false2025FY0001001290D0xbrli:sharesiso4217:PENiso4217:PENxbrli:sharesiso4217:USDxbrli:purebap:overnightDepositiso4217:BOBbap:certificateiso4217:JPYiso4217:COPbap:Swapiso4217:USDxbrli:sharesbap:Regimebap:TaxValueUnitutr:sqftbap:riskFactorbap:marketCurvebap:stockPricebap:mutualFundbap:seriesiso4217:CLPbap:Subsidary00010012902025-01-012025-12-310001001290dei:BusinessContactMember2025-01-012025-12-3100010012902025-12-3100010012902024-12-3100010012902024-01-012024-12-3100010012902023-01-012023-12-310001001290bap:MedicalServicesMember2025-01-012025-12-310001001290bap:MedicalServicesMember2024-01-012024-12-310001001290bap:MedicalServicesMember2023-01-012023-12-310001001290ifrs-full:IssuedCapitalMember2022-12-310001001290bap:TreasuryStockSharesOfGroupMember2022-12-310001001290bap:TreasuryStockShareBasedPaymentMember2022-12-310001001290ifrs-full:SharePremiumMember2022-12-310001001290ifrs-full:MiscellaneousOtherReservesMember2022-12-310001001290ifrs-full:ReserveOfGainsAndLossesFromInvestmentsInEquityInstrumentsMember2022-12-310001001290bap:ReserveOfGainsAndLossesFromInvestmentsInDebtInstrumentsMember2022-12-310001001290ifrs-full:ReserveOfCashFlowHedgesMember2022-12-310001001290bap:InsuranceReservesMember2022-12-310001001290ifrs-full:ReserveOfExchangeDifferencesOnTranslationMember2022-12-310001001290ifrs-full:RetainedEarningsMember2022-12-310001001290ifrs-full:EquityAttributableToOwnersOfParentMember2022-12-310001001290ifrs-full:NoncontrollingInterestsMember2022-12-3100010012902022-12-310001001290ifrs-full:RetainedEarningsMember2023-01-012023-12-310001001290ifrs-full:EquityAttributableToOwnersOfParentMember2023-01-012023-12-310001001290ifrs-full:NoncontrollingInterestsMember2023-01-012023-12-310001001290ifrs-full:ReserveOfGainsAndLossesFromInvestmentsInEquityInstrumentsMember2023-01-012023-12-310001001290bap:ReserveOfGainsAndLossesFromInvestmentsInDebtInstrumentsMember2023-01-012023-12-310001001290ifrs-full:ReserveOfCashFlowHedgesMember2023-01-012023-12-310001001290bap:InsuranceReservesMember2023-01-012023-12-310001001290ifrs-full:ReserveOfExchangeDifferencesOnTranslationMember2023-01-012023-12-310001001290ifrs-full:MiscellaneousOtherReservesMember2023-01-012023-12-310001001290bap:TreasuryStockShareBasedPaymentMember2023-01-012023-12-310001001290ifrs-full:SharePremiumMember2023-01-012023-12-310001001290ifrs-full:IssuedCapitalMember2023-12-310001001290bap:TreasuryStockSharesOfGroupMember2023-12-310001001290bap:TreasuryStockShareBasedPaymentMember2023-12-310001001290ifrs-full:SharePremiumMember2023-12-310001001290ifrs-full:MiscellaneousOtherReservesMember2023-12-310001001290ifrs-full:ReserveOfGainsAndLossesFromInvestmentsInEquityInstrumentsMember2023-12-310001001290bap:ReserveOfGainsAndLossesFromInvestmentsInDebtInstrumentsMember2023-12-310001001290ifrs-full:ReserveOfCashFlowHedgesMember2023-12-310001001290bap:InsuranceReservesMember2023-12-310001001290ifrs-full:ReserveOfExchangeDifferencesOnTranslationMember2023-12-310001001290ifrs-full:RetainedEarningsMember2023-12-310001001290ifrs-full:EquityAttributableToOwnersOfParentMember2023-12-310001001290ifrs-full:NoncontrollingInterestsMember2023-12-3100010012902023-12-310001001290ifrs-full:RetainedEarningsMember2024-01-012024-12-310001001290ifrs-full:EquityAttributableToOwnersOfParentMember2024-01-012024-12-310001001290ifrs-full:NoncontrollingInterestsMember2024-01-012024-12-310001001290ifrs-full:ReserveOfGainsAndLossesFromInvestmentsInEquityInstrumentsMember2024-01-012024-12-310001001290bap:ReserveOfGainsAndLossesFromInvestmentsInDebtInstrumentsMember2024-01-012024-12-310001001290ifrs-full:ReserveOfCashFlowHedgesMember2024-01-012024-12-310001001290bap:InsuranceReservesMember2024-01-012024-12-310001001290ifrs-full:ReserveOfExchangeDifferencesOnTranslationMember2024-01-012024-12-310001001290ifrs-full:MiscellaneousOtherReservesMember2024-01-012024-12-310001001290bap:TreasuryStockShareBasedPaymentMember2024-01-012024-12-310001001290ifrs-full:SharePremiumMember2024-01-012024-12-310001001290ifrs-full:IssuedCapitalMember2024-12-310001001290bap:TreasuryStockSharesOfGroupMember2024-12-310001001290bap:TreasuryStockShareBasedPaymentMember2024-12-310001001290ifrs-full:SharePremiumMember2024-12-310001001290ifrs-full:MiscellaneousOtherReservesMember2024-12-310001001290ifrs-full:ReserveOfGainsAndLossesFromInvestmentsInEquityInstrumentsMember2024-12-310001001290bap:ReserveOfGainsAndLossesFromInvestmentsInDebtInstrumentsMember2024-12-310001001290ifrs-full:ReserveOfCashFlowHedgesMember2024-12-310001001290bap:InsuranceReservesMember2024-12-310001001290ifrs-full:ReserveOfExchangeDifferencesOnTranslationMember2024-12-310001001290ifrs-full:RetainedEarningsMember2024-12-310001001290ifrs-full:EquityAttributableToOwnersOfParentMember2024-12-310001001290ifrs-full:NoncontrollingInterestsMember2024-12-310001001290ifrs-full:RetainedEarningsMember2025-01-012025-12-310001001290ifrs-full:EquityAttributableToOwnersOfParentMember2025-01-012025-12-310001001290ifrs-full:NoncontrollingInterestsMember2025-01-012025-12-310001001290ifrs-full:ReserveOfGainsAndLossesFromInvestmentsInEquityInstrumentsMember2025-01-012025-12-310001001290bap:ReserveOfGainsAndLossesFromInvestmentsInDebtInstrumentsMember2025-01-012025-12-310001001290ifrs-full:ReserveOfCashFlowHedgesMember2025-01-012025-12-310001001290bap:InsuranceReservesMember2025-01-012025-12-310001001290ifrs-full:ReserveOfExchangeDifferencesOnTranslationMember2025-01-012025-12-310001001290ifrs-full:MiscellaneousOtherReservesMember2025-01-012025-12-310001001290bap:TreasuryStockShareBasedPaymentMember2025-01-012025-12-310001001290ifrs-full:SharePremiumMember2025-01-012025-12-310001001290ifrs-full:IssuedCapitalMember2025-12-310001001290bap:TreasuryStockSharesOfGroupMember2025-12-310001001290bap:TreasuryStockShareBasedPaymentMember2025-12-310001001290ifrs-full:SharePremiumMember2025-12-310001001290ifrs-full:MiscellaneousOtherReservesMember2025-12-310001001290ifrs-full:ReserveOfGainsAndLossesFromInvestmentsInEquityInstrumentsMember2025-12-310001001290bap:ReserveOfGainsAndLossesFromInvestmentsInDebtInstrumentsMember2025-12-310001001290ifrs-full:ReserveOfCashFlowHedgesMember2025-12-310001001290bap:InsuranceReservesMember2025-12-310001001290ifrs-full:ReserveOfExchangeDifferencesOnTranslationMember2025-12-310001001290ifrs-full:RetainedEarningsMember2025-12-310001001290ifrs-full:EquityAttributableToOwnersOfParentMember2025-12-310001001290ifrs-full:NoncontrollingInterestsMember2025-12-310001001290bap:SubordinatedBondsMember2024-12-310001001290bap:SubordinatedBondsMember2025-01-012025-12-310001001290bap:SubordinatedBondsMember2025-12-310001001290ifrs-full:LeaseLiabilitiesMember2024-12-310001001290ifrs-full:LeaseLiabilitiesMember2025-01-012025-12-310001001290ifrs-full:LeaseLiabilitiesMember2025-12-310001001290bap:SubordinatedBondsMember2023-12-310001001290bap:SubordinatedBondsMember2024-01-012024-12-310001001290ifrs-full:LeaseLiabilitiesMember2023-12-310001001290ifrs-full:LeaseLiabilitiesMember2024-01-012024-12-310001001290bap:SubordinatedBondsMember2022-12-310001001290bap:SubordinatedBondsMember2023-01-012023-12-310001001290ifrs-full:LeaseLiabilitiesMember2022-12-310001001290ifrs-full:LeaseLiabilitiesMember2023-01-012023-12-310001001290bap:EmpresasBanmedicaMember2024-11-010001001290bap:PacificoSegurosMember2024-11-010001001290bap:GrupoCreditoSAMember2024-11-010001001290bap:PacificoEPSMember2025-03-130001001290bap:PreAcquisitionCarryingAmountMemberbap:PacificoEPSMember2025-03-130001001290bap:FairValueAdjustmentsMemberbap:PacificoEPSMember2025-03-130001001290bap:PacificoEPSMember2025-03-132025-03-130001001290bap:BancoDeCreditoDelPeruBCPMember2025-12-290001001290bap:GrupoCrditoSAAndSubsidiariesMember2025-01-012025-12-310001001290bap:GrupoCrditoSAAndSubsidiariesMember2024-01-012024-12-310001001290bap:GrupoCrditoSAAndSubsidiariesMember2025-12-310001001290bap:GrupoCrditoSAAndSubsidiariesMember2024-12-310001001290bap:GrupoCrditoSAAndSubsidiariesMember2023-01-012023-12-310001001290bap:PacficoCompaniaDeSegurosYReasegurosSAAndSubsidiariesMember2025-01-012025-12-310001001290bap:PacficoCompaniaDeSegurosYReasegurosSAAndSubsidiariesMember2024-01-012024-12-310001001290bap:PacficoCompaniaDeSegurosYReasegurosSAAndSubsidiariesMember2025-12-310001001290bap:PacficoCompaniaDeSegurosYReasegurosSAAndSubsidiariesMember2024-12-310001001290bap:PacficoCompaniaDeSegurosYReasegurosSAAndSubsidiariesMember2023-01-012023-12-310001001290bap:AtlanticSecurityHoldingCorporationAndSubsidiariesMember2025-01-012025-12-310001001290bap:AtlanticSecurityHoldingCorporationAndSubsidiariesMember2024-01-012024-12-310001001290bap:AtlanticSecurityHoldingCorporationAndSubsidiariesMember2025-12-310001001290bap:AtlanticSecurityHoldingCorporationAndSubsidiariesMember2024-12-310001001290bap:AtlanticSecurityHoldingCorporationAndSubsidiariesMember2023-01-012023-12-310001001290bap:CredicorpCapitalLtdAndSubsidiariesMember2025-01-012025-12-310001001290bap:CredicorpCapitalLtdAndSubsidiariesMember2024-01-012024-12-310001001290bap:CredicorpCapitalLtdAndSubsidiariesMember2025-12-310001001290bap:CredicorpCapitalLtdAndSubsidiariesMember2024-12-310001001290bap:CredicorpCapitalLtdAndSubsidiariesMember2023-01-012023-12-310001001290bap:CCRIncorporationMember2025-01-012025-12-310001001290bap:CCRIncorporationMember2024-01-012024-12-310001001290bap:CCRIncorporationMember2025-12-310001001290bap:CCRIncorporationMember2024-12-310001001290bap:CCRIncorporationMember2023-01-012023-12-310001001290bap:BancoDeCreditoDelPeruAndSubsidiariesMember2025-01-012025-12-310001001290bap:BancoDeCreditoDelPeruAndSubsidiariesMember2024-01-012024-12-310001001290bap:BancoDeCreditoDelPeruAndSubsidiariesMember2025-12-310001001290bap:BancoDeCreditoDelPeruAndSubsidiariesMember2024-12-310001001290bap:BancoDeCreditoDelPeruAndSubsidiariesMember2023-01-012023-12-310001001290bap:InversionesCredicorpBoliviaSAAndSubsidiariesMember2025-01-012025-12-310001001290bap:InversionesCredicorpBoliviaSAAndSubsidiariesMember2024-01-012024-12-310001001290bap:InversionesCredicorpBoliviaSAAndSubsidiariesMember2025-12-310001001290bap:InversionesCredicorpBoliviaSAAndSubsidiariesMember2024-12-310001001290bap:InversionesCredicorpBoliviaSAAndSubsidiariesMember2023-01-012023-12-310001001290bap:PrimaAFPSAMember2025-01-012025-12-310001001290bap:PrimaAFPSAMember2024-01-012024-12-310001001290bap:PrimaAFPSAMember2025-12-310001001290bap:PrimaAFPSAMember2024-12-310001001290bap:PrimaAFPSAMember2023-01-012023-12-310001001290bap:TenpoSpAAndSubsidiariesMember2025-01-012025-12-310001001290bap:TenpoSpAAndSubsidiariesMember2024-01-012024-12-310001001290bap:TenpoSpAAndSubsidiariesMember2025-12-310001001290bap:TenpoSpAAndSubsidiariesMember2024-12-310001001290bap:TenpoSpAAndSubsidiariesMember2023-01-012023-12-310001001290bap:YapeMarketMember2025-01-012025-12-310001001290bap:YapeMarketMember2024-01-012024-12-310001001290bap:YapeMarketMember2025-12-310001001290bap:YapeMarketMember2024-12-310001001290bap:YapeMarketMember2023-01-012023-12-310001001290bap:KrealoManagementMember2025-01-012025-12-310001001290bap:KrealoManagementMember2024-01-012024-12-310001001290bap:KrealoManagementMember2025-12-310001001290bap:KrealoManagementMember2024-12-310001001290bap:KrealoManagementMember2023-01-012023-12-310001001290bap:CompaniaIncubadoraDeSolucionesMovilesS.ACulqiMember2025-01-012025-12-310001001290bap:CompaniaIncubadoraDeSolucionesMovilesS.ACulqiMember2024-01-012024-12-310001001290bap:CompaniaIncubadoraDeSolucionesMovilesS.ACulqiMember2025-12-310001001290bap:CompaniaIncubadoraDeSolucionesMovilesS.ACulqiMember2024-12-310001001290bap:CompaniaIncubadoraDeSolucionesMovilesS.ACulqiMember2023-01-012023-12-310001001290bap:OtherMinorsSubsidiariesMember2025-01-012025-12-310001001290bap:OtherMinorsSubsidiariesMember2024-01-012024-12-310001001290bap:OtherMinorsSubsidiariesMember2025-12-310001001290bap:OtherMinorsSubsidiariesMember2024-12-310001001290bap:OtherMinorsSubsidiariesMember2023-01-012023-12-310001001290bap:MibancoMember2025-12-310001001290bap:MibancoMember2025-01-012025-12-310001001290bap:MibancoMember2024-12-310001001290bap:MibancoMember2024-01-012024-12-310001001290bap:BancoDeCreditoDeBoliviaMember2025-12-310001001290bap:BancoDeCreditoDeBoliviaMember2025-01-012025-12-310001001290bap:BancoDeCreditoDeBoliviaMember2024-12-310001001290bap:BancoDeCreditoDeBoliviaMember2024-01-012024-12-310001001290bap:CredicorpHoldingColombiaS.a.s.AndSubsidiariesMember2025-01-012025-12-310001001290bap:CredicorpHoldingColombiaS.a.s.AndSubsidiariesMember2024-01-012024-12-310001001290bap:CredicorpHoldingColombiaS.a.s.AndSubsidiariesMember2025-12-310001001290bap:CredicorpHoldingColombiaS.a.s.AndSubsidiariesMember2024-12-310001001290bap:CredicorpHoldingColombiaS.a.s.AndSubsidiariesMember2023-01-012023-12-310001001290bap:CredicorpCapitalHoldingChileAndSubsidiariesMember2025-01-012025-12-310001001290bap:CredicorpCapitalHoldingChileAndSubsidiariesMember2024-01-012024-12-310001001290bap:CredicorpCapitalHoldingChileAndSubsidiariesMember2025-12-310001001290bap:CredicorpCapitalHoldingChileAndSubsidiariesMember2024-12-310001001290bap:CredicorpCapitalHoldingChileAndSubsidiariesMember2023-01-012023-12-310001001290bap:CredicorpCapitalHoldingPeruSAAndSubsidiariesMember2025-01-012025-12-310001001290bap:CredicorpCapitalHoldingPeruSAAndSubsidiariesMember2024-01-012024-12-310001001290bap:CredicorpCapitalHoldingPeruSAAndSubsidiariesMember2025-12-310001001290bap:CredicorpCapitalHoldingPeruSAAndSubsidiariesMember2024-12-310001001290bap:CredicorpCapitalHoldingPeruSAAndSubsidiariesMember2023-01-012023-12-310001001290bap:MibancoMember2023-01-012023-12-310001001290bap:CredicorpCapitalColombiaSAMember2025-01-012025-12-310001001290bap:CredicorpCapitalColombiaSAMember2024-01-012024-12-310001001290bap:CredicorpCapitalColombiaSAMember2025-12-310001001290bap:CredicorpCapitalColombiaSAMember2024-12-310001001290bap:CredicorpCapitalColombiaSAMember2023-01-012023-12-310001001290bap:MibancoBancoDeLaMicroempresaDeColombiaS.A.Member2025-01-012025-12-310001001290bap:MibancoBancoDeLaMicroempresaDeColombiaS.A.Member2024-01-012024-12-310001001290bap:MibancoBancoDeLaMicroempresaDeColombiaS.A.Member2025-12-310001001290bap:MibancoBancoDeLaMicroempresaDeColombiaS.A.Member2024-12-310001001290bap:MibancoBancoDeLaMicroempresaDeColombiaS.A.Member2023-01-012023-12-310001001290bap:SolesMemberifrs-full:NotLaterThanOneYearMember2025-12-310001001290bap:SolesMemberifrs-full:NotLaterThanOneYearMember2024-12-310001001290bap:SolesMemberifrs-full:NotLaterThanOneYearMember2023-12-310001001290bap:SolesMemberifrs-full:LaterThanOneYearAndNotLaterThanThreeYearsMember2025-12-310001001290bap:SolesMemberifrs-full:LaterThanOneYearAndNotLaterThanThreeYearsMember2024-12-310001001290bap:SolesMemberifrs-full:LaterThanOneYearAndNotLaterThanThreeYearsMember2023-12-310001001290bap:SolesMemberifrs-full:LaterThanThreeYearsAndNotLaterThanFiveYearsMember2025-12-310001001290bap:SolesMemberifrs-full:LaterThanThreeYearsAndNotLaterThanFiveYearsMember2024-12-310001001290bap:SolesMemberifrs-full:LaterThanThreeYearsAndNotLaterThanFiveYearsMember2023-12-310001001290bap:SolesVACMemberifrs-full:NotLaterThanOneYearMember2025-12-310001001290bap:SolesVACMemberifrs-full:NotLaterThanOneYearMember2024-12-310001001290bap:SolesVACMemberifrs-full:NotLaterThanOneYearMember2023-12-310001001290bap:SolesVACMemberifrs-full:LaterThanOneYearAndNotLaterThanThreeYearsMember2025-12-310001001290bap:SolesVACMemberifrs-full:LaterThanOneYearAndNotLaterThanThreeYearsMember2024-12-310001001290bap:SolesVACMemberifrs-full:LaterThanOneYearAndNotLaterThanThreeYearsMember2023-12-310001001290bap:SolesVACMemberifrs-full:LaterThanThreeYearsAndNotLaterThanFiveYearsMember2025-12-310001001290bap:SolesVACMemberifrs-full:LaterThanThreeYearsAndNotLaterThanFiveYearsMember2024-12-310001001290bap:SolesVACMemberifrs-full:LaterThanThreeYearsAndNotLaterThanFiveYearsMember2023-12-310001001290bap:USDollarsMemberifrs-full:NotLaterThanOneYearMember2025-12-310001001290bap:USDollarsMemberifrs-full:NotLaterThanOneYearMember2024-12-310001001290bap:USDollarsMemberifrs-full:NotLaterThanOneYearMember2023-12-310001001290bap:USDollarsMemberifrs-full:LaterThanOneYearAndNotLaterThanThreeYearsMember2025-12-310001001290bap:USDollarsMemberifrs-full:LaterThanOneYearAndNotLaterThanThreeYearsMember2024-12-310001001290bap:USDollarsMemberifrs-full:LaterThanOneYearAndNotLaterThanThreeYearsMember2023-12-310001001290bap:USDollarsMemberifrs-full:LaterThanThreeYearsAndNotLaterThanFiveYearsMember2025-12-310001001290bap:USDollarsMemberifrs-full:LaterThanThreeYearsAndNotLaterThanFiveYearsMember2024-12-310001001290bap:USDollarsMemberifrs-full:LaterThanThreeYearsAndNotLaterThanFiveYearsMember2023-12-310001001290bap:SolesMemberifrs-full:LaterThanFiveYearsAndNotLaterThanTenYearsMember2025-12-310001001290bap:SolesMemberifrs-full:LaterThanFiveYearsAndNotLaterThanTenYearsMember2024-12-310001001290bap:SolesMemberifrs-full:LaterThanFiveYearsAndNotLaterThanTenYearsMember2023-12-310001001290bap:SolesMemberbap:LaterThanTenYearsAndNotLaterThanTwentyYearsMember2025-12-310001001290bap:SolesMemberbap:LaterThanTenYearsAndNotLaterThanTwentyYearsMember2024-12-310001001290bap:SolesMemberbap:LaterThanTenYearsAndNotLaterThanTwentyYearsMember2023-12-310001001290bap:SolesVACMemberifrs-full:LaterThanFiveYearsAndNotLaterThanTenYearsMember2025-12-310001001290bap:SolesVACMemberifrs-full:LaterThanFiveYearsAndNotLaterThanTenYearsMember2024-12-310001001290bap:SolesVACMemberifrs-full:LaterThanFiveYearsAndNotLaterThanTenYearsMember2023-12-310001001290bap:SolesVACMemberbap:LaterThanTenYearsAndNotLaterThanTwentyYearsMember2025-12-310001001290bap:SolesVACMemberbap:LaterThanTenYearsAndNotLaterThanTwentyYearsMember2024-12-310001001290bap:SolesVACMemberbap:LaterThanTenYearsAndNotLaterThanTwentyYearsMember2023-12-310001001290bap:USDollarsMemberifrs-full:LaterThanFiveYearsAndNotLaterThanTenYearsMember2025-12-310001001290bap:USDollarsMemberifrs-full:LaterThanFiveYearsAndNotLaterThanTenYearsMember2024-12-310001001290bap:USDollarsMemberifrs-full:LaterThanFiveYearsAndNotLaterThanTenYearsMember2023-12-310001001290bap:USDollarsMemberbap:LaterThanTenYearsAndNotLaterThanTwentyYearsMember2025-12-310001001290bap:USDollarsMemberbap:LaterThanTenYearsAndNotLaterThanTwentyYearsMember2024-12-310001001290bap:USDollarsMemberbap:LaterThanTenYearsAndNotLaterThanTwentyYearsMember2023-12-310001001290bap:PrimaAFPAFPUnionVidaMemberifrs-full:CustomerrelatedIntangibleAssetsMember2025-01-012025-12-310001001290bap:CredicorpCapitalHoldingChileInversionesIMTMemberifrs-full:CustomerrelatedIntangibleAssetsMember2025-01-012025-12-310001001290bap:UltrasefincoS.A.Memberifrs-full:CustomerrelatedIntangibleAssetsMember2025-01-012025-12-310001001290bap:PacificoEPSAndMedicalServicesMemberifrs-full:CustomerrelatedIntangibleAssetsMember2025-01-012025-12-310001001290bap:MibancoBancoDeLaMicroempresaSAMemberifrs-full:BrandNamesMember2025-01-012025-12-310001001290bap:JoinnusSACMemberifrs-full:BrandNamesMember2025-01-012025-12-310001001290bap:CompaniaIncubadoraDeSolucionesMovilesS.aMemberifrs-full:BrandNamesMember2025-01-012025-12-310001001290bap:CredicorpCapitalColombiaSAMemberbap:FundManagerContractMemberifrs-full:BottomOfRangeMember2025-01-012025-12-310001001290bap:CredicorpCapitalColombiaSAMemberbap:FundManagerContractMemberifrs-full:TopOfRangeMember2025-01-012025-12-310001001290bap:FundManagerContractMemberifrs-full:BottomOfRangeMember2025-01-012025-12-310001001290bap:FundManagerContractMemberifrs-full:TopOfRangeMember2025-01-012025-12-310001001290bap:UltrasefincoS.A.Memberbap:FundManagerContractMember2025-01-012025-12-310001001290bap:USDollarsMember2025-01-012025-12-310001001290bap:USDollarsMember2025-12-310001001290bap:SolesMember2025-01-012025-12-310001001290bap:SolesMember2025-12-310001001290bap:SolesMember2024-01-012024-12-310001001290bap:USDollarsMember2024-01-012024-12-310001001290bap:SolesMember2024-12-310001001290bap:USDollarsMember2024-12-310001001290ifrs-full:BottomOfRangeMember2025-01-012025-12-310001001290ifrs-full:TopOfRangeMember2025-01-012025-12-310001001290ifrs-full:BottomOfRangeMember2024-01-012024-12-310001001290ifrs-full:TopOfRangeMember2024-01-012024-12-310001001290bap:ReverseRepurchaseAgreementAndSecurityBorrowingsMember2025-12-310001001290bap:ReverseRepurchaseAgreementAndSecurityBorrowingsMember2024-12-310001001290bap:CashCollateralOnRepurchaseAgreementsAndSecurityLendingMember2025-12-310001001290bap:CashCollateralOnRepurchaseAgreementsAndSecurityLendingMember2024-12-310001001290bap:FinancialTransactionsToBeSettledMember2025-12-310001001290bap:FinancialTransactionsToBeSettledMember2024-12-310001001290bap:InstrumentsIssuedByColombianGovernmentMemberbap:ReverseRepurchaseAgreementAndSecurityBorrowingsMember2025-12-310001001290bap:InstrumentsIssuedByColombianGovernmentMemberbap:ReverseRepurchaseAgreementAndSecurityBorrowingsMemberbap:NotLaterThanThreeDaysMember2025-12-310001001290bap:InstrumentsIssuedByColombianGovernmentMemberbap:ReverseRepurchaseAgreementAndSecurityBorrowingsMemberbap:LaterThanThreeAndNotLaterThanThirtyDaysMember2025-12-310001001290bap:InstrumentsIssuedByColombianGovernmentMemberbap:ReverseRepurchaseAgreementAndSecurityBorrowingsMemberbap:LaterThanThirtyDaysMember2025-12-310001001290bap:InstrumentsIssuedByColombianGovernmentMemberbap:ReverseRepurchaseAgreementAndSecurityBorrowingsMember2024-12-310001001290bap:InstrumentsIssuedByColombianGovernmentMemberbap:ReverseRepurchaseAgreementAndSecurityBorrowingsMemberbap:NotLaterThanThreeDaysMember2024-12-310001001290bap:InstrumentsIssuedByColombianGovernmentMemberbap:ReverseRepurchaseAgreementAndSecurityBorrowingsMemberbap:LaterThanThreeAndNotLaterThanThirtyDaysMember2024-12-310001001290bap:InstrumentsIssuedByColombianGovernmentMemberbap:ReverseRepurchaseAgreementAndSecurityBorrowingsMemberbap:LaterThanThirtyDaysMember2024-12-310001001290bap:InstrumentsIssuedByChileanGovernmentMemberbap:ReverseRepurchaseAgreementAndSecurityBorrowingsMember2025-12-310001001290bap:InstrumentsIssuedByChileanGovernmentMemberbap:ReverseRepurchaseAgreementAndSecurityBorrowingsMemberbap:NotLaterThanThreeDaysMember2025-12-310001001290bap:InstrumentsIssuedByChileanGovernmentMemberbap:ReverseRepurchaseAgreementAndSecurityBorrowingsMemberbap:LaterThanThreeAndNotLaterThanThirtyDaysMember2025-12-310001001290bap:InstrumentsIssuedByChileanGovernmentMemberbap:ReverseRepurchaseAgreementAndSecurityBorrowingsMemberbap:LaterThanThirtyDaysMember2025-12-310001001290bap:InstrumentsIssuedByChileanGovernmentMemberbap:ReverseRepurchaseAgreementAndSecurityBorrowingsMember2024-12-310001001290bap:InstrumentsIssuedByChileanGovernmentMemberbap:ReverseRepurchaseAgreementAndSecurityBorrowingsMemberbap:NotLaterThanThreeDaysMember2024-12-310001001290bap:InstrumentsIssuedByChileanGovernmentMemberbap:ReverseRepurchaseAgreementAndSecurityBorrowingsMemberbap:LaterThanThreeAndNotLaterThanThirtyDaysMember2024-12-310001001290bap:InstrumentsIssuedByChileanGovernmentMemberbap:ReverseRepurchaseAgreementAndSecurityBorrowingsMemberbap:LaterThanThirtyDaysMember2024-12-310001001290bap:OtherInstrumentsMemberbap:ReverseRepurchaseAgreementAndSecurityBorrowingsMember2025-12-310001001290bap:OtherInstrumentsMemberbap:ReverseRepurchaseAgreementAndSecurityBorrowingsMemberbap:NotLaterThanThreeDaysMember2025-12-310001001290bap:OtherInstrumentsMemberbap:ReverseRepurchaseAgreementAndSecurityBorrowingsMemberbap:LaterThanThreeAndNotLaterThanThirtyDaysMember2025-12-310001001290bap:OtherInstrumentsMemberbap:ReverseRepurchaseAgreementAndSecurityBorrowingsMemberbap:LaterThanThirtyDaysMember2025-12-310001001290bap:OtherInstrumentsMemberbap:ReverseRepurchaseAgreementAndSecurityBorrowingsMember2024-12-310001001290bap:OtherInstrumentsMemberbap:ReverseRepurchaseAgreementAndSecurityBorrowingsMemberbap:NotLaterThanThreeDaysMember2024-12-310001001290bap:OtherInstrumentsMemberbap:ReverseRepurchaseAgreementAndSecurityBorrowingsMemberbap:LaterThanThreeAndNotLaterThanThirtyDaysMember2024-12-310001001290bap:OtherInstrumentsMemberbap:ReverseRepurchaseAgreementAndSecurityBorrowingsMemberbap:LaterThanThirtyDaysMember2024-12-310001001290bap:NotLaterThanThreeDaysMemberbap:ReverseRepurchaseAgreementAndSecurityBorrowingsMember2025-12-310001001290bap:LaterThanThreeAndNotLaterThanThirtyDaysMemberbap:ReverseRepurchaseAgreementAndSecurityBorrowingsMember2025-12-310001001290bap:LaterThanThirtyDaysMemberbap:ReverseRepurchaseAgreementAndSecurityBorrowingsMember2025-12-310001001290bap:ReverseRepurchaseAgreementAndSecurityBorrowingsMember2025-12-310001001290bap:NotLaterThanThreeDaysMemberbap:ReverseRepurchaseAgreementAndSecurityBorrowingsMember2024-12-310001001290bap:LaterThanThreeAndNotLaterThanThirtyDaysMemberbap:ReverseRepurchaseAgreementAndSecurityBorrowingsMember2024-12-310001001290bap:LaterThanThirtyDaysMemberbap:ReverseRepurchaseAgreementAndSecurityBorrowingsMember2024-12-310001001290bap:ReverseRepurchaseAgreementAndSecurityBorrowingsMember2024-12-310001001290bap:CredicorpCapitalColombiaSAMemberbap:InstrumentsIssuedByColombianGovernmentMember2025-12-310001001290bap:CentralBankOfBoliviaMemberbap:USDollarsMember2025-12-310001001290bap:CentralBankOfBoliviaMemberbap:USDollarsMember2024-12-310001001290bap:PayablesFromRepurchaseAgreementsAndSecurityLendingsMemberbap:DebtInstrumentsMember2025-12-310001001290bap:PayablesFromRepurchaseAgreementsAndSecurityLendingsMemberbap:NotLaterThanThreeDaysMemberbap:DebtInstrumentsMember2025-12-310001001290bap:PayablesFromRepurchaseAgreementsAndSecurityLendingsMemberbap:LaterThanThreeAndNotLaterThanThirtyDaysMemberbap:DebtInstrumentsMember2025-12-310001001290bap:PayablesFromRepurchaseAgreementsAndSecurityLendingsMemberbap:LaterThanThirtyDaysMemberbap:DebtInstrumentsMember2025-12-310001001290bap:PayablesFromRepurchaseAgreementsAndSecurityLendingsMemberbap:DebtInstrumentsMember2024-12-310001001290bap:PayablesFromRepurchaseAgreementsAndSecurityLendingsMemberbap:NotLaterThanThreeDaysMemberbap:DebtInstrumentsMember2024-12-310001001290bap:PayablesFromRepurchaseAgreementsAndSecurityLendingsMemberbap:LaterThanThreeAndNotLaterThanThirtyDaysMemberbap:DebtInstrumentsMember2024-12-310001001290bap:PayablesFromRepurchaseAgreementsAndSecurityLendingsMemberbap:LaterThanThirtyDaysMemberbap:DebtInstrumentsMember2024-12-310001001290bap:PayablesFromRepurchaseAgreementsAndSecurityLendingsMemberbap:InstrumentsIssuedByColombianGovernmentMember2025-12-310001001290bap:PayablesFromRepurchaseAgreementsAndSecurityLendingsMemberbap:NotLaterThanThreeDaysMemberbap:InstrumentsIssuedByColombianGovernmentMember2025-12-310001001290bap:PayablesFromRepurchaseAgreementsAndSecurityLendingsMemberbap:LaterThanThreeAndNotLaterThanThirtyDaysMemberbap:InstrumentsIssuedByColombianGovernmentMember2025-12-310001001290bap:PayablesFromRepurchaseAgreementsAndSecurityLendingsMemberbap:LaterThanThirtyDaysMemberbap:InstrumentsIssuedByColombianGovernmentMember2025-12-310001001290bap:PayablesFromRepurchaseAgreementsAndSecurityLendingsMemberbap:InstrumentsIssuedByColombianGovernmentMember2024-12-310001001290bap:PayablesFromRepurchaseAgreementsAndSecurityLendingsMemberbap:NotLaterThanThreeDaysMemberbap:InstrumentsIssuedByColombianGovernmentMember2024-12-310001001290bap:PayablesFromRepurchaseAgreementsAndSecurityLendingsMemberbap:LaterThanThreeAndNotLaterThanThirtyDaysMemberbap:InstrumentsIssuedByColombianGovernmentMember2024-12-310001001290bap:PayablesFromRepurchaseAgreementsAndSecurityLendingsMemberbap:LaterThanThirtyDaysMemberbap:InstrumentsIssuedByColombianGovernmentMember2024-12-310001001290bap:PayablesFromRepurchaseAgreementsAndSecurityLendingsMemberbap:InstrumentsIssuedByChileanGovernmentMember2025-12-310001001290bap:PayablesFromRepurchaseAgreementsAndSecurityLendingsMemberbap:NotLaterThanThreeDaysMemberbap:InstrumentsIssuedByChileanGovernmentMember2025-12-310001001290bap:PayablesFromRepurchaseAgreementsAndSecurityLendingsMemberbap:LaterThanThreeAndNotLaterThanThirtyDaysMemberbap:InstrumentsIssuedByChileanGovernmentMember2025-12-310001001290bap:PayablesFromRepurchaseAgreementsAndSecurityLendingsMemberbap:LaterThanThirtyDaysMemberbap:InstrumentsIssuedByChileanGovernmentMember2025-12-310001001290bap:PayablesFromRepurchaseAgreementsAndSecurityLendingsMemberbap:InstrumentsIssuedByChileanGovernmentMember2024-12-310001001290bap:PayablesFromRepurchaseAgreementsAndSecurityLendingsMemberbap:NotLaterThanThreeDaysMemberbap:InstrumentsIssuedByChileanGovernmentMember2024-12-310001001290bap:PayablesFromRepurchaseAgreementsAndSecurityLendingsMemberbap:LaterThanThreeAndNotLaterThanThirtyDaysMemberbap:InstrumentsIssuedByChileanGovernmentMember2024-12-310001001290bap:PayablesFromRepurchaseAgreementsAndSecurityLendingsMemberbap:LaterThanThirtyDaysMemberbap:InstrumentsIssuedByChileanGovernmentMember2024-12-310001001290bap:PayablesFromRepurchaseAgreementsAndSecurityLendingsMemberbap:OtherInstrumentsMember2025-12-310001001290bap:PayablesFromRepurchaseAgreementsAndSecurityLendingsMemberbap:NotLaterThanThreeDaysMemberbap:OtherInstrumentsMember2025-12-310001001290bap:PayablesFromRepurchaseAgreementsAndSecurityLendingsMemberbap:LaterThanThreeAndNotLaterThanThirtyDaysMemberbap:OtherInstrumentsMember2025-12-310001001290bap:PayablesFromRepurchaseAgreementsAndSecurityLendingsMemberbap:LaterThanThirtyDaysMemberbap:OtherInstrumentsMember2025-12-310001001290bap:PayablesFromRepurchaseAgreementsAndSecurityLendingsMemberbap:OtherInstrumentsMember2024-12-310001001290bap:PayablesFromRepurchaseAgreementsAndSecurityLendingsMemberbap:NotLaterThanThreeDaysMemberbap:OtherInstrumentsMember2024-12-310001001290bap:PayablesFromRepurchaseAgreementsAndSecurityLendingsMemberbap:LaterThanThreeAndNotLaterThanThirtyDaysMemberbap:OtherInstrumentsMember2024-12-310001001290bap:PayablesFromRepurchaseAgreementsAndSecurityLendingsMemberbap:LaterThanThirtyDaysMemberbap:OtherInstrumentsMember2024-12-310001001290bap:PayablesFromRepurchaseAgreementsAndSecurityLendingsMemberbap:NotLaterThanThreeDaysMember2025-12-310001001290bap:PayablesFromRepurchaseAgreementsAndSecurityLendingsMemberbap:LaterThanThreeAndNotLaterThanThirtyDaysMember2025-12-310001001290bap:PayablesFromRepurchaseAgreementsAndSecurityLendingsMemberbap:LaterThanThirtyDaysMember2025-12-310001001290bap:PayablesFromRepurchaseAgreementsAndSecurityLendingsMember2025-12-310001001290bap:PayablesFromRepurchaseAgreementsAndSecurityLendingsMemberbap:NotLaterThanThreeDaysMember2024-12-310001001290bap:PayablesFromRepurchaseAgreementsAndSecurityLendingsMemberbap:LaterThanThreeAndNotLaterThanThirtyDaysMember2024-12-310001001290bap:PayablesFromRepurchaseAgreementsAndSecurityLendingsMemberbap:LaterThanThirtyDaysMember2024-12-310001001290bap:PayablesFromRepurchaseAgreementsAndSecurityLendingsMember2024-12-310001001290bap:BCRPOneMemberbap:DebtInstrumentsMember2025-12-310001001290bap:BCRPOneMemberbap:DebtInstrumentsMember2024-12-310001001290bap:BarclaysBankPLCMemberbap:DebtInstrumentsMember2025-12-310001001290bap:BarclaysBankPLCMemberbap:DebtInstrumentsMember2024-12-310001001290bap:NatixisS.A.OneMemberbap:DebtInstrumentsMember2025-12-310001001290bap:NatixisS.A.OneMemberbap:DebtInstrumentsMember2024-12-310001001290bap:BancoCentralDeBoliviaMemberbap:DebtInstrumentsMember2025-12-310001001290bap:BancoCentralDeBoliviaMemberbap:DebtInstrumentsMember2024-12-310001001290bap:BancoSantanderPeruMemberbap:DebtInstrumentsMember2025-12-310001001290bap:BancoSantanderPeruMemberbap:DebtInstrumentsMember2024-12-310001001290bap:BancoDeLaRepublicaDeColombiaMemberbap:DebtInstrumentsMember2025-12-310001001290bap:BancoDeLaRepublicaDeColombiaMemberbap:DebtInstrumentsMember2024-12-310001001290bap:CitigroupGlobalMarketsLimitedMemberbap:DebtInstrumentsMember2025-12-310001001290bap:CitigroupGlobalMarketsLimitedMemberbap:DebtInstrumentsMember2024-12-310001001290bap:NatixisS.A.TwoMemberbap:DebtInstrumentsMember2025-12-310001001290bap:NatixisS.A.TwoMemberbap:DebtInstrumentsMember2024-12-310001001290bap:BarclaysCapitalI.N.C.Memberbap:DebtInstrumentsMember2025-12-310001001290bap:BarclaysCapitalI.N.C.Memberbap:DebtInstrumentsMember2024-12-310001001290bap:BCRPReactivaPeruMemberbap:DebtInstrumentsMember2025-12-310001001290bap:BCRPReactivaPeruMemberbap:DebtInstrumentsMember2024-12-310001001290bap:BCRPReactivaPeruEspecialMemberbap:DebtInstrumentsMember2025-12-310001001290bap:BCRPReactivaPeruEspecialMemberbap:DebtInstrumentsMember2024-12-310001001290bap:BalanceBeforeAccruedInterestMemberbap:DebtInstrumentsMember2025-12-310001001290bap:BalanceBeforeAccruedInterestMemberbap:DebtInstrumentsMember2024-12-310001001290bap:AccruedInterestMemberbap:DebtInstrumentsMember2025-12-310001001290bap:AccruedInterestMemberbap:DebtInstrumentsMember2024-12-310001001290bap:DebtInstrumentsMember2025-12-310001001290bap:DebtInstrumentsMember2024-12-310001001290bap:RepurchaseAgreementMember2025-01-012025-12-310001001290bap:RepurchaseAgreementMember2025-12-310001001290bap:RepurchaseAgreementMember2024-12-310001001290bap:SecuredOvernightFinancingRate4.85Member2025-01-012025-12-310001001290bap:SecuredOvernightFinancingRate6.66Member2025-01-012025-12-310001001290bap:SecuredOvernightFinancingRate702Member2024-01-012024-12-310001001290bap:SecuredOvernightFinancingRate724Member2024-01-012024-12-310001001290bap:GovernmentTreasuryBondsMember2025-12-310001001290bap:GovernmentTreasuryBondsMember2024-12-310001001290ifrs-full:InvestmentFundsMember2025-12-310001001290ifrs-full:InvestmentFundsMember2024-12-310001001290bap:ParticipationInMutualFundsMember2025-12-310001001290bap:ParticipationInMutualFundsMember2024-12-310001001290bap:RestrictedMutualFundsMember2025-12-310001001290bap:RestrictedMutualFundsMember2024-12-310001001290bap:ParticipationInRALFundsMember2025-12-310001001290bap:ParticipationInRALFundsMember2024-12-310001001290bap:CorporateBondsMember2025-12-310001001290bap:CorporateBondsMember2024-12-310001001290bap:SharesMember2025-12-310001001290bap:SharesMember2024-12-310001001290bap:BondsFromFinancialOrganizationsMember2025-12-310001001290bap:BondsFromFinancialOrganizationsMember2024-12-310001001290bap:SubordinatedBondsMember2025-12-310001001290bap:SubordinatedBondsMember2024-12-310001001290bap:ExchangeTradedFundMember2025-12-310001001290bap:ExchangeTradedFundMember2024-12-310001001290bap:CentralBankOfChileBondsMember2025-12-310001001290bap:CentralBankOfChileBondsMember2024-12-310001001290bap:OthersMember2025-12-310001001290bap:OthersMember2024-12-310001001290ifrs-full:FinancialAssetsAtFairValueThroughProfitOrLossClassifiedAsHeldForTradingCategoryMember2025-12-310001001290ifrs-full:FinancialAssetsAtFairValueThroughProfitOrLossClassifiedAsHeldForTradingCategoryMember2024-12-310001001290bap:InterestAccruedOnInvestmentsMember2025-12-310001001290bap:InterestAccruedOnInvestmentsMember2024-12-310001001290bap:ColombianTreasuryBondsMember2025-12-310001001290bap:ColombianTreasuryBondsMember2024-12-310001001290bap:PeruvianTreasuryBondsMember2025-12-310001001290bap:PeruvianTreasuryBondsMember2024-12-310001001290bap:ChileanTreasuryBondsMember2025-12-310001001290bap:ChileanTreasuryBondsMember2024-12-310001001290bap:UnitedStatesOfAmericaTreasuryBondsMember2025-12-310001001290bap:UnitedStatesOfAmericaTreasuryBondsMember2024-12-310001001290bap:MexicanTreasuryBondsMember2025-12-310001001290bap:MexicanTreasuryBondsMember2024-12-310001001290bap:PanamaGovernmentBondsMember2025-12-310001001290bap:PanamaGovernmentBondsMember2024-12-310001001290ifrs-full:InvestmentFundsMembercountry:PE2025-12-310001001290ifrs-full:InvestmentFundsMembercountry:US2025-12-310001001290ifrs-full:InvestmentFundsMembercountry:CO2025-12-310001001290ifrs-full:InvestmentFundsMemberbap:OtherCountryMember2025-12-310001001290ifrs-full:InvestmentFundsMembercountry:PE2024-12-310001001290ifrs-full:InvestmentFundsMembercountry:US2024-12-310001001290ifrs-full:InvestmentFundsMembercountry:CO2024-12-310001001290ifrs-full:InvestmentFundsMemberbap:OtherCountryMember2024-12-310001001290bap:ParticipationInMutualFundsMembercountry:BO2025-12-310001001290bap:ParticipationInMutualFundsMembercountry:CL2025-12-310001001290bap:ParticipationInMutualFundsMembercountry:IE2025-12-310001001290bap:ParticipationInMutualFundsMembercountry:LU2025-12-310001001290bap:ParticipationInMutualFundsMemberbap:OtherCountryMember2025-12-310001001290bap:ParticipationInMutualFundsMembercountry:BO2024-12-310001001290bap:ParticipationInMutualFundsMembercountry:IE2024-12-310001001290bap:ParticipationInMutualFundsMembercountry:LU2024-12-310001001290bap:ParticipationInMutualFundsMemberbap:OtherCountryMember2024-12-310001001290bap:BolivianosMemberbap:ParticipationInRALFundMember2025-12-310001001290bap:USDollarsMemberbap:ParticipationInRALFundMember2025-12-310001001290bap:BolivianosMemberbap:ParticipationInRALFundMember2024-12-310001001290bap:USDollarsMemberbap:ParticipationInRALFundMember2024-12-310001001290bap:CorporateBondsMembercountry:CO2025-01-012025-12-310001001290bap:CorporateBondsMembercountry:PE2025-01-012025-12-310001001290bap:CorporateBondsMembercountry:CL2025-01-012025-12-310001001290bap:CorporateBondsMembercountry:BR2025-01-012025-12-310001001290bap:CorporateBondsMembercountry:US2025-01-012025-12-310001001290bap:CorporateBondsMemberbap:OtherCountryMember2025-01-012025-12-310001001290bap:CorporateBondsMembercountry:PE2024-01-012024-12-310001001290bap:CorporateBondsMembercountry:CL2024-01-012024-12-310001001290bap:CorporateBondsMembercountry:CO2024-01-012024-12-310001001290bap:CorporateBondsMembercountry:BR2024-01-012024-12-310001001290bap:CorporateBondsMemberbap:OtherCountryMember2024-01-012024-12-310001001290bap:CertificatesOfDepositBCRPMember2025-12-310001001290bap:CertificatesOfDepositBCRPMember2024-12-310001001290bap:SecuritizationInstrumentsMember2025-12-310001001290bap:SecuritizationInstrumentsMember2024-12-310001001290bap:NegotiableCertificatesOfDepositMember2025-12-310001001290bap:NegotiableCertificatesOfDepositMember2024-12-310001001290bap:InversionesCentenarioMember2025-12-310001001290bap:InversionesCentenarioMember2024-12-310001001290bap:CorporacionAndinaDeFomentoMember2025-12-310001001290bap:CorporacionAndinaDeFomentoMember2024-12-310001001290bap:HoldingBursatilChilenaSAMember2025-12-310001001290bap:HoldingBursatilChilenaSAMember2024-12-310001001290bap:HoldingBursatilRegionalSAMember2025-12-310001001290bap:HoldingBursatilRegionalSAMember2024-12-310001001290bap:PagosDigitalesPeruanosS.AMember2025-12-310001001290bap:PagosDigitalesPeruanosS.AMember2024-12-310001001290bap:OtherMember2025-12-310001001290bap:OtherMember2024-12-310001001290bap:SolesMemberbap:CorporateBondsMemberifrs-full:BottomOfRangeMember2025-12-310001001290bap:SolesMemberbap:CorporateBondsMemberifrs-full:TopOfRangeMember2025-12-310001001290bap:USDollarsMemberbap:CorporateBondsMemberifrs-full:BottomOfRangeMember2025-12-310001001290bap:USDollarsMemberbap:CorporateBondsMemberifrs-full:TopOfRangeMember2025-12-310001001290bap:OtherMemberbap:CorporateBondsMemberifrs-full:BottomOfRangeMember2025-12-310001001290bap:OtherMemberbap:CorporateBondsMemberifrs-full:TopOfRangeMember2025-12-310001001290bap:SolesMemberbap:CorporateBondsMemberifrs-full:BottomOfRangeMember2024-12-310001001290bap:SolesMemberbap:CorporateBondsMemberifrs-full:TopOfRangeMember2024-12-310001001290bap:USDollarsMemberbap:CorporateBondsMemberifrs-full:BottomOfRangeMember2024-12-310001001290bap:USDollarsMemberbap:CorporateBondsMemberifrs-full:TopOfRangeMember2024-12-310001001290bap:OtherMemberbap:CorporateBondsMemberifrs-full:BottomOfRangeMember2024-12-310001001290bap:OtherMemberbap:CorporateBondsMemberifrs-full:TopOfRangeMember2024-12-310001001290bap:SolesMemberbap:GovernmentTreasuryBondsMemberifrs-full:BottomOfRangeMember2025-12-310001001290bap:SolesMemberbap:GovernmentTreasuryBondsMemberifrs-full:TopOfRangeMember2025-12-310001001290bap:USDollarsMemberbap:GovernmentTreasuryBondsMemberifrs-full:BottomOfRangeMember2025-12-310001001290bap:USDollarsMemberbap:GovernmentTreasuryBondsMemberifrs-full:TopOfRangeMember2025-12-310001001290bap:OtherMemberbap:GovernmentTreasuryBondsMemberifrs-full:BottomOfRangeMember2025-12-310001001290bap:OtherMemberbap:GovernmentTreasuryBondsMemberifrs-full:TopOfRangeMember2025-12-310001001290bap:SolesMemberbap:GovernmentTreasuryBondsMemberifrs-full:BottomOfRangeMember2024-12-310001001290bap:SolesMemberbap:GovernmentTreasuryBondsMemberifrs-full:TopOfRangeMember2024-12-310001001290bap:USDollarsMemberbap:GovernmentTreasuryBondsMemberifrs-full:BottomOfRangeMember2024-12-310001001290bap:USDollarsMemberbap:GovernmentTreasuryBondsMemberifrs-full:TopOfRangeMember2024-12-310001001290bap:OtherMemberbap:GovernmentTreasuryBondsMemberifrs-full:BottomOfRangeMember2024-12-310001001290bap:OtherMemberbap:GovernmentTreasuryBondsMemberifrs-full:TopOfRangeMember2024-12-310001001290bap:SolesMemberbap:CertificatesOfDepositBCRPMemberifrs-full:BottomOfRangeMember2025-12-310001001290bap:SolesMemberbap:CertificatesOfDepositBCRPMemberifrs-full:TopOfRangeMember2025-12-310001001290bap:USDollarsMemberbap:CertificatesOfDepositBCRPMemberifrs-full:BottomOfRangeMember2025-12-310001001290bap:USDollarsMemberbap:CertificatesOfDepositBCRPMemberifrs-full:TopOfRangeMember2025-12-310001001290bap:OtherMemberbap:CertificatesOfDepositBCRPMemberifrs-full:BottomOfRangeMember2025-12-310001001290bap:OtherMemberbap:CertificatesOfDepositBCRPMemberifrs-full:TopOfRangeMember2025-12-310001001290bap:SolesMemberbap:CertificatesOfDepositBCRPMemberifrs-full:BottomOfRangeMember2024-12-310001001290bap:SolesMemberbap:CertificatesOfDepositBCRPMemberifrs-full:TopOfRangeMember2024-12-310001001290bap:USDollarsMemberbap:CertificatesOfDepositBCRPMemberifrs-full:BottomOfRangeMember2024-12-310001001290bap:USDollarsMemberbap:CertificatesOfDepositBCRPMemberifrs-full:TopOfRangeMember2024-12-310001001290bap:OtherMemberbap:CertificatesOfDepositBCRPMemberifrs-full:BottomOfRangeMember2024-12-310001001290bap:OtherMemberbap:CertificatesOfDepositBCRPMemberifrs-full:TopOfRangeMember2024-12-310001001290bap:SolesMemberbap:SecuritizationInstrumentsMemberifrs-full:BottomOfRangeMember2025-12-310001001290bap:SolesMemberbap:SecuritizationInstrumentsMemberifrs-full:TopOfRangeMember2025-12-310001001290bap:USDollarsMemberbap:SecuritizationInstrumentsMemberifrs-full:BottomOfRangeMember2025-12-310001001290bap:USDollarsMemberbap:SecuritizationInstrumentsMemberifrs-full:TopOfRangeMember2025-12-310001001290bap:OtherMemberbap:SecuritizationInstrumentsMemberifrs-full:BottomOfRangeMember2025-12-310001001290bap:OtherMemberbap:SecuritizationInstrumentsMemberifrs-full:TopOfRangeMember2025-12-310001001290bap:SolesMemberbap:SecuritizationInstrumentsMemberifrs-full:BottomOfRangeMember2024-12-310001001290bap:SolesMemberbap:SecuritizationInstrumentsMemberifrs-full:TopOfRangeMember2024-12-310001001290bap:USDollarsMemberbap:SecuritizationInstrumentsMemberifrs-full:BottomOfRangeMember2024-12-310001001290bap:USDollarsMemberbap:SecuritizationInstrumentsMemberifrs-full:TopOfRangeMember2024-12-310001001290bap:OtherMemberbap:SecuritizationInstrumentsMemberifrs-full:BottomOfRangeMember2024-12-310001001290bap:OtherMemberbap:SecuritizationInstrumentsMemberifrs-full:TopOfRangeMember2024-12-310001001290bap:SolesMemberbap:NegotiableCertificatesOfDepositsMemberifrs-full:BottomOfRangeMember2025-12-310001001290bap:SolesMemberbap:NegotiableCertificatesOfDepositsMemberifrs-full:TopOfRangeMember2025-12-310001001290bap:USDollarsMemberbap:NegotiableCertificatesOfDepositsMemberifrs-full:BottomOfRangeMember2025-12-310001001290bap:USDollarsMemberbap:NegotiableCertificatesOfDepositsMemberifrs-full:TopOfRangeMember2025-12-310001001290bap:OtherMemberbap:NegotiableCertificatesOfDepositsMemberifrs-full:BottomOfRangeMember2025-12-310001001290bap:OtherMemberbap:NegotiableCertificatesOfDepositsMemberifrs-full:TopOfRangeMember2025-12-310001001290bap:SolesMemberbap:NegotiableCertificatesOfDepositsMemberifrs-full:BottomOfRangeMember2024-12-310001001290bap:SolesMemberbap:NegotiableCertificatesOfDepositsMemberifrs-full:TopOfRangeMember2024-12-310001001290bap:USDollarsMemberbap:NegotiableCertificatesOfDepositsMemberifrs-full:BottomOfRangeMember2024-12-310001001290bap:USDollarsMemberbap:NegotiableCertificatesOfDepositsMemberifrs-full:TopOfRangeMember2024-12-310001001290bap:OtherMemberbap:NegotiableCertificatesOfDepositsMemberifrs-full:BottomOfRangeMember2024-12-310001001290bap:OtherMemberbap:NegotiableCertificatesOfDepositsMemberifrs-full:TopOfRangeMember2024-12-310001001290bap:SolesMemberbap:SubordinatedBondsMemberifrs-full:BottomOfRangeMember2025-12-310001001290bap:SolesMemberbap:SubordinatedBondsMemberifrs-full:TopOfRangeMember2025-12-310001001290bap:USDollarsMemberbap:SubordinatedBondsMemberifrs-full:BottomOfRangeMember2025-12-310001001290bap:USDollarsMemberbap:SubordinatedBondsMemberifrs-full:TopOfRangeMember2025-12-310001001290bap:OtherMemberbap:SubordinatedBondsMemberifrs-full:BottomOfRangeMember2025-12-310001001290bap:OtherMemberbap:SubordinatedBondsMemberifrs-full:TopOfRangeMember2025-12-310001001290bap:SolesMemberbap:SubordinatedBondsMemberifrs-full:BottomOfRangeMember2024-12-310001001290bap:SolesMemberbap:SubordinatedBondsMemberifrs-full:TopOfRangeMember2024-12-310001001290bap:USDollarsMemberbap:SubordinatedBondsMemberifrs-full:BottomOfRangeMember2024-12-310001001290bap:USDollarsMemberbap:SubordinatedBondsMemberifrs-full:TopOfRangeMember2024-12-310001001290bap:OtherMemberbap:SubordinatedBondsMemberifrs-full:BottomOfRangeMember2024-12-310001001290bap:OtherMemberbap:SubordinatedBondsMemberifrs-full:TopOfRangeMember2024-12-310001001290bap:SolesMemberbap:OthersMemberifrs-full:BottomOfRangeMember2025-12-310001001290bap:SolesMemberbap:OthersMemberifrs-full:TopOfRangeMember2025-12-310001001290bap:USDollarsMemberbap:OthersMemberifrs-full:BottomOfRangeMember2025-12-310001001290bap:USDollarsMemberbap:OthersMemberifrs-full:TopOfRangeMember2025-12-310001001290bap:OtherMemberbap:OthersMemberifrs-full:BottomOfRangeMember2025-12-310001001290bap:OtherMemberbap:OthersMemberifrs-full:TopOfRangeMember2025-12-310001001290bap:SolesMemberbap:OthersMemberifrs-full:BottomOfRangeMember2024-12-310001001290bap:SolesMemberbap:OthersMemberifrs-full:TopOfRangeMember2024-12-310001001290bap:USDollarsMemberbap:OthersMemberifrs-full:BottomOfRangeMember2024-12-310001001290bap:USDollarsMemberbap:OthersMemberifrs-full:TopOfRangeMember2024-12-310001001290bap:OtherMemberbap:OthersMemberifrs-full:BottomOfRangeMember2024-12-310001001290bap:OtherMemberbap:OthersMemberifrs-full:TopOfRangeMember2024-12-310001001290bap:RepurchasesAgreementMember2025-12-310001001290bap:RepurchasesAgreementMember2024-12-310001001290country:US2025-01-012025-12-310001001290country:PE2025-01-012025-12-310001001290country:CL2025-01-012025-12-310001001290country:CO2025-01-012025-12-310001001290bap:OtherCountryMember2025-01-012025-12-310001001290country:US2024-01-012024-12-310001001290country:PE2024-01-012024-12-310001001290country:CO2024-01-012024-12-310001001290bap:OtherCountryMember2024-01-012024-12-310001001290ifrs-full:InterestRateSwapContractMemberifrs-full:FairValueHedgesMember2025-12-310001001290ifrs-full:InterestRateSwapContractMemberifrs-full:FairValueHedgesMember2024-12-310001001290bap:CorporateBondsMemberifrs-full:FairValueHedgesMember2025-12-310001001290bap:CorporateBondsMemberifrs-full:FairValueHedgesMember2024-12-310001001290bap:CorporateBondsMemberifrs-full:CurrencySwapContractMemberifrs-full:CashFlowHedgesMember2025-12-310001001290bap:PeruvianGovernmentBondsMember2025-12-310001001290bap:PeruvianGovernmentBondsMember2024-12-310001001290bap:ColombianGovernmentBondsMember2025-12-310001001290bap:ColombianGovernmentBondsMember2024-12-310001001290bap:UnitedStatesOfAmericaGovernmentBondsMember2025-12-310001001290bap:UnitedStatesOfAmericaGovernmentBondsMember2024-12-310001001290bap:MexicanGovernmentBondsMember2025-12-310001001290bap:MexicanGovernmentBondsMember2024-12-310001001290bap:ChileanGovernmentBondsMember2025-12-310001001290bap:ChileanGovernmentBondsMember2024-12-310001001290bap:BrazilianGovernmentBondsMember2025-12-310001001290bap:BrazilianGovernmentBondsMember2024-12-310001001290bap:PhilippineGovernmentBondsMember2025-12-310001001290bap:PhilippineGovernmentBondsMember2024-12-310001001290bap:QatariGovernmentBondsMember2025-12-310001001290bap:QatariGovernmentBondsMember2024-12-310001001290bap:OtherBondsMember2025-12-310001001290bap:OtherBondsMember2024-12-310001001290bap:CertificatesOfDepositBCRPMember2025-01-012025-12-310001001290bap:CertificatesOfDepositBCRPMember2024-01-012024-12-310001001290bap:InmueblesPanamericanaS.A.Member2025-12-310001001290bap:InmueblesPanamericanaS.A.Member2024-12-310001001290bap:MallAventuraS.A.Member2025-12-310001001290bap:MallAventuraS.A.Member2024-12-310001001290bap:ColegiosPeruanosS.A.Member2025-12-310001001290bap:ColegiosPeruanosS.A.Member2024-12-310001001290bap:AbengoaTransmisionDelNorteS.A.Member2025-12-310001001290bap:AbengoaTransmisionDelNorteS.A.Member2024-12-310001001290bap:InretailShoppingMallsMember2025-12-310001001290bap:InretailShoppingMallsMember2024-12-310001001290bap:CentroComercialPlazaNorteS.A.C.Member2025-12-310001001290bap:CentroComercialPlazaNorteS.A.C.Member2024-12-310001001290bap:MultimercadosZonalesSACMember2025-12-310001001290bap:MultimercadosZonalesSACMember2024-12-310001001290bap:AeropuertosDelPeruS.A.Member2025-12-310001001290bap:AeropuertosDelPeruS.A.Member2024-12-310001001290bap:CentroComercialMallDelSurS.A.C.Member2025-12-310001001290bap:CentroComercialMallDelSurS.A.C.Member2024-12-310001001290bap:UniversidadPeruanaCayetanoHerediaMember2025-12-310001001290bap:UniversidadPeruanaCayetanoHerediaMember2024-12-310001001290bap:CostaDelSolSAMember2025-12-310001001290bap:CostaDelSolSAMember2024-12-310001001290bap:AsociacionCivilSanJuanBautistaMember2025-12-310001001290bap:AsociacionCivilSanJuanBautistaMember2024-12-310001001290bap:InmobiliariaTerranoSAYOperadoraPortuariaSAMember2025-12-310001001290bap:InmobiliariaTerranoSAYOperadoraPortuariaSAMember2024-12-310001001290bap:NessusHotelesPeruS.A.Member2025-12-310001001290bap:NessusHotelesPeruS.A.Member2024-12-310001001290bap:ConcesionariaLaChiraSAMember2025-12-310001001290bap:ConcesionariaLaChiraSAMember2024-12-310001001290bap:RedElectricaDelSurS.A.YTransmisoraElectricaDelSurS.A.Member2025-12-310001001290bap:RedElectricaDelSurS.A.YTransmisoraElectricaDelSurS.A.Member2024-12-310001001290bap:FerreyrosS.A.Member2025-12-310001001290bap:FerreyrosS.A.Member2024-12-310001001290bap:CompaniaDeTurismoLaPazS.A.C.Member2025-12-310001001290bap:CompaniaDeTurismoLaPazS.A.C.Member2024-12-310001001290bap:OthersInvestmentsMember2025-12-310001001290bap:OthersInvestmentsMember2024-12-310001001290bap:SecuritizationInstrumentsMember2025-12-310001001290bap:SecuritizationInstrumentsMember2024-12-310001001290bap:OtherMemberbap:CertificatesOfDepositBCRPMembercountry:BO2025-12-310001001290bap:OtherMemberbap:CertificatesOfDepositBCRPMembercountry:BO2024-12-310001001290bap:OtherGovernmentBondsMember2025-12-310001001290bap:NegotiableCertificatesOfDepositsMember2025-12-310001001290bap:CertificatesOfPaymentOnWorkProgressMember2025-12-310001001290bap:OtherGovernmentBondsMember2024-12-310001001290bap:NegotiableCertificatesOfDepositsMember2024-12-310001001290bap:CertificatesOfPaymentOnWorkProgressMember2024-12-310001001290ifrs-full:FinancialAssetsAtAmortisedCostMember2025-01-012025-12-310001001290ifrs-full:FinancialAssetsAtAmortisedCostMember2024-01-012024-12-310001001290bap:SolesMemberifrs-full:BottomOfRangeMember2025-12-310001001290bap:SolesMemberifrs-full:TopOfRangeMember2025-12-310001001290bap:USDollarsMemberifrs-full:BottomOfRangeMember2025-12-310001001290bap:USDollarsMemberifrs-full:TopOfRangeMember2025-12-310001001290bap:OtherMemberifrs-full:BottomOfRangeMember2025-12-310001001290bap:OtherMemberifrs-full:TopOfRangeMember2025-12-310001001290bap:SolesMemberifrs-full:BottomOfRangeMember2024-12-310001001290bap:SolesMemberifrs-full:TopOfRangeMember2024-12-310001001290bap:USDollarsMemberifrs-full:BottomOfRangeMember2024-12-310001001290bap:USDollarsMemberifrs-full:TopOfRangeMember2024-12-310001001290bap:OtherMemberifrs-full:BottomOfRangeMember2024-12-310001001290bap:OtherMemberifrs-full:TopOfRangeMember2024-12-310001001290ifrs-full:FinancialAssetsAtAmortisedCostMember2025-12-310001001290ifrs-full:FinancialAssetsAtAmortisedCostMember2024-12-310001001290bap:SovereignBondsMemberifrs-full:FinancialAssetsAtAmortisedCostMember2025-08-310001001290bap:SovereignBondsMember2025-08-310001001290bap:SovereignBondsMemberifrs-full:FinancialAssetsAtAmortisedCostMember2024-06-300001001290bap:SovereignBondsMember2024-06-300001001290ifrs-full:FinancialAssetsAtFairValueThroughOtherComprehensiveIncomeCategoryMemberifrs-full:NotLaterThanThreeMonthsMember2025-12-310001001290ifrs-full:FinancialAssetsAtAmortisedCostCategoryMemberifrs-full:NotLaterThanThreeMonthsMember2025-12-310001001290ifrs-full:FinancialAssetsAtFairValueThroughOtherComprehensiveIncomeCategoryMemberifrs-full:LaterThanThreeMonthsAndNotLaterThanOneYearMember2025-12-310001001290ifrs-full:FinancialAssetsAtAmortisedCostCategoryMemberifrs-full:LaterThanThreeMonthsAndNotLaterThanOneYearMember2025-12-310001001290ifrs-full:FinancialAssetsAtFairValueThroughOtherComprehensiveIncomeCategoryMemberifrs-full:LaterThanOneYearAndNotLaterThanThreeYearsMember2025-12-310001001290ifrs-full:FinancialAssetsAtAmortisedCostCategoryMemberifrs-full:LaterThanOneYearAndNotLaterThanThreeYearsMember2025-12-310001001290ifrs-full:FinancialAssetsAtFairValueThroughOtherComprehensiveIncomeCategoryMemberifrs-full:LaterThanThreeYearsAndNotLaterThanFiveYearsMember2025-12-310001001290ifrs-full:FinancialAssetsAtAmortisedCostCategoryMemberifrs-full:LaterThanThreeYearsAndNotLaterThanFiveYearsMember2025-12-310001001290ifrs-full:FinancialAssetsAtFairValueThroughOtherComprehensiveIncomeCategoryMemberifrs-full:LaterThanFiveYearsMember2025-12-310001001290ifrs-full:FinancialAssetsAtAmortisedCostCategoryMemberifrs-full:LaterThanFiveYearsMember2025-12-310001001290ifrs-full:FinancialAssetsAtFairValueThroughOtherComprehensiveIncomeCategoryMemberbap:WithoutMaturityMember2025-12-310001001290ifrs-full:FinancialAssetsAtAmortisedCostCategoryMemberbap:WithoutMaturityMember2025-12-310001001290ifrs-full:FinancialAssetsAtFairValueThroughOtherComprehensiveIncomeCategoryMember2025-12-310001001290ifrs-full:FinancialAssetsAtAmortisedCostCategoryMember2025-12-310001001290ifrs-full:FinancialAssetsAtFairValueThroughOtherComprehensiveIncomeCategoryMemberifrs-full:NotLaterThanThreeMonthsMember2024-12-310001001290ifrs-full:FinancialAssetsAtAmortisedCostCategoryMemberifrs-full:NotLaterThanThreeMonthsMember2024-12-310001001290ifrs-full:FinancialAssetsAtFairValueThroughOtherComprehensiveIncomeCategoryMemberifrs-full:LaterThanThreeMonthsAndNotLaterThanOneYearMember2024-12-310001001290ifrs-full:FinancialAssetsAtAmortisedCostCategoryMemberifrs-full:LaterThanThreeMonthsAndNotLaterThanOneYearMember2024-12-310001001290ifrs-full:FinancialAssetsAtFairValueThroughOtherComprehensiveIncomeCategoryMemberifrs-full:LaterThanOneYearAndNotLaterThanThreeYearsMember2024-12-310001001290ifrs-full:FinancialAssetsAtAmortisedCostCategoryMemberifrs-full:LaterThanOneYearAndNotLaterThanThreeYearsMember2024-12-310001001290ifrs-full:FinancialAssetsAtFairValueThroughOtherComprehensiveIncomeCategoryMemberifrs-full:LaterThanThreeYearsAndNotLaterThanFiveYearsMember2024-12-310001001290ifrs-full:FinancialAssetsAtAmortisedCostCategoryMemberifrs-full:LaterThanThreeYearsAndNotLaterThanFiveYearsMember2024-12-310001001290ifrs-full:FinancialAssetsAtFairValueThroughOtherComprehensiveIncomeCategoryMemberifrs-full:LaterThanFiveYearsMember2024-12-310001001290ifrs-full:FinancialAssetsAtAmortisedCostCategoryMemberifrs-full:LaterThanFiveYearsMember2024-12-310001001290ifrs-full:FinancialAssetsAtFairValueThroughOtherComprehensiveIncomeCategoryMemberbap:WithoutMaturityMember2024-12-310001001290ifrs-full:FinancialAssetsAtAmortisedCostCategoryMemberbap:WithoutMaturityMember2024-12-310001001290ifrs-full:FinancialAssetsAtFairValueThroughOtherComprehensiveIncomeCategoryMember2024-12-310001001290ifrs-full:FinancialAssetsAtAmortisedCostCategoryMember2024-12-310001001290ifrs-full:CorporateLoansMemberbap:StageOneMemberbap:PortfolioOfDirectLoansMember2024-12-310001001290ifrs-full:CorporateLoansMemberbap:StageOneMemberbap:PortfolioOfDirectLoansMember2025-01-012025-12-310001001290ifrs-full:CorporateLoansMemberbap:StageOneMemberbap:PortfolioOfDirectLoansMember2025-12-310001001290bap:ResidentialMortgageLoansMemberbap:StageOneMemberbap:PortfolioOfDirectLoansMember2024-12-310001001290bap:ResidentialMortgageLoansMemberbap:StageOneMemberbap:PortfolioOfDirectLoansMember2025-01-012025-12-310001001290bap:ResidentialMortgageLoansMemberbap:StageOneMemberbap:PortfolioOfDirectLoansMember2025-12-310001001290bap:SmallBusinessLoansMemberbap:StageOneMemberbap:PortfolioOfDirectLoansMember2024-12-310001001290bap:SmallBusinessLoansMemberbap:StageOneMemberbap:PortfolioOfDirectLoansMember2025-01-012025-12-310001001290bap:SmallBusinessLoansMemberbap:StageOneMemberbap:PortfolioOfDirectLoansMember2025-12-310001001290ifrs-full:ConsumerLoansMemberbap:StageOneMemberbap:PortfolioOfDirectLoansMember2024-12-310001001290ifrs-full:ConsumerLoansMemberbap:StageOneMemberbap:PortfolioOfDirectLoansMember2025-01-012025-12-310001001290ifrs-full:ConsumerLoansMemberbap:StageOneMemberbap:PortfolioOfDirectLoansMember2025-12-310001001290bap:StageOneMemberbap:PortfolioOfDirectLoansMember2024-12-310001001290bap:StageOneMemberbap:PortfolioOfDirectLoansMember2025-01-012025-12-310001001290bap:StageOneMemberbap:PortfolioOfDirectLoansMember2025-12-310001001290ifrs-full:CorporateLoansMemberbap:StageTwoMemberbap:PortfolioOfDirectLoansMember2024-12-310001001290ifrs-full:CorporateLoansMemberbap:StageTwoMemberbap:PortfolioOfDirectLoansMember2025-01-012025-12-310001001290ifrs-full:CorporateLoansMemberbap:StageTwoMemberbap:PortfolioOfDirectLoansMember2025-12-310001001290bap:ResidentialMortgageLoansMemberbap:StageTwoMemberbap:PortfolioOfDirectLoansMember2024-12-310001001290bap:ResidentialMortgageLoansMemberbap:StageTwoMemberbap:PortfolioOfDirectLoansMember2025-01-012025-12-310001001290bap:ResidentialMortgageLoansMemberbap:StageTwoMemberbap:PortfolioOfDirectLoansMember2025-12-310001001290bap:SmallBusinessLoansMemberbap:StageTwoMemberbap:PortfolioOfDirectLoansMember2024-12-310001001290bap:SmallBusinessLoansMemberbap:StageTwoMemberbap:PortfolioOfDirectLoansMember2025-01-012025-12-310001001290bap:SmallBusinessLoansMemberbap:StageTwoMemberbap:PortfolioOfDirectLoansMember2025-12-310001001290ifrs-full:ConsumerLoansMemberbap:StageTwoMemberbap:PortfolioOfDirectLoansMember2024-12-310001001290ifrs-full:ConsumerLoansMemberbap:StageTwoMemberbap:PortfolioOfDirectLoansMember2025-01-012025-12-310001001290ifrs-full:ConsumerLoansMemberbap:StageTwoMemberbap:PortfolioOfDirectLoansMember2025-12-310001001290bap:StageTwoMemberbap:PortfolioOfDirectLoansMember2024-12-310001001290bap:StageTwoMemberbap:PortfolioOfDirectLoansMember2025-01-012025-12-310001001290bap:StageTwoMemberbap:PortfolioOfDirectLoansMember2025-12-310001001290ifrs-full:CorporateLoansMemberbap:StageThreeMemberbap:PortfolioOfDirectLoansMember2024-12-310001001290ifrs-full:CorporateLoansMemberbap:StageThreeMemberbap:PortfolioOfDirectLoansMember2025-01-012025-12-310001001290ifrs-full:CorporateLoansMemberbap:StageThreeMemberbap:PortfolioOfDirectLoansMember2025-12-310001001290bap:ResidentialMortgageLoansMemberbap:StageThreeMemberbap:PortfolioOfDirectLoansMember2024-12-310001001290bap:ResidentialMortgageLoansMemberbap:StageThreeMemberbap:PortfolioOfDirectLoansMember2025-01-012025-12-310001001290bap:ResidentialMortgageLoansMemberbap:StageThreeMemberbap:PortfolioOfDirectLoansMember2025-12-310001001290bap:SmallBusinessLoansMemberbap:StageThreeMemberbap:PortfolioOfDirectLoansMember2024-12-310001001290bap:SmallBusinessLoansMemberbap:StageThreeMemberbap:PortfolioOfDirectLoansMember2025-01-012025-12-310001001290bap:SmallBusinessLoansMemberbap:StageThreeMemberbap:PortfolioOfDirectLoansMember2025-12-310001001290ifrs-full:ConsumerLoansMemberbap:StageThreeMemberbap:PortfolioOfDirectLoansMember2024-12-310001001290ifrs-full:ConsumerLoansMemberbap:StageThreeMemberbap:PortfolioOfDirectLoansMember2025-01-012025-12-310001001290ifrs-full:ConsumerLoansMemberbap:StageThreeMemberbap:PortfolioOfDirectLoansMember2025-12-310001001290bap:StageThreeMemberbap:PortfolioOfDirectLoansMember2024-12-310001001290bap:StageThreeMemberbap:PortfolioOfDirectLoansMember2025-01-012025-12-310001001290bap:StageThreeMemberbap:PortfolioOfDirectLoansMember2025-12-310001001290ifrs-full:CorporateLoansMemberbap:ConsolidationOfAllStagesMemberbap:PortfolioOfDirectLoansMember2024-12-310001001290ifrs-full:CorporateLoansMemberbap:ConsolidationOfAllStagesMemberbap:PortfolioOfDirectLoansMember2025-01-012025-12-310001001290ifrs-full:CorporateLoansMemberbap:ConsolidationOfAllStagesMemberbap:PortfolioOfDirectLoansMember2025-12-310001001290bap:ResidentialMortgageLoansMemberbap:ConsolidationOfAllStagesMemberbap:PortfolioOfDirectLoansMember2024-12-310001001290bap:ResidentialMortgageLoansMemberbap:ConsolidationOfAllStagesMemberbap:PortfolioOfDirectLoansMember2025-01-012025-12-310001001290bap:ResidentialMortgageLoansMemberbap:ConsolidationOfAllStagesMemberbap:PortfolioOfDirectLoansMember2025-12-310001001290bap:SmallBusinessLoansMemberbap:ConsolidationOfAllStagesMemberbap:PortfolioOfDirectLoansMember2024-12-310001001290bap:SmallBusinessLoansMemberbap:ConsolidationOfAllStagesMemberbap:PortfolioOfDirectLoansMember2025-01-012025-12-310001001290bap:SmallBusinessLoansMemberbap:ConsolidationOfAllStagesMemberbap:PortfolioOfDirectLoansMember2025-12-310001001290ifrs-full:ConsumerLoansMemberbap:ConsolidationOfAllStagesMemberbap:PortfolioOfDirectLoansMember2024-12-310001001290ifrs-full:ConsumerLoansMemberbap:ConsolidationOfAllStagesMemberbap:PortfolioOfDirectLoansMember2025-01-012025-12-310001001290ifrs-full:ConsumerLoansMemberbap:ConsolidationOfAllStagesMemberbap:PortfolioOfDirectLoansMember2025-12-310001001290bap:ConsolidationOfAllStagesMemberbap:PortfolioOfDirectLoansMember2024-12-310001001290bap:ConsolidationOfAllStagesMemberbap:PortfolioOfDirectLoansMember2025-01-012025-12-310001001290bap:ConsolidationOfAllStagesMemberbap:PortfolioOfDirectLoansMember2025-12-310001001290ifrs-full:CorporateLoansMemberbap:StageOneMemberbap:PortfolioOfDirectLoansMember2023-12-310001001290ifrs-full:CorporateLoansMemberbap:StageOneMemberbap:PortfolioOfDirectLoansMember2024-01-012024-12-310001001290bap:ResidentialMortgageLoansMemberbap:StageOneMemberbap:PortfolioOfDirectLoansMember2023-12-310001001290bap:ResidentialMortgageLoansMemberbap:StageOneMemberbap:PortfolioOfDirectLoansMember2024-01-012024-12-310001001290bap:SmallBusinessLoansMemberbap:StageOneMemberbap:PortfolioOfDirectLoansMember2023-12-310001001290bap:SmallBusinessLoansMemberbap:StageOneMemberbap:PortfolioOfDirectLoansMember2024-01-012024-12-310001001290ifrs-full:ConsumerLoansMemberbap:StageOneMemberbap:PortfolioOfDirectLoansMember2023-12-310001001290ifrs-full:ConsumerLoansMemberbap:StageOneMemberbap:PortfolioOfDirectLoansMember2024-01-012024-12-310001001290bap:StageOneMemberbap:PortfolioOfDirectLoansMember2023-12-310001001290bap:StageOneMemberbap:PortfolioOfDirectLoansMember2024-01-012024-12-310001001290ifrs-full:CorporateLoansMemberbap:StageTwoMemberbap:PortfolioOfDirectLoansMember2023-12-310001001290ifrs-full:CorporateLoansMemberbap:StageTwoMemberbap:PortfolioOfDirectLoansMember2024-01-012024-12-310001001290bap:ResidentialMortgageLoansMemberbap:StageTwoMemberbap:PortfolioOfDirectLoansMember2023-12-310001001290bap:ResidentialMortgageLoansMemberbap:StageTwoMemberbap:PortfolioOfDirectLoansMember2024-01-012024-12-310001001290bap:SmallBusinessLoansMemberbap:StageTwoMemberbap:PortfolioOfDirectLoansMember2023-12-310001001290bap:SmallBusinessLoansMemberbap:StageTwoMemberbap:PortfolioOfDirectLoansMember2024-01-012024-12-310001001290ifrs-full:ConsumerLoansMemberbap:StageTwoMemberbap:PortfolioOfDirectLoansMember2023-12-310001001290ifrs-full:ConsumerLoansMemberbap:StageTwoMemberbap:PortfolioOfDirectLoansMember2024-01-012024-12-310001001290bap:StageTwoMemberbap:PortfolioOfDirectLoansMember2023-12-310001001290bap:StageTwoMemberbap:PortfolioOfDirectLoansMember2024-01-012024-12-310001001290ifrs-full:CorporateLoansMemberbap:StageThreeMemberbap:PortfolioOfDirectLoansMember2023-12-310001001290ifrs-full:CorporateLoansMemberbap:StageThreeMemberbap:PortfolioOfDirectLoansMember2024-01-012024-12-310001001290bap:ResidentialMortgageLoansMemberbap:StageThreeMemberbap:PortfolioOfDirectLoansMember2023-12-310001001290bap:ResidentialMortgageLoansMemberbap:StageThreeMemberbap:PortfolioOfDirectLoansMember2024-01-012024-12-310001001290bap:SmallBusinessLoansMemberbap:StageThreeMemberbap:PortfolioOfDirectLoansMember2023-12-310001001290bap:SmallBusinessLoansMemberbap:StageThreeMemberbap:PortfolioOfDirectLoansMember2024-01-012024-12-310001001290ifrs-full:ConsumerLoansMemberbap:StageThreeMemberbap:PortfolioOfDirectLoansMember2023-12-310001001290ifrs-full:ConsumerLoansMemberbap:StageThreeMemberbap:PortfolioOfDirectLoansMember2024-01-012024-12-310001001290bap:StageThreeMemberbap:PortfolioOfDirectLoansMember2023-12-310001001290bap:StageThreeMemberbap:PortfolioOfDirectLoansMember2024-01-012024-12-310001001290ifrs-full:CorporateLoansMemberbap:ConsolidationOfAllStagesMemberbap:PortfolioOfDirectLoansMember2023-12-310001001290ifrs-full:CorporateLoansMemberbap:ConsolidationOfAllStagesMemberbap:PortfolioOfDirectLoansMember2024-01-012024-12-310001001290bap:ResidentialMortgageLoansMemberbap:ConsolidationOfAllStagesMemberbap:PortfolioOfDirectLoansMember2023-12-310001001290bap:ResidentialMortgageLoansMemberbap:ConsolidationOfAllStagesMemberbap:PortfolioOfDirectLoansMember2024-01-012024-12-310001001290bap:SmallBusinessLoansMemberbap:ConsolidationOfAllStagesMemberbap:PortfolioOfDirectLoansMember2023-12-310001001290bap:SmallBusinessLoansMemberbap:ConsolidationOfAllStagesMemberbap:PortfolioOfDirectLoansMember2024-01-012024-12-310001001290ifrs-full:ConsumerLoansMemberbap:ConsolidationOfAllStagesMemberbap:PortfolioOfDirectLoansMember2023-12-310001001290ifrs-full:ConsumerLoansMemberbap:ConsolidationOfAllStagesMemberbap:PortfolioOfDirectLoansMember2024-01-012024-12-310001001290bap:ConsolidationOfAllStagesMemberbap:PortfolioOfDirectLoansMember2023-12-310001001290bap:ConsolidationOfAllStagesMemberbap:PortfolioOfDirectLoansMember2024-01-012024-12-310001001290ifrs-full:CorporateLoansMemberbap:StageOneMemberbap:PortfolioOfDirectAndIndirectLoansMember2024-12-310001001290ifrs-full:CorporateLoansMemberbap:StageOneMemberbap:PortfolioOfDirectAndIndirectLoansMember2025-01-012025-12-310001001290ifrs-full:CorporateLoansMemberbap:StageOneMemberbap:PortfolioOfDirectAndIndirectLoansMember2025-12-310001001290bap:ResidentialMortgageLoansMemberbap:StageOneMemberbap:PortfolioOfDirectAndIndirectLoansMember2024-12-310001001290bap:ResidentialMortgageLoansMemberbap:StageOneMemberbap:PortfolioOfDirectAndIndirectLoansMember2025-01-012025-12-310001001290bap:ResidentialMortgageLoansMemberbap:StageOneMemberbap:PortfolioOfDirectAndIndirectLoansMember2025-12-310001001290bap:SmallAndMicroBusinessLoansMemberbap:StageOneMemberbap:PortfolioOfDirectAndIndirectLoansMember2024-12-310001001290bap:SmallAndMicroBusinessLoansMemberbap:StageOneMemberbap:PortfolioOfDirectAndIndirectLoansMember2025-01-012025-12-310001001290bap:SmallAndMicroBusinessLoansMemberbap:StageOneMemberbap:PortfolioOfDirectAndIndirectLoansMember2025-12-310001001290ifrs-full:ConsumerLoansMemberbap:StageOneMemberbap:PortfolioOfDirectAndIndirectLoansMember2024-12-310001001290ifrs-full:ConsumerLoansMemberbap:StageOneMemberbap:PortfolioOfDirectAndIndirectLoansMember2025-01-012025-12-310001001290ifrs-full:ConsumerLoansMemberbap:StageOneMemberbap:PortfolioOfDirectAndIndirectLoansMember2025-12-310001001290bap:StageOneMemberbap:PortfolioOfDirectAndIndirectLoansMember2024-12-310001001290bap:StageOneMemberbap:PortfolioOfDirectAndIndirectLoansMember2025-01-012025-12-310001001290bap:StageOneMemberbap:PortfolioOfDirectAndIndirectLoansMember2025-12-310001001290ifrs-full:CorporateLoansMemberbap:StageTwoMemberbap:PortfolioOfDirectAndIndirectLoansMember2024-12-310001001290ifrs-full:CorporateLoansMemberbap:StageTwoMemberbap:PortfolioOfDirectAndIndirectLoansMember2025-01-012025-12-310001001290ifrs-full:CorporateLoansMemberbap:StageTwoMemberbap:PortfolioOfDirectAndIndirectLoansMember2025-12-310001001290bap:ResidentialMortgageLoansMemberbap:StageTwoMemberbap:PortfolioOfDirectAndIndirectLoansMember2024-12-310001001290bap:ResidentialMortgageLoansMemberbap:StageTwoMemberbap:PortfolioOfDirectAndIndirectLoansMember2025-01-012025-12-310001001290bap:ResidentialMortgageLoansMemberbap:StageTwoMemberbap:PortfolioOfDirectAndIndirectLoansMember2025-12-310001001290bap:SmallAndMicroBusinessLoansMemberbap:StageTwoMemberbap:PortfolioOfDirectAndIndirectLoansMember2024-12-310001001290bap:SmallAndMicroBusinessLoansMemberbap:StageTwoMemberbap:PortfolioOfDirectAndIndirectLoansMember2025-01-012025-12-310001001290bap:SmallAndMicroBusinessLoansMemberbap:StageTwoMemberbap:PortfolioOfDirectAndIndirectLoansMember2025-12-310001001290ifrs-full:ConsumerLoansMemberbap:StageTwoMemberbap:PortfolioOfDirectAndIndirectLoansMember2024-12-310001001290ifrs-full:ConsumerLoansMemberbap:StageTwoMemberbap:PortfolioOfDirectAndIndirectLoansMember2025-01-012025-12-310001001290ifrs-full:ConsumerLoansMemberbap:StageTwoMemberbap:PortfolioOfDirectAndIndirectLoansMember2025-12-310001001290bap:StageTwoMemberbap:PortfolioOfDirectAndIndirectLoansMember2024-12-310001001290bap:StageTwoMemberbap:PortfolioOfDirectAndIndirectLoansMember2025-01-012025-12-310001001290bap:StageTwoMemberbap:PortfolioOfDirectAndIndirectLoansMember2025-12-310001001290ifrs-full:CorporateLoansMemberbap:StageThreeMemberbap:PortfolioOfDirectAndIndirectLoansMember2024-12-310001001290ifrs-full:CorporateLoansMemberbap:StageThreeMemberbap:PortfolioOfDirectAndIndirectLoansMember2025-01-012025-12-310001001290ifrs-full:CorporateLoansMemberbap:StageThreeMemberbap:PortfolioOfDirectAndIndirectLoansMember2025-12-310001001290bap:ResidentialMortgageLoansMemberbap:StageThreeMemberbap:PortfolioOfDirectAndIndirectLoansMember2024-12-310001001290bap:ResidentialMortgageLoansMemberbap:StageThreeMemberbap:PortfolioOfDirectAndIndirectLoansMember2025-01-012025-12-310001001290bap:ResidentialMortgageLoansMemberbap:StageThreeMemberbap:PortfolioOfDirectAndIndirectLoansMember2025-12-310001001290bap:SmallAndMicroBusinessLoansMemberbap:StageThreeMemberbap:PortfolioOfDirectAndIndirectLoansMember2024-12-310001001290bap:SmallAndMicroBusinessLoansMemberbap:StageThreeMemberbap:PortfolioOfDirectAndIndirectLoansMember2025-01-012025-12-310001001290bap:SmallAndMicroBusinessLoansMemberbap:StageThreeMemberbap:PortfolioOfDirectAndIndirectLoansMember2025-12-310001001290ifrs-full:ConsumerLoansMemberbap:StageThreeMemberbap:PortfolioOfDirectAndIndirectLoansMember2024-12-310001001290ifrs-full:ConsumerLoansMemberbap:StageThreeMemberbap:PortfolioOfDirectAndIndirectLoansMember2025-01-012025-12-310001001290ifrs-full:ConsumerLoansMemberbap:StageThreeMemberbap:PortfolioOfDirectAndIndirectLoansMember2025-12-310001001290bap:StageThreeMemberbap:PortfolioOfDirectAndIndirectLoansMember2024-12-310001001290bap:StageThreeMemberbap:PortfolioOfDirectAndIndirectLoansMember2025-01-012025-12-310001001290bap:StageThreeMemberbap:PortfolioOfDirectAndIndirectLoansMember2025-12-310001001290ifrs-full:CorporateLoansMemberbap:ConsolidationOfAllStagesMemberbap:PortfolioOfDirectAndIndirectLoansMember2024-12-310001001290ifrs-full:CorporateLoansMemberbap:ConsolidationOfAllStagesMemberbap:PortfolioOfDirectAndIndirectLoansMember2025-01-012025-12-310001001290ifrs-full:CorporateLoansMemberbap:ConsolidationOfAllStagesMemberbap:PortfolioOfDirectAndIndirectLoansMember2025-12-310001001290bap:ResidentialMortgageLoansMemberbap:ConsolidationOfAllStagesMemberbap:PortfolioOfDirectAndIndirectLoansMember2024-12-310001001290bap:ResidentialMortgageLoansMemberbap:ConsolidationOfAllStagesMemberbap:PortfolioOfDirectAndIndirectLoansMember2025-01-012025-12-310001001290bap:ResidentialMortgageLoansMemberbap:ConsolidationOfAllStagesMemberbap:PortfolioOfDirectAndIndirectLoansMember2025-12-310001001290bap:SmallAndMicroBusinessLoansMemberbap:ConsolidationOfAllStagesMemberbap:PortfolioOfDirectAndIndirectLoansMember2024-12-310001001290bap:SmallAndMicroBusinessLoansMemberbap:ConsolidationOfAllStagesMemberbap:PortfolioOfDirectAndIndirectLoansMember2025-01-012025-12-310001001290bap:SmallAndMicroBusinessLoansMemberbap:ConsolidationOfAllStagesMemberbap:PortfolioOfDirectAndIndirectLoansMember2025-12-310001001290ifrs-full:ConsumerLoansMemberbap:ConsolidationOfAllStagesMemberbap:PortfolioOfDirectAndIndirectLoansMember2024-12-310001001290ifrs-full:ConsumerLoansMemberbap:ConsolidationOfAllStagesMemberbap:PortfolioOfDirectAndIndirectLoansMember2025-01-012025-12-310001001290ifrs-full:ConsumerLoansMemberbap:ConsolidationOfAllStagesMemberbap:PortfolioOfDirectAndIndirectLoansMember2025-12-310001001290bap:ConsolidationOfAllStagesMemberbap:PortfolioOfDirectAndIndirectLoansMember2024-12-310001001290bap:ConsolidationOfAllStagesMemberbap:PortfolioOfDirectAndIndirectLoansMember2025-01-012025-12-310001001290bap:ConsolidationOfAllStagesMemberbap:PortfolioOfDirectAndIndirectLoansMember2025-12-310001001290ifrs-full:CorporateLoansMemberbap:StageOneMemberbap:PortfolioOfDirectAndIndirectLoansMember2023-12-310001001290ifrs-full:CorporateLoansMemberbap:StageOneMemberbap:PortfolioOfDirectAndIndirectLoansMember2024-01-012024-12-310001001290bap:ResidentialMortgageLoansMemberbap:StageOneMemberbap:PortfolioOfDirectAndIndirectLoansMember2023-12-310001001290bap:ResidentialMortgageLoansMemberbap:StageOneMemberbap:PortfolioOfDirectAndIndirectLoansMember2024-01-012024-12-310001001290bap:SmallAndMicroBusinessLoansMemberbap:StageOneMemberbap:PortfolioOfDirectAndIndirectLoansMember2023-12-310001001290bap:SmallAndMicroBusinessLoansMemberbap:StageOneMemberbap:PortfolioOfDirectAndIndirectLoansMember2024-01-012024-12-310001001290ifrs-full:ConsumerLoansMemberbap:StageOneMemberbap:PortfolioOfDirectAndIndirectLoansMember2023-12-310001001290ifrs-full:ConsumerLoansMemberbap:StageOneMemberbap:PortfolioOfDirectAndIndirectLoansMember2024-01-012024-12-310001001290bap:StageOneMemberbap:PortfolioOfDirectAndIndirectLoansMember2023-12-310001001290bap:StageOneMemberbap:PortfolioOfDirectAndIndirectLoansMember2024-01-012024-12-310001001290ifrs-full:CorporateLoansMemberbap:StageTwoMemberbap:PortfolioOfDirectAndIndirectLoansMember2023-12-310001001290ifrs-full:CorporateLoansMemberbap:StageTwoMemberbap:PortfolioOfDirectAndIndirectLoansMember2024-01-012024-12-310001001290bap:ResidentialMortgageLoansMemberbap:StageTwoMemberbap:PortfolioOfDirectAndIndirectLoansMember2023-12-310001001290bap:ResidentialMortgageLoansMemberbap:StageTwoMemberbap:PortfolioOfDirectAndIndirectLoansMember2024-01-012024-12-310001001290bap:SmallAndMicroBusinessLoansMemberbap:StageTwoMemberbap:PortfolioOfDirectAndIndirectLoansMember2023-12-310001001290bap:SmallAndMicroBusinessLoansMemberbap:StageTwoMemberbap:PortfolioOfDirectAndIndirectLoansMember2024-01-012024-12-310001001290ifrs-full:ConsumerLoansMemberbap:StageTwoMemberbap:PortfolioOfDirectAndIndirectLoansMember2023-12-310001001290ifrs-full:ConsumerLoansMemberbap:StageTwoMemberbap:PortfolioOfDirectAndIndirectLoansMember2024-01-012024-12-310001001290bap:StageTwoMemberbap:PortfolioOfDirectAndIndirectLoansMember2023-12-310001001290bap:StageTwoMemberbap:PortfolioOfDirectAndIndirectLoansMember2024-01-012024-12-310001001290ifrs-full:CorporateLoansMemberbap:StageThreeMemberbap:PortfolioOfDirectAndIndirectLoansMember2023-12-310001001290ifrs-full:CorporateLoansMemberbap:StageThreeMemberbap:PortfolioOfDirectAndIndirectLoansMember2024-01-012024-12-310001001290bap:ResidentialMortgageLoansMemberbap:StageThreeMemberbap:PortfolioOfDirectAndIndirectLoansMember2023-12-310001001290bap:ResidentialMortgageLoansMemberbap:StageThreeMemberbap:PortfolioOfDirectAndIndirectLoansMember2024-01-012024-12-310001001290bap:SmallAndMicroBusinessLoansMemberbap:StageThreeMemberbap:PortfolioOfDirectAndIndirectLoansMember2023-12-310001001290bap:SmallAndMicroBusinessLoansMemberbap:StageThreeMemberbap:PortfolioOfDirectAndIndirectLoansMember2024-01-012024-12-310001001290ifrs-full:ConsumerLoansMemberbap:StageThreeMemberbap:PortfolioOfDirectAndIndirectLoansMember2023-12-310001001290ifrs-full:ConsumerLoansMemberbap:StageThreeMemberbap:PortfolioOfDirectAndIndirectLoansMember2024-01-012024-12-310001001290bap:StageThreeMemberbap:PortfolioOfDirectAndIndirectLoansMember2023-12-310001001290bap:StageThreeMemberbap:PortfolioOfDirectAndIndirectLoansMember2024-01-012024-12-310001001290ifrs-full:CorporateLoansMemberbap:ConsolidationOfAllStagesMemberbap:PortfolioOfDirectAndIndirectLoansMember2023-12-310001001290ifrs-full:CorporateLoansMemberbap:ConsolidationOfAllStagesMemberbap:PortfolioOfDirectAndIndirectLoansMember2024-01-012024-12-310001001290bap:ResidentialMortgageLoansMemberbap:ConsolidationOfAllStagesMemberbap:PortfolioOfDirectAndIndirectLoansMember2023-12-310001001290bap:ResidentialMortgageLoansMemberbap:ConsolidationOfAllStagesMemberbap:PortfolioOfDirectAndIndirectLoansMember2024-01-012024-12-310001001290bap:SmallAndMicroBusinessLoansMemberbap:ConsolidationOfAllStagesMemberbap:PortfolioOfDirectAndIndirectLoansMember2023-12-310001001290bap:SmallAndMicroBusinessLoansMemberbap:ConsolidationOfAllStagesMemberbap:PortfolioOfDirectAndIndirectLoansMember2024-01-012024-12-310001001290ifrs-full:ConsumerLoansMemberbap:ConsolidationOfAllStagesMemberbap:PortfolioOfDirectAndIndirectLoansMember2023-12-310001001290ifrs-full:ConsumerLoansMemberbap:ConsolidationOfAllStagesMemberbap:PortfolioOfDirectAndIndirectLoansMember2024-01-012024-12-310001001290bap:ConsolidationOfAllStagesMemberbap:PortfolioOfDirectAndIndirectLoansMember2023-12-310001001290bap:ConsolidationOfAllStagesMemberbap:PortfolioOfDirectAndIndirectLoansMember2024-01-012024-12-310001001290ifrs-full:LaterThanOneMonthAndNotLaterThanThreeMonthsMember2025-12-310001001290ifrs-full:LaterThanOneMonthAndNotLaterThanThreeMonthsMember2024-12-310001001290ifrs-full:LaterThanThreeMonthsAndNotLaterThanOneYearMember2025-12-310001001290ifrs-full:LaterThanThreeMonthsAndNotLaterThanOneYearMember2024-12-310001001290ifrs-full:LaterThanOneYearAndNotLaterThanThreeYearsMember2025-12-310001001290ifrs-full:LaterThanOneYearAndNotLaterThanThreeYearsMember2024-12-310001001290ifrs-full:LaterThanThreeYearsAndNotLaterThanFiveYearsMember2025-12-310001001290ifrs-full:LaterThanThreeYearsAndNotLaterThanFiveYearsMember2024-12-310001001290bap:LaterThanFiveYearsAndNotLaterThanFifteenYearsMember2025-12-310001001290bap:LaterThanFiveYearsAndNotLaterThanFifteenYearsMember2024-12-310001001290bap:LaterThanFifteenYearsMember2025-12-310001001290bap:LaterThanFifteenYearsMember2024-12-310001001290ifrs-full:NotLaterThanThreeMonthsMember2025-12-310001001290ifrs-full:NotLaterThanThreeMonthsMember2024-12-310001001290ifrs-full:LaterThanThreeMonthsMember2025-12-310001001290ifrs-full:LaterThanThreeMonthsMember2024-12-310001001290ifrs-full:InterestRateSwapContractMemberifrs-full:FairValueHedgesMember2025-12-310001001290ifrs-full:InterestRateSwapContractMemberifrs-full:FairValueHedgesMember2024-12-310001001290ifrs-full:ReinsuranceContractsHeldMemberbap:AssetsRemainingCoverageMember2024-12-310001001290ifrs-full:ReinsuranceContractsHeldMemberbap:IncurredClaimsAssetsContractsMeasuredByPAAPresentValueOfFutureCashFlowsMember2024-12-310001001290ifrs-full:ReinsuranceContractsHeldMember2024-12-310001001290ifrs-full:ReinsuranceContractsHeldMemberbap:AssetsRemainingCoverageMember2023-12-310001001290ifrs-full:ReinsuranceContractsHeldMemberbap:IncurredClaimsAssetsContractsMeasuredByPAAPresentValueOfFutureCashFlowsMember2023-12-310001001290ifrs-full:ReinsuranceContractsHeldMember2023-12-310001001290ifrs-full:ReinsuranceContractsHeldMemberbap:AssetsRemainingCoverageMember2025-01-012025-12-310001001290ifrs-full:ReinsuranceContractsHeldMemberbap:IncurredClaimsAssetsContractsMeasuredByPAAPresentValueOfFutureCashFlowsMember2025-01-012025-12-310001001290ifrs-full:ReinsuranceContractsHeldMember2025-01-012025-12-310001001290ifrs-full:ReinsuranceContractsHeldMemberbap:AssetsRemainingCoverageMember2024-01-012024-12-310001001290ifrs-full:ReinsuranceContractsHeldMemberbap:IncurredClaimsAssetsContractsMeasuredByPAAPresentValueOfFutureCashFlowsMember2024-01-012024-12-310001001290ifrs-full:ReinsuranceContractsHeldMember2024-01-012024-12-310001001290ifrs-full:ReinsuranceContractsHeldMemberbap:AssetsRemainingCoverageMember2025-12-310001001290ifrs-full:ReinsuranceContractsHeldMemberbap:IncurredClaimsAssetsContractsMeasuredByPAAPresentValueOfFutureCashFlowsMember2025-12-310001001290ifrs-full:ReinsuranceContractsHeldMember2025-12-310001001290ifrs-full:InsuranceContractsIssuedMemberifrs-full:NetLiabilitiesOrAssetsForRemainingCoverageExcludingLossComponentMember2024-12-310001001290ifrs-full:InsuranceContractsIssuedMemberifrs-full:LossComponentMember2024-12-310001001290ifrs-full:InsuranceContractsIssuedMemberbap:LiabilitiesForIncurredLossesForContractsNotMeasuredByPAAMember2024-12-310001001290ifrs-full:InsuranceContractsIssuedMemberbap:IncurredLossLiabilitiesContractsMeasuredByPAAPresentValueOfFulfillmentCashFlowsMember2024-12-310001001290ifrs-full:InsuranceContractsIssuedMemberbap:IncurredLossLiabilitiesContractsMeasuredByPAARiskAdjustmentMember2024-12-310001001290ifrs-full:InsuranceContractsIssuedMember2024-12-310001001290ifrs-full:InsuranceContractsIssuedMemberifrs-full:NetLiabilitiesOrAssetsForRemainingCoverageExcludingLossComponentMember2025-01-012025-12-310001001290ifrs-full:InsuranceContractsIssuedMemberifrs-full:LossComponentMember2025-01-012025-12-310001001290ifrs-full:InsuranceContractsIssuedMemberbap:LiabilitiesForIncurredLossesForContractsNotMeasuredByPAAMember2025-01-012025-12-310001001290ifrs-full:InsuranceContractsIssuedMemberbap:IncurredLossLiabilitiesContractsMeasuredByPAAPresentValueOfFulfillmentCashFlowsMember2025-01-012025-12-310001001290ifrs-full:InsuranceContractsIssuedMemberbap:IncurredLossLiabilitiesContractsMeasuredByPAARiskAdjustmentMember2025-01-012025-12-310001001290ifrs-full:InsuranceContractsIssuedMember2025-01-012025-12-310001001290ifrs-full:InsuranceContractsIssuedMemberifrs-full:NetLiabilitiesOrAssetsForRemainingCoverageExcludingLossComponentMember2025-12-310001001290ifrs-full:InsuranceContractsIssuedMemberifrs-full:LossComponentMember2025-12-310001001290ifrs-full:InsuranceContractsIssuedMemberbap:LiabilitiesForIncurredLossesForContractsNotMeasuredByPAAMember2025-12-310001001290ifrs-full:InsuranceContractsIssuedMemberbap:IncurredLossLiabilitiesContractsMeasuredByPAAPresentValueOfFulfillmentCashFlowsMember2025-12-310001001290ifrs-full:InsuranceContractsIssuedMemberbap:IncurredLossLiabilitiesContractsMeasuredByPAARiskAdjustmentMember2025-12-310001001290ifrs-full:InsuranceContractsIssuedMember2025-12-310001001290ifrs-full:InsuranceContractsIssuedMemberifrs-full:NetLiabilitiesOrAssetsForRemainingCoverageExcludingLossComponentMember2023-12-310001001290ifrs-full:InsuranceContractsIssuedMemberifrs-full:LossComponentMember2023-12-310001001290ifrs-full:InsuranceContractsIssuedMemberbap:LiabilitiesForIncurredLossesForContractsNotMeasuredByPAAMember2023-12-310001001290ifrs-full:InsuranceContractsIssuedMemberbap:IncurredLossLiabilitiesContractsMeasuredByPAAPresentValueOfFulfillmentCashFlowsMember2023-12-310001001290ifrs-full:InsuranceContractsIssuedMemberbap:IncurredLossLiabilitiesContractsMeasuredByPAARiskAdjustmentMember2023-12-310001001290ifrs-full:InsuranceContractsIssuedMember2023-12-310001001290ifrs-full:InsuranceContractsIssuedMemberifrs-full:NetLiabilitiesOrAssetsForRemainingCoverageExcludingLossComponentMember2024-01-012024-12-310001001290ifrs-full:InsuranceContractsIssuedMemberifrs-full:LossComponentMember2024-01-012024-12-310001001290ifrs-full:InsuranceContractsIssuedMemberbap:LiabilitiesForIncurredLossesForContractsNotMeasuredByPAAMember2024-01-012024-12-310001001290ifrs-full:InsuranceContractsIssuedMemberbap:IncurredLossLiabilitiesContractsMeasuredByPAAPresentValueOfFulfillmentCashFlowsMember2024-01-012024-12-310001001290ifrs-full:InsuranceContractsIssuedMemberbap:IncurredLossLiabilitiesContractsMeasuredByPAARiskAdjustmentMember2024-01-012024-12-310001001290ifrs-full:InsuranceContractsIssuedMember2024-01-012024-12-310001001290bap:EstimatesOfPresentValueOfFulfillmentCashFlowsMember2024-12-310001001290ifrs-full:RiskAdjustmentForNonfinancialRiskMember2024-12-310001001290ifrs-full:ContractualServiceMarginRelatedToContractsThatExistedAtTransitionDateToWhichModifiedRetrospectiveApproachHasBeenAppliedMember2024-12-310001001290bap:EstimatesOfPresentValueOfFulfillmentCashFlowsMember2023-12-310001001290ifrs-full:RiskAdjustmentForNonfinancialRiskMember2023-12-310001001290ifrs-full:ContractualServiceMarginRelatedToContractsThatExistedAtTransitionDateToWhichModifiedRetrospectiveApproachHasBeenAppliedMember2023-12-310001001290bap:EstimatesOfPresentValueOfFulfillmentCashFlowsMember2025-01-012025-12-310001001290ifrs-full:RiskAdjustmentForNonfinancialRiskMember2025-01-012025-12-310001001290ifrs-full:ContractualServiceMarginRelatedToContractsThatExistedAtTransitionDateToWhichModifiedRetrospectiveApproachHasBeenAppliedMember2025-01-012025-12-310001001290bap:EstimatesOfPresentValueOfFulfillmentCashFlowsMember2024-01-012024-12-310001001290ifrs-full:RiskAdjustmentForNonfinancialRiskMember2024-01-012024-12-310001001290ifrs-full:ContractualServiceMarginRelatedToContractsThatExistedAtTransitionDateToWhichModifiedRetrospectiveApproachHasBeenAppliedMember2024-01-012024-12-310001001290bap:EstimatesOfPresentValueOfFulfillmentCashFlowsMember2025-12-310001001290ifrs-full:RiskAdjustmentForNonfinancialRiskMember2025-12-310001001290ifrs-full:ContractualServiceMarginRelatedToContractsThatExistedAtTransitionDateToWhichModifiedRetrospectiveApproachHasBeenAppliedMember2025-12-310001001290bap:InsuranceContractLiabilitiesMeasuredUnderGeneralModelMember2025-12-310001001290bap:InsuranceContractLiabilitiesMeasuredUnderGeneralModelMember2024-12-310001001290bap:InsuranceContractLiabilitiesMeasuredUnderVariableFeeApproachMember2025-12-310001001290bap:InsuranceContractLiabilitiesMeasuredUnderVariableFeeApproachMember2024-12-310001001290ifrs-full:LandMemberifrs-full:GrossCarryingAmountMember2024-12-310001001290ifrs-full:BuildingsMemberifrs-full:GrossCarryingAmountMember2024-12-310001001290ifrs-full:MachineryMemberifrs-full:GrossCarryingAmountMember2024-12-310001001290ifrs-full:FixturesAndFittingsMemberifrs-full:GrossCarryingAmountMember2024-12-310001001290ifrs-full:ComputerEquipmentMemberifrs-full:GrossCarryingAmountMember2024-12-310001001290ifrs-full:VehiclesMemberifrs-full:GrossCarryingAmountMember2024-12-310001001290ifrs-full:ConstructionInProgressMemberifrs-full:GrossCarryingAmountMember2024-12-310001001290ifrs-full:GrossCarryingAmountMember2024-12-310001001290ifrs-full:GrossCarryingAmountMember2023-12-310001001290ifrs-full:GrossCarryingAmountMember2022-12-310001001290ifrs-full:LandMemberifrs-full:GrossCarryingAmountMember2025-01-012025-12-310001001290ifrs-full:BuildingsMemberifrs-full:GrossCarryingAmountMember2025-01-012025-12-310001001290ifrs-full:MachineryMemberifrs-full:GrossCarryingAmountMember2025-01-012025-12-310001001290ifrs-full:FixturesAndFittingsMemberifrs-full:GrossCarryingAmountMember2025-01-012025-12-310001001290ifrs-full:ComputerEquipmentMemberifrs-full:GrossCarryingAmountMember2025-01-012025-12-310001001290ifrs-full:VehiclesMemberifrs-full:GrossCarryingAmountMember2025-01-012025-12-310001001290ifrs-full:ConstructionInProgressMemberifrs-full:GrossCarryingAmountMember2025-01-012025-12-310001001290ifrs-full:GrossCarryingAmountMember2025-01-012025-12-310001001290ifrs-full:GrossCarryingAmountMember2024-01-012024-12-310001001290ifrs-full:GrossCarryingAmountMember2023-01-012023-12-310001001290ifrs-full:LandMemberifrs-full:GrossCarryingAmountMember2025-12-310001001290ifrs-full:BuildingsMemberifrs-full:GrossCarryingAmountMember2025-12-310001001290ifrs-full:MachineryMemberifrs-full:GrossCarryingAmountMember2025-12-310001001290ifrs-full:FixturesAndFittingsMemberifrs-full:GrossCarryingAmountMember2025-12-310001001290ifrs-full:ComputerEquipmentMemberifrs-full:GrossCarryingAmountMember2025-12-310001001290ifrs-full:VehiclesMemberifrs-full:GrossCarryingAmountMember2025-12-310001001290ifrs-full:ConstructionInProgressMemberifrs-full:GrossCarryingAmountMember2025-12-310001001290ifrs-full:GrossCarryingAmountMember2025-12-310001001290ifrs-full:LandMemberbap:AccumulatedDepreciationMember2024-12-310001001290ifrs-full:BuildingsMemberbap:AccumulatedDepreciationMember2024-12-310001001290ifrs-full:MachineryMemberbap:AccumulatedDepreciationMember2024-12-310001001290ifrs-full:FixturesAndFittingsMemberbap:AccumulatedDepreciationMember2024-12-310001001290ifrs-full:ComputerEquipmentMemberbap:AccumulatedDepreciationMember2024-12-310001001290ifrs-full:VehiclesMemberbap:AccumulatedDepreciationMember2024-12-310001001290ifrs-full:ConstructionInProgressMemberbap:AccumulatedDepreciationMember2024-12-310001001290bap:AccumulatedDepreciationMember2024-12-310001001290bap:AccumulatedDepreciationMember2023-12-310001001290bap:AccumulatedDepreciationMember2022-12-310001001290ifrs-full:LandMemberbap:AccumulatedDepreciationMember2025-01-012025-12-310001001290ifrs-full:BuildingsMemberbap:AccumulatedDepreciationMember2025-01-012025-12-310001001290ifrs-full:MachineryMemberbap:AccumulatedDepreciationMember2025-01-012025-12-310001001290ifrs-full:FixturesAndFittingsMemberbap:AccumulatedDepreciationMember2025-01-012025-12-310001001290ifrs-full:ComputerEquipmentMemberbap:AccumulatedDepreciationMember2025-01-012025-12-310001001290ifrs-full:VehiclesMemberbap:AccumulatedDepreciationMember2025-01-012025-12-310001001290ifrs-full:ConstructionInProgressMemberbap:AccumulatedDepreciationMember2025-01-012025-12-310001001290bap:AccumulatedDepreciationMember2025-01-012025-12-310001001290bap:AccumulatedDepreciationMember2024-01-012024-12-310001001290bap:AccumulatedDepreciationMember2023-01-012023-12-310001001290ifrs-full:LandMemberbap:AccumulatedDepreciationMember2025-12-310001001290ifrs-full:BuildingsMemberbap:AccumulatedDepreciationMember2025-12-310001001290ifrs-full:MachineryMemberbap:AccumulatedDepreciationMember2025-12-310001001290ifrs-full:FixturesAndFittingsMemberbap:AccumulatedDepreciationMember2025-12-310001001290ifrs-full:ComputerEquipmentMemberbap:AccumulatedDepreciationMember2025-12-310001001290ifrs-full:VehiclesMemberbap:AccumulatedDepreciationMember2025-12-310001001290ifrs-full:ConstructionInProgressMemberbap:AccumulatedDepreciationMember2025-12-310001001290bap:AccumulatedDepreciationMember2025-12-310001001290ifrs-full:LandMember2025-12-310001001290ifrs-full:BuildingsMember2025-12-310001001290ifrs-full:MachineryMember2025-12-310001001290ifrs-full:FixturesAndFittingsMember2025-12-310001001290ifrs-full:ComputerEquipmentMember2025-12-310001001290ifrs-full:VehiclesMember2025-12-310001001290ifrs-full:ConstructionInProgressMember2025-12-310001001290bap:ForeclosedPropertiesMemberifrs-full:GrossCarryingAmountMember2025-01-012025-12-310001001290ifrs-full:GrossCarryingAmountMemberifrs-full:CustomerrelatedIntangibleAssetsMember2024-12-310001001290ifrs-full:GrossCarryingAmountMemberifrs-full:BrandNamesMember2024-12-310001001290ifrs-full:GrossCarryingAmountMemberbap:FundManagerContractMember2024-12-310001001290ifrs-full:GrossCarryingAmountMemberbap:RelationshipsWithHoldersMember2024-12-310001001290ifrs-full:GrossCarryingAmountMemberifrs-full:ComputerSoftwareMember2024-12-310001001290ifrs-full:GrossCarryingAmountMemberifrs-full:IntangibleAssetsUnderDevelopmentMember2024-12-310001001290ifrs-full:GrossCarryingAmountMemberifrs-full:CustomerrelatedIntangibleAssetsMember2025-01-012025-12-310001001290ifrs-full:GrossCarryingAmountMemberifrs-full:BrandNamesMember2025-01-012025-12-310001001290ifrs-full:GrossCarryingAmountMemberbap:FundManagerContractMember2025-01-012025-12-310001001290ifrs-full:GrossCarryingAmountMemberbap:RelationshipsWithHoldersMember2025-01-012025-12-310001001290ifrs-full:GrossCarryingAmountMemberifrs-full:ComputerSoftwareMember2025-01-012025-12-310001001290ifrs-full:GrossCarryingAmountMemberifrs-full:IntangibleAssetsUnderDevelopmentMember2025-01-012025-12-310001001290ifrs-full:GrossCarryingAmountMemberifrs-full:CustomerrelatedIntangibleAssetsMember2025-12-310001001290ifrs-full:GrossCarryingAmountMemberifrs-full:BrandNamesMember2025-12-310001001290ifrs-full:GrossCarryingAmountMemberbap:FundManagerContractMember2025-12-310001001290ifrs-full:GrossCarryingAmountMemberbap:RelationshipsWithHoldersMember2025-12-310001001290ifrs-full:GrossCarryingAmountMemberifrs-full:ComputerSoftwareMember2025-12-310001001290ifrs-full:GrossCarryingAmountMemberifrs-full:IntangibleAssetsUnderDevelopmentMember2025-12-310001001290bap:AccumulatedAmortisationMemberifrs-full:CustomerrelatedIntangibleAssetsMember2024-12-310001001290bap:AccumulatedAmortisationMemberifrs-full:BrandNamesMember2024-12-310001001290bap:AccumulatedAmortisationMemberbap:FundManagerContractMember2024-12-310001001290bap:AccumulatedAmortisationMemberbap:RelationshipsWithHoldersMember2024-12-310001001290bap:AccumulatedAmortisationMemberifrs-full:ComputerSoftwareMember2024-12-310001001290bap:AccumulatedAmortisationMemberifrs-full:IntangibleAssetsUnderDevelopmentMember2024-12-310001001290bap:AccumulatedAmortisationMember2024-12-310001001290bap:AccumulatedAmortisationMember2023-12-310001001290bap:AccumulatedAmortisationMember2022-12-310001001290bap:AccumulatedAmortisationMemberifrs-full:CustomerrelatedIntangibleAssetsMember2025-01-012025-12-310001001290bap:AccumulatedAmortisationMemberifrs-full:BrandNamesMember2025-01-012025-12-310001001290bap:AccumulatedAmortisationMemberbap:FundManagerContractMember2025-01-012025-12-310001001290bap:AccumulatedAmortisationMemberbap:RelationshipsWithHoldersMember2025-01-012025-12-310001001290bap:AccumulatedAmortisationMemberifrs-full:ComputerSoftwareMember2025-01-012025-12-310001001290bap:AccumulatedAmortisationMemberifrs-full:IntangibleAssetsUnderDevelopmentMember2025-01-012025-12-310001001290bap:AccumulatedAmortisationMember2025-01-012025-12-310001001290bap:AccumulatedAmortisationMember2024-01-012024-12-310001001290bap:AccumulatedAmortisationMember2023-01-012023-12-310001001290bap:AccumulatedAmortisationMemberifrs-full:CustomerrelatedIntangibleAssetsMember2025-12-310001001290bap:AccumulatedAmortisationMemberifrs-full:BrandNamesMember2025-12-310001001290bap:AccumulatedAmortisationMemberbap:FundManagerContractMember2025-12-310001001290bap:AccumulatedAmortisationMemberbap:RelationshipsWithHoldersMember2025-12-310001001290bap:AccumulatedAmortisationMemberifrs-full:ComputerSoftwareMember2025-12-310001001290bap:AccumulatedAmortisationMemberifrs-full:IntangibleAssetsUnderDevelopmentMember2025-12-310001001290bap:AccumulatedAmortisationMember2025-12-310001001290ifrs-full:CustomerrelatedIntangibleAssetsMember2025-12-310001001290ifrs-full:BrandNamesMember2025-12-310001001290bap:FundManagerContractMember2025-12-310001001290bap:RelationshipsWithHoldersMember2025-12-310001001290ifrs-full:ComputerSoftwareMember2025-12-310001001290ifrs-full:IntangibleAssetsUnderDevelopmentMember2025-12-310001001290ifrs-full:IncreaseDecreaseDueToChangesInAccountingPolicyRequiredByIFRSsCumulativeEffectAtDateOfInitialApplicationMemberifrs-full:InsuranceContractsIssuedMember2025-01-012025-12-310001001290ifrs-full:IncreaseDecreaseDueToChangesInAccountingPolicyRequiredByIFRSsCumulativeEffectAtDateOfInitialApplicationMemberifrs-full:ReinsuranceContractsHeldMember2025-01-012025-12-310001001290ifrs-full:IncreaseDecreaseDueToChangesInAccountingPolicyRequiredByIFRSsCumulativeEffectAtDateOfInitialApplicationMemberifrs-full:InsuranceContractsIssuedMember2024-01-012024-12-310001001290ifrs-full:IncreaseDecreaseDueToChangesInAccountingPolicyRequiredByIFRSsCumulativeEffectAtDateOfInitialApplicationMemberifrs-full:ReinsuranceContractsHeldMember2024-01-012024-12-310001001290ifrs-full:IncreaseDecreaseDueToChangesInAccountingPolicyRequiredByIFRSsCumulativeEffectAtDateOfInitialApplicationMemberifrs-full:InsuranceContractsIssuedMember2023-01-012023-12-310001001290ifrs-full:IncreaseDecreaseDueToChangesInAccountingPolicyRequiredByIFRSsCumulativeEffectAtDateOfInitialApplicationMemberifrs-full:ReinsuranceContractsHeldMember2023-01-012023-12-310001001290bap:PacificoS.A.EntidadPrestadoraDeSaludMemberifrs-full:CustomerrelatedIntangibleAssetsMember2025-12-310001001290bap:PacificoS.A.EntidadPrestadoraDeSaludMemberifrs-full:CustomerrelatedIntangibleAssetsMember2024-12-310001001290bap:LaboratoriosROES.AMemberifrs-full:CustomerrelatedIntangibleAssetsMember2025-12-310001001290bap:LaboratoriosROES.AMemberifrs-full:CustomerrelatedIntangibleAssetsMember2024-12-310001001290bap:ClinicaSanFelipeS.A.Memberifrs-full:CustomerrelatedIntangibleAssetsMember2025-12-310001001290bap:ClinicaSanFelipeS.A.Memberifrs-full:CustomerrelatedIntangibleAssetsMember2024-12-310001001290bap:CentroMedicoOdontologicoAmericanoS.A.CMemberifrs-full:CustomerrelatedIntangibleAssetsMember2025-12-310001001290bap:CentroMedicoOdontologicoAmericanoS.A.CMemberifrs-full:CustomerrelatedIntangibleAssetsMember2024-12-310001001290bap:ClinicaSanchezFerrerS.AMemberifrs-full:CustomerrelatedIntangibleAssetsMember2025-12-310001001290bap:ClinicaSanchezFerrerS.AMemberifrs-full:CustomerrelatedIntangibleAssetsMember2024-12-310001001290bap:OncocareS.A.CMemberifrs-full:CustomerrelatedIntangibleAssetsMember2025-12-310001001290bap:OncocareS.A.CMemberifrs-full:CustomerrelatedIntangibleAssetsMember2024-12-310001001290bap:LaEsperanzaDelPeruS.AMemberifrs-full:CustomerrelatedIntangibleAssetsMember2025-12-310001001290bap:LaEsperanzaDelPeruS.AMemberifrs-full:CustomerrelatedIntangibleAssetsMember2024-12-310001001290bap:ClinicaBelenMemberifrs-full:CustomerrelatedIntangibleAssetsMember2025-12-310001001290bap:ClinicaBelenMemberifrs-full:CustomerrelatedIntangibleAssetsMember2024-12-310001001290bap:ClinicaDelSurMemberifrs-full:CustomerrelatedIntangibleAssetsMember2025-12-310001001290bap:ClinicaDelSurMemberifrs-full:CustomerrelatedIntangibleAssetsMember2024-12-310001001290bap:CredicorpCapitalHoldingChileInversionesIMTMemberifrs-full:CustomerrelatedIntangibleAssetsMember2025-12-310001001290bap:CredicorpCapitalHoldingChileInversionesIMTMemberifrs-full:CustomerrelatedIntangibleAssetsMember2024-12-310001001290bap:ProsemedicS.A.CMemberifrs-full:CustomerrelatedIntangibleAssetsMember2025-12-310001001290bap:ProsemedicS.A.CMemberifrs-full:CustomerrelatedIntangibleAssetsMember2024-12-310001001290bap:PrimaAFPAFPUnionVidaMemberifrs-full:CustomerrelatedIntangibleAssetsMember2025-12-310001001290bap:PrimaAFPAFPUnionVidaMemberifrs-full:CustomerrelatedIntangibleAssetsMember2024-12-310001001290bap:ClinicaElGolfMemberifrs-full:CustomerrelatedIntangibleAssetsMember2025-12-310001001290bap:ClinicaElGolfMemberifrs-full:CustomerrelatedIntangibleAssetsMember2024-12-310001001290bap:UltraserfincoS.AMemberifrs-full:CustomerrelatedIntangibleAssetsMember2025-12-310001001290bap:UltraserfincoS.AMemberifrs-full:CustomerrelatedIntangibleAssetsMember2024-12-310001001290bap:TenpoBankMemberifrs-full:CustomerrelatedIntangibleAssetsMember2025-12-310001001290bap:TenpoBankMemberifrs-full:CustomerrelatedIntangibleAssetsMember2024-12-310001001290bap:DoctorS.A.CMemberifrs-full:CustomerrelatedIntangibleAssetsMember2025-12-310001001290bap:DoctorS.A.CMemberifrs-full:CustomerrelatedIntangibleAssetsMember2024-12-310001001290bap:CompaniaIncubadoraDeSolucionesMovilesS.ACulqiMemberifrs-full:CustomerrelatedIntangibleAssetsMember2025-12-310001001290bap:CompaniaIncubadoraDeSolucionesMovilesS.ACulqiMemberifrs-full:CustomerrelatedIntangibleAssetsMember2024-12-310001001290bap:TenpoSpaMemberifrs-full:CustomerrelatedIntangibleAssetsMember2025-12-310001001290bap:TenpoSpaMemberifrs-full:CustomerrelatedIntangibleAssetsMember2024-12-310001001290bap:JoinnusSACMemberifrs-full:CustomerrelatedIntangibleAssetsMember2025-12-310001001290bap:JoinnusSACMemberifrs-full:CustomerrelatedIntangibleAssetsMember2024-12-310001001290ifrs-full:CustomerrelatedIntangibleAssetsMember2024-12-310001001290bap:ROEMemberifrs-full:BrandNamesMember2025-12-310001001290bap:ROEMemberifrs-full:BrandNamesMember2024-12-310001001290bap:MibancoMemberifrs-full:BrandNamesMember2025-12-310001001290bap:MibancoMemberifrs-full:BrandNamesMember2024-12-310001001290bap:ClinicaSanFelipeS.A.Memberifrs-full:BrandNamesMember2025-12-310001001290bap:ClinicaSanFelipeS.A.Memberifrs-full:BrandNamesMember2024-12-310001001290bap:ClinicaSanBorjaMemberifrs-full:BrandNamesMember2025-12-310001001290bap:ClinicaSanBorjaMemberifrs-full:BrandNamesMember2024-12-310001001290bap:SannaMemberifrs-full:BrandNamesMember2025-12-310001001290bap:SannaMemberifrs-full:BrandNamesMember2024-12-310001001290bap:ClinicaElGolfMemberifrs-full:BrandNamesMember2025-12-310001001290bap:ClinicaElGolfMemberifrs-full:BrandNamesMember2024-12-310001001290bap:DoctorMasMemberifrs-full:BrandNamesMember2025-12-310001001290bap:DoctorMasMemberifrs-full:BrandNamesMember2024-12-310001001290bap:ACMLMemberifrs-full:BrandNamesMember2025-12-310001001290bap:ACMLMemberifrs-full:BrandNamesMember2024-12-310001001290bap:AliadaMemberifrs-full:BrandNamesMember2025-12-310001001290bap:AliadaMemberifrs-full:BrandNamesMember2024-12-310001001290bap:ClinicaBelenMemberifrs-full:BrandNamesMember2025-12-310001001290bap:ClinicaBelenMemberifrs-full:BrandNamesMember2024-12-310001001290bap:COAMemberifrs-full:BrandNamesMember2025-12-310001001290bap:COAMemberifrs-full:BrandNamesMember2024-12-310001001290bap:ClinicaSanchezFerrerS.AMemberifrs-full:BrandNamesMember2025-12-310001001290bap:ClinicaSanchezFerrerS.AMemberifrs-full:BrandNamesMember2024-12-310001001290bap:ClinicaDelSurMemberifrs-full:BrandNamesMember2025-12-310001001290bap:ClinicaDelSurMemberifrs-full:BrandNamesMember2024-12-310001001290bap:PMDMemberifrs-full:BrandNamesMember2025-12-310001001290bap:PMDMemberifrs-full:BrandNamesMember2024-12-310001001290bap:JoinnusSACMemberifrs-full:BrandNamesMember2025-12-310001001290bap:JoinnusSACMemberifrs-full:BrandNamesMember2024-12-310001001290bap:CulqiMemberifrs-full:BrandNamesMember2025-12-310001001290bap:CulqiMemberifrs-full:BrandNamesMember2024-12-310001001290ifrs-full:BrandNamesMember2024-12-310001001290bap:CredicorpCapitalColombiaSAMemberbap:FundManagerContractMember2025-12-310001001290bap:CredicorpCapitalColombiaSAMemberbap:FundManagerContractMember2024-12-310001001290bap:CredicorpCapitalHoldingChileInversionesIMTMemberbap:FundManagerContractMember2025-12-310001001290bap:CredicorpCapitalHoldingChileInversionesIMTMemberbap:FundManagerContractMember2024-12-310001001290bap:UltrasefincoS.A.Memberbap:FundManagerContractMember2025-12-310001001290bap:UltrasefincoS.A.Memberbap:FundManagerContractMember2024-12-310001001290bap:FundManagerContractMember2024-12-310001001290bap:PacificoEPSAndMedicalServicesMember2025-12-310001001290bap:PacificoEPSAndMedicalServicesMember2024-12-310001001290bap:MibancoEdyficarPeruMember2025-12-310001001290bap:MibancoEdyficarPeruMember2024-12-310001001290bap:PrimaAFPAFPUnionVidaMember2025-12-310001001290bap:PrimaAFPAFPUnionVidaMember2024-12-310001001290bap:BancoDeCreditoDelPeruMember2025-12-310001001290bap:BancoDeCreditoDelPeruMember2024-12-310001001290bap:MibancoColombiaBancoCompartirS.aMember2025-12-310001001290bap:MibancoColombiaBancoCompartirS.aMember2024-12-310001001290bap:PacificoSegurosMember2025-12-310001001290bap:PacificoSegurosMember2024-12-310001001290bap:AtlanticSecurityHoldingCorporationMember2025-12-310001001290bap:AtlanticSecurityHoldingCorporationMember2024-12-310001001290bap:MonokeraSASMember2025-12-310001001290bap:MonokeraSASMember2024-12-310001001290bap:TenpoSpaMember2025-12-310001001290bap:TenpoSpaMember2024-12-310001001290bap:TenpoTechnologieSpAMember2025-12-310001001290bap:TenpoTechnologieSpAMember2024-12-310001001290bap:JoinnusSACMember2025-12-310001001290bap:JoinnusSACMember2024-12-310001001290bap:CrediseguroSegurosPersonalesMember2025-12-310001001290bap:CrediseguroSegurosPersonalesMember2024-12-310001001290bap:JoinnusSACMember2024-01-012024-12-310001001290bap:WallyPOSSACMember2024-01-012024-12-310001001290bap:SamiShopSACMember2024-01-012024-12-310001001290bap:CompaniaIncubadoraDeSolucionesMovilesSACulqiMember2024-01-012024-12-310001001290bap:MibancoEdyficarPeruMember2025-12-310001001290bap:PrimaAFPAFPUnionVidaMember2025-12-310001001290bap:MibancoColombiaBancoCompartirS.aMember2025-12-310001001290bap:CredicorpCapitalColombiaSAMember2025-12-310001001290bap:BancoDeCreditoDelPeruMember2025-12-310001001290bap:PacificoSegurosMember2025-12-310001001290bap:PacificoSegurosMemberifrs-full:BottomOfRangeMember2025-12-310001001290bap:PacificoSegurosMemberifrs-full:TopOfRangeMember2025-12-310001001290bap:AtlanticSecurityHoldingCorporationMember2025-12-310001001290bap:MonokeraSASMember2025-12-310001001290bap:TenpoSpaMember2025-12-310001001290bap:JoinnusSACMember2025-12-310001001290bap:MibancoEdyficarPeruMember2024-12-310001001290bap:PrimaAFPAFPUnionVidaMember2024-12-310001001290bap:MibancoColombiaBancoCompartirS.aMember2024-12-310001001290bap:CredicorpCapitalColombiaSAMember2024-12-310001001290bap:BancoDeCreditoDelPeruMember2024-12-310001001290bap:PacificoSegurosMember2024-12-310001001290bap:PacificoSegurosMemberifrs-full:BottomOfRangeMember2024-12-310001001290bap:PacificoSegurosMemberifrs-full:TopOfRangeMember2024-12-310001001290bap:AtlanticSecurityHoldingCorporationMember2024-12-310001001290bap:MonokeraSASMember2024-12-310001001290bap:TenpoSpaMember2024-12-310001001290bap:JoinnusSACMember2024-12-310001001290bap:CompaniaIncubadoraDeSolucionesMovilesS.aMember2024-12-310001001290bap:WallyPOSSACMember2024-12-310001001290bap:SamiShopSACMember2024-12-310001001290ifrs-full:GrossCarryingAmountMemberbap:PropertyAgenciesAndOfficesMember2024-12-310001001290ifrs-full:GrossCarryingAmountMemberbap:ServersAndTechnologyPlatformsMember2024-12-310001001290ifrs-full:GrossCarryingAmountMemberbap:TransportUnitsMember2024-12-310001001290ifrs-full:GrossCarryingAmountMemberbap:OtherLeasesMember2024-12-310001001290ifrs-full:GrossCarryingAmountMemberbap:PropertyAgenciesAndOfficesMember2025-01-012025-12-310001001290ifrs-full:GrossCarryingAmountMemberbap:ServersAndTechnologyPlatformsMember2025-01-012025-12-310001001290ifrs-full:GrossCarryingAmountMemberbap:TransportUnitsMember2025-01-012025-12-310001001290ifrs-full:GrossCarryingAmountMemberbap:OtherLeasesMember2025-01-012025-12-310001001290ifrs-full:GrossCarryingAmountMemberbap:PropertyAgenciesAndOfficesMember2025-12-310001001290ifrs-full:GrossCarryingAmountMemberbap:ServersAndTechnologyPlatformsMember2025-12-310001001290ifrs-full:GrossCarryingAmountMemberbap:TransportUnitsMember2025-12-310001001290ifrs-full:GrossCarryingAmountMemberbap:OtherLeasesMember2025-12-310001001290bap:AccumulatedDepreciationMemberbap:PropertyAgenciesAndOfficesMember2024-12-310001001290bap:AccumulatedDepreciationMemberbap:ServersAndTechnologyPlatformsMember2024-12-310001001290bap:AccumulatedDepreciationMemberbap:TransportUnitsMember2024-12-310001001290bap:AccumulatedDepreciationMemberbap:OtherLeasesMember2024-12-310001001290bap:AccumulatedDepreciationMemberbap:PropertyAgenciesAndOfficesMember2025-01-012025-12-310001001290bap:AccumulatedDepreciationMemberbap:ServersAndTechnologyPlatformsMember2025-01-012025-12-310001001290bap:AccumulatedDepreciationMemberbap:TransportUnitsMember2025-01-012025-12-310001001290bap:AccumulatedDepreciationMemberbap:OtherLeasesMember2025-01-012025-12-310001001290bap:AccumulatedDepreciationMemberbap:PropertyAgenciesAndOfficesMember2025-12-310001001290bap:AccumulatedDepreciationMemberbap:ServersAndTechnologyPlatformsMember2025-12-310001001290bap:AccumulatedDepreciationMemberbap:TransportUnitsMember2025-12-310001001290bap:AccumulatedDepreciationMemberbap:OtherLeasesMember2025-12-310001001290bap:PropertyAgenciesAndOfficesMember2025-12-310001001290bap:ServersAndTechnologyPlatformsMember2025-12-310001001290bap:TransportUnitsMember2025-12-310001001290bap:OtherLeasesMember2025-12-310001001290bap:PacificoEPSAndMedicalServicesMember2025-01-012025-12-310001001290bap:DerivativesHeldForTradingMemberifrs-full:ForwardContractMember2025-12-310001001290bap:DerivativesHeldForTradingMemberifrs-full:ForwardContractMember2024-12-310001001290bap:DerivativesHeldForTradingMemberifrs-full:InterestRateSwapContractMember2025-12-310001001290bap:DerivativesHeldForTradingMemberifrs-full:InterestRateSwapContractMember2024-12-310001001290bap:DerivativesHeldForTradingMemberifrs-full:CurrencySwapContractMember2025-12-310001001290bap:DerivativesHeldForTradingMemberifrs-full:CurrencySwapContractMember2024-12-310001001290bap:DerivativesHeldForTradingMemberifrs-full:OptionContractMember2025-12-310001001290bap:DerivativesHeldForTradingMemberifrs-full:OptionContractMember2024-12-310001001290bap:DerivativesHeldForTradingMemberifrs-full:FuturesContractMember2025-12-310001001290bap:DerivativesHeldForTradingMemberifrs-full:FuturesContractMember2024-12-310001001290bap:DerivativesHeldForTradingMember2025-12-310001001290bap:DerivativesHeldForTradingMember2024-12-310001001290bap:DerivativesHeldAsHedgesMemberifrs-full:InterestRateSwapContractMemberifrs-full:CashFlowHedgesMember2025-12-310001001290bap:DerivativesHeldAsHedgesMemberifrs-full:InterestRateSwapContractMemberifrs-full:CashFlowHedgesMember2024-12-310001001290bap:DerivativesHeldAsHedgesMemberbap:CrossCurrencySwapContractMemberifrs-full:CashFlowHedgesMember2025-12-310001001290bap:DerivativesHeldAsHedgesMemberbap:CrossCurrencySwapContractMemberifrs-full:CashFlowHedgesMember2024-12-310001001290bap:DerivativesHeldAsHedgesMemberbap:CrossCurrencySwapContractOneMemberifrs-full:CashFlowHedgesMember2025-12-310001001290bap:DerivativesHeldAsHedgesMemberbap:CrossCurrencySwapContractOneMemberifrs-full:CashFlowHedgesMember2024-12-310001001290bap:DerivativesHeldAsHedgesMemberbap:CrossCurrencySwapContractTwoMemberifrs-full:CashFlowHedgesMember2025-12-310001001290bap:DerivativesHeldAsHedgesMemberbap:CrossCurrencySwapContractTwoMemberifrs-full:CashFlowHedgesMember2024-12-310001001290bap:DerivativesHeldAsHedgesMemberbap:CrossCurrencySwapContractThreeMemberifrs-full:CashFlowHedgesMember2025-12-310001001290bap:DerivativesHeldAsHedgesMemberbap:CrossCurrencySwapContractThreeMemberifrs-full:CashFlowHedgesMember2024-12-310001001290bap:DerivativesHeldAsHedgesMemberifrs-full:InterestRateSwapContractMemberifrs-full:FairValueHedgesMember2025-12-310001001290bap:DerivativesHeldAsHedgesMemberifrs-full:InterestRateSwapContractMemberifrs-full:FairValueHedgesMember2024-12-310001001290bap:DerivativesHeldAsHedgesMemberifrs-full:ForwardContractMemberifrs-full:FairValueHedgesMember2025-12-310001001290bap:DerivativesHeldAsHedgesMemberifrs-full:ForwardContractMemberifrs-full:FairValueHedgesMember2024-12-310001001290bap:DerivativesHeldAsHedgesMemberbap:ForwardContractOneMemberifrs-full:FairValueHedgesMember2025-12-310001001290bap:DerivativesHeldAsHedgesMemberbap:ForwardContractOneMemberifrs-full:FairValueHedgesMember2024-12-310001001290bap:DerivativesHeldAsHedgesMemberifrs-full:FairValueHedgesMember2025-12-310001001290bap:DerivativesHeldAsHedgesMemberifrs-full:FairValueHedgesMember2024-12-310001001290bap:DerivativesHeldAsHedgesMember2025-12-310001001290bap:DerivativesHeldAsHedgesMember2024-12-310001001290bap:CrossCurrencySwapContractTwoMemberifrs-full:CashFlowHedgesMember2024-12-310001001290bap:DerivativesHeldAsHedgesMemberbap:CrossCurrencySwapContractTwoMember2024-12-310001001290ifrs-full:CashFlowHedgesMember2024-12-310001001290ifrs-full:ForwardContractMemberifrs-full:NotLaterThanThreeMonthsMember2025-12-310001001290ifrs-full:ForwardContractMemberifrs-full:LaterThanThreeMonthsAndNotLaterThanOneYearMember2025-12-310001001290ifrs-full:ForwardContractMemberifrs-full:LaterThanOneYearAndNotLaterThanThreeYearsMember2025-12-310001001290ifrs-full:ForwardContractMemberifrs-full:LaterThanThreeYearsAndNotLaterThanFiveYearsMember2025-12-310001001290ifrs-full:ForwardContractMemberifrs-full:LaterThanFiveYearsMember2025-12-310001001290ifrs-full:ForwardContractMember2025-12-310001001290ifrs-full:ForwardContractMemberifrs-full:NotLaterThanThreeMonthsMember2024-12-310001001290ifrs-full:ForwardContractMemberifrs-full:LaterThanThreeMonthsAndNotLaterThanOneYearMember2024-12-310001001290ifrs-full:ForwardContractMemberifrs-full:LaterThanOneYearAndNotLaterThanThreeYearsMember2024-12-310001001290ifrs-full:ForwardContractMemberifrs-full:LaterThanThreeYearsAndNotLaterThanFiveYearsMember2024-12-310001001290ifrs-full:ForwardContractMemberifrs-full:LaterThanFiveYearsMember2024-12-310001001290ifrs-full:ForwardContractMember2024-12-310001001290ifrs-full:InterestRateSwapContractMemberifrs-full:NotLaterThanThreeMonthsMember2025-12-310001001290ifrs-full:InterestRateSwapContractMemberifrs-full:LaterThanThreeMonthsAndNotLaterThanOneYearMember2025-12-310001001290ifrs-full:InterestRateSwapContractMemberifrs-full:LaterThanOneYearAndNotLaterThanThreeYearsMember2025-12-310001001290ifrs-full:InterestRateSwapContractMemberifrs-full:LaterThanThreeYearsAndNotLaterThanFiveYearsMember2025-12-310001001290ifrs-full:InterestRateSwapContractMemberifrs-full:LaterThanFiveYearsMember2025-12-310001001290ifrs-full:InterestRateSwapContractMember2025-12-310001001290ifrs-full:InterestRateSwapContractMemberifrs-full:NotLaterThanThreeMonthsMember2024-12-310001001290ifrs-full:InterestRateSwapContractMemberifrs-full:LaterThanThreeMonthsAndNotLaterThanOneYearMember2024-12-310001001290ifrs-full:InterestRateSwapContractMemberifrs-full:LaterThanOneYearAndNotLaterThanThreeYearsMember2024-12-310001001290ifrs-full:InterestRateSwapContractMemberifrs-full:LaterThanThreeYearsAndNotLaterThanFiveYearsMember2024-12-310001001290ifrs-full:InterestRateSwapContractMemberifrs-full:LaterThanFiveYearsMember2024-12-310001001290ifrs-full:InterestRateSwapContractMember2024-12-310001001290ifrs-full:CurrencySwapContractMemberifrs-full:NotLaterThanThreeMonthsMember2025-12-310001001290ifrs-full:CurrencySwapContractMemberifrs-full:LaterThanThreeMonthsAndNotLaterThanOneYearMember2025-12-310001001290ifrs-full:CurrencySwapContractMemberifrs-full:LaterThanOneYearAndNotLaterThanThreeYearsMember2025-12-310001001290ifrs-full:CurrencySwapContractMemberifrs-full:LaterThanThreeYearsAndNotLaterThanFiveYearsMember2025-12-310001001290ifrs-full:CurrencySwapContractMemberifrs-full:LaterThanFiveYearsMember2025-12-310001001290ifrs-full:CurrencySwapContractMember2025-12-310001001290ifrs-full:CurrencySwapContractMemberifrs-full:NotLaterThanThreeMonthsMember2024-12-310001001290ifrs-full:CurrencySwapContractMemberifrs-full:LaterThanThreeMonthsAndNotLaterThanOneYearMember2024-12-310001001290ifrs-full:CurrencySwapContractMemberifrs-full:LaterThanOneYearAndNotLaterThanThreeYearsMember2024-12-310001001290ifrs-full:CurrencySwapContractMemberifrs-full:LaterThanThreeYearsAndNotLaterThanFiveYearsMember2024-12-310001001290ifrs-full:CurrencySwapContractMemberifrs-full:LaterThanFiveYearsMember2024-12-310001001290ifrs-full:CurrencySwapContractMember2024-12-310001001290ifrs-full:OptionContractMemberifrs-full:NotLaterThanThreeMonthsMember2025-12-310001001290ifrs-full:OptionContractMemberifrs-full:LaterThanThreeMonthsAndNotLaterThanOneYearMember2025-12-310001001290ifrs-full:OptionContractMemberifrs-full:LaterThanOneYearAndNotLaterThanThreeYearsMember2025-12-310001001290ifrs-full:OptionContractMemberifrs-full:LaterThanThreeYearsAndNotLaterThanFiveYearsMember2025-12-310001001290ifrs-full:OptionContractMemberifrs-full:LaterThanFiveYearsMember2025-12-310001001290ifrs-full:OptionContractMember2025-12-310001001290ifrs-full:OptionContractMemberifrs-full:NotLaterThanThreeMonthsMember2024-12-310001001290ifrs-full:OptionContractMemberifrs-full:LaterThanThreeMonthsAndNotLaterThanOneYearMember2024-12-310001001290ifrs-full:OptionContractMemberifrs-full:LaterThanOneYearAndNotLaterThanThreeYearsMember2024-12-310001001290ifrs-full:OptionContractMemberifrs-full:LaterThanThreeYearsAndNotLaterThanFiveYearsMember2024-12-310001001290ifrs-full:OptionContractMemberifrs-full:LaterThanFiveYearsMember2024-12-310001001290ifrs-full:OptionContractMember2024-12-310001001290ifrs-full:FuturesContractMemberifrs-full:NotLaterThanThreeMonthsMember2025-12-310001001290ifrs-full:FuturesContractMemberifrs-full:LaterThanThreeMonthsAndNotLaterThanOneYearMember2025-12-310001001290ifrs-full:FuturesContractMemberifrs-full:LaterThanOneYearAndNotLaterThanThreeYearsMember2025-12-310001001290ifrs-full:FuturesContractMemberifrs-full:LaterThanThreeYearsAndNotLaterThanFiveYearsMember2025-12-310001001290ifrs-full:FuturesContractMemberifrs-full:LaterThanFiveYearsMember2025-12-310001001290ifrs-full:FuturesContractMember2025-12-310001001290ifrs-full:FuturesContractMemberifrs-full:NotLaterThanThreeMonthsMember2024-12-310001001290ifrs-full:FuturesContractMemberifrs-full:LaterThanThreeMonthsAndNotLaterThanOneYearMember2024-12-310001001290ifrs-full:FuturesContractMemberifrs-full:LaterThanOneYearAndNotLaterThanThreeYearsMember2024-12-310001001290ifrs-full:FuturesContractMemberifrs-full:LaterThanThreeYearsAndNotLaterThanFiveYearsMember2024-12-310001001290ifrs-full:FuturesContractMemberifrs-full:LaterThanFiveYearsMember2024-12-310001001290ifrs-full:FuturesContractMember2024-12-310001001290ifrs-full:DerivativesMemberifrs-full:NotLaterThanThreeMonthsMember2025-12-310001001290ifrs-full:DerivativesMemberifrs-full:LaterThanThreeMonthsAndNotLaterThanOneYearMember2025-12-310001001290ifrs-full:DerivativesMemberifrs-full:LaterThanOneYearAndNotLaterThanThreeYearsMember2025-12-310001001290ifrs-full:DerivativesMemberifrs-full:LaterThanThreeYearsAndNotLaterThanFiveYearsMember2025-12-310001001290ifrs-full:DerivativesMemberifrs-full:LaterThanFiveYearsMember2025-12-310001001290ifrs-full:DerivativesMember2025-12-310001001290ifrs-full:DerivativesMemberifrs-full:NotLaterThanThreeMonthsMember2024-12-310001001290ifrs-full:DerivativesMemberifrs-full:LaterThanThreeMonthsAndNotLaterThanOneYearMember2024-12-310001001290ifrs-full:DerivativesMemberifrs-full:LaterThanOneYearAndNotLaterThanThreeYearsMember2024-12-310001001290ifrs-full:DerivativesMemberifrs-full:LaterThanThreeYearsAndNotLaterThanFiveYearsMember2024-12-310001001290ifrs-full:DerivativesMemberifrs-full:LaterThanFiveYearsMember2024-12-310001001290ifrs-full:DerivativesMember2024-12-310001001290ifrs-full:NotLaterThanOneYearMember2025-12-310001001290ifrs-full:LaterThanFiveYearsMember2025-12-310001001290ifrs-full:NotLaterThanOneYearMember2024-12-310001001290ifrs-full:LaterThanFiveYearsMember2024-12-310001001290ifrs-full:NotLaterThanOneYearMember2025-01-012025-12-310001001290ifrs-full:LaterThanOneYearAndNotLaterThanThreeYearsMember2025-01-012025-12-310001001290ifrs-full:LaterThanThreeYearsAndNotLaterThanFiveYearsMember2025-01-012025-12-310001001290ifrs-full:LaterThanFiveYearsMember2025-01-012025-12-310001001290ifrs-full:NotLaterThanOneYearMember2024-01-012024-12-310001001290ifrs-full:LaterThanOneYearAndNotLaterThanThreeYearsMember2024-01-012024-12-310001001290ifrs-full:LaterThanThreeYearsAndNotLaterThanFiveYearsMember2024-01-012024-12-310001001290ifrs-full:LaterThanFiveYearsMember2024-01-012024-12-310001001290ifrs-full:LandMember2025-01-012025-12-310001001290ifrs-full:BuildingsMember2025-01-012025-12-310001001290ifrs-full:InvestmentPropertyMember2025-12-310001001290ifrs-full:InvestmentPropertyMember2024-12-310001001290bap:PacificoEPSMember2025-12-310001001290bap:EntidadPrestadoraDeSaludMember2025-12-310001001290bap:TaxAssessmentAndPenaltyResolutionsMember2025-06-012025-06-300001001290country:PE2025-12-310001001290country:PE2024-12-310001001290ifrs-full:ForeignCountriesMember2025-12-310001001290ifrs-full:ForeignCountriesMember2024-12-310001001290bap:FondoDeSeguroDeDepositosMember2025-12-310001001290bap:FondoDeSeguroDeDepositosMember2024-12-310001001290bap:FondoDeProteccinAlAhorristaMember2025-12-310001001290bap:FondoDeProteccinAlAhorristaMember2024-12-310001001290bap:FondoDeGarantiaDeLasInstitucionesFinancierasMember2025-12-310001001290bap:FondoDeGarantiaDeLasInstitucionesFinancierasMember2024-12-310001001290bap:StateBankOfIndiaMember2025-12-310001001290bap:StateBankOfIndiaMember2024-12-310001001290bap:CorporacionFinancieraDeDesarrolloCofideMember2025-12-310001001290bap:CorporacionFinancieraDeDesarrolloCofideMember2024-12-310001001290bap:BankOfAmericaN.AMember2025-12-310001001290bap:BankOfAmericaN.AMember2024-12-310001001290bap:CaixabankMember2025-12-310001001290bap:CaixabankMember2024-12-310001001290bap:BancoDeLaNacionMember2025-12-310001001290bap:BancoDeLaNacionMember2024-12-310001001290bap:WellsFargoBankN.A.Member2025-12-310001001290bap:WellsFargoBankN.A.Member2024-12-310001001290bap:CommerzbankAGMember2025-12-310001001290bap:CommerzbankAGMember2024-12-310001001290bap:SumitomoMitsuiBankingCorporationMember2025-12-310001001290bap:SumitomoMitsuiBankingCorporationMember2024-12-310001001290bap:BancoInteramericanoDeDesarrolloMember2025-12-310001001290bap:BancoInteramericanoDeDesarrolloMember2024-12-310001001290bap:BancoBCIMember2025-12-310001001290bap:BancoBCIMember2024-12-310001001290bap:BancoBiceMember2025-12-310001001290bap:BancoBiceMember2024-12-310001001290bap:BankOfNewYorkMellonMember2025-12-310001001290bap:BankOfNewYorkMellonMember2024-12-310001001290bap:JapanInternationalCooperationAgencyMember2025-12-310001001290bap:JapanInternationalCooperationAgencyMember2024-12-310001001290bap:BancoldexMember2025-12-310001001290bap:BancoldexMember2024-12-310001001290bap:StandardCharteredBankHongKongLTDMember2025-12-310001001290bap:StandardCharteredBankHongKongLTDMember2024-12-310001001290bap:BancoBBVAPeruMember2025-12-310001001290bap:BancoBBVAPeruMember2024-12-310001001290bap:JPMorganChaseCoMember2025-12-310001001290bap:JPMorganChaseCoMember2024-12-310001001290bap:ICBCPeruBankSAMember2025-12-310001001290bap:ICBCPeruBankSAMember2024-12-310001001290bap:BancoInternacionalMember2025-12-310001001290bap:BancoInternacionalMember2024-12-310001001290bap:BancoNacionalDeBoliviaSAMember2025-12-310001001290bap:BancoNacionalDeBoliviaSAMember2024-12-310001001290bap:BancoBisaSAMember2025-12-310001001290bap:BancoBisaSAMember2024-12-310001001290bap:BancoDeOccidenteMember2025-12-310001001290bap:BancoDeOccidenteMember2024-12-310001001290bap:BancolombiaSAMember2025-12-310001001290bap:BancolombiaSAMember2024-12-310001001290bap:CitibankNAMember2025-12-310001001290bap:CitibankNAMember2024-12-310001001290bap:BancoSecurityMember2025-12-310001001290bap:BancoSecurityMember2024-12-310001001290bap:InternationalFinanceCorporationMember2025-12-310001001290bap:InternationalFinanceCorporationMember2024-12-310001001290bap:OtherMinorsMember2025-12-310001001290bap:OtherMinorsMember2024-12-310001001290bap:PeruvianSolMemberifrs-full:BottomOfRangeMember2025-12-310001001290bap:PeruvianSolMemberifrs-full:TopOfRangeMember2025-12-310001001290bap:PeruvianSolMemberifrs-full:BottomOfRangeMember2024-12-310001001290bap:PeruvianSolMemberifrs-full:TopOfRangeMember2024-12-310001001290bap:BolivianosMemberifrs-full:BottomOfRangeMember2025-12-310001001290bap:BolivianosMemberifrs-full:TopOfRangeMember2025-12-310001001290bap:BolivianosMemberifrs-full:BottomOfRangeMember2024-12-310001001290bap:BolivianosMemberifrs-full:TopOfRangeMember2024-12-310001001290bap:ColombianPesosMemberifrs-full:BottomOfRangeMember2025-12-310001001290bap:ColombianPesosMemberifrs-full:TopOfRangeMember2025-12-310001001290bap:ColombianPesosMemberifrs-full:BottomOfRangeMember2024-12-310001001290bap:ColombianPesosMemberifrs-full:TopOfRangeMember2024-12-310001001290bap:CrossCurrencySwapContractMember2024-12-310001001290bap:PeruvianSolMemberbap:CorporacinFinancieraDeDesarrolloAndFondoDeCooperacinParaElDesarrolloSocialMemberifrs-full:BottomOfRangeMember2025-01-012025-12-310001001290bap:PeruvianSolMemberbap:CorporacinFinancieraDeDesarrolloAndFondoDeCooperacinParaElDesarrolloSocialMemberifrs-full:TopOfRangeMember2025-01-012025-12-310001001290bap:PeruvianSolMemberbap:CorporacinFinancieraDeDesarrolloAndFondoDeCooperacinParaElDesarrolloSocialMemberifrs-full:BottomOfRangeMember2025-12-310001001290bap:PeruvianSolMemberbap:CorporacinFinancieraDeDesarrolloAndFondoDeCooperacinParaElDesarrolloSocialMemberifrs-full:TopOfRangeMember2025-12-310001001290bap:ForeignCurrencyMemberbap:CorporacinFinancieraDeDesarrolloAndFondoDeCooperacinParaElDesarrolloSocialMember2025-12-310001001290bap:PeruvianSolMemberbap:CorporacinFinancieraDeDesarrolloAndFondoDeCooperacinParaElDesarrolloSocialMemberifrs-full:BottomOfRangeMember2024-01-012024-12-310001001290bap:PeruvianSolMemberbap:CorporacinFinancieraDeDesarrolloAndFondoDeCooperacinParaElDesarrolloSocialMemberifrs-full:TopOfRangeMember2024-01-012024-12-310001001290bap:PeruvianSolMemberbap:CorporacinFinancieraDeDesarrolloAndFondoDeCooperacinParaElDesarrolloSocialMemberifrs-full:BottomOfRangeMember2024-12-310001001290bap:PeruvianSolMemberbap:CorporacinFinancieraDeDesarrolloAndFondoDeCooperacinParaElDesarrolloSocialMemberifrs-full:TopOfRangeMember2024-12-310001001290bap:ForeignCurrencyMemberbap:CorporacinFinancieraDeDesarrolloAndFondoDeCooperacinParaElDesarrolloSocialMember2024-12-310001001290bap:CorporacinFinancieraDeDesarrolloAndFondoDeCooperacinParaElDesarrolloSocialMember2025-12-310001001290bap:CorporacinFinancieraDeDesarrolloAndFondoDeCooperacinParaElDesarrolloSocialMember2024-12-310001001290bap:SeniorNotesOneMemberbap:BancoDeCreditoDelPeruMemberifrs-full:FixedInterestRateMember2025-12-310001001290bap:SeniorNotesOneMemberbap:BancoDeCreditoDelPeruMember2025-01-012025-12-310001001290bap:SeniorNotesOneMemberbap:BancoDeCreditoDelPeruMember2025-12-310001001290bap:SeniorNotesOneMemberbap:BancoDeCreditoDelPeruMember2024-01-012024-12-310001001290bap:SeniorNotesOneMemberbap:BancoDeCreditoDelPeruMember2024-12-310001001290bap:SeniorNotesTwoMemberbap:BancoDeCreditoDelPeruMemberifrs-full:FixedInterestRateMember2025-12-310001001290bap:SeniorNotesTwoMemberbap:BancoDeCreditoDelPeruMember2025-01-012025-12-310001001290bap:SeniorNotesTwoMemberbap:BancoDeCreditoDelPeruMember2025-12-310001001290bap:SeniorNotesTwoMemberbap:BancoDeCreditoDelPeruMember2024-01-012024-12-310001001290bap:SeniorNotesTwoMemberbap:BancoDeCreditoDelPeruMember2024-12-310001001290bap:SeniorNotesThreeMemberbap:BancoDeCreditoDelPeruMemberifrs-full:FixedInterestRateMember2025-12-310001001290bap:SeniorNotesThreeMemberbap:BancoDeCreditoDelPeruMember2025-01-012025-12-310001001290bap:SeniorNotesThreeMemberbap:BancoDeCreditoDelPeruMember2025-12-310001001290bap:SeniorNotesThreeMemberbap:BancoDeCreditoDelPeruMember2024-01-012024-12-310001001290bap:SeniorNotesThreeMemberbap:BancoDeCreditoDelPeruMember2024-12-310001001290bap:SeniorNotesFourMemberbap:EntidadPrestadoraDeSaludMemberifrs-full:FixedInterestRateMember2025-12-310001001290bap:SeniorNotesFourMemberbap:EntidadPrestadoraDeSaludMember2025-01-012025-12-310001001290bap:SeniorNotesFourMemberbap:EntidadPrestadoraDeSaludMember2025-12-310001001290bap:SeniorNotesFiveMemberbap:BancoDeCreditoDelPeruMemberifrs-full:FixedInterestRateMember2025-12-310001001290bap:SeniorNotesFiveMemberbap:BancoDeCreditoDelPeruMember2025-01-012025-12-310001001290bap:SeniorNotesFiveMemberbap:BancoDeCreditoDelPeruMember2025-12-310001001290bap:SeniorNotesFiveMemberbap:BancoDeCreditoDelPeruMember2024-01-012024-12-310001001290bap:SeniorNotesFiveMemberbap:BancoDeCreditoDelPeruMember2024-12-310001001290bap:SeniorNotesSixMemberbap:BancoDeCreditoDelPeruMemberifrs-full:FixedInterestRateMember2025-12-310001001290bap:SeniorNotesSixMemberbap:BancoDeCreditoDelPeruMember2025-01-012025-12-310001001290bap:SeniorNotesSixMemberbap:BancoDeCreditoDelPeruMember2025-12-310001001290bap:SeniorNotesSixMemberbap:BancoDeCreditoDelPeruMember2024-01-012024-12-310001001290bap:SeniorNotesSixMemberbap:BancoDeCreditoDelPeruMember2024-12-310001001290bap:SeniorNotesSevenMemberbap:CredicorpCapitalLtdAndSubsidiariesMemberifrs-full:FixedInterestRateMember2025-12-310001001290bap:SeniorNotesSevenMemberbap:CredicorpCapitalLtdAndSubsidiariesMember2025-01-012025-12-310001001290bap:SeniorNotesSevenMemberbap:CredicorpCapitalLtdAndSubsidiariesMember2024-01-012024-12-310001001290bap:SeniorNotesSevenMemberbap:CredicorpCapitalLtdAndSubsidiariesMember2024-12-310001001290bap:CorporateBondsFirstProgramFirstIssuanceSeriesAMemberbap:MibancoColombiaMemberifrs-full:FixedInterestRateMember2025-12-310001001290bap:CorporateBondsFirstProgramFirstIssuanceSeriesAMemberbap:MibancoColombiaMember2025-01-012025-12-310001001290bap:CorporateBondsFirstProgramFirstIssuanceSeriesAMemberbap:MibancoColombiaMember2025-12-310001001290bap:CorporateBondsFirstProgramFirstIssuanceSeriesAMemberbap:MibancoColombiaMember2024-01-012024-12-310001001290bap:CorporateBondsFirstProgramFirstIssuanceSeriesAMemberbap:MibancoColombiaMember2024-12-310001001290bap:CorporateBondsFirstProgramFirstIssuanceSeriesUnicaMemberbap:BancoDeCreditoDelPeruMemberifrs-full:FixedInterestRateMember2025-12-310001001290bap:CorporateBondsFirstProgramFirstIssuanceSeriesUnicaMemberbap:BancoDeCreditoDelPeruMember2025-01-012025-12-310001001290bap:CorporateBondsFirstProgramFirstIssuanceSeriesUnicaMemberbap:BancoDeCreditoDelPeruMember2025-12-310001001290bap:CorporateBondsAndSeniorNotesMember2025-12-310001001290bap:CorporateBondsAndSeniorNotesMember2024-12-310001001290bap:SubordinatedBonds1Memberbap:BancoDeCreditoDelPeruMemberifrs-full:FixedInterestRateMemberifrs-full:BottomOfRangeMember2025-12-310001001290bap:SubordinatedBonds1Memberbap:BancoDeCreditoDelPeruMember2025-01-012025-12-310001001290bap:SubordinatedBonds1Memberbap:BancoDeCreditoDelPeruMember2025-12-310001001290bap:SubordinatedBonds1Memberbap:BancoDeCreditoDelPeruMember2024-12-310001001290bap:SubordinatedBonds2Memberbap:BancoDeCreditoDelPeruMemberifrs-full:FixedInterestRateMemberifrs-full:BottomOfRangeMember2025-12-310001001290bap:SubordinatedBonds2Memberbap:BancoDeCreditoDelPeruMember2025-01-012025-12-310001001290bap:SubordinatedBonds2Memberbap:BancoDeCreditoDelPeruMember2025-12-310001001290bap:SubordinatedBonds2Memberbap:BancoDeCreditoDelPeruMember2024-01-012024-12-310001001290bap:SubordinatedBonds2Memberbap:BancoDeCreditoDelPeruMember2024-12-310001001290bap:SubordinatedBonds3Memberbap:BancoDeCreditoDelPeruMemberifrs-full:FixedInterestRateMemberifrs-full:BottomOfRangeMember2025-12-310001001290bap:SubordinatedBonds3Memberbap:BancoDeCreditoDelPeruMember2025-01-012025-12-310001001290bap:SubordinatedBonds3Memberbap:BancoDeCreditoDelPeruMember2025-12-310001001290bap:SubordinatedBonds3Memberbap:BancoDeCreditoDelPeruMember2024-01-012024-12-310001001290bap:SubordinatedBonds3Memberbap:BancoDeCreditoDelPeruMember2024-12-310001001290bap:SubordinatedBonds4Memberbap:BancoDeCreditoDelPeruMemberifrs-full:FixedInterestRateMemberifrs-full:BottomOfRangeMember2025-12-310001001290bap:SubordinatedBonds4Memberbap:BancoDeCreditoDelPeruMember2025-01-012025-12-310001001290bap:SubordinatedBonds4Memberbap:BancoDeCreditoDelPeruMember2025-12-310001001290bap:SubordinatedBonds5Memberbap:BancoDeCreditoDelPeruMemberifrs-full:FixedInterestRateMemberifrs-full:BottomOfRangeMember2025-12-310001001290bap:SubordinatedBonds5Memberbap:BancoDeCreditoDelPeruMember2025-01-012025-12-310001001290bap:SubordinatedBonds5Memberbap:BancoDeCreditoDelPeruMember2024-01-012024-12-310001001290bap:SubordinatedBonds5Memberbap:BancoDeCreditoDelPeruMember2024-12-310001001290bap:SubordinatedBondsSecondProgramSecondIssuanceSeriesBMemberbap:PacificoSegurosMemberifrs-full:FixedInterestRateMember2025-12-310001001290bap:SubordinatedBondsSecondProgramSecondIssuanceSeriesBMemberbap:PacificoSegurosMember2025-01-012025-12-310001001290bap:SubordinatedBondsSecondProgramSecondIssuanceSeriesBMemberbap:PacificoSegurosMember2025-12-310001001290bap:SubordinatedBondsSecondProgramSecondIssuanceSeriesBMemberbap:PacificoSegurosMember2024-01-012024-12-310001001290bap:SubordinatedBondsSecondProgramSecondIssuanceSeriesBMemberbap:PacificoSegurosMember2024-12-310001001290bap:SubordinatedBondsSecondProgramSecondIssuanceSeriesAMemberbap:PacificoSegurosMemberifrs-full:FixedInterestRateMember2025-12-310001001290bap:SubordinatedBondsSecondProgramSecondIssuanceSeriesAMemberbap:PacificoSegurosMember2025-01-012025-12-310001001290bap:SubordinatedBondsSecondProgramSecondIssuanceSeriesAMemberbap:PacificoSegurosMember2025-12-310001001290bap:SubordinatedBondsSecondProgramSecondIssuanceSeriesAMemberbap:PacificoSegurosMember2024-01-012024-12-310001001290bap:SubordinatedBondsSecondProgramSecondIssuanceSeriesAMemberbap:PacificoSegurosMember2024-12-310001001290bap:SubordinatedBondsSecondProgramFirstIssuanceSeriesBMemberbap:MibancoMemberifrs-full:FixedInterestRateMember2025-12-310001001290bap:SubordinatedBondsSecondProgramFirstIssuanceSeriesBMemberbap:MibancoMember2025-01-012025-12-310001001290bap:SubordinatedBondsSecondProgramFirstIssuanceSeriesBMemberbap:MibancoMember2024-01-012024-12-310001001290bap:SubordinatedBondsSecondProgramFirstIssuanceSeriesBMemberbap:MibancoMember2024-12-310001001290bap:SubordinatedBondsThirdProgramFourthIssuanceMemberbap:BancoDeCreditoDeBoliviaMemberifrs-full:FixedInterestRateMember2025-12-310001001290bap:SubordinatedBondsThirdProgramFourthIssuanceMemberbap:BancoDeCreditoDeBoliviaMember2025-01-012025-12-310001001290bap:SubordinatedBondsThirdProgramFourthIssuanceMemberbap:BancoDeCreditoDeBoliviaMember2025-12-310001001290bap:SubordinatedBondsThirdProgramFourthIssuanceMemberbap:BancoDeCreditoDeBoliviaMember2024-01-012024-12-310001001290bap:SubordinatedBondsThirdProgramFourthIssuanceMemberbap:BancoDeCreditoDeBoliviaMember2024-12-310001001290bap:SubordinatedBondsThirdProgramThirdIssuanceMemberbap:BancoDeCreditoDeBoliviaMemberifrs-full:FixedInterestRateMember2025-12-310001001290bap:SubordinatedBondsThirdProgramThirdIssuanceMemberbap:BancoDeCreditoDeBoliviaMember2025-01-012025-12-310001001290bap:SubordinatedBondsThirdProgramThirdIssuanceMemberbap:BancoDeCreditoDeBoliviaMember2025-12-310001001290bap:SubordinatedBondsThirdProgramThirdIssuanceMemberbap:BancoDeCreditoDeBoliviaMember2024-01-012024-12-310001001290bap:SubordinatedBondsThirdProgramThirdIssuanceMemberbap:BancoDeCreditoDeBoliviaMember2024-12-310001001290bap:SubordinatedBondsThirdProgramFirstIssuanceMemberbap:BancoDeCreditoDeBoliviaMemberifrs-full:FixedInterestRateMember2025-12-310001001290bap:SubordinatedBondsThirdProgramFirstIssuanceMemberbap:BancoDeCreditoDeBoliviaMember2025-01-012025-12-310001001290bap:SubordinatedBondsThirdProgramFirstIssuanceMemberbap:BancoDeCreditoDeBoliviaMember2025-12-310001001290bap:SubordinatedBondsThirdProgramFirstIssuanceMemberbap:BancoDeCreditoDeBoliviaMember2024-01-012024-12-310001001290bap:SubordinatedBondsThirdProgramFirstIssuanceMemberbap:BancoDeCreditoDeBoliviaMember2024-12-310001001290bap:SubordinatedBondsFourthProgramFourthIssuanceSeriesBMemberbap:PacificoSegurosMemberifrs-full:FixedInterestRateMember2025-12-310001001290bap:SubordinatedBondsFourthProgramFourthIssuanceSeriesBMemberbap:PacificoSegurosMember2025-01-012025-12-310001001290bap:SubordinatedBondsFourthProgramFourthIssuanceSeriesBMemberbap:PacificoSegurosMember2025-12-310001001290bap:SubordinatedBondsFourthProgramFourthIssuanceSeriesAMemberbap:MibancoMemberifrs-full:FixedInterestRateMember2025-12-310001001290bap:SubordinatedBondsFourthProgramFourthIssuanceSeriesAMemberbap:MibancoMember2025-01-012025-12-310001001290bap:SubordinatedBondsFourthProgramFourthIssuanceSeriesAMemberbap:MibancoMember2025-12-310001001290bap:SubordinatedBondsFourthProgramFourthIssuanceSeriesAMemberbap:MibancoMember2024-01-012024-12-310001001290bap:SubordinatedBondsFourthProgramFourthIssuanceSeriesAMemberbap:MibancoMember2024-12-310001001290bap:SubordinatedBondsFifthProgramFirstIssuanceSeriesBMemberbap:MibancoMemberifrs-full:FixedInterestRateMember2025-12-310001001290bap:SubordinatedBondsFifthProgramFirstIssuanceSeriesBMemberbap:MibancoMember2025-01-012025-12-310001001290bap:SubordinatedBondsFifthProgramFirstIssuanceSeriesBMemberbap:MibancoMember2025-12-310001001290bap:SubordinatedBondsFifthProgramFirstIssuanceSeriesAMemberbap:MibancoMemberifrs-full:FixedInterestRateMember2025-12-310001001290bap:SubordinatedBondsFifthProgramFirstIssuanceSeriesAMemberbap:MibancoMember2025-01-012025-12-310001001290bap:SubordinatedBondsFifthProgramFirstIssuanceSeriesAMemberbap:MibancoMember2025-12-310001001290bap:SubordinatedBondsMember2025-12-310001001290bap:SubordinatedBondsMember2024-12-310001001290bap:NegotiableCertificatesOfDepositMemberbap:MibancoColombiaMember2025-01-012025-12-310001001290bap:NegotiableCertificatesOfDepositMemberbap:MibancoColombiaMember2025-12-310001001290bap:NegotiableCertificatesOfDepositMemberbap:MibancoColombiaMember2024-01-012024-12-310001001290bap:NegotiableCertificatesOfDepositMemberbap:MibancoColombiaMember2024-12-310001001290bap:NegotiableCertificatesOfDepositMemberbap:MibancoMember2025-01-012025-12-310001001290bap:NegotiableCertificatesOfDepositMemberbap:MibancoMember2025-12-310001001290bap:NegotiableCertificatesOfDepositMemberbap:MibancoMember2024-01-012024-12-310001001290bap:NegotiableCertificatesOfDepositMemberbap:MibancoMember2024-12-310001001290bap:SeniorNotesTwoMember2024-01-112024-01-110001001290bap:TreasuryOfUnitedStatesOfAmericasRateMemberbap:SeniorNotesTwoMember2024-01-110001001290bap:SeniorNotesTwoMember2024-01-110001001290bap:SeniorNotesFourMemberbap:PacificoS.A.EntidadPrestadoraDeSaludMember2017-09-280001001290bap:SeniorNotesFourMemberbap:PacificoS.A.EntidadPrestadoraDeSaludMemberifrs-full:FixedInterestRateMember2017-09-280001001290bap:SeniorNotesFiveMemberifrs-full:CashFlowHedgesMember2024-12-310001001290ifrs-full:CurrencySwapContractMember2025-01-012025-12-310001001290bap:SeniorNotesSixMember2025-01-110001001290bap:SeniorNotesSixMemberifrs-full:CashFlowHedgesMember2024-12-310001001290bap:SeniorNotesSevenMember2025-06-170001001290bap:CorporateBondsFirstProgramFirstIssuanceSeriesUnicaMemberbap:BancoDeCreditoDelPeruMember2025-06-260001001290bap:SixPoint45PercentSubordinatedFixedToFixedRateNotesMember2025-04-300001001290bap:SixPoint45PercentSubordinatedFixedToFixedRateNotesMemberbap:BancoDeCreditoDelPeruMember2025-04-302025-04-300001001290bap:SixPoint45PercentSubordinatedFixedToFixedRateNotesMemberbap:BancoDeCreditoDelPeruMemberifrs-full:FixedInterestRateMember2025-04-300001001290bap:SixPoint45PercentSubordinatedFixedToFixedRateNotesMember2025-04-302025-04-300001001290bap:FivePoint8PercentSubordinatedFixedToFixedRateNotesMemberMember2024-09-102024-09-100001001290bap:FivePoint8PercentSubordinatedFixedToFixedRateNotesMemberMember2024-09-100001001290bap:FivePoint8PercentSubordinatedFixedToFixedRateNotesMemberMemberbap:BancoDeCreditoDelPeruMember2025-01-012025-12-310001001290bap:FivePoint8PercentSubordinatedFixedToFixedRateNotesMemberMemberbap:BancoDeCreditoDelPeruMember2024-09-100001001290bap:BancoDeCreditoDelPeruMember2024-09-100001001290bap:ThreePoint25PercentSubordinatedFixedToFixedRateNotesMember2021-03-302021-03-300001001290bap:ThreePoint25PercentSubordinatedFixedToFixedRateNotesMember2021-03-300001001290bap:ThreePoint25PercentSubordinatedFixedToFixedRateNotesMemberbap:BancoDeCreditoDelPeruMember2025-01-012025-12-310001001290bap:ThreePoint25PercentSubordinatedFixedToFixedRateNotesMemberbap:BancoDeCreditoDelPeruMember2021-03-300001001290bap:BancoDeCreditoDelPeruMember2021-03-300001001290bap:FivePoint65PercentSubordinatedFixedToFixedRateNotesMember2025-10-152025-10-150001001290bap:FivePoint65PercentSubordinatedFixedToFixedRateNotesMember2025-10-150001001290bap:FivePoint65PercentSubordinatedFixedToFixedRateNotesMemberbap:BancoDeCreditoDelPeruMember2025-01-012025-12-310001001290bap:FivePoint65PercentSubordinatedFixedToFixedRateNotesMemberbap:BancoDeCreditoDelPeruMember2025-10-150001001290bap:BancoDeCreditoDelPeruMember2025-10-150001001290bap:ThreePoint125PercentSubordinatedFixedToFixedRateNotesMember2020-07-020001001290bap:SubordinatedBondsFourthProgramFourthIssuanceSeriesBMemberbap:PacificoS.A.EntidadPrestadoraDeSaludMember2025-12-190001001290bap:SubordinatedBondsFourthProgramFourthIssuanceSeriesBMemberbap:PacificoS.A.EntidadPrestadoraDeSaludMemberifrs-full:FixedInterestRateMember2025-12-190001001290bap:SubordinatedBondsFifthProgramFirstIssuanceSeriesBMemberbap:MibancoMember2025-08-200001001290bap:SubordinatedBondsFifthProgramFirstIssuanceSeriesAMemberbap:MibancoMember2025-03-280001001290bap:SubordinatedBondsFifthProgramFirstIssuanceSeriesAMemberbap:MibancoMemberifrs-full:FixedInterestRateMember2025-03-280001001290bap:AtlanticSecurityHoldingCorporationTreasurySharesMember2025-12-310001001290bap:AtlanticSecurityInternationalFinancialServicesMember2025-12-310001001290bap:GrupoCreditoSAMember2025-12-310001001290bap:PacficoSegurosMember2025-12-310001001290bap:MibancoBancoDeLaMicroempresaMember2025-12-310001001290bap:AtlanticSecurityBankMember2025-12-310001001290bap:CredicorpCapitalServiciosFinancierosMember2025-12-310001001290bap:OtherSubsidiariesMember2025-12-310001001290bap:AtlanticSecurityHoldingCorporationTreasurySharesMember2024-12-310001001290bap:AtlanticSecurityInternationalFinancialServicesMember2024-12-310001001290bap:GrupoCreditoSAMember2024-12-310001001290bap:PacficoSegurosMember2024-12-310001001290bap:MibancoBancoDeLaMicroempresaMember2024-12-310001001290bap:CredicorpCapitalServiciosFinancierosMember2024-12-310001001290bap:AtlanticSecurityBankMember2024-12-310001001290bap:OtherSubsidiariesMember2024-12-310001001290bap:AtlanticSecurityHoldingCorporationTreasurySharesMember2023-12-310001001290bap:BancoDeCreditoDelPeruMember2023-12-310001001290bap:AtlanticSecurityInternationalFinancialServicesMember2023-12-310001001290bap:GrupoCreditoSAMember2023-12-310001001290bap:PacficoSegurosMember2023-12-310001001290bap:MibancoBancoDeLaMicroempresaMember2023-12-310001001290bap:CredicorpCapitalServiciosFinancierosMember2023-12-310001001290bap:AtlanticSecurityBankMember2023-12-310001001290bap:PrimaAFPSAMember2023-12-310001001290bap:OtherSubsidiariesMember2023-12-3100010012902025-02-272025-02-2700010012902024-04-272024-04-2700010012902023-04-272023-04-270001001290ifrs-full:ReserveOfGainsAndLossesFromInvestmentsInEquityInstrumentsMember2022-12-310001001290bap:ReserveOfDebtInstrumentsAtFairValueMember2022-12-310001001290ifrs-full:ReserveOfCashFlowHedgesMember2022-12-310001001290bap:InsuranceReservesMember2022-12-310001001290ifrs-full:ReserveOfExchangeDifferencesOnTranslationMember2022-12-310001001290ifrs-full:ReserveOfGainsAndLossesFromInvestmentsInEquityInstrumentsMember2023-01-012023-12-310001001290bap:ReserveOfDebtInstrumentsAtFairValueMember2023-01-012023-12-310001001290ifrs-full:ReserveOfCashFlowHedgesMember2023-01-012023-12-310001001290bap:InsuranceReservesMember2023-01-012023-12-310001001290ifrs-full:ReserveOfExchangeDifferencesOnTranslationMember2023-01-012023-12-310001001290ifrs-full:ReserveOfGainsAndLossesFromInvestmentsInEquityInstrumentsMember2023-12-310001001290bap:ReserveOfDebtInstrumentsAtFairValueMember2023-12-310001001290ifrs-full:ReserveOfCashFlowHedgesMember2023-12-310001001290bap:InsuranceReservesMember2023-12-310001001290ifrs-full:ReserveOfExchangeDifferencesOnTranslationMember2023-12-310001001290ifrs-full:ReserveOfGainsAndLossesFromInvestmentsInEquityInstrumentsMember2024-01-012024-12-310001001290bap:ReserveOfDebtInstrumentsAtFairValueMember2024-01-012024-12-310001001290ifrs-full:ReserveOfCashFlowHedgesMember2024-01-012024-12-310001001290bap:InsuranceReservesMember2024-01-012024-12-310001001290ifrs-full:ReserveOfExchangeDifferencesOnTranslationMember2024-01-012024-12-310001001290ifrs-full:ReserveOfGainsAndLossesFromInvestmentsInEquityInstrumentsMember2024-12-310001001290bap:ReserveOfDebtInstrumentsAtFairValueMember2024-12-310001001290ifrs-full:ReserveOfCashFlowHedgesMember2024-12-310001001290bap:InsuranceReservesMember2024-12-310001001290ifrs-full:ReserveOfExchangeDifferencesOnTranslationMember2024-12-310001001290ifrs-full:ReserveOfGainsAndLossesFromInvestmentsInEquityInstrumentsMember2025-01-012025-12-310001001290bap:ReserveOfDebtInstrumentsAtFairValueMember2025-01-012025-12-310001001290ifrs-full:ReserveOfCashFlowHedgesMember2025-01-012025-12-310001001290bap:InsuranceReservesMember2025-01-012025-12-310001001290ifrs-full:ReserveOfExchangeDifferencesOnTranslationMember2025-01-012025-12-310001001290ifrs-full:ReserveOfGainsAndLossesFromInvestmentsInEquityInstrumentsMember2025-12-310001001290bap:ReserveOfDebtInstrumentsAtFairValueMember2025-12-310001001290ifrs-full:ReserveOfCashFlowHedgesMember2025-12-310001001290bap:InsuranceReservesMember2025-12-310001001290ifrs-full:ReserveOfExchangeDifferencesOnTranslationMember2025-12-3100010012902024-08-292024-08-290001001290country:BO2023-01-012023-12-310001001290country:BO2024-01-012024-12-310001001290country:BO2025-01-012025-12-310001001290country:CL2020-01-012020-12-310001001290ifrs-full:CountryOfDomicileMember2025-01-012025-12-310001001290ifrs-full:CountryOfDomicileMember2024-01-012024-12-310001001290ifrs-full:CountryOfDomicileMember2023-01-012023-12-310001001290country:CLifrs-full:BottomOfRangeMember2025-01-012025-12-310001001290country:CLifrs-full:TopOfRangeMember2025-01-012025-12-310001001290country:CO2023-01-012023-12-310001001290country:PE2023-01-012023-12-310001001290ifrs-full:ForeignCountriesMember2025-01-012025-12-310001001290ifrs-full:ForeignCountriesMember2024-01-012024-12-310001001290ifrs-full:ForeignCountriesMember2023-01-012023-12-310001001290bap:DeferredIncomeTaxAssetNetMemberifrs-full:AllowanceForCreditLossesMember2025-12-310001001290bap:DeferredIncomeTaxAssetNetMemberifrs-full:AllowanceForCreditLossesMember2024-12-310001001290bap:DeferredIncomeTaxAssetNetMemberifrs-full:AllowanceForCreditLossesMember2025-01-012025-12-310001001290bap:DeferredIncomeTaxAssetNetMemberifrs-full:AllowanceForCreditLossesMember2024-01-012024-12-310001001290bap:DeferredIncomeTaxAssetNetMemberifrs-full:UnusedTaxLossesMember2025-12-310001001290bap:DeferredIncomeTaxAssetNetMemberifrs-full:UnusedTaxLossesMember2024-12-310001001290bap:DeferredIncomeTaxAssetNetMemberifrs-full:UnusedTaxLossesMember2025-01-012025-12-310001001290bap:DeferredIncomeTaxAssetNetMemberifrs-full:UnusedTaxLossesMember2024-01-012024-12-310001001290bap:DeferredIncomeTaxAssetNetMemberbap:ProvisionForProfitSharingMember2025-12-310001001290bap:DeferredIncomeTaxAssetNetMemberbap:ProvisionForProfitSharingMember2024-12-310001001290bap:DeferredIncomeTaxAssetNetMemberbap:ProvisionForProfitSharingMember2025-01-012025-12-310001001290bap:DeferredIncomeTaxAssetNetMemberbap:ProvisionForProfitSharingMember2024-01-012024-12-310001001290bap:DeferredIncomeTaxAssetNetMemberbap:ProvisionForSundryExpensesAndRisksMember2025-12-310001001290bap:DeferredIncomeTaxAssetNetMemberbap:ProvisionForSundryExpensesAndRisksMember2024-12-310001001290bap:DeferredIncomeTaxAssetNetMemberbap:ProvisionForSundryExpensesAndRisksMember2025-01-012025-12-310001001290bap:DeferredIncomeTaxAssetNetMemberbap:ProvisionForSundryExpensesAndRisksMember2024-01-012024-12-310001001290bap:DeferredIncomeTaxAssetNetMemberbap:UnrealizedLossesDueToValuationOfInvestmentsAtFairValueThroughOtherComprehensiveIncomeMember2025-12-310001001290bap:DeferredIncomeTaxAssetNetMemberbap:UnrealizedLossesDueToValuationOfInvestmentsAtFairValueThroughOtherComprehensiveIncomeMember2024-12-310001001290bap:DeferredIncomeTaxAssetNetMemberbap:UnrealizedLossesDueToValuationOfInvestmentsAtFairValueThroughOtherComprehensiveIncomeMember2025-01-012025-12-310001001290bap:DeferredIncomeTaxAssetNetMemberbap:UnrealizedLossesDueToValuationOfInvestmentsAtFairValueThroughOtherComprehensiveIncomeMember2024-01-012024-12-310001001290bap:DeferredIncomeTaxAssetNetMemberbap:ProvisionForPendingVacationsMember2025-12-310001001290bap:DeferredIncomeTaxAssetNetMemberbap:ProvisionForPendingVacationsMember2024-12-310001001290bap:DeferredIncomeTaxAssetNetMemberbap:ProvisionForPendingVacationsMember2025-01-012025-12-310001001290bap:DeferredIncomeTaxAssetNetMemberbap:ProvisionForPendingVacationsMember2024-01-012024-12-310001001290bap:DeferredIncomeTaxAssetNetMemberbap:ProvisionForStockAwardsMember2025-12-310001001290bap:DeferredIncomeTaxAssetNetMemberbap:ProvisionForStockAwardsMember2024-12-310001001290bap:DeferredIncomeTaxAssetNetMemberbap:ProvisionForStockAwardsMember2025-01-012025-12-310001001290bap:DeferredIncomeTaxAssetNetMemberbap:ProvisionForStockAwardsMember2024-01-012024-12-310001001290bap:DeferredIncomeTaxAssetNetMemberbap:DepreciationOfImprovementsForLeasedPremisesMember2025-12-310001001290bap:DeferredIncomeTaxAssetNetMemberbap:DepreciationOfImprovementsForLeasedPremisesMember2024-12-310001001290bap:DeferredIncomeTaxAssetNetMemberbap:DepreciationOfImprovementsForLeasedPremisesMember2025-01-012025-12-310001001290bap:DeferredIncomeTaxAssetNetMemberbap:DepreciationOfImprovementsForLeasedPremisesMember2024-01-012024-12-310001001290bap:DeferredIncomeTaxAssetNetMemberbap:OthersMember2025-12-310001001290bap:DeferredIncomeTaxAssetNetMemberbap:OthersMember2024-12-310001001290bap:DeferredIncomeTaxAssetNetMemberbap:OthersMember2025-01-012025-12-310001001290bap:DeferredIncomeTaxAssetNetMemberbap:OthersMember2024-01-012024-12-310001001290bap:DeferredIncomeTaxAssetNetMemberbap:IntangiblesNetMember2025-12-310001001290bap:DeferredIncomeTaxAssetNetMemberbap:IntangiblesNetMember2024-12-310001001290bap:DeferredIncomeTaxAssetNetMemberbap:IntangiblesNetMember2025-01-012025-12-310001001290bap:DeferredIncomeTaxAssetNetMemberbap:IntangiblesNetMember2024-01-012024-12-310001001290bap:DeferredIncomeTaxAssetNetMemberbap:AdjustmentForDifferenceInExchangeOfSuperintendenciaNacionalDeAduanasYDeAdministracionTributariaSUNATAndSBSMember2025-12-310001001290bap:DeferredIncomeTaxAssetNetMemberbap:AdjustmentForDifferenceInExchangeOfSuperintendenciaNacionalDeAduanasYDeAdministracionTributariaSUNATAndSBSMember2024-12-310001001290bap:DeferredIncomeTaxAssetNetMemberbap:AdjustmentForDifferenceInExchangeOfSuperintendenciaNacionalDeAduanasYDeAdministracionTributariaSUNATAndSBSMember2025-01-012025-12-310001001290bap:DeferredIncomeTaxAssetNetMemberbap:AdjustmentForDifferenceInExchangeOfSuperintendenciaNacionalDeAduanasYDeAdministracionTributariaSUNATAndSBSMember2024-01-012024-12-310001001290bap:DeferredIncomeTaxAssetNetMemberbap:BuildingsDepreciationMember2025-12-310001001290bap:DeferredIncomeTaxAssetNetMemberbap:BuildingsDepreciationMember2024-12-310001001290bap:DeferredIncomeTaxAssetNetMemberbap:BuildingsDepreciationMember2025-01-012025-12-310001001290bap:DeferredIncomeTaxAssetNetMemberbap:BuildingsDepreciationMember2024-01-012024-12-310001001290bap:DeferredIncomeTaxAssetNetMemberbap:DeferredAcquisitionsCostsMember2025-12-310001001290bap:DeferredIncomeTaxAssetNetMemberbap:DeferredAcquisitionsCostsMember2024-12-310001001290bap:DeferredIncomeTaxAssetNetMemberbap:DeferredAcquisitionsCostsMember2025-01-012025-12-310001001290bap:DeferredIncomeTaxAssetNetMemberbap:DeferredAcquisitionsCostsMember2024-01-012024-12-310001001290bap:DeferredIncomeTaxAssetNetMemberbap:UnrealizedGainDueToValuationOfInvestmentsAtFairValueThroughOtherComprehensiveIncomeMember2025-12-310001001290bap:DeferredIncomeTaxAssetNetMemberbap:UnrealizedGainDueToValuationOfInvestmentsAtFairValueThroughOtherComprehensiveIncomeMember2024-12-310001001290bap:DeferredIncomeTaxAssetNetMemberbap:UnrealizedGainDueToValuationOfInvestmentsAtFairValueThroughOtherComprehensiveIncomeMember2025-01-012025-12-310001001290bap:DeferredIncomeTaxAssetNetMemberbap:UnrealizedGainDueToValuationOfInvestmentsAtFairValueThroughOtherComprehensiveIncomeMember2024-01-012024-12-310001001290bap:DeferredIncomeTaxAssetNetMember2025-12-310001001290bap:DeferredIncomeTaxAssetNetMember2024-12-310001001290bap:DeferredIncomeTaxAssetNetMember2025-01-012025-12-310001001290bap:DeferredIncomeTaxAssetNetMember2024-01-012024-12-310001001290bap:DeferredIncomeTaxLiabilityNetMemberbap:ProvisionForSundryExpensesAndRisksMember2025-12-310001001290bap:DeferredIncomeTaxLiabilityNetMemberbap:ProvisionForSundryExpensesAndRisksMember2024-12-310001001290bap:DeferredIncomeTaxLiabilityNetMemberbap:ProvisionForSundryExpensesAndRisksMember2025-01-012025-12-310001001290bap:DeferredIncomeTaxLiabilityNetMemberbap:ProvisionForSundryExpensesAndRisksMember2024-01-012024-12-310001001290bap:DeferredIncomeTaxLiabilityNetMemberbap:DeferredIncomeDueToCommissionMember2025-12-310001001290bap:DeferredIncomeTaxLiabilityNetMemberbap:DeferredIncomeDueToCommissionMember2024-12-310001001290bap:DeferredIncomeTaxLiabilityNetMemberbap:DeferredIncomeDueToCommissionMember2025-01-012025-12-310001001290bap:DeferredIncomeTaxLiabilityNetMemberbap:DeferredIncomeDueToCommissionMember2024-01-012024-12-310001001290bap:DeferredIncomeTaxLiabilityNetMemberbap:ProvisionForProfitSharingMember2025-12-310001001290bap:DeferredIncomeTaxLiabilityNetMemberbap:ProvisionForProfitSharingMember2024-12-310001001290bap:DeferredIncomeTaxLiabilityNetMemberbap:ProvisionForProfitSharingMember2025-01-012025-12-310001001290bap:DeferredIncomeTaxLiabilityNetMemberbap:ProvisionForProfitSharingMember2024-01-012024-12-310001001290bap:DeferredIncomeTaxLiabilityNetMemberifrs-full:UnusedTaxLossesMember2025-12-310001001290bap:DeferredIncomeTaxLiabilityNetMemberifrs-full:UnusedTaxLossesMember2024-12-310001001290bap:DeferredIncomeTaxLiabilityNetMemberifrs-full:UnusedTaxLossesMember2025-01-012025-12-310001001290bap:DeferredIncomeTaxLiabilityNetMemberifrs-full:UnusedTaxLossesMember2024-01-012024-12-310001001290bap:DeferredIncomeTaxLiabilityNetMemberbap:UnrealizedLossesDueToValuationOfInvestmentsAtFairValueThroughOtherComprehensiveIncomeMember2025-12-310001001290bap:DeferredIncomeTaxLiabilityNetMemberbap:UnrealizedLossesDueToValuationOfInvestmentsAtFairValueThroughOtherComprehensiveIncomeMember2024-12-310001001290bap:DeferredIncomeTaxLiabilityNetMemberbap:UnrealizedLossesDueToValuationOfInvestmentsAtFairValueThroughOtherComprehensiveIncomeMember2025-01-012025-12-310001001290bap:DeferredIncomeTaxLiabilityNetMemberbap:UnrealizedLossesDueToValuationOfInvestmentsAtFairValueThroughOtherComprehensiveIncomeMember2024-01-012024-12-310001001290bap:DeferredIncomeTaxLiabilityNetMemberbap:OthersMember2025-12-310001001290bap:DeferredIncomeTaxLiabilityNetMemberbap:OthersMember2024-12-310001001290bap:DeferredIncomeTaxLiabilityNetMemberbap:OthersMember2025-01-012025-12-310001001290bap:DeferredIncomeTaxLiabilityNetMemberbap:OthersMember2024-01-012024-12-310001001290bap:DeferredIncomeTaxLiabilityNetMemberbap:RevaluationOfLongLivedAssetsInABusinessCombinationMember2025-12-310001001290bap:DeferredIncomeTaxLiabilityNetMemberbap:RevaluationOfLongLivedAssetsInABusinessCombinationMember2024-12-310001001290bap:DeferredIncomeTaxLiabilityNetMemberbap:RevaluationOfLongLivedAssetsInABusinessCombinationMember2025-01-012025-12-310001001290bap:DeferredIncomeTaxLiabilityNetMemberbap:RevaluationOfLongLivedAssetsInABusinessCombinationMember2024-01-012024-12-310001001290bap:DeferredIncomeTaxLiabilityNetMemberbap:IntangiblesNetMember2025-12-310001001290bap:DeferredIncomeTaxLiabilityNetMemberbap:IntangiblesNetMember2024-12-310001001290bap:DeferredIncomeTaxLiabilityNetMemberbap:IntangiblesNetMember2025-01-012025-12-310001001290bap:DeferredIncomeTaxLiabilityNetMemberbap:IntangiblesNetMember2024-01-012024-12-310001001290bap:DeferredIncomeTaxLiabilityNetMemberbap:UnrealizedGainDueToValuationOfInvestmentsAtFairValueThroughOtherComprehensiveIncomeMember2025-12-310001001290bap:DeferredIncomeTaxLiabilityNetMemberbap:UnrealizedGainDueToValuationOfInvestmentsAtFairValueThroughOtherComprehensiveIncomeMember2024-12-310001001290bap:DeferredIncomeTaxLiabilityNetMemberbap:UnrealizedGainDueToValuationOfInvestmentsAtFairValueThroughOtherComprehensiveIncomeMember2025-01-012025-12-310001001290bap:DeferredIncomeTaxLiabilityNetMemberbap:UnrealizedGainDueToValuationOfInvestmentsAtFairValueThroughOtherComprehensiveIncomeMember2024-01-012024-12-310001001290bap:DeferredIncomeTaxLiabilityNetMemberbap:DeferredAcquisitionsCostsMember2025-12-310001001290bap:DeferredIncomeTaxLiabilityNetMemberbap:DeferredAcquisitionsCostsMember2024-12-310001001290bap:DeferredIncomeTaxLiabilityNetMemberbap:DeferredAcquisitionsCostsMember2025-01-012025-12-310001001290bap:DeferredIncomeTaxLiabilityNetMemberbap:DeferredAcquisitionsCostsMember2024-01-012024-12-310001001290bap:DeferredIncomeTaxLiabilityNetMemberbap:GainGeneratedInTheReorganizationOfPacficoEPSMember2025-12-310001001290bap:DeferredIncomeTaxLiabilityNetMemberbap:GainGeneratedInTheReorganizationOfPacficoEPSMember2024-12-310001001290bap:DeferredIncomeTaxLiabilityNetMemberbap:GainGeneratedInTheReorganizationOfPacficoEPSMember2025-01-012025-12-310001001290bap:DeferredIncomeTaxLiabilityNetMemberbap:GainGeneratedInTheReorganizationOfPacficoEPSMember2024-01-012024-12-310001001290bap:DeferredIncomeTaxLiabilityNetMember2025-12-310001001290bap:DeferredIncomeTaxLiabilityNetMember2024-12-310001001290bap:DeferredIncomeTaxLiabilityNetMember2025-01-012025-12-310001001290bap:DeferredIncomeTaxLiabilityNetMember2024-01-012024-12-310001001290bap:GuaranteesAndStandbyLettersMember2025-12-310001001290bap:GuaranteesAndStandbyLettersMember2024-12-310001001290bap:ImportAndExportLettersOfCreditMember2025-12-310001001290bap:ImportAndExportLettersOfCreditMember2024-12-310001001290ifrs-full:PerformanceObligationsSatisfiedAtPointInTimeMember2025-01-012025-12-310001001290ifrs-full:PerformanceObligationsSatisfiedAtPointInTimeMember2024-01-012024-12-310001001290ifrs-full:PerformanceObligationsSatisfiedAtPointInTimeMember2023-01-012023-12-310001001290ifrs-full:PerformanceObligationsSatisfiedOverTimeMember2025-01-012025-12-310001001290ifrs-full:PerformanceObligationsSatisfiedOverTimeMember2024-01-012024-12-310001001290ifrs-full:PerformanceObligationsSatisfiedOverTimeMember2023-01-012023-12-310001001290ifrs-full:InsuranceContractsIssuedMemberbap:ContractsMeasuredUnderBuildingBlockApproachAndVariableFeeApproachMember2025-01-012025-12-310001001290ifrs-full:InsuranceContractsIssuedMemberbap:ContractsMeasuredUnderBuildingBlockApproachAndVariableFeeApproachMember2024-01-012024-12-310001001290ifrs-full:InsuranceContractsIssuedMemberbap:ContractsMeasuredUnderBuildingBlockApproachAndVariableFeeApproachMember2023-01-012023-12-310001001290ifrs-full:InsuranceContractsIssuedMemberbap:ContractsMeasuredUnderPremiumAllocationApproachMember2025-01-012025-12-310001001290ifrs-full:InsuranceContractsIssuedMemberbap:ContractsMeasuredUnderPremiumAllocationApproachMember2024-01-012024-12-310001001290ifrs-full:InsuranceContractsIssuedMemberbap:ContractsMeasuredUnderPremiumAllocationApproachMember2023-01-012023-12-310001001290ifrs-full:InsuranceContractsIssuedMember2023-01-012023-12-310001001290ifrs-full:ReinsuranceContractsHeldMember2023-01-012023-12-310001001290bap:InsuranceContractsToWhichBuildingBlockApproachAndVariableFeeApproachHasBeenAppliedMember2025-01-012025-12-310001001290bap:InsuranceContractsToWhichBuildingBlockApproachAndVariableFeeApproachHasBeenAppliedMember2024-01-012024-12-310001001290bap:InsuranceContractsToWhichBuildingBlockApproachAndVariableFeeApproachHasBeenAppliedMember2023-01-012023-12-310001001290ifrs-full:EstimatesOfPresentValueOfInsuranceAcquisitionCashFlowsMemberifrs-full:OnerousContractsProvisionMember2025-01-012025-12-310001001290ifrs-full:EstimatesOfPresentValueOfInsuranceAcquisitionCashFlowsMemberbap:NonOnerousContractsProvisionMember2025-01-012025-12-310001001290ifrs-full:EstimatesOfPresentValueOfInsuranceAcquisitionCashFlowsMemberbap:ContractsProvisionMember2025-01-012025-12-310001001290ifrs-full:EstimatesOfPresentValueOfFutureCashOutflowsOtherThanInsuranceAcquisitionCashFlowsMemberifrs-full:OnerousContractsProvisionMember2025-01-012025-12-310001001290ifrs-full:EstimatesOfPresentValueOfFutureCashOutflowsOtherThanInsuranceAcquisitionCashFlowsMemberbap:NonOnerousContractsProvisionMember2025-01-012025-12-310001001290ifrs-full:EstimatesOfPresentValueOfFutureCashOutflowsOtherThanInsuranceAcquisitionCashFlowsMemberbap:ContractsProvisionMember2025-01-012025-12-310001001290ifrs-full:EstimatesOfPresentValueOfFutureCashInflowsMemberifrs-full:OnerousContractsProvisionMember2025-01-012025-12-310001001290ifrs-full:EstimatesOfPresentValueOfFutureCashInflowsMemberbap:NonOnerousContractsProvisionMember2025-01-012025-12-310001001290ifrs-full:EstimatesOfPresentValueOfFutureCashInflowsMemberbap:ContractsProvisionMember2025-01-012025-12-310001001290ifrs-full:RiskAdjustmentForNonfinancialRiskMemberifrs-full:OnerousContractsProvisionMember2025-01-012025-12-310001001290ifrs-full:RiskAdjustmentForNonfinancialRiskMemberbap:NonOnerousContractsProvisionMember2025-01-012025-12-310001001290ifrs-full:RiskAdjustmentForNonfinancialRiskMemberbap:ContractsProvisionMember2025-01-012025-12-310001001290ifrs-full:ContractualServiceMarginMemberifrs-full:OnerousContractsProvisionMember2025-01-012025-12-310001001290ifrs-full:ContractualServiceMarginMemberbap:NonOnerousContractsProvisionMember2025-01-012025-12-310001001290ifrs-full:ContractualServiceMarginMemberbap:ContractsProvisionMember2025-01-012025-12-310001001290ifrs-full:OnerousContractsProvisionMember2025-01-012025-12-310001001290bap:NonOnerousContractsProvisionMember2025-01-012025-12-310001001290bap:ContractsProvisionMember2025-01-012025-12-310001001290ifrs-full:EstimatesOfPresentValueOfInsuranceAcquisitionCashFlowsMemberifrs-full:OnerousContractsProvisionMember2024-01-012024-12-310001001290ifrs-full:EstimatesOfPresentValueOfInsuranceAcquisitionCashFlowsMemberbap:NonOnerousContractsProvisionMember2024-01-012024-12-310001001290ifrs-full:EstimatesOfPresentValueOfInsuranceAcquisitionCashFlowsMemberbap:ContractsProvisionMember2024-01-012024-12-310001001290ifrs-full:EstimatesOfPresentValueOfFutureCashOutflowsOtherThanInsuranceAcquisitionCashFlowsMemberifrs-full:OnerousContractsProvisionMember2024-01-012024-12-310001001290ifrs-full:EstimatesOfPresentValueOfFutureCashOutflowsOtherThanInsuranceAcquisitionCashFlowsMemberbap:NonOnerousContractsProvisionMember2024-01-012024-12-310001001290ifrs-full:EstimatesOfPresentValueOfFutureCashOutflowsOtherThanInsuranceAcquisitionCashFlowsMemberbap:ContractsProvisionMember2024-01-012024-12-310001001290ifrs-full:EstimatesOfPresentValueOfFutureCashInflowsMemberifrs-full:OnerousContractsProvisionMember2024-01-012024-12-310001001290ifrs-full:EstimatesOfPresentValueOfFutureCashInflowsMemberbap:NonOnerousContractsProvisionMember2024-01-012024-12-310001001290ifrs-full:EstimatesOfPresentValueOfFutureCashInflowsMemberbap:ContractsProvisionMember2024-01-012024-12-310001001290ifrs-full:RiskAdjustmentForNonfinancialRiskMemberifrs-full:OnerousContractsProvisionMember2024-01-012024-12-310001001290ifrs-full:RiskAdjustmentForNonfinancialRiskMemberbap:NonOnerousContractsProvisionMember2024-01-012024-12-310001001290ifrs-full:RiskAdjustmentForNonfinancialRiskMemberbap:ContractsProvisionMember2024-01-012024-12-310001001290ifrs-full:ContractualServiceMarginMemberifrs-full:OnerousContractsProvisionMember2024-01-012024-12-310001001290ifrs-full:ContractualServiceMarginMemberbap:NonOnerousContractsProvisionMember2024-01-012024-12-310001001290ifrs-full:ContractualServiceMarginMemberbap:ContractsProvisionMember2024-01-012024-12-310001001290ifrs-full:OnerousContractsProvisionMember2024-01-012024-12-310001001290bap:NonOnerousContractsProvisionMember2024-01-012024-12-310001001290bap:ContractsProvisionMember2024-01-012024-12-310001001290ifrs-full:EstimatesOfPresentValueOfInsuranceAcquisitionCashFlowsMemberifrs-full:OnerousContractsProvisionMember2023-01-012023-12-310001001290ifrs-full:EstimatesOfPresentValueOfInsuranceAcquisitionCashFlowsMemberbap:NonOnerousContractsProvisionMember2023-01-012023-12-310001001290ifrs-full:EstimatesOfPresentValueOfInsuranceAcquisitionCashFlowsMemberbap:ContractsProvisionMember2023-01-012023-12-310001001290ifrs-full:EstimatesOfPresentValueOfFutureCashOutflowsOtherThanInsuranceAcquisitionCashFlowsMemberifrs-full:OnerousContractsProvisionMember2023-01-012023-12-310001001290ifrs-full:EstimatesOfPresentValueOfFutureCashOutflowsOtherThanInsuranceAcquisitionCashFlowsMemberbap:NonOnerousContractsProvisionMember2023-01-012023-12-310001001290ifrs-full:EstimatesOfPresentValueOfFutureCashOutflowsOtherThanInsuranceAcquisitionCashFlowsMemberbap:ContractsProvisionMember2023-01-012023-12-310001001290ifrs-full:EstimatesOfPresentValueOfFutureCashInflowsMemberifrs-full:OnerousContractsProvisionMember2023-01-012023-12-310001001290ifrs-full:EstimatesOfPresentValueOfFutureCashInflowsMemberbap:NonOnerousContractsProvisionMember2023-01-012023-12-310001001290ifrs-full:EstimatesOfPresentValueOfFutureCashInflowsMemberbap:ContractsProvisionMember2023-01-012023-12-310001001290ifrs-full:RiskAdjustmentForNonfinancialRiskMemberifrs-full:OnerousContractsProvisionMember2023-01-012023-12-310001001290ifrs-full:RiskAdjustmentForNonfinancialRiskMemberbap:NonOnerousContractsProvisionMember2023-01-012023-12-310001001290ifrs-full:RiskAdjustmentForNonfinancialRiskMemberbap:ContractsProvisionMember2023-01-012023-12-310001001290ifrs-full:ContractualServiceMarginMemberifrs-full:OnerousContractsProvisionMember2023-01-012023-12-310001001290ifrs-full:ContractualServiceMarginMemberbap:NonOnerousContractsProvisionMember2023-01-012023-12-310001001290ifrs-full:ContractualServiceMarginMemberbap:ContractsProvisionMember2023-01-012023-12-310001001290ifrs-full:OnerousContractsProvisionMember2023-01-012023-12-310001001290bap:NonOnerousContractsProvisionMember2023-01-012023-12-310001001290bap:ContractsProvisionMember2023-01-012023-12-310001001290ifrs-full:ContractualServiceMarginMemberifrs-full:NotLaterThanOneYearMember2025-12-310001001290ifrs-full:ContractualServiceMarginMemberifrs-full:NotLaterThanOneYearMember2024-12-310001001290ifrs-full:ContractualServiceMarginMemberifrs-full:NotLaterThanOneYearMember2023-12-310001001290ifrs-full:ContractualServiceMarginMemberifrs-full:LaterThanOneYearAndNotLaterThanTwoYearsMember2025-12-310001001290ifrs-full:ContractualServiceMarginMemberifrs-full:LaterThanOneYearAndNotLaterThanTwoYearsMember2024-12-310001001290ifrs-full:ContractualServiceMarginMemberifrs-full:LaterThanOneYearAndNotLaterThanTwoYearsMember2023-12-310001001290ifrs-full:ContractualServiceMarginMemberifrs-full:LaterThanTwoYearsAndNotLaterThanThreeYearsMember2025-12-310001001290ifrs-full:ContractualServiceMarginMemberifrs-full:LaterThanTwoYearsAndNotLaterThanThreeYearsMember2024-12-310001001290ifrs-full:ContractualServiceMarginMemberifrs-full:LaterThanTwoYearsAndNotLaterThanThreeYearsMember2023-12-310001001290ifrs-full:ContractualServiceMarginMemberifrs-full:LaterThanThreeYearsAndNotLaterThanFourYearsMember2025-12-310001001290ifrs-full:ContractualServiceMarginMemberifrs-full:LaterThanThreeYearsAndNotLaterThanFourYearsMember2024-12-310001001290ifrs-full:ContractualServiceMarginMemberifrs-full:LaterThanThreeYearsAndNotLaterThanFourYearsMember2023-12-310001001290ifrs-full:ContractualServiceMarginMemberifrs-full:LaterThanFourYearsAndNotLaterThanFiveYearsMember2025-12-310001001290ifrs-full:ContractualServiceMarginMemberifrs-full:LaterThanFourYearsAndNotLaterThanFiveYearsMember2024-12-310001001290ifrs-full:ContractualServiceMarginMemberifrs-full:LaterThanFourYearsAndNotLaterThanFiveYearsMember2023-12-310001001290ifrs-full:ContractualServiceMarginMemberifrs-full:LaterThanFiveYearsAndNotLaterThanTenYearsMember2025-12-310001001290ifrs-full:ContractualServiceMarginMemberifrs-full:LaterThanFiveYearsAndNotLaterThanTenYearsMember2024-12-310001001290ifrs-full:ContractualServiceMarginMemberifrs-full:LaterThanFiveYearsAndNotLaterThanTenYearsMember2023-12-310001001290ifrs-full:ContractualServiceMarginMemberifrs-full:LaterThanTenYearsMember2025-12-310001001290ifrs-full:ContractualServiceMarginMemberifrs-full:LaterThanTenYearsMember2024-12-310001001290ifrs-full:ContractualServiceMarginMemberifrs-full:LaterThanTenYearsMember2023-12-310001001290ifrs-full:ContractualServiceMarginMember2025-12-310001001290ifrs-full:ContractualServiceMarginMember2024-12-310001001290ifrs-full:ContractualServiceMarginMember2023-12-310001001290bap:ControlledMember2025-12-310001001290bap:ControlledMember2024-12-310001001290bap:ControlledMember2023-12-310001001290bap:ControlledSolesMember2025-12-310001001290bap:ControlledSolesMember2024-12-310001001290bap:ControlledSolesMember2023-12-310001001290bap:BalancedMember2025-12-310001001290bap:BalancedMember2024-12-310001001290bap:BalancedMember2023-12-310001001290bap:BalancedIIMember2025-12-310001001290bap:BalancedIIMember2024-12-310001001290bap:BalancedIIMember2023-12-310001001290bap:GlobalBalancedMember2025-12-310001001290bap:GlobalBalancedMember2024-12-310001001290bap:GlobalBalancedMember2023-12-310001001290bap:CapitalizedMember2025-12-310001001290bap:CapitalizedMember2024-12-310001001290bap:CapitalizedMember2023-12-310001001290bap:CapitalizedIIMember2025-12-310001001290bap:CapitalizedIIMember2024-12-310001001290bap:CapitalizedIIMember2023-12-310001001290bap:GlobalGrowthMember2025-12-310001001290bap:GlobalGrowthMember2024-12-310001001290bap:GlobalGrowthMember2023-12-310001001290bap:ILControlledIIMember2025-12-310001001290bap:ILControlledIIMember2024-12-310001001290bap:ILControlledIIMember2023-12-310001001290bap:SustainableCapitalizationMember2025-12-310001001290bap:SustainableCapitalizationMember2024-12-310001001290bap:SustainableCapitalizationMember2023-12-310001001290ifrs-full:ContractualServiceMarginMember2022-12-310001001290ifrs-full:ContractualServiceMarginMember2025-01-012025-12-310001001290ifrs-full:ContractualServiceMarginMember2024-01-012024-12-310001001290ifrs-full:ContractualServiceMarginMember2023-01-012023-12-310001001290ifrs-full:OperatingSegmentsMemberbap:UniversalBankingBancoDeCreditoDelPeruMemberbap:UniversalBankingMember2025-01-012025-12-310001001290ifrs-full:OperatingSegmentsMemberbap:UniversalBankingBancoDeCreditoDelPeruMemberbap:UniversalBankingMember2025-12-310001001290ifrs-full:OperatingSegmentsMemberbap:UniversalBankingBancoDeCreditoDeBoliviaMemberbap:UniversalBankingMember2025-01-012025-12-310001001290ifrs-full:OperatingSegmentsMemberbap:UniversalBankingBancoDeCreditoDeBoliviaMemberbap:UniversalBankingMember2025-12-310001001290bap:UniversalBankingMember2025-01-012025-12-310001001290bap:UniversalBankingMember2025-12-310001001290ifrs-full:OperatingSegmentsMemberbap:InsuranceAndPensionFundsPacificoSegurosAndSubsidiariesMemberbap:InsuranceAndPensionFundsMember2025-01-012025-12-310001001290ifrs-full:OperatingSegmentsMemberbap:InsuranceAndPensionFundsPacificoSegurosAndSubsidiariesMemberbap:InsuranceAndPensionFundsMember2025-12-310001001290ifrs-full:OperatingSegmentsMemberbap:InsurancePensionFundsPrimaAFPMemberbap:InsuranceAndPensionFundsMember2025-01-012025-12-310001001290ifrs-full:OperatingSegmentsMemberbap:InsurancePensionFundsPrimaAFPMemberbap:InsuranceAndPensionFundsMember2025-12-310001001290bap:InsuranceAndPensionFundsMember2025-01-012025-12-310001001290bap:InsuranceAndPensionFundsMember2025-12-310001001290ifrs-full:OperatingSegmentsMemberbap:MicrofinanceMibancoMemberbap:MicrofinanceMember2025-01-012025-12-310001001290ifrs-full:OperatingSegmentsMemberbap:MicrofinanceMibancoMemberbap:MicrofinanceMember2025-12-310001001290ifrs-full:OperatingSegmentsMemberbap:MicrofinanceMibancoColombiaMemberbap:MicrofinanceMember2025-01-012025-12-310001001290ifrs-full:OperatingSegmentsMemberbap:MicrofinanceMibancoColombiaMemberbap:MicrofinanceMember2025-12-310001001290bap:MicrofinanceMember2025-01-012025-12-310001001290bap:MicrofinanceMember2025-12-310001001290bap:InvestmentManagementAndAdvisoryMemberifrs-full:OperatingSegmentsMember2025-01-012025-12-310001001290bap:InvestmentManagementAndAdvisoryMemberifrs-full:OperatingSegmentsMember2025-12-310001001290ifrs-full:AllOtherSegmentsMemberifrs-full:OperatingSegmentsMember2025-01-012025-12-310001001290ifrs-full:AllOtherSegmentsMemberifrs-full:OperatingSegmentsMember2025-12-310001001290ifrs-full:EliminationOfIntersegmentAmountsMember2025-01-012025-12-310001001290ifrs-full:EliminationOfIntersegmentAmountsMember2025-12-310001001290ifrs-full:OperatingSegmentsMemberbap:UniversalBankingBancoDeCreditoDelPeruMemberbap:UniversalBankingMember2024-01-012024-12-310001001290ifrs-full:OperatingSegmentsMemberbap:UniversalBankingBancoDeCreditoDelPeruMemberbap:UniversalBankingMember2024-12-310001001290ifrs-full:OperatingSegmentsMemberbap:UniversalBankingBancoDeCreditoDeBoliviaMemberbap:UniversalBankingMember2024-01-012024-12-310001001290ifrs-full:OperatingSegmentsMemberbap:UniversalBankingBancoDeCreditoDeBoliviaMemberbap:UniversalBankingMember2024-12-310001001290bap:UniversalBankingMember2024-01-012024-12-310001001290bap:UniversalBankingMember2024-12-310001001290ifrs-full:OperatingSegmentsMemberbap:InsuranceAndPensionFundsPacificoSegurosAndSubsidiariesMemberbap:InsuranceAndPensionFundsMember2024-01-012024-12-310001001290ifrs-full:OperatingSegmentsMemberbap:InsuranceAndPensionFundsPacificoSegurosAndSubsidiariesMemberbap:InsuranceAndPensionFundsMember2024-12-310001001290ifrs-full:OperatingSegmentsMemberbap:InsurancePensionFundsPrimaAFPMemberbap:InsuranceAndPensionFundsMember2024-01-012024-12-310001001290ifrs-full:OperatingSegmentsMemberbap:InsurancePensionFundsPrimaAFPMemberbap:InsuranceAndPensionFundsMember2024-12-310001001290bap:InsuranceAndPensionFundsMember2024-01-012024-12-310001001290bap:InsuranceAndPensionFundsMember2024-12-310001001290ifrs-full:OperatingSegmentsMemberbap:MicrofinanceMibancoMemberbap:MicrofinanceMember2024-01-012024-12-310001001290ifrs-full:OperatingSegmentsMemberbap:MicrofinanceMibancoMemberbap:MicrofinanceMember2024-12-310001001290ifrs-full:OperatingSegmentsMemberbap:MicrofinanceMibancoColombiaMemberbap:MicrofinanceMember2024-01-012024-12-310001001290ifrs-full:OperatingSegmentsMemberbap:MicrofinanceMibancoColombiaMemberbap:MicrofinanceMember2024-12-310001001290bap:MicrofinanceMember2024-01-012024-12-310001001290bap:MicrofinanceMember2024-12-310001001290bap:InvestmentManagementAndAdvisoryMemberifrs-full:OperatingSegmentsMember2024-01-012024-12-310001001290bap:InvestmentManagementAndAdvisoryMemberifrs-full:OperatingSegmentsMember2024-12-310001001290ifrs-full:AllOtherSegmentsMemberifrs-full:OperatingSegmentsMember2024-01-012024-12-310001001290ifrs-full:AllOtherSegmentsMemberifrs-full:OperatingSegmentsMember2024-12-310001001290ifrs-full:EliminationOfIntersegmentAmountsMember2024-01-012024-12-310001001290ifrs-full:EliminationOfIntersegmentAmountsMember2024-12-310001001290ifrs-full:OperatingSegmentsMemberbap:UniversalBankingBancoDeCreditoDelPeruMemberbap:UniversalBankingMember2023-01-012023-12-310001001290ifrs-full:OperatingSegmentsMemberbap:UniversalBankingBancoDeCreditoDelPeruMemberbap:UniversalBankingMember2023-12-310001001290ifrs-full:OperatingSegmentsMemberbap:UniversalBankingBancoDeCreditoDeBoliviaMemberbap:UniversalBankingMember2023-01-012023-12-310001001290ifrs-full:OperatingSegmentsMemberbap:UniversalBankingBancoDeCreditoDeBoliviaMemberbap:UniversalBankingMember2023-12-310001001290bap:UniversalBankingMember2023-01-012023-12-310001001290bap:UniversalBankingMember2023-12-310001001290bap:UniversalBankingMemberifrs-full:OperatingSegmentsMember2023-12-310001001290ifrs-full:OperatingSegmentsMemberbap:InsuranceAndPensionFundsPacificoSegurosAndSubsidiariesMemberbap:InsuranceAndPensionFundsMember2023-01-012023-12-310001001290ifrs-full:OperatingSegmentsMemberbap:InsuranceAndPensionFundsPacificoSegurosAndSubsidiariesMemberbap:InsuranceAndPensionFundsMember2023-12-310001001290ifrs-full:OperatingSegmentsMemberbap:InsurancePensionFundsPrimaAFPMemberbap:InsuranceAndPensionFundsMember2023-01-012023-12-310001001290ifrs-full:OperatingSegmentsMemberbap:InsurancePensionFundsPrimaAFPMemberbap:InsuranceAndPensionFundsMember2023-12-310001001290bap:InsuranceAndPensionFundsMember2023-01-012023-12-310001001290bap:InsuranceAndPensionFundsMember2023-12-310001001290bap:InsuranceAndPensionFundsMemberifrs-full:OperatingSegmentsMember2023-12-310001001290ifrs-full:OperatingSegmentsMemberbap:MicrofinanceMibancoMemberbap:MicrofinanceMember2023-01-012023-12-310001001290ifrs-full:OperatingSegmentsMemberbap:MicrofinanceMibancoMemberbap:MicrofinanceMember2023-12-310001001290ifrs-full:OperatingSegmentsMemberbap:MicrofinanceMibancoColombiaMemberbap:MicrofinanceMember2023-01-012023-12-310001001290ifrs-full:OperatingSegmentsMemberbap:MicrofinanceMibancoColombiaMemberbap:MicrofinanceMember2023-12-310001001290bap:MicrofinanceMember2023-01-012023-12-310001001290bap:MicrofinanceMember2023-12-310001001290bap:MicrofinanceMemberifrs-full:OperatingSegmentsMember2023-12-310001001290bap:InvestmentManagementAndAdvisoryMemberifrs-full:OperatingSegmentsMember2023-01-012023-12-310001001290bap:InvestmentManagementAndAdvisoryMemberifrs-full:OperatingSegmentsMember2023-12-310001001290ifrs-full:AllOtherSegmentsMemberifrs-full:OperatingSegmentsMember2023-01-012023-12-310001001290ifrs-full:AllOtherSegmentsMemberifrs-full:OperatingSegmentsMember2023-12-310001001290ifrs-full:EliminationOfIntersegmentAmountsMember2023-01-012023-12-310001001290ifrs-full:EliminationOfIntersegmentAmountsMember2023-12-310001001290country:PE2023-12-310001001290country:BM2025-01-012025-12-310001001290country:BM2025-12-310001001290country:BM2024-01-012024-12-310001001290country:BM2024-12-310001001290country:BM2023-01-012023-12-310001001290country:BM2023-12-310001001290country:CO2025-12-310001001290country:CO2024-12-310001001290country:CO2023-12-310001001290country:BO2025-12-310001001290country:BO2024-12-310001001290country:BO2023-12-310001001290country:PA2025-01-012025-12-310001001290country:PA2025-12-310001001290country:PA2024-01-012024-12-310001001290country:PA2024-12-310001001290country:PA2023-01-012023-12-310001001290country:PA2023-12-310001001290country:CL2025-12-310001001290country:CL2024-01-012024-12-310001001290country:CL2024-12-310001001290country:CL2023-01-012023-12-310001001290country:CL2023-12-310001001290country:US2025-12-310001001290country:US2024-12-310001001290country:US2023-01-012023-12-310001001290country:US2023-12-310001001290country:KY2025-01-012025-12-310001001290country:KY2025-12-310001001290country:KY2024-01-012024-12-310001001290country:KY2024-12-310001001290country:KY2023-01-012023-12-310001001290country:KY2023-12-310001001290bap:OtherCountriesAdjustmentsAndEliminationsMember2025-01-012025-12-310001001290bap:OtherCountriesAdjustmentsAndEliminationsMember2025-12-310001001290bap:OtherCountriesAdjustmentsAndEliminationsMember2024-01-012024-12-310001001290bap:OtherCountriesAdjustmentsAndEliminationsMember2024-12-310001001290bap:OtherCountriesAdjustmentsAndEliminationsMember2023-01-012023-12-310001001290bap:OtherCountriesAdjustmentsAndEliminationsMember2023-12-310001001290bap:AlicorpSAAMemberifrs-full:DebtSecuritiesMember2025-12-310001001290bap:PluzEnergiaS.A.A.Memberifrs-full:DebtSecuritiesMember2025-12-310001001290bap:CorporacionPrimaxMemberifrs-full:EquityInvestmentsMember2025-12-310001001290bap:CementosPacasmayoS.aMemberifrs-full:EquityInvestmentsMember2025-12-310001001290bap:AlicorpSAAMemberifrs-full:DebtSecuritiesMember2024-12-310001001290bap:CementosPacasmayoS.aMemberifrs-full:EquityInvestmentsMember2024-12-310001001290bap:InversionesCentenarioMemberifrs-full:EquityInvestmentsMember2024-12-310001001290bap:SolesAverageInterestRateMember2025-12-310001001290bap:CurrencyAverageInterestRateForeignMember2025-12-310001001290bap:SolesAverageInterestRateMember2024-12-310001001290bap:CurrencyAverageInterestRateForeignMember2024-12-310001001290bap:EmployeesDirectorsKeyManagementAndFamilyMembersMember2025-12-310001001290bap:EmployeesDirectorsKeyManagementAndFamilyMembersMember2024-12-310001001290bap:DirectorsCompensationMember2025-01-012025-12-310001001290bap:DirectorsCompensationMember2024-01-012024-12-310001001290bap:RemunerationsMember2025-01-012025-12-310001001290bap:RemunerationsMember2024-01-012024-12-310001001290bap:StockAwardsMember2025-01-012025-12-310001001290bap:StockAwardsMember2024-01-012024-12-310001001290bap:BolivianosMember2025-12-310001001290bap:BolivianosMember2024-12-310001001290bap:ColombianPesosMember2025-12-310001001290bap:ColombianPesosMember2024-12-310001001290bap:ChileanPesosMember2025-12-310001001290bap:ChileanPesosMember2024-12-310001001290ifrs-full:FinancialAssetsAtFairValueThroughProfitOrLossCategoryMemberbap:FinancialAssetsAtFairValueInvestmentsAndDerivatesMember2025-12-310001001290ifrs-full:FinancialAssetsAtFairValueThroughProfitOrLossCategoryMemberbap:FinancialAssetsAtFairValueInvestmentsDesignatedAtInceptionMember2025-12-310001001290ifrs-full:FinancialAssetsAtFairValueThroughOtherComprehensiveIncomeCategoryMemberbap:FinancialAssetsAtFairValueInvestmentsMember2025-12-310001001290ifrs-full:FinancialAssetsAtFairValueThroughOtherComprehensiveIncomeCategoryMemberbap:FinancialAssetsAtFairValueInvestmentsDesignatedAtInceptionMember2025-12-310001001290bap:CategoriesOfFinancialAssetsMember2025-12-310001001290ifrs-full:FinancialAssetsAtFairValueThroughProfitOrLossCategoryMemberbap:FinancialAssetsAtFairValueInvestmentsAndDerivatesMember2024-12-310001001290ifrs-full:FinancialAssetsAtFairValueThroughProfitOrLossCategoryMemberbap:FinancialAssetsAtFairValueInvestmentsDesignatedAtInceptionMember2024-12-310001001290ifrs-full:FinancialAssetsAtFairValueThroughOtherComprehensiveIncomeCategoryMemberbap:FinancialAssetsAtFairValueInvestmentsMember2024-12-310001001290ifrs-full:FinancialAssetsAtFairValueThroughOtherComprehensiveIncomeCategoryMemberbap:FinancialAssetsAtFairValueInvestmentsDesignatedAtInceptionMember2024-12-310001001290bap:CategoriesOfFinancialAssetsMember2024-12-310001001290ifrs-full:FinancialLiabilitiesAtFairValueThroughProfitOrLossCategoryMemberbap:FinancialLiabilitiesAtFairValueInvestmentsAndDerivatesMember2025-12-310001001290ifrs-full:FinancialLiabilitiesAtFairValueThroughProfitOrLossCategoryMemberbap:FinancialLiabilitiesAtFairValueInvestmentsDesignatedAtInceptionMember2025-12-310001001290ifrs-full:FinancialLiabilitiesAtAmortisedCostCategoryMember2025-12-310001001290bap:CategoriesOfFinancialLiabilitiesMember2025-12-310001001290ifrs-full:FinancialLiabilitiesAtFairValueThroughProfitOrLossCategoryMemberbap:FinancialLiabilitiesAtFairValueInvestmentsAndDerivatesMember2024-12-310001001290ifrs-full:FinancialLiabilitiesAtFairValueThroughProfitOrLossCategoryMemberbap:FinancialLiabilitiesAtFairValueInvestmentsDesignatedAtInceptionMember2024-12-310001001290ifrs-full:FinancialLiabilitiesAtAmortisedCostCategoryMember2024-12-310001001290bap:CategoriesOfFinancialLiabilitiesMember2024-12-310001001290ifrs-full:FinancialAssetsNeitherPastDueNorImpairedMemberbap:StageOneMemberbap:CommercialLoansMember2025-12-310001001290ifrs-full:FinancialAssetsNeitherPastDueNorImpairedMemberbap:StageTwoMemberbap:CommercialLoansMember2025-12-310001001290ifrs-full:FinancialAssetsNeitherPastDueNorImpairedMemberbap:StageThreeMemberbap:CommercialLoansMember2025-12-310001001290bap:CommercialLoansMemberifrs-full:FinancialAssetsNeitherPastDueNorImpairedMember2025-12-310001001290ifrs-full:FinancialAssetsNeitherPastDueNorImpairedMemberbap:StageOneMemberbap:CommercialLoansMember2024-12-310001001290ifrs-full:FinancialAssetsNeitherPastDueNorImpairedMemberbap:StageTwoMemberbap:CommercialLoansMember2024-12-310001001290ifrs-full:FinancialAssetsNeitherPastDueNorImpairedMemberbap:StageThreeMemberbap:CommercialLoansMember2024-12-310001001290bap:CommercialLoansMemberifrs-full:FinancialAssetsNeitherPastDueNorImpairedMember2024-12-310001001290ifrs-full:FinancialAssetsPastDueButNotImpairedMemberbap:StageOneMemberbap:CommercialLoansMember2025-12-310001001290ifrs-full:FinancialAssetsPastDueButNotImpairedMemberbap:StageTwoMemberbap:CommercialLoansMember2025-12-310001001290ifrs-full:FinancialAssetsPastDueButNotImpairedMemberbap:StageThreeMemberbap:CommercialLoansMember2025-12-310001001290bap:CommercialLoansMemberifrs-full:FinancialAssetsPastDueButNotImpairedMember2025-12-310001001290ifrs-full:FinancialAssetsPastDueButNotImpairedMemberbap:StageOneMemberbap:CommercialLoansMember2024-12-310001001290ifrs-full:FinancialAssetsPastDueButNotImpairedMemberbap:StageTwoMemberbap:CommercialLoansMember2024-12-310001001290ifrs-full:FinancialAssetsPastDueButNotImpairedMemberbap:StageThreeMemberbap:CommercialLoansMember2024-12-310001001290bap:CommercialLoansMemberifrs-full:FinancialAssetsPastDueButNotImpairedMember2024-12-310001001290ifrs-full:FinancialAssetsImpairedMemberbap:StageOneMemberbap:CommercialLoansMember2025-12-310001001290ifrs-full:FinancialAssetsImpairedMemberbap:StageTwoMemberbap:CommercialLoansMember2025-12-310001001290ifrs-full:FinancialAssetsImpairedMemberbap:StageThreeMemberbap:CommercialLoansMember2025-12-310001001290bap:CommercialLoansMemberifrs-full:FinancialAssetsImpairedMember2025-12-310001001290ifrs-full:FinancialAssetsImpairedMemberbap:StageOneMemberbap:CommercialLoansMember2024-12-310001001290ifrs-full:FinancialAssetsImpairedMemberbap:StageTwoMemberbap:CommercialLoansMember2024-12-310001001290ifrs-full:FinancialAssetsImpairedMemberbap:StageThreeMemberbap:CommercialLoansMember2024-12-310001001290bap:CommercialLoansMemberifrs-full:FinancialAssetsImpairedMember2024-12-310001001290bap:CommercialLoansMemberbap:StageOneMember2025-12-310001001290bap:CommercialLoansMemberbap:StageTwoMember2025-12-310001001290bap:CommercialLoansMemberbap:StageThreeMember2025-12-310001001290bap:CommercialLoansMember2025-12-310001001290bap:CommercialLoansMemberbap:StageOneMember2024-12-310001001290bap:CommercialLoansMemberbap:StageTwoMember2024-12-310001001290bap:CommercialLoansMemberbap:StageThreeMember2024-12-310001001290bap:CommercialLoansMember2024-12-310001001290ifrs-full:FinancialAssetsNeitherPastDueNorImpairedMemberbap:StageOneMemberifrs-full:MortgagesMember2025-12-310001001290ifrs-full:FinancialAssetsNeitherPastDueNorImpairedMemberbap:StageTwoMemberifrs-full:MortgagesMember2025-12-310001001290ifrs-full:FinancialAssetsNeitherPastDueNorImpairedMemberbap:StageThreeMemberifrs-full:MortgagesMember2025-12-310001001290ifrs-full:MortgagesMemberifrs-full:FinancialAssetsNeitherPastDueNorImpairedMember2025-12-310001001290ifrs-full:FinancialAssetsNeitherPastDueNorImpairedMemberbap:StageOneMemberifrs-full:MortgagesMember2024-12-310001001290ifrs-full:FinancialAssetsNeitherPastDueNorImpairedMemberbap:StageTwoMemberifrs-full:MortgagesMember2024-12-310001001290ifrs-full:FinancialAssetsNeitherPastDueNorImpairedMemberbap:StageThreeMemberifrs-full:MortgagesMember2024-12-310001001290ifrs-full:MortgagesMemberifrs-full:FinancialAssetsNeitherPastDueNorImpairedMember2024-12-310001001290ifrs-full:FinancialAssetsPastDueButNotImpairedMemberbap:StageOneMemberifrs-full:MortgagesMember2025-12-310001001290ifrs-full:FinancialAssetsPastDueButNotImpairedMemberbap:StageTwoMemberifrs-full:MortgagesMember2025-12-310001001290ifrs-full:FinancialAssetsPastDueButNotImpairedMemberbap:StageThreeMemberifrs-full:MortgagesMember2025-12-310001001290ifrs-full:MortgagesMemberifrs-full:FinancialAssetsPastDueButNotImpairedMember2025-12-310001001290ifrs-full:FinancialAssetsPastDueButNotImpairedMemberbap:StageOneMemberifrs-full:MortgagesMember2024-12-310001001290ifrs-full:FinancialAssetsPastDueButNotImpairedMemberbap:StageTwoMemberifrs-full:MortgagesMember2024-12-310001001290ifrs-full:FinancialAssetsPastDueButNotImpairedMemberbap:StageThreeMemberifrs-full:MortgagesMember2024-12-310001001290ifrs-full:MortgagesMemberifrs-full:FinancialAssetsPastDueButNotImpairedMember2024-12-310001001290ifrs-full:FinancialAssetsImpairedMemberbap:StageOneMemberifrs-full:MortgagesMember2025-12-310001001290ifrs-full:FinancialAssetsImpairedMemberbap:StageTwoMemberifrs-full:MortgagesMember2025-12-310001001290ifrs-full:FinancialAssetsImpairedMemberbap:StageThreeMemberifrs-full:MortgagesMember2025-12-310001001290ifrs-full:MortgagesMemberifrs-full:FinancialAssetsImpairedMember2025-12-310001001290ifrs-full:FinancialAssetsImpairedMemberbap:StageOneMemberifrs-full:MortgagesMember2024-12-310001001290ifrs-full:FinancialAssetsImpairedMemberbap:StageTwoMemberifrs-full:MortgagesMember2024-12-310001001290ifrs-full:FinancialAssetsImpairedMemberbap:StageThreeMemberifrs-full:MortgagesMember2024-12-310001001290ifrs-full:MortgagesMemberifrs-full:FinancialAssetsImpairedMember2024-12-310001001290ifrs-full:MortgagesMemberbap:StageOneMember2025-12-310001001290ifrs-full:MortgagesMemberbap:StageTwoMember2025-12-310001001290ifrs-full:MortgagesMemberbap:StageThreeMember2025-12-310001001290ifrs-full:MortgagesMember2025-12-310001001290ifrs-full:MortgagesMemberbap:StageOneMember2024-12-310001001290ifrs-full:MortgagesMemberbap:StageTwoMember2024-12-310001001290ifrs-full:MortgagesMemberbap:StageThreeMember2024-12-310001001290ifrs-full:MortgagesMember2024-12-310001001290ifrs-full:FinancialAssetsNeitherPastDueNorImpairedMemberbap:StageOneMemberbap:SmallAndMicroBusinessLoansMember2025-12-310001001290ifrs-full:FinancialAssetsNeitherPastDueNorImpairedMemberbap:StageTwoMemberbap:SmallAndMicroBusinessLoansMember2025-12-310001001290ifrs-full:FinancialAssetsNeitherPastDueNorImpairedMemberbap:StageThreeMemberbap:SmallAndMicroBusinessLoansMember2025-12-310001001290bap:SmallAndMicroBusinessLoansMemberifrs-full:FinancialAssetsNeitherPastDueNorImpairedMember2025-12-310001001290ifrs-full:FinancialAssetsNeitherPastDueNorImpairedMemberbap:StageOneMemberbap:SmallAndMicroBusinessLoansMember2024-12-310001001290ifrs-full:FinancialAssetsNeitherPastDueNorImpairedMemberbap:StageTwoMemberbap:SmallAndMicroBusinessLoansMember2024-12-310001001290ifrs-full:FinancialAssetsNeitherPastDueNorImpairedMemberbap:StageThreeMemberbap:SmallAndMicroBusinessLoansMember2024-12-310001001290bap:SmallAndMicroBusinessLoansMemberifrs-full:FinancialAssetsNeitherPastDueNorImpairedMember2024-12-310001001290ifrs-full:FinancialAssetsPastDueButNotImpairedMemberbap:StageOneMemberbap:SmallAndMicroBusinessLoansMember2025-12-310001001290ifrs-full:FinancialAssetsPastDueButNotImpairedMemberbap:StageTwoMemberbap:SmallAndMicroBusinessLoansMember2025-12-310001001290ifrs-full:FinancialAssetsPastDueButNotImpairedMemberbap:StageThreeMemberbap:SmallAndMicroBusinessLoansMember2025-12-310001001290bap:SmallAndMicroBusinessLoansMemberifrs-full:FinancialAssetsPastDueButNotImpairedMember2025-12-310001001290ifrs-full:FinancialAssetsPastDueButNotImpairedMemberbap:StageOneMemberbap:SmallAndMicroBusinessLoansMember2024-12-310001001290ifrs-full:FinancialAssetsPastDueButNotImpairedMemberbap:StageTwoMemberbap:SmallAndMicroBusinessLoansMember2024-12-310001001290ifrs-full:FinancialAssetsPastDueButNotImpairedMemberbap:StageThreeMemberbap:SmallAndMicroBusinessLoansMember2024-12-310001001290bap:SmallAndMicroBusinessLoansMemberifrs-full:FinancialAssetsPastDueButNotImpairedMember2024-12-310001001290ifrs-full:FinancialAssetsImpairedMemberbap:StageOneMemberbap:SmallAndMicroBusinessLoansMember2025-12-310001001290ifrs-full:FinancialAssetsImpairedMemberbap:StageTwoMemberbap:SmallAndMicroBusinessLoansMember2025-12-310001001290ifrs-full:FinancialAssetsImpairedMemberbap:StageThreeMemberbap:SmallAndMicroBusinessLoansMember2025-12-310001001290bap:SmallAndMicroBusinessLoansMemberifrs-full:FinancialAssetsImpairedMember2025-12-310001001290ifrs-full:FinancialAssetsImpairedMemberbap:StageOneMemberbap:SmallAndMicroBusinessLoansMember2024-12-310001001290ifrs-full:FinancialAssetsImpairedMemberbap:StageTwoMemberbap:SmallAndMicroBusinessLoansMember2024-12-310001001290ifrs-full:FinancialAssetsImpairedMemberbap:StageThreeMemberbap:SmallAndMicroBusinessLoansMember2024-12-310001001290bap:SmallAndMicroBusinessLoansMemberifrs-full:FinancialAssetsImpairedMember2024-12-310001001290bap:SmallAndMicroBusinessLoansMemberbap:StageOneMember2025-12-310001001290bap:SmallAndMicroBusinessLoansMemberbap:StageTwoMember2025-12-310001001290bap:SmallAndMicroBusinessLoansMemberbap:StageThreeMember2025-12-310001001290bap:SmallAndMicroBusinessLoansMember2025-12-310001001290bap:SmallAndMicroBusinessLoansMemberbap:StageOneMember2024-12-310001001290bap:SmallAndMicroBusinessLoansMemberbap:StageTwoMember2024-12-310001001290bap:SmallAndMicroBusinessLoansMemberbap:StageThreeMember2024-12-310001001290bap:SmallAndMicroBusinessLoansMember2024-12-310001001290ifrs-full:FinancialAssetsNeitherPastDueNorImpairedMemberbap:StageOneMemberifrs-full:ConsumerLoansMember2025-12-310001001290ifrs-full:FinancialAssetsNeitherPastDueNorImpairedMemberbap:StageTwoMemberifrs-full:ConsumerLoansMember2025-12-310001001290ifrs-full:FinancialAssetsNeitherPastDueNorImpairedMemberbap:StageThreeMemberifrs-full:ConsumerLoansMember2025-12-310001001290ifrs-full:ConsumerLoansMemberifrs-full:FinancialAssetsNeitherPastDueNorImpairedMember2025-12-310001001290ifrs-full:FinancialAssetsNeitherPastDueNorImpairedMemberbap:StageOneMemberifrs-full:ConsumerLoansMember2024-12-310001001290ifrs-full:FinancialAssetsNeitherPastDueNorImpairedMemberbap:StageTwoMemberifrs-full:ConsumerLoansMember2024-12-310001001290ifrs-full:FinancialAssetsNeitherPastDueNorImpairedMemberbap:StageThreeMemberifrs-full:ConsumerLoansMember2024-12-310001001290ifrs-full:ConsumerLoansMemberifrs-full:FinancialAssetsNeitherPastDueNorImpairedMember2024-12-310001001290ifrs-full:FinancialAssetsPastDueButNotImpairedMemberbap:StageOneMemberifrs-full:ConsumerLoansMember2025-12-310001001290ifrs-full:FinancialAssetsPastDueButNotImpairedMemberbap:StageTwoMemberifrs-full:ConsumerLoansMember2025-12-310001001290ifrs-full:FinancialAssetsPastDueButNotImpairedMemberbap:StageThreeMemberifrs-full:ConsumerLoansMember2025-12-310001001290ifrs-full:ConsumerLoansMemberifrs-full:FinancialAssetsPastDueButNotImpairedMember2025-12-310001001290ifrs-full:FinancialAssetsPastDueButNotImpairedMemberbap:StageOneMemberifrs-full:ConsumerLoansMember2024-12-310001001290ifrs-full:FinancialAssetsPastDueButNotImpairedMemberbap:StageTwoMemberifrs-full:ConsumerLoansMember2024-12-310001001290ifrs-full:FinancialAssetsPastDueButNotImpairedMemberbap:StageThreeMemberifrs-full:ConsumerLoansMember2024-12-310001001290ifrs-full:ConsumerLoansMemberifrs-full:FinancialAssetsPastDueButNotImpairedMember2024-12-310001001290ifrs-full:FinancialAssetsImpairedMemberbap:StageOneMemberifrs-full:ConsumerLoansMember2025-12-310001001290ifrs-full:FinancialAssetsImpairedMemberbap:StageTwoMemberifrs-full:ConsumerLoansMember2025-12-310001001290ifrs-full:FinancialAssetsImpairedMemberbap:StageThreeMemberifrs-full:ConsumerLoansMember2025-12-310001001290ifrs-full:ConsumerLoansMemberifrs-full:FinancialAssetsImpairedMember2025-12-310001001290ifrs-full:FinancialAssetsImpairedMemberbap:StageOneMemberifrs-full:ConsumerLoansMember2024-12-310001001290ifrs-full:FinancialAssetsImpairedMemberbap:StageTwoMemberifrs-full:ConsumerLoansMember2024-12-310001001290ifrs-full:FinancialAssetsImpairedMemberbap:StageThreeMemberifrs-full:ConsumerLoansMember2024-12-310001001290ifrs-full:ConsumerLoansMemberifrs-full:FinancialAssetsImpairedMember2024-12-310001001290ifrs-full:ConsumerLoansMemberbap:StageOneMember2025-12-310001001290ifrs-full:ConsumerLoansMemberbap:StageTwoMember2025-12-310001001290ifrs-full:ConsumerLoansMemberbap:StageThreeMember2025-12-310001001290ifrs-full:ConsumerLoansMember2025-12-310001001290ifrs-full:ConsumerLoansMemberbap:StageOneMember2024-12-310001001290ifrs-full:ConsumerLoansMemberbap:StageTwoMember2024-12-310001001290ifrs-full:ConsumerLoansMemberbap:StageThreeMember2024-12-310001001290ifrs-full:ConsumerLoansMember2024-12-310001001290bap:StageOneMember2025-12-310001001290bap:StageTwoMember2025-12-310001001290bap:StageThreeMember2025-12-310001001290bap:StageOneMember2024-12-310001001290bap:StageTwoMember2024-12-310001001290bap:StageThreeMember2024-12-310001001290bap:RefinancedLoansAndAllowanceForLoanLossesMemberbap:StageOneMember2025-12-310001001290bap:RefinancedLoansAndAllowanceForLoanLossesMemberbap:StageOneMember2024-12-310001001290bap:RefinancedLoansAndAllowanceForLoanLossesMemberbap:StageTwoMember2025-12-310001001290bap:RefinancedLoansAndAllowanceForLoanLossesMemberbap:StageTwoMember2024-12-310001001290bap:RefinancedLoansAndAllowanceForLoanLossesMemberbap:StageThreeMember2025-12-310001001290bap:RefinancedLoansAndAllowanceForLoanLossesMemberbap:StageThreeMember2024-12-310001001290bap:RefinancedLoansAndAllowanceForLoanLossesMember2025-12-310001001290bap:RefinancedLoansAndAllowanceForLoanLossesMember2024-12-310001001290bap:RenegotiatedLoansAndAllowancesForLoanLossesMemberbap:StageOneMember2025-12-310001001290bap:RenegotiatedLoansAndAllowancesForLoanLossesMemberbap:StageOneMember2024-12-310001001290bap:RenegotiatedLoansAndAllowancesForLoanLossesMemberbap:StageTwoMember2025-12-310001001290bap:RenegotiatedLoansAndAllowancesForLoanLossesMemberbap:StageTwoMember2024-12-310001001290bap:RenegotiatedLoansAndAllowancesForLoanLossesMemberbap:StageThreeMember2025-12-310001001290bap:RenegotiatedLoansAndAllowancesForLoanLossesMemberbap:StageThreeMember2024-12-310001001290bap:RenegotiatedLoansAndAllowancesForLoanLossesMember2025-12-310001001290bap:RenegotiatedLoansAndAllowancesForLoanLossesMember2024-12-310001001290ifrs-full:FinancialAssetsImpairedMember2025-12-310001001290ifrs-full:FinancialAssetsImpairedMember2024-12-310001001290ifrs-full:FinancialAssetsNeitherPastDueNorImpairedMember2025-12-310001001290ifrs-full:FinancialAssetsNeitherPastDueNorImpairedMember2024-12-310001001290ifrs-full:FinancialAssetsPastDueButNotImpairedMember2025-12-310001001290ifrs-full:FinancialAssetsPastDueButNotImpairedMember2024-12-310001001290bap:SmallBusinessLoansMember2025-12-310001001290bap:SmallBusinessLoansMember2024-12-310001001290srt:ScenarioForecastMemberifrs-full:LaterThanOneYearAndNotLaterThanTwoYearsMember2026-01-012026-12-310001001290bap:BaselineMember2025-01-012025-12-310001001290bap:OptimisticMember2025-01-012025-12-310001001290bap:PessimisticMember2025-01-012025-12-310001001290bap:OptimisticMember2025-12-310001001290bap:OptimisticMember2024-12-310001001290bap:BaseCaseMember2025-12-310001001290bap:BaseCaseMember2024-12-310001001290bap:PessimisticMember2025-12-310001001290bap:PessimisticMember2024-12-310001001290bap:BbbToBbbMemberifrs-full:CountryOfDomicileMember2025-12-310001001290bap:BbbToBbbMemberifrs-full:CountryOfDomicileMember2024-12-310001001290bap:BbToBbMemberifrs-full:CountryOfDomicileMember2025-12-310001001290bap:BbToBbMemberifrs-full:CountryOfDomicileMember2024-12-310001001290bap:LowerAndEqualToBMemberifrs-full:CountryOfDomicileMember2025-12-310001001290bap:LowerAndEqualToBMemberifrs-full:CountryOfDomicileMember2024-12-310001001290bap:BcrpCertificatesOfDepositMemberifrs-full:CountryOfDomicileMember2025-12-310001001290bap:BcrpCertificatesOfDepositMemberifrs-full:CountryOfDomicileMember2024-12-310001001290bap:ListedAndUnlistedSecuritiesMemberifrs-full:CountryOfDomicileMember2025-12-310001001290bap:ListedAndUnlistedSecuritiesMemberifrs-full:CountryOfDomicileMember2024-12-310001001290bap:RestrictedMutualFundsMemberifrs-full:CountryOfDomicileMember2025-12-310001001290bap:RestrictedMutualFundsMemberifrs-full:CountryOfDomicileMember2024-12-310001001290ifrs-full:InvestmentFundsMemberifrs-full:CountryOfDomicileMember2025-12-310001001290ifrs-full:InvestmentFundsMemberifrs-full:CountryOfDomicileMember2024-12-310001001290bap:MutualFundsMemberifrs-full:CountryOfDomicileMember2025-12-310001001290bap:MutualFundsMemberifrs-full:CountryOfDomicileMember2024-12-310001001290bap:OtherInstrumentsMemberifrs-full:CountryOfDomicileMember2025-12-310001001290bap:OtherInstrumentsMemberifrs-full:CountryOfDomicileMember2024-12-310001001290bap:SubtotalMemberifrs-full:CountryOfDomicileMember2025-12-310001001290bap:SubtotalMemberifrs-full:CountryOfDomicileMember2024-12-310001001290bap:AaaMemberifrs-full:ForeignCountriesMember2025-12-310001001290bap:AaaMemberifrs-full:ForeignCountriesMember2024-12-310001001290bap:AaToAaMemberifrs-full:ForeignCountriesMember2025-12-310001001290bap:AaToAaMemberifrs-full:ForeignCountriesMember2024-12-310001001290bap:AToAMemberifrs-full:ForeignCountriesMember2025-12-310001001290bap:AToAMemberifrs-full:ForeignCountriesMember2024-12-310001001290bap:BbbToBbbMemberifrs-full:ForeignCountriesMember2025-12-310001001290bap:BbbToBbbMemberifrs-full:ForeignCountriesMember2024-12-310001001290bap:BbToBbMemberifrs-full:ForeignCountriesMember2025-12-310001001290bap:BbToBbMemberifrs-full:ForeignCountriesMember2024-12-310001001290bap:LowerAndEqualToBMemberifrs-full:ForeignCountriesMember2025-12-310001001290bap:LowerAndEqualToBMemberifrs-full:ForeignCountriesMember2024-12-310001001290bap:ListedAndUnlistedSecuritiesMemberifrs-full:ForeignCountriesMember2025-12-310001001290bap:ListedAndUnlistedSecuritiesMemberifrs-full:ForeignCountriesMember2024-12-310001001290bap:MutualFundsMemberifrs-full:ForeignCountriesMember2025-12-310001001290bap:MutualFundsMemberifrs-full:ForeignCountriesMember2024-12-310001001290bap:ParticipationsOfRalFundsMemberifrs-full:ForeignCountriesMember2025-12-310001001290bap:ParticipationsOfRalFundsMemberifrs-full:ForeignCountriesMember2024-12-310001001290ifrs-full:InvestmentFundsMemberifrs-full:ForeignCountriesMember2025-12-310001001290ifrs-full:InvestmentFundsMemberifrs-full:ForeignCountriesMember2024-12-310001001290bap:OtherInstrumentsMemberifrs-full:ForeignCountriesMember2025-12-310001001290bap:OtherInstrumentsMemberifrs-full:ForeignCountriesMember2024-12-310001001290bap:SubtotalMemberifrs-full:ForeignCountriesMember2025-12-310001001290bap:SubtotalMemberifrs-full:ForeignCountriesMember2024-12-310001001290bap:TradingSecuritiesAvailableforsaleAndHeldtomaturityInvestmentsMember2025-12-310001001290bap:TradingSecuritiesAvailableforsaleAndHeldtomaturityInvestmentsMember2024-12-310001001290ifrs-full:FinancialAssetsAtFairValueThroughProfitOrLossClassifiedAsHeldForTradingCategoryMemberbap:CentralReserveBankOfPeruMember2025-12-310001001290ifrs-full:FinancialAssetsAtFairValueThroughProfitOrLossDesignatedUponInitialRecognitionCategoryMemberbap:CentralReserveBankOfPeruMember2025-12-310001001290ifrs-full:FinancialAssetsAtAmortisedCostMemberbap:CentralReserveBankOfPeruMember2025-12-310001001290ifrs-full:InvestmentsInEquityInstrumentsMeasuredAtFairValueThroughOtherComprehensiveIncomeMemberbap:CentralReserveBankOfPeruMember2025-12-310001001290bap:CentralReserveBankOfPeruMember2025-12-310001001290ifrs-full:FinancialAssetsAtFairValueThroughProfitOrLossClassifiedAsHeldForTradingCategoryMemberbap:CentralReserveBankOfPeruMember2024-12-310001001290ifrs-full:FinancialAssetsAtFairValueThroughProfitOrLossDesignatedUponInitialRecognitionCategoryMemberbap:CentralReserveBankOfPeruMember2024-12-310001001290ifrs-full:FinancialAssetsAtAmortisedCostMemberbap:CentralReserveBankOfPeruMember2024-12-310001001290ifrs-full:InvestmentsInEquityInstrumentsMeasuredAtFairValueThroughOtherComprehensiveIncomeMemberbap:CentralReserveBankOfPeruMember2024-12-310001001290bap:CentralReserveBankOfPeruMember2024-12-310001001290ifrs-full:FinancialAssetsAtFairValueThroughProfitOrLossClassifiedAsHeldForTradingCategoryMemberbap:FinancialServicesMember2025-12-310001001290ifrs-full:FinancialAssetsAtFairValueThroughProfitOrLossDesignatedUponInitialRecognitionCategoryMemberbap:FinancialServicesMember2025-12-310001001290ifrs-full:FinancialAssetsAtAmortisedCostMemberbap:FinancialServicesMember2025-12-310001001290ifrs-full:InvestmentsInEquityInstrumentsMeasuredAtFairValueThroughOtherComprehensiveIncomeMemberbap:FinancialServicesMember2025-12-310001001290bap:FinancialServicesMember2025-12-310001001290ifrs-full:FinancialAssetsAtFairValueThroughProfitOrLossClassifiedAsHeldForTradingCategoryMemberbap:FinancialServicesMember2024-12-310001001290ifrs-full:FinancialAssetsAtFairValueThroughProfitOrLossDesignatedUponInitialRecognitionCategoryMemberbap:FinancialServicesMember2024-12-310001001290ifrs-full:FinancialAssetsAtAmortisedCostMemberbap:FinancialServicesMember2024-12-310001001290ifrs-full:InvestmentsInEquityInstrumentsMeasuredAtFairValueThroughOtherComprehensiveIncomeMemberbap:FinancialServicesMember2024-12-310001001290bap:FinancialServicesMember2024-12-310001001290ifrs-full:FinancialAssetsAtFairValueThroughProfitOrLossClassifiedAsHeldForTradingCategoryMemberbap:CommerceMember2025-12-310001001290ifrs-full:FinancialAssetsAtFairValueThroughProfitOrLossDesignatedUponInitialRecognitionCategoryMemberbap:CommerceMember2025-12-310001001290ifrs-full:FinancialAssetsAtAmortisedCostMemberbap:CommerceMember2025-12-310001001290ifrs-full:InvestmentsInEquityInstrumentsMeasuredAtFairValueThroughOtherComprehensiveIncomeMemberbap:CommerceMember2025-12-310001001290bap:CommerceMember2025-12-310001001290ifrs-full:FinancialAssetsAtFairValueThroughProfitOrLossClassifiedAsHeldForTradingCategoryMemberbap:CommerceMember2024-12-310001001290ifrs-full:FinancialAssetsAtFairValueThroughProfitOrLossDesignatedUponInitialRecognitionCategoryMemberbap:CommerceMember2024-12-310001001290ifrs-full:FinancialAssetsAtAmortisedCostMemberbap:CommerceMember2024-12-310001001290ifrs-full:InvestmentsInEquityInstrumentsMeasuredAtFairValueThroughOtherComprehensiveIncomeMemberbap:CommerceMember2024-12-310001001290bap:CommerceMember2024-12-310001001290ifrs-full:FinancialAssetsAtFairValueThroughProfitOrLossClassifiedAsHeldForTradingCategoryMemberbap:GovernmentAndPublicAdministrationMember2025-12-310001001290ifrs-full:FinancialAssetsAtFairValueThroughProfitOrLossDesignatedUponInitialRecognitionCategoryMemberbap:GovernmentAndPublicAdministrationMember2025-12-310001001290ifrs-full:FinancialAssetsAtAmortisedCostMemberbap:GovernmentAndPublicAdministrationMember2025-12-310001001290ifrs-full:InvestmentsInEquityInstrumentsMeasuredAtFairValueThroughOtherComprehensiveIncomeMemberbap:GovernmentAndPublicAdministrationMember2025-12-310001001290bap:GovernmentAndPublicAdministrationMember2025-12-310001001290ifrs-full:FinancialAssetsAtFairValueThroughProfitOrLossClassifiedAsHeldForTradingCategoryMemberbap:GovernmentAndPublicAdministrationMember2024-12-310001001290ifrs-full:FinancialAssetsAtFairValueThroughProfitOrLossDesignatedUponInitialRecognitionCategoryMemberbap:GovernmentAndPublicAdministrationMember2024-12-310001001290ifrs-full:FinancialAssetsAtAmortisedCostMemberbap:GovernmentAndPublicAdministrationMember2024-12-310001001290ifrs-full:InvestmentsInEquityInstrumentsMeasuredAtFairValueThroughOtherComprehensiveIncomeMemberbap:GovernmentAndPublicAdministrationMember2024-12-310001001290bap:GovernmentAndPublicAdministrationMember2024-12-310001001290ifrs-full:FinancialAssetsAtFairValueThroughProfitOrLossClassifiedAsHeldForTradingCategoryMemberbap:MortgageLoansMember2025-12-310001001290ifrs-full:FinancialAssetsAtFairValueThroughProfitOrLossDesignatedUponInitialRecognitionCategoryMemberbap:MortgageLoansMember2025-12-310001001290ifrs-full:FinancialAssetsAtAmortisedCostMemberbap:MortgageLoansMember2025-12-310001001290ifrs-full:InvestmentsInEquityInstrumentsMeasuredAtFairValueThroughOtherComprehensiveIncomeMemberbap:MortgageLoansMember2025-12-310001001290bap:MortgageLoansMember2025-12-310001001290ifrs-full:FinancialAssetsAtFairValueThroughProfitOrLossClassifiedAsHeldForTradingCategoryMemberbap:MortgageLoansMember2024-12-310001001290ifrs-full:FinancialAssetsAtFairValueThroughProfitOrLossDesignatedUponInitialRecognitionCategoryMemberbap:MortgageLoansMember2024-12-310001001290ifrs-full:FinancialAssetsAtAmortisedCostMemberbap:MortgageLoansMember2024-12-310001001290ifrs-full:InvestmentsInEquityInstrumentsMeasuredAtFairValueThroughOtherComprehensiveIncomeMemberbap:MortgageLoansMember2024-12-310001001290bap:MortgageLoansMember2024-12-310001001290ifrs-full:FinancialAssetsAtFairValueThroughProfitOrLossClassifiedAsHeldForTradingCategoryMemberbap:ManufacturingMember2025-12-310001001290ifrs-full:FinancialAssetsAtFairValueThroughProfitOrLossDesignatedUponInitialRecognitionCategoryMemberbap:ManufacturingMember2025-12-310001001290ifrs-full:FinancialAssetsAtAmortisedCostMemberbap:ManufacturingMember2025-12-310001001290ifrs-full:InvestmentsInEquityInstrumentsMeasuredAtFairValueThroughOtherComprehensiveIncomeMemberbap:ManufacturingMember2025-12-310001001290bap:ManufacturingMember2025-12-310001001290ifrs-full:FinancialAssetsAtFairValueThroughProfitOrLossClassifiedAsHeldForTradingCategoryMemberbap:ManufacturingMember2024-12-310001001290ifrs-full:FinancialAssetsAtFairValueThroughProfitOrLossDesignatedUponInitialRecognitionCategoryMemberbap:ManufacturingMember2024-12-310001001290ifrs-full:FinancialAssetsAtAmortisedCostMemberbap:ManufacturingMember2024-12-310001001290ifrs-full:InvestmentsInEquityInstrumentsMeasuredAtFairValueThroughOtherComprehensiveIncomeMemberbap:ManufacturingMember2024-12-310001001290bap:ManufacturingMember2024-12-310001001290ifrs-full:FinancialAssetsAtFairValueThroughProfitOrLossClassifiedAsHeldForTradingCategoryMemberifrs-full:ConsumerLoansMember2025-12-310001001290ifrs-full:FinancialAssetsAtFairValueThroughProfitOrLossDesignatedUponInitialRecognitionCategoryMemberifrs-full:ConsumerLoansMember2025-12-310001001290ifrs-full:FinancialAssetsAtAmortisedCostMemberifrs-full:ConsumerLoansMember2025-12-310001001290ifrs-full:InvestmentsInEquityInstrumentsMeasuredAtFairValueThroughOtherComprehensiveIncomeMemberifrs-full:ConsumerLoansMember2025-12-310001001290ifrs-full:ConsumerLoansMember2025-12-310001001290ifrs-full:FinancialAssetsAtFairValueThroughProfitOrLossClassifiedAsHeldForTradingCategoryMemberifrs-full:ConsumerLoansMember2024-12-310001001290ifrs-full:FinancialAssetsAtFairValueThroughProfitOrLossDesignatedUponInitialRecognitionCategoryMemberifrs-full:ConsumerLoansMember2024-12-310001001290ifrs-full:FinancialAssetsAtAmortisedCostMemberifrs-full:ConsumerLoansMember2024-12-310001001290ifrs-full:InvestmentsInEquityInstrumentsMeasuredAtFairValueThroughOtherComprehensiveIncomeMemberifrs-full:ConsumerLoansMember2024-12-310001001290ifrs-full:ConsumerLoansMember2024-12-310001001290ifrs-full:FinancialAssetsAtFairValueThroughProfitOrLossClassifiedAsHeldForTradingCategoryMemberbap:CommunicationsStorageAndTransportationMember2025-12-310001001290ifrs-full:FinancialAssetsAtFairValueThroughProfitOrLossDesignatedUponInitialRecognitionCategoryMemberbap:CommunicationsStorageAndTransportationMember2025-12-310001001290ifrs-full:FinancialAssetsAtAmortisedCostMemberbap:CommunicationsStorageAndTransportationMember2025-12-310001001290ifrs-full:InvestmentsInEquityInstrumentsMeasuredAtFairValueThroughOtherComprehensiveIncomeMemberbap:CommunicationsStorageAndTransportationMember2025-12-310001001290bap:CommunicationsStorageAndTransportationMember2025-12-310001001290ifrs-full:FinancialAssetsAtFairValueThroughProfitOrLossClassifiedAsHeldForTradingCategoryMemberbap:CommunicationsStorageAndTransportationMember2024-12-310001001290ifrs-full:FinancialAssetsAtFairValueThroughProfitOrLossDesignatedUponInitialRecognitionCategoryMemberbap:CommunicationsStorageAndTransportationMember2024-12-310001001290ifrs-full:FinancialAssetsAtAmortisedCostMemberbap:CommunicationsStorageAndTransportationMember2024-12-310001001290ifrs-full:InvestmentsInEquityInstrumentsMeasuredAtFairValueThroughOtherComprehensiveIncomeMemberbap:CommunicationsStorageAndTransportationMember2024-12-310001001290bap:CommunicationsStorageAndTransportationMember2024-12-310001001290ifrs-full:FinancialAssetsAtFairValueThroughProfitOrLossClassifiedAsHeldForTradingCategoryMemberbap:ElectricityGasAndWaterMember2025-12-310001001290ifrs-full:FinancialAssetsAtFairValueThroughProfitOrLossDesignatedUponInitialRecognitionCategoryMemberbap:ElectricityGasAndWaterMember2025-12-310001001290ifrs-full:FinancialAssetsAtAmortisedCostMemberbap:ElectricityGasAndWaterMember2025-12-310001001290ifrs-full:InvestmentsInEquityInstrumentsMeasuredAtFairValueThroughOtherComprehensiveIncomeMemberbap:ElectricityGasAndWaterMember2025-12-310001001290bap:ElectricityGasAndWaterMember2025-12-310001001290ifrs-full:FinancialAssetsAtFairValueThroughProfitOrLossClassifiedAsHeldForTradingCategoryMemberbap:ElectricityGasAndWaterMember2024-12-310001001290ifrs-full:FinancialAssetsAtFairValueThroughProfitOrLossDesignatedUponInitialRecognitionCategoryMemberbap:ElectricityGasAndWaterMember2024-12-310001001290ifrs-full:FinancialAssetsAtAmortisedCostMemberbap:ElectricityGasAndWaterMember2024-12-310001001290ifrs-full:InvestmentsInEquityInstrumentsMeasuredAtFairValueThroughOtherComprehensiveIncomeMemberbap:ElectricityGasAndWaterMember2024-12-310001001290bap:ElectricityGasAndWaterMember2024-12-310001001290ifrs-full:FinancialAssetsAtFairValueThroughProfitOrLossClassifiedAsHeldForTradingCategoryMemberbap:RealEstateAndLeasingMember2025-12-310001001290ifrs-full:FinancialAssetsAtFairValueThroughProfitOrLossDesignatedUponInitialRecognitionCategoryMemberbap:RealEstateAndLeasingMember2025-12-310001001290ifrs-full:FinancialAssetsAtAmortisedCostMemberbap:RealEstateAndLeasingMember2025-12-310001001290ifrs-full:InvestmentsInEquityInstrumentsMeasuredAtFairValueThroughOtherComprehensiveIncomeMemberbap:RealEstateAndLeasingMember2025-12-310001001290bap:RealEstateAndLeasingMember2025-12-310001001290ifrs-full:FinancialAssetsAtFairValueThroughProfitOrLossClassifiedAsHeldForTradingCategoryMemberbap:RealEstateAndLeasingMember2024-12-310001001290ifrs-full:FinancialAssetsAtFairValueThroughProfitOrLossDesignatedUponInitialRecognitionCategoryMemberbap:RealEstateAndLeasingMember2024-12-310001001290ifrs-full:FinancialAssetsAtAmortisedCostMemberbap:RealEstateAndLeasingMember2024-12-310001001290ifrs-full:InvestmentsInEquityInstrumentsMeasuredAtFairValueThroughOtherComprehensiveIncomeMemberbap:RealEstateAndLeasingMember2024-12-310001001290bap:RealEstateAndLeasingMember2024-12-310001001290ifrs-full:FinancialAssetsAtFairValueThroughProfitOrLossClassifiedAsHeldForTradingCategoryMemberbap:MiningMember2025-12-310001001290ifrs-full:FinancialAssetsAtFairValueThroughProfitOrLossDesignatedUponInitialRecognitionCategoryMemberbap:MiningMember2025-12-310001001290ifrs-full:FinancialAssetsAtAmortisedCostMemberbap:MiningMember2025-12-310001001290ifrs-full:InvestmentsInEquityInstrumentsMeasuredAtFairValueThroughOtherComprehensiveIncomeMemberbap:MiningMember2025-12-310001001290bap:MiningMember2025-12-310001001290ifrs-full:FinancialAssetsAtFairValueThroughProfitOrLossClassifiedAsHeldForTradingCategoryMemberbap:MiningMember2024-12-310001001290ifrs-full:FinancialAssetsAtFairValueThroughProfitOrLossDesignatedUponInitialRecognitionCategoryMemberbap:MiningMember2024-12-310001001290ifrs-full:FinancialAssetsAtAmortisedCostMemberbap:MiningMember2024-12-310001001290ifrs-full:InvestmentsInEquityInstrumentsMeasuredAtFairValueThroughOtherComprehensiveIncomeMemberbap:MiningMember2024-12-310001001290bap:MiningMember2024-12-310001001290ifrs-full:FinancialAssetsAtFairValueThroughProfitOrLossClassifiedAsHeldForTradingCategoryMemberbap:AgricultureMember2025-12-310001001290ifrs-full:FinancialAssetsAtFairValueThroughProfitOrLossDesignatedUponInitialRecognitionCategoryMemberbap:AgricultureMember2025-12-310001001290ifrs-full:FinancialAssetsAtAmortisedCostMemberbap:AgricultureMember2025-12-310001001290ifrs-full:InvestmentsInEquityInstrumentsMeasuredAtFairValueThroughOtherComprehensiveIncomeMemberbap:AgricultureMember2025-12-310001001290bap:AgricultureMember2025-12-310001001290ifrs-full:FinancialAssetsAtFairValueThroughProfitOrLossClassifiedAsHeldForTradingCategoryMemberbap:AgricultureMember2024-12-310001001290ifrs-full:FinancialAssetsAtFairValueThroughProfitOrLossDesignatedUponInitialRecognitionCategoryMemberbap:AgricultureMember2024-12-310001001290ifrs-full:FinancialAssetsAtAmortisedCostMemberbap:AgricultureMember2024-12-310001001290ifrs-full:InvestmentsInEquityInstrumentsMeasuredAtFairValueThroughOtherComprehensiveIncomeMemberbap:AgricultureMember2024-12-310001001290bap:AgricultureMember2024-12-310001001290ifrs-full:FinancialAssetsAtFairValueThroughProfitOrLossClassifiedAsHeldForTradingCategoryMemberbap:ConstructionsMember2025-12-310001001290ifrs-full:FinancialAssetsAtFairValueThroughProfitOrLossDesignatedUponInitialRecognitionCategoryMemberbap:ConstructionsMember2025-12-310001001290ifrs-full:FinancialAssetsAtAmortisedCostMemberbap:ConstructionsMember2025-12-310001001290ifrs-full:InvestmentsInEquityInstrumentsMeasuredAtFairValueThroughOtherComprehensiveIncomeMemberbap:ConstructionsMember2025-12-310001001290bap:ConstructionsMember2025-12-310001001290ifrs-full:FinancialAssetsAtFairValueThroughProfitOrLossClassifiedAsHeldForTradingCategoryMemberbap:ConstructionsMember2024-12-310001001290ifrs-full:FinancialAssetsAtFairValueThroughProfitOrLossDesignatedUponInitialRecognitionCategoryMemberbap:ConstructionsMember2024-12-310001001290ifrs-full:FinancialAssetsAtAmortisedCostMemberbap:ConstructionsMember2024-12-310001001290ifrs-full:InvestmentsInEquityInstrumentsMeasuredAtFairValueThroughOtherComprehensiveIncomeMemberbap:ConstructionsMember2024-12-310001001290bap:ConstructionsMember2024-12-310001001290ifrs-full:FinancialAssetsAtFairValueThroughProfitOrLossClassifiedAsHeldForTradingCategoryMemberbap:HotelsAndRestaurantsMember2025-12-310001001290ifrs-full:FinancialAssetsAtFairValueThroughProfitOrLossDesignatedUponInitialRecognitionCategoryMemberbap:HotelsAndRestaurantsMember2025-12-310001001290ifrs-full:FinancialAssetsAtAmortisedCostMemberbap:HotelsAndRestaurantsMember2025-12-310001001290ifrs-full:InvestmentsInEquityInstrumentsMeasuredAtFairValueThroughOtherComprehensiveIncomeMemberbap:HotelsAndRestaurantsMember2025-12-310001001290bap:HotelsAndRestaurantsMember2025-12-310001001290ifrs-full:FinancialAssetsAtFairValueThroughProfitOrLossClassifiedAsHeldForTradingCategoryMemberbap:HotelsAndRestaurantsMember2024-12-310001001290ifrs-full:FinancialAssetsAtFairValueThroughProfitOrLossDesignatedUponInitialRecognitionCategoryMemberbap:HotelsAndRestaurantsMember2024-12-310001001290ifrs-full:FinancialAssetsAtAmortisedCostMemberbap:HotelsAndRestaurantsMember2024-12-310001001290ifrs-full:InvestmentsInEquityInstrumentsMeasuredAtFairValueThroughOtherComprehensiveIncomeMemberbap:HotelsAndRestaurantsMember2024-12-310001001290bap:HotelsAndRestaurantsMember2024-12-310001001290ifrs-full:FinancialAssetsAtFairValueThroughProfitOrLossClassifiedAsHeldForTradingCategoryMemberbap:EducationHealthAndOtherServicesMember2025-12-310001001290ifrs-full:FinancialAssetsAtFairValueThroughProfitOrLossDesignatedUponInitialRecognitionCategoryMemberbap:EducationHealthAndOtherServicesMember2025-12-310001001290ifrs-full:FinancialAssetsAtAmortisedCostMemberbap:EducationHealthAndOtherServicesMember2025-12-310001001290ifrs-full:InvestmentsInEquityInstrumentsMeasuredAtFairValueThroughOtherComprehensiveIncomeMemberbap:EducationHealthAndOtherServicesMember2025-12-310001001290bap:EducationHealthAndOtherServicesMember2025-12-310001001290ifrs-full:FinancialAssetsAtFairValueThroughProfitOrLossClassifiedAsHeldForTradingCategoryMemberbap:EducationHealthAndOtherServicesMember2024-12-310001001290ifrs-full:FinancialAssetsAtFairValueThroughProfitOrLossDesignatedUponInitialRecognitionCategoryMemberbap:EducationHealthAndOtherServicesMember2024-12-310001001290ifrs-full:FinancialAssetsAtAmortisedCostMemberbap:EducationHealthAndOtherServicesMember2024-12-310001001290ifrs-full:InvestmentsInEquityInstrumentsMeasuredAtFairValueThroughOtherComprehensiveIncomeMemberbap:EducationHealthAndOtherServicesMember2024-12-310001001290bap:EducationHealthAndOtherServicesMember2024-12-310001001290ifrs-full:FinancialAssetsAtFairValueThroughProfitOrLossClassifiedAsHeldForTradingCategoryMemberbap:FishingMember2025-12-310001001290ifrs-full:FinancialAssetsAtFairValueThroughProfitOrLossDesignatedUponInitialRecognitionCategoryMemberbap:FishingMember2025-12-310001001290ifrs-full:FinancialAssetsAtAmortisedCostMemberbap:FishingMember2025-12-310001001290ifrs-full:InvestmentsInEquityInstrumentsMeasuredAtFairValueThroughOtherComprehensiveIncomeMemberbap:FishingMember2025-12-310001001290bap:FishingMember2025-12-310001001290ifrs-full:FinancialAssetsAtFairValueThroughProfitOrLossClassifiedAsHeldForTradingCategoryMemberbap:FishingMember2024-12-310001001290ifrs-full:FinancialAssetsAtFairValueThroughProfitOrLossDesignatedUponInitialRecognitionCategoryMemberbap:FishingMember2024-12-310001001290ifrs-full:FinancialAssetsAtAmortisedCostMemberbap:FishingMember2024-12-310001001290ifrs-full:InvestmentsInEquityInstrumentsMeasuredAtFairValueThroughOtherComprehensiveIncomeMemberbap:FishingMember2024-12-310001001290bap:FishingMember2024-12-310001001290ifrs-full:FinancialAssetsAtFairValueThroughProfitOrLossClassifiedAsHeldForTradingCategoryMemberbap:InsuranceMember2025-12-310001001290ifrs-full:FinancialAssetsAtFairValueThroughProfitOrLossDesignatedUponInitialRecognitionCategoryMemberbap:InsuranceMember2025-12-310001001290ifrs-full:FinancialAssetsAtAmortisedCostMemberbap:InsuranceMember2025-12-310001001290ifrs-full:InvestmentsInEquityInstrumentsMeasuredAtFairValueThroughOtherComprehensiveIncomeMemberbap:InsuranceMember2025-12-310001001290bap:InsuranceMember2025-12-310001001290ifrs-full:FinancialAssetsAtFairValueThroughProfitOrLossClassifiedAsHeldForTradingCategoryMemberbap:InsuranceMember2024-12-310001001290ifrs-full:FinancialAssetsAtFairValueThroughProfitOrLossDesignatedUponInitialRecognitionCategoryMemberbap:InsuranceMember2024-12-310001001290ifrs-full:FinancialAssetsAtAmortisedCostMemberbap:InsuranceMember2024-12-310001001290ifrs-full:InvestmentsInEquityInstrumentsMeasuredAtFairValueThroughOtherComprehensiveIncomeMemberbap:InsuranceMember2024-12-310001001290bap:InsuranceMember2024-12-310001001290ifrs-full:FinancialAssetsAtFairValueThroughProfitOrLossClassifiedAsHeldForTradingCategoryMemberbap:CommunityServicesAndOthersMember2025-12-310001001290ifrs-full:FinancialAssetsAtFairValueThroughProfitOrLossDesignatedUponInitialRecognitionCategoryMemberbap:CommunityServicesAndOthersMember2025-12-310001001290ifrs-full:FinancialAssetsAtAmortisedCostMemberbap:CommunityServicesAndOthersMember2025-12-310001001290ifrs-full:InvestmentsInEquityInstrumentsMeasuredAtFairValueThroughOtherComprehensiveIncomeMemberbap:CommunityServicesAndOthersMember2025-12-310001001290bap:CommunityServicesAndOthersMember2025-12-310001001290ifrs-full:FinancialAssetsAtFairValueThroughProfitOrLossClassifiedAsHeldForTradingCategoryMemberbap:CommunityServicesAndOthersMember2024-12-310001001290ifrs-full:FinancialAssetsAtFairValueThroughProfitOrLossDesignatedUponInitialRecognitionCategoryMemberbap:CommunityServicesAndOthersMember2024-12-310001001290ifrs-full:FinancialAssetsAtAmortisedCostMemberbap:CommunityServicesAndOthersMember2024-12-310001001290ifrs-full:InvestmentsInEquityInstrumentsMeasuredAtFairValueThroughOtherComprehensiveIncomeMemberbap:CommunityServicesAndOthersMember2024-12-310001001290bap:CommunityServicesAndOthersMember2024-12-310001001290ifrs-full:FinancialAssetsAtFairValueThroughProfitOrLossDesignatedUponInitialRecognitionCategoryMember2025-12-310001001290ifrs-full:FinancialAssetsAtAmortisedCostMember2025-12-310001001290ifrs-full:InvestmentsInEquityInstrumentsMeasuredAtFairValueThroughOtherComprehensiveIncomeMember2025-12-310001001290bap:FinancialInstrumentsWithExposureToCreditRiskMember2025-12-310001001290ifrs-full:FinancialAssetsAtFairValueThroughProfitOrLossDesignatedUponInitialRecognitionCategoryMember2024-12-310001001290ifrs-full:FinancialAssetsAtAmortisedCostMember2024-12-310001001290ifrs-full:InvestmentsInEquityInstrumentsMeasuredAtFairValueThroughOtherComprehensiveIncomeMember2024-12-310001001290bap:FinancialInstrumentsWithExposureToCreditRiskMember2024-12-310001001290bap:CreditRiskGeographicalAreawiseMember2025-01-012025-12-310001001290country:PEifrs-full:FinancialAssetsAtFairValueThroughProfitOrLossClassifiedAsHeldForTradingCategoryMember2025-12-310001001290country:PEifrs-full:FinancialAssetsAtFairValueThroughProfitOrLossDesignatedUponInitialRecognitionCategoryMember2025-12-310001001290country:PEifrs-full:FinancialAssetsAtAmortisedCostMember2025-12-310001001290country:PEifrs-full:InvestmentsInEquityInstrumentsMeasuredAtFairValueThroughOtherComprehensiveIncomeMember2025-12-310001001290country:PE2025-12-310001001290country:PEifrs-full:FinancialAssetsAtFairValueThroughProfitOrLossClassifiedAsHeldForTradingCategoryMember2024-12-310001001290country:PEifrs-full:FinancialAssetsAtFairValueThroughProfitOrLossDesignatedUponInitialRecognitionCategoryMember2024-12-310001001290country:PEifrs-full:FinancialAssetsAtAmortisedCostMember2024-12-310001001290country:PEifrs-full:InvestmentsInEquityInstrumentsMeasuredAtFairValueThroughOtherComprehensiveIncomeMember2024-12-310001001290country:PE2024-12-310001001290country:USifrs-full:FinancialAssetsAtFairValueThroughProfitOrLossClassifiedAsHeldForTradingCategoryMember2025-12-310001001290country:USifrs-full:FinancialAssetsAtFairValueThroughProfitOrLossDesignatedUponInitialRecognitionCategoryMember2025-12-310001001290country:USifrs-full:FinancialAssetsAtAmortisedCostMember2025-12-310001001290country:USifrs-full:InvestmentsInEquityInstrumentsMeasuredAtFairValueThroughOtherComprehensiveIncomeMember2025-12-310001001290country:US2025-12-310001001290country:USifrs-full:FinancialAssetsAtFairValueThroughProfitOrLossClassifiedAsHeldForTradingCategoryMember2024-12-310001001290country:USifrs-full:FinancialAssetsAtFairValueThroughProfitOrLossDesignatedUponInitialRecognitionCategoryMember2024-12-310001001290country:USifrs-full:FinancialAssetsAtAmortisedCostMember2024-12-310001001290country:USifrs-full:InvestmentsInEquityInstrumentsMeasuredAtFairValueThroughOtherComprehensiveIncomeMember2024-12-310001001290country:US2024-12-310001001290country:COifrs-full:FinancialAssetsAtFairValueThroughProfitOrLossClassifiedAsHeldForTradingCategoryMember2025-12-310001001290country:COifrs-full:FinancialAssetsAtFairValueThroughProfitOrLossDesignatedUponInitialRecognitionCategoryMember2025-12-310001001290country:COifrs-full:FinancialAssetsAtAmortisedCostMember2025-12-310001001290country:COifrs-full:InvestmentsInEquityInstrumentsMeasuredAtFairValueThroughOtherComprehensiveIncomeMember2025-12-310001001290country:CO2025-12-310001001290country:COifrs-full:FinancialAssetsAtFairValueThroughProfitOrLossClassifiedAsHeldForTradingCategoryMember2024-12-310001001290country:COifrs-full:FinancialAssetsAtFairValueThroughProfitOrLossDesignatedUponInitialRecognitionCategoryMember2024-12-310001001290country:COifrs-full:FinancialAssetsAtAmortisedCostMember2024-12-310001001290country:COifrs-full:InvestmentsInEquityInstrumentsMeasuredAtFairValueThroughOtherComprehensiveIncomeMember2024-12-310001001290country:CO2024-12-310001001290country:BOifrs-full:FinancialAssetsAtFairValueThroughProfitOrLossClassifiedAsHeldForTradingCategoryMember2025-12-310001001290country:BOifrs-full:FinancialAssetsAtFairValueThroughProfitOrLossDesignatedUponInitialRecognitionCategoryMember2025-12-310001001290country:BOifrs-full:FinancialAssetsAtAmortisedCostMember2025-12-310001001290country:BOifrs-full:InvestmentsInEquityInstrumentsMeasuredAtFairValueThroughOtherComprehensiveIncomeMember2025-12-310001001290country:BO2025-12-310001001290country:BOifrs-full:FinancialAssetsAtFairValueThroughProfitOrLossClassifiedAsHeldForTradingCategoryMember2024-12-310001001290country:BOifrs-full:FinancialAssetsAtFairValueThroughProfitOrLossDesignatedUponInitialRecognitionCategoryMember2024-12-310001001290country:BOifrs-full:FinancialAssetsAtAmortisedCostMember2024-12-310001001290country:BOifrs-full:InvestmentsInEquityInstrumentsMeasuredAtFairValueThroughOtherComprehensiveIncomeMember2024-12-310001001290country:BO2024-12-310001001290country:CLifrs-full:FinancialAssetsAtFairValueThroughProfitOrLossClassifiedAsHeldForTradingCategoryMember2025-12-310001001290country:CLifrs-full:FinancialAssetsAtFairValueThroughProfitOrLossDesignatedUponInitialRecognitionCategoryMember2025-12-310001001290country:CLifrs-full:FinancialAssetsAtAmortisedCostMember2025-12-310001001290country:CLifrs-full:InvestmentsInEquityInstrumentsMeasuredAtFairValueThroughOtherComprehensiveIncomeMember2025-12-310001001290country:CL2025-12-310001001290country:CLifrs-full:FinancialAssetsAtFairValueThroughProfitOrLossClassifiedAsHeldForTradingCategoryMember2024-12-310001001290country:CLifrs-full:FinancialAssetsAtFairValueThroughProfitOrLossDesignatedUponInitialRecognitionCategoryMember2024-12-310001001290country:CLifrs-full:FinancialAssetsAtAmortisedCostMember2024-12-310001001290country:CLifrs-full:InvestmentsInEquityInstrumentsMeasuredAtFairValueThroughOtherComprehensiveIncomeMember2024-12-310001001290country:CL2024-12-310001001290country:BRifrs-full:FinancialAssetsAtFairValueThroughProfitOrLossClassifiedAsHeldForTradingCategoryMember2025-12-310001001290country:BRifrs-full:FinancialAssetsAtFairValueThroughProfitOrLossDesignatedUponInitialRecognitionCategoryMember2025-12-310001001290country:BRifrs-full:FinancialAssetsAtAmortisedCostMember2025-12-310001001290country:BRifrs-full:InvestmentsInEquityInstrumentsMeasuredAtFairValueThroughOtherComprehensiveIncomeMember2025-12-310001001290country:BR2025-12-310001001290country:BRifrs-full:FinancialAssetsAtFairValueThroughProfitOrLossClassifiedAsHeldForTradingCategoryMember2024-12-310001001290country:BRifrs-full:FinancialAssetsAtFairValueThroughProfitOrLossDesignatedUponInitialRecognitionCategoryMember2024-12-310001001290country:BRifrs-full:FinancialAssetsAtAmortisedCostMember2024-12-310001001290country:BRifrs-full:InvestmentsInEquityInstrumentsMeasuredAtFairValueThroughOtherComprehensiveIncomeMember2024-12-310001001290country:BR2024-12-310001001290country:PAifrs-full:FinancialAssetsAtFairValueThroughProfitOrLossClassifiedAsHeldForTradingCategoryMember2025-12-310001001290country:PAifrs-full:FinancialAssetsAtFairValueThroughProfitOrLossDesignatedUponInitialRecognitionCategoryMember2025-12-310001001290country:PAifrs-full:FinancialAssetsAtAmortisedCostMember2025-12-310001001290country:PAifrs-full:InvestmentsInEquityInstrumentsMeasuredAtFairValueThroughOtherComprehensiveIncomeMember2025-12-310001001290country:PA2025-12-310001001290country:PAifrs-full:FinancialAssetsAtFairValueThroughProfitOrLossClassifiedAsHeldForTradingCategoryMember2024-12-310001001290country:PAifrs-full:FinancialAssetsAtFairValueThroughProfitOrLossDesignatedUponInitialRecognitionCategoryMember2024-12-310001001290country:PAifrs-full:FinancialAssetsAtAmortisedCostMember2024-12-310001001290country:PAifrs-full:InvestmentsInEquityInstrumentsMeasuredAtFairValueThroughOtherComprehensiveIncomeMember2024-12-310001001290country:PA2024-12-310001001290country:MXifrs-full:FinancialAssetsAtFairValueThroughProfitOrLossClassifiedAsHeldForTradingCategoryMember2025-12-310001001290country:MXifrs-full:FinancialAssetsAtFairValueThroughProfitOrLossDesignatedUponInitialRecognitionCategoryMember2025-12-310001001290country:MXifrs-full:FinancialAssetsAtAmortisedCostMember2025-12-310001001290country:MXifrs-full:InvestmentsInEquityInstrumentsMeasuredAtFairValueThroughOtherComprehensiveIncomeMember2025-12-310001001290country:MX2025-12-310001001290country:MXifrs-full:FinancialAssetsAtFairValueThroughProfitOrLossClassifiedAsHeldForTradingCategoryMember2024-12-310001001290country:MXifrs-full:FinancialAssetsAtFairValueThroughProfitOrLossDesignatedUponInitialRecognitionCategoryMember2024-12-310001001290country:MXifrs-full:FinancialAssetsAtAmortisedCostMember2024-12-310001001290country:MXifrs-full:InvestmentsInEquityInstrumentsMeasuredAtFairValueThroughOtherComprehensiveIncomeMember2024-12-310001001290country:MX2024-12-310001001290country:CAifrs-full:FinancialAssetsAtFairValueThroughProfitOrLossClassifiedAsHeldForTradingCategoryMember2025-12-310001001290country:CAifrs-full:FinancialAssetsAtFairValueThroughProfitOrLossDesignatedUponInitialRecognitionCategoryMember2025-12-310001001290country:CAifrs-full:FinancialAssetsAtAmortisedCostMember2025-12-310001001290country:CAifrs-full:InvestmentsInEquityInstrumentsMeasuredAtFairValueThroughOtherComprehensiveIncomeMember2025-12-310001001290country:CA2025-12-310001001290country:CAifrs-full:FinancialAssetsAtFairValueThroughProfitOrLossClassifiedAsHeldForTradingCategoryMember2024-12-310001001290country:CAifrs-full:FinancialAssetsAtFairValueThroughProfitOrLossDesignatedUponInitialRecognitionCategoryMember2024-12-310001001290country:CAifrs-full:FinancialAssetsAtAmortisedCostMember2024-12-310001001290country:CAifrs-full:InvestmentsInEquityInstrumentsMeasuredAtFairValueThroughOtherComprehensiveIncomeMember2024-12-310001001290country:CA2024-12-310001001290country:GBifrs-full:FinancialAssetsAtFairValueThroughProfitOrLossClassifiedAsHeldForTradingCategoryMember2025-12-310001001290country:GBifrs-full:FinancialAssetsAtFairValueThroughProfitOrLossDesignatedUponInitialRecognitionCategoryMember2025-12-310001001290country:GBifrs-full:FinancialAssetsAtAmortisedCostMember2025-12-310001001290country:GBifrs-full:InvestmentsInEquityInstrumentsMeasuredAtFairValueThroughOtherComprehensiveIncomeMember2025-12-310001001290country:GB2025-12-310001001290country:GBifrs-full:FinancialAssetsAtFairValueThroughProfitOrLossClassifiedAsHeldForTradingCategoryMember2024-12-310001001290country:GBifrs-full:FinancialAssetsAtFairValueThroughProfitOrLossDesignatedUponInitialRecognitionCategoryMember2024-12-310001001290country:GBifrs-full:FinancialAssetsAtAmortisedCostMember2024-12-310001001290country:GBifrs-full:InvestmentsInEquityInstrumentsMeasuredAtFairValueThroughOtherComprehensiveIncomeMember2024-12-310001001290country:GB2024-12-310001001290country:ESifrs-full:FinancialAssetsAtFairValueThroughProfitOrLossClassifiedAsHeldForTradingCategoryMember2025-12-310001001290country:ESifrs-full:FinancialAssetsAtFairValueThroughProfitOrLossDesignatedUponInitialRecognitionCategoryMember2025-12-310001001290country:ESifrs-full:FinancialAssetsAtAmortisedCostMember2025-12-310001001290country:ESifrs-full:InvestmentsInEquityInstrumentsMeasuredAtFairValueThroughOtherComprehensiveIncomeMember2025-12-310001001290country:ES2025-12-310001001290country:ESifrs-full:FinancialAssetsAtFairValueThroughProfitOrLossClassifiedAsHeldForTradingCategoryMember2024-12-310001001290country:ESifrs-full:FinancialAssetsAtFairValueThroughProfitOrLossDesignatedUponInitialRecognitionCategoryMember2024-12-310001001290country:ESifrs-full:FinancialAssetsAtAmortisedCostMember2024-12-310001001290country:ESifrs-full:InvestmentsInEquityInstrumentsMeasuredAtFairValueThroughOtherComprehensiveIncomeMember2024-12-310001001290country:ES2024-12-310001001290country:FRifrs-full:FinancialAssetsAtFairValueThroughProfitOrLossClassifiedAsHeldForTradingCategoryMember2025-12-310001001290country:FRifrs-full:FinancialAssetsAtFairValueThroughProfitOrLossDesignatedUponInitialRecognitionCategoryMember2025-12-310001001290country:FRifrs-full:FinancialAssetsAtAmortisedCostMember2025-12-310001001290country:FRifrs-full:InvestmentsInEquityInstrumentsMeasuredAtFairValueThroughOtherComprehensiveIncomeMember2025-12-310001001290country:FR2025-12-310001001290country:FRifrs-full:FinancialAssetsAtFairValueThroughProfitOrLossClassifiedAsHeldForTradingCategoryMember2024-12-310001001290country:FRifrs-full:FinancialAssetsAtFairValueThroughProfitOrLossDesignatedUponInitialRecognitionCategoryMember2024-12-310001001290country:FRifrs-full:FinancialAssetsAtAmortisedCostMember2024-12-310001001290country:FRifrs-full:InvestmentsInEquityInstrumentsMeasuredAtFairValueThroughOtherComprehensiveIncomeMember2024-12-310001001290country:FR2024-12-310001001290country:CHifrs-full:FinancialAssetsAtFairValueThroughProfitOrLossClassifiedAsHeldForTradingCategoryMember2025-12-310001001290country:CHifrs-full:FinancialAssetsAtFairValueThroughProfitOrLossDesignatedUponInitialRecognitionCategoryMember2025-12-310001001290country:CHifrs-full:FinancialAssetsAtAmortisedCostMember2025-12-310001001290country:CHifrs-full:InvestmentsInEquityInstrumentsMeasuredAtFairValueThroughOtherComprehensiveIncomeMember2025-12-310001001290country:CH2025-12-310001001290country:CHifrs-full:FinancialAssetsAtFairValueThroughProfitOrLossClassifiedAsHeldForTradingCategoryMember2024-12-310001001290country:CHifrs-full:FinancialAssetsAtFairValueThroughProfitOrLossDesignatedUponInitialRecognitionCategoryMember2024-12-310001001290country:CHifrs-full:FinancialAssetsAtAmortisedCostMember2024-12-310001001290country:CHifrs-full:InvestmentsInEquityInstrumentsMeasuredAtFairValueThroughOtherComprehensiveIncomeMember2024-12-310001001290country:CH2024-12-310001001290country:LUifrs-full:FinancialAssetsAtFairValueThroughProfitOrLossClassifiedAsHeldForTradingCategoryMember2025-12-310001001290country:LUifrs-full:FinancialAssetsAtFairValueThroughProfitOrLossDesignatedUponInitialRecognitionCategoryMember2025-12-310001001290country:LUifrs-full:FinancialAssetsAtAmortisedCostMember2025-12-310001001290country:LUifrs-full:InvestmentsInEquityInstrumentsMeasuredAtFairValueThroughOtherComprehensiveIncomeMember2025-12-310001001290country:LU2025-12-310001001290country:LUifrs-full:FinancialAssetsAtFairValueThroughProfitOrLossClassifiedAsHeldForTradingCategoryMember2024-12-310001001290country:LUifrs-full:FinancialAssetsAtFairValueThroughProfitOrLossDesignatedUponInitialRecognitionCategoryMember2024-12-310001001290country:LUifrs-full:FinancialAssetsAtAmortisedCostMember2024-12-310001001290country:LUifrs-full:InvestmentsInEquityInstrumentsMeasuredAtFairValueThroughOtherComprehensiveIncomeMember2024-12-310001001290country:LU2024-12-310001001290country:NLifrs-full:FinancialAssetsAtFairValueThroughProfitOrLossClassifiedAsHeldForTradingCategoryMember2025-12-310001001290country:NLifrs-full:FinancialAssetsAtFairValueThroughProfitOrLossDesignatedUponInitialRecognitionCategoryMember2025-12-310001001290country:NLifrs-full:FinancialAssetsAtAmortisedCostMember2025-12-310001001290country:NLifrs-full:InvestmentsInEquityInstrumentsMeasuredAtFairValueThroughOtherComprehensiveIncomeMember2025-12-310001001290country:NL2025-12-310001001290country:NLifrs-full:FinancialAssetsAtFairValueThroughProfitOrLossClassifiedAsHeldForTradingCategoryMember2024-12-310001001290country:NLifrs-full:FinancialAssetsAtFairValueThroughProfitOrLossDesignatedUponInitialRecognitionCategoryMember2024-12-310001001290country:NLifrs-full:FinancialAssetsAtAmortisedCostMember2024-12-310001001290country:NLifrs-full:InvestmentsInEquityInstrumentsMeasuredAtFairValueThroughOtherComprehensiveIncomeMember2024-12-310001001290country:NL2024-12-310001001290bap:OtherInEuropeMemberifrs-full:FinancialAssetsAtFairValueThroughProfitOrLossClassifiedAsHeldForTradingCategoryMember2025-12-310001001290bap:OtherInEuropeMemberifrs-full:FinancialAssetsAtFairValueThroughProfitOrLossDesignatedUponInitialRecognitionCategoryMember2025-12-310001001290bap:OtherInEuropeMemberifrs-full:FinancialAssetsAtAmortisedCostMember2025-12-310001001290bap:OtherInEuropeMemberifrs-full:InvestmentsInEquityInstrumentsMeasuredAtFairValueThroughOtherComprehensiveIncomeMember2025-12-310001001290bap:OtherInEuropeMember2025-12-310001001290bap:OtherInEuropeMemberifrs-full:FinancialAssetsAtFairValueThroughProfitOrLossClassifiedAsHeldForTradingCategoryMember2024-12-310001001290bap:OtherInEuropeMemberifrs-full:FinancialAssetsAtFairValueThroughProfitOrLossDesignatedUponInitialRecognitionCategoryMember2024-12-310001001290bap:OtherInEuropeMemberifrs-full:FinancialAssetsAtAmortisedCostMember2024-12-310001001290bap:OtherInEuropeMemberifrs-full:InvestmentsInEquityInstrumentsMeasuredAtFairValueThroughOtherComprehensiveIncomeMember2024-12-310001001290bap:OtherInEuropeMember2024-12-310001001290bap:OtherCountryMemberifrs-full:FinancialAssetsAtFairValueThroughProfitOrLossClassifiedAsHeldForTradingCategoryMember2025-12-310001001290bap:OtherCountryMemberifrs-full:FinancialAssetsAtFairValueThroughProfitOrLossDesignatedUponInitialRecognitionCategoryMember2025-12-310001001290bap:OtherCountryMemberifrs-full:FinancialAssetsAtAmortisedCostMember2025-12-310001001290bap:OtherCountryMemberifrs-full:InvestmentsInEquityInstrumentsMeasuredAtFairValueThroughOtherComprehensiveIncomeMember2025-12-310001001290bap:OtherCountryMember2025-12-310001001290bap:OtherCountryMemberifrs-full:FinancialAssetsAtFairValueThroughProfitOrLossClassifiedAsHeldForTradingCategoryMember2024-12-310001001290bap:OtherCountryMemberifrs-full:FinancialAssetsAtFairValueThroughProfitOrLossDesignatedUponInitialRecognitionCategoryMember2024-12-310001001290bap:OtherCountryMemberifrs-full:FinancialAssetsAtAmortisedCostMember2024-12-310001001290bap:OtherCountryMemberifrs-full:InvestmentsInEquityInstrumentsMeasuredAtFairValueThroughOtherComprehensiveIncomeMember2024-12-310001001290bap:OtherCountryMember2024-12-310001001290ifrs-full:DerivativesMember2025-12-310001001290bap:CashCollateralReverseRepurchaseAgreementsAndSecuritiesBorrowingsMember2025-12-310001001290bap:InvestmentsAtFairValueThroughOtherComprehensiveIncomeAndAmortizedCostPledgedAsCollateralMember2025-12-310001001290ifrs-full:DerivativesMember2024-12-310001001290bap:CashCollateralReverseRepurchaseAgreementsAndSecuritiesBorrowingsMember2024-12-310001001290bap:InvestmentsAtFairValueThroughOtherComprehensiveIncomeAndAmortizedCostPledgedAsCollateralMember2024-12-310001001290ifrs-full:DerivativesMember2025-12-310001001290bap:PayablesFromRepurchaseAgreementsAndSecurityLendingsMember2025-12-310001001290ifrs-full:DerivativesMember2024-12-310001001290bap:PayablesFromRepurchaseAgreementsAndSecurityLendingsMember2024-12-310001001290ifrs-full:InterestRateRiskMember2025-12-310001001290ifrs-full:InterestRateRiskMember2024-12-310001001290bap:PriceRiskMember2025-12-310001001290bap:PriceRiskMember2024-12-310001001290bap:VolatilityRiskMember2025-12-310001001290bap:VolatilityRiskMember2024-12-310001001290ifrs-full:RiskDiversificationEffectMember2025-12-310001001290ifrs-full:RiskDiversificationEffectMember2024-12-310001001290ifrs-full:InterestRateRiskMember2025-01-012025-12-310001001290bap:CashAndCashCollateralReverseRepurchaseAgreementsAndSecuritiesBorrowingMemberifrs-full:InterestRateRiskMemberifrs-full:NotLaterThanOneMonthMember2025-12-310001001290bap:CashAndCashCollateralReverseRepurchaseAgreementsAndSecuritiesBorrowingMemberifrs-full:InterestRateRiskMemberifrs-full:LaterThanOneMonthAndNotLaterThanThreeMonthsMember2025-12-310001001290bap:CashAndCashCollateralReverseRepurchaseAgreementsAndSecuritiesBorrowingMemberifrs-full:InterestRateRiskMemberifrs-full:LaterThanThreeMonthsAndNotLaterThanOneYearMember2025-12-310001001290bap:CashAndCashCollateralReverseRepurchaseAgreementsAndSecuritiesBorrowingMemberifrs-full:InterestRateRiskMemberifrs-full:LaterThanOneYearAndNotLaterThanFiveYearsMember2025-12-310001001290bap:CashAndCashCollateralReverseRepurchaseAgreementsAndSecuritiesBorrowingMemberifrs-full:InterestRateRiskMemberifrs-full:LaterThanFiveYearsMember2025-12-310001001290bap:CashAndCashCollateralReverseRepurchaseAgreementsAndSecuritiesBorrowingMemberbap:NoninterestBearingAssetsMemberifrs-full:InterestRateRiskMember2025-12-310001001290bap:CashAndCashCollateralReverseRepurchaseAgreementsAndSecuritiesBorrowingMemberifrs-full:InterestRateRiskMember2025-12-310001001290bap:InvestmentMemberifrs-full:InterestRateRiskMemberifrs-full:NotLaterThanOneMonthMember2025-12-310001001290bap:InvestmentMemberifrs-full:InterestRateRiskMemberifrs-full:LaterThanOneMonthAndNotLaterThanThreeMonthsMember2025-12-310001001290bap:InvestmentMemberifrs-full:InterestRateRiskMemberifrs-full:LaterThanThreeMonthsAndNotLaterThanOneYearMember2025-12-310001001290bap:InvestmentMemberifrs-full:InterestRateRiskMemberifrs-full:LaterThanOneYearAndNotLaterThanFiveYearsMember2025-12-310001001290bap:InvestmentMemberifrs-full:InterestRateRiskMemberifrs-full:LaterThanFiveYearsMember2025-12-310001001290bap:InvestmentMemberbap:NoninterestBearingAssetsMemberifrs-full:InterestRateRiskMember2025-12-310001001290bap:InvestmentMemberifrs-full:InterestRateRiskMember2025-12-310001001290bap:LoansNetMemberifrs-full:InterestRateRiskMemberifrs-full:NotLaterThanOneMonthMember2025-12-310001001290bap:LoansNetMemberifrs-full:InterestRateRiskMemberifrs-full:LaterThanOneMonthAndNotLaterThanThreeMonthsMember2025-12-310001001290bap:LoansNetMemberifrs-full:InterestRateRiskMemberifrs-full:LaterThanThreeMonthsAndNotLaterThanOneYearMember2025-12-310001001290bap:LoansNetMemberifrs-full:InterestRateRiskMemberifrs-full:LaterThanOneYearAndNotLaterThanFiveYearsMember2025-12-310001001290bap:LoansNetMemberifrs-full:InterestRateRiskMemberifrs-full:LaterThanFiveYearsMember2025-12-310001001290bap:LoansNetMemberbap:NoninterestBearingAssetsMemberifrs-full:InterestRateRiskMember2025-12-310001001290bap:LoansNetMemberifrs-full:InterestRateRiskMember2025-12-310001001290bap:FinancialAssetsDesignatedAtFairValueThroughProfitOrLossMemberifrs-full:InterestRateRiskMemberifrs-full:NotLaterThanOneMonthMember2025-12-310001001290bap:FinancialAssetsDesignatedAtFairValueThroughProfitOrLossMemberifrs-full:InterestRateRiskMemberifrs-full:LaterThanOneMonthAndNotLaterThanThreeMonthsMember2025-12-310001001290bap:FinancialAssetsDesignatedAtFairValueThroughProfitOrLossMemberifrs-full:InterestRateRiskMemberifrs-full:LaterThanThreeMonthsAndNotLaterThanOneYearMember2025-12-310001001290bap:FinancialAssetsDesignatedAtFairValueThroughProfitOrLossMemberifrs-full:InterestRateRiskMemberifrs-full:LaterThanOneYearAndNotLaterThanFiveYearsMember2025-12-310001001290bap:FinancialAssetsDesignatedAtFairValueThroughProfitOrLossMemberifrs-full:InterestRateRiskMemberifrs-full:LaterThanFiveYearsMember2025-12-310001001290bap:FinancialAssetsDesignatedAtFairValueThroughProfitOrLossMemberbap:NoninterestBearingAssetsMemberifrs-full:InterestRateRiskMember2025-12-310001001290bap:FinancialAssetsDesignatedAtFairValueThroughProfitOrLossMemberifrs-full:InterestRateRiskMember2025-12-310001001290bap:ReinsuranceAndInsuranceContractAssetsMemberifrs-full:InterestRateRiskMemberifrs-full:NotLaterThanOneMonthMember2025-12-310001001290bap:ReinsuranceAndInsuranceContractAssetsMemberifrs-full:InterestRateRiskMemberifrs-full:LaterThanOneMonthAndNotLaterThanThreeMonthsMember2025-12-310001001290bap:ReinsuranceAndInsuranceContractAssetsMemberifrs-full:InterestRateRiskMemberifrs-full:LaterThanThreeMonthsAndNotLaterThanOneYearMember2025-12-310001001290bap:ReinsuranceAndInsuranceContractAssetsMemberifrs-full:InterestRateRiskMemberifrs-full:LaterThanOneYearAndNotLaterThanFiveYearsMember2025-12-310001001290bap:ReinsuranceAndInsuranceContractAssetsMemberifrs-full:InterestRateRiskMemberifrs-full:LaterThanFiveYearsMember2025-12-310001001290bap:ReinsuranceAndInsuranceContractAssetsMemberbap:NoninterestBearingAssetsMemberifrs-full:InterestRateRiskMember2025-12-310001001290bap:ReinsuranceAndInsuranceContractAssetsMemberifrs-full:InterestRateRiskMember2025-12-310001001290bap:OtherAssetMemberifrs-full:InterestRateRiskMemberifrs-full:NotLaterThanOneMonthMember2025-12-310001001290bap:OtherAssetMemberifrs-full:InterestRateRiskMemberifrs-full:LaterThanOneMonthAndNotLaterThanThreeMonthsMember2025-12-310001001290bap:OtherAssetMemberifrs-full:InterestRateRiskMemberifrs-full:LaterThanThreeMonthsAndNotLaterThanOneYearMember2025-12-310001001290bap:OtherAssetMemberifrs-full:InterestRateRiskMemberifrs-full:LaterThanOneYearAndNotLaterThanFiveYearsMember2025-12-310001001290bap:OtherAssetMemberifrs-full:InterestRateRiskMemberifrs-full:LaterThanFiveYearsMember2025-12-310001001290bap:OtherAssetMemberbap:NoninterestBearingAssetsMemberifrs-full:InterestRateRiskMember2025-12-310001001290bap:OtherAssetMemberifrs-full:InterestRateRiskMember2025-12-310001001290bap:AssetMemberifrs-full:InterestRateRiskMemberifrs-full:NotLaterThanOneMonthMember2025-12-310001001290bap:AssetMemberifrs-full:InterestRateRiskMemberifrs-full:LaterThanOneMonthAndNotLaterThanThreeMonthsMember2025-12-310001001290bap:AssetMemberifrs-full:InterestRateRiskMemberifrs-full:LaterThanThreeMonthsAndNotLaterThanOneYearMember2025-12-310001001290bap:AssetMemberifrs-full:InterestRateRiskMemberifrs-full:LaterThanOneYearAndNotLaterThanFiveYearsMember2025-12-310001001290bap:AssetMemberifrs-full:InterestRateRiskMemberifrs-full:LaterThanFiveYearsMember2025-12-310001001290bap:AssetMemberbap:NoninterestBearingAssetsMemberifrs-full:InterestRateRiskMember2025-12-310001001290bap:AssetMemberifrs-full:InterestRateRiskMember2025-12-310001001290bap:DepositsAndObligationsMemberifrs-full:InterestRateRiskMemberifrs-full:NotLaterThanOneMonthMember2025-12-310001001290bap:DepositsAndObligationsMemberifrs-full:InterestRateRiskMemberifrs-full:LaterThanOneMonthAndNotLaterThanThreeMonthsMember2025-12-310001001290bap:DepositsAndObligationsMemberifrs-full:InterestRateRiskMemberifrs-full:LaterThanThreeMonthsAndNotLaterThanOneYearMember2025-12-310001001290bap:DepositsAndObligationsMemberifrs-full:InterestRateRiskMemberifrs-full:LaterThanOneYearAndNotLaterThanFiveYearsMember2025-12-310001001290bap:DepositsAndObligationsMemberifrs-full:InterestRateRiskMemberifrs-full:LaterThanFiveYearsMember2025-12-310001001290bap:DepositsAndObligationsMemberbap:NoninterestBearingAssetsMemberifrs-full:InterestRateRiskMember2025-12-310001001290bap:DepositsAndObligationsMemberifrs-full:InterestRateRiskMember2025-12-310001001290bap:PayablesFromRepurchaseAgreementsAndSecuritiesLendingAndDueToBanksAndCorrespondentsMemberifrs-full:InterestRateRiskMemberifrs-full:NotLaterThanOneMonthMember2025-12-310001001290bap:PayablesFromRepurchaseAgreementsAndSecuritiesLendingAndDueToBanksAndCorrespondentsMemberifrs-full:InterestRateRiskMemberifrs-full:LaterThanOneMonthAndNotLaterThanThreeMonthsMember2025-12-310001001290bap:PayablesFromRepurchaseAgreementsAndSecuritiesLendingAndDueToBanksAndCorrespondentsMemberifrs-full:InterestRateRiskMemberifrs-full:LaterThanThreeMonthsAndNotLaterThanOneYearMember2025-12-310001001290bap:PayablesFromRepurchaseAgreementsAndSecuritiesLendingAndDueToBanksAndCorrespondentsMemberifrs-full:InterestRateRiskMemberifrs-full:LaterThanOneYearAndNotLaterThanFiveYearsMember2025-12-310001001290bap:PayablesFromRepurchaseAgreementsAndSecuritiesLendingAndDueToBanksAndCorrespondentsMemberifrs-full:InterestRateRiskMemberifrs-full:LaterThanFiveYearsMember2025-12-310001001290bap:PayablesFromRepurchaseAgreementsAndSecuritiesLendingAndDueToBanksAndCorrespondentsMemberbap:NoninterestBearingAssetsMemberifrs-full:InterestRateRiskMember2025-12-310001001290bap:PayablesFromRepurchaseAgreementsAndSecuritiesLendingAndDueToBanksAndCorrespondentsMemberifrs-full:InterestRateRiskMember2025-12-310001001290bap:InsuranceAndReinsuranceContractLiabilityMemberifrs-full:InterestRateRiskMemberifrs-full:NotLaterThanOneMonthMember2025-12-310001001290bap:InsuranceAndReinsuranceContractLiabilityMemberifrs-full:InterestRateRiskMemberifrs-full:LaterThanOneMonthAndNotLaterThanThreeMonthsMember2025-12-310001001290bap:InsuranceAndReinsuranceContractLiabilityMemberifrs-full:InterestRateRiskMemberifrs-full:LaterThanThreeMonthsAndNotLaterThanOneYearMember2025-12-310001001290bap:InsuranceAndReinsuranceContractLiabilityMemberifrs-full:InterestRateRiskMemberifrs-full:LaterThanOneYearAndNotLaterThanFiveYearsMember2025-12-310001001290bap:InsuranceAndReinsuranceContractLiabilityMemberifrs-full:InterestRateRiskMemberifrs-full:LaterThanFiveYearsMember2025-12-310001001290bap:InsuranceAndReinsuranceContractLiabilityMemberbap:NoninterestBearingAssetsMemberifrs-full:InterestRateRiskMember2025-12-310001001290bap:InsuranceAndReinsuranceContractLiabilityMemberifrs-full:InterestRateRiskMember2025-12-310001001290bap:FinancialLiabilitiesAtFairValueThroughProfitOrLossMemberifrs-full:InterestRateRiskMemberifrs-full:NotLaterThanOneMonthMember2025-12-310001001290bap:FinancialLiabilitiesAtFairValueThroughProfitOrLossMemberifrs-full:InterestRateRiskMemberifrs-full:LaterThanOneMonthAndNotLaterThanThreeMonthsMember2025-12-310001001290bap:FinancialLiabilitiesAtFairValueThroughProfitOrLossMemberifrs-full:InterestRateRiskMemberifrs-full:LaterThanThreeMonthsAndNotLaterThanOneYearMember2025-12-310001001290bap:FinancialLiabilitiesAtFairValueThroughProfitOrLossMemberifrs-full:InterestRateRiskMemberifrs-full:LaterThanOneYearAndNotLaterThanFiveYearsMember2025-12-310001001290bap:FinancialLiabilitiesAtFairValueThroughProfitOrLossMemberifrs-full:InterestRateRiskMemberifrs-full:LaterThanFiveYearsMember2025-12-310001001290bap:FinancialLiabilitiesAtFairValueThroughProfitOrLossMemberbap:NoninterestBearingAssetsMemberifrs-full:InterestRateRiskMember2025-12-310001001290bap:FinancialLiabilitiesAtFairValueThroughProfitOrLossMemberifrs-full:InterestRateRiskMember2025-12-310001001290bap:BondsAndNotesIssuedMemberifrs-full:InterestRateRiskMemberifrs-full:NotLaterThanOneMonthMember2025-12-310001001290bap:BondsAndNotesIssuedMemberifrs-full:InterestRateRiskMemberifrs-full:LaterThanOneMonthAndNotLaterThanThreeMonthsMember2025-12-310001001290bap:BondsAndNotesIssuedMemberifrs-full:InterestRateRiskMemberifrs-full:LaterThanThreeMonthsAndNotLaterThanOneYearMember2025-12-310001001290bap:BondsAndNotesIssuedMemberifrs-full:InterestRateRiskMemberifrs-full:LaterThanOneYearAndNotLaterThanFiveYearsMember2025-12-310001001290bap:BondsAndNotesIssuedMemberifrs-full:InterestRateRiskMemberifrs-full:LaterThanFiveYearsMember2025-12-310001001290bap:BondsAndNotesIssuedMemberbap:NoninterestBearingAssetsMemberifrs-full:InterestRateRiskMember2025-12-310001001290bap:BondsAndNotesIssuedMemberifrs-full:InterestRateRiskMember2025-12-310001001290bap:OtherLiabilityMemberifrs-full:InterestRateRiskMemberifrs-full:NotLaterThanOneMonthMember2025-12-310001001290bap:OtherLiabilityMemberifrs-full:InterestRateRiskMemberifrs-full:LaterThanOneMonthAndNotLaterThanThreeMonthsMember2025-12-310001001290bap:OtherLiabilityMemberifrs-full:InterestRateRiskMemberifrs-full:LaterThanThreeMonthsAndNotLaterThanOneYearMember2025-12-310001001290bap:OtherLiabilityMemberifrs-full:InterestRateRiskMemberifrs-full:LaterThanOneYearAndNotLaterThanFiveYearsMember2025-12-310001001290bap:OtherLiabilityMemberifrs-full:InterestRateRiskMemberifrs-full:LaterThanFiveYearsMember2025-12-310001001290bap:OtherLiabilityMemberbap:NoninterestBearingAssetsMemberifrs-full:InterestRateRiskMember2025-12-310001001290bap:OtherLiabilityMemberifrs-full:InterestRateRiskMember2025-12-310001001290bap:EquitysMemberifrs-full:InterestRateRiskMemberifrs-full:NotLaterThanOneMonthMember2025-12-310001001290bap:EquitysMemberifrs-full:InterestRateRiskMemberifrs-full:LaterThanOneMonthAndNotLaterThanThreeMonthsMember2025-12-310001001290bap:EquitysMemberifrs-full:InterestRateRiskMemberifrs-full:LaterThanThreeMonthsAndNotLaterThanOneYearMember2025-12-310001001290bap:EquitysMemberifrs-full:InterestRateRiskMemberifrs-full:LaterThanOneYearAndNotLaterThanFiveYearsMember2025-12-310001001290bap:EquitysMemberifrs-full:InterestRateRiskMemberifrs-full:LaterThanFiveYearsMember2025-12-310001001290bap:EquitysMemberbap:NoninterestBearingAssetsMemberifrs-full:InterestRateRiskMember2025-12-310001001290bap:EquitysMemberifrs-full:InterestRateRiskMember2025-12-310001001290bap:LiabilitiesAndEquityMemberifrs-full:InterestRateRiskMemberifrs-full:NotLaterThanOneMonthMember2025-12-310001001290bap:LiabilitiesAndEquityMemberifrs-full:InterestRateRiskMemberifrs-full:LaterThanOneMonthAndNotLaterThanThreeMonthsMember2025-12-310001001290bap:LiabilitiesAndEquityMemberifrs-full:InterestRateRiskMemberifrs-full:LaterThanThreeMonthsAndNotLaterThanOneYearMember2025-12-310001001290bap:LiabilitiesAndEquityMemberifrs-full:InterestRateRiskMemberifrs-full:LaterThanOneYearAndNotLaterThanFiveYearsMember2025-12-310001001290bap:LiabilitiesAndEquityMemberifrs-full:InterestRateRiskMemberifrs-full:LaterThanFiveYearsMember2025-12-310001001290bap:LiabilitiesAndEquityMemberbap:NoninterestBearingAssetsMemberifrs-full:InterestRateRiskMember2025-12-310001001290bap:LiabilitiesAndEquityMemberifrs-full:InterestRateRiskMember2025-12-310001001290bap:DerivativeFinancialAssetsMemberifrs-full:InterestRateRiskMemberifrs-full:NotLaterThanOneMonthMember2025-12-310001001290bap:DerivativeFinancialAssetsMemberifrs-full:InterestRateRiskMemberifrs-full:LaterThanOneMonthAndNotLaterThanThreeMonthsMember2025-12-310001001290bap:DerivativeFinancialAssetsMemberifrs-full:InterestRateRiskMemberifrs-full:LaterThanThreeMonthsAndNotLaterThanOneYearMember2025-12-310001001290bap:DerivativeFinancialAssetsMemberifrs-full:InterestRateRiskMemberifrs-full:LaterThanOneYearAndNotLaterThanFiveYearsMember2025-12-310001001290bap:DerivativeFinancialAssetsMemberifrs-full:InterestRateRiskMemberifrs-full:LaterThanFiveYearsMember2025-12-310001001290bap:DerivativeFinancialAssetsMemberbap:NoninterestBearingAssetsMemberifrs-full:InterestRateRiskMember2025-12-310001001290bap:DerivativeFinancialAssetsMemberifrs-full:InterestRateRiskMember2025-12-310001001290bap:DerivativeFinancialLiabilitiesMemberifrs-full:InterestRateRiskMemberifrs-full:NotLaterThanOneMonthMember2025-12-310001001290bap:DerivativeFinancialLiabilitiesMemberifrs-full:InterestRateRiskMemberifrs-full:LaterThanOneMonthAndNotLaterThanThreeMonthsMember2025-12-310001001290bap:DerivativeFinancialLiabilitiesMemberifrs-full:InterestRateRiskMemberifrs-full:LaterThanThreeMonthsAndNotLaterThanOneYearMember2025-12-310001001290bap:DerivativeFinancialLiabilitiesMemberifrs-full:InterestRateRiskMemberifrs-full:LaterThanOneYearAndNotLaterThanFiveYearsMember2025-12-310001001290bap:DerivativeFinancialLiabilitiesMemberifrs-full:InterestRateRiskMemberifrs-full:LaterThanFiveYearsMember2025-12-310001001290bap:DerivativeFinancialLiabilitiesMemberbap:NoninterestBearingAssetsMemberifrs-full:InterestRateRiskMember2025-12-310001001290bap:DerivativeFinancialLiabilitiesMemberifrs-full:InterestRateRiskMember2025-12-310001001290bap:DerivativeNetMemberifrs-full:InterestRateRiskMemberifrs-full:NotLaterThanOneMonthMember2025-12-310001001290bap:DerivativeNetMemberifrs-full:InterestRateRiskMemberifrs-full:LaterThanOneMonthAndNotLaterThanThreeMonthsMember2025-12-310001001290bap:DerivativeNetMemberifrs-full:InterestRateRiskMemberifrs-full:LaterThanThreeMonthsAndNotLaterThanOneYearMember2025-12-310001001290bap:DerivativeNetMemberifrs-full:InterestRateRiskMemberifrs-full:LaterThanOneYearAndNotLaterThanFiveYearsMember2025-12-310001001290bap:DerivativeNetMemberifrs-full:InterestRateRiskMemberifrs-full:LaterThanFiveYearsMember2025-12-310001001290bap:DerivativeNetMemberbap:NoninterestBearingAssetsMemberifrs-full:InterestRateRiskMember2025-12-310001001290bap:DerivativeNetMemberifrs-full:InterestRateRiskMember2025-12-310001001290bap:MarginalDifferenceMemberifrs-full:InterestRateRiskMemberifrs-full:NotLaterThanOneMonthMember2025-12-310001001290bap:MarginalDifferenceMemberifrs-full:InterestRateRiskMemberifrs-full:LaterThanOneMonthAndNotLaterThanThreeMonthsMember2025-12-310001001290bap:MarginalDifferenceMemberifrs-full:InterestRateRiskMemberifrs-full:LaterThanThreeMonthsAndNotLaterThanOneYearMember2025-12-310001001290bap:MarginalDifferenceMemberifrs-full:InterestRateRiskMemberifrs-full:LaterThanOneYearAndNotLaterThanFiveYearsMember2025-12-310001001290bap:MarginalDifferenceMemberifrs-full:InterestRateRiskMemberifrs-full:LaterThanFiveYearsMember2025-12-310001001290bap:MarginalDifferenceMemberbap:NoninterestBearingAssetsMemberifrs-full:InterestRateRiskMember2025-12-310001001290bap:MarginalDifferenceMemberifrs-full:InterestRateRiskMember2025-12-310001001290bap:AccumulatedDifferenceMemberifrs-full:InterestRateRiskMemberifrs-full:NotLaterThanOneMonthMember2025-12-310001001290bap:AccumulatedDifferenceMemberifrs-full:InterestRateRiskMemberifrs-full:LaterThanOneMonthAndNotLaterThanThreeMonthsMember2025-12-310001001290bap:AccumulatedDifferenceMemberifrs-full:InterestRateRiskMemberifrs-full:LaterThanThreeMonthsAndNotLaterThanOneYearMember2025-12-310001001290bap:AccumulatedDifferenceMemberifrs-full:InterestRateRiskMemberifrs-full:LaterThanOneYearAndNotLaterThanFiveYearsMember2025-12-310001001290bap:AccumulatedDifferenceMemberifrs-full:InterestRateRiskMemberifrs-full:LaterThanFiveYearsMember2025-12-310001001290bap:AccumulatedDifferenceMemberbap:NoninterestBearingAssetsMemberifrs-full:InterestRateRiskMember2025-12-310001001290bap:AccumulatedDifferenceMemberifrs-full:InterestRateRiskMember2025-12-310001001290bap:CashAndCashCollateralReverseRepurchaseAgreementsAndSecuritiesBorrowingMemberifrs-full:InterestRateRiskMemberifrs-full:NotLaterThanOneMonthMember2024-12-310001001290bap:CashAndCashCollateralReverseRepurchaseAgreementsAndSecuritiesBorrowingMemberifrs-full:InterestRateRiskMemberifrs-full:LaterThanOneMonthAndNotLaterThanThreeMonthsMember2024-12-310001001290bap:CashAndCashCollateralReverseRepurchaseAgreementsAndSecuritiesBorrowingMemberifrs-full:InterestRateRiskMemberifrs-full:LaterThanThreeMonthsAndNotLaterThanOneYearMember2024-12-310001001290bap:CashAndCashCollateralReverseRepurchaseAgreementsAndSecuritiesBorrowingMemberifrs-full:InterestRateRiskMemberifrs-full:LaterThanOneYearAndNotLaterThanFiveYearsMember2024-12-310001001290bap:CashAndCashCollateralReverseRepurchaseAgreementsAndSecuritiesBorrowingMemberifrs-full:InterestRateRiskMemberifrs-full:LaterThanFiveYearsMember2024-12-310001001290bap:CashAndCashCollateralReverseRepurchaseAgreementsAndSecuritiesBorrowingMemberbap:NoninterestBearingAssetsMemberifrs-full:InterestRateRiskMember2024-12-310001001290bap:CashAndCashCollateralReverseRepurchaseAgreementsAndSecuritiesBorrowingMemberifrs-full:InterestRateRiskMember2024-12-310001001290bap:InvestmentMemberifrs-full:InterestRateRiskMemberifrs-full:NotLaterThanOneMonthMember2024-12-310001001290bap:InvestmentMemberifrs-full:InterestRateRiskMemberifrs-full:LaterThanOneMonthAndNotLaterThanThreeMonthsMember2024-12-310001001290bap:InvestmentMemberifrs-full:InterestRateRiskMemberifrs-full:LaterThanThreeMonthsAndNotLaterThanOneYearMember2024-12-310001001290bap:InvestmentMemberifrs-full:InterestRateRiskMemberifrs-full:LaterThanOneYearAndNotLaterThanFiveYearsMember2024-12-310001001290bap:InvestmentMemberifrs-full:InterestRateRiskMemberifrs-full:LaterThanFiveYearsMember2024-12-310001001290bap:InvestmentMemberbap:NoninterestBearingAssetsMemberifrs-full:InterestRateRiskMember2024-12-310001001290bap:InvestmentMemberifrs-full:InterestRateRiskMember2024-12-310001001290bap:LoansNetMemberifrs-full:InterestRateRiskMemberifrs-full:NotLaterThanOneMonthMember2024-12-310001001290bap:LoansNetMemberifrs-full:InterestRateRiskMemberifrs-full:LaterThanOneMonthAndNotLaterThanThreeMonthsMember2024-12-310001001290bap:LoansNetMemberifrs-full:InterestRateRiskMemberifrs-full:LaterThanThreeMonthsAndNotLaterThanOneYearMember2024-12-310001001290bap:LoansNetMemberifrs-full:InterestRateRiskMemberifrs-full:LaterThanOneYearAndNotLaterThanFiveYearsMember2024-12-310001001290bap:LoansNetMemberifrs-full:InterestRateRiskMemberifrs-full:LaterThanFiveYearsMember2024-12-310001001290bap:LoansNetMemberbap:NoninterestBearingAssetsMemberifrs-full:InterestRateRiskMember2024-12-310001001290bap:LoansNetMemberifrs-full:InterestRateRiskMember2024-12-310001001290bap:FinancialAssetsDesignatedAtFairValueThroughProfitOrLossMemberifrs-full:InterestRateRiskMemberifrs-full:NotLaterThanOneMonthMember2024-12-310001001290bap:FinancialAssetsDesignatedAtFairValueThroughProfitOrLossMemberifrs-full:InterestRateRiskMemberifrs-full:LaterThanOneMonthAndNotLaterThanThreeMonthsMember2024-12-310001001290bap:FinancialAssetsDesignatedAtFairValueThroughProfitOrLossMemberifrs-full:InterestRateRiskMemberifrs-full:LaterThanThreeMonthsAndNotLaterThanOneYearMember2024-12-310001001290bap:FinancialAssetsDesignatedAtFairValueThroughProfitOrLossMemberifrs-full:InterestRateRiskMemberifrs-full:LaterThanOneYearAndNotLaterThanFiveYearsMember2024-12-310001001290bap:FinancialAssetsDesignatedAtFairValueThroughProfitOrLossMemberifrs-full:InterestRateRiskMemberifrs-full:LaterThanFiveYearsMember2024-12-310001001290bap:FinancialAssetsDesignatedAtFairValueThroughProfitOrLossMemberbap:NoninterestBearingAssetsMemberifrs-full:InterestRateRiskMember2024-12-310001001290bap:FinancialAssetsDesignatedAtFairValueThroughProfitOrLossMemberifrs-full:InterestRateRiskMember2024-12-310001001290bap:ReinsuranceAndInsuranceContractAssetsMemberifrs-full:InterestRateRiskMemberifrs-full:NotLaterThanOneMonthMember2024-12-310001001290bap:ReinsuranceAndInsuranceContractAssetsMemberifrs-full:InterestRateRiskMemberifrs-full:LaterThanOneMonthAndNotLaterThanThreeMonthsMember2024-12-310001001290bap:ReinsuranceAndInsuranceContractAssetsMemberifrs-full:InterestRateRiskMemberifrs-full:LaterThanThreeMonthsAndNotLaterThanOneYearMember2024-12-310001001290bap:ReinsuranceAndInsuranceContractAssetsMemberifrs-full:InterestRateRiskMemberifrs-full:LaterThanOneYearAndNotLaterThanFiveYearsMember2024-12-310001001290bap:ReinsuranceAndInsuranceContractAssetsMemberifrs-full:InterestRateRiskMemberifrs-full:LaterThanFiveYearsMember2024-12-310001001290bap:ReinsuranceAndInsuranceContractAssetsMemberbap:NoninterestBearingAssetsMemberifrs-full:InterestRateRiskMember2024-12-310001001290bap:ReinsuranceAndInsuranceContractAssetsMemberifrs-full:InterestRateRiskMember2024-12-310001001290bap:OtherAssetMemberifrs-full:InterestRateRiskMemberifrs-full:NotLaterThanOneMonthMember2024-12-310001001290bap:OtherAssetMemberifrs-full:InterestRateRiskMemberifrs-full:LaterThanOneMonthAndNotLaterThanThreeMonthsMember2024-12-310001001290bap:OtherAssetMemberifrs-full:InterestRateRiskMemberifrs-full:LaterThanThreeMonthsAndNotLaterThanOneYearMember2024-12-310001001290bap:OtherAssetMemberifrs-full:InterestRateRiskMemberifrs-full:LaterThanOneYearAndNotLaterThanFiveYearsMember2024-12-310001001290bap:OtherAssetMemberifrs-full:InterestRateRiskMemberifrs-full:LaterThanFiveYearsMember2024-12-310001001290bap:OtherAssetMemberbap:NoninterestBearingAssetsMemberifrs-full:InterestRateRiskMember2024-12-310001001290bap:OtherAssetMemberifrs-full:InterestRateRiskMember2024-12-310001001290bap:AssetMemberifrs-full:InterestRateRiskMemberifrs-full:NotLaterThanOneMonthMember2024-12-310001001290bap:AssetMemberifrs-full:InterestRateRiskMemberifrs-full:LaterThanOneMonthAndNotLaterThanThreeMonthsMember2024-12-310001001290bap:AssetMemberifrs-full:InterestRateRiskMemberifrs-full:LaterThanThreeMonthsAndNotLaterThanOneYearMember2024-12-310001001290bap:AssetMemberifrs-full:InterestRateRiskMemberifrs-full:LaterThanOneYearAndNotLaterThanFiveYearsMember2024-12-310001001290bap:AssetMemberifrs-full:InterestRateRiskMemberifrs-full:LaterThanFiveYearsMember2024-12-310001001290bap:AssetMemberbap:NoninterestBearingAssetsMemberifrs-full:InterestRateRiskMember2024-12-310001001290bap:AssetMemberifrs-full:InterestRateRiskMember2024-12-310001001290bap:DepositsAndObligationsMemberifrs-full:InterestRateRiskMemberifrs-full:NotLaterThanOneMonthMember2024-12-310001001290bap:DepositsAndObligationsMemberifrs-full:InterestRateRiskMemberifrs-full:LaterThanOneMonthAndNotLaterThanThreeMonthsMember2024-12-310001001290bap:DepositsAndObligationsMemberifrs-full:InterestRateRiskMemberifrs-full:LaterThanThreeMonthsAndNotLaterThanOneYearMember2024-12-310001001290bap:DepositsAndObligationsMemberifrs-full:InterestRateRiskMemberifrs-full:LaterThanOneYearAndNotLaterThanFiveYearsMember2024-12-310001001290bap:DepositsAndObligationsMemberifrs-full:InterestRateRiskMemberifrs-full:LaterThanFiveYearsMember2024-12-310001001290bap:DepositsAndObligationsMemberbap:NoninterestBearingAssetsMemberifrs-full:InterestRateRiskMember2024-12-310001001290bap:DepositsAndObligationsMemberifrs-full:InterestRateRiskMember2024-12-310001001290bap:PayablesFromRepurchaseAgreementsAndSecuritiesLendingAndDueToBanksAndCorrespondentsMemberifrs-full:InterestRateRiskMemberifrs-full:NotLaterThanOneMonthMember2024-12-310001001290bap:PayablesFromRepurchaseAgreementsAndSecuritiesLendingAndDueToBanksAndCorrespondentsMemberifrs-full:InterestRateRiskMemberifrs-full:LaterThanOneMonthAndNotLaterThanThreeMonthsMember2024-12-310001001290bap:PayablesFromRepurchaseAgreementsAndSecuritiesLendingAndDueToBanksAndCorrespondentsMemberifrs-full:InterestRateRiskMemberifrs-full:LaterThanThreeMonthsAndNotLaterThanOneYearMember2024-12-310001001290bap:PayablesFromRepurchaseAgreementsAndSecuritiesLendingAndDueToBanksAndCorrespondentsMemberifrs-full:InterestRateRiskMemberifrs-full:LaterThanOneYearAndNotLaterThanFiveYearsMember2024-12-310001001290bap:PayablesFromRepurchaseAgreementsAndSecuritiesLendingAndDueToBanksAndCorrespondentsMemberifrs-full:InterestRateRiskMemberifrs-full:LaterThanFiveYearsMember2024-12-310001001290bap:PayablesFromRepurchaseAgreementsAndSecuritiesLendingAndDueToBanksAndCorrespondentsMemberbap:NoninterestBearingAssetsMemberifrs-full:InterestRateRiskMember2024-12-310001001290bap:PayablesFromRepurchaseAgreementsAndSecuritiesLendingAndDueToBanksAndCorrespondentsMemberifrs-full:InterestRateRiskMember2024-12-310001001290bap:InsuranceAndReinsuranceContractLiabilityMemberifrs-full:InterestRateRiskMemberifrs-full:NotLaterThanOneMonthMember2024-12-310001001290bap:InsuranceAndReinsuranceContractLiabilityMemberifrs-full:InterestRateRiskMemberifrs-full:LaterThanOneMonthAndNotLaterThanThreeMonthsMember2024-12-310001001290bap:InsuranceAndReinsuranceContractLiabilityMemberifrs-full:InterestRateRiskMemberifrs-full:LaterThanThreeMonthsAndNotLaterThanOneYearMember2024-12-310001001290bap:InsuranceAndReinsuranceContractLiabilityMemberifrs-full:InterestRateRiskMemberifrs-full:LaterThanOneYearAndNotLaterThanFiveYearsMember2024-12-310001001290bap:InsuranceAndReinsuranceContractLiabilityMemberifrs-full:InterestRateRiskMemberifrs-full:LaterThanFiveYearsMember2024-12-310001001290bap:InsuranceAndReinsuranceContractLiabilityMemberbap:NoninterestBearingAssetsMemberifrs-full:InterestRateRiskMember2024-12-310001001290bap:InsuranceAndReinsuranceContractLiabilityMemberifrs-full:InterestRateRiskMember2024-12-310001001290bap:FinancialLiabilitiesAtFairValueThroughProfitOrLossMemberifrs-full:InterestRateRiskMemberifrs-full:NotLaterThanOneMonthMember2024-12-310001001290bap:FinancialLiabilitiesAtFairValueThroughProfitOrLossMemberifrs-full:InterestRateRiskMemberifrs-full:LaterThanOneMonthAndNotLaterThanThreeMonthsMember2024-12-310001001290bap:FinancialLiabilitiesAtFairValueThroughProfitOrLossMemberifrs-full:InterestRateRiskMemberifrs-full:LaterThanThreeMonthsAndNotLaterThanOneYearMember2024-12-310001001290bap:FinancialLiabilitiesAtFairValueThroughProfitOrLossMemberifrs-full:InterestRateRiskMemberifrs-full:LaterThanOneYearAndNotLaterThanFiveYearsMember2024-12-310001001290bap:FinancialLiabilitiesAtFairValueThroughProfitOrLossMemberifrs-full:InterestRateRiskMemberifrs-full:LaterThanFiveYearsMember2024-12-310001001290bap:FinancialLiabilitiesAtFairValueThroughProfitOrLossMemberbap:NoninterestBearingAssetsMemberifrs-full:InterestRateRiskMember2024-12-310001001290bap:FinancialLiabilitiesAtFairValueThroughProfitOrLossMemberifrs-full:InterestRateRiskMember2024-12-310001001290bap:BondsAndNotesIssuedMemberifrs-full:InterestRateRiskMemberifrs-full:NotLaterThanOneMonthMember2024-12-310001001290bap:BondsAndNotesIssuedMemberifrs-full:InterestRateRiskMemberifrs-full:LaterThanOneMonthAndNotLaterThanThreeMonthsMember2024-12-310001001290bap:BondsAndNotesIssuedMemberifrs-full:InterestRateRiskMemberifrs-full:LaterThanThreeMonthsAndNotLaterThanOneYearMember2024-12-310001001290bap:BondsAndNotesIssuedMemberifrs-full:InterestRateRiskMemberifrs-full:LaterThanOneYearAndNotLaterThanFiveYearsMember2024-12-310001001290bap:BondsAndNotesIssuedMemberifrs-full:InterestRateRiskMemberifrs-full:LaterThanFiveYearsMember2024-12-310001001290bap:BondsAndNotesIssuedMemberbap:NoninterestBearingAssetsMemberifrs-full:InterestRateRiskMember2024-12-310001001290bap:BondsAndNotesIssuedMemberifrs-full:InterestRateRiskMember2024-12-310001001290bap:OtherLiabilityMemberifrs-full:InterestRateRiskMemberifrs-full:NotLaterThanOneMonthMember2024-12-310001001290bap:OtherLiabilityMemberifrs-full:InterestRateRiskMemberifrs-full:LaterThanOneMonthAndNotLaterThanThreeMonthsMember2024-12-310001001290bap:OtherLiabilityMemberifrs-full:InterestRateRiskMemberifrs-full:LaterThanThreeMonthsAndNotLaterThanOneYearMember2024-12-310001001290bap:OtherLiabilityMemberifrs-full:InterestRateRiskMemberifrs-full:LaterThanOneYearAndNotLaterThanFiveYearsMember2024-12-310001001290bap:OtherLiabilityMemberifrs-full:InterestRateRiskMemberifrs-full:LaterThanFiveYearsMember2024-12-310001001290bap:OtherLiabilityMemberbap:NoninterestBearingAssetsMemberifrs-full:InterestRateRiskMember2024-12-310001001290bap:OtherLiabilityMemberifrs-full:InterestRateRiskMember2024-12-310001001290bap:EquitysMemberifrs-full:InterestRateRiskMemberifrs-full:NotLaterThanOneMonthMember2024-12-310001001290bap:EquitysMemberifrs-full:InterestRateRiskMemberifrs-full:LaterThanOneMonthAndNotLaterThanThreeMonthsMember2024-12-310001001290bap:EquitysMemberifrs-full:InterestRateRiskMemberifrs-full:LaterThanThreeMonthsAndNotLaterThanOneYearMember2024-12-310001001290bap:EquitysMemberifrs-full:InterestRateRiskMemberifrs-full:LaterThanOneYearAndNotLaterThanFiveYearsMember2024-12-310001001290bap:EquitysMemberifrs-full:InterestRateRiskMemberifrs-full:LaterThanFiveYearsMember2024-12-310001001290bap:EquitysMemberbap:NoninterestBearingAssetsMemberifrs-full:InterestRateRiskMember2024-12-310001001290bap:EquitysMemberifrs-full:InterestRateRiskMember2024-12-310001001290bap:LiabilitiesAndEquityMemberifrs-full:InterestRateRiskMemberifrs-full:NotLaterThanOneMonthMember2024-12-310001001290bap:LiabilitiesAndEquityMemberifrs-full:InterestRateRiskMemberifrs-full:LaterThanOneMonthAndNotLaterThanThreeMonthsMember2024-12-310001001290bap:LiabilitiesAndEquityMemberifrs-full:InterestRateRiskMemberifrs-full:LaterThanThreeMonthsAndNotLaterThanOneYearMember2024-12-310001001290bap:LiabilitiesAndEquityMemberifrs-full:InterestRateRiskMemberifrs-full:LaterThanOneYearAndNotLaterThanFiveYearsMember2024-12-310001001290bap:LiabilitiesAndEquityMemberifrs-full:InterestRateRiskMemberifrs-full:LaterThanFiveYearsMember2024-12-310001001290bap:LiabilitiesAndEquityMemberbap:NoninterestBearingAssetsMemberifrs-full:InterestRateRiskMember2024-12-310001001290bap:LiabilitiesAndEquityMemberifrs-full:InterestRateRiskMember2024-12-310001001290bap:DerivativeFinancialAssetsMemberifrs-full:InterestRateRiskMemberifrs-full:NotLaterThanOneMonthMember2024-12-310001001290bap:DerivativeFinancialAssetsMemberifrs-full:InterestRateRiskMemberifrs-full:LaterThanOneMonthAndNotLaterThanThreeMonthsMember2024-12-310001001290bap:DerivativeFinancialAssetsMemberifrs-full:InterestRateRiskMemberifrs-full:LaterThanThreeMonthsAndNotLaterThanOneYearMember2024-12-310001001290bap:DerivativeFinancialAssetsMemberifrs-full:InterestRateRiskMemberifrs-full:LaterThanOneYearAndNotLaterThanFiveYearsMember2024-12-310001001290bap:DerivativeFinancialAssetsMemberifrs-full:InterestRateRiskMemberifrs-full:LaterThanFiveYearsMember2024-12-310001001290bap:DerivativeFinancialAssetsMemberbap:NoninterestBearingAssetsMemberifrs-full:InterestRateRiskMember2024-12-310001001290bap:DerivativeFinancialAssetsMemberifrs-full:InterestRateRiskMember2024-12-310001001290bap:DerivativeFinancialLiabilitiesMemberifrs-full:InterestRateRiskMemberifrs-full:NotLaterThanOneMonthMember2024-12-310001001290bap:DerivativeFinancialLiabilitiesMemberifrs-full:InterestRateRiskMemberifrs-full:LaterThanOneMonthAndNotLaterThanThreeMonthsMember2024-12-310001001290bap:DerivativeFinancialLiabilitiesMemberifrs-full:InterestRateRiskMemberifrs-full:LaterThanThreeMonthsAndNotLaterThanOneYearMember2024-12-310001001290bap:DerivativeFinancialLiabilitiesMemberifrs-full:InterestRateRiskMemberifrs-full:LaterThanOneYearAndNotLaterThanFiveYearsMember2024-12-310001001290bap:DerivativeFinancialLiabilitiesMemberifrs-full:InterestRateRiskMemberifrs-full:LaterThanFiveYearsMember2024-12-310001001290bap:DerivativeFinancialLiabilitiesMemberbap:NoninterestBearingAssetsMemberifrs-full:InterestRateRiskMember2024-12-310001001290bap:DerivativeFinancialLiabilitiesMemberifrs-full:InterestRateRiskMember2024-12-310001001290bap:DerivativeNetMemberifrs-full:InterestRateRiskMemberifrs-full:NotLaterThanOneMonthMember2024-12-310001001290bap:DerivativeNetMemberifrs-full:InterestRateRiskMemberifrs-full:LaterThanOneMonthAndNotLaterThanThreeMonthsMember2024-12-310001001290bap:DerivativeNetMemberifrs-full:InterestRateRiskMemberifrs-full:LaterThanThreeMonthsAndNotLaterThanOneYearMember2024-12-310001001290bap:DerivativeNetMemberifrs-full:InterestRateRiskMemberifrs-full:LaterThanOneYearAndNotLaterThanFiveYearsMember2024-12-310001001290bap:DerivativeNetMemberifrs-full:InterestRateRiskMemberifrs-full:LaterThanFiveYearsMember2024-12-310001001290bap:DerivativeNetMemberbap:NoninterestBearingAssetsMemberifrs-full:InterestRateRiskMember2024-12-310001001290bap:DerivativeNetMemberifrs-full:InterestRateRiskMember2024-12-310001001290bap:MarginalDifferenceMemberifrs-full:InterestRateRiskMemberifrs-full:NotLaterThanOneMonthMember2024-12-310001001290bap:MarginalDifferenceMemberifrs-full:InterestRateRiskMemberifrs-full:LaterThanOneMonthAndNotLaterThanThreeMonthsMember2024-12-310001001290bap:MarginalDifferenceMemberifrs-full:InterestRateRiskMemberifrs-full:LaterThanThreeMonthsAndNotLaterThanOneYearMember2024-12-310001001290bap:MarginalDifferenceMemberifrs-full:InterestRateRiskMemberifrs-full:LaterThanOneYearAndNotLaterThanFiveYearsMember2024-12-310001001290bap:MarginalDifferenceMemberifrs-full:InterestRateRiskMemberifrs-full:LaterThanFiveYearsMember2024-12-310001001290bap:MarginalDifferenceMemberbap:NoninterestBearingAssetsMemberifrs-full:InterestRateRiskMember2024-12-310001001290bap:MarginalDifferenceMemberifrs-full:InterestRateRiskMember2024-12-310001001290bap:AccumulatedDifferenceMemberifrs-full:InterestRateRiskMemberifrs-full:NotLaterThanOneMonthMember2024-12-310001001290bap:AccumulatedDifferenceMemberifrs-full:InterestRateRiskMemberifrs-full:LaterThanOneMonthAndNotLaterThanThreeMonthsMember2024-12-310001001290bap:AccumulatedDifferenceMemberifrs-full:InterestRateRiskMemberifrs-full:LaterThanThreeMonthsAndNotLaterThanOneYearMember2024-12-310001001290bap:AccumulatedDifferenceMemberifrs-full:InterestRateRiskMemberifrs-full:LaterThanOneYearAndNotLaterThanFiveYearsMember2024-12-310001001290bap:AccumulatedDifferenceMemberifrs-full:InterestRateRiskMemberifrs-full:LaterThanFiveYearsMember2024-12-310001001290bap:AccumulatedDifferenceMemberbap:NoninterestBearingAssetsMemberifrs-full:InterestRateRiskMember2024-12-310001001290bap:AccumulatedDifferenceMemberifrs-full:InterestRateRiskMember2024-12-310001001290ifrs-full:InterestRateRiskMemberbap:ChangesInBasisPointsMember2025-12-310001001290ifrs-full:InterestRateRiskMemberbap:ChangesInBasisPointsMember2025-01-012025-12-310001001290ifrs-full:InterestRateRiskMemberbap:ChangesInBasisPointsOneMember2025-12-310001001290ifrs-full:InterestRateRiskMemberbap:ChangesInBasisPointsOneMember2025-01-012025-12-310001001290ifrs-full:InterestRateRiskMemberbap:ChangesInBasisPointsTwoMember2025-12-310001001290ifrs-full:InterestRateRiskMemberbap:ChangesInBasisPointsTwoMember2025-01-012025-12-310001001290ifrs-full:InterestRateRiskMemberbap:ChangesInBasisPointsThreeMember2025-12-310001001290ifrs-full:InterestRateRiskMemberbap:ChangesInBasisPointsThreeMember2025-01-012025-12-310001001290ifrs-full:InterestRateRiskMemberbap:ChangesInBasisPointsFourMember2025-12-310001001290ifrs-full:InterestRateRiskMemberbap:ChangesInBasisPointsFourMember2025-01-012025-12-310001001290ifrs-full:InterestRateRiskMemberbap:ChangesInBasisPointsFiveMember2025-12-310001001290ifrs-full:InterestRateRiskMemberbap:ChangesInBasisPointsFiveMember2025-01-012025-12-310001001290ifrs-full:InterestRateRiskMemberbap:ChangesInBasisPointsSixMember2025-12-310001001290ifrs-full:InterestRateRiskMemberbap:ChangesInBasisPointsSixMember2025-01-012025-12-310001001290ifrs-full:InterestRateRiskMemberbap:ChangesInBasisPointsSevenMember2025-12-310001001290ifrs-full:InterestRateRiskMemberbap:ChangesInBasisPointsSevenMember2025-01-012025-12-310001001290ifrs-full:InterestRateRiskMemberbap:ChangesInBasisPointsMember2024-12-310001001290ifrs-full:InterestRateRiskMemberbap:ChangesInBasisPointsMember2024-01-012024-12-310001001290ifrs-full:InterestRateRiskMemberbap:ChangesInBasisPointsOneMember2024-12-310001001290ifrs-full:InterestRateRiskMemberbap:ChangesInBasisPointsOneMember2024-01-012024-12-310001001290ifrs-full:InterestRateRiskMemberbap:ChangesInBasisPointsTwoMember2024-12-310001001290ifrs-full:InterestRateRiskMemberbap:ChangesInBasisPointsTwoMember2024-01-012024-12-310001001290ifrs-full:InterestRateRiskMemberbap:ChangesInBasisPointsThreeMember2024-12-310001001290ifrs-full:InterestRateRiskMemberbap:ChangesInBasisPointsThreeMember2024-01-012024-12-310001001290ifrs-full:InterestRateRiskMemberbap:ChangesInBasisPointsFourMember2024-12-310001001290ifrs-full:InterestRateRiskMemberbap:ChangesInBasisPointsFourMember2024-01-012024-12-310001001290ifrs-full:InterestRateRiskMemberbap:ChangesInBasisPointsFiveMember2024-12-310001001290ifrs-full:InterestRateRiskMemberbap:ChangesInBasisPointsFiveMember2024-01-012024-12-310001001290ifrs-full:InterestRateRiskMemberbap:ChangesInBasisPointsSixMember2024-12-310001001290ifrs-full:InterestRateRiskMemberbap:ChangesInBasisPointsSixMember2024-01-012024-12-310001001290ifrs-full:InterestRateRiskMemberbap:ChangesInBasisPointsSevenMember2024-12-310001001290ifrs-full:InterestRateRiskMemberbap:ChangesInBasisPointsSevenMember2024-01-012024-12-310001001290bap:EquitySecuritiesAt10PercentChangeMember2025-12-310001001290bap:EquitySecuritiesAt25PercentChangeMember2025-12-310001001290bap:EquitySecuritiesAt30PercentChangeMember2025-12-310001001290bap:MarketPriceChangeRiskMember2025-01-012025-12-310001001290bap:EquitySecuritiesAt10PercentChangeMember2024-12-310001001290bap:EquitySecuritiesAt25PercentChangeMember2024-12-310001001290bap:EquitySecuritiesAt30PercentChangeMember2024-12-310001001290bap:ParticipationInMutualFundsAt10PercentChangeMember2025-12-310001001290bap:ParticipationInMutualFundsAt10PercentChangeMember2024-12-310001001290bap:ParticipationInMutualFundsAt25PercentChangeMember2025-12-310001001290bap:ParticipationInMutualFundsAt25PercentChangeMember2024-12-310001001290bap:ParticipationInMutualFundsAt30PercentChangeMember2025-12-310001001290bap:ParticipationInMutualFundsAt30PercentChangeMember2024-12-310001001290bap:RestrictedMutualFundsAt10PercentChangeMember2025-12-310001001290bap:RestrictedMutualFundsAt10PercentChangeMember2024-12-310001001290bap:RestrictedMutualFundsAt25PercentChangeMember2025-12-310001001290bap:RestrictedMutualFundsAt25PercentChangeMember2024-12-310001001290bap:RestrictedMutualFundsAt30PercentChangeMember2025-12-310001001290bap:RestrictedMutualFundsAt30PercentChangeMember2024-12-310001001290bap:ParticipationInRALFundsAt10PercentChangeMember2025-12-310001001290bap:ParticipationInRALFundsAt10PercentChangeMember2024-12-310001001290bap:ParticipationInRALFundsAt25PercentChangeMember2025-12-310001001290bap:ParticipationInRALFundsAt25PercentChangeMember2024-12-310001001290bap:ParticipationInRALFundsAt30PercentChangeMember2025-12-310001001290bap:ParticipationInRALFundsAt30PercentChangeMember2024-12-310001001290bap:InvestmentFundsAt10PercentChangeMember2025-12-310001001290bap:InvestmentFundsAt10PercentChangeMember2024-12-310001001290bap:InvestmentFundsAt25PercentChangeMember2025-12-310001001290bap:InvestmentFundsAt25PercentChangeMember2024-12-310001001290bap:InvestmentFundsAt30PercentChangeMember2025-12-310001001290bap:InvestmentFundsAt30PercentChangeMember2024-12-310001001290bap:ExchangeTradeFundsAt10PercentChangeMember2025-12-310001001290bap:ExchangeTradeFundsAt10PercentChangeMember2024-12-310001001290bap:ExchangeTradeFundsAt25PercentChangeMember2025-12-310001001290bap:ExchangeTradeFundsAt25PercentChangeMember2024-12-310001001290bap:ExchangeTradeFundsAt30PercentChangeMember2025-12-310001001290bap:ExchangeTradeFundsAt30PercentChangeMember2024-12-310001001290currency:USDbap:MonetaryAssetsMember2025-12-310001001290bap:OtherCurrenciesMemberbap:MonetaryAssetsMember2025-12-310001001290bap:MonetaryAssetsMember2025-12-310001001290currency:USDbap:MonetaryAssetsMember2024-12-310001001290bap:OtherCurrenciesMemberbap:MonetaryAssetsMember2024-12-310001001290bap:MonetaryAssetsMember2024-12-310001001290currency:USDbap:MonetaryLiabilitiesMember2025-12-310001001290bap:OtherCurrenciesMemberbap:MonetaryLiabilitiesMember2025-12-310001001290bap:MonetaryLiabilitiesMember2025-12-310001001290currency:USDbap:MonetaryLiabilitiesMember2024-12-310001001290bap:OtherCurrenciesMemberbap:MonetaryLiabilitiesMember2024-12-310001001290bap:MonetaryLiabilitiesMember2024-12-310001001290currency:USD2025-12-310001001290bap:OtherCurrenciesMember2025-12-310001001290currency:USD2024-12-310001001290bap:OtherCurrenciesMember2024-12-310001001290ifrs-full:CurrencyRiskMemberbap:DevaluationAt5InUSDollarMember2025-12-310001001290ifrs-full:CurrencyRiskMemberbap:DevaluationAt5InUSDollarMember2024-12-310001001290ifrs-full:CurrencyRiskMemberbap:DevaluationAt10InUSDollarMember2025-12-310001001290ifrs-full:CurrencyRiskMemberbap:DevaluationAt10InUSDollarMember2024-12-310001001290ifrs-full:CurrencyRiskMemberbap:RevaluationAt5InUSDollarMember2025-12-310001001290ifrs-full:CurrencyRiskMemberbap:RevaluationAt5InUSDollarMember2024-12-310001001290ifrs-full:CurrencyRiskMemberbap:RevaluationAt10InUSDollarMember2025-12-310001001290ifrs-full:CurrencyRiskMemberbap:RevaluationAt10InUSDollarMember2024-12-310001001290ifrs-full:CurrencyRiskMemberbap:DevaluationAt5InBolivianoMember2025-12-310001001290ifrs-full:CurrencyRiskMemberbap:DevaluationAt5InBolivianoMember2024-12-310001001290ifrs-full:CurrencyRiskMemberbap:DevaluationAt10InBolivianoMember2025-12-310001001290ifrs-full:CurrencyRiskMemberbap:DevaluationAt10InBolivianoMember2024-12-310001001290ifrs-full:CurrencyRiskMemberbap:RevaluationAt5InBolivianoMember2025-12-310001001290ifrs-full:CurrencyRiskMemberbap:RevaluationAt5InBolivianoMember2024-12-310001001290ifrs-full:CurrencyRiskMemberbap:RevaluationAt10InBolivianoMember2025-12-310001001290ifrs-full:CurrencyRiskMemberbap:RevaluationAt10InBolivianoMember2024-12-310001001290ifrs-full:CurrencyRiskMemberbap:DevaluationAt5InColombianPesoMember2025-12-310001001290ifrs-full:CurrencyRiskMemberbap:DevaluationAt5InColombianPesoMember2024-12-310001001290ifrs-full:CurrencyRiskMemberbap:DevaluationAt10InColombianPesoMember2025-12-310001001290ifrs-full:CurrencyRiskMemberbap:DevaluationAt10InColombianPesoMember2024-12-310001001290ifrs-full:CurrencyRiskMemberbap:RevaluationAt5InColombianPesoMember2025-12-310001001290ifrs-full:CurrencyRiskMemberbap:RevaluationAt5InColombianPesoMember2024-12-310001001290ifrs-full:CurrencyRiskMemberbap:RevaluationAt10InColombianPesoMember2025-12-310001001290ifrs-full:CurrencyRiskMemberbap:RevaluationAt10InColombianPesoMember2024-12-310001001290ifrs-full:CurrencyRiskMemberbap:DevaluationAt5InChileanPesoMember2025-12-310001001290ifrs-full:CurrencyRiskMemberbap:DevaluationAt5InChileanPesoMember2024-12-310001001290ifrs-full:CurrencyRiskMemberbap:DevaluationAt10InChileanPesoMember2025-12-310001001290ifrs-full:CurrencyRiskMemberbap:DevaluationAt10InChileanPesoMember2024-12-310001001290ifrs-full:CurrencyRiskMemberbap:RevaluationAt5InChileanPesoMember2025-12-310001001290ifrs-full:CurrencyRiskMemberbap:RevaluationAt5InChileanPesoMember2024-12-310001001290ifrs-full:CurrencyRiskMemberbap:RevaluationAt10InChileanPesoMember2025-12-310001001290ifrs-full:CurrencyRiskMemberbap:RevaluationAt10InChileanPesoMember2024-12-310001001290ifrs-full:NotLaterThanOneMonthMember2025-12-310001001290ifrs-full:LaterThanOneYearAndNotLaterThanFiveYearsMember2025-12-310001001290ifrs-full:NotLaterThanOneMonthMember2024-12-310001001290ifrs-full:LaterThanOneYearAndNotLaterThanFiveYearsMember2024-12-310001001290bap:DepositsAndObligationsMemberifrs-full:NotLaterThanOneMonthMember2025-12-310001001290bap:DepositsAndObligationsMemberifrs-full:LaterThanOneMonthAndNotLaterThanThreeMonthsMember2025-12-310001001290bap:DepositsAndObligationsMemberifrs-full:LaterThanThreeMonthsAndNotLaterThanOneYearMember2025-12-310001001290bap:DepositsAndObligationsMemberifrs-full:LaterThanOneYearAndNotLaterThanFiveYearsMember2025-12-310001001290bap:DepositsAndObligationsMemberifrs-full:LaterThanFiveYearsMember2025-12-310001001290bap:DepositsAndObligationsMember2025-12-310001001290bap:DepositsAndObligationsMemberifrs-full:NotLaterThanOneMonthMember2024-12-310001001290bap:DepositsAndObligationsMemberifrs-full:LaterThanOneMonthAndNotLaterThanThreeMonthsMember2024-12-310001001290bap:DepositsAndObligationsMemberifrs-full:LaterThanThreeMonthsAndNotLaterThanOneYearMember2024-12-310001001290bap:DepositsAndObligationsMemberifrs-full:LaterThanOneYearAndNotLaterThanFiveYearsMember2024-12-310001001290bap:DepositsAndObligationsMemberifrs-full:LaterThanFiveYearsMember2024-12-310001001290bap:DepositsAndObligationsMember2024-12-310001001290bap:ReversePurchaseAgreementsAndSecurityLendingsMemberifrs-full:NotLaterThanOneMonthMember2025-12-310001001290bap:ReversePurchaseAgreementsAndSecurityLendingsMemberifrs-full:LaterThanOneMonthAndNotLaterThanThreeMonthsMember2025-12-310001001290bap:ReversePurchaseAgreementsAndSecurityLendingsMemberifrs-full:LaterThanThreeMonthsAndNotLaterThanOneYearMember2025-12-310001001290bap:ReversePurchaseAgreementsAndSecurityLendingsMemberifrs-full:LaterThanOneYearAndNotLaterThanFiveYearsMember2025-12-310001001290bap:ReversePurchaseAgreementsAndSecurityLendingsMemberifrs-full:LaterThanFiveYearsMember2025-12-310001001290bap:ReversePurchaseAgreementsAndSecurityLendingsMember2025-12-310001001290bap:ReversePurchaseAgreementsAndSecurityLendingsMemberifrs-full:NotLaterThanOneMonthMember2024-12-310001001290bap:ReversePurchaseAgreementsAndSecurityLendingsMemberifrs-full:LaterThanOneMonthAndNotLaterThanThreeMonthsMember2024-12-310001001290bap:ReversePurchaseAgreementsAndSecurityLendingsMemberifrs-full:LaterThanThreeMonthsAndNotLaterThanOneYearMember2024-12-310001001290bap:ReversePurchaseAgreementsAndSecurityLendingsMemberifrs-full:LaterThanOneYearAndNotLaterThanFiveYearsMember2024-12-310001001290bap:ReversePurchaseAgreementsAndSecurityLendingsMemberifrs-full:LaterThanFiveYearsMember2024-12-310001001290bap:ReversePurchaseAgreementsAndSecurityLendingsMember2024-12-310001001290ifrs-full:FinancialLiabilitiesAtFairValueThroughProfitOrLossCategoryMemberifrs-full:NotLaterThanOneMonthMember2025-12-310001001290ifrs-full:FinancialLiabilitiesAtFairValueThroughProfitOrLossCategoryMemberifrs-full:LaterThanOneMonthAndNotLaterThanThreeMonthsMember2025-12-310001001290ifrs-full:FinancialLiabilitiesAtFairValueThroughProfitOrLossCategoryMemberifrs-full:LaterThanThreeMonthsAndNotLaterThanOneYearMember2025-12-310001001290ifrs-full:FinancialLiabilitiesAtFairValueThroughProfitOrLossCategoryMemberifrs-full:LaterThanOneYearAndNotLaterThanFiveYearsMember2025-12-310001001290ifrs-full:FinancialLiabilitiesAtFairValueThroughProfitOrLossCategoryMemberifrs-full:LaterThanFiveYearsMember2025-12-310001001290ifrs-full:FinancialLiabilitiesAtFairValueThroughProfitOrLossCategoryMember2025-12-310001001290ifrs-full:FinancialLiabilitiesAtFairValueThroughProfitOrLossCategoryMemberifrs-full:NotLaterThanOneMonthMember2024-12-310001001290ifrs-full:FinancialLiabilitiesAtFairValueThroughProfitOrLossCategoryMemberifrs-full:LaterThanOneMonthAndNotLaterThanThreeMonthsMember2024-12-310001001290ifrs-full:FinancialLiabilitiesAtFairValueThroughProfitOrLossCategoryMemberifrs-full:LaterThanThreeMonthsAndNotLaterThanOneYearMember2024-12-310001001290ifrs-full:FinancialLiabilitiesAtFairValueThroughProfitOrLossCategoryMemberifrs-full:LaterThanOneYearAndNotLaterThanFiveYearsMember2024-12-310001001290ifrs-full:FinancialLiabilitiesAtFairValueThroughProfitOrLossCategoryMemberifrs-full:LaterThanFiveYearsMember2024-12-310001001290ifrs-full:FinancialLiabilitiesAtFairValueThroughProfitOrLossCategoryMember2024-12-310001001290bap:BondsAndNotesMemberifrs-full:NotLaterThanOneMonthMember2025-12-310001001290bap:BondsAndNotesMemberifrs-full:LaterThanOneMonthAndNotLaterThanThreeMonthsMember2025-12-310001001290bap:BondsAndNotesMemberifrs-full:LaterThanThreeMonthsAndNotLaterThanOneYearMember2025-12-310001001290bap:BondsAndNotesMemberifrs-full:LaterThanOneYearAndNotLaterThanFiveYearsMember2025-12-310001001290bap:BondsAndNotesMemberifrs-full:LaterThanFiveYearsMember2025-12-310001001290bap:BondsAndNotesMember2025-12-310001001290bap:BondsAndNotesMemberifrs-full:NotLaterThanOneMonthMember2024-12-310001001290bap:BondsAndNotesMemberifrs-full:LaterThanOneMonthAndNotLaterThanThreeMonthsMember2024-12-310001001290bap:BondsAndNotesMemberifrs-full:LaterThanThreeMonthsAndNotLaterThanOneYearMember2024-12-310001001290bap:BondsAndNotesMemberifrs-full:LaterThanOneYearAndNotLaterThanFiveYearsMember2024-12-310001001290bap:BondsAndNotesMemberifrs-full:LaterThanFiveYearsMember2024-12-310001001290bap:BondsAndNotesMember2024-12-310001001290ifrs-full:LeaseLiabilitiesMemberifrs-full:NotLaterThanOneMonthMember2025-12-310001001290ifrs-full:LeaseLiabilitiesMemberifrs-full:LaterThanOneMonthAndNotLaterThanThreeMonthsMember2025-12-310001001290ifrs-full:LeaseLiabilitiesMemberifrs-full:LaterThanThreeMonthsAndNotLaterThanOneYearMember2025-12-310001001290ifrs-full:LeaseLiabilitiesMemberifrs-full:LaterThanOneYearAndNotLaterThanFiveYearsMember2025-12-310001001290ifrs-full:LeaseLiabilitiesMemberifrs-full:LaterThanFiveYearsMember2025-12-310001001290ifrs-full:LeaseLiabilitiesMember2025-12-310001001290ifrs-full:LeaseLiabilitiesMemberifrs-full:NotLaterThanOneMonthMember2024-12-310001001290ifrs-full:LeaseLiabilitiesMemberifrs-full:LaterThanOneMonthAndNotLaterThanThreeMonthsMember2024-12-310001001290ifrs-full:LeaseLiabilitiesMemberifrs-full:LaterThanThreeMonthsAndNotLaterThanOneYearMember2024-12-310001001290ifrs-full:LeaseLiabilitiesMemberifrs-full:LaterThanOneYearAndNotLaterThanFiveYearsMember2024-12-310001001290ifrs-full:LeaseLiabilitiesMemberifrs-full:LaterThanFiveYearsMember2024-12-310001001290ifrs-full:LeaseLiabilitiesMember2024-12-310001001290bap:OtherFinancialLiabilitiesMemberifrs-full:NotLaterThanOneMonthMember2025-12-310001001290bap:OtherFinancialLiabilitiesMemberifrs-full:LaterThanOneMonthAndNotLaterThanThreeMonthsMember2025-12-310001001290bap:OtherFinancialLiabilitiesMemberifrs-full:LaterThanThreeMonthsAndNotLaterThanOneYearMember2025-12-310001001290bap:OtherFinancialLiabilitiesMemberifrs-full:LaterThanOneYearAndNotLaterThanFiveYearsMember2025-12-310001001290bap:OtherFinancialLiabilitiesMemberifrs-full:LaterThanFiveYearsMember2025-12-310001001290bap:OtherFinancialLiabilitiesMember2025-12-310001001290bap:OtherFinancialLiabilitiesMemberifrs-full:NotLaterThanOneMonthMember2024-12-310001001290bap:OtherFinancialLiabilitiesMemberifrs-full:LaterThanOneMonthAndNotLaterThanThreeMonthsMember2024-12-310001001290bap:OtherFinancialLiabilitiesMemberifrs-full:LaterThanThreeMonthsAndNotLaterThanOneYearMember2024-12-310001001290bap:OtherFinancialLiabilitiesMemberifrs-full:LaterThanOneYearAndNotLaterThanFiveYearsMember2024-12-310001001290bap:OtherFinancialLiabilitiesMemberifrs-full:LaterThanFiveYearsMember2024-12-310001001290bap:OtherFinancialLiabilitiesMember2024-12-310001001290ifrs-full:NineYearsBeforeReportingYearMember2025-12-310001001290ifrs-full:EightYearsBeforeReportingYearMember2025-12-310001001290ifrs-full:SevenYearsBeforeReportingYearMember2025-12-310001001290ifrs-full:SixYearsBeforeReportingYearMember2025-12-310001001290ifrs-full:FiveYearsBeforeReportingYearMember2025-12-310001001290ifrs-full:FourYearsBeforeReportingYearMember2025-12-310001001290ifrs-full:ThreeYearsBeforeReportingYearMember2025-12-310001001290ifrs-full:TwoYearsBeforeReportingYearMember2025-12-310001001290ifrs-full:OneYearBeforeReportingYearMember2025-12-310001001290ifrs-full:ReportingYearMember2025-12-310001001290ifrs-full:NineYearsBeforeReportingYearMember2024-12-310001001290ifrs-full:EightYearsBeforeReportingYearMember2024-12-310001001290ifrs-full:SevenYearsBeforeReportingYearMember2024-12-310001001290ifrs-full:SixYearsBeforeReportingYearMember2024-12-310001001290ifrs-full:FiveYearsBeforeReportingYearMember2024-12-310001001290ifrs-full:FourYearsBeforeReportingYearMember2024-12-310001001290ifrs-full:ThreeYearsBeforeReportingYearMember2024-12-310001001290ifrs-full:TwoYearsBeforeReportingYearMember2024-12-310001001290ifrs-full:OneYearBeforeReportingYearMember2024-12-310001001290ifrs-full:ReportingYearMember2024-12-310001001290bap:DerivativeFinancialAssetsMemberifrs-full:ForwardContractMemberifrs-full:Level1OfFairValueHierarchyMember2025-12-310001001290bap:DerivativeFinancialAssetsMemberifrs-full:ForwardContractMemberifrs-full:Level2OfFairValueHierarchyMember2025-12-310001001290bap:DerivativeFinancialAssetsMemberifrs-full:ForwardContractMemberifrs-full:Level3OfFairValueHierarchyMember2025-12-310001001290ifrs-full:ForwardContractMemberbap:DerivativeFinancialAssetsMember2025-12-310001001290bap:DerivativeFinancialAssetsMemberifrs-full:ForwardContractMemberifrs-full:Level1OfFairValueHierarchyMember2024-12-310001001290bap:DerivativeFinancialAssetsMemberifrs-full:ForwardContractMemberifrs-full:Level2OfFairValueHierarchyMember2024-12-310001001290bap:DerivativeFinancialAssetsMemberifrs-full:ForwardContractMemberifrs-full:Level3OfFairValueHierarchyMember2024-12-310001001290ifrs-full:ForwardContractMemberbap:DerivativeFinancialAssetsMember2024-12-310001001290bap:DerivativeFinancialAssetsMemberifrs-full:InterestRateSwapContractMemberifrs-full:Level1OfFairValueHierarchyMember2025-12-310001001290bap:DerivativeFinancialAssetsMemberifrs-full:InterestRateSwapContractMemberifrs-full:Level2OfFairValueHierarchyMember2025-12-310001001290bap:DerivativeFinancialAssetsMemberifrs-full:InterestRateSwapContractMemberifrs-full:Level3OfFairValueHierarchyMember2025-12-310001001290ifrs-full:InterestRateSwapContractMemberbap:DerivativeFinancialAssetsMember2025-12-310001001290bap:DerivativeFinancialAssetsMemberifrs-full:InterestRateSwapContractMemberifrs-full:Level1OfFairValueHierarchyMember2024-12-310001001290bap:DerivativeFinancialAssetsMemberifrs-full:InterestRateSwapContractMemberifrs-full:Level2OfFairValueHierarchyMember2024-12-310001001290bap:DerivativeFinancialAssetsMemberifrs-full:InterestRateSwapContractMemberifrs-full:Level3OfFairValueHierarchyMember2024-12-310001001290ifrs-full:InterestRateSwapContractMemberbap:DerivativeFinancialAssetsMember2024-12-310001001290bap:DerivativeFinancialAssetsMemberifrs-full:CurrencySwapContractMemberifrs-full:Level1OfFairValueHierarchyMember2025-12-310001001290bap:DerivativeFinancialAssetsMemberifrs-full:CurrencySwapContractMemberifrs-full:Level2OfFairValueHierarchyMember2025-12-310001001290bap:DerivativeFinancialAssetsMemberifrs-full:CurrencySwapContractMemberifrs-full:Level3OfFairValueHierarchyMember2025-12-310001001290ifrs-full:CurrencySwapContractMemberbap:DerivativeFinancialAssetsMember2025-12-310001001290bap:DerivativeFinancialAssetsMemberifrs-full:CurrencySwapContractMemberifrs-full:Level1OfFairValueHierarchyMember2024-12-310001001290bap:DerivativeFinancialAssetsMemberifrs-full:CurrencySwapContractMemberifrs-full:Level2OfFairValueHierarchyMember2024-12-310001001290bap:DerivativeFinancialAssetsMemberifrs-full:CurrencySwapContractMemberifrs-full:Level3OfFairValueHierarchyMember2024-12-310001001290ifrs-full:CurrencySwapContractMemberbap:DerivativeFinancialAssetsMember2024-12-310001001290bap:DerivativeFinancialAssetsMemberbap:ForeignCurrencyOptionsMemberifrs-full:Level1OfFairValueHierarchyMember2025-12-310001001290bap:DerivativeFinancialAssetsMemberbap:ForeignCurrencyOptionsMemberifrs-full:Level2OfFairValueHierarchyMember2025-12-310001001290bap:DerivativeFinancialAssetsMemberbap:ForeignCurrencyOptionsMemberifrs-full:Level3OfFairValueHierarchyMember2025-12-310001001290bap:ForeignCurrencyOptionsMemberbap:DerivativeFinancialAssetsMember2025-12-310001001290bap:DerivativeFinancialAssetsMemberbap:ForeignCurrencyOptionsMemberifrs-full:Level1OfFairValueHierarchyMember2024-12-310001001290bap:DerivativeFinancialAssetsMemberbap:ForeignCurrencyOptionsMemberifrs-full:Level2OfFairValueHierarchyMember2024-12-310001001290bap:DerivativeFinancialAssetsMemberbap:ForeignCurrencyOptionsMemberifrs-full:Level3OfFairValueHierarchyMember2024-12-310001001290bap:ForeignCurrencyOptionsMemberbap:DerivativeFinancialAssetsMember2024-12-310001001290bap:DerivativeFinancialAssetsMemberbap:CrossCurrencySwapsMemberifrs-full:Level1OfFairValueHierarchyMember2025-12-310001001290bap:DerivativeFinancialAssetsMemberbap:CrossCurrencySwapsMemberifrs-full:Level2OfFairValueHierarchyMember2025-12-310001001290bap:DerivativeFinancialAssetsMemberbap:CrossCurrencySwapsMemberifrs-full:Level3OfFairValueHierarchyMember2025-12-310001001290bap:CrossCurrencySwapsMemberbap:DerivativeFinancialAssetsMember2025-12-310001001290bap:DerivativeFinancialAssetsMemberbap:CrossCurrencySwapsMemberifrs-full:Level1OfFairValueHierarchyMember2024-12-310001001290bap:DerivativeFinancialAssetsMemberbap:CrossCurrencySwapsMemberifrs-full:Level2OfFairValueHierarchyMember2024-12-310001001290bap:DerivativeFinancialAssetsMemberbap:CrossCurrencySwapsMemberifrs-full:Level3OfFairValueHierarchyMember2024-12-310001001290bap:CrossCurrencySwapsMemberbap:DerivativeFinancialAssetsMember2024-12-310001001290bap:DerivativeFinancialAssetsMemberifrs-full:FuturesContractMemberifrs-full:Level1OfFairValueHierarchyMember2025-12-310001001290bap:DerivativeFinancialAssetsMemberifrs-full:FuturesContractMemberifrs-full:Level2OfFairValueHierarchyMember2025-12-310001001290bap:DerivativeFinancialAssetsMemberifrs-full:FuturesContractMemberifrs-full:Level3OfFairValueHierarchyMember2025-12-310001001290ifrs-full:FuturesContractMemberbap:DerivativeFinancialAssetsMember2025-12-310001001290bap:DerivativeFinancialAssetsMemberifrs-full:FuturesContractMemberifrs-full:Level1OfFairValueHierarchyMember2024-12-310001001290bap:DerivativeFinancialAssetsMemberifrs-full:FuturesContractMemberifrs-full:Level2OfFairValueHierarchyMember2024-12-310001001290bap:DerivativeFinancialAssetsMemberifrs-full:FuturesContractMemberifrs-full:Level3OfFairValueHierarchyMember2024-12-310001001290ifrs-full:FuturesContractMemberbap:DerivativeFinancialAssetsMember2024-12-310001001290ifrs-full:Level1OfFairValueHierarchyMemberbap:DerivativeFinancialAssetsMember2025-12-310001001290ifrs-full:Level2OfFairValueHierarchyMemberbap:DerivativeFinancialAssetsMember2025-12-310001001290ifrs-full:Level3OfFairValueHierarchyMemberbap:DerivativeFinancialAssetsMember2025-12-310001001290bap:DerivativeFinancialAssetsMember2025-12-310001001290ifrs-full:Level1OfFairValueHierarchyMemberbap:DerivativeFinancialAssetsMember2024-12-310001001290ifrs-full:Level2OfFairValueHierarchyMemberbap:DerivativeFinancialAssetsMember2024-12-310001001290ifrs-full:Level3OfFairValueHierarchyMemberbap:DerivativeFinancialAssetsMember2024-12-310001001290bap:DerivativeFinancialAssetsMember2024-12-310001001290ifrs-full:Level1OfFairValueHierarchyMemberbap:InvestmentsAtFairValueThroughProfitOrLossMember2025-12-310001001290ifrs-full:Level2OfFairValueHierarchyMemberbap:InvestmentsAtFairValueThroughProfitOrLossMember2025-12-310001001290ifrs-full:Level3OfFairValueHierarchyMemberbap:InvestmentsAtFairValueThroughProfitOrLossMember2025-12-310001001290bap:InvestmentsAtFairValueThroughProfitOrLossMember2025-12-310001001290ifrs-full:Level1OfFairValueHierarchyMemberbap:InvestmentsAtFairValueThroughProfitOrLossMember2024-12-310001001290ifrs-full:Level2OfFairValueHierarchyMemberbap:InvestmentsAtFairValueThroughProfitOrLossMember2024-12-310001001290ifrs-full:Level3OfFairValueHierarchyMemberbap:InvestmentsAtFairValueThroughProfitOrLossMember2024-12-310001001290bap:InvestmentsAtFairValueThroughProfitOrLossMember2024-12-310001001290ifrs-full:Level1OfFairValueHierarchyMemberifrs-full:FinancialAssetsAtFairValueThroughProfitOrLossCategoryMember2025-12-310001001290ifrs-full:Level2OfFairValueHierarchyMemberifrs-full:FinancialAssetsAtFairValueThroughProfitOrLossCategoryMember2025-12-310001001290ifrs-full:Level3OfFairValueHierarchyMemberifrs-full:FinancialAssetsAtFairValueThroughProfitOrLossCategoryMember2025-12-310001001290ifrs-full:FinancialAssetsAtFairValueThroughProfitOrLossCategoryMember2025-12-310001001290ifrs-full:Level1OfFairValueHierarchyMemberifrs-full:FinancialAssetsAtFairValueThroughProfitOrLossCategoryMember2024-12-310001001290ifrs-full:Level2OfFairValueHierarchyMemberifrs-full:FinancialAssetsAtFairValueThroughProfitOrLossCategoryMember2024-12-310001001290ifrs-full:Level3OfFairValueHierarchyMemberifrs-full:FinancialAssetsAtFairValueThroughProfitOrLossCategoryMember2024-12-310001001290ifrs-full:FinancialAssetsAtFairValueThroughProfitOrLossCategoryMember2024-12-310001001290ifrs-full:FinancialAssetsAvailableforsaleCategoryMemberbap:CorporateBondsMemberifrs-full:Level1OfFairValueHierarchyMember2025-12-310001001290ifrs-full:FinancialAssetsAvailableforsaleCategoryMemberbap:CorporateBondsMemberifrs-full:Level2OfFairValueHierarchyMember2025-12-310001001290ifrs-full:FinancialAssetsAvailableforsaleCategoryMemberbap:CorporateBondsMemberifrs-full:Level3OfFairValueHierarchyMember2025-12-310001001290bap:CorporateBondsMemberifrs-full:FinancialAssetsAvailableforsaleCategoryMember2025-12-310001001290ifrs-full:FinancialAssetsAvailableforsaleCategoryMemberbap:CorporateBondsMemberifrs-full:Level1OfFairValueHierarchyMember2024-12-310001001290ifrs-full:FinancialAssetsAvailableforsaleCategoryMemberbap:CorporateBondsMemberifrs-full:Level2OfFairValueHierarchyMember2024-12-310001001290ifrs-full:FinancialAssetsAvailableforsaleCategoryMemberbap:CorporateBondsMemberifrs-full:Level3OfFairValueHierarchyMember2024-12-310001001290bap:CorporateBondsMemberifrs-full:FinancialAssetsAvailableforsaleCategoryMember2024-12-310001001290ifrs-full:FinancialAssetsAvailableforsaleCategoryMemberbap:GovernmentTreasuryBondsMemberifrs-full:Level1OfFairValueHierarchyMember2025-12-310001001290ifrs-full:FinancialAssetsAvailableforsaleCategoryMemberbap:GovernmentTreasuryBondsMemberifrs-full:Level2OfFairValueHierarchyMember2025-12-310001001290ifrs-full:FinancialAssetsAvailableforsaleCategoryMemberbap:GovernmentTreasuryBondsMemberifrs-full:Level3OfFairValueHierarchyMember2025-12-310001001290bap:GovernmentTreasuryBondsMemberifrs-full:FinancialAssetsAvailableforsaleCategoryMember2025-12-310001001290ifrs-full:FinancialAssetsAvailableforsaleCategoryMemberbap:GovernmentTreasuryBondsMemberifrs-full:Level1OfFairValueHierarchyMember2024-12-310001001290ifrs-full:FinancialAssetsAvailableforsaleCategoryMemberbap:GovernmentTreasuryBondsMemberifrs-full:Level2OfFairValueHierarchyMember2024-12-310001001290ifrs-full:FinancialAssetsAvailableforsaleCategoryMemberbap:GovernmentTreasuryBondsMemberifrs-full:Level3OfFairValueHierarchyMember2024-12-310001001290bap:GovernmentTreasuryBondsMemberifrs-full:FinancialAssetsAvailableforsaleCategoryMember2024-12-310001001290ifrs-full:FinancialAssetsAvailableforsaleCategoryMemberbap:CertificatesOfDepositBCRPMemberifrs-full:Level1OfFairValueHierarchyMember2025-12-310001001290ifrs-full:FinancialAssetsAvailableforsaleCategoryMemberbap:CertificatesOfDepositBCRPMemberifrs-full:Level2OfFairValueHierarchyMember2025-12-310001001290ifrs-full:FinancialAssetsAvailableforsaleCategoryMemberbap:CertificatesOfDepositBCRPMemberifrs-full:Level3OfFairValueHierarchyMember2025-12-310001001290bap:CertificatesOfDepositBCRPMemberifrs-full:FinancialAssetsAvailableforsaleCategoryMember2025-12-310001001290ifrs-full:FinancialAssetsAvailableforsaleCategoryMemberbap:CertificatesOfDepositBCRPMemberifrs-full:Level1OfFairValueHierarchyMember2024-12-310001001290ifrs-full:FinancialAssetsAvailableforsaleCategoryMemberbap:CertificatesOfDepositBCRPMemberifrs-full:Level2OfFairValueHierarchyMember2024-12-310001001290ifrs-full:FinancialAssetsAvailableforsaleCategoryMemberbap:CertificatesOfDepositBCRPMemberifrs-full:Level3OfFairValueHierarchyMember2024-12-310001001290bap:CertificatesOfDepositBCRPMemberifrs-full:FinancialAssetsAvailableforsaleCategoryMember2024-12-310001001290ifrs-full:FinancialAssetsAvailableforsaleCategoryMemberbap:SecuritizationInstrumentsMemberifrs-full:Level1OfFairValueHierarchyMember2025-12-310001001290ifrs-full:FinancialAssetsAvailableforsaleCategoryMemberbap:SecuritizationInstrumentsMemberifrs-full:Level2OfFairValueHierarchyMember2025-12-310001001290ifrs-full:FinancialAssetsAvailableforsaleCategoryMemberbap:SecuritizationInstrumentsMemberifrs-full:Level3OfFairValueHierarchyMember2025-12-310001001290bap:SecuritizationInstrumentsMemberifrs-full:FinancialAssetsAvailableforsaleCategoryMember2025-12-310001001290ifrs-full:FinancialAssetsAvailableforsaleCategoryMemberbap:SecuritizationInstrumentsMemberifrs-full:Level1OfFairValueHierarchyMember2024-12-310001001290ifrs-full:FinancialAssetsAvailableforsaleCategoryMemberbap:SecuritizationInstrumentsMemberifrs-full:Level2OfFairValueHierarchyMember2024-12-310001001290ifrs-full:FinancialAssetsAvailableforsaleCategoryMemberbap:SecuritizationInstrumentsMemberifrs-full:Level3OfFairValueHierarchyMember2024-12-310001001290bap:SecuritizationInstrumentsMemberifrs-full:FinancialAssetsAvailableforsaleCategoryMember2024-12-310001001290ifrs-full:FinancialAssetsAvailableforsaleCategoryMemberbap:SubordinatedBondsMemberifrs-full:Level1OfFairValueHierarchyMember2025-12-310001001290ifrs-full:FinancialAssetsAvailableforsaleCategoryMemberbap:SubordinatedBondsMemberifrs-full:Level2OfFairValueHierarchyMember2025-12-310001001290ifrs-full:FinancialAssetsAvailableforsaleCategoryMemberbap:SubordinatedBondsMemberifrs-full:Level3OfFairValueHierarchyMember2025-12-310001001290bap:SubordinatedBondsMemberifrs-full:FinancialAssetsAvailableforsaleCategoryMember2025-12-310001001290ifrs-full:FinancialAssetsAvailableforsaleCategoryMemberbap:SubordinatedBondsMemberifrs-full:Level1OfFairValueHierarchyMember2024-12-310001001290ifrs-full:FinancialAssetsAvailableforsaleCategoryMemberbap:SubordinatedBondsMemberifrs-full:Level2OfFairValueHierarchyMember2024-12-310001001290ifrs-full:FinancialAssetsAvailableforsaleCategoryMemberbap:SubordinatedBondsMemberifrs-full:Level3OfFairValueHierarchyMember2024-12-310001001290bap:SubordinatedBondsMemberifrs-full:FinancialAssetsAvailableforsaleCategoryMember2024-12-310001001290ifrs-full:FinancialAssetsAvailableforsaleCategoryMemberbap:NegotiableCertificatesOfDepositsMemberifrs-full:Level1OfFairValueHierarchyMember2025-12-310001001290ifrs-full:FinancialAssetsAvailableforsaleCategoryMemberbap:NegotiableCertificatesOfDepositsMemberifrs-full:Level2OfFairValueHierarchyMember2025-12-310001001290ifrs-full:FinancialAssetsAvailableforsaleCategoryMemberbap:NegotiableCertificatesOfDepositsMemberifrs-full:Level3OfFairValueHierarchyMember2025-12-310001001290bap:NegotiableCertificatesOfDepositsMemberifrs-full:FinancialAssetsAvailableforsaleCategoryMember2025-12-310001001290ifrs-full:FinancialAssetsAvailableforsaleCategoryMemberbap:NegotiableCertificatesOfDepositsMemberifrs-full:Level1OfFairValueHierarchyMember2024-12-310001001290ifrs-full:FinancialAssetsAvailableforsaleCategoryMemberbap:NegotiableCertificatesOfDepositsMemberifrs-full:Level2OfFairValueHierarchyMember2024-12-310001001290ifrs-full:FinancialAssetsAvailableforsaleCategoryMemberbap:NegotiableCertificatesOfDepositsMemberifrs-full:Level3OfFairValueHierarchyMember2024-12-310001001290bap:NegotiableCertificatesOfDepositsMemberifrs-full:FinancialAssetsAvailableforsaleCategoryMember2024-12-310001001290ifrs-full:FinancialAssetsAvailableforsaleCategoryMemberbap:OtherInstrumentsMemberifrs-full:Level1OfFairValueHierarchyMember2025-12-310001001290ifrs-full:FinancialAssetsAvailableforsaleCategoryMemberbap:OtherInstrumentsMemberifrs-full:Level2OfFairValueHierarchyMember2025-12-310001001290ifrs-full:FinancialAssetsAvailableforsaleCategoryMemberbap:OtherInstrumentsMemberifrs-full:Level3OfFairValueHierarchyMember2025-12-310001001290bap:OtherInstrumentsMemberifrs-full:FinancialAssetsAvailableforsaleCategoryMember2025-12-310001001290ifrs-full:FinancialAssetsAvailableforsaleCategoryMemberbap:OtherInstrumentsMemberifrs-full:Level1OfFairValueHierarchyMember2024-12-310001001290ifrs-full:FinancialAssetsAvailableforsaleCategoryMemberbap:OtherInstrumentsMemberifrs-full:Level2OfFairValueHierarchyMember2024-12-310001001290ifrs-full:FinancialAssetsAvailableforsaleCategoryMemberbap:OtherInstrumentsMemberifrs-full:Level3OfFairValueHierarchyMember2024-12-310001001290bap:OtherInstrumentsMemberifrs-full:FinancialAssetsAvailableforsaleCategoryMember2024-12-310001001290ifrs-full:FinancialAssetsAvailableforsaleCategoryMemberbap:EquityInstrumentsMemberifrs-full:Level1OfFairValueHierarchyMember2025-12-310001001290ifrs-full:FinancialAssetsAvailableforsaleCategoryMemberbap:EquityInstrumentsMemberifrs-full:Level2OfFairValueHierarchyMember2025-12-310001001290ifrs-full:FinancialAssetsAvailableforsaleCategoryMemberbap:EquityInstrumentsMemberifrs-full:Level3OfFairValueHierarchyMember2025-12-310001001290bap:EquityInstrumentsMemberifrs-full:FinancialAssetsAvailableforsaleCategoryMember2025-12-310001001290ifrs-full:FinancialAssetsAvailableforsaleCategoryMemberbap:EquityInstrumentsMemberifrs-full:Level1OfFairValueHierarchyMember2024-12-310001001290ifrs-full:FinancialAssetsAvailableforsaleCategoryMemberbap:EquityInstrumentsMemberifrs-full:Level2OfFairValueHierarchyMember2024-12-310001001290ifrs-full:FinancialAssetsAvailableforsaleCategoryMemberbap:EquityInstrumentsMemberifrs-full:Level3OfFairValueHierarchyMember2024-12-310001001290bap:EquityInstrumentsMemberifrs-full:FinancialAssetsAvailableforsaleCategoryMember2024-12-310001001290ifrs-full:Level1OfFairValueHierarchyMemberifrs-full:FinancialAssetsAvailableforsaleCategoryMember2025-12-310001001290ifrs-full:Level2OfFairValueHierarchyMemberifrs-full:FinancialAssetsAvailableforsaleCategoryMember2025-12-310001001290ifrs-full:Level3OfFairValueHierarchyMemberifrs-full:FinancialAssetsAvailableforsaleCategoryMember2025-12-310001001290ifrs-full:FinancialAssetsAvailableforsaleCategoryMember2025-12-310001001290ifrs-full:Level1OfFairValueHierarchyMemberifrs-full:FinancialAssetsAvailableforsaleCategoryMember2024-12-310001001290ifrs-full:Level2OfFairValueHierarchyMemberifrs-full:FinancialAssetsAvailableforsaleCategoryMember2024-12-310001001290ifrs-full:Level3OfFairValueHierarchyMemberifrs-full:FinancialAssetsAvailableforsaleCategoryMember2024-12-310001001290ifrs-full:FinancialAssetsAvailableforsaleCategoryMember2024-12-310001001290ifrs-full:Level1OfFairValueHierarchyMemberifrs-full:AtFairValueMember2025-12-310001001290ifrs-full:Level2OfFairValueHierarchyMemberifrs-full:AtFairValueMember2025-12-310001001290ifrs-full:Level3OfFairValueHierarchyMemberifrs-full:AtFairValueMember2025-12-310001001290ifrs-full:AtFairValueMember2025-12-310001001290ifrs-full:Level1OfFairValueHierarchyMemberifrs-full:AtFairValueMember2024-12-310001001290ifrs-full:Level2OfFairValueHierarchyMemberifrs-full:AtFairValueMember2024-12-310001001290ifrs-full:Level3OfFairValueHierarchyMemberifrs-full:AtFairValueMember2024-12-310001001290ifrs-full:AtFairValueMember2024-12-310001001290bap:DerivativeFinancialLiabilitiesMemberifrs-full:InterestRateSwapContractMemberifrs-full:Level1OfFairValueHierarchyMember2025-12-310001001290bap:DerivativeFinancialLiabilitiesMemberifrs-full:InterestRateSwapContractMemberifrs-full:Level2OfFairValueHierarchyMember2025-12-310001001290bap:DerivativeFinancialLiabilitiesMemberifrs-full:InterestRateSwapContractMemberifrs-full:Level3OfFairValueHierarchyMember2025-12-310001001290ifrs-full:InterestRateSwapContractMemberbap:DerivativeFinancialLiabilitiesMember2025-12-310001001290bap:DerivativeFinancialLiabilitiesMemberifrs-full:InterestRateSwapContractMemberifrs-full:Level1OfFairValueHierarchyMember2024-12-310001001290bap:DerivativeFinancialLiabilitiesMemberifrs-full:InterestRateSwapContractMemberifrs-full:Level2OfFairValueHierarchyMember2024-12-310001001290bap:DerivativeFinancialLiabilitiesMemberifrs-full:InterestRateSwapContractMemberifrs-full:Level3OfFairValueHierarchyMember2024-12-310001001290ifrs-full:InterestRateSwapContractMemberbap:DerivativeFinancialLiabilitiesMember2024-12-310001001290bap:DerivativeFinancialLiabilitiesMemberifrs-full:CurrencySwapContractMemberifrs-full:Level1OfFairValueHierarchyMember2025-12-310001001290bap:DerivativeFinancialLiabilitiesMemberifrs-full:CurrencySwapContractMemberifrs-full:Level2OfFairValueHierarchyMember2025-12-310001001290bap:DerivativeFinancialLiabilitiesMemberifrs-full:CurrencySwapContractMemberifrs-full:Level3OfFairValueHierarchyMember2025-12-310001001290ifrs-full:CurrencySwapContractMemberbap:DerivativeFinancialLiabilitiesMember2025-12-310001001290bap:DerivativeFinancialLiabilitiesMemberifrs-full:CurrencySwapContractMemberifrs-full:Level1OfFairValueHierarchyMember2024-12-310001001290bap:DerivativeFinancialLiabilitiesMemberifrs-full:CurrencySwapContractMemberifrs-full:Level2OfFairValueHierarchyMember2024-12-310001001290bap:DerivativeFinancialLiabilitiesMemberifrs-full:CurrencySwapContractMemberifrs-full:Level3OfFairValueHierarchyMember2024-12-310001001290ifrs-full:CurrencySwapContractMemberbap:DerivativeFinancialLiabilitiesMember2024-12-310001001290bap:DerivativeFinancialLiabilitiesMemberifrs-full:ForwardContractMemberifrs-full:Level1OfFairValueHierarchyMember2025-12-310001001290bap:DerivativeFinancialLiabilitiesMemberifrs-full:ForwardContractMemberifrs-full:Level2OfFairValueHierarchyMember2025-12-310001001290bap:DerivativeFinancialLiabilitiesMemberifrs-full:ForwardContractMemberifrs-full:Level3OfFairValueHierarchyMember2025-12-310001001290ifrs-full:ForwardContractMemberbap:DerivativeFinancialLiabilitiesMember2025-12-310001001290bap:DerivativeFinancialLiabilitiesMemberifrs-full:ForwardContractMemberifrs-full:Level1OfFairValueHierarchyMember2024-12-310001001290bap:DerivativeFinancialLiabilitiesMemberifrs-full:ForwardContractMemberifrs-full:Level2OfFairValueHierarchyMember2024-12-310001001290bap:DerivativeFinancialLiabilitiesMemberifrs-full:ForwardContractMemberifrs-full:Level3OfFairValueHierarchyMember2024-12-310001001290ifrs-full:ForwardContractMemberbap:DerivativeFinancialLiabilitiesMember2024-12-310001001290bap:DerivativeFinancialLiabilitiesMemberbap:CrossCurrencySwapsMemberifrs-full:Level1OfFairValueHierarchyMember2025-12-310001001290bap:DerivativeFinancialLiabilitiesMemberbap:CrossCurrencySwapsMemberifrs-full:Level2OfFairValueHierarchyMember2025-12-310001001290bap:DerivativeFinancialLiabilitiesMemberbap:CrossCurrencySwapsMemberifrs-full:Level3OfFairValueHierarchyMember2025-12-310001001290bap:CrossCurrencySwapsMemberbap:DerivativeFinancialLiabilitiesMember2025-12-310001001290bap:DerivativeFinancialLiabilitiesMemberbap:CrossCurrencySwapsMemberifrs-full:Level1OfFairValueHierarchyMember2024-12-310001001290bap:DerivativeFinancialLiabilitiesMemberbap:CrossCurrencySwapsMemberifrs-full:Level2OfFairValueHierarchyMember2024-12-310001001290bap:DerivativeFinancialLiabilitiesMemberbap:CrossCurrencySwapsMemberifrs-full:Level3OfFairValueHierarchyMember2024-12-310001001290bap:CrossCurrencySwapsMemberbap:DerivativeFinancialLiabilitiesMember2024-12-310001001290bap:DerivativeFinancialLiabilitiesMemberbap:ForeignCurrencyOptionsMemberifrs-full:Level1OfFairValueHierarchyMember2025-12-310001001290bap:DerivativeFinancialLiabilitiesMemberbap:ForeignCurrencyOptionsMemberifrs-full:Level2OfFairValueHierarchyMember2025-12-310001001290bap:DerivativeFinancialLiabilitiesMemberbap:ForeignCurrencyOptionsMemberifrs-full:Level3OfFairValueHierarchyMember2025-12-310001001290bap:ForeignCurrencyOptionsMemberbap:DerivativeFinancialLiabilitiesMember2025-12-310001001290bap:DerivativeFinancialLiabilitiesMemberbap:ForeignCurrencyOptionsMemberifrs-full:Level1OfFairValueHierarchyMember2024-12-310001001290bap:DerivativeFinancialLiabilitiesMemberbap:ForeignCurrencyOptionsMemberifrs-full:Level2OfFairValueHierarchyMember2024-12-310001001290bap:DerivativeFinancialLiabilitiesMemberbap:ForeignCurrencyOptionsMemberifrs-full:Level3OfFairValueHierarchyMember2024-12-310001001290bap:ForeignCurrencyOptionsMemberbap:DerivativeFinancialLiabilitiesMember2024-12-310001001290bap:DerivativeFinancialLiabilitiesMemberifrs-full:FuturesContractMemberifrs-full:Level1OfFairValueHierarchyMember2025-12-310001001290bap:DerivativeFinancialLiabilitiesMemberifrs-full:FuturesContractMemberifrs-full:Level2OfFairValueHierarchyMember2025-12-310001001290bap:DerivativeFinancialLiabilitiesMemberifrs-full:FuturesContractMemberifrs-full:Level3OfFairValueHierarchyMember2025-12-310001001290ifrs-full:FuturesContractMemberbap:DerivativeFinancialLiabilitiesMember2025-12-310001001290bap:DerivativeFinancialLiabilitiesMemberifrs-full:FuturesContractMemberifrs-full:Level1OfFairValueHierarchyMember2024-12-310001001290bap:DerivativeFinancialLiabilitiesMemberifrs-full:FuturesContractMemberifrs-full:Level2OfFairValueHierarchyMember2024-12-310001001290bap:DerivativeFinancialLiabilitiesMemberifrs-full:FuturesContractMemberifrs-full:Level3OfFairValueHierarchyMember2024-12-310001001290ifrs-full:FuturesContractMemberbap:DerivativeFinancialLiabilitiesMember2024-12-310001001290ifrs-full:Level1OfFairValueHierarchyMemberbap:DerivativeFinancialLiabilitiesMember2025-12-310001001290ifrs-full:Level2OfFairValueHierarchyMemberbap:DerivativeFinancialLiabilitiesMember2025-12-310001001290ifrs-full:Level3OfFairValueHierarchyMemberbap:DerivativeFinancialLiabilitiesMember2025-12-310001001290bap:DerivativeFinancialLiabilitiesMember2025-12-310001001290ifrs-full:Level1OfFairValueHierarchyMemberbap:DerivativeFinancialLiabilitiesMember2024-12-310001001290ifrs-full:Level2OfFairValueHierarchyMemberbap:DerivativeFinancialLiabilitiesMember2024-12-310001001290ifrs-full:Level3OfFairValueHierarchyMemberbap:DerivativeFinancialLiabilitiesMember2024-12-310001001290bap:DerivativeFinancialLiabilitiesMember2024-12-310001001290bap:DerivativeFinancialLiabilitiesMemberifrs-full:FinancialLiabilitiesAtFairValueThroughProfitOrLossCategoryMemberifrs-full:Level1OfFairValueHierarchyMember2025-12-310001001290bap:DerivativeFinancialLiabilitiesMemberifrs-full:FinancialLiabilitiesAtFairValueThroughProfitOrLossCategoryMemberifrs-full:Level2OfFairValueHierarchyMember2025-12-310001001290bap:DerivativeFinancialLiabilitiesMemberifrs-full:FinancialLiabilitiesAtFairValueThroughProfitOrLossCategoryMemberifrs-full:Level3OfFairValueHierarchyMember2025-12-310001001290ifrs-full:FinancialLiabilitiesAtFairValueThroughProfitOrLossCategoryMemberbap:DerivativeFinancialLiabilitiesMember2025-12-310001001290bap:DerivativeFinancialLiabilitiesMemberifrs-full:FinancialLiabilitiesAtFairValueThroughProfitOrLossCategoryMemberifrs-full:Level1OfFairValueHierarchyMember2024-12-310001001290bap:DerivativeFinancialLiabilitiesMemberifrs-full:FinancialLiabilitiesAtFairValueThroughProfitOrLossCategoryMemberifrs-full:Level2OfFairValueHierarchyMember2024-12-310001001290bap:DerivativeFinancialLiabilitiesMemberifrs-full:FinancialLiabilitiesAtFairValueThroughProfitOrLossCategoryMemberifrs-full:Level3OfFairValueHierarchyMember2024-12-310001001290ifrs-full:FinancialLiabilitiesAtFairValueThroughProfitOrLossCategoryMemberbap:DerivativeFinancialLiabilitiesMember2024-12-310001001290ifrs-full:Level1OfFairValueHierarchyMemberbap:CashAndDueFromBanksMember2025-12-310001001290ifrs-full:Level2OfFairValueHierarchyMemberbap:CashAndDueFromBanksMember2025-12-310001001290ifrs-full:Level3OfFairValueHierarchyMemberbap:CashAndDueFromBanksMember2025-12-310001001290bap:CashAndDueFromBanksMember2025-12-310001001290ifrs-full:Level1OfFairValueHierarchyMemberbap:CashAndDueFromBanksMember2024-12-310001001290ifrs-full:Level2OfFairValueHierarchyMemberbap:CashAndDueFromBanksMember2024-12-310001001290ifrs-full:Level3OfFairValueHierarchyMemberbap:CashAndDueFromBanksMember2024-12-310001001290bap:CashAndDueFromBanksMember2024-12-310001001290ifrs-full:Level1OfFairValueHierarchyMemberbap:CashAndCashCollateralReverseRepurchaseAgreementsAndSecuritiesBorrowingMember2025-12-310001001290ifrs-full:Level2OfFairValueHierarchyMemberbap:CashAndCashCollateralReverseRepurchaseAgreementsAndSecuritiesBorrowingMember2025-12-310001001290ifrs-full:Level3OfFairValueHierarchyMemberbap:CashAndCashCollateralReverseRepurchaseAgreementsAndSecuritiesBorrowingMember2025-12-310001001290bap:CashAndCashCollateralReverseRepurchaseAgreementsAndSecuritiesBorrowingMember2025-12-310001001290ifrs-full:Level1OfFairValueHierarchyMemberbap:CashAndCashCollateralReverseRepurchaseAgreementsAndSecuritiesBorrowingMember2024-12-310001001290ifrs-full:Level2OfFairValueHierarchyMemberbap:CashAndCashCollateralReverseRepurchaseAgreementsAndSecuritiesBorrowingMember2024-12-310001001290ifrs-full:Level3OfFairValueHierarchyMemberbap:CashAndCashCollateralReverseRepurchaseAgreementsAndSecuritiesBorrowingMember2024-12-310001001290bap:CashAndCashCollateralReverseRepurchaseAgreementsAndSecuritiesBorrowingMember2024-12-310001001290ifrs-full:Level1OfFairValueHierarchyMemberbap:InvestmentsAtAmortizedCostMember2025-12-310001001290ifrs-full:Level2OfFairValueHierarchyMemberbap:InvestmentsAtAmortizedCostMember2025-12-310001001290ifrs-full:Level3OfFairValueHierarchyMemberbap:InvestmentsAtAmortizedCostMember2025-12-310001001290bap:InvestmentsAtAmortizedCostMember2025-12-310001001290ifrs-full:Level1OfFairValueHierarchyMemberbap:InvestmentsAtAmortizedCostMember2024-12-310001001290ifrs-full:Level2OfFairValueHierarchyMemberbap:InvestmentsAtAmortizedCostMember2024-12-310001001290ifrs-full:Level3OfFairValueHierarchyMemberbap:InvestmentsAtAmortizedCostMember2024-12-310001001290bap:InvestmentsAtAmortizedCostMember2024-12-310001001290ifrs-full:Level1OfFairValueHierarchyMemberbap:LoansNetMember2025-12-310001001290ifrs-full:Level2OfFairValueHierarchyMemberbap:LoansNetMember2025-12-310001001290ifrs-full:Level3OfFairValueHierarchyMemberbap:LoansNetMember2025-12-310001001290bap:LoansNetMember2025-12-310001001290ifrs-full:Level1OfFairValueHierarchyMemberbap:LoansNetMember2024-12-310001001290ifrs-full:Level2OfFairValueHierarchyMemberbap:LoansNetMember2024-12-310001001290ifrs-full:Level3OfFairValueHierarchyMemberbap:LoansNetMember2024-12-310001001290bap:LoansNetMember2024-12-310001001290ifrs-full:Level1OfFairValueHierarchyMemberbap:DueFromCustomersOnBankAcceptancesMember2025-12-310001001290ifrs-full:Level2OfFairValueHierarchyMemberbap:DueFromCustomersOnBankAcceptancesMember2025-12-310001001290ifrs-full:Level3OfFairValueHierarchyMemberbap:DueFromCustomersOnBankAcceptancesMember2025-12-310001001290bap:DueFromCustomersOnBankAcceptancesMember2025-12-310001001290ifrs-full:Level1OfFairValueHierarchyMemberbap:DueFromCustomersOnBankAcceptancesMember2024-12-310001001290ifrs-full:Level2OfFairValueHierarchyMemberbap:DueFromCustomersOnBankAcceptancesMember2024-12-310001001290ifrs-full:Level3OfFairValueHierarchyMemberbap:DueFromCustomersOnBankAcceptancesMember2024-12-310001001290bap:DueFromCustomersOnBankAcceptancesMember2024-12-310001001290ifrs-full:Level1OfFairValueHierarchyMemberbap:OtherAssetMember2025-12-310001001290ifrs-full:Level2OfFairValueHierarchyMemberbap:OtherAssetMember2025-12-310001001290ifrs-full:Level3OfFairValueHierarchyMemberbap:OtherAssetMember2025-12-310001001290bap:OtherAssetMember2025-12-310001001290ifrs-full:Level1OfFairValueHierarchyMemberbap:OtherAssetMember2024-12-310001001290ifrs-full:Level2OfFairValueHierarchyMemberbap:OtherAssetMember2024-12-310001001290ifrs-full:Level3OfFairValueHierarchyMemberbap:OtherAssetMember2024-12-310001001290bap:OtherAssetMember2024-12-310001001290ifrs-full:Level1OfFairValueHierarchyMemberbap:NotMeasuredAtFairValueMember2025-12-310001001290ifrs-full:Level2OfFairValueHierarchyMemberbap:NotMeasuredAtFairValueMember2025-12-310001001290ifrs-full:Level3OfFairValueHierarchyMemberbap:NotMeasuredAtFairValueMember2025-12-310001001290bap:NotMeasuredAtFairValueMember2025-12-310001001290ifrs-full:Level1OfFairValueHierarchyMemberbap:NotMeasuredAtFairValueMember2024-12-310001001290ifrs-full:Level2OfFairValueHierarchyMemberbap:NotMeasuredAtFairValueMember2024-12-310001001290ifrs-full:Level3OfFairValueHierarchyMemberbap:NotMeasuredAtFairValueMember2024-12-310001001290bap:NotMeasuredAtFairValueMember2024-12-310001001290ifrs-full:Level1OfFairValueHierarchyMemberbap:DepositsAndObligationsMember2025-12-310001001290ifrs-full:Level2OfFairValueHierarchyMemberbap:DepositsAndObligationsMember2025-12-310001001290ifrs-full:Level3OfFairValueHierarchyMemberbap:DepositsAndObligationsMember2025-12-310001001290bap:DepositsAndObligationsMember2025-12-310001001290ifrs-full:Level1OfFairValueHierarchyMemberbap:DepositsAndObligationsMember2024-12-310001001290ifrs-full:Level2OfFairValueHierarchyMemberbap:DepositsAndObligationsMember2024-12-310001001290ifrs-full:Level3OfFairValueHierarchyMemberbap:DepositsAndObligationsMember2024-12-310001001290bap:DepositsAndObligationsMember2024-12-310001001290ifrs-full:Level1OfFairValueHierarchyMemberbap:PayablesFromRepurchaseAgreementsAndSecuritiesLendingMember2025-12-310001001290ifrs-full:Level2OfFairValueHierarchyMemberbap:PayablesFromRepurchaseAgreementsAndSecuritiesLendingMember2025-12-310001001290ifrs-full:Level3OfFairValueHierarchyMemberbap:PayablesFromRepurchaseAgreementsAndSecuritiesLendingMember2025-12-310001001290bap:PayablesFromRepurchaseAgreementsAndSecuritiesLendingMember2025-12-310001001290ifrs-full:Level1OfFairValueHierarchyMemberbap:PayablesFromRepurchaseAgreementsAndSecuritiesLendingMember2024-12-310001001290ifrs-full:Level2OfFairValueHierarchyMemberbap:PayablesFromRepurchaseAgreementsAndSecuritiesLendingMember2024-12-310001001290ifrs-full:Level3OfFairValueHierarchyMemberbap:PayablesFromRepurchaseAgreementsAndSecuritiesLendingMember2024-12-310001001290bap:PayablesFromRepurchaseAgreementsAndSecuritiesLendingMember2024-12-310001001290ifrs-full:Level1OfFairValueHierarchyMemberbap:DueToBanksAndCorrespondentsAndOtherEntitiesMember2025-12-310001001290ifrs-full:Level2OfFairValueHierarchyMemberbap:DueToBanksAndCorrespondentsAndOtherEntitiesMember2025-12-310001001290ifrs-full:Level3OfFairValueHierarchyMemberbap:DueToBanksAndCorrespondentsAndOtherEntitiesMember2025-12-310001001290bap:DueToBanksAndCorrespondentsAndOtherEntitiesMember2025-12-310001001290ifrs-full:Level1OfFairValueHierarchyMemberbap:DueToBanksAndCorrespondentsAndOtherEntitiesMember2024-12-310001001290ifrs-full:Level2OfFairValueHierarchyMemberbap:DueToBanksAndCorrespondentsAndOtherEntitiesMember2024-12-310001001290ifrs-full:Level3OfFairValueHierarchyMemberbap:DueToBanksAndCorrespondentsAndOtherEntitiesMember2024-12-310001001290bap:DueToBanksAndCorrespondentsAndOtherEntitiesMember2024-12-310001001290ifrs-full:Level1OfFairValueHierarchyMemberbap:DueFromCustomersOnBankAcceptancesLiabilitiesMember2025-12-310001001290ifrs-full:Level2OfFairValueHierarchyMemberbap:DueFromCustomersOnBankAcceptancesLiabilitiesMember2025-12-310001001290ifrs-full:Level3OfFairValueHierarchyMemberbap:DueFromCustomersOnBankAcceptancesLiabilitiesMember2025-12-310001001290bap:DueFromCustomersOnBankAcceptancesLiabilitiesMember2025-12-310001001290ifrs-full:Level1OfFairValueHierarchyMemberbap:DueFromCustomersOnBankAcceptancesLiabilitiesMember2024-12-310001001290ifrs-full:Level2OfFairValueHierarchyMemberbap:DueFromCustomersOnBankAcceptancesLiabilitiesMember2024-12-310001001290ifrs-full:Level3OfFairValueHierarchyMemberbap:DueFromCustomersOnBankAcceptancesLiabilitiesMember2024-12-310001001290bap:DueFromCustomersOnBankAcceptancesLiabilitiesMember2024-12-310001001290ifrs-full:Level1OfFairValueHierarchyMemberifrs-full:LeaseLiabilitiesMember2025-12-310001001290ifrs-full:Level2OfFairValueHierarchyMemberifrs-full:LeaseLiabilitiesMember2025-12-310001001290ifrs-full:Level3OfFairValueHierarchyMemberifrs-full:LeaseLiabilitiesMember2025-12-310001001290ifrs-full:LeaseLiabilitiesMember2025-12-310001001290ifrs-full:Level1OfFairValueHierarchyMemberifrs-full:LeaseLiabilitiesMember2024-12-310001001290ifrs-full:Level2OfFairValueHierarchyMemberifrs-full:LeaseLiabilitiesMember2024-12-310001001290ifrs-full:Level3OfFairValueHierarchyMemberifrs-full:LeaseLiabilitiesMember2024-12-310001001290ifrs-full:LeaseLiabilitiesMember2024-12-310001001290ifrs-full:Level1OfFairValueHierarchyMemberbap:BondAndNotesIssuedMember2025-12-310001001290ifrs-full:Level2OfFairValueHierarchyMemberbap:BondAndNotesIssuedMember2025-12-310001001290ifrs-full:Level3OfFairValueHierarchyMemberbap:BondAndNotesIssuedMember2025-12-310001001290bap:BondAndNotesIssuedMember2025-12-310001001290ifrs-full:Level1OfFairValueHierarchyMemberbap:BondAndNotesIssuedMember2024-12-310001001290ifrs-full:Level2OfFairValueHierarchyMemberbap:BondAndNotesIssuedMember2024-12-310001001290ifrs-full:Level3OfFairValueHierarchyMemberbap:BondAndNotesIssuedMember2024-12-310001001290bap:BondAndNotesIssuedMember2024-12-310001001290ifrs-full:Level1OfFairValueHierarchyMemberbap:FinancialLiabilitiesClassifiedAsOtherMember2025-12-310001001290ifrs-full:Level2OfFairValueHierarchyMemberbap:FinancialLiabilitiesClassifiedAsOtherMember2025-12-310001001290ifrs-full:Level3OfFairValueHierarchyMemberbap:FinancialLiabilitiesClassifiedAsOtherMember2025-12-310001001290bap:FinancialLiabilitiesClassifiedAsOtherMember2025-12-310001001290ifrs-full:Level1OfFairValueHierarchyMemberbap:FinancialLiabilitiesClassifiedAsOtherMember2024-12-310001001290ifrs-full:Level2OfFairValueHierarchyMemberbap:FinancialLiabilitiesClassifiedAsOtherMember2024-12-310001001290ifrs-full:Level3OfFairValueHierarchyMemberbap:FinancialLiabilitiesClassifiedAsOtherMember2024-12-310001001290bap:FinancialLiabilitiesClassifiedAsOtherMember2024-12-310001001290ifrs-full:InvestmentFundsMember2025-12-310001001290ifrs-full:InvestmentFundsMember2024-12-310001001290bap:EquityManagedMember2025-12-310001001290bap:EquityManagedMember2024-12-310001001290bap:PensionFundsMember2025-12-310001001290bap:PensionFundsMember2024-12-310001001290bap:BankTrustsMember2025-12-310001001290bap:BankTrustsMember2024-12-310001001290bap:FuerzaPopular2011CampaignMember2010-01-012011-12-310001001290bap:FuerzaPopular2011CampaignMember2010-01-012010-12-310001001290bap:FuerzaPopular2011CampaignMember2011-01-012011-12-310001001290bap:PeruanosPorElKambioCampaignMember2016-01-012016-12-310001001290ifrs-full:SubsidiariesMemberbap:PeruanosPorElKambioCampaignMember2016-01-012016-12-310001001290bap:EventsAfterReportingPeriodMember2026-04-2300010012902026-04-232026-04-23
UNITED STATES
SECURITIES AND EXCHANGE COMMISSION
WASHINGTON, D.C. 20549
FORM 20-F
o REGISTRATION STATEMENT PURSUANT TO SECTION 12(b) OR (g) OF THE
SECURITIES EXCHANGE ACT OF 1934
OR
x ANNUAL REPORT PURSUANT TO SECTION 13 OR 15(d) OF THE SECURITIES
EXCHANGE ACT OF 1934
For the fiscal year ended December 31, 2025
OR
o TRANSITION REPORT PURSUANT TO SECTION 13 OR 15(d) OF THE SECURITIES
EXCHANGE ACT OF 1934
OR
o SHELL COMPANY REPORT PURSUANT TO SECTION 13 OR 15 (d) OF THE SECURITIES
EXCHANGE ACT OF 1934
Date of event requiring this shell company report ______________
For the transition period from ________ to _______
Commission file number 1-14014
| | |
CREDICORP LTD. |
(Exact name of registrant as specified in its
charter) |
|
| BERMUDA |
| (Jurisdiction of incorporation or organization) |
|
| Of our subsidiary |
Banco de Credito del Peru: |
| Calle Centenario 156 |
La Molina 15026 |
Lima, Peru |
| (Address of principal executive offices) |
|
| Alejandro Pérez-Reyes |
| Chief Financial Officer |
| Credicorp Ltd |
Banco de Credito del Peru: |
| Calle Centenario 156 |
La Molina 15026 |
Lima, Peru |
Phone (+511) 313 2000 |
|
| (Name, Telephone, Email and/or Facsimile number and Address of Company Contact Person) |
Securities registered or to be registered pursuant to Section 12(b) of the Act.
| | | | | | | | | | | | | | |
| Title of each class | | Trading Symbol(s) | | Name of each exchange on which registered |
| Common Shares, par value $5.00 per share | | BAP | | New York Stock Exchange |
Securities registered or to be registered pursuant to Section 12(g) of the Act. None
Securities for which there is a reporting obligation pursuant to Section 15(d) of the Act. None
Indicate the number of outstanding shares of each of the issuer’s classes of capital or common stock as of the close of the period covered by the annual report.
Common Shares, par value $5.00 per share 94,382,317
Indicate by check mark if the registrant is a well-known seasoned issuer, as defined in Rule 405 of the Securities Act.
Yes x No o
If this report is an annual or transition report, indicate by check mark if the registrant is not required to file reports pursuant to Section 13 or 15(d) of the Securities Exchange Act of 1934.
Yes o No x
Indicate by check mark whether the registrant (1) has filed all reports required to be filed by Section 13 or 15(d) of the Securities Exchange Act of 1934 during the preceding 12 months (or for such shorter period that the registrant was required to file such reports), and (2) has been subject to such filing requirements for the past 90 days.
Yes x No o
Indicate by check mark whether the registrant has submitted electronically every Interactive Data File required to be submitted pursuant to Rule 405 of Regulation S-T (§232.405 of this chapter) during the preceding 12 months (or for such shorter period that the registrant was required to submit such files).
Yes x No o
Indicate by check mark whether the registrant is a large accelerated filer, an accelerated filer, a non-accelerated filer, or an emerging growth company. See the definitions of “large accelerated filer,” “accelerated filer,” and “emerging growth company” in Rule 12b-2 of the Exchange Act
| | | | | | | | | | | | | | |
| Large accelerated filer | x | Accelerated filer | o |
| | | | |
| Non-accelerated filer | o | Emerging Growth Company | o |
If an emerging growth company that prepares its financial statements in accordance with U.S. GAAP, indicate by check mark if the registrant has elected not to use the extended transition period for complying with any new or revised financial accounting standards† provided pursuant to Section 13(a) of the Exchange Act o
†The term “new or revised financial accounting standard” refers to any update issued by the Financial Accounting Standards Board to its Accounting Standards Codification after April 5, 2012.
Indicate by check mark whether the registrant has filed a report on and attestation to its management’s assessment of the effectiveness of its internal control over financial reporting under Section 404(b) of the Sarbanes-Oxley Act (15 U.S.C. 7262(b)) by the registered public accounting firm that prepared or issued its audit report. x
If securities are registered pursuant to Section 12(b) of the Act, indicate by check mark whether the financial statements of the registrant included in the filing reflect the correction of an error to previously issued financial statements. o
Indicate by check mark whether any of those error corrections are restatements that required a recovery analysis of incentive based compensation received by any of the registrant’s executive officers during the relevant recovery period pursuant to §240.10D-1(b). o
Indicate by check mark which basis of accounting the registrant has used to prepare the financial statements included in this filing:
| | | | | | | | |
U.S. GAAP o | International Financial Reporting Standards as issued | Other o |
| by the International Accounting Standards Board x | |
If “Other” has been checked in response to the previous question, indicate by check mark which financial statement item the registrant has elected to follow.
Item 17 o Item 18 o
If this is an annual report, indicate by check mark whether the registrant is a shell company (as defined in Rule 12b-2 of the Exchange Act).
Yes o No x
ABBREVIATIONS
| | | | | | | | |
| Abbreviations | | Meaning |
| AFP | | Administradora de Fondo de Pensiones or Private Pension Funds Administrators |
| AI | | Artificial Intelligence |
| ALCO | | Asset and Liabilities Committee |
| ALM | | Asset and Liabilities Management |
| AML | | Anti-Money Laundering |
| AMV | | Autorregulador del Mercado de Valores de Colombia or Colombia’s Stock Market Self-regulator |
| ANPDP | | Autoridad Nacional de Protección de Datos Personales del Peru or National Authority for the Protection of Personal Data of Peru |
| APS | | Autoridad de Fiscalización y Control de Pensiones y Seguros de Bolivia or Supervision and Control Authority for Pensions and Insurance of Bolivia |
| ARRC | | Alternative Reference Rates Committee |
| ASB | | Atlantic Security Bank, currently ASB Bank Corp. |
| ASBANC | | Asociación de Bancos del Peru or Association of Banks of Peru |
| ASFI | | Autoridad Supervisora del Sistema Financiero or Financial System Supervisory Authority – Bolivia |
| ASHC | | Atlantic Security Holding Corporation |
| ASOMIF | | Asociación de Instituciones de Microfinanzas del Peru or Association of Microfinance Institutions of Peru |
| ATM | | Automated Teller Machine (cash machine) |
Banco Falabella | | Banco Falabella, S.A. |
| Bancompartir | | Banco Compartir S.A., now Mibanco Colombia |
| BCB | | Banco Central de Bolivia or Bolivian Central Bank |
| BCCh | | Banco Central de Chile or Chilean Central Bank |
| BCM | | Business Continuity Management |
| BCP Bolivia | | Banco de Crédito de Bolivia S.A. |
| BCP Consolidated | | BCP Consolidated includes BCP Stand-alone, Mibanco and Solución Empresa Administradora Hipotecaria |
| BCP Miami | | Banco de Crédito del Peru, Miami Agency |
| BCP Panama | | Banco de Crédito del Peru, Panama Branch |
| BCP Stand-alone | | Banco de Crédito del Peru including BCP Panama and BCP Miami, but excluding subsidiaries |
| BCRP | | Banco Central de Reserva del Peru or Peruvian Central Bank |
| BOB | | Bolivianos – Bolivian Currency |
| Bps | | Basis Points |
| BVL | | Bolsa de Valores de Lima or Lima Stock Exchange |
| CAS | | Contrato Administrativo de Servicios or Administrative Contracting of Services |
| CCSI | | Credicorp Capital Securities Inc. |
| CEO | | Chief Executive Officer |
| CET1 | | Common Equity Tier I |
| CGU | | Cash-Generating Unit |
| CID | | Corporate and International Division |
| CIMA | | Cayman Islands Monetary Authority |
| CINO | | Chief Innovation Officer |
| CLP | | Chilean Peso – Chilean Currency |
| CMF | | Comisión para el Mercado Financiero or Financial Markets Commission of Chile |
| CODM | | Chief Operating Decision Maker |
| CoE | | Center of Excellence |
| | | | | | | | |
| COFIDE | | Corporación Financiera de Desarrollo S.A. or Peruvian Government-Owned Development Bank |
| CONFIEP | | Confederación Nacional de Instituciones Empresariales Privadas or National Confederation of Private Business Institutions in Peru |
| Consolidated Supervision of Financial and Mixed Conglomerates Regulation | | SBS Resolution No. 11823-2010, Reglamento para la Supervisión Consolidada de los Conglomerados Financieros y Mixtos |
| COOPACS | | Cooperativa de Ahorro y Créditos de Peru or Savings and Loans Associations of Peru |
| COP | | Colombian Peso – Colombian Currency |
| COSO | | Committee of Sponsoring Organizations of the Treadway Commission |
| CPS | | Comisión de Protección Social or Social Protection Committee of Peru |
| CRA | | Credit Rating Agency |
| CSF | | National Institute of Standards and Technology (NIST) Cybersecurity Framework |
CSO | | Chief Strategy Officer |
| Credicorp Capital | | Credicorp Capital Ltd., formerly Credicorp Investments Ltd. |
| Credicorp Capital Bolsa | | Credicorp Capital Sociedad Agente de Bolsa S.A., formerly Credibolsa SAB S.A. |
| Credicorp Capital Chile | | Credicorp Capital Chile S.A., operating subsidiary of Credicorp Capital Holding Chile |
| Credicorp Capital Colombia | | Credicorp Capital Colombia S.A., formerly Correval S.A. |
| Credicorp Capital Fondos | | Credicorp Capital Sociedad Administradora de Fondos S.A., formerly Credifondo SAFI S.A. |
| Credicorp Capital Holding Chile | | Credicorp Capital Holding Chile S.A., holding subsidiary of Credicorp Capital Ltd. |
| Credicorp Capital Holding Colombia | | Credicorp Capital Holding Colombia S.A.S., holding subsidiary of Credicorp Capital Ltd. |
| Credicorp Holding Colombia | | Credicorp Holding Colombia S.A.S., holding subsidiary of Credicorp Ltd., which holds Credicorp Capital Colombia S.A.S. and Mibanco – Banco de la Microempresa de Colombia S.A. |
| Credicorp Capital Holding Peru | | Credicorp Capital Holding Peru S.A., holding subsidiary of Credicorp Capital Ltd. |
| Credicorp Capital LLC | | Subsidiary of Credicorp Capital USA, resulting from the merger of Ultralat Capital Market Inc. and Credicorp Capital Securities Inc. |
| Credicorp Capital Peru | | Credicorp Capital Peru S.A.A., operating subsidiary of Credicorp Capital Holding Peru, and formerly BCP Capital S.A.A. |
| Credicorp Capital Servicios Financieros | | Credicorp Capital Servicios Financieros S.A., formerly BCP Capital Financial Services S.A. |
| Credicorp Capital Titulizadora | | Credicorp Capital Sociedad Titulizadora S.A., formerly Credititulos S.A. |
| Credicorp Capital USA | | Credicorp Capital USA Inc., holding subsidiary of Credicorp Capital Ltd. |
| CRS | | Common Reporting Standards |
| CTF | | Counter-Terrorism Financing |
| Culqi | | Compañía Incubadora de Soluciones Móviles S.A. |
| DANE | | Departamento Administrativo Nacional de Estadísticas or Colombian National Statistics Bureau |
| D&S | | Disability and Survivorship |
| Deposit Insurance Fund | | Fondo de Seguro de Depósitos or Deposit Insurance Fund of Peru |
| | | | | | | | |
| DIAN | | Dirección de Impuestos y Aduanas Nacionales de Colombia or Taxes and National Customs Authority of Colombia |
| DTA | | Deferred Tax Assets |
| Edpymes | | Empresas de Crédito or Small and Micro Firm Development Institution of Peru, formerly Empresas de Desarrollo de Pequeña y Microempresa (Legislative Decree No. 1531) |
| Edyficar | | Empresa Financiera Edyficar S.A. – Peru |
| EIR | | Effective Interest Rate |
| Encumbra | | Empresa Financiera Edyficar S.A.S. – Colombia |
| EPS | | Entidad Prestadora de Salud or Health Care Facility |
| ENPS | | Employee Net Promoter Score |
| ES Act | | Economic Substance Act 2018 (as amended) of Bermuda |
| FAE | | Fondo de Apoyo Empresarial del Peru or Business Support Fund of Peru |
| FAE-Mype | | Fondo de Apoyo Empresarial a la Mype del Peru or SME Business Support Fund of Peru |
| FATCA | | Foreign Account Tax Compliance Act |
| FCA | | Financial Conduct Authority – United Kingdom |
| FED | | Board of Governors of the U.S. Federal Reserve System |
| FFIEC | | Federal Financial Institutions Examination Council |
| FIBA | | Financial and International Business Association, formerly Florida International Bankers Association |
| FINRA | | Financial Industry Regulatory Authority – US |
| Fintech | | Financial Technology |
| FMV | | Fair market value |
| Fondemi | | Fondo de Desarrollo de la Microempresa del Peru or SMEs Development Fund of Peru |
| GAAP | | Generally Accepted Accounting Principles |
| GDP | | Gross Domestic Product |
| GMV | | Gross Merchant Volume |
| Government Program Loans ("GP" or "GP Loans") | | Loans related to Reactiva Peru, FAE-Mype and Impulso MYPERÚ programs to respond effectively to liquidity needs and maintain the payment chain. |
| Grupo Pacífico | | Pacífico Compañía de Seguros y Reaseguros S.A. and consolidated subsidiaries |
| IASB | | International Accounting Standards Board |
| IBA | | ICE Benchmark Administration Limited |
| IBNR | | Incurred but not reported |
| ICBSA | | Inversiones Credicorp Bolivia S.A. |
| ILCR | | Internal Liquidity Coverage Ratio |
| INDECOPI | | Instituto Nacional de Defensa de la Competencia y de la Protección de la Propiedad Intelectual del Peru or National Institute for the Defense of Competition and the Protection of Intellectual Property of Peru |
| IFRS | | International Financial Reporting Standards |
| IGA | | Intergovernmental Agreements |
| IIA | | Institute of Internal Auditors |
| IMF | | International Monetary Fund |
| IMO | | Innovation Management Office |
| INE | | Instituto Nacional de Estadística or National Statistics Institute of Chile |
| INEI | | Instituto Nacional de Estadística e Informática or Peruvian National institute of Statistic and Informatics |
| IPO | | Initial Public Offering |
| IRS | | United States Internal Revenue Service |
| | | | | | | | |
| ISACA | | Information Systems Audit and Control Association |
| IT | | Information Technology |
| IUs | | Innovation Units |
| KRI | | Key Risk Indicators |
| LCR | | Liquidity Coverage Ratio |
| LGD | | Loss Given Default |
| LIBOR | | London Interbank Offered Rate |
| LoB | | Lines of Business or Operating Segments |
| LTV | | Loan to Value |
| MEF | | Ministry of Economy and Finance of Peru |
| Merger Control Law | | Law No. 31112 of Peru (Ley que establece el control previo de operaciones de concentración empresarial) |
| Mibanco | | Mibanco, Banco de la Microempresa S.A. |
| Mibanco Colombia | | Mibanco, Banco de la Microempresa de Colombia S.A. |
| MMD | | Middle-Market Banking Division |
| MSME | | Micro, Small and Medium Enterprise |
| Mype | | Micro y Pequeña Empresa or Micro and Small Enterprise |
| NIM | | Net Interest Margin |
| NIST | | National Institute of Standards and Technology |
| NPS | | Net Promoter Score |
| NYSE | | New York Stock Exchange |
| OECD | | Organization for Economic Cooperation and Development |
| P&C | | Property and Casualty |
| Pacífico Seguros | | Pacífico Compañía de Seguros y Reaseguros S.A. |
| PEN | | Peruvian Sol (S/) – Peruvian Currency |
| Peruvian Banking and Insurance Law | | Law No. 26702, Ley General del Sistema Financiero y del Sistema de Seguros y Orgánica de la Superintendencia de Banca y Seguros |
| PPS | | Peruvian Private Pension System |
| Peruvian Data Privacy Regulation | | Rules governing personal data protection under the Peruvian Data Privacy Law. Approved by decree 016-2024-JUS on November, 2024. |
| RBG | | Retail Banking Group |
| ROAA | | Return on Average Assets |
| ROAE | | Return on Average Equity |
| ROE | | Return on Equity |
| RWAs | | Risk-Weighted Assets |
| S&P | | Standard & Poor’s |
| SBP | | Superintendencia de Bancos de Panamá or Superintendency of Banks of Panama |
| SBS | | Superintendencia de Banca, Seguros y Administradoras Privadas de Fondos de Pensiones or Superintendence of Banks, Insurance and Pension Funds – Peru |
| SCTR | | Seguro Complementario de Trabajo de Riesgo or Complementary Work Risk Insurance |
| SEAH | | Solución Empresa Administradora Hipotecaria S.A. |
| SEC | | U.S. Securities and Exchange Commission |
| SFC | | Superintendencia Financiera de Colombia or Financial Superintendence of Colombia |
| SME | | Small and Medium Enterprise |
| SME – Business | | SME-Business Credicorp Segment |
| SME – Pyme | | SME-Pyme Credicorp Segment |
| SMV | | Superintendencia del Mercado de Valores or Superintendence of the Securities Market – Peru |
| | | | | | | | |
| SOFR | | Secured Overnight Financing Rate |
Soles | | Peruvian currency (S/ - PEN) |
| SUNAT | | Superintendencia Nacional de Aduanas y de Administración Tributaria or Superintendence of Tax Administration – Peru |
| SUSALUD | | Superintendencia Nacional de Salud del Peru or National Health Superintendence of Peru |
| Tenpo | | Tenpo SpA (formerly Krealo SpA) |
| Tyba | | Credicorp Capital Negocios Digitales S.A.S. |
| UIT | | Tax Reference Unit expressed in Soles (Unidad Impositiva Tributaria, acronym in Spanish) |
| Ultralat | | Ultralat Capital Market Inc. |
| U.S. Dollar | | United States currency (also $, US$, US Dollar, US Dollars or U.S. Dollars) |
| USA | | United States of America (USA, U.S.A., US or U.S.) |
| USDBOB | | Currency exchange rate between the U.S. Dollar and the Bolivian Boliviano |
| USDPEN | | Currency exchange rate between the U.S. Dollar and the Peruvian Sol |
| Usury Law Regulation | | Peruvian Law No. 31143, Ley que protege de la usura a los consumidores de los servicios financieros |
| VaR | | Value at Risk |
| VAT | | Value-added tax |
| Wally | | Wally POS S.A.C. |
| WBG | | Wholesale Banking Group |
| WHO | | World Health Organization |
| WTI | | West Texas Intermediate |
PRESENTATION OF FINANCIAL INFORMATION
Credicorp Ltd. is a Bermuda exempted company (and is referred to in this Annual Report as Credicorp, the Company, the Group, we, or us, each of which means either Credicorp Ltd. as a separate entity or as an entity together with our consolidated subsidiaries, as the context may require). We maintain our financial books and records in Peruvian Soles and present our financial statements in accordance with IFRS Accounting Standards as issued by the International Accounting Standards Board (IASB).
We operate primarily through our four lines of business (LoBs): Universal Banking, Microfinance, Insurance & Pensions, and Investment Management & Advisory. Additionally, we complement the operations of our LoBs through our innovation portfolio which is managed by the Innovation Committee at a corporate level. For more information about our innovation portfolio and strategy, please review “ITEM 4. INFORMATION ON THE COMPANY – 4.B Business Overview – (1) Credicorp Overview – Our Innovation Strategy”.
Our eight main operating subsidiaries are:
•Within Universal Banking: (i) Banco de Crédito del Perú S.A. (BCP Stand-alone), a Peruvian financial institution; and (ii) Banco de Crédito de Bolivia S.A. (BCP Bolivia) a commercial bank that operates in Bolivia and that we hold through Inversiones Credicorp Bolivia S.A. (ICBSA);
•Within Microfinance: (iii) Mibanco, Banco de la Microempresa S.A. (Mibanco), a Peruvian banking entity oriented toward the micro and small business sector; and (iv) Mibanco – Banco de la Microempresa de Colombia S.A. (Mibanco Colombia, which we hold through Credicorp Holding Colombia S.A.S.);
•Within Insurance, Medical Services and Pensions: (v) Pacífico Compañía de Seguros y Reaseguros S.A. (Pacífico Seguros and, together with its consolidated subsidiaries, Grupo Pacífico), an entity that contracts and manages all types of general risk and life insurance, reinsurance, provides medical and health services under Pacífico S.A. Entidad Prestadora de Salud (Pacífico EPS) and subsidiaries, and property investment and financial operations; and (vi) Prima AFP S.A., a private pension fund; and
•Finally, within Investment Management and Advisory: (vii) Credicorp Capital Ltd. (together with its subsidiaries) which was formed in 2012, and (viii) ASB Bank Corp., which resulted from the merger between ASB Bank Corp. and Atlantic Security Bank, which we hold through Atlantic Security Holding Corporation (ASHC).
For information about these LoBs, see “ITEM 4. INFORMATION ON THE COMPANY – 4.B Business Overview – (2) Lines of Business (LoBs)”.
As of and for the year ended on December 31, 2025, BCP Stand-alone represented 75.6% of our total assets and 65.2% of our equity attributable to Credicorp’s equity holders (that is, its shareholders). Unless otherwise specified, the financial information of BCP Stand-alone included in this Annual Report is presented in accordance with IFRS Accounting Standards and before eliminations for consolidation purposes. See “ITEM 4. INFORMATION ON THE COMPANY – 4.A History and Development of the Company”. We refer to BCP Stand-alone, BCP Bolivia, Mibanco, Mibanco Colombia, Grupo Pacífico, Prima AFP S.A., Credicorp Capital Ltd. and ASB Bank Corp. as our main operating subsidiaries.
Unless otherwise specified or the context otherwise requires, references in this Annual Report to “S/”, “Sol”, “local currency” or “Soles” are to Peruvian Soles (each Sol is divided into 100 centimos (cents)), and references to “$”, “US$”, “Dollars”, “US Dollars” or “U.S. Dollars” are to United States Dollars. In addition, references to USDPEN are the currency exchange rate between the U.S. Dollar and the Peruvian Sol.
Some of our subsidiaries, namely Atlantic Security Holding Corporation and five of its subsidiaries (Atlantic Security International Financial Services Inc (ASIF), ASB Bank Corp., Atlantic Private Equity Investment Advisor, Atlantic Security Private Equity General Partner and Credicorp Capital Cayman GP), Credicorp Capital USA Inc. (with its subsidiaries Credicorp Capital Advisors LLC., and Credicorp Capital LLC.) and Credicorp Capital Asset Management S.A. Administradora General de Fondos maintain their operations and balances in US Dollars and other currencies. As a result, in certain instances throughout this Annual Report, we have translated US Dollars and other currencies to Soles. You should not construe any of these translations as representations that the US Dollar amounts actually represent such equivalent Sol amounts or that such US Dollar amounts could be converted into Soles at the rate indicated, as of the dates mentioned herein, or at all. Unless otherwise indicated, these Sol amounts have been translated from US Dollar amounts at an exchange rate of S/3.363 = US$1.00, which is the December 31, 2025 exchange rate set by the Peruvian Superintendence of Banks, Insurance and Pension Funds (Superintendencia de Banca, Seguros y Administradoras Privadas
de Fondos de Pensiones or SBS by its Spanish initials), S/3.764 and S/3.709 per dollar as of December 31, 2024 and 2023, respectively. Converting US Dollars to Soles on a specified date (at the prevailing exchange rate on that date) may result in the presentation of Sol amounts that are different from the Sol amounts that would result by converting the same amount of US Dollars on a different specified date (at the prevailing exchange rate on such date). Our Bolivian subsidiary operates in Bolivianos (BOB). For consolidation purposes, our Bolivian subsidiary’s financial statements are also presented in Soles. Our Colombian and Chilean subsidiaries operate in Colombian Pesos (COP) and Chilean Pesos (CLP), respectively, and their financial statements are also converted into Soles for consolidation purposes.
CAUTIONARY STATEMENT WITH RESPECT TO FORWARD-LOOKING STATEMENTS
Certain statements contained in this Annual Report are not historical facts, including, without limitation, certain statements made in the sections titled “ITEM 3. KEY INFORMATION”, “ITEM 4. INFORMATION ON THE COMPANY”, “ITEM 5. OPERATING AND FINANCIAL REVIEW AND PROSPECTS” and “ITEM 11. QUANTITATIVE AND QUALITATIVE DISCLOSURES ABOUT RISK MANAGEMENT”, which are forward-looking statements within the meaning of Section 27A of the U.S. Securities Act of 1933, as amended, and Section 21E of the U.S. Securities Exchange Act of 1934, as amended (the Exchange Act). You can find many of these statements by looking for words such as “believes”, “expects”, “anticipates”, “estimates”, “intends”, “plans”, “goal”, “seek”, “project”, “strategy”, “future”, “likely”, “should”, “will”, “would”, “may””, or other similar expressions referring to future periods. Examples of forward-looking statements may include:
•projections of operating revenues, net income (loss), net income (loss) per share, capital expenditures, dividends, capital structure or other financial items or ratios;
•statements of our plans, objectives or goals;
•statements regarding anticipated trends, competition and regulation; and
•statements about our future economic performance or that of Peru or other countries in which we operate.
Forward-looking statements are based only on our management’s current views and assumptions and involve known and unknown risks and uncertainties that could cause actual results, performance, or events to differ materially from those expressed or implied in the forward-looking statements. Therefore, actual results, performance, or events may be materially different from those in the forward-looking statements due to, without limitation, the following factors:
a)Economic conditions and regulatory framework in Peru and markets in which we operate;
b)The occurrence of natural disasters or political or social instability in Peru and markets in which we operate;
c)The adequacy of the dividends that our subsidiaries are able to pay to us, which may affect our ability to pay dividends to shareholders and corporate expenses;
d)Performance of, and volatility in, financial markets, including in Latin America and other emerging markets;
e)The frequency, severity, and types of insured loss events;
f)Fluctuations in interest rate and liquidity levels;
g)Foreign currency exchange rates, including the Sol/US Dollar exchange rate;
h)Deterioration in the quality of our loan portfolio;
i)Increasing levels of competition in Peru and markets in which we operate;
j)Developments and changes in laws and regulations affecting the financial sector and adoption of new international guidelines;
k)Changes in the policies of central banks and/or foreign governments;
l)Effectiveness of our risk management policies and of our operational and security systems;
m)Emerging cybersecurity and environmental risks;
n)Losses associated with counterparty exposures;
o)Public health crises beyond our control;
p)Changes in Bermuda laws and regulations applicable to so-called non-resident entities; and
q)International geopolitical tensions and conflict.
See “ITEM 3. KEY INFORMATION - 3.D Risk Factors” and “ITEM 5. OPERATING AND FINANCIAL REVIEW AND PROSPECTS” for additional information and other such factors.
Any forward-looking statement made by us in this Annual Report is based only on information currently available to us and is made only as of the date on which it is made, and you are cautioned not to place any undue reliance on any such statement. We are not under any obligation to, and we expressly disclaim any obligation to, update or alter any forward-looking statements contained in this Annual Report, whether as a result of new information, future events or otherwise.
PART I
ITEM 1.IDENTITY OF DIRECTORS, SENIOR MANAGEMENT AND ADVISERS
A.Directors
Not applicable.
B.Senior Management
Not applicable.
C.Advisers
Not applicable.
ITEM 2.OFFER STATISTICS AND EXPECTED TIMETABLE
Not applicable.
ITEM 3.KEY INFORMATION
3. A[Reserved]
3. BCapitalization and Indebtedness
Not applicable.
3. CReasons for the Offer and Use of Proceeds
Not applicable.
3. DRisk Factors
Our businesses are affected by many internal and external factors in the markets in which we operate. Different risk factors can impact our businesses, our ability to operate effectively and our business strategies. You should consider the risk factors carefully and read them in conjunction with all the information in this document. You should note that these risk factors described below are not the only risks to consider. Rather, these are the risks that we currently consider material. There may be additional risks that we consider immaterial or of which we are unaware, and any of these risks could have similar effects to those set forth below.
Credicorp is exposed to the following macroeconomic, legal and regulatory, industry and market, business performance, operational and environmental and social and governance risks:
•Our business is exposed to risks related to political and socioeconomic conditions in Peru.
•Our banking and capital market operations in neighboring countries expose us to risks related to political and economic conditions in those countries.
•Economic and market conditions in other countries may affect the Peruvian economy and the market price of Peruvian securities.
•Geopolitical tensions and conflict, including the conflicts between Russia and Ukraine and the ongoing conflict in the Middle East, could have economic effects that could negatively impact the Peruvian economy.
•Regulatory changes and the adoption of new international guidelines to sectors in which we operate could adversely affect our earnings and our operating performance.
•Credicorp, as a Bermuda exempted company, may be adversely affected by any change in Bermuda law or regulation.
•It may be difficult to serve process on or enforce judgments against us or our principals residing outside of the United States or to assert claims against our officers or Directors.
•Medical malpractice claims, professional negligence and adverse clinical outcomes that may arise from our medical services operations could lead to significant financial liabilities. These situations have the potential to not only result in substantial legal and settlement costs but also to cause reputational harm.
•We operate in a competitive environment that may limit our potential to grow and may put pressure on our margins and reduce our profitability.
•Our business and results of operations could be negatively impacted by a pandemic virus outbreak or other public health crises beyond our control.
•Our financial statements, particularly our interest-earning assets and interest-bearing liabilities, could be exposed to fluctuations in interest rates, foreign currency exchange rates and exchange controls, which may adversely affect our financial condition and results of operations.
•Liquidity risks are inherent in our business activities.
•Our liquidity, business activities and profitability may be adversely affected by an inability to access the debt capital markets or to sell assets during periods of market-wide or firm-specific liquidity constraints.
•The Group relies significantly on its deposits for funding.
•Our investments measured at fair value through profit or loss and fair value through other comprehensive income expose us to market price volatility, liquidity declines and fluctuations in foreign currency exchange rates, which may result in losses that could adversely affect our business, financial condition and operating results. In addition, our investments measured at amortized cost may expose us to market price volatility and liquidity shortcomings if sales of those investments become required for liquidity purposes.
•A deterioration in the quality of our loan portfolio may adversely affect our results of operations.
•Errors or inaccuracies in risk models can have an adverse economic impact on our business, financial condition and results of operations.
•Accurate underwriting and setting of premiums are important risk management tools for primary insurance companies, such as Grupo Pacífico, but the estimates underlying our underwriting and premiums may be inaccurate.
•While reinsurance is a tool for risk diversification that may help to reduce losses for a primary insurance company such as Grupo Pacífico, we face the possibility that the reinsured amount will be insufficient to fully cover incurred losses or that the reinsurance companies will be unable to honor their contractual obligations.
•Risks not contemplated in our insurance policies may affect our results of operations.
•Acquisitions, strategic partnerships and investments may not perform as expected, which could have an adverse effect on our business, financial condition and results of operations.
•Credicorp’s increasing investments in digital transformation and disruptive initiatives may fail to achieve the ambitions, efficiencies, and other performance improvements that it is pursuing.
•The shortage of specialized talent can negatively affect the implementation of our strategy.
•Our ability to pay dividends to shareholders and to pay corporate expenses may be adversely affected by the ability of our subsidiaries to pay dividends to us.
•A failure in, or breach of, our operational or security systems, fraud by our employees or outsiders, and other operational errors of our internal controls system could temporarily interrupt our businesses, increase our costs and cause losses.
•Our Anti-Money Laundering (AML) and Counter-Terrorist Financing (CTF) measures are designed to safeguard our operations and uphold the highest standards of compliance; however, no system can guarantee absolute prevention, and we may not be able to prevent third parties from using as a conduit for illicit activities. While our framework significantly reduces the likelihood of illicit activities and reinforces the integrity of our business, any failure could damage our reputation or expose us to fines, sanctions or legal enforcement, any of which could have a material adverse effect on our business, financial condition and results of operations.
•Natural disasters in Peru and in the countries where we operate could disrupt our businesses and affect our results of operations and financial condition.
•We may incur financial losses and damages to our reputation from ESG risks, which recently have been recognized as increasingly relevant because they can affect business continuity and the creation of long-term value for our stakeholders.
Macroeconomic Risks
Our business is exposed to risks related to political and socioeconomic conditions in Peru
Most operations of BCP Stand-alone, Grupo Pacífico, and Prima AFP, and a significant part of Credicorp Capital’s and Mibanco’s operations, are located in Peru. In addition, while ASB Bank Corp. is based in Panama rather than in Peru, most of its customers are located in Peru. Therefore, our results primarily depend on economic activity in Peru. Changes in economic conditions, government policies and social uncertainty can alter the financial health and regular development of our businesses. These changes may include, but are not limited to, high inflation, currency depreciation, currency exchange controls, caps on interest rates, confiscation of private property and changes in financial regulation. Similarly, political and social unrest, corruption scandals and deteriorations in public security conditions - such as increased criminal activity or extortion - affecting Peru could adversely impact our operations.
Political Conditions
Peru experienced one of its worst social and political crises in more than two decades after a failed coup on December 7, 2022, by former President Pedro Castillo, which triggered and exacerbated massive protests. On the day of a debate by Peru’s Congress on a third motion to impeach Castillo, he announced in a message to the Nation the temporary dissolution of Peru’s Congress, new elections for a Congress with the power to reform Peru’s constitution, and the restructuring of Peru’s justice system. The police and armed forces opposed the coup, releasing a joint statement saying that any act contrary to the established constitutional order was a violation of the constitution and that they would not abide by it. Within hours of his speech, Peru’s Congress voted to remove Castillo from office due to moral incapacity and he was arrested on charges of rebellion and conspiracy. Vice President Dina Boluarte was sworn in as Peru’s first female president and indicated that she plans to govern until July 2026, when Castillo’s term would have ended.
Between December 2022, when Boluarte took office, and the first months of 2023, social unrest increased, mainly in southern regions of Peru which represent around 15% of Peru’s GDP, where Castillo had more support. Protesters demanded the release of former President Castillo and the holding of new general elections. Protests were violent and resulted in supply chain disruptions due to road blockages, and some regional airports suspended operations temporarily as infrastructure was damaged. Additionally, some mining operations were also disrupted as they faced road blockages and supply shortages. Furthermore, the protest negatively affected the tourism, hospitality, transportation, construction, and retail sectors.
These protests ended in February 2023. According to the Ombudsman’s office, the conflict linked to the political crisis caused at least 60 deaths as a result of clashes between civilians, police, and the military. Since then, other attempts of social protest have not gained much traction. However, there can be no assurance that similar social unrest will not occur in the future.
In the context of social unrest, on December 12, 2022, a bill was initially approved by Congress to hold early elections in April 2024. Thereafter, political parties asked for a reconsideration of the bill which would move the date for the elections earlier to October 2023. On January 29, 2023, the reconsidered bill did not obtain the required superior majority (87 of 130 votes), which voided the initially approved initiative. Two months later, in March 2023, the executive branch presented another bill for early elections in December 2023, which was again rejected. On June 15, 2023, President Boluarte indicated to press that early elections in 2024 were a ‘closed topic’ and that her government would remain in office until July 2026, which is the initial end date of Castillo’s term.
In 2025, the last year of former President Boluarte's term, Congress had the authority to remove her from office without the need to call for early elections once she announces the election date. Removing the president required a motion of vacancy to be signed by at least 20% of Congress (26 signatures). The motion then had to be admitted to debate with the favorable vote of 40% of Congress. Finally, approving the vacancy required a qualified majority of at least two‑thirds of the legal number of congressmen, the equivalent of 87 out of 130 votes. This process was ultimately carried out, and on October 10th, 122 members of Congress voted to remove Boluarte from office due to her declared ‘permanent moral incapacity’, citing the government’s failure to control rampant crime and insecurity. The position of the president is assumed by the vice president or, in their absence, by the president of Congress, without the need to call for early elections. As such, and given that Boluarte had no vice president, the then‑President of Congress, José Jerí, took office following the congressional vote. He was an elected congressman from the Somos Perú party. However, Jerí’s tenure was short‑lived: on February 17, 2026, Congress approved multiple motions of censure against him (in his capacity as President of Congress and, by succession, interim President of the Republic), which resulted in his immediate removal and the declaration of the position of the presidency as vacant. Following Jerí’s removal, Congress proceeded to elect a new congressional leader who, by constitutional succession, assumed the presidency; José María Balcázar subsequently took office as President of the Republic on a transitional basis.
On March 25, 2025, former President Dina Boluarte called for general elections to be held on April 12, 2026, in which Peruvians will elect a new President, members of Congress and the Senate of a restored bicameral legislature, as well as representatives to the Andean Parliament. Under the new bicameral system, removing the president requires a vacancy motion to be initiated in the Chamber of Deputies, signed by at least 30% of its members (39 signatures). The motion must first be admitted to debate with the favorable vote of 40% of deputies. To approve the vacancy at this stage, a qualified majority of two‑thirds of the legal number of deputies (87 out of 130 votes) is required. Once approved, the decision is submitted to the Senate, where the president may again present a defense. The vacancy is finalized only if it is ratified by a two‑thirds majority of the legal number of senators (40 out of 60 votes).
As of now, 38 political parties are officially registered to participate in these elections. The 2026 elections will mark the return to a bicameral Congress following the approval by Congress of a constitutional reform that introduces a Senate with at least 60 seats and allows for consecutive legislative reelection. According to Moody’s, this constitutional overhaul aims to strengthen institutional checks and balances, although its effectiveness will depend on implementation and political dynamics following the elections.
Peru's 2026 presidential election moved to a runoff after no candidate secured a majority in the first round (12–13 April). Keiko Fujimori leads with about 17% and is expected to advance to the June 7 runoff. The second finalist remains uncertain: Roberto Sánchez is ahead of Rafael López Aliaga by less than 20,000 votes and some tally sheets are still under review, so confirmation may take until mid-May. The fragmented vote underscores Peru’s divided political landscape and the final runoff pairing hinges on completing the official count and resolving appeals.
The general elections of 2021 resulted in an environment of political and social polarization, and general elections in 2026 could have a similar result. The Peruvian Congress remains highly fragmented, as no political party has a clear majority and at least 10 political parties hold minority representations. Former president Boluarte assumed the presidency with no parliamentary bench as she was expelled from the political party Peru Libre at the beginning of 2021 for ideological differences.
President Dina Boluarte left office on October 10, 2025 with an approval rating of only 3%, according to the September 2025 Ipsos Survey, underscoring the fragility of Peru’s political environment as the country moves toward the 2026 general elections. This instability intensified under President José Jerí, against whom Congress filed seven impeachment motions invoking “permanent moral incapacity.” One of these motions was ultimately successful, leading to President Jerí’s removal from office on February 17, 2026. The impeachment proceedings were based on allegations that President Jerí held non‑registered meetings with a Chinese businessman, purportedly in violation of Peru’s Law on the Management of Interests, raising significant concerns regarding transparency and potential conflicts of interest. Following his removal, Congress elected José María Balcázar of the Perú Libre party—who was associated with former president Pedro Castillo—as president, securing 60 votes in a second‑round vote against María del Carmen Alva (political party Acción Popular). Denisse Miralles, who previously served as Minister of Economy in President Jerí’s cabinet, was appointed Prime Minister.
There can be no assurance that future developments in or affecting the Peruvian political landscape, including economic, social or political instability, will not materially and adversely affect our business, financial condition or results of operations.
The risk that a future government may revive the debate over adopting a new constitution remains. To replace the current constitution through a constituent assembly, a constitutional reform proposal would first need to be approved by Peru’s Congress—either by an absolute majority of 87 votes in two consecutive legislative sessions, or by a simple majority of 66 votes followed by ratification through a national referendum. These procedural requirements are expected to change with the introduction of a bicameral Congress beginning in 2026.
Social and political instability in Peru is not new. The country has experienced various instances of instability ranging from domestic terrorism (during the 1980s) to military coups and a succession of regimes. Although renewed domestic terrorism is not expected, any violence derived from the drug trade or illegal mining, or a resumption of large-scale terrorist activities, could hurt our operations. Additionally, some regimes during the 1970s and 1980s heavily intervened in the economy, through actions including expropriation, nationalization and new taxation policies. These interventions altered the country’s economic environment, financial system and agricultural sector, among other components.
There have also been several political disputes between the government and the opposition in recent years. Since 2001, more than ten different political organizations have nominated candidates in each of the past five election processes, showing
low approval rating for all candidates (usually around 20%–30% or less). Between August 2016 and February 2026, Peru has had 8 presidents, 3 congresses and 20 prime ministers.
Socioeconomic conditions
Additionally, high levels of poverty and inequality in Peru have been a contributing factor to social conflict. According to Peruvian National Institute of Statistics and Information (Instituto Nacional de Estadística e Informática or INEI by its Spanish initials), Peru’s poverty rate decreased from almost 60% of the population to 20% between 2004 and 2019 (that is, before the COVID-19 pandemic). In 2020, due to the economic shock resulting from the COVID-19 pandemic, the poverty rate increased to 30%, erasing nearly all gains from the last decade and even though it fell to 25.9% in 2021, it rose again in 2022 to 27.5%, remaining above pre-pandemic levels. In 2023, the poverty rate increased for a second consecutive year to 29% due to the first economic recession in 25 years, excluding the pandemic. In 2024, as the economy began to recover, Peru’s poverty rate declined to 27.6%. The rate is expected to continue falling supported by stronger economic growth.
There can be no assurance that Peru will not continue facing political, economic or social problems in the future or that these problems will not adversely affect our business, financial condition and results of operations. There is always the possibility that a political faction could promote policies to respond to social unrest that include, among other things, expropriation, nationalization, suspension of the enforcement of creditors’ rights and new taxation policies. As such, our financial condition and results of operations may be adversely affected by changes in Peru’s political climate to the extent such changes affect the nation’s economic policies, growth, stability, outlook or regulatory environment. Another source of risk is political and social unrest in areas where mining and oil and gas operations take place. In recent years, Peru has experienced protests against mining projects in several regions around the country.
Mining is an important part of the Peruvian economy. According to INEI, the mining and hydrocarbons sector represented 14.4% of GDP (mining 12.2% and hydrocarbons 2.2%) in 2025, this corresponds to the weight derived from the GDP structure with base year 2007. The country’s exports are highly concentrated in the mining industry. In 2025, free on board (FOB) exports of metallic mining represented 66% of total exports (copper represents 45% while gold 38% of mining exports), with tax revenues from the sector representing close to 11% of total fiscal revenues.
On several occasions, local communities have opposed these operations, and accused them of polluting the environment, specifically rivers, hurting agricultural and other traditional economic activities, as well as complained of not receiving the benefits generated by the mining projects. For example, in April 2022, Las Bambas (which produced 15% of Peru's total copper production in 2025) shut down for 51 days after protesters from two communities entered the mine. The social protests of late 2022 and early 2023 also affected Las Bambas’ operations, as road blockages prevented the arrival of key inputs. In another example, on January 12, 2023, Minsur announced the temporary suspension of operations in its San Rafael tin mine in Peru’s Puno region, as a measure of solidarity with the families of individuals who died in protests in the region. On February 6, 2023, Buenaventura temporarily suspended operations at its Julcani silver mine after protesters entered and destroyed part of the mine's facilities. In 2024, protests and strikes were held in Arequipa and Puno, regions of southern Peru, against the Tía María mining project, though these were less intense compared to those during the social crisis of late 2022. These protests were primarily driven by local communities concerned about the environmental impact and potential threats to their agricultural livelihoods. The Tía María project, operated by Southern Peru Copper Corporation, has been a point of contention for years. In July 2024, the company announced plans to resume development, which reignited opposition, although less than in the past. For instance, on December 16 and 17, farmers staged a preventive strike in the Tambo Valley, in Islay, Arequipa—right within the mining project’s area of influence. Notwithstanding this opposition, construction progress stood at approximately 24% as of December 2025.
Any delay or cancellation of mining projects could reduce Peruvian economic growth and business confidence, through reduced production, thereby hurting the financial system both directly (many mining projects are at least partially financed by local financial institutions) and indirectly (overall economic activity could decelerate). Additionally, 66% of total exports are metallic mining products; fewer exports could reduce the trade balance surplus, cause depreciation pressures, and increase inflation. Any such effect on the financial system could have a material adverse effect on our business and result of operations.
More recently, violence and crime have become the main concern of Peruvians, according to a October 2025 Ipsos survey—above corruption and unemployment. According to the National Institute of Statistics and Informatics (INEI) and the Interinstitutional Statistical Committee on Criminality (CEIC), the homicide rate in Peru in 2025 was 10.7 per 100,000 inhabitants, a historical high (7.2 in 2015, according to the December 2024 research from the Bank of Ideas Credicorp). The increase in citizen insecurity not only has a negative impact on victims of crime, but also households and companies, which allocate part of their income to prevention measures. Due to the security crisis, the government declared two districts of
Metropolitan Lima in a state of emergency in September 2023 to provide for security and social peace until January 2024. In September 2024, a 60-day state of emergency was declared in 12 districts of Lima following a strike by bus drivers demanding greater protection from organized crime. At the beginning of January 2025, the government extended the state of emergency declared in the province of Trujillo in the department of La Libertad for 60 days due to a significant increase in criminal activity, including extortion, kidnappings, and murders.
During 2025, the Peruvian government continued to rely on successive declarations and extensions of states of emergency in several regions, particularly in Metropolitan Lima, Callao and the province of Trujillo, with measures renewed multiple times during the year, adjusted in scope to specific districts or provinces, and periodically re‑declared in response to persistent criminal activity, including extortion, kidnappings and violent crime. These measures generally involved the temporary restriction of certain constitutional rights (freedom of assembly, and transit, among others) and the support of the Armed Forces to the National Police in maintaining public order, and similar actions could continue to be adopted in the future depending on security conditions.
Mining has also been affected by crime. In December 2023, nine workers were killed and others gravely injured in an attack where men armed with explosives raided and took hostages at a mine belonging to Compañía Minera Poderosa, one of Peru's top gold producers. The government attributed the attack to illegal miners and criminal groups. In September 2024, a subsequent attack on a Poderosa facility resulted in the death of a security agent and injuries to others. On January 12, 2025, the company was again targeted by illegal miners and criminal groups, resulting in the destruction of a high-voltage tower that supplies power to key mining operations in Pataz, located in the department of La Libertad. In May 2025, following the kidnapping and subsequent murder of thirteen security workers linked to a contractor operating at a Poderosa‑related mine site in Pataz, the government temporarily suspended mining operations, imposed curfews and expanded the military presence in the area. The risk that such criminal acts could persist or recur in the future remains high.
Altogether, this reduces economic efficiency and aggregate productivity. Higher crime rates can lead to financial instability for borrowers, making it more difficult for them to repay loans. Additionally, it can negatively impact the local economy, leading to reduced business activity and lower income levels. This economic downturn can affect borrowers’ ability to repay loans, which in turn increases the overall credit risk. Even further, crime can disrupt business operations, particularly for small and medium-sized enterprises (SMEs), which can lead to cash flow problems, making it harder for businesses to meet their loan obligations. The persistence of these problems represents a source of risk to the economy and Credicorp’s Businesses.
After social unrest erupted in December 2022, Standard & Poor’s (S&P) changed the outlook for Peru’s long-term debt in foreign currency from stable to negative (but kept the credit rating at BBB) due to the challenging relationship between the executive and legislative branches, which limited the government’s ability to timely implement policies. S&P reaffirmed its BBB rating with negative outlook in February 2024 and two months later, in April 2024, it downgraded Peru's sovereign debt credit rating to BBB- (the lowest level allowed to be considered an investment-grade country) with a stable outlook. The agency indicated that its decision reflected the country's complex political environment, which limits the government's ability to adopt policies that favor investment and, in turn, affects growth prospects.
In September 2024, Moody's affirmed Peru's credit rating at Baa1, two notches above the minimum investment grade rating, and improved the outlook from negative to stable due to political reforms that alleviate medium-term concerns about institutional stability. These reforms included the restoration of a bicameral Congress and the reintroduction of congressional reelection. In November 2024, Fitch also improved the outlook from negative to stable and affirmed its rating at BBB (one notch above the minimum investment grade rating). Since then, there have been no further changes to Peru’s sovereign credit ratings or outlooks.
Peru held general elections on April 12, 2026, to elect a new President, members of Congress and the Senate under the restored bicameral legislative system. As no presidential candidate secured an absolute majority in the first round, a second‑round runoff election is scheduled for June 7, 2026. These elections mark the return to a bicameral Congress, including the election of a new Senate, which has constitutional and oversight powers, such as reviewing and approving legislation passed by the lower house, ratifying key public appointments, and authorizing certain executive actions.
Peru’s electoral framework includes a legislative electoral threshold (“valla electoral”) that conditions access to congressional representation. Under the reinstated bicameral legislature, political organizations must obtain at least 5% of valid nationwide votes and meet minimum seat thresholds in each chamber to participate in the allocation of congressional seats. The implementation of this framework, together with the transition to a bicameral Congress, may contribute to political fragmentation, legislative delays, or shifts in economic or regulatory priorities. These factors could increase political
uncertainty and social tensions, potentially adversely affecting investor confidence, economic growth, and the operating environment for businesses in Peru.
Our banking and capital market operations in neighboring countries expose us to risks related to political and economic conditions in those countries.
ICBSA, Credicorp Capital Holding Colombia, Credicorp Capital Holding Chile and ASB Bank Corp. expose us to risks related to Bolivian, Colombian, Chilean and Panamanian political and economic conditions, respectively. These economies experienced significant GDP contractions in 2020 due to the COVID-19 pandemic and faced uneven recoveries as a result of different policy responses and economic structures. Even prior to the pandemic, these countries exhibited elevated levels of inequality and social dissatisfaction. The pandemic’s adverse effects on poverty and inequality were further exacerbated by the pandemic’s adverse effects on poverty and employment. The global inflationary shock (especially high energy and food prices) drove inflation rates to their highest in decades to which central banks reacted by significantly increasing their policy rates. This environment further intensified existing social and economic pressures in these markets which resulted in countries facing distinct macroeconomic trajectories shaped by idiosyncratic factors.
Between 2019 and 2023, Chile experienced significant social and political turbulence. In October 2019, massive and violent demonstrations erupted, prompting President Sebastián Piñera’s government to agree to a referendum on a new constitution. In late 2021, Gabriel Boric, a 36‑year‑old left‑wing leader, was elected president for a four‑year term. After voters rejected the proposed new constitution in September 2022, Congress approved a new constitutional process, which was again rejected in December 2023. More recently, political developments have reduced uncertainty. In December 2025, José Antonio Kast was elected president by a decisive margin, marking a shift toward more conservative economic and public‑order policies.
In Colombia, the proposal of an unpopular tax reform in 2021 triggered serious public unrest, ranking among the worst episodes of social protest in the country’s recent history. In 2022, Gustavo Petro, a left‑wing candidate and former member of the M‑19 guerrilla group, won the general election, becoming the first left‑wing president in Colombia’s history for a four‑year term. His ability to implement reforms has been undermined by corruption scandals and the subsequent loss of a political majority in Congress. Colombia will hold presidential elections in May 2026, with a possible runoff in June, a process that typically gains greater clarity after early‑year political developments. Recent polling suggests a highly competitive race between right‑ and left‑wing candidates, with the eventual outcome expected to significantly shape the macroeconomic outlook amid fiscal deterioration, weak private investment, and worsening security conditions.
Panama experienced rising social unrest beginning in 2022, driven by increasing living costs. In October 2023, large‑scale protests erupted again after Congress fast‑tracked approval of the renegotiated concession contract between the government and Minera Cobre Panamá. The unrest lasted more than a month and ended only after the Supreme Court ruled the contract unconstitutional, a decision widely welcomed by the population. Following this period of instability, José Raúl Mulino was elected president in May 2024. His administration has taken steps to restore fiscal discipline and institutional stability, including securing the suspension of international arbitration proceedings involving Minera Cobre Panamá. In 2025, however, Mulino’s government faced renewed social unrest following approval of a reform to the social security system. Despite widespread protests, the administration did not retract the reform, underscoring its commitment to advancing structural fiscal measures amid continued social opposition.
In Bolivia, Luis Arce, a left‑wing candidate, was elected president for a five‑year term in 2020. Between late 2022 and January 2023, protests took place in Santa Cruz, the country’s largest city by GDP. In September 2024, social unrest intensified following the disqualification of Evo Morales’s candidacy for the August 2025 election. Supporters of Morales, including factions within the MAS party, organized demonstrations and roadblocks, which escalated into violent clashes between pro‑Morales and pro‑Arce groups and were also driven by underlying economic concerns. Political uncertainty eased after the October 2025 election of President Rodrigo Paz, which ended nearly two decades of rule by the Movement Toward Socialism party and marked a significant political transition amid efforts to address macroeconomic imbalances and restore confidence.
While these more recent electoral outcomes may contribute to greater political clarity or policy continuity in certain jurisdictions, the region remains exposed to risks associated with persistent social demands, political polarization and potential shifts in economic policy. Such risks could continue to affect macroeconomic conditions and the operating environment in the countries in which we operate. Accordingly, we cannot provide any assurance that Peru will not experience spillover effects from developments in neighboring or comparable countries, including situations observed elsewhere in the region where social dissatisfaction initially concentrated among lower‑income groups later extended to broader segments of the population, such as the middle class. A similar expansion of social unrest in Peru could adversely affect economic activity, consumer confidence
and segments of our client base, which could have a materially adverse effect on our business and results of operations. In addition, significant changes in political or economic conditions in Bolivia, Colombia, Chile or Panama could also adversely affect our business, financial condition and results of operations.
Bolivia
In 2025, the Bolivian economy continued to face significant challenges stemming from the balance of payments crisis that began in 2023. This situation was further exacerbated by domestic fuel shortages, increasing volatility in the parallel exchange rate, and low levels of dollar liquidity at the Central Bank, which affected its ability to meet key short-term obligations. In addition, sociopolitical polarization intensified. During the first half of the year, several social groups opposed to the government staged protests and road blockades that directly disrupted economic activity and exerted upward pressure on prices, with the highest monthly variation recorded in June (5.2%). GDP fell 1.6% year-on-year in the first nine months of 2025.
As in 2024, the government maintained unconventional policies aimed at restoring foreign exchange flows and address macroeconomic imbalances. These measures included the domestic purchase of gold, the issuance of U.S. Dollar-denominated bonds, gold-backed forward operations, the repatriation of public company assets, and the receipt of transfers, donations, and other sources of income. As a result, the Central Bank acquired approximately US$2.7 billion to meet its financial obligations. Despite these efforts, the foreign currency shortage persisted.
From the latter half of 2025 onward, Bolivia experienced a notable improvement in its economic outlook, supported by increased optimism following the inauguration of the new government in November. The economic measures implemented by the authorities yielded positive results across multiple indicators, including moderated inflation, stabilization of the parallel exchange rate, and a reduction in country risk (573 basis points as of February 20, 2026, from approximately 1,525 basis points prior to the first round of the presidential election). Key measures enacted included eliminating the fuel subsidy, negotiating new external loans with multilateral organizations totaling up to US$7.6 billion, publishing a reference exchange rate based on foreign trade transactions within the financial sector, tariff relief for various imported goods, and strengthening social compensation and benefit programs.
By the end of 2025, Bolivia’s international reserves reached approximately US$3.7 billion, equivalent to 6.5% of GDP and representing an 88% increase compared to the end of 2024. Most reserves were held in gold, cash reserves increased from 2.4% to 13.6% of total reserves within the year. The exchange rate averaged 9.6 bolivianos per dollar by December, while the official exchange rate remained unchanged.
Annual inflation rose to 20.4% in December 2025, primarily influenced by adverse weather conditions, political instability, smuggling activities, and global inflationary pressures.
Additionally, the government established a six-month deferral on loans granted to micro and small economic units upon borrower request.
Finally, the Financial System Supervisory Authority (ASFI) required banks to capitalize a smaller share of their profits compared to previous years, easing capital retention requirements.
Colombia
The Colombian economy grew 2.6% year-over-year in 2025. In line with our expectations and the dynamic seen over the last year, consumption remained the primary driver of economic activity, resulting in a strong increase in domestic demand (3Q25: 5%; YTD: 4.6%). On the private consumption side, the solid dynamism has been explained by i) higher real salaries, ii) a record-low unemployment rate amid higher job creation, iii) historic workers’ remittances, iv) government transfers to households, v) higher income of coffee-growing families, and vi) higher consumer credit. Public consumption has significantly contributed to GDP expansion amid ongoing fiscal deterioration and the government's reluctance to undertake spending cuts, especially during the electoral period. Conversely, investment remains sluggish, posing risks to potential GDP growth ahead. Elevated interest rates and heightened regulatory risks amid political uncertainty continue to weigh on investment. GDP is expected to grow 2.7% in 2026.
Headline inflation remained relatively stable in 2025, standing at 5.10%, just 10bps below the 2024 close (5.2%), making fifth consecutive year above the inflation target range of 3.0% +/- 1 percentage point. This trend was primarily driven by the housing (rent,utilities and basic services) division (+4.76% y/y, contributing +148bp), foodstuffs (+5.07% y/y, +95bp), and
restaurants and hotels (+4.97% y/y, +87bp). Notably, core measures signaled mounting inflationary pressures at the end of last year, with the average of the four core metrics remaining high at 5.24% y/y (the BanRep’s preferred gauge, which excludes food and regulated items, accelerated to 5.02% y/y). Strong domestic demand and indexation mechanisms following minimum-wage increases have been major factors behind inflation's stickiness. The stunning 23% increase in the minimum wage in 2026 is expected to push inflation.
Under this scenario, the Banco de la República (BanRep) only cut its reference rate by 25 basis points to 9.25% along 2025, in stark contrast to initial market forecasts of an accumulated 250 basis points reduction. In January 2026, the BanRep raised its policy rate by 100 bp to 10.25% citing rising inflation expectations following the increase in the 2026 minimum wage.
The COP closed Dec-25 at 3,775 per dollar, representing a 14.3% y/y appreciation. This trend was driven by factors such as (i) the global weakening of the USD throughout the year and (ii) the externalities of the national government’s financial engineering maneuvers. Specifically, the Directorate of Public Credit executed strategic monetizations of proceeds from external debt issuances to bolster the local currency, leveraging the exchange rate to improve key fiscal metrics. All in all, according to the central bank’s technical staff, the current analytical framework for macroeconomic imbalances indicates that (a) fiscal slippage and (b) the overvaluation of the real exchange rate are the primary concerns.
Total fiscal deficit closed last year near 6.2% of GDP; however, the primary deficit reached ~3% of GDP indicating that the structural deterioration of public finances persists. Under this context, Fitch cut the sovereign rating from BB+ to BB in December 25, matching S&P. All attention will be paid to the fiscal plan of the upcoming administration.
On the political side, congressional elections primaries were held on March 8, 2026, while the first round of the presidential election is scheduled for May 31, 2026, with a potential runoff on June 21, 2026. The March elections provided greater visibility on the electoral landscape, narrowing the presidential field to approximately six candidates. Paloma Valencia (center‑right), Abelardo de la Espriella (right), and Iván Cepeda (hard left) have emerged as the most prominent figures. The new Congress is expected to remain highly fragmented, with no absolute majority, and the left is set to lose around 10 seats following the expiration of the special congressional seats granted under the FARC Peace Agreement. Undoubtedly, the final electoral outcome will shape the macroeconomic outlook over the coming years, against a backdrop of deteriorating fiscal accounts, sluggish private investment, and worsening security conditions.
Chile
According to the Central Bank of Chile (BCCh), Chile’s annual GDP grew by 2.4% in 2025. Growth projections were steadily raised throughout the year—particularly for non-mining sectors—as the global economy remained resilient and local investment proved more dynamic than anticipated, especially in the mining and energy industries. Investment exceeded expectations, with capital goods import figures confirming this positive momentum; however, investment in construction and infrastructure continues to lag. Private consumption evolved in line with forecasts as its underlying fundamentals improved. Specifically, consumer confidence has risen, and the labor market shows signs of recovery, although significant challenges remain. The BCCh also noted improved terms of trade, driven by a sharp rise in copper prices. This surge is attributed to increased demand—linked to artificial intelligence (AI) investment, the energy transition, and defense spending—combined with supply constraints. Conversely, oil prices declined due to improved supply prospects.
According to the Chilean National Statistics Bureau (INE), annual inflation stood at 3.5% in December 2025, down from 4.5% a year earlier and slightly above the Central Bank’s 3% target. During the year, inflation declined faster than anticipated, particularly in the goods component, driven by the strong appreciation of the Chilean Peso (CLP) and the impact of trade diversions on the prices of certain imported goods. Services inflation remained above 4% by year-end, although labor cost growth slowed. According to BCCh surveys, two-year inflation expectations remain well-anchored at the 3% target.
In this context, the BCCh continued the normalization of the policy rate, implementing a total reduction of 50 basis points during 2025, for a cumulative decrease of 675 basis points since July 2023. The rate closed the year at 4.5%, near the midpoint of the neutral level estimated at 4.25%. Looking ahead, the BCCh stated that the Board will evaluate future movements of the monetary policy rate based on the evolution of the macroeconomic scenario and its implications for inflation convergence.
Regarding the fiscal accounts, the fiscal deficit close 2025 at 2.8% of GDP, while gross debt remained stable at 41.7% of GDP in 2025. The recent surge in copper prices is likely to alleviate fiscal pressures in the short term. Notably, both S&P and Moody’s reaffirmed Chile’s sovereign credit rating with a stable outlook. S&P highlighted Chile’s strong institutional framework, sound fiscal and monetary policies, and moderate debt profile by international standards, noting that foreign direct
investment is sufficient to finance current-account deficits. Moody’s emphasized that Chile’s fiscal consolidation is expected to continue, keeping debt well below its prudent threshold of 45% of GDP.
Finally, on the political front, José Antonio Kast (right-wing) was elected the new President of Chile. The election results coincided with rising consumer and business confidence, declining political uncertainty, upward revisions to GDP growth estimates to 2.4%, and a historic rise in the IPSA index. However, the elections produced a fragmented Congress with no coalition securing an absolute majority in either chamber, increasing the likelihood that the next administration will likely need to negotiate across multiple blocs to advance legislation, which could complicate or delay the legislative process.
Panama
In 2025, GDP grew 4.4% year-over-year, rebounding from a weak performance in 2024, when growth slowed to 2.7%—its lowest rate since the 2009 global financial crisis, excluding the pandemic period. The recovery was primarily driven by private consumption and services activity, despite periods of social unrest between April and July 2025 and continued uncertainty related to fiscal and social security reforms.
In 2024, economic activity was adversely affected by the closure of the Cobre Panamá mine, the loss of investment grade status by Fitch Ratings, and heightened uncertainty surrounding the May 2024 presidential elections. In 2023, GDP grew by 7.2%, supported by significant infrastructure and investment projects, including Panama’s third metro line and a fourth bridge over the Panama Canal.
In 2023, the “El Niño” phenomenon caused the most severe drought in approximately 70 years, disrupting operations at the Panama Canal. As a result, the number of vessels transiting the Canal declined by 7.4% compared to the previous year, although toll revenues increased by approximately 10%, representing around 4% of GDP. The logistics sector accounts for approximately 11.6% of Panama’s GDP, and the country is recognized as a regional logistics and financial hub. According to McKinsey, an estimated 2.5% of global seaborne trade transits through the Panama Canal. Prolonged or renewed restrictions on Canal transit volumes could force vessels to divert to alternative routes, resulting in longer transit times and higher transportation costs.
The post‑pandemic recovery in 2021 and 2022 was particularly strong, with Panama ranking among the highest global growth performers following the unprecedented 17.8% contraction in GDP in 2020. GDP expanded by 16.5% in 2021 and 11.0% in 2022, supported by the global economic recovery, large‑scale infrastructure projects, and copper production from the Cobre Panamá mine.
One important development in 2025 was the approval of the social security reform intended to strengthen the long-term sustainability of the pension system and mitigate pressures on public finances. In March 2025, Panama enacted Law No. 462, which introduced significant reforms to the Social Security Fund (Caja de Seguro Social, or “CSS”) and its Disability, Old Age and Death program (“IVM”).
Panama has experienced several episodes of social unrest in recent years. In mid‑2022, protests erupted in response to rising living costs—particularly higher fuel prices—as well as concerns over inequality and perceived corruption. In October 2023, Congress fast‑tracked the approval of a renegotiated concession contract between the government and Minera Panamá, a local subsidiary of First Quantum Minerals, triggering widespread protests and road blockages—the most severe in at least three decades—which disrupted economic activity and led to shortages of basic goods. Protesters argued that the contract was unconstitutional, abusive, and environmentally harmful. More recently, the 2025 social security reform also triggered protests, reflecting long‑standing concerns over the sustainability and governance of the social security system, fears of potential future pension benefit erosion, and public distrust stemming from prior pension reforms.
In November 2023, former President Laurentino Cortizo enacted an indefinite moratorium on new mining concessions and prohibited the renewal of existing ones in an effort to reduce social unrest. Despite this measure, protests continued, and days later Panama’s Supreme Court ruled the concession contract unconstitutional, a decision that was broadly welcomed by the population. As a result, the government ordered the definitive closure of First Quantum Minerals’ copper mine. According to the Minister of Industry and Commerce, the orderly closure of a mine of this scale could take between seven to eight years. First Quantum subsequently initiated two arbitration proceedings against Panama, seeking at least US$20 billion (approximately 23% of 2024 GDP), one before the International Chamber of Commerce and another under the Canada–Panama Free Trade Agreement. However, in March 2025, First Quantum announced that it had agreed with the government to discontinue both arbitration proceedings. In June 2025, the company resumed the export of stockpiled copper concentrate following government approval granted in May 2025, which authorized the export of up to 120,000 tonnes of stranded material.
Proceeds from these sales are intended to support the ongoing maintenance of the idled facility. The likelihood of a reopening of the mine remains uncertain.
The significance of the mine to the country was undeniable. Cobre Panamá was the largest private investment project in the nation’s history, amounting to 10% of GDP in 2024. It began operations in 2019 and reached maximum capacity in 2021. With a production of 350,000 tons of copper in 2022, it ranked among the top 15 copper-producing mines globally. Additionally, according to the National Institute of Statistics and Census (INEC), it generated around US$2.8 billion (3.1% of 2025 GDP) through copper exports and was an important source of fiscal revenue.
In an already challenging fiscal environment, the closure of the Cobre Panama mine and the moratorium on new mining concessions triggered movements from the three main credit rating agencies in 2024. No further changes were made in 2025. In March 2024, Fitch downgraded Panama’s credit rating by one notch to BB+ with a stable outlook, stripping the country of its investment grade status achieved in 2010. The agency stated that the move reflected fiscal and governance challenges aggravated by the events surrounding the closure of Minera Cobre Panama in 2023. Later, in December 2024, the agency affirmed its BB+ rating with a stable outlook. Panama’s public debt, as a percentage of GDP, peaked at year-end 2020 at 64.8% of GDP, declined to 60.1% at year-end 2021, 58.0% of GDP at year-end 2022, and 56.4% of GDP at year-end 2023, before increasing to 62.3% of GDP at the end of 2024 and to 65.5% at year-end 2025.
In October 2024, Moody’s reaffirmed its rating at Baa3 but changed the outlook to negative. The agency stated that this decision reflected a greater-than-expected deterioration of the fiscal balance in 2024 and significant obstacles to achieving rapid fiscal consolidation, suggesting risks that sovereign debt indicators and debt affordability will weaken. In November 2024, S&P downgraded Panama's rating to BBB- and changed the outlook to stable due to the weakening of Panama's fiscal flexibility and performance, attributed to a higher interest burden that increased its vulnerability to adverse economic conditions. As such, Moody’s and S&P places Panama’s credit rating at the lowest possible rating for a security to be considered investment grade.
On the political front, Jose Raul Mulino, from the Realizando Metas party of former president Ricardo Martinelli, won the May 2024 presidential elections with 34% of the votes. He defeated Ricardo Lombana who finished second with 25% of the votes. His presidential mandate runs until 2029. According to S&P, Mulino's administration, which took office on July 1, inherited several pressing challenges, including a rising social security deficit, weak public finances, and the fallout the closure of the copper mine in 2023. Addressing these challenges will require negotiations with other political parties, as the president's party lacks a simple majority.
In 2025, the stance of President Trump towards the Panama Canal has proven to be another challenge faced by Mulino’s government. President Trump threatened to take control of the Panama Canal, citing concerns over China's growing influence in the region. In response, Panama agreed to end its Belt and Road agreement with China and increase cooperation with the U.S. to reduce Chinese influence. The agreement with China included projects such as the expansion of ports, construction of railways, and other significant infrastructure developments. The Panamanian government also initiated an audit process for Panama Ports Company, a subsidiary of the Chinese company Hutchison Ports, which manages two ports of the Canal. In January 2026, Panama’s Supreme Court ruled that the concession held by CK Hutchison to operate the ports of Balboa and Cristóbal was unconstitutional, prompting a strong reaction from the Chinese government, which criticized the decision and warned that Panama could face political and economic consequences. President José Raúl Mulino publicly rejected those warnings, underscoring the geopolitical sensitivity of the dispute.
Panama was removed from the (Financial Action Task Force) grey list, in October 2023, a development viewed by the International Monetary Fund as key to preserving Panama’s position as a regional financial center. Additionally, in July 2025, it was removed from the European Union list of non-cooperative jurisdictions for tax purposes.
Finally, downside pressures on economic activity and risks to trade through the Panamá Canal could negatively impact on lending activity and credit quality of loan portfolios at BCP Panamá.
Economic and market conditions in other countries may affect the Peruvian economy and the market price of Peruvian securities.
Peru is a small, open economy highly integrated with the rest of the world and affected by movements in the external environment (including the growth of main trade partners, changes in commodity prices and movements in external rates and global financial markets). As such, any major deterioration of the international economy can have materially adverse effects on the Peruvian economy and markets, as well as in our businesses and operational results.
U.S. President Trump's presidency has materially impacted various aspects of global politics, economics, and international relations. President Trump, a Republican, began his second nonconsecutive term on January 20, 2025. His party achieved a majority in both the Senate and the House of Representatives, which gave Republicans the opportunity to control the legislative agenda and made it easier for President Trump to pass laws and implement his policies. Since January 2025, the Trump administration has implemented significant policy changes in the United States, particularly in trade, immigration, fiscal policy and monetary policy, which has increased uncertainty in global economic and financial conditions. The expansion of tariffs as a core trade‑policy instrument—including a universal baseline tariff and reciprocal measures—has raised the U.S. effective tariff rate and contributed to slower‑than‑expected disinflation through retail price pass‑through, while also increasing the risk of supply‑chain disruptions, weaker investment and renewed market volatility should trade tensions escalate. With respect to Peru, Chile, and Colombia, these countries were subject to a 10% reciprocal tariff; however, such tariffs were invalidated following the U.S. Supreme Court’s February 20, 2026 ruling that the International Emergency Economic Powers Act (IEEPA) does not authorize the imposition of tariffs. In response, the Trump administration announced the imposition of a global tariff under Section 122 of the Trade Act of 1974, initially set at 10% and subsequently increased to 15%—the statutory maximum—for a period of up to 150 days, subject to congressional approval for any extension beyond that timeframe. In parallel, more restrictive immigration policies have reduced growth in the U.S. labor force, increasing the risk that a future acceleration in labor demand could place upward pressure on wages and inflation. Expansionary fiscal measures, including tax cuts, may support near‑term growth but could exacerbate fiscal imbalances and place upward pressure on long term interest rates, tightening financial conditions.
Uncertainty has also increased regarding U.S. monetary policy, amid public criticism of the Federal Reserve by President Trump and concerns about potential erosion of central‑bank independence. Any re‑acceleration of inflation could prompt the Federal Reserve to maintain a restrictive stance for longer, leading markets to reassess expectations for currently pricing in rate cuts. A shift toward fewer cuts or renewed tightening could strengthen the U.S. Dollar, increase global risk premia, and tighten financial conditions, with adverse spillovers to emerging markets, including Peru. The risk of renewed inflationary pressures from the aforementioned policies could prompt central banks, particularly the Federal Reserve of the United States, to halt the rate-cutting cycle, keeping the policy rate at levels slightly above neutral (3.75% upper bound as of January 2026). A change in market‑implied interest rate expectations, from one rate cut currently priced to a scenario involving no cuts or possible rate increases, could exacerbate fiscal, financial, and external risks, while also strengthening the US Dollar.
The weakening of global economic growth could affect Peru’s economic growth mainly through lower commodity prices and lower external demand. The country’s exports are highly concentrated in the mining industry, where copper and gold exports’ share of total exports was above to 50% in 2025. In addition, an important source of fiscal revenue comes from mining (10.6% in 2025). Therefore, Peruvian trade responds significantly to fluctuations in metal prices, especially copper and gold. In 2025, Peru’s trade surplus increased to a record of US$34.6 billion, due to a 21.8% growth in exports, an increase of 12.3% in imports and terms of trade at historical highs. The average copper price for 2025 was US$4.51 per pound, 9% higher than the average of US$4.15 per pound in 2024, while oil prices fell 15% over the same period (to US$64.7 per barrel). In addition to changes in prices, Peru is also vulnerable to fluctuations in foreign demand, particularly from its main trading partners, China and the United States, which account for 35% and 12% of its total exports, respectively. The European Union is also an important buyer of Peruvian goods, especially non-traditional ones (13% of total exports and 24% of total non-traditional exports). As such, lower than expected growth from these countries would pose risks to Peru’s exports, foreign direct investments, and overall economic growth.
If inflation were to reaccelerate, the Federal Reserve could be compelled to maintain a restrictive monetary policy stance for a longer period. This could reinforce U.S. Dollar appreciation pressures, which, in turn, could lead to depreciation pressures on the Peruvian currency. If such depreciation pressures were large or persistent, they could complicate the Central Reserve Bank of Peru’s efforts to keep inflation within its target range of 1% to 3%. A weaker currency would raise the cost of imported goods and could contribute to higher domestic inflationary pressures.
President Trump’s concerns regarding China’s involvement in Latin America underscore broader geopolitical risks that may also be relevant for Peru. The Trump administration’s confrontational stance toward China, combined with Peru’s deep economic ties with China, could give rise to downside risks depending on future U.S. policy responses. For example, the Chancay Port—expected to transform Peru into a major logistics hub on the Pacific coast of South America—is operated by Cosco Shipping Ports Chancay Perú S.A., a joint venture between the Chinese state‑owned company COSCO Shipping Ports (60%) and the Peruvian company Volcan (40%). In addition, Chinese companies control a substantial share of electricity distribution in Lima. According to the Peruvian government, foreign direct investment from China in the mining sector totaled approximately US$15 billion between 2010 and 2024 following the entry into force of the bilateral free trade agreement. Additionally, copper production by Chinese‑owned companies accounted for approximately 25% of Peru’s total copper output in 2025.
In January 2026, the United States designated Peru as a Major Non‑NATO Ally, reinforcing bilateral cooperation in defense, security, and technology, while not conferring NATO membership or establishing automatic defense obligations.
Any escalation in U.S.–China tensions or adverse policy measures affecting Chinese investments in the region could negatively affect economic activity, investor confidence and the operating environment in Peru and the countries where we operate, which could, in turn, adversely effect Credicorp’s business, financial condition and results of operations.
In general, lower economic growth, rising inflation, and depreciation pressures can impact Credicorp's business. These factors may lead to reduced credit demand, an increase in non-performing loans, and slower growth in savings.
For further detail please refer to “ITEM 5. OPERATING AND FINANCIAL REVIEW AND PROSPECTS – 5.A Operating Results – (2) Political and Macroeconomic Environment.”
Likewise, a reduction of growth in Latin America can also impact the Peruvian economy and our business, especially regarding Chile, Colombia, Bolivia and Panama, where we have operations, as well as Brazil and Mexico, which have a broad impact throughout the region because of their size.
Furthermore, financial conditions in global markets impact the Peruvian economy, affecting interest rates for local corporate bonds and influencing the exchange rate. Monetary policy tightening in developed economies, particularly by the Federal Reserve in the United States, could adversely affect economic activity in Peru because it strengthens the US Dollar and increases interest rates, thereby reducing access to funding for some local businesses. Also, because the Peruvian economy has a portion of loans denominated in US Dollars (21.9% of loans to the private sector and 31.4% of deposits as of December 2025), which is referred to as financial dollarization, balance sheet position effects should be considered because a higher exchange rate could increase debt burdens for individuals and businesses that have taken loans in Dollars but earn their income in local currency.
Geopolitical tensions and conflict, including the conflicts between Russia and Ukraine and the ongoing conflict in the Middle East, could have economic effects that could negatively impact the Peruvian economy.
We are exposed to geopolitical risks, including economic sanctions, acts or threats of international or domestic terrorism, actions taken by governments in response, state-sponsored cyberattacks or campaigns, and civil unrest and/or military conflicts, which could adversely affect business and economic conditions abroad and in the markets in which we operate.
Tensions between the United States and Iran have increased materially, particularly in connection with Iran’s nuclear program, U.S. sanctions enforcement, and periodic military incidents in the Middle East, and, in late February 2026, escalated into open hostilities involving the United States, Israel and Iran, which has significantly raised geopolitical risk, global financial‑market volatility, and the risk of severe energy supply disruptions. Recent U.S.‑Israeli strikes against Iran and Iran’s subsequent retaliation targeting U.S. military assets and regional energy infrastructure have intensified concerns of a prolonged regional conflict, amid indications of renewed diplomatic strains during late 2025 and early 2026, and leadership dynamics in Tehran perceived as favoring a hardline continuation of hostilities.In early April 2026, the U.S. administration announced a temporary pause in active military operations to allow for diplomatic engagement, easing immediate escalation risks. However, U.S. authorities have emphasized that the pause remains conditional and reversible, with military options still on the table should negotiations fail or hostilities resume. Energy markets have reacted sharply, with oil and gas prices experiencing extreme volatility (year‑to‑date as of April 16, the price of WTI crude oil has increased by 64.9% and European natural gas prices have risen by 88.9%), reflecting production outages, infrastructure damage, temporary shutdowns of Liquefied Natural Gas (LNG) facilities, storage constraints, and heightened fears of interference with maritime traffic or a sustained closure of the Strait of Hormuz—through which approximately 20% of global oil supplies transit. Given Iran’s role as an oil producer and the strategic importance of regional shipping routes, any further escalation of hostilities, disruption to Iranian output, or interference with maritime traffic could materially reduce supply and/or raise risk premiums, resulting in higher global energy prices.
These developments have also contributed to significant volatility across commodities, foreign exchange, interest rates, and equity markets, with the U.S. Dollar appreciating, global equity markets reacting unevenly, and bond yields rising. Market sensitivity to energy‑driven inflation shocks remains elevated following the surge in global inflation associated with the Russia‑Ukraine war, increasing the risk that a renewed and persistent increase in energy prices could again feed through to broader price pressures. Elevated energy prices and sustained uncertainty could therefore exacerbate inflation, weigh on global growth—particularly in energy‑importing economies—and constrain monetary policy flexibility, including delaying or limiting anticipated interest rate cuts in the United States. Any further escalation, extended supply disruptions, sanctions‑related
constraints, policy actions affecting energy markets, or deterioration in broader regional stability could materially and adversely impact global economic conditions and financial markets, with adverse effects on the countries in which we operate and on our business, financial condition and results of operations.
Furthermore, the conflict between Russia and Ukraine remains unresolved, with Russia’s invasion now in its fourth year, and the conflict continues to pose significant global risks in 2026. In 2025, sanctions and trade measures against Russia expanded further, with the United States announcing additional restrictions on Russia’s major energy companies and related entities, adding to earlier and broader sanctions that contributed to higher energy prices. In parallel, the European Union has maintained price caps on Russian petroleum products since late 2022 and has adopted additional measures to restrict the re‑exportation of certain goods to Russia. More recently, in February 2026, the United States reached a trade agreement with India that included commitments to reduce Indian purchases of Russian oil. These actions add to an already extensive and unprecedented sanctions regime. Any escalation of the conflict could intensify existing economic disruptions, particularly in energy markets, with adverse effects on global growth, inflation and financial stability.
A scenario where geopolitical conflicts escalate and energy and commodity prices increase significantly would cause a negative shock on real disposable income and could make both basic and agricultural products more expensive, along with higher transportation costs due to higher oil prices. Emerging economies with high levels of poverty remain particularly vulnerable to this shock which could fuel new waves of social unrest. Additionally, it could renew inflationary pressures globally and cause central banks to keep policy rates around neutral for a prolonged period or even move towards a restrictive policy stance.
The Israel–Hamas armed conflict that erupted in October 2023 escalated into a severe humanitarian crisis in the Gaza Strip and triggered widespread global calls for a ceasefire. In January 2025, Israel and Hamas reached a U.S.‑, Egyptian‑ and Qatari‑mediated, multi‑phase ceasefire agreement, which came into effect on January 19, 2025, and provided for a cessation of hostilities, the release of hostages and prisoners, and expanded humanitarian access. A broader U.S.‑brokered ceasefire was subsequently reached in October 2025, including further troop withdrawals and the initiation of discussions on Gaza’s reconstruction, which is expected to take several years. However, both Israel and Hamas have accused each other of near‑daily violations since the ceasefire took effect, raising uncertainty about its durability. Any renewed escalation of the conflict could further exacerbate an already fragile regional security environment, particularly amid the ongoing U.S.‑Israel–Iran confrontation, which has disrupted energy transit routes and production across major oil‑ and gas‑exporting countries in the Middle East. A deterioration in conditions could compound risks to global energy supply, push energy prices higher, reignite inflationary pressures, and increase financial market volatility.
Another geopolitical risk that has gained prominence following President Trump’s return to office is the deterioration in relations between the United States and China. In early 2025, the Trump administration imposed new tariffs on a broad range of Chinese imports, prompting retaliatory measures by the Chinese government and reigniting trade tensions between the two countries. Among major U.S. trading partners, China has been subject to the highest tariff burden. These developments represent a renewed escalation following the trade dispute during President Trump’s first term in 2018–2019, which involved repeated rounds of tariffs, allegations of currency manipulation and trade‑related actions at the World Trade Organization, and which weighed on global demand, commodity prices and financial market sentiment. The renewed U.S.–China trade conflict has increased uncertainty around global trade flows, supply chains and investment decisions and could adversely affect global economic growth and commodity markets, with potential spillover effects on emerging economies, including Peru. Although global growth exceeded expectations in 2025 and metal prices increased, this dynamic remains a significant risk to the global economy.
The rerouting of Chinese exports has emerged as a relevant global trade issue in 2025, following higher tariffs imposed by the United States. In this context, Chinese products have increasingly entered other economies at lower prices, intensifying competition with local producers and exerting downward pressure on prices and margins in affected industries. Reflecting this trend, the number of antidumping measures applied to China and notified to the World Trade Organization increased significantly, rising from seven measures in the second quarter of 2024 to 31 measures in the same quarter of 2025. In Peru, the increased presence of lower‑priced Chinese imports has adversely affected specific domestic sectors, including detergent manufacturing, footwear and ceramic tiles production. Continued trade diversion, additional antidumping actions or sustained price‑based competition from imports could negatively impact other exposed sectors, which could adversely affect economic conditions and certain segments of our client base and, in turn, our business, financial condition and results of operations.
In 2023, political tensions escalated after the United States shot down a suspected Chinese surveillance balloon, and U.S. Representative Nancy Pelosi, the former Speaker of the House, visited Taiwan, which China claims as part of its territory. In 2024, China intensified patrols around a group of islands controlled by Taiwan. More recently, on February 4, 2026, the South
China Morning Post reported that, during a telephone conversation between the two leaders, Chinese President Xi Jinping told U.S. President Donald Trump that the Taiwan issue represents the most important and sensitive matter in U.S.–China relations. President Xi reportedly urged President Trump to exercise extreme caution with respect to U.S. arms sales to Taiwan.
Taiwan plays a critical role in the global electronics market, as the Taiwan Semiconductor Manufacturing Company (TSMC) is one of the world’s leading producers of semiconductors. An escalation of tensions between China and Taiwan could disrupt semiconductor supply chains and renew price pressures in the semiconductor market, with adverse effects on inflation similar to those observed in 2022. In January 2026, the United States and Taiwan announced a trade and investment agreement under which the U.S. reciprocal tariff rate on Taiwanese goods would be capped at approximately 15%, down from 20%, in exchange for increased Taiwanese investment in semiconductor manufacturing capacity in the United States. However, broader trade and geopolitical risks affecting the sector remain.
If geopolitical risks lead to a stagflation (characterized by lower economic growth and rising inflation) Credicorp’s business could be impacted through reduced credit demand and increased customer credit risk leading to higher non-performing loans, and slower growth in savings.
Legal and Regulatory Risks
Regulatory changes and the adoption of new international guidelines to sectors in which we operate could adversely affect our earnings and our operating performance.
Because we are subject to regulation and supervision in Peru, Bolivia, Colombia, Chile, Cayman Islands, the United States of America, Panama, and Bermuda, changes to the regulatory framework in any of these countries or changes in tax laws could adversely affect our business.
Financial Services Activities
We are directly subject to extensive supervision and regulation through the Peruvian Banking and Insurance Law and the Peruvian Consolidated Supervision of Financial and Mixed Conglomerates Regulation.
The SBS and the BCRP supervise and regulate BCP Stand-alone and Mibanco’s operations. Peru’s constitution and the SBS’s statutory charter grant the SBS the authority to oversee and control banks and other financial institutions, including private pension funds and insurance companies. The SBS and the BCRP have general administrative responsibilities over BCP Stand-alone and Mibanco, including setting capital and reserve requirements. In past years, the BCRP has, on numerous occasions, changed the deposit reserve requirements applicable to Peruvian commercial banks, as well as the rate of interest paid on deposit reserves and the amount of deposit reserves on which no interest is payable by the BCRP. Such changes in the supervision and regulation of BCP Stand-alone and Mibanco may adversely affect our results of operations and financial condition. See “ITEM 4. INFORMATION ON THE COMPANY – 4.B Business Overview – (6) Supervision and Regulation – 6.2 Subsidiaries – 6.2.1 Peru” for additional information regarding the regulation of BCP Stand-alone and Mibanco by the SBS and the BCRP.
Furthermore, changes in regulations related to consumer protection may also affect our business. For example, in March 2021, a new interest rate ceiling law was approved under the Peruvian Usury Law. This law grants the BCRP the power to set maximum and minimum interest rates, on a semi-annual basis, to regulate the market for consumer loans, small consumer loans, small and medium enterprises (SMEs) loans and credit card loans. Additionally, the Peruvian Usury Law states that if a debtor is late in payment, only default interest will be charged. The collection of penalties or other commissions or expenses from debtors, as well as the capitalization of interest, is prohibited. The Peruvian Usury Law also establishes that (i) the commissions and expenses applicable to consumer loans, small consumer loans, small and medium enterprises loans and credit card loans must imply the provision of an additional and/or complementary service to the transaction entered into by the clients; (ii) the financial institution must justify the transfer of the cost to the client; and (iii) the value of the service must be supported by a technical, economic and legal report, which must be submitted to the SBS. Even though the impact of the Peruvian Usury Law may be limited for Credicorp’s total loan book, it may impair our ability to financially include unbanked customers with riskier profiles.
The Superintendence of the Securities Market of Peru (Superintendencia del Mercado de Valores or SMV by its Spanish initials) also supervises certain of our subsidiaries, such as BCP Consolidated, Credicorp Capital Sociedad Agente de Bolsa S.A. (Credicorp Capital SAB), Credicorp Capital S.A. Sociedad Administradora de Fondos (Credicorp Capital SAF), Credicorp Capital Peru S.A.A. (Credicorp Capital Peru) and Credicorp Capital Sociedad Titulizadora S.A. (Credicorp Capital Titulizadora). Additionally, some of our subsidiaries are under the supervision of the Peruvian Financial Intelligence Unit (Unidad de Inteligencia Financiera del Peru or UIF-Peru by its Spanish initials), and all of our subsidiaries that operate in Peru must comply with the provisions regulated by the Peruvian Consumer Protection Authority (Instituto Nacional de Defensa de la Competencia y de la Protección de la Propiedad Intelectual or INDECOPI by its Spanish initials) and the Peruvian Data Privacy Authority (Autoridad Nacional de Protección de Datos Personales or ANPDP by its Spanish initials).
On the other hand, the Peruvian government has approved the Artificial Intelligence Regulation, which is overseen by the Secretariat of Digital Government under the Presidency of the Council of Ministers. The Artificial Intelligence Regulation entered into effect on January 23, 2026, with certain provisions scheduled to become effective on September 10, 2026. The regulation is being implemented as of today, and Credicorp has adopted the risk‑management, compliance, and governance measures to support adherence to this evolving regulatory framework.
We are also regulated by other governmental entities in other jurisdictions. In Colombia, we are subject to supervision and regulation through the Unit of Financial Regulation (Unidad de Proyección Normativa y Estudios de Regulación Financiera or URF by its Spanish initials), the Financial Superintendence of Colombia (Superintendencia
Financiera de Colombia or SFC by its Spanish initials) and the Colombian Stock Market Self Regulator (Autorregulador del Mercado de Valores de Colombia or AMV by its Spanish initials). In Chile, we are subject to supervision and regulation through the Financial Markets Commission of Chile (Comisión para el Mercado Financiero or CMF by its Spanish initials). See “ITEM 4. INFORMATION ON THE COMPANY – 4.B Business Overview – (6) Supervision and Regulation – 6.2 Subsidiaries – 6.2.4. Colombia and 6.2.5 Chile”.
In Bolivia, we are subject to the supervision of the Bolivian Financial Authority (Autoridad de Supervisión del Sistema Financiero or ASFI by its Spanish initials) and of the Bolivian Pensions and Insurance Authority (Autoridad de Fiscalización y Control de Pensiones y Seguros or APS by its Spanish initials).
BCP Miami is regulated, supervised and examined by the Florida Office of Financial Regulation (OFR) and by the Board of Governors of the U.S. Federal Reserve System (FED). Our direct and indirect nonbanking subsidiaries doing business in the United States are also subject to the authority of relevant U.S. financial regulatory agencies depending on their U.S. activities.
Further, Credicorp Capital LLC., our U.S. broker-dealer, is regulated, supervised and examined by the U.S. Securities and Exchange Commission (SEC) and the Financial Industry Regulatory Authority, Inc. (FINRA). Additionally, Credicorp Capital Advisors LLC., our U.S. Registered Investment Adviser (RIA), is also regulated by the SEC.
In the Cayman Islands, we are subject to the regulation of the Cayman Islands Companies Law for ASHC. Effective August 2, 2021, Atlantic Security Bank (Cayman Islands) and ASB Bank Corp. (Panama) merged, with the latter being the surviving entity. ASB Bank Corp. is supervised by its principal regulators, the Superintendence of Banks of Panama (Superintendencia de Bancos de Panama or SBP by its Spanish initials) and, with respect to activities relating to its securities investment business, the Superintendency of the Securities Market of the Republic of Panama (Superintendencia del Mercado de Valores de la República de Panama or Panama SMV by its Spanish initials).
Changes in the supervision and regulation of our subsidiaries in other countries may adversely affect our results of operations and financial condition.
For details on income tax review by the tax authorities on the jurisdictions in which we operate, please refer to Note 17(a) and (e) of the consolidated financial statements. Also, for further information refer to “ITEM 4. INFORMATION ON THE COMPANY – 4.B Business Overview – (6) Supervision and Regulation – 6.2 Subsidiaries”.
Insurance
Our Property and Casualty (P&C) and life insurance businesses are carried out by Pacífico Seguros, which is part of Grupo Pacífico. The insurance business is subject to regulation by the SBS. New legislation or regulations may adversely affect Grupo Pacífico’s ability to underwrite and price risks accurately, which in turn would affect Insurance Underwriting Results and business profitability. Grupo Pacífico is unable to predict whether and to what extent new laws and regulations that may affect its business will be adopted in the future.
While Grupo Pacífico is unable to predict with any certainty the timing of the passage or adoption of any new laws or regulations, or the effects those laws or regulations may have on its operations, profitability and financial condition in future years, we expect Peru to adopt new legislation in the coming years that will change the regulation of insurance companies. The legislation may be similar to the measure enacted by the European Union through Solvency II, a regulatory capital framework that seeks to further reduce the insolvency risk faced by insurance companies in the European Union by improving capital regulations for insurance companies in the region.
The Peruvian regulator has been working on the implementation of the risk-based capital model, which seeks to guarantee that insurance companies maintain the necessary capital to face the risks inherent to their activity in the face of possible stress scenarios (similar to Solvency II). It is expected that this model will come into force before the year 2028. In the first quantitative exercise that was carried out, the results for the company showed that Pacífico Seguros had capital in excess of what would be required.
Medical Services
The Group’s medical facilities are subject to extensive healthcare regulations and licensing requirements in Peru, including authorizations to operate as healthcare providers and ongoing supervision by relevant health authorities. Failure
to obtain, maintain or renew required licenses or to comply with applicable healthcare regulations could result in fines, sanctions, suspension of operations or revocation of operating authorizations. Changes in healthcare laws, regulations or enforcement practices may increase compliance costs or materially affect the Group’s medical services operations.
Pension fund
In recent years, the Peruvian government has implemented various reforms to the pension system, significantly impacting the funds under management and, consequently, our business operations and results.
In January 2023, the government approved and published Law No. 31670, introducing a new retirement option based on a minimum pension and creating incentives to increase voluntary contributions. In June 2023, the SBS modified the methodology to calculate the legal reserve requirement. The new methodology assigns a fixed percentage (based on the level of risk of each fund) of the assets under management of each fund as the legal reserve requirement.
In April 2024, Congress approved the seventh AFP withdrawal, allowing affiliates to withdraw up to 4 Tax Units (UIT), equivalent to S/20,600. The payments were made in four installments of up to 1 UIT each. According to figures from the SBS, approximately S/28 billion was withdrawn. For Prima, the total amount withdrawn reached S/7.8 billion.
In September 2024, the government published a Law for the Modernization of the Peruvian Pension System, which provides for the creation of a Comprehensive Peruvian Pension System (SIPP) to ensure pension protection for all citizens. The Ministry of Economy and Finance (MEF) had until June 18, 2025, to issue the regulations. This regulation was approved in September 2025 through Supreme Decree No. 189-2025-EF, which initiates the operational implementation of the new pension system.
This regulatory framework developed key provisions by promoting increased competition in the sector and enabling the participation of banks, insurance companies, and other financial system entities under transparency requirements and equal operating conditions. While these measures represent initial steps toward a more robust and modern pension system, additional regulations remain pending with respect to material aspects such as the minimum and proportional pension schemes and the consumption-based pension, which are necessary for the full implementation of the new framework and broader pension coverage.
In September 2025, Congress also approved the eighth AFP withdrawal, allowing affiliates to withdraw up to four Tax Units (UIT), equivalent to S/21,400. The withdrawals were made in four installments of up to one UIT each. The SBS has not yet published final figures; however, the total amount withdrawn has been estimated at approximately S/26 billion. As of the end of December 2025, payments totaling S/3.5 billion had been made to affiliates in response to their withdrawal requests.
See “ITEM 4. INFORMATION ON THE COMPANY – 4.B Business Overview – (6) Supervision and Regulation – 6.2 Subsidiaries – 6.2.1 Peru”.
Taxation
Changes in U.S. laws or regulations applicable to our business, such as the U.S. Foreign Account Tax Compliance Act (FATCA), the National Defense Authorization Act (NDAA) and the Anti-Money Laundering Act of 2020 (AMLA 2020) regulations, as well as other international regulations such as the Organization for Economic Co-operation and Development’s (OECD’s) Common Reporting Standards (CRS) and the OECD/G20 Inclusive Framework’s Global Anti-Base Erosion (GloBE) rules, may have an adverse effect on our financial and operational performance by significantly increasing our compliance obligations.
For a discussion of Peruvian, Chilean, and Colombian tax regulation, see “ITEM 10. ADDITIONAL INFORMATION – 10.E Taxation”.
Credicorp, as a Bermuda exempted company, may be adversely affected by any change in Bermuda law or regulation.
The Economic Substance Act 2018 (as amended) of Bermuda (the ES Act) came into force on January 1, 2019. Pursuant to the ES Act, a registered entity, other than an entity which is resident for tax purposes in certain jurisdictions outside Bermuda (that is, a non-resident entity), that carries on as a business any one or more of the “relevant activities” referred to in the ES Act is considered to be in the scope of ES Act and must comply with the economic substance requirements to ensure that the entity is engaged in real economic activity in Bermuda. The ES Act may require in-scope Bermuda-registered entities that are engaged in such “relevant activities” to be directed and managed in Bermuda, have an adequate level of qualified employees in Bermuda, incur an adequate level of annual expenditures in Bermuda in relation to the relevant activity, maintain physical offices and premises in Bermuda and perform core income-generating activities in Bermuda in relation to the relevant activity. “Relevant activities” under the ES Act include the following: banking, insurance, fund management, financing and leasing, headquarters, shipping, distribution and service center, intellectual property and holding entities. Based on the current guidance issued pursuant to the ES Act, which was revised at the beginning of 2023, the Bermuda Registrar of Companies will consider an entity that carries on relevant activities to be engaged in those activities and within the scope of the ES Act, regardless of whether the entity earns any gross revenue from such activities during the relevant financial period.
Both Credicorp Ltd. and Credicorp Capital Ltd. are Bermuda exempted companies, so the ES Act applies to them. Both companies are also considered “pure equity holding”, entities under the ES Act. All entities subject to the ES Act that undertake “relevant activities”, including all “pure equity holding” entities, must file annually with the Registrar of Companies an Economic Substance Declaration (the ESD), providing information in relation to the previous financial year (relevant financial period). The ESD requires the disclosure of certain key information applicable to assessing compliance with the economic substance requirements. Pure equity holding entities are currently subject to minimum economic substance requirements, including the requirement to comply with the applicable corporate governance requirements of the Companies Act 1981, the filing of an ESD, and maintaining adequate personnel and premises in Bermuda for holding and managing equity participations. An entity conducting the relevant activity of having a headquarters in Bermuda which generates gross revenue is required to satisfy the requirements under the ES Act in respect of that activity for that relevant financial period. However, an entity that earns no gross revenue in respect of such activity in any relevant financial period will not be required to satisfy the requirements under the ES Act with respect to activity for that relevant financial period but will still need to file an ESD.
The Registrar of Companies is responsible for monitoring and enforcing the economic substance regime. The ES Act provides for civil penalties, subject to rights of appeal, of up to US$250,000 for non-compliance with the applicable economic substance requirements. If, after the applicable civil penalties have been exhausted, an entity continues to fail to comply, the Registrar of Companies may apply for a petition to the Supreme Court of Bermuda for an order for such terms as it considers appropriate. This may include an order to strike the entity off the Register of Companies. The ES Act also criminalized knowingly providing false declaration information to the Registrar of Companies, which is punishable by penalties of up to US$10,000, imprisonment for two years, or both.
Other offshore jurisdictions released similar legislation that affects some of our offshore entities (including ASHC in the Cayman Islands). This other legislation imposes similar requirements and penalties.
We could also be subject to changes in tax rates, the enactment of legislation implementing changes in taxation of international business activities, the adoption of other corporate tax reform policies, or other changes in tax legislation or policies which could adversely affect our business, financial condition, and results of operations.
In October 2021, the Organization for Economic Cooperation and Development’s (the OECD) Inclusive Framework reached an agreement on a “Two-Pillar Solution to Address the Tax Challenges Arising from the Digitalisation of the Economy” and, on 20 December 2021, the OECD’s Inclusive Framework published “Global Anti-Base Erosion,” or “GloBE” model rules (the GloBE Rules), which are a key component of the Two-Pillar Solution.
The GloBE model rules would apply to Multinational Enterprises (“MNEs”) with revenues of at least EUR750 million and provide for a coordinated system of taxation that imposes a “top-up” tax to ensure that an MNE pays a minimum rate of 15% tax on its net income in each country where it operates. Countries around the world have enacted, and are continuing to enact, legislation to implement the GloBE model rules. As the Two-Pillar Solution is subject to implementation by each member country, the timing and ultimate impact of any such changes on our tax obligations is uncertain. Such legislative initiatives may materially and adversely affect our plans to expand internationally and may negatively impact our tax liability, financial condition, and results of operations, and could increase our administrative expenses.
These changes, as they take effect in various countries in which we do business, may also increase our taxes in these countries. For example, Bermuda enacted the Corporate Income Tax Act 2023 on 27 December 2023 (the “CIT Act”). Entities subject to tax under the CIT Act are the Bermuda constituent entities of MNEs. The definition of a MNE under the CIT Act follows the definition in the GloBE model roles i.e., a group with entities in more than one jurisdiction with consolidated revenues of at least EUR750 million for two out of the four previous fiscal years.
If Bermuda constituent entities of a multi-national group are subject to tax under the CIT Act, such tax is charged at a rate of 15 per cent of the net taxable income of such constituent entities as determined in accordance with and subject to the adjustments set out in the CIT Act.
The CIT Act does not impose any withholding tax, capital transfer tax, estate duty or inheritance tax, so there have been no such taxes payable by us or by our shareholders in respect of our shares following the effective date of January 1, 2025.
The ES Act, CIT Act and future legislative initiatives may, among other things, negatively impact our tax liability, financial condition and results of operations. It could increase our administrative expenses, compliance and disclosure requirements, and increase the risks of administrative penalties for non-compliance with the applicable legislation.
It may be difficult to serve process on or enforce judgments against us or our principals residing outside of the United States or to assert claims against our officers or Directors.
A significant majority of our Directors and officers live outside the United States (principally in Peru). Most of our assets and those of our principal subsidiaries, as well as our principal subsidiaries’ respective legal domiciles, are located outside the United States. As a result, it may not be possible for investors to effect service of process within the United States upon us or our principal subsidiaries to initiate a civil suit under U.S. securities laws in U.S. courts. We have also been advised by our Peruvian counsel that judgments or decisions obtained under U.S. federal securities laws may not be recognized and enforceable in Peru unless certain requirements, which are required under Peruvian law for so-called exequatur proceedings, including those with respect to jurisdiction, due process and consistency with Peruvian law, are deemed to have been satisfied. Similarly, our Bermuda counsel have advised us that courts in Bermuda may not be able to enforce judgments obtained in other jurisdictions, or entertain actions in Bermuda, against us or our Directors or officers under the securities laws of those jurisdictions. In addition, judgments of U.S. courts obtained in actions under the United States federal securities laws may not be enforceable in other non-U.S. jurisdictions in which we or our principals operate or have assets.
In addition, our Bye-laws contain a broad waiver by our shareholders of any claim or right of action, both individually and on our behalf, against any of our officers or Directors. This waiver limits the rights of shareholders to assert claims against our officers and Directors for any action taken by an officer or Director. It also limits the rights of shareholders to assert claims against officers for the failure of an officer or Director to take any action in the performance of his or her duties, except with respect to any matter involving willful negligence, willful default, fraud or dishonesty on the part of the officer or Director. As a result, it may be more difficult for our minority shareholders to assert claims against us or our Directors and officers, as compared to the shareholders of a U.S. company.
Medical malpractice claims, professional negligence and adverse clinical outcomes that may arise from our medical services operations could lead to significant financial liabilities. These situations have the potential to not only result in substantial legal and settlement costs but also to cause reputational harm.
The operation of hospitals and outpatient medical facilities involves inherent risks associated with the provision of medical care, including the risk of medical malpractice claims, professional negligence and adverse clinical outcomes. Claims or legal actions arising from alleged medical errors or failures to meet applicable standards of care could result in
significant financial costs, including damages, legal expenses and reputational harm, which may adversely affect the Group’s results of operations. The Group maintains insurance coverage for professional and general liability risks; however, such coverage may not be sufficient to fully cover all potential claims or losses.
Industry and Market Risks
We operate in a competitive environment that may limit our potential to grow and may put pressure on our margins and reduce our profitability.
BCP Stand-alone and Mibanco have experienced increased competition, including increased pressure on margins. This is primarily a result of the following:
•Highly liquid foreign-owned commercial banks and microfinance institutions in the market;
•Local and foreign financial services, wealth management and capital markets institutions, with substantial capital, technology and marketing resources; and
•Local pension funds that lend to BCP Stand-alone’s corporate customers through securities issuances.
Larger Peruvian companies have gained access to new sources of capital through local and international capital markets, and BCP Stand-alone’s existing and new competitors, including non-banking institutions such as fintech companies, have increasingly made inroads into the higher margin, middle market and retail banking sectors. Such increased competition has affected BCP Stand-alone’s loan growth as well as reduced the average interest rates that BCP Stand-alone can charge its customers.
Competitors may also dedicate greater resources to, and be more successful in, the development of technologically advanced products and services that may compete directly with BCP Stand-alone’s and Mibanco’s products and services. Such competition could adversely affect the adoption of BCP Stand-alone’s and Mibanco’s products and/or lead to adverse changes in the spending and saving habits of BCP Stand-alone’s and Mibanco’s customer base. If competing entities are successful in developing products and services that are more effective or less costly than the products and services developed by BCP Stand-alone and Mibanco, BCP Stand-alone’s and Mibanco’s products and services may be unable to compete successfully. BCP Stand-alone and Mibanco may not be able to maintain their respective market shares if they are not able to match their competitors’ loan pricing or keep pace with their development of new products and services. Even if BCP Stand-alone’s and Mibanco’s products and services prove to be more effective than those developed by other entities, such other entities may be more successful in marketing their products and services than BCP Stand-alone and Mibanco because of their greater financial resources, higher sales and marketing capacity or other similar factors.
We also face increasing competition from non-banking and digital bank competitors in markets for some of our products and services. These non-banking competitors, including fintech and startup companies and other technology companies, have emerged in recent years with increasing digitalization, and these competitors may adversely affect our results of operations. Some of these competitors operate under different or reduced levels of regulation in comparison to the regular banking supervision that applies to BCP Stand-alone and Mibanco. Therefore, these non-banking competitors are not subject to the same specific solvency or liquidity requirements as banks.
Some international banks and microfinance institutions have also sought and obtained authorization to open representative offices in Peru. With the increased competition, more individuals will have access to credit, and the percentage of the population using banking services will likely climb. This may eventually put downward pressure on interest rates. Any negative impact on BCP Stand-alone and Mibanco resulting from increased competition could have a material adverse effect on our results of operations and financial condition. For further detail about the competitive market in our LoBs, see “ITEM 4. INFORMATION ON THE COMPANY – 4.B. Business Overview – (5) Competition”.
Our business and results of operations could be negatively impacted by a pandemic virus outbreak or other public health crises beyond our control.
In March 2020, the World Health Organization (WHO) declared the COVID-19 outbreak a pandemic. This destructive pandemic forced governments around the world to take important measures to mitigate the contagion, such as the closure of international borders, severe mobilization restrictions and lockdowns. As a result, global GDP (as adjusted
for purchasing power parity) contracted sharply in 2020 (the sharpest contraction since the Great Depression of 1929), and the economies in which Credicorp operates (mainly Peru, Bolivia, Colombia, Chile and Panama) were severely affected by two factors: (i) the effect on the global economy (such as the economic growth of our main trade partners like China and the United States, as well as lower commodity prices, mainly metals and oil), during the first half of 2020 (at the worst of the crisis, WTI oil and copper prices has fallen around approximately 80% and 25%, respectively); and (ii) the local effect of government measures to stop the COVID-19 outbreak, such as quarantines, forced economic shutdowns and populist initiatives. In 2020, GDP fell 10.9% in Peru, 6.1% in Chile, 7.2% in Colombia, 8.7% in Bolivia and 17.7% in Panama.
Major disruptions in exchange rates and global capital flows were triggered by the pandemic. The value of emerging markets currencies against the US Dollar, including those from Latin America, dropped substantially. The Brazilian Real (BRL), Mexican Peso (MXN), Colombian Peso (COP) and Chilean Peso (CLP) all reached significantly low levels against the US Dollar at the beginning of the pandemic.
To mitigate the negative effects of the pandemic on health and economic outcomes, governments around the globe took drastic fiscal measures that consisted of additional spending or forgone revenue, including direct transfers and tax relief measures, and provided liquidity support, through loans and government guarantees (like the “Reactiva Program” in Peru). Central banks delivered massive monetary stimuli by reducing policy rates to the zero lower bound in most developed and emerging economies and announcing quantitative easing programs to purchase sovereign and corporate bonds. Furthermore, in Chile and Peru, early withdrawals from pension funds were approved as a source of relief for households.
These measures, however, came with a cost. Lower economic growth and higher spending weakened debt metrics significantly and caused credit rating agencies (CRAs) to issue many sovereign downgrades. According to a 2021 report from the Bennett Institute for Public Policy in England, between January 2020 and March 2021, three CRAs issued a total of 99 sovereign rating downgrades on 48 countries, affecting 35% of their rated sovereign portfolio. In the Latin American region, for instance, coupled with political instability, between 2020 and 2022, Chile’s sovereign credit rating was downgraded by one notch by Fitch and S&P to A- and A, respectively; Colombia lost its investment grade rating from Fitch and S&P; Peru and Panama suffered downgrades from the three agencies and are now two and one notch above investment grade (lowest possible rating for a security to be considered investment grade), respectively, when we consider the lowest rating of the three CRAs.
Sovereign credit rating revisions often impact local companies, particularly on their funding cost through long-term debt issuances in foreign currency. Consequently, credit rating downgrades could adversely affect the results of Credicorp and its subsidiaries.
Additionally, large fiscal stimulus programs and expansive monetary policies worldwide were also behind the worst inflation shock in four decades experienced post COVID-19.
Future pandemic outbreaks (whether like COVID-19 or of a more deadly pathogen), would bring risks to the global economy and to Peru’s economy and our operations. A new pandemic could again deteriorate fiscal metrics and reduce economic outcomes. Hence, it would put new downward pressure on credit ratings. Actions taken by governmental authorities and other third parties in response to this risk may negatively impact our business, results of operations and financial condition. In general, some of the main economic indicators that may be affected by a pandemic include exchange rates, interest rates, credit spreads, commodity prices, GDP and sovereign government debt. Other possible effects on our businesses and operations of another pandemic outbreak or other international public health crisis could include the following:
•The credit risk of Credicorp’s loan portfolio may be adversely affected. Resulting temporary closures, mobility restrictions, increases in unemployment rates and insufficient liquidity could negatively affect our business volume and the portfolio quality of our credit and investment portfolios.
•Our insurance business may be adversely affected due to the possible increase in the level of claims, mainly in the life and health segments.
•Possible government measures or pension reforms may lead to higher demand for early redemptions from clients, which could reduce management fees and adversely affect revenues in our pension fund business.
•Prolonged economic stress and market disruptions may generate pressure on our liquidity management and lead to increased volatility in financial markets, such as disruption in fixed and equity income global markets (resulting in the fall of stock prices, including the price of Credicorp). Moreover, the increase in liquidity risk may result in limited and/or costly access to financing sources, an inability to access capital
markets, an increase in draws of outstanding credit lines and a change in the expected level of cash inflow as consequences of large-scale changes to loan interest rates or other terms.
•In terms of non-financial risks, another contagion disease may affect our ability to continue operating. Additionally, the possibility of lockdowns may cause some of our suppliers to stop providing us with services for business continuity.
Our financial statements, particularly our interest-earning assets and interest-bearing liabilities, could be exposed to fluctuations in interest rates, foreign currency exchange rates and exchange controls, which may adversely affect our financial condition and results of operations.
The interest income we earn on our interest-earning assets and the interest expense we pay on our interest-bearing liabilities could be affected by changes in domestic and international market interest rates. These rates are sensitive to many factors beyond our control, including monetary policies and domestic and international economic and political conditions.
We have implemented several policies to manage our interest rate risk exposure and seek proactively to update our interest rate risk profile to minimize losses and optimize net revenues; however, sudden and/or significant volatility in market interest rates could have a material adverse effect on our financial condition and results of operations. For further information, see “ITEM 11. QUANTITATIVE AND QUALITATIVE DISCLOSURES ABOUT RISK MANAGEMENT – Sensitivity to Changes in Interest Rates.”
Since January 1, 2014, the functional currency of our financial statements has been the Sol; however, the Group’s subsidiaries generate revenues in Soles, U.S. Dollars, Bolivianos, Colombian Pesos and Chilean Pesos. As a consequence, the fluctuation of our functional currency against other currencies, or any exchange controls implemented in the countries in which we operate, could have an adverse impact on our financial condition and results of operations.
Article 64 of the Peruvian Constitution guarantees the freedom to use and hold foreign currency. Consequently, under current law, the Peruvian government cannot impose restrictions on companies' ability to transfer Soles, U.S. Dollars, or other currencies from Peru to other countries, nor can it restrict the conversion of Peruvian currency into other currencies. However, there is a risk that such restrictions could be implemented in the future if constitutional amendments or other legal changes were adopted.
We also face foreign exchange risk on credit that we extend through our banking business, which is primarily conducted through BCP Stand-alone. To address this risk, BCP Stand-alone identifies borrowers that may not meet their debt obligations due to currency mismatches by performing sensitivity analyses of the credit ratings of companies and the debt-service capacities of individuals. Then, we classify borrowers according to their level of foreign exchange credit risk exposure. We monitor these clients, and, on an ongoing basis, we revise our risk policies for underwriting loans and managing our portfolio of foreign currency-denominated loans. However, these policies may not sufficiently address our foreign exchange risk, resulting in adverse effects on our financial condition and results of operations.
We have taken steps to manage the gap between our foreign currency-denominated assets and liabilities in several ways, including closely matching their volumes and maturities. Nevertheless, a sudden and significant depreciation of the Sol could have a material adverse effect on our financial condition and results of operations. For further information, see “ITEM 11. QUANTITATIVE AND QUALITATIVE DISCLOSURES ABOUT RISK MANAGEMENT – Foreign Currency Exchange Rate Risk”.
Liquidity risks are inherent in our business activities.
Liquidity risk is the risk of being unable to meet funding obligations as they come due, to capitalize on growth opportunities as they arise or to pay dividends without incurring unacceptable losses, costs or risks. This risk is inherent in any retail and commercial banking business and can be heightened by a number of factors, such as over-reliance on a particular source of funding, changes in credit ratings or market-wide phenomena such as market dislocation. The Group's liquidity arises primarily from customer deposits, principal and interest payments on loans and investment securities, net cash flow from operating activities and other sources. We must maintain sufficient funds to respond to the needs of depositors and borrowers.
Our liquidity, business activities and profitability may be adversely affected by an inability to access the debt capital markets or to sell assets during periods of market-wide or firm-specific liquidity constraints.
Our ability to borrow on a secured or unsecured basis, and the cost of doing so, can be affected by increases in interest rates or credit spreads, a downturn in the geographic markets in which our loans are concentrated, the availability of credit, regulatory requirements relating to liquidity or the market perceptions of risk relating to us, certain of our counterparties or the banking sector or the financial services sector as a whole, including our perceived or actual creditworthiness, as well as other factors that may be outside our control. An inability to obtain financing in the unsecured long-term or short-term debt capital markets, or to access the secured lending markets, could have a substantial adverse effect on our liquidity. In challenging credit markets, our funding costs may increase, or we may be unable to raise funds to support or expand our businesses, adversely affecting our results of operations.
If we are unable to raise needed funds in the capital markets (including through offerings of equity, regulatory capital securities and other debt), we may need to liquidate unencumbered assets to meet our liabilities. In a time of reduced liquidity, we may be unable to sell some of our assets, or we may need to sell assets at depressed prices. Either case could adversely affect our results of operations and financial condition.
The Group relies significantly on its deposits for funding.
The Group benefits from short-term funding sources, including primarily demand deposits, securities lending and time deposits. The Group's ability to generate deposits depends on its reputation, customer service and competitive pricing. Our access to deposits may also be adversely affected by the liquidity needs of our depositors, which may increase in an inflationary environment where they may be compelled to withdraw deposits in order to cover rising expenses. As a part of our liquidity management, we must ensure we can respond effectively to potential volatility in our customers’ deposit balances.
Although we have been able to replace maturing or withdrawn deposits and advances historically as necessary, we might not be able to replace such funds in the future, especially if a large number of our depositors, or depositors with high deposit balances, seek to empty their accounts in a short period of time. We could encounter difficulty facing a significant deposit outflow, which could negatively affect our profitability or reputation. In circumstances in which our ability to generate needed liquidity is impaired, we may need access to non-core funding, such as borrowings from the BCRP, and other emergency sources. While we maintain access to these non-core funding sources, some sources are dependent on the availability of collateral and the counterparty’s willingness and ability to lend. Any long-term decline in deposit funding would adversely affect our liquidity, and we may not be able to manage the risk of deposit volatility effectively.
Our investments measured at fair value through profit or loss and fair value through other comprehensive income expose us to market price volatility, liquidity declines and fluctuations in foreign currency exchange rates, which may result in losses that could adversely affect our business, financial condition and operating results. In addition, our investments measured at amortized cost may expose us to market price volatility and liquidity shortcomings if sales of those investments become required for liquidity purposes.
Price, liquidity and foreign exchange risks are inherent in the Group’s securities. Our investments at fair value through profit or loss may lead to gains or losses when sold or marked to market. Our investments at fair value through other comprehensive income may require us to record unrealized gains or losses through other comprehensive income when those investments are marked to market and in realized gains or losses when sold. Both types of investments measured at fair value may fluctuate from period to period due to numerous factors that are beyond our control, such as foreign currency exchange rates, interest rate levels, counterparty credit risks, and general market volatility. Losses from trading activities and realized or unrealized losses could have an adverse effect on our business, financial condition and operating results.
Our investments measured at amortized cost may lead to gains or losses when sold due to liquidity requirements. These gains or losses occur due to numerous factors that are beyond our control, including interest rate levels, counterparties' credit risk and general market volatility.
Business Performance Risks
A deterioration in the quality of our loan portfolio may adversely affect our results of operations.
Given that a significant percentage of our income is related to lending activities, a significant deterioration in the quality of our loan portfolio would have a material adverse effect on our business, financial condition and results of operations. Problems with our borrowers may adversely affect our financial condition and results of operations. While loan portfolio risk associated with lending to certain economic sectors or clients in certain market segments can be mitigated through adequate diversification, our pursuit of opportunities in which we can charge higher interest rates, and thereby increase revenue, may have an impact on the profile of loan portfolio and risk exposure.
In addition, loan concentration in commercial sectors is particularly salient in Peru, and any significant deterioration in such sectors may have a material adverse effect on our business, financial condition and results of operations. For additional detail on the composition of our loan portfolio, see “ITEM 4. INFORMATION ON THE COMPANY – 4.B Business Overview – (7) Selected Statistical Information – 7.3 Loan portfolio and – 7.3.3 Concentrations of loan portfolio and lending limits”. Our strategy includes increasing our exposure to market segments with heightened credit risk, including middle-market and consumer segments, such as unsecured small companies, and consumer loans and consumer mortgages, which have higher risk profiles compared to loans to large corporate customers. Given the changing composition of our loan portfolio and the possible adverse changes in the environment in which we operate, our future results may differ significantly from our past results.
Errors or inaccuracies in risk models can have an adverse economic impact on our business, financial condition and results of operations.
Model risk is defined as the possibility of incurring economic losses due to decisions that are made based on erroneous or imprecise models. Deficiencies at the model level may be generated by problems with data quality, methodologies, implementations and/or uses. This risk is relevant because the Group relies heavily on the use of models all throughout the credit management process, including prospecting, pricing, admission, portfolio monitoring, collection, provisions, internal calculations of economic capital and other aspects.
Our use of models requires a comprehensive governance framework for the construction and monitoring of these models. Although the standards underlying our governance framework are updated and improved upon from time to time to mitigate the impact that severe or unexpected changes in the macro and micro economic environment could have on the risk quality of our portfolio, we cannot provide assurance that the models will be accurate or that severe or unexpected changes will not create risk for our loan portfolio. Our consumer and SME segments are particularly vulnerable to this risk.
Accurate underwriting and setting of premiums are important risk management tools for primary insurance companies, such as Grupo Pacífico, but the estimates underlying our underwriting and premiums may be inaccurate.
Grupo Pacífico’s operating performance and financial condition depend on its ability to underwrite and set premium rates accurately across a full spectrum of risks. In order to be profitable, Grupo Pacífico must generate sufficient premiums to offset losses, loss adjustment expenses and underwriting expenses.
To price premium rates accurately, Grupo Pacífico must:
•Collect and analyze a substantial volume of data;
•Provide sufficient resources to its technical units;
•Develop, test and apply appropriate rating formula;
•Closely monitor changes in trends in a timely fashion; and
•Predict both severity and frequency with reasonable accuracy.
If Grupo Pacífico fails to accurately assess the risks that it assumes, or if it does not accurately estimate its retention, it may fail to establish adequate premium rates. Failure to establish adequate premium rates could reduce income and have a material adverse effect on Grupo Pacifico´s operating results or financial condition. Moreover, there is inherent uncertainty in the process of establishing life insurance reserves and P&C loss reserves. Reserves are estimates based on actuarial and statistical projections at a given point in time of what Grupo Pacífico ultimately expects to pay out on claims and of the related costs of adjusting those claims, based on the facts and circumstances then known. Factors affecting these projections include, among others: (i) in the case of life insurance reserves, changes in mortality or longevity rates, interest
rates, persistency rates and regulation; and (ii) in the case of P&C loss reserves, morbidity, changes in medical costs, repair costs and regulation. Any negative effect of inaccurate estimates or projections on Grupo Pacífico could have a material adverse effect on its results of operations and financial condition.
While reinsurance is a tool for risk diversification that may help to reduce losses for a primary insurance company such as Grupo Pacífico, we face the possibility that the reinsured amount will be insufficient to fully cover incurred losses or that the reinsurance companies will be unable to honor their contractual obligations.
Credicorp assumes reinsurance risk in the normal course of business for its insurance contracts, when applicable. Premiums and claims related to assumed reinsurance are recognized as income or expenses in the same manner as direct business, based on the product classification of the reinsured business. Assuming reinsurance risk exposes Credicorp to the risk of loss if the reinsurer is unable to meet its obligations for credit reasons, if the company underestimates the frequency or severity of claims, or if adverse changes occur in the underlying insurance exposures, which are not considered when purchasing coverage from the reinsurer.
In the case of a catastrophic event that exceeds the confidence levels used for the purchase of reinsurance, which are based on models and practices aligned with the best market standards, we would face the risk that the reinsured amount may be insufficient to fully cover incurred losses. In that case, there would be a negative impact on our equity. Additionally, while Credicorp’s internal requirements with respect to reinsurer counterparty credit risk, as set by Grupo Pacífico’s risk management unit and approved by the Risk Committee, are more stringent than local regulatory requirements and include diversified placement of reinsurance, a failure by one or more of our counterparty reinsurance companies to honor their contractual obligations could have a material adverse effect on our financial condition and results of operations.
Risks not contemplated in our insurance policies may affect our results of operations.
Insurance amounts are calculated through statistical analysis and then maintained to cover risks related to our operations, including, among others, internal and external fraud, computer crime, professional liability for services we provide, director’s and officer’s liability and general liability against general claims involving bodily injuries and property damage. However, the terms and conditions of the insurance policies we have may not cover losses we incur in connection with a specific event or incident or may cover only part of the losses we may incur. The insurance policies of Credicorp and its subsidiaries are underwritten by Grupo Pacífico. Grupo Pacífico reinsures the policies in the cases it deems appropriate due to the materiality of the risk. In addition, operational risk may arise from misalignment between the terms of reinsurance policies and those of local insurance contracts.
Acquisitions, strategic partnerships and investments may not perform as expected, which could have an adverse effect on our business, financial condition and results of operations.
Acquisitions, strategic partnerships and investments may not perform as expected since our assessments and projections are based on assumptions with respect to operations, profitability and other matters that may subsequently prove to be incorrect. Future acquisitions, investments and alliances may not produce the anticipated synergies or perform in accordance with our expectations, which could have an adverse effect on our business, financial condition, and results of operation.
For example, in 2024, the Group recorded an impairment in the following companies: Joinnus S.A. for S/12.0 million, Wally POS S.A.C for S/9.0 million, Sami Shop for S/4.0 million and Compañía Incubadora de Soluciones Móviles S.A. for S/2.3 million. In 2023, the Group recorded an impairment loss totaling S/71.9 million (equivalent to US$19.3 million or 75,199 million Colombian Pesos (COP)) for its investment in Mibanco Colombia (formerly Bancompartir) as a result of its assessment of the recoverable amount. In this assessment, the fair value of Mibanco Colombia was estimated to be 438,259 million COP (equivalent to US$113.2 million or S/419.4 million), which was less than its book value of 513,458 million COP (equivalent to US$132.5 million or S/491.3 million). For further detail, please see Note 10(b) (Intangible Assets and Goodwill) to the consolidated financial statements.
Credicorp’s increasing investments in digital transformation and disruptive initiatives may fail to achieve the ambitions, efficiencies, and other performance improvements that it is pursuing.
As part of its transformation strategy, Credicorp is increasing investments in developing digital capabilities such as IT, data analytics and cybersecurity. The Company is spending significant resources with the goal of attracting digital
talent, evolving its agile culture to maximize client experience and strengthening its self-disruptive mindset. Moreover, Credicorp is increasing its investments in innovation and disruptive initiatives. Finally, as part of its transformation strategy, Credicorp is increasing investments in developing artificial intelligence (AI) capabilities and implementing use cases that increase both productivity and customer experience. These investments may fail to achieve their ambitions, limiting the company’s potential for acquisition of clients, income generation, efficiency and other performance improvements described in “ITEM 4. INFORMATION ON THE COMPANY – 4.B Business Overview – (1) Credicorp Overview”.
Credicorp continues to invest in its technology and digital and AI capabilities across its franchises, including digital platforms, data management and cloud-based solutions. Credicorp has also been pursuing productivity and operational performance improvements through the evolution of its diverse business models. For example, we aim for all Credicorp employees to use AI tools to improve their productivity. In microfinance, Mibanco has leveraged data and analytics to develop centralized credit assessment capabilities and generate loan offers to current clients and has leveraged alternative channels, such as mobile banking, call centers and home banking, among others, to increase loan disbursements. In addition, Credicorp has been making other investments in new ventures within its LoBs, such as our Yape mobile application, and through its corporate venture capital center Krealo, which is investing in fintech startups, such as Tenpo SpA (Tenpo), Credicorp Capital Negocios Digitales S.A.S. (Tyba), Compañía Incubadora de Soluciones Móviles S.A. (Culqi), among others. For additional detail about Credicorp's Innovation strategy and our investment in disruptive initiatives, please see “ITEM 4. INFORMATION ON THE COMPANY – 4.B Business Overview – (1) Credicorp Overview – Our Innovation Strategy”.
If Credicorp fails to adequately invest in its digital and innovation strategy, and artificial intelligence capabilities, our ability to compete or to provide superior customer experience could be adversely affected. There is no guarantee, however, that these or other initiatives at Credicorp will achieve the ambitions, efficiencies, profitability or other performance improvements that the Company is pursuing or that they will have any benefits at all.
Furthermore, Credicorp’s digital investments involve execution complexity and could result in additional losses, charges or other negative financial impacts. For example, Credicorp may not be able to achieve its objectives related to monetization of disruptive initiatives due to limited available information about new and under-penetrated markets that these initiatives target. The risks associated with disruptive initiatives encompass both technological and human factors. On the technical side, there are notable challenges such as current limitations in modulating conversational tone, which may impede adaptation to diverse communication contexts; the need to enhance dialogue protection against threats like prompt injection or data poisoning, which could undermine the integrity and security of interactions; and the persistent risk of AI-generated hallucinations that may affect the reliability of the solutions. From a user perspective, responses to these technologies will vary: while some individuals may embrace new communication methods, others will continue to favor direct human interaction. Additionally, ensuring that AI-generated conversations are truly indistinguishable from those between humans remains a considerable challenge, which could impact user trust and satisfaction.
Credicorp’s digital and artificial intelligence investments, and other initiatives, are subject to changes in business strategy, market environment and regulatory expectations, which could make the initiatives more costly and more challenging to implement and limit their effectiveness. Moreover, Credicorp’s ability to achieve expected returns on its investments and costs savings depends partially on factors that it cannot control, including, among others, interest rates; inflation; customer, client and competitor actions; and ongoing regulatory changes.
The shortage of specialized talent can negatively affect the implementation of our strategy.
Organizations globally are experiencing significant transformations due to the acceleration of digitalization and the rapid advancement of artificial intelligence, which is redefining roles and generating new skill demands, particularly in data, technology, and AI-related capabilities. The demand for digital skills and specialized profiles driven by artificial intelligence in the financial industry is far exceeding the supply, creating a talent gap that poses a considerable risk to organizations.
For Credicorp, the talent shortage due to the emergence of new AI-enabled roles and the increased demand for digital and analytical capabilities represents a strategic challenge that can impact the ability to innovate and improve operational efficiency, limiting the implementation of key technological initiatives and adaptation to new industry trends.
The clinics business is highly dependent on the availability and retention of qualified medical professionals, including physicians, nurses and specialized healthcare staff. Risks include workforce shortages, high turnover, labor
disputes, non-compliance with labor regulations, and dependency on key medical personnel. Inability to attract or retain qualified staff could negatively impact service continuity, quality of care and operational performance.
Our ability to pay dividends to shareholders and to pay corporate expenses may be adversely affected by the ability of our subsidiaries to pay dividends to us.
As a holding company, our ability to make dividend payments, if any, and to pay corporate expenses depends on the receipt of dividends and other distributions from our operating subsidiaries. Our principal operating subsidiaries are BCP Stand-alone, BCP Bolivia, Mibanco, Mibanco Colombia, Grupo Pacífico, ASB Bank Corp., Prima AFP and Credicorp Capital. Subject to certain minimum liquidity, reserve and capital adequacy requirements under applicable regulations, we are able to cause our subsidiaries to declare dividends. If our subsidiaries do not have funds available or are otherwise restricted from paying us dividends, we may be limited in our ability to pay dividends to shareholders. Currently, apart from the minimum capital requirements, there are no restrictions on the ability of BCP Stand-alone, BCP Bolivia, Mibanco, Mibanco Colombia, Grupo Pacífico, ASB Bank Corp., Prima AFP or Credicorp Capital to pay dividends abroad. In addition, our right to participate in the distribution of assets of any subsidiary, upon any subsidiary’s liquidation or reorganization (with the holders of our securities able to benefit indirectly from such distribution), is subject to the prior claims of creditors of that subsidiary, except where we are considered an unsubordinated creditor of the subsidiary. Accordingly, our securities will effectively be subordinated to all existing and future liabilities of our subsidiaries, and holders of our securities should look only to our assets for payments.
Since our main Peruvian subsidiaries pay dividends considering the accumulated results shown in the financial statements prepared under local GAAP applicable to financial entities, there could be differences between local GAAP and IFRS. The main differences between these are concentrated in the application of (i) IFRS 9, for both the methodology used to determine the provision for credit losses in loan portfolio and for the determination of financial income for loans; and (ii) IFRS 17, for the methodology used to determine Net Interest Income, Other Non-Core Income, Insurance and Reinsurance Result, and Total Expenses.
Finally, the value of any dividend paid by our operating subsidiaries that declare dividends in a currency different from Credicorp’s dividends (such as ASB Bank Corp., BCP Bolivia, Credicorp Capital Holding Chile and Credicorp Capital Holding Colombia) is subject to the impact of the exchange rate of the dividend’s currency against Credicorp’s functional currency. This foreign currency exchange could have a negative impact on our ability to pay dividends to shareholders. For further details about Credicorp’s Dividend Policy refer to “ITEM 8. FINANCIAL INFORMATION – 8.A Consolidated Statements and Other Financial Information – (3) Dividend Policy”.
Operational Risks
A failure in, or breach of, our operational or security systems, fraud by our employees or outsiders, and other operational errors of our internal controls system could temporarily interrupt our businesses, increase our costs and cause losses.
The risk of the occurrence of, or a material adverse effect caused by, security breaches remain present due to the constant adoption of new technologies and the interoperability between them, the use of digital profiles and processes, and the use and integration of artificial intelligence (AI) technologies into its operations. This risk is also present due to transfer of data among remote workers, cloud servers and office workers, given the transition to a more permanent hybrid workforce. Similarly, exposure to malicious external actors or insiders (i.e., security breaches) or operational errors affecting the confidentiality, availability and integrity of our main information assets (data bases, servers, software digital information associated with processes, among others) could result in significant losses of customer data and/or other types of confidential information, losses of revenue and customers, reputational harm and legal risks, any of which could directly affect our business and operations. In addition, the increased use of information technology (IT) and other IT resources can increase technological risks due to failures or problems in the management of technological tools and operational risks due to deficiencies or failures in processes or resources.
We also rely on third-party service providers that store, transmit and process part of our confidential information and that of our clients, which constitutes a supply chain risk. In addition, in recent years, there has been an increase in the number and sophistication of cyberattacks not only against financial institutions but also their providers worldwide.
Clinics process large volumes of sensitive personal and health-related data and are therefore exposed to risks of data breaches, cyberattacks, ransomware incidents or unauthorized access. Failure to adequately protect patient information
or comply with data protection regulations may result in administrative sanctions, litigation, loss of patient trust and reputational harm.
For further detail about the integration of cybersecurity processes into risk management at Credicorp, see item “ITEM 16K. CYBERSECURITY”.
Our Anti-Money Laundering (AML) and Counter-Terrorist Financing (CTF) measures are designed to safeguard our operations and uphold the highest standards of compliance; however, no system can guarantee absolute prevention, and we may not be able to prevent third parties from using as a conduit for illicit activities. While our framework significantly reduces the likelihood of illicit activities and reinforces the integrity of our business, any failure could damage our reputation or expose us to fines, sanctions or legal enforcement, any of which could have a material adverse effect on our business, financial condition and results of operations.
As financial institutions, our subsidiaries must comply with significant anti-money laundering and counter-terrorist financing laws and regulations, as well as applicable international standards and recommendations such as those provided by the Financial Action Task Force (FATF) and local directives. In line with these requirements, our group has developed a comprehensive risk-based approach strategy to implement an Anti-Money Laundering (AML) and Counter-Terrorism Financing (CTF) Program that seeks to prevent third parties from channeling illicit funds through Credicorp. At Credicorp, our financial institutions have continued to face many AML/CTF risks such as fines, commercial sanctions or legal enforcement.
In Peru, the SBS published the Anti-Money Laundering and Anti-Financing of Terrorism (AML/AFT) Risk Management Regulation in 2015 (SBS Resolution No. 2660-2015 and subsequent amendments), which includes provisions that extend the duties and functions of the Compliance Officer, clarify the obligation of companies to carry out customer classification under strict terms, establish enhanced due diligence for high risk customers and set out the guidelines for transferring funds, as well as many other specific requirements for daily transactions. These guidelines have introduced significant operational challenges, including increased exposure to compliance risks and the necessity for ongoing investment in advanced technology to ensure adherence to the stringent requirements of the regulation.
Environmental, Social and Governance Risks
Natural disasters in Peru and in the countries where we operate could disrupt our businesses and affect our results of operations and financial condition.
Peru continues to be periodically exposed to the effects of the El Niño Phenomenon (“El Niño”), an oceanic and atmospheric event associated with the warming of the central and eastern tropical Pacific Ocean that can generate heavy rainfall, flooding and landslides, particularly along the northern coast and in central Andean regions. Historically, strong El Niño episodes, such as those that occurred in 1997–1998 and in 2017, have generated significant impacts on the Peruvian economy.
Recently, we experienced a strong Coastal El Niño in 2023, which was intensified by Cyclone Yaku and brought heavy rains and floods and generated supply disruptions along Peru’s North Coast. These events significantly affected anchovy fishing, agriculture, primary manufacturing, and domestic textile production. During 2025, we did not experience an El Niño nor any other climatic phenomenon. However, as of April 2026, the Multisectoral Commission responsible for the National Study of the Phenomenon (ENFEN) estimates a moderate El Niño from June 2026 through July 2026.
While we cannot precisely forecast future El Niño events or their potential effects on our country's economy, our clients' financial performance, or the quality of our loan portfolio, we recognize that this phenomenon will continue to affect the country periodically, as it has in the past. Therefore, we remain vigilant and proactively prepare for its potential impacts.
We may incur financial losses and damages to our reputation from ESG risks, which recently have been recognized as increasingly relevant because they can affect business continuity and the creation of long-term value for our stakeholders.
ESG risks may adversely affect our business continuity and our ability to create long-term value for our stakeholders. Environmental risks, for example, may affect our businesses, particularly within our banking, asset
management and insurance subsidiaries. The market increasingly demands a proactive approach to issues affecting the environment from companies like ours, and thus a perception of lack of environmental responsibility could damage our reputation. Moreover, we operate in a region susceptible to climate-related challenges.
These environmental issues have the potential to have an adverse impact on our clients, affecting their payment capabilities and business continuity, likewise affecting our own operation. Among these environmental issues, climate change is particularly important to Credicorp, potentially exposing us to physical and transition risks, which may impact other traditional risks, such as credit, operational, reputational and others.
Social issues related to managing employees, customers and communities’ relationships may affect our business mainly through a talent or capabilities deficit, high training costs, compliance failures, operational inefficiencies and reputational risks. Finally, corporate governance issues may affect our business mainly through reputational risk, if we are perceived by stakeholders as a company that has any controversy related to transparency, Board structure and remuneration or stakeholder governance.
ITEM 4.INFORMATION ON THE COMPANY
4. AHistory and development of the Company
Credicorp Ltd. (New York Stock Exchange (NYSE) and Lima Stock Exchange (Bolsa de Valores de Lima or BVL by its Spanish initials) trading code: BAP) is an exempted company that was formed in Bermuda on August 17, 1995, pursuant to the Bermuda Companies Act 1981 in order to act as a holding company for, and to coordinate the policy and administration of our subsidiaries, which include BCP Stand-alone, BCP Bolivia, Mibanco, Mibanco Colombia, Grupo Pacífico, Prima AFP, Credicorp Capital and ASB Bank Corp. We currently hold, directly and indirectly, 97.74% of BCP, 100.00% of BCP Bolivia, 99.92% of Mibanco, 99.97% of Mibanco Colombia, 98.86% of Grupo Pacífico, 100.00% of Prima AFP, 100.00% of Credicorp Capital and 100.00% of ASHC (as well as 100.00% of ASB Bank Corp. through ASHC). See “ITEM 4. INFORMATION ON THE COMPANY – 4.C Organizational Structure”. In Bermuda, where it remains domiciled, Credicorp operates under the Bermuda Companies Act 1981 (as to date amended).
Our principal activity is to coordinate and manage the business plans of our subsidiaries to develop our Universal Banking, Microfinance, Insurance and Pension, and Investment Management and Advisory businesses at Perú, Colombia, Chile, Bolivia, Panama and the United States. Though we primarily focus on the aforementioned countries, we also make limited investments in other countries in the same region. Many of these investments are conducted through Grupo Credito S.A., a subsidiary 99.99% owned by Credicorp, whose purpose is to engage in different types of commercial activities, investments in securities, buying and selling of stocks and securities, and business in general. Our registered address in Bermuda is at Clarendon House, 2 Church Street, Hamilton, Bermuda, the address of our website is https://www.grupocredicorp.com/ (the website, and the information on such website, are not incorporated in this Form 20-F). The management and administrative office (which is the same as the principal place of business) of our principal subsidiary, Banco de Credito del Peru, is located at Calle Centenario 156, La Molina 15026, Lima, Peru, and its phone number is +51-1-313-2000. Our agent for service of process in the United States is the chief executive officer of BCP Miami, who is located at 121 Alhambra Plaza, Suite 1200, Coral Gables, FL 33134.
The SEC maintains a website that contains reports of the issuers that file electronically with the SEC. Our electronic filings with the SEC are available to the public from the SEC’s website at http://www.sec.gov. (Trading Code – BAP).
As of December 31, 2023 and December 31, 2024, our total assets were S/238.8 billion and S/256.1 billion, respectively, while net equity attributable to Credicorp’s equity holders was S/32.5 billion and S/34.3 billion. As of December 31, 2025, our total assets were S/267.4 billion and equity attributable to Credicorp’s equity holders was S/38.4 billion. Net profit attributable to Credicorp’s equity holders in 2023, 2024 and 2025 was S/4,865.5 million, S/5,501.3 million and S/6,925.4 million, respectively. See “ITEM 5. OPERATING AND FINANCIAL REVIEW AND PROSPECTS – 5. A Operating Results”.
On December 20, 2017, Credicorp’s Board of Directors resolved to organize Credicorp’s subsidiaries in four LoBs: Universal Banking; Microfinance; Insurance and Pensions; and Investment Management and Advisory. These changes took effect on April 1, 2018. During the same year, the Corporate Venture Capital Arm of the group was formed, developing Krealo in March 2018.
Universal Banking
On April 18, 2018, Credicorp Ltd., through its subsidiaries Grupo Crédito S.A. and BCP Stand-alone, acquired 3.23% and 0.06%, respectively, of the share capital of Mibanco from minority shareholders for approximately S/129.0 million and S/2.4 million, respectively. Additionally, on May 22 and 23, 2018, BCP Stand-alone acquired 1.22% and 0.05%, respectively, of the share capital of Mibanco from minority shareholders for approximately S/47.3 million and S/1.9 million, respectively. These acquisitions of non-controlling interest were recorded as equity transactions. Through these acquisitions, Credicorp Ltd. increased its interest in the share capital of Mibanco from 93.18% to 97.74%.
On May 7, 2018, Credicorp Ltd. sold to its subsidiary Grupo Crédito S.A. 220,113,636 shares of BCP Stand-alone owned by Credicorp Ltd., which represented 2.77% of BCP Stand-alone’s share capital. The amount paid per share was S/6.61. On May 7, 2019, Credicorp Ltd. sold to its subsidiary Grupo Crédito S.A. 83,839,991 shares of BCP Stand-alone, which represented 0.96% of BCP Stand-alone’s share capital. Following these sales, Credicorp, in conjunction with its subsidiary Grupo Credito, continued to own 97.74% of the shares of BCP Stand-alone.
In July 2022, Grupo Crédito S.A. established Yape Market S.A.C, a company focused on the promotion and management of sales and placement of products and services through electronic means. Grupo Crédito S.A. currently owns a 99.99% stake in Yape Market S.A.C.
Joinnus was acquired in March 2023. It is a subsidiary of Yape Market S.A.C, currently owns a 99.93% stake. The company is a digital platform for selling tickets to online events and shows.
In December 2025, BCP entered into an agreement to acquire 100% of the issued and outstanding shares of Helm Bank USA (“Helm Bank”) for USD 180 million, subject to customary price adjustment at closing. Helm Bank is a community bank authorized to operate in the State of Florida by the Florida Office of Financial Regulation (OFR), is supervised by the OFR and is a member of the Federal Deposit Insurance Corporation (FDIC). The strategic rationale for the transaction is to enhance Credicorp’s cross-border capabilities by serving internationally active clients and bolster its ability to meet the growing needs of Latin American clients, while preserving Helm Bank’s legacy as a community-focused institution. The completion of the transaction is subject to obtaining the required regulatory approvals in the United States from the OFR and the Federal Reserve (Fed), and in Peru from the Superintendence of Banking, Insurance and Private Pension Fund Administrators (SBS), as well as the fulfillment of other customary closing conditions.
Microfinance
On June 28, 2019, Credicorp Ltd., through its subsidiary Credicorp Holding Colombia S.A.S., reached an agreement with the majority shareholders of Banco Compartir S.A. (Bancompartir) to acquire a majority stake in Bancompartir, which provides microfinance and SME financing solutions to micro entrepreneurs and was one of the top four microfinance banks in Colombia. On December 2, 2019, Credicorp Ltd. announced that after obtaining the necessary regulatory approvals, it completed the acquisition of 77.46% of the capital stock of Bancompartir for approximately US$76.0 million, as part of Credicorp Ltd.’s strategy of expanding its microfinance business in Latin America.
On October 30, 2020, Credicorp Ltd. confirmed the merger of Bancompartir and Edyficar S.A.S. (Encumbra), to be integrated under the name Mibanco – Banco de la Microempresa de Colombia S.A. (Mibanco Colombia). The merged entity had a consolidated loan portfolio of more than US$270 million as of December 31, 2020. Its operating model focuses on achieving financial inclusion and social development serving and accompanying small and micro entrepreneurs in line with the business strategy proposed by Credicorp.
Insurance and Pensions
In 2015, Grupo Pacífico signed an agreement with Banmédica to participate as equal partners in the health insurance and medical services business. Grupo Pacífico transferred the majority control of the Pacífico Seguros corporate health insurance business and medical services to Banmédica. Consequently, the Pacífico Seguros corporate health insurance business and medical services were no longer consolidated with Grupo Pacífico for accounting purposes and were reported as an investment in associates. In 2018, UnitedHealth Group, one of the world's largest healthcare companies, acquired Banmédica, becoming Pacífico’s new partner in Peru. In 2025, Credicorp Ltd. completed the acquisition of the remaining 50% stake in joint venture with Empresas Banmédica. With the completion of this acquisition, Banmédica has transferred its 50% interest in the private medical insurance business in Peru to Pacifico Seguros, while its 50% interest in Pacífico S.A. Entidad Prestadora de Salud (“Pacifico EPS”), which manages the corporate health insurance for employees and medical services businesses in Peru, has been transferred to Credicorp’s subsidiary Grupo Crédito S.A. As a result, Credicorp, through its subsidiaries Pacifico Seguros and Grupo Crédito S.A. is now the sole owner of both the private medical insurance business and Pacifico EPS.
Investment Management and Advisory
During 2012, Credicorp initiated the creation of a regional investment banking platform. During the same year, the firm acquired a 51.0% stake in Correval S.A. Comisionista de Bolsa in Colombia and 60.6% of IM Trust & Co. Holding S.A. in Chile. In 2013, Credicorp Capital Peru was created following a spin-off from BCP, and included Credicorp Capital Bolsa, Credicorp Capital Titulizadora, Credicorp Capital Fondos and BCP Stand-alone’s investment banking activities. On September 30, 2016, Credicorp Capital Peru concluded the acquisition of the remaining stake in Correval S.A. Comisionista de Bolsa in Colombia and IM Trust S.A. Corredores de Bolsa in Chile. As a result of these acquisitions, Credicorp Capital became the owner of 100% of both companies. During these years Credicorp wanted to consolidate the brand name of Credicorp Capital on the whole region, so the group decided to name Correval S.A. Comisionista de Bolsa in Colombia as Credicorp Capital Colombia and IM Trust S.A. Corredores de Bolsa in Chile as Credicorp Capital Chile.
On February 12, 2019, Credicorp Ltd., through its subsidiary Credicorp Holding Colombia S.A.S., reached an agreement with the shareholders of Ultraserfinco S.A. Comisionista de Bolsa, a financial services company in Colombia, to acquire a 100% stake in Ultraserfinco S.A. Comisionista de Bolsa and its subsidiaries, which include 100% of Ultra Holding Group Inc., which in turn holds 100% of Ultralat Group Inc. (including 100% of Ultralat Investment Advisor and 100% of Ultralat Capital Market, LLC. (UCM)), for approximately US$43.0 million. On November 1, 2019, after obtaining the necessary regulatory approvals, the acquisition of 100% of the capital stock of Ultraserfinco S.A. Comisionista de Bolsa was completed through Credicorp Holding Colombia S.A.S. and Credicorp Capital Fiduciaria S.A. Ultraserfinco S.A. Comisionista de Bolsa had several subsidiaries including Ultralat, a company regulated by the SEC. On February 1, 2021, we finalized a merger between CCSI and UCM, which resulted in Credicorp Capital LLC.
On August 2, 2021, we finalized the merger by absorption between Atlantic Security Bank (Cayman Islands) and ASB Bank Corp. (Panama), with the latter being the surviving entity. ASB Bank Corp. is a financial institution incorporated under the laws of Panama, with an International Banking License and a securities brokerage license, issued by the SBP and the Panama SMV, respectively.
On March 15, 2022, Credicorp incorporated CC Asset Management Mexico S.A. de C.V., an unregulated legal entity (specifically, a variable capital corporation) in Mexico. This entity will distribute mutual funds and investment funds through private offerings. The company was constituted as a subsidiary of Credicorp Capital Ltd.
In December 2024, Credicorp Capital SAF notified its clients that it had offered to purchase 100% of the value of investments in the Credicorp Capital Factoring Dólares FMIV and Credicorp Capital Factoring Soles FMIV funds. These funds, which had exposure to assets managed by Sartor Administradora General de Fondos S.A. (“Sartor”) in Chile, a third-party fund manager, were impacted by recent regulatory actions and alleged misconduct at Sartor and on December 20, 2024, the Chilean Financial Market Commission revoked Sartor’s authorization to operate and ordered the liquidation of all funds under Sartor’s management. To facilitate the purchase process, Credicorp Capital SAF will execute participation transfer agreements through its affiliate Atlantic Security Holding Corporation (ASHC).
Corporate Venture Capital – Krealo
Krealo, Credicorp’s initiative that evolved from an open innovation arm to a Corporate Venture Capital, identifies and invests in opportunities that complement Credicorp's business lines. Krealo operates primarily through its ventures, including Tenpo, Tyba, Culqi, among others.
In January 2019, Grupo Crédito S.A. incorporated Tenpo S.P.A. (formerly Krealo S.P.A.) in Chile with the purpose of constituting investments in companies, real estate and movable capital. Tenpo S.P.A. acquired 100% of Tenpo Technologies S.P.A., a company dedicated to the commercialization of services, digital products, information technology and telecommunications, and 100% of Tenpo Prepago S.A. (formerly Multicaja Prepago S.A.), a company dedicated to the issuance and operation of prepaid cards. Tenpo S.P.A. has evolved into Credicorp’s digital wallet in Chile and, after obtaining its banking license in early 2026, became the country’s first neobank. For further information about this process, see “ITEM 4. INFORMATION ON THE COMPANY - 4. A History and development of the Company - Recent Developments” section.
In January 2019, Grupo Crédito S.A. acquired 91.36% of Compañia Incubadora de Soluciones Moviles S.A. (Culqi). Currently, Grupo Crédito S.A. directly and indirectly owns 100% of Culqi. Culqi was created in December 2013 and is mainly engaged in the development and operation of an online payment technology platform for digital businesses.
In March 2019, Credicorp Capital Negocios Digitales S.A.S. (Tyba) was chartered in Colombia to engage in information system development; computer consulting; and administration of information installations. Credicorp Holding Colombia S.A.S. holds 100% of the shares of this entity. Tyba has evolved into Credicorp’s digital investment platform with presence in Colombia, Chile, and Peru, which is primarily managed by Krealo.
We acquired Wally POS S.A.C. in January 2022 with the purpose of facilitating the management of client businesses through electronic tools and software that allows for the control of key aspects such as electronic invoicing, inventory control, and reports. Krealo Management S.A. holds 99.99% of the shares of this entity.
We acquired Sami Shop S.A.C in June 2022, which is a company that offers e-commerce platforms to small, medium and large companies. Grupo Crédito S.A. holds 99.99% of the shares of this entity.
Krealo Management S.A. was incorporated in September 2022 with the purpose of being a Peruvian holding company. Krealo Management S.A. currently owns 99.99% of Wally POS S.A.C., and 67.11% of Monokera S.A.S.
In November 2022, Krealo Ltd. was created in Bermuda as a wholly owned subsidiary of Credicorp. Krealo Ltd.’s purpose is to be a holding company, which encompasses some of Krealo´s investments.
In December 2022, Krealo Management S.A. acquired a 60.71% stake in Monokera S.A.S, a company that offers an insurtech platform that provides both core software and integration capabilities to insurance companies and sales channels for selling embedded insurance products through a license and commission-based business model.
Monokera Agencia LTDA., a subsidiary 100% owned by Monokera S.A.S., was created in March 2023.
Recent Developments
Credicorp Ltd.
In July 2025, Eduardo Montero was appointed as Head of Insurance and Pensions of Credicorp, and CEO of Pacífico Seguros. The appointment became effective in January 2026. Mr. Montero served as the Head of the Investment Management and Advisory business line and CEO of Credicorp Capital Ltd. from January 2019 to December 2025. See ITEM 6. DIRECTORS, SENIOR MANAGEMENT AND EMPLOYEES” for more information on Mr. Montero's biography.
In July 2025, Galantino Gallo was appointed as Head of the Investment Management and Advisory business line and CEO of Credicorp Capital Ltd. The appointment became effective in January 2026. Mr. Gallo previously served as CEO at Prima AFP for nearly three years. Before that, he was Managing Director of Asset Management and Sustainability Lead at Credicorp Capital, where he held a range of senior leadership roles, including Chief Investment Officer, Deputy Chief Investment Officer in Chile, Head of Equities in Chile and Peru, and Head of Buy Side Research. Mr. Gallo has over 20 years of experience in the financial sector. He holds a degree in Economics from Universidad del Pacífico and an MBA from The Wharton School of the University of Pennsylvania.
At the Company’s 2026 Annual General Shareholders Meeting, held on March 31, 2026, Credicorp Ltd.’s shareholders voted to approve the appointment of the new Board of Directors, which will hold office for the March 2026 – March 2029 period. New board members María Inés Álvarez Arnao, Juan Paredes Manrique and Manuel Romero Valdez succeed Antonio Abruña Puyol, Alexandre Gouvêa and Patricia Lizárraga Guthertz, who decided to retire from the Board. Additionally, six existing directors were re-elected. The new members further strengthen expertise in technology and AI-related oversight, financial and regulatory governance, and strategic execution.
María Inés Álvarez Arnao (Independent)
Ms. Alvarez is a technology executive and board director with over 30 years of experience in artificial intelligence, cloud platforms, cybersecurity, and large-scale technology operations. She most recently served as Vice President of Experimentation, AI Platform, Cloud & AI at Microsoft, where she led global experimentation and data-driven product development across multiple business units. Prior to Microsoft, she held executive technology roles at Panda Security and Yahoo. Ms. Alvarez has previously served on boards of two private institutions: BB Imaging and Workfront.
Ms. Alvarez currently serves as a Board Member and Chair of the Information Security Audit Committee at Alkami Technology, a U.S. listed digital banking technology company, where she oversees cybersecurity, fraud prevention, and information security governance.
She holds a master’s degree in computer science from California State Polytechnic University and a bachelor’s degree in information technology from Universidad Tecnológica del Centro (UNITEC) in Venezuela.
Her experience in technology governance, AI strategy, cybersecurity oversight, and scalable digital platforms directly supports Credicorp’s 2026 strategic priorities, particularly in digital transformation, risk management, operational resilience, and innovation across its financial services businesses.
Juan Paredes Manrique (Independent)
Mr. Paredes has served as a Director of Banco de Crédito del Perú (BCP) since March 27, 2024. In addition, he serves as a Director of Solución Empresa Administradora Hipotecaria S.A., a subsidiary of Credicorp.
Mr. Paredes is an independent consultant and director with more than three decades of experience in external audit, financial advisory and regulatory matters, with a particular focus on financial institutions and other regulated companies. He served as an Audit Partner at EY Peru from September 2002 to June 2021, and led the firm’s Assurance practice, which includes audit, accounting and financial consulting, and integrity risk services.
He also currently serves as a director of the private institution Anddes Asociados S.A.C.
Mr. Paredes holds an MBA from Universidad Adolfo Ibáñez (Chile) and degrees in Accounting and Business Administration from Universidad del Pacífico (Peru).
Mr. Paredes contributes to the Board’s oversight of financial integrity, regulatory compliance and risk management, bringing a practical understanding of accounting standards (IFRS and US GAAP) and the supervisory frameworks applicable to financial institutions, including those of the Superintendencia de Banca, Seguros y AFP (Perú), the U.S. Securities and Exchange Commission and the Public Company Accounting Oversight Board.
Manuel Romero Valdez (Non‑Independent)
Mr. Romero has served as a Director of Banco de Crédito del Perú (BCP) since March 27, 2024, and as a Director of Mibanco since January 16, 2026. As part of his role as a board member of BCP, he serves as an advisor of Yape, the digital initiative recently scaled within BCP.
Mr. Romero has extensive experience in corporate finance, strategy, and transformation. He is currently Chairman of Grupo Romero and previously served as Deputy Chief Executive Officer and Chief Financial Officer of Alicorp S.A.A. He has also held executive roles at Primax Colombia, where he was responsible for finance, technology, and business development. He has served previously as Vice President and Head of M&A at GRIO (Grupo Romero Investment Office), and worked in investment banking at Credit Suisse in New York.
He currently serves on the board of the publicly listed company Alicorp S.A.A. (Lima Stock Exchange). He also serves on the boards of the following private institutions: Primax Colombia S.A., InfraCorp S.A., GRAM LLC, Trabajos Marítimos S.A., Palmas del Espino S.A., Samay S.A.C., and Fundación Romero.
Mr. Romero holds an MBA from Stanford Graduate School of Business and bachelor’s degrees in mechanical engineering and economics from the Massachusetts Institute of Technology (MIT).
His background in strategy, capital allocation, transformation, investment decision-making, and experience across Latin America and the United States, with exposure to several sectors, supports the Board’s oversight of long-term value creation, disciplined execution, and the alignment of Credicorp’s strategic priorities with shareholder interests.
The Directors of Credicorp Ltd. that will hold office for the March 2026 – March 2029 period are:
•Nuria Aliño Pérez
•María Inés Álvarez Arnao
•María Teresa Aranzábal Harreguy
•Raimundo Morales Dasso
•Juan Paredes Manrique
•Leslie Pierce Diez-Canseco
•Luis Romero Belismelis
•Manuel Romero Valdez
•Pedro Rubio Feijóo
Additionally, the Board of Directors of Credicorp Ltd., in its session held on April 1, 2026, has approved the following matters in relation to the election, at the Company’s Annual General Meeting of Shareholders, of the new Board which will perform the role for the March 2026 -March 2029 period:
1. Election of Mr. Luis Romero Belismelis as the Chairman of the Board and Mr. Raimundo Morales Dasso as the Vice-Chairman of the Board of Credicorp.
2. Designation of the following directors as members of the Audit Committee:
•Juan Paredes Manrique (Chair and Financial Expert)
•Nuria Aliño Pérez
•María Teresa Aranzabal Harreguy
Mr. Raimundo Morales Dasso will act as advisor to the Audit Committee.
3. Designation of the following directors as members of the Risk Committee:
•Pedro Rubio Feijóo (Chair)
•María Inés Álvarez Arnao
•Raimundo Morales Dasso
•Juan Paredes Manrique
•Luis Romero Belismelis
4. Designation of the following directors as members of the Compensation and Nominations Committee:
•Nuria Aliño Pérez (Chair)
•María Teresa Aranzabal Harreguy
•Raimundo Morales Dasso
•Luis Romero Belismelis
•Pedro Rubio Feijóo
5. Designation of the following directors as members of the Sustainability Committee:
•María Teresa Aranzabal Harreguy (Chair)
•Nuria Aliño Pérez
•Leslie Pierce Diez-Canseco
•Manuel Romero Valdez
•Pedro Rubio Feijóo
Effective March 18, 2026, directors and executive officers of a foreign private issuer that has issued equity securities registered under Section 12 of the Exchange Act (such as the shares of Credicorp Ltd.) will be subject to Section 16(a) reporting obligations in substantially the same manner as directors and officers of U.S. domestic reporting companies. Therefore, beginning on March 18, 2026:
•Initial Reports (Form 3): All existing directors and officers of Credicorp must file a Form 3 disclosing all beneficial ownership in Credicorp shares, even if no securities are owned.
•Transaction Reports (Form 4): Most changes in beneficial ownership must be reported on Form 4 within two business days of the transaction.
•Annual Reports (Form 5): For certain exempt transactions, or for transactions that were not properly reported in prior filings, directors and officers may file a Form 5, which is due within 45 days after the company’s fiscal year-end.
All existing directors and executive officers of Credicorp are compliant with these regulations.
On April 23, 2026, the Board of Directors of Credicorp Ltd. declared a cash dividend of S/50.00 per share for a total of S/4,719,115,85.00 in line with the Company’s Bye-Laws. The cash dividend will be paid out on June 12, 2026, without withholding tax at source, to shareholders of record on May 18, 2026.
Credicorp and certain of its subsidiaries are involved in administrative and judicial proceedings in Peru arising from the disclosure of political campaign contributions made in connection with the 2011 and 2016 Peruvian presidential elections. These proceedings originated from sanctioning actions initiated by the Peruvian Superintendence of the Securities Market for alleged failures to timely disclose such contributions to the market and have progressed through the administrative and judicial stages, remaining pending final resolution before the Peruvian Judiciary as of the end of 2025. In the case of Credicorp, in January 2026 a second‑instance ruling was issued confirming the first‑instance decision, against which Credicorp filed a cassation appeal. Accordingly, as of the date of this report, both Credicorp’s case and the cases involving its three subsidiaries remain pending a final resolution by the Judiciary.
With respect to the administrative proceeding before SUNAT, in January 2026, Grupo Crédito has filed the corresponding administrative appeal, and, as of the date of this report, the administrative proceeding remains pending resolution by the competent authority. For more information about this proceeding, please refer to Item 8 - 8A - (1) Government Investigations.
In November 2025, the SBS issued Resolution No. 04200‑2025, which introduces clarifications to the computation of regulatory capital at the consolidated group and financial group levels. Effective with information for the first quarter of 2026, the amendments clarify the treatment of earnings and unrealized gains that may be incorporated into regulatory capital depending on the accounting framework applied by group entities: earnings from entities that apply SBS accounting standards in origin or through harmonization are included without requiring capitalization agreements, whereas earnings from entities that do not apply such framework are only included with capitalization agreements executed within the deadlines established by the SBS. In addition, the resolution sets specific criteria for recognizing net unrealized gains on debt instruments issued by the Government of Peru, by foreign governments with investment‑grade ratings, and by the Central Reserve Bank of Peru. These clarifications do not change the structure of CET1, Tier 1 and Tier 2, but modify the earnings that are eligible for purposes of the calculation of consolidated regulatory capital, as well as the composition among its tiers, depending on the degree of accounting harmonization applied within the group.
BCP Stand-alone
On April 24, 2026, the Federal Reserve Board approved BCP’s application to convert its existing Miami agency into a full state-licensed branch in Coral Gables, Florida (BCP’s first U.S. branch) permitting the bank to accept wholesale deposits from U.S. sources for the first time.
Krealo
In January 2024, Credicorp submitted an application for a banking license in Chile with the objective of scaling its digital wallet, Tenpo SPA (currently controlled by Krealo), and creating the country's first fully digital bank, becoming Credicorp's first step into Chilean retail banking through its product offering. The licensing process in Chile requires three
regulatory approvals. On January 19, 2026, Tenpo Bank Chile, a subsidiary of Tenpo SPA, successfully obtained authorization from the Chilean regulator Comisión para el Mercado Financiero (CMF), to operate as a bank in Chile.
Other Matters
On April 12, 2026, general elections were held in Peru for the election of the President of the Republic and members of Congress, with the new dual-chamber congress. While Keiko Fujimori is expected to advance to the second‑round presidential runoff, the official results will determine which candidate will join her. The second finalist remains uncertain: Roberto Sánchez is ahead of Rafael López Aliaga by less than 20,000 votes and some tally sheets are still under review, so confirmation may take until mid-May.
4. BBusiness Overview
(1)Credicorp Overview
Credicorp is a financial services holding company. Its principal subsidiary, Banco de Crédito del Perú (BCP), has more than 135 years of operating history in the financial sector. Credicorp conducts its operations through four lines of business: (i) Universal Banking; (ii) Insurance and Pensions, which primarily serves the Peruvian market; (iii) Microfinance; and (iv) Investment Management and Advisory, which operates across Latin America. In addition, Credicorp operates a corporate venture capital platform focused on external innovation to support its current and future businesses.
The year 2025 marks the 30th anniversary of Credicorp’s listing on the New York Stock Exchange. This milestone reflects the Company’s disciplined execution and strategic focus over time, supported by sustained investment in talent and innovation and its transformation capabilities to enhance long‑term competitiveness. During this period, Credicorp has expanded from a primarily domestic platform into a diversified regional organization, with operations in Peru, Bolivia, Colombia, Chile, Panama, and the United States, while managing capital in a prudent and responsible manner.
Credicorp’s performance extends beyond financial results and, consistent with its corporate purpose, reflects its contribution to inclusive and sustainable development for employees, customers, and the communities in which it operates. Credicorp Culture serves as the Company’s strategic framework, reinforcing a shared identity across the organization through teamwork and cross‑business collaboration, ambition, innovation, customer‑centricity, and integrity.
The Company’s strategy is focused on achieving sustainable growth while decoupling from broader economic cycles, supported by customer‑centric innovation and disciplined risk management. This strategy is underpinned by three priorities: attracting, developing, and retaining top talent; advancing digital transformation and innovation; and embedding sustainability as a core component of the Company’s overall strategy.
Furthermore, we are executing our strategy across four core areas that reinforce our competitive advantage and support consistent growth, scale and value creation:
•Prioritizing leading market positions in an underpenetrated region with clear growth avenues
•Scaling an integrated digital ecosystem
•Unlocking synergies by leveraging shared capabilities across the ecosystem
•Delivering strong, resilient results across economic cycles
Artificial Intelligence Program
At Credicorp, we have developed a playbook where we aim to centralize major AI initiatives at the corporate level, through which we consolidate an inventory of the group's initiatives, promoting the standardization and reuse of technology, as well as the efficiency and deployment of guidelines and tools for the design and implementation of AI solutions.
In 2024, we launched a Generative Artificial Intelligence program with the aim of leveraging this technology to improve customer experiences and employee productivity and processes.
To increase productivity of our employees and processes, we use copilots to assist employees with specific tasks, such as database searches, image analysis, and report generation. Our more than 2,700 developers at BCP, BCP Bolivia, Pacifico and Credicorp Capital use GitHub Copilot, for example. Likewise, other use cases focus on customer experience, such as Generative AI-powered voicebots and chatbots that answer general inquiries from clients. Additionally, we personalize the customer experience by generating images and messaging in line with the customer's specific segment or profile to better communicate commercial offers. This year, we have enabled different AI tools for more than 27,000 employees, and almost 70% of them use AI on a regular basis.
At Credicorp, we recognize the risks associated with implementing Generative AI solutions and the impact it could have on our operations. Therefore, we are on our way to implement a robust framework based on international standards and practices, such as the NIST AI Risk Management Framework, the ISO 23894 standard for AI risk management, and various international regulations. For further detail, see “ITEM 16K. CYBERSECURITY”. Additionally, we have an internal policy on responsible use of artificial intelligence.
Sustainability Strategy
During 2025, we began rolling out Credicorp’s new 2025–2030 Sustainability Strategy, approved by our Board of Directors and aligned with our purpose of improving lives by accelerating the changes that our countries need. This strategy builds on the foundations of the previous one, preserving its essence and strengthening the commitments that define us. The new strategy was developed through a rigorous and collaborative process that included an in-depth materiality analysis, the integration of our key stakeholder perspectives, a review of international benchmarks, and consultation with subject-matter experts.
The strategy is implemented on three fronts: our Impact Plan, a Responsible Management, and through Accelerators. Our Impact Plan primarily reflects initiatives aimed at our clients and society. The Group contributes to this front through its core businesses and the strategic social action initiatives of its subsidiaries. To ensure effective implementation, Credicorp mobilizes a series of Responsible Management fronts that serve as strategic enablers, consolidating the operational, ethical and governance pillars that turn the sustainability vision into tangible outcomes. Additionally, the strategy is driven by cross-cutting elements that span both the Impact Plan and Responsible Management, referred to as Accelerators, which aim to accelerate the pace of sustainable transformation, build internal and external capabilities, and foster an organizational culture aligned with the Group’s sustainability objectives.
The Impact Plan is structured around three strategic pillars: Inclusion, Finance for the Future, and Trust, with an overarching element of Country Vision:
•Inclusion: Contribute to ensuring that all individuals, especially those who are vulnerable or underserved, have access to and make use of quality financial and healthcare services that enable their full participation in the economy and society. By focusing on financial inclusion and education, as well as access to quality healthcare, this pillar seeks to promote more equitable development that also serves as a pathway for growth.
•Finance for the Future: Mobilize financial resources, education, tools, and protection mechanisms to drive social transformation, strengthen the resilience of businesses and individuals, and support an environmentally sustainable economy. This pillar focuses on empowering micro, small, and medium-sized enterprises (MSMEs), as well as large companies, by enhancing resilience, primarily through insurance and prevention strategies, and promoting sustainable finance.
•Trust: Strengthen trust in Credicorp and its subsidiaries, as well as in the private sector more broadly. In the context in which we operate, where distrust limits access to and use of the financial system, building trust is essential to advancing inclusion, particularly among vulnerable or underserved populations.
•Country Vision: Promote development in the regions of the countries where Credicorp operates by reducing social gaps and creating more equitable access to opportunities, resources, and infrastructure. This is an overarching element of the Impact Plan.
Inclusion:
Yape, our SuperApp, has become a key driver of financial inclusion in the region, promoting access, usage, and quality of financial services through digitalization. Between 2020 and 2025, 6.6 million Peruvians were financially included through Yape and BCP’s savings accounts. Since 2022, 1.3 million individuals have accessed their first formal loan via Yape. Additionally, through Mibanco, in 2025, more than 57 thousand people in Peru and more than 19 thousand in Colombia were banked through access to loans.
Access to affordable, inclusive insurance is essential for advancing inclusion. These products include health, life, accidents, and small business protection insurance. Pacífico Seguros offers these solutions through various channels, including Mibanco, BCP, Yape, and third-party partnerships. In 2025, 3 million individuals were included through inclusive insurance products.
Financial, digital, and prevention education is a fundamental enabler for advancing inclusion. Through our subsidiaries, we offer programs and partnerships that empower individuals to make more informed decisions and improve their well-being. In 2025, BCP reached 405 thousand people through ABC del BCP program and BCP Bolivia reached more than 2 million people through its ABC program, which includes courses and videos on managing money, personal finances, and banking products. Additionally, BCP had an impact on 715 thousand clients during the same year, who adopted healthier financial behaviors, stemming from financial education efforts. Prima reached over 1,164 thousand people through ABC de la Cultura Previsional, fostering a culture of retirement savings in 2025. Pacífico Seguros, in turn, reached 250 thousand individuals through ABC de Pacífico, which includes digital content and in‑person activations designed to promote risk awareness, health prevention, and the use of insurance, accessible to everyone. Credicorp Capital, through Tyba, its web and in-app platform, offers information and courses on investments, personal finance, and capital markets to its users.
We are committed to strengthening primary healthcare for underserved populations, especially vulnerable and lower-income groups. Our initiatives aim to expand access to primary, preventive, and digital healthcare services, integrating telemedicine and education efforts to reduce geographic and cultural barriers. This includes inclusive health insurance and Tsana, a low-cost digital platform offering 24/7 teleconsultations, AI-powered symptom checks, and wellness classes, primarily for female heads of household. Additionally, Desafío Salud (Doctor+) provides affordable outpatient medical services, laboratory, imaging, and pharmacy solutions, a model that is currently in an exploratory phase.
Finance for the Future:
We have implemented a range of initiatives, products, and solutions to support MSMEs. Over 880 thousand MSMEs disbursed a loan through Mibanco Perú, and over 1.4 million microbusinesses obtained microcredits via Yape. Mibanco Colombia launched the first sustainable deposit in Colombia, while BCP introduced a Sustainable Fixed-Term Deposit1 in Peru. Through the Contigo Emprendedor program, BCP provided advisory services to over 200 thousand MSMEs. The Franco MiBanco Chatbot in Colombia, which offers personalized financial advice and education 24/7, reached more than 120 thousand microbusinesses. Additionally, the Academia del Progreso program trained and advised over 537 thousand participants in Peru and Colombia through Mibanco.
We promote a culture of resilience through educational programs and practical tools such as those of Protege 365 and Comunidad Segura by Pacífico Seguros, which focus on risk prevention in businesses and communities. We launched
1 Sustainable Fixed-term Deposit: The Sustainable Fixed-term Deposit is a time deposit through which the bank allocates customer funds to eligible environmental and social projects, in line with eligibility criteria.
a free online Resilience Calculator to help users assess their preparedness for unforeseen events and risks, offering insights on their strengths, improvement opportunities, and training resources for families. We also offer tailored insurance products for MSMEs, including business protection insurance through Mibanco in Colombia and Peru. In Colombia, a climate risk alert system provides clients with preventive guidance, while enabling the insurance offering towards these clients.
In Sustainable Finance, through BCP Peru we mobilized USD 3,440 million in sustainable capital, including green and social financing. BCP Bolivia disbursed USD 69 million, and Mibanco Colombia COP 127,486 million, in environmental financing. Additionally, BCP launched its first Social Confirming line, an initiative that enables micro and small enterprises to access financing, promotes financial inclusion and strengthens the business ecosystem.
Trust:
We participate in numerous associations that help build trust with our stakeholders, expand the reach and impact of our initiatives, and reinforce our commitment to sustainability. In Peru, we are members of Peru Sostenible, the country’s largest network promoting sustainable development, and Es Hoy, a movement of business leaders committed to an inclusive, prosperous, and sustainable Peru. Internationally, we are members of PCAF2, CDP3, UNGC4, and PRI5. In 2025, Credicorp and Mibanco Colombia joined the TISFD6 Alliance, a global advisory group focused on setting standards for inequality and social impact disclosure. Pacífico Seguros became the first Peruvian insurer to join the Micro Insurance Network, a global platform promoting inclusive insurance for low-income and vulnerable populations.
Additionally, we carry out complementary actions to increase our impact and stakeholder trust through Strategic Social Action, which includes impact beyond our core businesses, and refers to volunteer programs, works for taxes. social projects and other programs that help close social gaps.
Responsible Management:
Our Responsible Management framework is structured around seven strategic pillars: (1) corporate and sustainability governance, (2) ethics, compliance and human rights, (3) social and environmental risk management, (4) people strategy, equity and diversity, (5) environmental management (own operations and portfolio), (6) supplier management, and (7) reporting and disclosure. Through these pillars, we aim to prevent risks, promote an ethical culture, create superior value for our employees, manage our direct and indirect environmental impacts, and ensure transparent communication of our sustainability performance.
Sustainability Governance Structure:
Our governance model enables us to elevate the visibility of our sustainability agenda to the highest levels of the organization, ensure its integration into our management approach and alignment with the business strategy, coordinate efforts across corporate teams and subsidiaries, and strengthen accountability for results.
2 PCAF: Partnership for Carbon Accounting Financial Disclosures
3 CDP: Carbon Disclosure Project
4 UNGC: United Nations Global Compact
5 PRI: Principles for Responsible Investment
6 TISFD: Taskforce on Inequality and Social-related Financial Disclosures
Credicorp’s Innovation Strategy
Our digital strategy is a fundamental element needed to execute our purpose, follow our values, and advance towards the future guided by our north star values. With an overarching group strategy, we enhance our digital and transformation processes to capture opportunities efficiently, expand our total addressable market and strengthen our operational drivers.
Our journey began in 2015, when BCP Stand-alone decided to focus on customer satisfaction while pursuing greater efficiency. Soon after, Grupo Pacífico, Mibanco, Prima AFP and Credicorp Capital followed the same path. Each of our LoBs has created an innovation lab, which is crucial for our LoBs’ cultural and digital transformation.
Throughout all these years, we have been seeking to innovate by constantly challenging, transforming, and disrupting ourselves. We aim to anticipate and adapt to the increasingly fast changing megatrends that could impact our customers, capture digital opportunities, and generate long-term profitability. For this, we have been seeking to strive for developing digital capabilities such as:
a)Having a self-disruptive mindset,
b)Strengthening an agile and user experience culture,
c)Capturing digital talent, and;
d)Developing solid tech capabilities.
While leveraging our competitive strengths:
a)Diversified and independent LoBs,
b)Strong brand and extensive network of long-term client relationships,
c)Sound management with resilient track record, and;
d)Solid balance sheet and risk discipline.
During 2022, we implemented our corporate innovation system at Credicorp Ltd. level. This system is focused on disruptive initiatives; that is, those that (i) are aimed at achieving new revenue streams through new business models, (ii) may compete with our own traditional businesses, and (iii) may require building new and critical capabilities, either operational, digital, or technological. The system is steered by the Chief Innovation Officer (CINO), with the support of the Innovation Management Office (IMO). The CINO and the IMO oversee (i) the definition of an innovation strategy at a corporate level, (ii) the management of the disruptive initiative portfolio, (iii) the development of the necessary innovation enablers; and (iv) the execution of activities and transversal projects to foster and improve innovation efforts. We periodically review potential disruptive initiatives so that we can manage them within funds, financial limits, and metrics structured as a portfolio. The CINO steers this process, which is performed alongside the Finance Department and validated by the Innovation Committee.
The system and its governance reflect an entrepreneurial and decentralized innovation model. Major decisions around strategy and portfolio management are made by a central Innovation Committee, while the sourcing and development of initiatives are executed by decentralized Innovation Units (IUs), which operate within or next to our LoBs. Thanks to this arrangement, we believe that we benefit from, on one hand, a central decision body that ensures alignment of innovation to our corporate goals and enables a fast decision process on the most complex issues; and, on the other, from being close to our customers, leveraging information already managed by our LoBs, and fostering rapid change and adoption in the overall organization.
The Innovation Committee, which is the system’s central body, is composed by Credicorp’s CEO, CSO and CINO, and has as guests Credicorp's CFO and Krealo’s CEO. This committee works closely with, and makes recommendations to, the Board of Directors, which holds the power over material decisions involving innovation, and over key venture graduations (e.g., spin-offs, spin-ins, write-offs, others). The Innovation Committee interacts with other forums through a variety of coordinated approaches. For instance, the Valuation Committee, which defines the methodologies and parameters for the valuation of ventures, is chaired by the CFO. We also have an Innovation Table, chaired by the CINO, which serves as an open discussion and coordination space for the IUs’ leaders. The following picture summarizes the main participants in our innovation system:
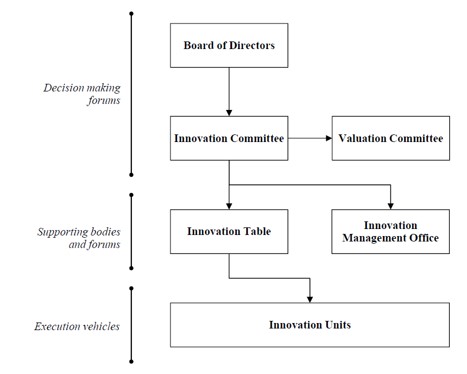
The IUs perform different roles depending on their various capabilities and on the LoBs’ needs. Some of the parties that hold these roles include: (i) innovation labs, which focus on inside-out innovation and operate mainly from ideation to the product-market-fit stage; (ii) Krealo, our corporate venture capital arm, which brings outside-in innovation, primarily through the acquisition of or minority investments in ventures with some proven market fit; (iii) a growth accelerator unit that scales ideas with potential after product market fit has been established; and (iv) some specific ventures that are key to our strategy, which we call “speedboats”. These speedboats sit close to our LoBs in order to take advantage of digital and data assets. At the same time, they hold sufficient governance independence, which allows them to take decisions faster and track performance accordingly with the nature and risk of the innovation under development. For further information see “ITEM 4. INFORMATION ON THE COMPANY – 4.A History and development of the Company – Corporate Venture Capital – Krealo”.
Our innovation system covers strategic and enabling elements. The strategic elements aim to include innovation domains and ambition, allocation of resources, performance management, and governance. These are necessary to provide guidance to the IUs and add structure to the system. The enabling elements seek to include components such as talent, culture, organization, or IT functions. For instance, our Artificial Intelligence (AI) program is an example of how we promote transversal projects that enable better coordination and maximize value creation. We also work hand in hand with our ESG strategy team to seek disruptive business models that are aligned with our sustainability pillars.
The innovation domains reflect markets, verticals, and/or trends in which there might be opportunities to disrupt, given our corporate strategy and priorities, our internal capabilities, and market and digital developments. Thus, they tell the IUs where to look for new initiatives. We organize these domains in three horizons to help structure, prioritize, and make disciplined capital allocation decisions. In horizon 1, we group the domains that are closer to our core businesses and geographies and, thus, are spaces we should mainly strengthen. In horizon 2, we include adjacent markets or niches in which we have identified an opportunity to enter or to reinforce our presence. Finally, in horizon 3, we explore trends with heavy technological and/or digital components that might completely transform the way we operate.
To achieve our innovation ambition, we set financial limits that track our investment in the disruptive portfolio (including the impact to Credicorp’s ROE and Cost to Income). These limits ensure that our profitability and financial health remain in line with our corporate goals. They also allow us to allocate funds to the horizons and innovation stages appropriately. The Innovation Committee provides the priorities for capital allocation, but the LoBs commit the specific funds, in accordance with our entrepreneurial and decentralized innovation system.
Finally, for performance management, we have a set of metrics that help us monitor disruptive portfolio performance and make timely decisions. These metrics assess four portfolio dimensions: (i) fund activity, which measures the size and efficiency with which we use resources (time and money) and kill initiatives with little potential; (ii) strategic performance, which reflects, for instance, diversification, incremental revenues and clients, and how we extend our footprint across our domains and horizons; (iii) financial performance, which measures the actual and expected cost and return of our portfolio; and (iv) portfolio confidence, which captures the risk of our portfolio based on the completion of objectives and key results (OKRs) by innovation stage, which in turn help us fund only those initiatives with the greatest potential.
Corporate Venture Capital – Krealo
As part of our innovation efforts at the holding level, in 2018, Credicorp set up Krealo, an initiative that has evolved from our open innovation arm to Credicorp’s Corporate Venture Capital, bringing innovation from the outside-in. Krealo focuses on external innovation by investing in opportunities that complement current and future LoBs. Krealo works independently from other LoBs, with a similar flexibility to venture capital funds, coupled with the control, network and scalability of Credicorp.
Krealo’s purpose is to identify, screen, and invest in opportunities by building and/or acquiring new features. Credicorp and Krealo currently hold controlling stakes in the following companies: Tenpo (Chile), Tyba (Colombia, Peru and Chile), and Monokera (Colombia and Peru). Additionally, Credicorp and Krealo hold minority stakes in other ventures across Latin America with a focus on Colombia, Mexico, Chile, and Peru.
Krealo seeks to create both financial and strategic value for (i) Credicorp and (ii) the ventures:
(i)Regarding Credicorp, Krealo creates strategic value by:
a.Boosting Credicorp’s current businesses: As an example, Tyba, through its 100% digital onboarding, expands the total addressable market in the Investment Management and Advisory business of Credicorp.
b.Creating new businesses for Credicorp: Tenpo, our neobank in Chile, has become Credicorp's first step into Chilean retail banking through its product offering. Likewise, it is important to mention that in January 2024, Credicorp submitted an application for a banking license in Chile, which was obtained in early 2026. For further information see “ITEM 4. INFORMATION ON THE COMPANY - 4. A History and development of the Company - Recent Developments” section.
(ii)Regarding the ventures, Krealo creates strategic value by:
a.Providing independence to the ventures while still providing constant support in areas of expertise including growth, IT, data, and cybersecurity, among others.
b.Acting as a long-term strategic partner, willing to support ventures with capital and expertise throughout their development.
c.Offering flexible deal structures with the aim of generating financial and strategic value.
d.Helping ventures grow faster by offering partnerships with LoBs, regulatory and financial expertise, relationships with industry leaders and the financial ecosystem, and the opportunity to leverage in Credicorp’s distribution channel (both by selling their products through Credicorp channels and selling Credicorp products through the ventures channels).
Krealo is committed to its role in the Andean Venture Capital ecosystem, investing in fintechs and startups with a focus on financial services.
Risk Rating
In June 2025, Fitch Ratings affirmed Credicorp Ltd.’s and Banco de Credito del Peru risk ratings at ‘BBB’ and kept its outlook stable. As of December 2025, S&P Global Ratings continues to maintain the ratings of Credicorp Ltd., Banco de Crédito del Perú, and Mibanco at ‘BBB-’, with a stable outlook, in line with Peru’s long-term sovereign foreign currency rating.
Credicorp’s LoBs’ Contributions
According to IFRS, an operating segment is a component of an entity for which financial information is available and is evaluated periodically by the Chief Operating Decision Maker (CODM), who makes decisions about resources allocated for the segment and assesses its performance.
The following tables provide certain financial information about our LoBs as of and for the years ended December 31, 2025, 2024 and 2023:
| | | | | | | | | | | | | | | | | | | | | | | | | | | | | | | | | | | | | | | | | | | | | | | |
| As of and for the year ended December 31, 2025 |
| External income (1) | | Net interest, similar
income and
expenses | | Other income, net (2) | | Total assets |
| (Soles in millions, except percentages) |
| Amount | | %
Total | | Amount | | %
Total | | Amount | | % Total | | Amount | | % Total |
| Universal Banking | | | | | | | | | | | | | | | |
| BCP Stand-alone | 19,528 | | | 68.4 | | | 11,137 | | | 75.7 | | | 5,240 | | | 60.8 | | | 202,206 | | | 75.6 | |
| BCP Bolivia | 683 | | | 2.4 | | | 215 | | | 1.5 | | | 186 | | | 2.2 | | | 10,062 | | | 3.8 | |
| Insurance and Pension funds | | | | | | | | | | | | | | | |
| Grupo Pacífico | 2,374 | | | 8.3 | | | 298 | | | 2.0 | | | 1,456 | | | 16.9 | | | 20,625 | | | 7.7 | |
| Prima AFP | 407 | | | 1.4 | | | 1 | | | - | | | 403 | | | 4.6 | | | 682 | | | 0.3 | |
| Microfinance | | | | | | | | | | | | | | | |
| Mibanco | 3,301 | | | 11.6 | | | 2,480 | | | 16.8 | | | 138 | | | 1.6 | | | 18,355 | | | 6.8 | |
| Mibanco Colombia | 670 | | | 2.3 | | | 430 | | | 2.9 | | | 56 | | | 0.6 | | | 2,858 | | | 1.1 | |
| Investment Management and Advisory | 1,405 | | | 4.9 | | | 54 | | | 0.4 | | | 1,010 | | | 11.7 | | | 8,226 | | | 3.1 | |
| Other segments | 455 | | | 1.6 | | | 101 | | | 0.7 | | | 304 | | | 3.5 | | | 6,446 | | | 2.4 | |
| Eliminations | (268) | | | (0.9) | | | - | | | - | | | (168) | | | (1.9) | | | (2,097) | | | (0.8) | |
| Total consolidated | 28,555 | | | 100.0 | | | 14,716 | | | 100.0 | | | 8,625 | | | 100.0 | | | 267,363 | | | 100.0 | |
(1)Corresponds to total interest and similar income, other income, the result of the insurance and reinsurance service and medical services results.
(2)Corresponds to other income (include income and expenses for commissions), result of the insurance and reinsurance service and medical services results.
| | | | | | | | | | | | | | | | | | | | | | | | | | | | | | | | | | | | | | | | | | | | | | | |
| As of and for the year ended December 31, 2024 |
| External income (1) | | Net interest, similar
income and
expenses | | Other income, net (2) | | Total assets |
| (Soles in millions, except percentages) |
| Amount | | %
Total | | Amount | | %
Total | | Amount | | % Total | | Amount | | % Total |
| Universal Banking | | | | | | | | | | | | | | | |
| BCP Stand-alone | 19,176 | | | 69.8 | | | 10,815 | | | 76.6 | | | 4,831 | | | 63.5 | | | 194,921 | | | 76.1 | |
| BCP Bolivia | 924 | | | 3.4 | | | 353 | | | 2.5 | | | 254 | | | 3.3 | | | 12,996 | | | 5.1 | |
| Insurance and Pension funds | | | | | | | | | | | | | | | |
| Grupo Pacífico | 1,769 | | | 6.4 | | | 299 | | | 2.1 | | | 935 | | | 12.3 | | | 17,777 | | | 6.9 | |
| Prima AFP | 385 | | | 1.4 | | | 2 | | | - | | | 379 | | | 5.0 | | | 658 | | | 0.3 | |
| Microfinance | | | | | | | | | | | | | | | |
| Mibanco | 3,195 | | | 11.6 | | | 2,243 | | | 15.9 | | | 125 | | | 1.6 | | | 16,979 | | | 6.6 | |
| Mibanco Colombia | 574 | | | 2.1 | | | 326 | | | 2.3 | | | 60 | | | 0.8 | | | 2,323 | | | 0.9 | |
| Investment Management and Advisory | 1,317 | | | 4.8 | | | 36 | | | 0.3 | | | 945 | | | 12.4 | | | 8,466 | | | 3.3 | |
| Other segments | 388 | | | 1.4 | | | 41 | | | 0.3 | | | 174 | | | 2.4 | | | 6,341 | | | 2.5 | |
| Eliminations | (256) | | | (0.9) | | | - | | | - | | | (100) | | | (1.3) | | | (4,372) | | | (1.7) | |
| Total consolidated | 27,472 | | | 100.0 | | | 14,115 | | | 100.0 | | | 7,603 | | | 100.0 | | | 256,089 | | | 100.0 | |
(1)Corresponds to total interest and similar income, other income and the result of the insurance and reinsurance service.
(2)Corresponds to other income (include income and expenses for commissions) and result of the insurance and reinsurance service.
| | | | | | | | | | | | | | | | | | | | | | | | | | | | | | | | | | | | | | | | | | | | | | | |
| As of and for the year ended December 31, 2023 |
| External income (1) | | Net interest, similar
income and
expenses | | Other income, net (2) | | Total assets |
| (Soles in millions, except percentages) |
| Amount | | % Total | | Amount | | % Total | | Amount | | % Total | | Amount | | % Total |
| Universal Banking | | | | | | | | | | | | | | | |
| BCP Stand-alone | 17,802 | | | 69.4 | | | 9,818 | | | 75.9 | | | 4,315 | | | 62.8 | | | 178,053 | | | 74.6 | |
| BCP Bolivia | 820 | | | 3.2 | | | 332 | | | 2.6 | | | 110 | | | 1.6 | | | 12,631 | | | 5.3 | |
| Insurance and Pension funds | | | | | | | | | | | | | | | |
| Grupo Pacífico | 1,730 | | | 6.7 | | | 285 | | | 2.2 | | | 952 | | | 13.9 | | | 16,586 | | | 6.9 | |
| Prima AFP | 386 | | | 1.5 | | | 4 | | | - | | | 379 | | | 5.5 | | | 741 | | | 0.3 | |
| Microfinance | | | | | | | | | | | | | | | |
| Mibanco | 3,236 | | | 12.6 | | | 2,165 | | | 16.7 | | | 155 | | | 2.3 | | | 16,931 | | | 7.1 | |
| Mibanco Colombia | 489 | | | 1.9 | | | 255 | | | 2.0 | | | 45 | | | 0.7 | | | 2,164 | | | 0.9 | |
| Investment Management and Advisory | 1,210 | | | 4.7 | | | 82 | | | 0.6 | | | 809 | | | 11.8 | | | 10,104 | | | 4.2 | |
| Other segments | 278 | | | 1.1 | | | (3) | | | - | | | 216 | | | 3.1 | | | 4,947 | | | 2.1 | |
| Eliminations | (286) | | | (1.1) | | | - | | | - | | | (114) | | | (1.7) | | | (3,317) | | | (1.4) | |
| Total consolidated | 25,665 | | | 100.0 | | | 12,938 | | | 100.0 | | | 6,867 | | | 100.0 | | | 238,840 | | | 100.0 | |
(1)Corresponds to total interest and similar income, other income and the result of the insurance and reinsurance service.
(2)Corresponds to other income (include income and expenses for commissions) and result of the insurance and reinsurance service.
The following table sets forth the contribution to the consolidated net profit attributable to our equity holders by each of LoBs and main subsidiaries:
| | | | | | | | | | | | | | | | | | | | | | | | | | | | | | | | | | | |
| 2023 | | 2024 | | 2025 |
| Amount | | % Total | | Amount | | % Total | | Amount | | % Total |
| Universal Banking | | | | | | | | | | | |
| BCP Stand-alone | 4,281 | | | 88.0 | | | 4,889 | | | 88.9 | | | 5,908 | | | 85.3 | |
| BCP Bolivia | 83 | | | 1.7 | | | 94 | | | 1.7 | | | 86 | | | 1.2 | |
| Insurance and Pensions | | | | | | | | | | | |
| Grupo Pacífico | 801 | | | 16.5 | | | 761 | | | 13.8 | | | 838 | | | 12.1 | |
| Prima AFP | 150 | | | 3.1 | | | 133 | | | 2.4 | | | 147 | | | 2.1 | |
| Microfinance | | | | | | | | | | | |
| Mibanco | 199 | | | 4.1 | | | 302 | | | 5.5 | | | 445 | | | 6.4 | |
| Mibanco Colombia | (64) | | | (1.3) | | | (7) | | | (0.1) | | | 47 | | | 0.7 | |
Investment Management and Advisory (1) | 173 | | | 3.6 | | | 195 | | | 3.5 | | | 225 | | | 3.3 | |
Other segments and eliminations (2) | (758) | | | (15.6) | | | (866) | | | (15.7) | | | (771) | | | (11.1) | |
| Total | 4,865 | | | 100.0 | | | 5,501 | | | 100.0 | | | 6,925 | | | 100.0 | |
(1)Investment Management and Advisory mainly includes Credicorp Capital Ltd and subsidiaries and ASB Bank Corp.
(2)Includes Grupo Crédito S.A., Inversiones Credicorp Bolivia, SEAH and others.
The following table shows our LoBs and main subsidiaries’ respective percentage contributions to our total equity attributable to Credicorp’s equity holders:
| | | | | | | | | | | | | | | | | | | | | | | | | | | | | | | | | | | |
| 2023 | | 2024 | | 2025 |
| Amount | | % Total | | Amount | | % Total | | Amount | | % Total |
| Universal Banking | | | | | | | | | | | |
| BCP Stand-alone | 22,084 | | | 68.0 | | | 22,884 | | | 66.6 | | | 24,998 | | | 65.2 | |
| BCP Bolivia | 889 | | | 2.7 | | | 1,006 | | | 2.9 | | | 870 | | | 2.3 | |
| Insurance and Pensions | | | | | | | | | | | |
| Grupo Pacífico | 3,087 | | | 9.5 | | | 3,331 | | | 9.7 | | | 4,456 | | | 11.6 | |
| Prima AFP | 500 | | | 1.5 | | | 476 | | | 1.4 | | | 453 | | | 1.2 | |
| Microfinance | | | | | | | | | | | |
| Mibanco | 2,996 | | | 9.2 | | | 2,609 | | | 7.6 | | | 2,740 | | | 7.1 | |
| Mibanco Colombia | 265 | | | 0.8 | | | 379 | | | 1.1 | | | 443 | | | 1.2 | |
Investment Management and Advisory (1) | 1,917 | | | 5.9 | | | 1,425 | | | 4.2 | | | 1,402 | | | 3.6 | |
Other segments and eliminations (2) | 722 | | | 2.4 | | | 2,236 | | | 6.5 | | | 3,005 | | | 7.8 | |
| Total | 32,460 | | | 100.0 | | | 34,346 | | | 100.0 | | | 38,367 | | | 100.0 | |
(1)Investment Management and Advisory mainly includes Credicorp Capital Ltd and subsidiaries and ASB Bank Corp.
(2)Includes Grupo Crédito S.A., Inversiones Credicorp Bolivia, SEAH and others.
For a description of the principal markets in which we compete, please refer to “ITEM 4. INFORMATION ON THE COMPANY – 4.B Business Overview – (2) Lines of Business (LoBs), – (5) Competition, and – (6) Supervision and Regulation” and Note 27 to Credicorp’s consolidated financial statements. For a breakdown of total income and operating income by geographic market for each of the last three fiscal years, as well as other historical information about our LoBs, please refer to Note 27 to Credicorp’s consolidated financial statements.
(2)Lines of Business (LoBs)
2.1Universal Banking
Our Universal Banking LoB, which focuses on lending and transactional business, is organized into (i) retail banking activities, including our Individuals, SME-Business, SME-Pyme (small and micro firm) segments, which are carried out by BCP Stand-alone’s Retail Banking Group (RBG) and Yape; (ii) wholesale banking activities, including our corporate and middle-market banking business segments, which are carried out by BCP Stand-alone’s Wholesale Banking Group (WBG); (iii) treasury activities, including asset and liabilities management (ALM); sales and trading; and foreign exchange and derivatives distribution, which are carried out by BCP Stand-alone’s Treasury function; and (iv) wholesale and retail banking activities in Bolivia, which are carried out by BCP Bolivia and Yape Bolivia.
The majority of our banking business is carried out through BCP Stand-alone, the leading bank in Peru by loans and deposits with close to 29% market share in loans and 33% market share in deposits according to the SBS. We conduct banking activities in Bolivia through BCP Bolivia, a full-service commercial bank.
2.1.1BCP Stand-alone
(I)BCP Stand-alone’s Overview
BCP Stand-alone operates mainly in Peru and has one agency in Miami and one branch in Panama. See “ITEM 4. INFORMATION ON THE COMPANY – 4.C Organizational Structure – (1) Credicorp.” BCP Stand-alone’s operations are supervised and regulated by the SBS, SMV and the BCRP in Peru, by the Office of Financial Regulation of the State of Florida Department of Financial Services and the Federal Reserve in the United States, and by the SBP in Panama. As of and for the year ending on December 31, 2025, BCP Stand-alone represented 75.6% of our total assets, and 65.2% of our equity attributable to Credicorp’s equity holders.
BCP Stand-alone’s purpose and values
BCP Stand-alone’s purpose is “Transforming plans into reality”. We aim to support our clients in transforming their dreams and plans into reality. We hope to simultaneously contribute towards building Peru’s story of development and progress and deepening our connection to communities in order to generate value for all stakeholders and ensure long-term sustainability.
We believe our values are fundamental to fulfilling our purpose and shaping our culture. We refer to this as our “WOW Culture,” as it enables us to deliver an outstanding customer experience through a team committed to supporting our customers in achieving their goals and aspirations. Our values guide the actions of our stakeholders as they work toward our purpose and reflect the role we seek to play in Peruvian society. Our values are:
•Customer Centricity
•Test and Learn
•Risk-conscious and righteous
•Collaboration
•Give your Best
•Boost your Skills
BCP Stand-alone Strategy
Our strategy is geared towards delivering an extraordinary experience and operating with efficiency to remain competitive while investing in long-term sustainable growth. As such, we aim to be the number one company in Customer Experience in Peru and to be the most efficient bank in the region.
Experience:
We are placing a strong emphasis on digital coverage and high transactionality, ensuring our clients can meet their daily-banking needs anytime, anywhere. Additionally, we are committed to delivering a truly personalized experience for every client by harnessing advanced capabilities, transforming our digital channels, and continuously modernizing our physical network.
Efficiency:
We are committed to driving robust income through both margins and diversified revenue streams, while actively expanding our market share, introducing innovative products, and digitizing our services. At the same time, we prioritize operational efficiency to ensure sustainable profitability and preserve the ability to reinvest continuously in innovation empowering us to anticipate market trends, strengthen our digital capabilities, and deliver superior value to our clients.
This strategy is delivered to the market through our business units, each employing a unique strategic approach while continuing to serve as the primary bank for our customers.
•For Individuals, we developed a different strategy for each subsegment: from the Affluent where we have a value proposition based on personalized digital and physical comprehensive service, to a more digital cost-efficient and transactional value proposition that aim to expand the credit access through innovative digital solutions like Yape for the mass market.
•For SMEs, we aim to develop a digital solution and credit capabilities to serve smaller customers in a profitable way, to further develop risk-free income and to disrupt the way we attend underserved segments.
•For Wholesale, we have several objectives: Defending our leadership in these segments, expanding our services beyond banking, ensuring end-to-end digitization, and identifying ESG opportunities aligned with our Purpose.
We work to develop key internal capabilities, known as our enablers, that will help us to stay on course towards our ambitions. Our enablers are:
•IT: We continue to develop competitive advantages through increased productivity, enabling us to reach the market on time and efficiently expand our operational scale.
•Data and Analytics: We support our strategy by three fundamental pillars, democratize the use of data in all business areas, enhance by data-driven decision, and build a robust ecosystem that protects our clients' information.
•Cybersecurity: We are focusing our efforts on the most effective strategies to reduce our exposure to cybersecurity risk.
We believe that our enablers, leveraged by our talent and an agile mindset culture, will allow us to achieve our key objectives.
IT
To excel in Customer Experience, we need to have outstanding channel uptime and deliver new functionalities to market in record time; and to do this efficiently, we need modern technologies and a re-utilization of components.
As of the December 2025, we have developed 812 reusable APIs. The results have been impressive across all 3 target dimensions: we have 62% fewer service incidents (compared to 2021) with 99.8% uptime, we released 4x the number of features (compared to 2021), development time has been reduced by 75% (compared to 2021) and we have reduced the unit transaction cost by 82% (compared to 2021).
Data and Analytics
During 2025, we created value through advanced analytics projects for S/ 153 million in profit before income tax. The key contributors were: commercial intelligence models for insurance products (S/ 12 million), sovereign bonds inclusion in balance sheet optimization models that enhance risk-adjusted returns (S/ 10 million), and SME RM commercial targets alignment with each portfolio sales potential (S/ 10 million). Regarding the value generated by data solutions and external data ingestion, we managed to capture S/.51 million (+28% vs 2024) where the main drivers were marginal revenues and cost savings focusing on initiatives related to customer and wholesale segments and risk management.
Cybersecurity
We reduced our risk ratios and cybernetic vulnerability by strengthening our technological tools and processes as well as educating our employees and clients about such risks.
For further detail, see “ITEM 16K. CYBERSECURITY”.
To support these capabilities, we rely on a highly skilled and talented team (one that has been recruited, trained, upskilled) that operates on a well-established agile delivery model. To continue satisfactory development of our enablers, we rely on our talent and an agile culture mindset.
Therefore, we are attracting, upskilling, and retaining diverse tech talent. We recruit and hire specialized data, analytics and IT professionals from Credicorp’s international hubs in different countries on various continents. We offer our tech talent the opportunity to develop leading edge capabilities in an environment in which we aim to lead in technology.
We believe BCP Stand-alone has an organization scheme which was consolidated by 1) implementing a management model to promote the alignment, prioritization, and accountability of our initiatives; 2) developing high performance teams that focus on initiatives that improve time to market, productivity and quality in our squads, which are our autonomous and multidisciplinary teams that work within our Tribes and Centers of Excellence (CoEs); and 3) strengthening our chapters, which are highly specialized people that compose our CoEs, by raising the quality level of the service they offer to our squads. Tribes and CoEs are how we refer to our agile organizations dedicated to the creation and evolution of our highly specialized and strategic capabilities.
Where we stand today…
BCP Stand-alone has undergone a considerable transformation over the last five years. In our perspective, our strategy has resulted in a larger and more digital, efficient, transactional and sustainable bank in the long run. We have made significant strides in solidifying our strategy; this has resulted in maintaining our leadership in the NPS of our Consumer segment in 2025 and progress in maintaining our efficiency ratio.
In general, our transformation results are leading us towards a more digitized, loyal, and profitable customer profile – with more products and more use of digital channels which results in us being more profitable. Over the past five years, we have made progress over several areas in (i) our capacity for growth, (ii) our successful digital strategy, (iii) the growing customers’ preference for our digital services and (iv) customer’s trust. This allows us to understand and manage the evolution of our two north stars (experience and efficiency).
Our strategy execution is not only resulting in a better experience and more efficient value proposition for our customers. Sustainability is a key pillar of our strategic approach, focused on generating a positive impact in society aligned with our purpose and our business.
Since 2021, we have grown our customer base by approximately 1.7 times, reaching a total of 19 million clients (as compared to 10.9 million in 2021). Of these, 3.2 million currently have loans, a significant increase from the 1.2 million in 2021. Simultaneously, we have strengthened the customer experience, as evidenced by the improved Net Promoter Score (NPS) for the consumer segment, which reached 53 points in 2025 (up from 37 points in 2021).
As we keep on evolving, we stay committed to our purpose to transform plans into reality, with a clear and sustainable strategy, centered on maximizing customer and employee experience and improving the efficiency of our operations, within a sustainable framework. We embrace taking calculated and prudent risks, proving time and again that we can adapt and thrive in an ever-changing landscape.
(II)BCP Stand-alone’s Business Units
(II.I)Retail Banking Group (RBG)
As of December 31, 2025, Retail Banking-related loans represented 53% of BCP Stand-alone’s average total loans, while retail banking-related deposits represented 67% of BCP Stand-alone’s average total deposits.
The following table shows the client segmentation for RBG. This segmentation was a result of an analysis that addressed multiple factors such as the size and volume of activity for each client, the clients’ affiliation with other companies or groups and their credit ratings.
| | | | | | | | | | | |
| Client Segmentation |
|
|
| Business | Segment | Group | Client Income/Sales/Total debt |
Retail Banking
Group (RBG) | Individuals | Enalta | Individual monthly net income of at least S/20,000; or more than US$200,000 in asset under management in each of the previous 6 months (not including severance indemnity deposits) |
| Affluent | Individual monthly net income ranging from S/5,000 to S/20,000; or more than S/150,000 in assets under management in each of the previous 6 months (not including severance indemnity deposits) |
| Consumer | Focus on medium- and low-income individuals (less than S/5,000 of individual monthly income) |
| SME | Business | Annual sales from S/5.6 million to S/35 million; or total debt from S/1.2 million to S/10 million |
| Pyme | Annual sales up to S/5.6 million; or total debt up to S/1.2 million |
Individuals’ business segments within RBG are:
Enalta
Enalta services include investment advisory, securities-based lending, financial planning, and day-to-day banking services such as loans and cash accounts. In addition to regular branches, Enalta clients have access to nine exclusive branches; seven of them are in Lima, one is in Arequipa and one in Trujillo. These spaces enable customers to make financial transactions in a secure, private space, as well as experience personalized advice of investment, insurance and loan experts who offer exclusive, invitation-only products. Enalta services are available not only to the client itself but also to their household, allowing for additional financial relationships. Enalta offers highly personalized services and experiences and a wide range of products and, therefore, a strong value proposition. The Enalta segment has approximately 72,000 clients.
Affluent
Customers in RBG’s Affluent segment receive a differentiated value proposition based on dedicated remote customer service, including specialized account managers, an exclusive call center number, and investment advisory for mutual funds. They also receive preferential services from tellers at branches and unique products, such as credit cards with exclusive benefits and preferential interest rates on loans. Almost all of these clients are serviced through specialized remote account managers responsible for improving per-client profitability and achieving long-term relationships through personalized service, cross-selling, and share-of-wallet strategies. The Affluent segment has approximately 354,000 clients, who are served by 368 relationship managers.
Consumer Banking
Our Consumer Banking segment is in charge of developing strategies for the retail customers who are not included in affluent banking or small business banking. Its customer base consists of approximately 13.2 million (only considers clients with at least one product) medium-to-low-income individuals. Consumer Banking focuses on customers who receive their payroll through BCP Stand-alone (which represents around 1.5 million clients). Its strategies vary from basic acquisition of new accounts for wage-earners with special terms regarding fees and interest rates, to more sophisticated, aggressive cross-sell and retention programs that may include non-banking benefits (such as access to discounts on non-banking products) and access to payroll advances.
The main products offered to individuals are:
Mortgage
According to the SBS and the Association of Banks of Peru (Asociación de Bancos del Peru or ASBANC by its Spanish initials), as of December 31, 2025, BCP Stand-alone was the largest mortgage lender in Peru, with a market share of 32.6%.
One of the product lines in BCP Stand-alone’s mortgage lending to low-income customer is loans funded by the credit program of the Peruvian Housing Development Bank (Fondo MiVivienda). The Fondo MiVivienda credit program provides government-funded loans with down payment aid for the purchase of properties valued up to S/362,100 and brings credit risk coverage for the purchase of properties valued up to S/488,800. This program seeks to cover the deficit in housing for lower-income population segments.
According to the Fondo MiVivienda, during the year 2025, BCP Stand-alone made over 3,027 MiVivienda loans, representing the largest number of MiVivienda loans in the financial system.
Mortgage loans are associated with low losses because of their low LTV, as they are backed by the home equity guarantee. These loans have the added benefit of generating opportunities for cross selling other banking products.
Credit Card & Consumer Loans
BCP Stand-alone’s credit card year-end balances increase from S/5,958 million in 2024 to S/6,478 million in 2025, representing an increase of 8.73%. This is attributable to higher sales of Cardholder Loans (Prestamo Tarjetero) and greater billing in the portfolio.
Average gross payment volume increased 15% from 2024 to 2025. As a consequence, our credit card market share in Peru increased 112 bps from 32.2% in December 31, 2024, to 33.3% in December 31, 2025, according to the SBS and ASBANC.
Our focus in 2025 was on strengthen our cardholder benefits of exclusive experiences and concert ticket pre-sales, in addition to increasing the reach and offer of interest-free installment purchases and launching a new benefits program Qore. We have also encouraged the use of digital channels such as mobile wallets and e-commerce purchases.
In 2025, disbursements of consumer loans increased by 19.9% compared to 2024, driven by an improvement in the risk profile of the portfolio, that was primarily attributed to the new disbursements that focused on clients with better credit profiles. We expanded our offerings of leads by 11% year-over-year. Consequently, our average disbursements amounted to S/763 million, up from S/637 million in 2024.
The year-end balance of consumer loans without collateral balances increased from S/7,535 million in December 31, 2024, to S/7,946 million in December 31, 2025, representing a 5.4% increase. This was driven primarily by Affluent and Enalta (8,9% and 21.9% respectively), due to higher sales and lower-than-expected attrition, offsetting the decrease of 6.8% in Consumer. Notably, digital sales accounted for 56.4% of total unsecured consumer loans sold in 2025 from 50.8% in 2024.
The SME segments within RBG are:
SME-Pyme
The SME-Pyme segment served approximately 2.4 million clients as of December 31, 2025. The SME-Pyme credit portfolio totaled S/19,096 million as of December 31, 2025 (compared to S/18,401 million as of December 31, 2024). Additionally, our SME-Pyme segment had a market share of 19.95% in Peru as of December 2025, according to the SBS. In 2025, we continued to serve our clients while digitizing our processes and systems. Finally, in the fourth year using NPS as a new customer satisfaction methodology, SME-Pyme showed clear advances. In the portfolio without a relationship manager, there was an improvement of 4 points year-over-year, and in the portfolio of clients assigned to a relationship manager there was an improvement of 8 points year-over-year.
SME-Business
The SME-Business segment served approximately 15,286 clients as of December 31, 2025. In 2025, SME-Business experienced an increase in loans and deposits, which increased 3% and 11%, respectively, from December 31, 2024, to December 31, 2025, mainly driven by new Impulso MYPERÚ Program loans which make up for Reactiva Peru Loans cancellations (See “Government Program Loans”). Excluding the effects of the Impulso MYPERÚ and Reactiva Peru Programs, SME-Business’s loans balance increased by 15% over the same period.
According to the SBS and ASBANC, BCP Stand-alone closed December 2025 with 34.97% in loan market share in Peru, positioning BCP Stand-alone in first place in market share.
Furthermore, according to our internal customer satisfaction survey led by Ipsos Peru, 86% of our SME-Business clients indicated that they were satisfied with BCP Stand-alone products and services in 2025.
Distribution Channels
Digital channels
•Mobile Banking: In 2025, more than 1,160 million monetary transactions were channeled through mobile banking at BCP Stand-alone, which represented an increase of 43.3% compared to the number of such transactions in 2024. Also, the number of active customers increased by 1.2 million compared to last year, reaching 8.6 million active costumers.
•Internet Banking: Transactions through Internet banking at BCP were at a total of 40.8 million monetary transactions in 2025, which represents an increase of 4.7% compared to the number of monetary transactions registered in 2024.
•Yape: Yape registered higher growth in monetary transactions than any of our other channels from 2024 to 2025, reporting an expansion of 63% in monetary transactions from 6,145.7 million in 2024 to 10,039.1 million in 2025. For additional information about Yape, please see “ – (II.II Yape).”
Self-service channels
•ATMs: In 2025, BCP Stand-alone’s ATM monetary transactions decreased 8.21% from 2024 levels. BCP Stand-alone decreased its ATM pool by 71 from the end of 2024 to close 2025 at 2,402 units.
•Kioskos BCP: Kioskos BCP are digital self-service platforms at which customers can open savings accounts and/or pick up debit cards. Approximately 10 million transactions were conducted through Kioskos BCP in 2025, which represented a 19% decrease from 2024.
Physical channels
•BCP Agentes: BCP Agentes are legally separated points of contact at allied SMEs with which we contract to enable our clients to carry out certain transactions. BCP Agentes continue to constitute a highly effective channel for providing services to our clients given their wide availability in Peru. At the end of 2025, BCP Stand-alone had 10,382 BCP Agentes, less than 2024 as a consequence of the multichannel strategy and the increased digital presence. BCP Agentes conducted 392.9 million monetary transactions in 2025, which represents a decrease of 9.6% compared to 2024.
•Branches: As of the end of 2025, BCP Stand-alone had 316 branches; we have continued the transformation of 300 in our branch network to continue offering a better experience to our clients, achieving the transformation of more than 81% of our offices (with 244 offices transformed by the end of 2025) as well as the change of 154 facades.
(II.II)Yape
Yape has established itself as the leading digital ecosystem for payments and financial services in Peru, driving financial inclusion and creating new revenue streams for Credicorp. By the end of 2025, Yape reached 15.9 million monthly active users (MAU) and 19.1 million registered users, consolidating its position as the most valued and recognized brand in the daily lives of Peruvians, with an average of over 66 transactions per active user per month (+30% compared to 2024). Additionally, the platform processed 10,039.1 million transactions and a Total Payment Volume (TPV) of S/437.7 billion.
The platform is structured around three business lines aligned with our core objectives: (i) promoting financial inclusion, (ii) meeting user needs, and (iii) integrating Yape into everyday life. These lines are:
•Payments: Representing Yape’s primary driver of commission-based revenue, and is supported by a broad suite of functionalities that include bill payments, QR payments, mobile top‑ups, Yape Empresas, remittances, foreign exchange services, and B2C payment solutions. Bill payments remain the most representative product within the business line, posting a significant 67% increase in transaction volume during 2025, reaching 212.6 million transactions.
•Financial Services: Composed of both floating and credits,financial services generates interest income. In 2025, the credit business experienced exponential growth in loan disbursements, exceeding 1.3 million monthly disbursements between single-installment, multi-installment, and SME loans. Over 1 million users accessed their first formal credit within the financial system, of which more than 40% were women—reinforcing our commitment to gender-focused financial inclusion. Building on this momentum, we maintained a robust trend throughout 2025 of expanding multi‑installment credit options, offering higher loan amounts and slightly longer tenors.
•E-commerce: Designed to deepen user engagement by expanding beyond financial services, this segment saw significant growth through Yape Promos, offering exclusive discounts and benefits. The portfolio also includes features such as Yape Tienda, Gaming, Insurance, Ticketing for events and bus travel. Yape Promos continued its consolidation trend, reaching a GMV of S/ 302.2 million in 2025, representing 33% YoY growth.
This sustained growth has been driven by our focus on delivering exceptional user experience, reflected in an NPS consistently above 76 throughout the year and app availability of 99.5%, reaffirming our commitment to customer satisfaction and trust.
Yape plays a key role in our business model by promoting financial inclusion, enabling new sources of income and generating social impact from the core of our operations. It also remains one of the most valued and far-reaching brands throughout the country, thanks to its ability to connect with users and provide a simple, secure, and reliable experience. In 2025, Yape was recognized for the third consecutive year as a leader in customer experience, ranking first in the CX Index and earning awards such as Effie, ANDA, and Total Brands, reaffirming its commitment to excellence, innovation, and emotional connection with its users.
Additionally, Yape’s commitment to sustainable development is reflected in its “Por un Perú Para Todos” strategy, which drives initiatives that: promote financial inclusion and education; foster partnerships to create large-scale impact; and build emotional connections that inspire and motivate Peruvians through positivity.
(II.III)Wholesale Banking Group (WBG)
As of December 31, 2025, wholesale banking loans represented 45% of BCP Stand-alone’s average total loans, while wholesale banking deposits represented 31% of BCP Stand-alone’s average total deposits. WBG competes with local and foreign banks in Peru. WBG’s average loan balances amounted to S/53,613 million as of December 31, 2025 (a 3.2% increase from December 31, 2024), compared to average balances of S/51,940 million as of December 31, 2024 (a 1.9% decrease from December 31, 2023). It also maintained its leadership in the Peruvian Wholesale Banking market with a 37.2% market share in loans, according to the SBS and ASBANC. It has also established longstanding client relationships with major industrial and commercial groups in Peru. The WBG provides its customers with cash management solutions, short- and medium-term loans in local and foreign currencies, foreign trade-related financing, and lease and project financing.
The following table shows the client segmentation of BCP Stand-alone’s WBG segments. This segmentation was a result of an analysis, which addressed multiple factors such as the size and volume of activity for each client, the clients’ affiliation with other companies or groups and their credit ratings.
| | | | | | | | |
| Client Segmentation |
| Business | Group | Client Income/Sales/Total debt |
| WBG (1) | Corporate | Annual sales higher than $100 million |
| (Approximately S/336 million) |
| Middle-Market | Annual sales from $10 million to $100 million
(Approximately S/33.6 million to S/336 million) |
(1)Converted into Soles at the exchange rate of S/3.363 per US Dollar, December 31, 2025, as provided by the SBS.
WBG is divided into the following divisions and support areas:
Corporate and International Division (CID)
The CID served 2,816 clients as of December 31, 2025. The CID provides financing for capital expenditures and investments, sales, international trade, and inventories. It offers medium- and long-term financing, financial leases, and project financing.
The CID’s corporate banking subdivision provides loans and other credit and financial services. This subdivision focuses on serving large companies in Peru, which we consider to be those with annual sales of over US$100 million, corporate governance, audited financial statements, and dominant market positions in their particular brands or product areas. Even if clients do not meet any of these criteria, the CID may provide services to firms under this category if they belong to a large economic group of an important industry to Peru’s economy.
Through the CID, BCP Stand-alone assists its corporate clients with financial services, cash management solutions, and short- and medium-term financing. BCP Stand-alone’s corporate banking loans average balance was S/31,888 million as of December 31, 2023; S/31,436 million as of December 31, 2024; and S/32,305 million as of December 31, 2025.
BCP Stand-alone has a leading position in the Peruvian banking system with 38.1% of the market share for corporate banking loans, according to the SBS and ASBANC, despite the intense competition of foreign banks that may offer lower rates to the market since they finance their operations at lower costs from their headquarters jurisdictions.
International Banking
International Banking and Trade Finance subdivision, which manages relationships with financial institutions (locally and abroad) and provides trade products and international operational services.
BCP Stand-alone’s Correspondent Banking Unit focuses on obtaining and providing short-term funding for international trade, as well as medium-term lines of credit funded by international commercial banks and other countries’ governmental institutions. This unit also earns fees by confirming letters of credit and guarantees issued by international banks and by providing other international payment and trade finance services. The unit also provides funding to some other Latin American banks which send their international trade and guarantee flows to Peru through BCP Stand-alone. BCP Stand-alone’s Correspondent Banking Unit also promotes international trade activities with its local clients by structuring trade products and services, organizing and sponsoring conferences, and advising customers through a wide range of trade products.
Middle-Market Banking Division (MMD)
The MMD served 7,194 clients as of December 31, 2025. Regarding MMD, we note the following:
(i)The MMD serves mid-sized companies, organizations, and institutions. MMD considers a mix of different characteristics in identifying potential clients, such as annual revenues, financial leverage, overall debt, product penetration, and complexity. The MMD clients’ annual revenues generally range between US$10 million to US$100 million and are serviced nationwide by 12 BCP Stand-alone regional managers and multiple industry-focused service teams.
(ii)MMD focuses principally on serving for-profit and non-profit organizations, state-owned companies, and other significant institutions.
(iii)Furthermore, the Institutional Banking Unit, which operates within the MMD, serves 1,144 clients throughout Peru. In Lima, a specialized MMD team serves governmental entities, educational institutions, religious organizations, international bodies, non-governmental organizations, civil associations, and regulated entities, such as microfinance institutions, insurance companies, pension funds, and other private funds. BCP Stand-alone has also deployed specialized MMD teams in the largest provinces in Peru. In the smaller provinces in Peru, MMD is supported by the Retail Banking Division team in attending to our customers' needs.
(iv)Additionally, we also have BCP Xplore, the first exclusive banking for startups and fintech companies in Peru. It was created in 2023 to serve this segment of clients, offering them specialized advice on their needs, specific products and services and help to scale up through strategic alliances and synergies with companies of the Credicorp Group such as Krealo, Yape, among others. As of December 2025, we have 274 clients in the segment and the loan portfolio was S/107 million soles.
Moreover, in 2025, BCP Xplore achieved first place in the ‘Digital Transformation’ category at the Fintech Americas Awards, recognizing the development of four APIs by the Digital Platforms for Businesses Tribe and their successful implementation by BCP Xplore.
(v)The cash management and transactional services subdivision, which operates within the MMD, develops products and services to support clients’ daily cash management activities, collections payments, and investments, among others.
(vi)Leasing subdivision, focuses on providing clients with financial leasing products to acquire and renew their assets, expand plants, production lines, among others, without distracting your working capital.
The MMD loan portfolio (in average balances) was S/21,065 million as of December 31, 2023; S/20,504 million as of December 31, 2024; and S/21,308 million as of December 31, 2025. By December 31, 2025, BCP Stand-alone had a market share of 36.1% in the Peruvian middle-market segment, according to the SBS and ASBANC.
The products offered to middle-market clients are similar to those offered to corporate banking clients. The major types of products are:
(1)Revolving credit lines to finance working capital needs and international trade financing.
(2)Standby letters of credit and bond guarantees.
(3)Structured long-term and medium-term financing, through loans or financial leasing; and
(4)Cash management, transactional products, and electronic banking.
Products and Channels Division
This subdivision is responsible for the development, management and continuous evolution of transactional and credit products, digital platforms and distribution channels for Wholesale Banking clients. Operating through specialized multidisciplinary teams (“Tribes”), it focuses on enhancing customer experience, improving operational efficiency and strengthening the Bank’s digital capabilities, while supporting business profitability, preserving risk quality and addressing evolving client needs. These Tribes are:
(1)Tribe of Business Credit Products: Giving their business clients efficient financial solutions through a unique experience that satisfies their main financing needs.
(2)Tribe of Transactional Products for Businesses: Giving their business clients integral solutions that simplify their cash management processes and generate customer loyalty.
(3)Tribe of Digital Platforms for Businesses: Giving their business clients an outstanding and unique digital experience to become their ‘top of mind’ choice.
(4)Tribe of Supply Chain Finance: Responsible of developing the market potential of the invoice ecosystem.
Supported by specialized talent and key enablers, the subdivision continues to develop initiatives aimed at improving customer experience through more efficient processes and services. These efforts are focused on addressing client preferences by improving business profitability, preserving risk quality and enhancing digital platforms. Key initiatives include:
•Collections process enhancement: Due to greater competition in the non-lending business, we have implemented projects focused on digitalizing our clients’ collections journey, providing them with an improved customer experience and maintaining our leadership position in the Peruvian collection market. During 2025, we deployed campaigns to attract new users and worked closely with Yape to enable its application as an additional channel for our Wholesale Banking clients to collect payments from their customers.
•A unique and powerful digital platform offering: Update of our online banking platform for companies named Office Banking, aiming to deliver the best digital platform in the local financial market that allows us to accompany our clients in all their journeys, offering a digital end to end solution with 24/7 accessibility to our product and services portfolio.
•Operational stability improvement: We aim to ensure the security and availability of our platforms.
•Financial ecosystems and Open API development: We focus on creating an interconnected services network that allows users to satisfy multiple needs through a single integrated digital experience.
Profitability Management
We elaborated on the pricing advisory analysis for lending and non-lending products offered to our clients, with the aim to recommend prices based on a 360-degree view of our clients. In addition, we established monthly management Pricing Committees to help sales teams to implement these pricing recommendations, and to monitor revenues resulting from these actions.
Likewise, we generate a continuous analysis of rate optimization and calculation formulas for our different products; seeking to continuously align ourselves with the best practices of the national and international market. We also focused on pricing digitalization to improve customer experience and convenience. Thus, we worked together with Wholesale Tribes to implement a pricing feature on our digital platform for one of our financing products, allowing some of our clients to self-disburse loans at a predefined price, without requiring further manual intervention by relationship managers.
Finally, we support our clients in their transformation process and search for sustainable impact, providing them with the necessary products at an appropriate price.
Sustainable Finance
In 2025, WBG offered Sustainable Financing instruments to clients, such as green, social, and sustainability-linked loans. Most of these loans were provided through short- and medium-term facilities. Green loans were granted with a use-of-proceeds approach, according to relevant international criteria, enabling our clients to finance projects and activities aligned with categories included in BCP’s Green Taxonomy, such as renewable energy, sustainable agriculture and fisheries, green buildings, and efficient water resource management.
On the other hand, social loans were structured following BCP’s Social Taxonomy, prioritizing initiatives in SME financing, women-led SMEs and education. In 2025, BCP stand-alone has granted sustainable finance transactions for more than USD 3,440 million.
Open Economy
The Open Economy team at BCP was created to enable, through technology and APIs, a banking model fully integrated into the digital ecosystem, aimed at delivering real operational and financial efficiencies for both corporate clients and individuals. Within this framework, the team has become the first bank in Peru to integrate with SAP Multi-Bank Connectivity, enabling companies to automate payments, transfers, and reconciliations directly from their ERPs, reducing operational friction and improving treasury efficiency.
In addition, the team has deployed embedded payment solutions and the distribution of financial products within digital ecosystems, and has activated Open Finance use cases that expand access to financial products and accelerate adoption through strategic partnerships and engagement with corporate clients.
(II.IV)Treasury
BCP Stand-alone’s Treasury function is divided into six primary units: (1) the ALM Group, (2) the Sales and Trading Unit, (3) the Foreign Exchange and Derivatives Distribution Unit, (4) the Structuring and Client Derivative Solutions Unit, (5) the Foreign Exchange Ecosystem, and (6) the Treasury Tribe.
ALM Group
The ALM Group is responsible for managing BCP Stand-alone’s statement of financial position and for taking reasonable interest rate and liquidity risks under the oversight of our Asset and Liabilities Committee (ALCO). The ALM Group is also responsible for managing the investment portfolio, Liquidity Coverage Ratio (LCR) and Capital requirements. In addition, the ALM Group participates in money and debt capital markets, oversees reserve requirements, and manages BCP Stand-alone’s liquidity. The ALM Group has been active in auctions held by the BCRP for certificates of deposit as well as in financing its funding needs, interbank transactions, guaranteed negotiable notes, and other instruments.
ALM Group also maintains corporate responsibilities in Credicorp, aiming to optimize liquidity from a global Credicorp perspective, use corporate capabilities to support subsidiaries in their debt management, manage Credicorp’s foreign exchange risk, as well as its exposures and credit lines with a holistic approach, and ensure optimal capital levels.
Sales and Trading Unit
BCP Stand-alone Sales and Trading Unit manages both foreign exchange and interest rate risk exposure and investments for market making and market timing purposes. The managed risk originates mainly from client liquidity transactions and from open market timing positions. Market risk exposures and limits are independently defined by the Market Risk Unit and closely monitored by the Treasury Risk Unit. Additionally, an Investor Sales team within the Sales and Trading Unit actively reaches out to institutional investors, providing direct access to market maker prices and liquidity. The Sales and Trading Unit includes both a Foreign Exchange Desk and an Interest Rates Desk that manages risk as follows:
•Foreign Exchange: The Foreign Exchange Desk provides liquidity for spot and forward transactions for its clients and other market makers in US Dollar-Peruvian Soles (USDPEN), other Latin American currencies, and G-10 currencies. The Foreign Exchange Trading Desk also manages the foreign exchange volatility
book for USDPEN. Additionally, the desk participates in foreign exchange transactions related to different instruments designed by the BCRP to smooth out any currency volatility.
•Interest Rates (IR): The Interest Rates Desk manages the investments and risk originating from both fixed-income and swap transactions from clients and market timing strategies. BCP Stand-alone’s fixed-income portfolio consists mainly of government bonds (both in local and hard currency) from Latin American countries and US Treasuries. The Interest Rates Desk is one of the main liquidity providers in the Peruvian government bond market, where it is a leading participant of the Market Maker Program of the Ministry of Economy and Finance of Peru (MEF).
Foreign Exchange and Derivatives Distribution Unit
BCP Stand-alone’s Foreign Exchange and Derivatives Distribution Unit helps companies with their foreign exchange needs (spot and hedging) through its Distribution Desk. The broad portfolio of foreign exchange products provided to its client base has allowed the Foreign Exchange and Derivatives Distribution Unit to position itself as a benchmark in the foreign exchange business in the Peruvian market.
Structuring and Client Derivative Solutions Unit
BCP’s Structuring and Client Derivative Solutions Unit is formed by two teams:
The Structuring Team is in charge of developing solutions for clients, often involving derivatives, and providing insight and better understanding of these products to BCP’s commercial teams.
The Client Derivative Solutions Team plays a role similar to the Foreign Exchange and Derivatives Distribution Unit but focuses more specifically on derivatives. It interacts with our customers in order to provide what they demand via a better understanding of their needs and transmitting these to the Structuring Team if the solution is not already available. Another of its aims is to increase the awareness of structured solutions and derivatives within the bank and clients.
Foreign Exchange Ecosystem Unit
The Foreign Exchange Ecosystem Unit is responsible for the strategy of the FX product across the different customer segments and sales channels. It is responsible for the P&L of the Product and the bank’s value proposal for customers as well as for the Innovation and disruption projects that enable the product’s growth and enablement in new channels. It is responsible for the Pricing strategy from an omnichannel perspective as well as for the advertising related to the product.
Treasury Tribe
The Treasury Tribe is responsible for providing technological support to the different units that make up the Treasury function through the enabling of platforms and technological tools; as well as, through the implementation of different initiatives that allow business scalability. The Tribe is made up of six squads — five for the development of initiatives related to products (Exchange, Foreign Exchange & Derivatives, Investments & Funding, Liquidity and ALM) and one for shared requirements across those products.
(III)BCP Stand-alone’s lending policies and procedures
BCP Stand-alone has adopted a risk appetite framework, objective metrics and thresholds to periodically monitor the Bank’s evolving risk profile. The framework was approved by the Bank’s Board of Directors and is managed and monitored by the Risk Management Division within BCP Stand-alone’s Central Risk Management Group. The adoption of a risk appetite framework reflects BCP Stand-alone’s commitment to aligning its forward-looking business strategy with the Group’s risk vision.
BCP Stand-alone’s uniform credit policies and approval and review procedures are based upon conservative criteria. These policies are administered in accordance with guidelines established by the Peruvian financial sector laws and SBS regulations. For further information, see “ITEM 4. INFORMATION ON THE COMPANY – 4.B Business Overview – (6) Supervision and Regulation”.
BCP Stand-alone’s credit approval process is based primarily on an evaluation of each borrower’s repayment capacity and commercial and historical credit behavior. BCP Stand-alone determines a corporate borrower’s repayment capacity by analyzing the historical and projected financial condition of the company and of the industry in which it operates. Other factors that BCP Stand-alone analyzes include the company’s current management and the quality of any collateral to be provided. In addition, BCP Stand-alone’s credit officers analyze the corporate client’s ability to repay obligations, estimate the probability of default of the client using an internal risk rating model, and define the maximum credit exposure that BCP Stand-alone wants to hold with the client.
The standardization of our risk model building and monitoring practice, the inclusion of new sources of information and innovative statistical techniques including MLOPs (Machine Learning Operations), have contributed to improve the scope, accuracy and speed-to-market of our modelling capabilities to drive decision-making in the credit process, such as origination, monitoring, and recovery. In particular, more complex models with enriched data allow for the inclusion of lesser-known customers into the BCP Stand-alone portfolio and the more precise estimation of income and sales, which otherwise would have been done by traditional means. These models are continuously monitored in order to assess their accuracy and revised if necessary.
BCP stand-alone evaluates admission and portfolio management processes through scoring and rating models, whose default probabilities are used for credit evaluation. These admission models, along with the guidelines (policies) for granting credit (which include, among other issues, the client's financial history, payment capacity and the degree of knowledge of the client), are defined by risk units according to the guidelines approved by the different risk committees of the Group companies. Most sophisticated decisions about loan applications are made by loan officers who use various credit tools for their evaluations. During 2025, changes in risk management have focused on 4 components: i) more granular monitoring of our risk models and generation of earlier alerts, ii) improvement of our income estimators for expanding loan origination both on SME and Consumer Finance, iii) greater understanding of the profile of vulnerable subsegments or those that may begin to show signs of deterioration and iv) expansion on loans origination with digital underwriting processes for SME.
BCP’s Retail Risk Division completed its sixth year operating in an agile framework, in which tribes and squads follow an agile operating model that allows them to plan, prioritize and focus on initiatives that directly contribute to established objectives as well as providing flexibility and agility in order to create value for our clients.
Under the agile framework, tribes and squads consist of diverse team members such as risk specialists, data scientists and risk policy implementation members among others that previously worked separately and more remotely in distinct units. Operating under cross-functional squads has created a better understanding and alignment of goals in a timely schedule, through increased and improved communication and collaboration. Squads achieve a faster and more effective exchange of data, information, and knowledge. Consequently, BCP’s Retail Risk Division has used this framework to enhance the bank’s abilities to more precisely and timely identify and assess the specific segments and subsegments that may require adjustments in credit policies and processes in order to be optimally managed.
Our performance in the small business and personal lending areas depend largely on BCP Stand-alone’s ability to obtain reliable credit and client information about prospective borrowers. BCP Stand-alone has a large body of transactional information that is used in credit risk models. Also, the SBS has an extensive credit bureau, which has expanded its credit exposure database service to cover businesses and individuals that have borrowed any amounts from Peruvian financial institutions.
BCP Stand-alone periodically reviews the payment behavior of its diverse portfolios and segments with a deep level of granularity as part of its monitoring process. These assessments allow for the early identification, evaluation, and management of changes in credit quality, which leads to a timely evaluation and calibration of the expected loss models. In order to ensure the appropriate levels of accuracy and performance of our admission and behavior models, we keep developing methodological improvements, that include the expansion of our universe of data and variables, as well as the introduction of adjustments for economic trends or volatility (e.g., inflation).
BCP Stand-alone has a strictly enforced policy that limits the lending authority of its loan officers. It also has procedures to ensure that these limits are adhered to before a loan is disbursed. Under BCP Stand-alone’s credit approval process, the lending authority for WBG is centralized into a specialized credit risk analysis division. This division is operated by officers and committees that have specific lending limits set by clients and economic groups. Likewise, for RBG, there is another specialized credit risk analysis division that also operates with lending limits by product portfolio. In
addition to the controls built into the loan approval workflow systems, the credit risk management divisions and internal auditors regularly review credit approvals to ensure compliance with lending policies.
For the WBG, in accordance with international standards, BCP Stand-alone has established lending authority limits based on risk rating (probability of default) and particular guarantees of the borrower. Requests for credit facilities in excess of the limits set for credit officers are reviewed by the Credits Committee, Executive Committee or, if the amount requested is sufficiently large, by BCP Stand-alone’s Board of Directors. In addition, BCP Stand-alone has concentration limits in the loan portfolio by industry, which is based on its target risk appetite and market share.
BCP Stand-alone believes that an important factor to maintain the quality of its loan portfolio is the selection and training of its loan and risk officers. BCP Stand-alone requires loan officers to have degrees in economics, accounting, business administration or related fields from competitive local or foreign universities. In addition, training for new loan officers begins with a three-month program that covers all aspects of banking and finance. Subsequently, loan officers receive training in specific matters throughout their careers at BCP Stand-alone. Laterally hired officers are generally required to have prior experience as loan officers.
BCP Stand-alone operates in substantial part as a secured lender. As of December 31, 2025, approximately S/54.2 billion of its loan portfolio and off-balance-sheet exposure was secured by collateral, which represents 38.3% of its total loan portfolio excluding overseas branch office BCP Panama and overseas agency BCP Miami, as compared to 42.1% in 2024 and 43.1% in 2023. The decrease since 2020 was driven in large part by the repayment of loans guaranteed under the Reactiva Peru Program (which provides coverage of between 80% and 95% of principal value). Excluding loans guaranteed under the Reactiva Peru Program, 38.3% of the portfolio was secured by collateral in 2025 as compared to 41.8% in 2024.
Liquid collateral is a small portion of BCP Stand-alone’s total collateral. BCP Stand-alone requires collateral for the extension of credit depending on the risk profile and the business segment of the client, among other factors. When BCP Stand-alone requires collateral, it is usually valued at between 110% and 150% of the principal amount of the credit facility granted. The appraisal of illiquid collateral, in particular real estate assets, machinery and equipment, is performed by independent experts. BCP Stand-alone’s internal audit division conducts selected revisions and analyses on borrowers’ financial statements, consistent with the local banking regulations of the jurisdictions in which it operates.
In BCP Stand-alone’s credit monitoring unit, we continue to improve the anticipation of credit deterioration for Wholesale Banking and Business Banking customers. In addition to reactive alerts, we now have proactive alerts in our process, which notify us about the possible deterioration of clients that could occur in the next six to twelve months. This model uses transactional flows (cash flows in checking accounts, both incoming and outgoing), and we are also employing sector-specific alerts.
Furthermore, we have a sector taxonomy for risk management in case of unexpected events. This map is prepared by segmenting the portfolio by economic activities and identifying the risks for each sector.
2.1.2BCP Bolivia
(I)BCP Bolivia Overview
BCP Bolivia’s activities include wholesale banking and retail banking. As of December 31, 2025, BCP Bolivia had total assets of S/10,865.5 million, which include total loans of S/7,369.1 million, customer deposits of S/8,993.6 million, and shareholders’ equity of S/870.0 million. BCP Bolivia’s ROAE of December 31 was 13.3%.
As of December 31, 2025, BCP Bolivia’s loans represented approximately 8.9% and its deposits 9.0% of total loans and total deposits in the Bolivian banking system, respectively, according to ASFI.
The following table shows the BCP Bolivia’s client segmentation. This segmentation is a result of an analysis which addresses multiple factors such as the size (by income, sales, and/or debt) and volume of activity for each client, the clients’ affiliation with other companies or groups, and their credit ratings.
| | | | | | | | |
| Client Segmentation (1) |
| Business | Group | Income/Sales/Total Debt |
| Wholesale Banking | Large companies (2) Medium companies (3) | Annual sales higher than approximately US$15 million
Annual sales from approximately US$1 million to US$15 million |
| Retail Banking (5) | Small business (5) Micro business (5) Consumer (6) Mortgage Banking (7) | Annual sales from approximately US$0.03 million to US$1 million
Annual sales of at least approximately US$0.03 million
Payroll workers and self-employed workers
Payroll workers, independent professionals, and business owners |
(1)Exchange rate of Bs./8.4140 per U.S. Dollar, December 31, 2025 - ASFI.
(2)Loans to Large companies account for 45% of BCP Bolivia’s total loans. This segment accounts for approximately 247 customers.
(3)Loans to Medium companies account for 13% of BCP Bolivia‘s total loans. This segment accounts for approximately 386 customers.
(4)As of December 31, 2025, retail banking loans accounted for 42% of total loans of BCP Bolivia, while retail banking deposits accounted for 24% of BCP Bolivia's total deposits.
(5)Small and Micro business banking accounts for 8% of total loans of BCP Bolivia, small business banking serves approximately 8,013 clients while Micro Business serves approximately 11,768 business clients.
(6)Consumer banking accounts for 9% of total loans of BCP. Its customer base consists of approximately 66,404 Payroll and self-employed workers. Our strategies are based on cross-selling and retention programs that expand benefits to non-banking products.
(7)This segment serves 9,171 customers, representing 25% of BCP’s total loans.
(II)BCP Bolivia Strategy
Our purpose is “To Give Opportunities”. We aim to make our stakeholders' dreams possible, encouraging and generating opportunities that allow them to build their future, while contributing to the development and growth of the country.
At BCP Bolivia, we have key objectives that guide our journey: (i) managing a profitable loan portfolio among peers, (ii) being number one in customer experience, (iii) being number one in digital solutions, (iv) being leaders in innovation, and (v) being the main payment network in Bolivia. To meet these objectives, we work with two enablers: (i) data and analytics, and (ii) talent.
Distribution Channels
Digital channels
•Yape: As part of our commitment to increasing access to banking products and services, BCP Bolivia fosters the development of an ecosystem for digital payments with the mobile app Yape, which at the end of December 2025 had 3.9 million users. In 2025, transactions via Yape represented 78% of BCP Bolivia’s total monetary transactions (up from 66% in 2024).
•Mobile banking: Monetary transactions executed through mobile banking represented 13% of BCP Bolivia’s total monetary transactions in 2025 (down from 16% in 2024).
Self-service channels
•ATMs: BCP Bolivia had 316 units on December 31, 2025, which accounted for 3% of its total monetary transaction volume in 2025 (down from 6% in 2024).
Physical channels
•BCP Agentes: BCP Bolivia increased 667 BCP Agentes in 2025, bringing the total number of BCP Agentes to 2,501 as of December 31, 2025. Monetary transactions through BCP Agentes represented 5% of BCP Bolivia’s total monetary transactions in 2025 (down from 8% in 2024).
•Branches: BCP Bolivia reported a total of 46 branches as of December 2025. Monetary transactions in BCP Bolivia’s branches continued to decline in 2025 and represented only 0.3% of BCP Bolivia’s total monetary transactions in 2025 (down from 1% in 2024).
2.2Microfinance
(I)Microfinance Overview
The Microfinance LoB is focused on offering commercial banking activities and specialized financial services to small and micro business clients in Peru and Colombia through Mibanco. Mibanco Colombia was created in October 2020 after a reverse merger between Edyficar S.A.S. (whose commercial name was Encumbra) and Bancompartir (the surviving entity). The Mibanco franchise has a loan portfolio of S/15,922 million and approximately 4.0 million clients, representing around 7.9% of Credicorp’s total assets and 8.3% of the equity attributable to Credicorp’s equity holders. As of December 31, 2025, Mibanco Peru represented around 85.5% of the total loans of the Microfinance LoB.
For further information see “ITEM 4. INFORMATION ON THE COMPANY – 4.A History and development of the Company”.
Mibanco’s Purpose
Mibanco’s purpose is to transform lives and accompany our clients as they write their success stories. By doing so, we expand responsible financial inclusion in the markets in which we operate. Microfinance is a social business, and its success depends on the social development of our clients, employees, and communities.
Transformation Strategy
Mibanco’s transformation strategy has focused on migrating its traditional business model, which is intensive in people and offices, to a multichannel hybrid model supported by data and analytics. The hybrid model, implemented without compromising Mibanco’s differentiated focus on the customer, has resulted in increased efficiencies, allowing Mibanco to strengthen relationships with its clients, while also expanding its potential reach. Now we are evolving the hybrid model to offer a comprehensive and differential value proposition.
This model is anchored by the high-touch relationship that Mibanco strives to retain with its clients and is based on three main capabilities:
•Centralized intelligence for risk assessment
•Alternative distribution channels
•Commercial execution by our relationship managers
This approach will be enabled by a combination of five key areas:
•Data and analytics
•Risk models
•Cybersecurity
•IT architecture
•Strategic design
We are deploying Mibanco’s transformation strategy, which has enabled us to consolidate our hybrid model. We are strengthening risk management to accelerate growth and profitability. We aim to build more diversified and resilient business models by leveraging the Credicorp ecosystem and creating synergies with the group’s companies in the medium term, with the objectives of increasing our low-cost deposit portfolio and boosting revenues from sales of products and services that are decoupled from credit. Currently, we are migrating to a more profitable credit operation by increasing the share of small ticket loans (< 20 thousand of soles) and improving the spread for loans with larger tickets (from 20 to 150 thousand of soles). These efforts are aligned with our aspiration to provide clients a comprehensive value proposition, where centralized intelligence plays a role in generating offers for loans, liability products and transactional services. Our centralized intelligence allowed us to adjust commercial guidelines and mitigate the impact of portfolio deterioration. We believe we closed the year with stronger capacities and are better prepared to implement more preventive models and conduct more granular follow-up on the portfolio’s behavior. Additionally, we believe the experience for our clients
improved, as demonstrated by increases in our client NPS (Net Promoter Score) by 7.3 percentage points to stand at 51.4 in 2025. We believe we are now better prepared to achieve growth in 2026.
In Peru alone, there are almost 7.3 million unbanked entrepreneurs across the country, which we are best positioned to reach based on our countrywide and digital network. We believe there is a comparable market opportunity in Colombia, which has a microfinance sector of similar size to Mibanco Peru’s loan portfolio but an economy with approximately 1.4 times the GDP of Peru’s. We believe there is an opportunity to replicate, through the “Mibanco Way”, the improvements that we are already seeing in Peru in terms of productivity, cost of risk and efficiency.
2.2.1Mibanco Peru
The following table shows how Mibanco segments its clients. This segmentation is based on an analysis that considers multiple factors, such as business size and client income, sales, and/or total debt, among others, as well as the client’s affiliation with other companies or groups and their credit ratings.
| | | | | |
| Client Segmentation (1) |
| Group | Income/Sales/Total debt |
SME – medium (2) SME – small (3) Microbusiness (4) Consumer (5) Mortgage (6) | Annual sales from S/5 million up to S/20 million
Annual sales up to S/5 million and total debt higher than S/20,000
Annual sales up to S/5 million and total debt up to S/20,000
Focus on debt unrelated to business
Focus on individuals for the acquisition and construction of homes and granting mortgages |
(1)As of December 31, 2025, Mibanco had 887,280 registered clients with a credit. All portfolio percentages and customer counts in this table and the associated notes are as of December 31, 2025, unless otherwise disclosed.
(2)Mibanco’s SME – medium segment focuses on financing production, trade, or service activities for companies that have annual sales from S/5 million up to S/20 million in last year. This segment represents 0.03% of Mibanco’s total loans and 35 of its clients.
(3)Mibanco’s SME – small segment focuses on financing production, trade, or service activities for companies that have annual sales up to S/5 million in last year and total debt higher than S/20,000 in the last six months (without including mortgage loans). This segment represents 80.16% of Mibanco’s total loans and 291,677 of its clients.
(4)Mibanco’s microbusiness segment focuses on financing production, trade, or service activities for companies that have annual sales up to S/5 million in last year and total debt up to S/20,000 in the last six months (without including mortgage loans). Microbusiness loans represent 14.04% of Mibanco’s total loans and 479,581 of its clients.
(5)Mibanco’s consumer segment focuses on financing individuals to cover payments of goods and services or expenses unrelated to business. Consumer loans represent 3.14% of Mibanco’s total loans and 115,087 of its clients.
(6)Mibanco’s mortgage segment focuses on financing individuals’ acquisition, construction, renovation, remodeling, expansion, improvement, and subdivision of homes. Mortgage loans represent 2.63% of Mibanco’s total loans and 3,730 of its clients. Mibanco’s mortgage segment has a policy of limiting LTV to up to 90%.
Distribution Channels
Digital channels
•Mibanco Mobile App: In 2025, 18.1 million transactions were processed through Mibanco’s Mobile App, which represented an increase of 4.6% compared to the 2024 total. Additionally, 300,378 loans were requested through the app in 2025 (S/985.3 million in disbursements in 2025).
•Mibanco Web: Mibanco’s website processed 0.5 million transactions in 2025, which represented a decrease of 29% compared to 2024. Additionally, 18,675 loans were requested through the web in 2025, for which Mibanco had disbursed S/51.5 million in 2025.
•Yape: Since June 2020, Mibanco’s clients have been able to open a Yape account linked to their bank account. As of 2025, 120,416 clients transacted through Yape using their Mibanco bank account linked to their Yape account.
Physical channels
•Agentes Kasnet: As part of the services offered to its clients, Mibanco has an agreement with Agentes Kasnet, a network of Multibank correspondents in Peru. As of December of 2025, 11,768 Agentes Kasnet were available for Mibanco clients.
•Branches: As of December 2025, Mibanco had 282 branches; 244 were own branches while 38 belonged to Banco de la Nacion, a Peruvian state-owned bank that offers services to Mibanco clients under a special agreement.
2.2.2Mibanco Colombia
The following table shows how Mibanco Colombia segments its clients. This segmentation is based on an analysis that considers multiple factors, such as business size, client income, assets and/or total debt, among others, as well as the client’s affiliation with other companies or groups and their credit ratings.
| | | | | |
| Client Segmentation |
| Group | Income/Sales/Total debt (1) |
Commercial (2) Micro (3) Consumer (4) Mortgage (5) | Debt not categorized as micro, consumer, or mortgage.
Total debt up to 120 statutory minimum wages (equivalent to S/149,980).
Focus on debt unrelated to business.
Focus on individuals for acquisition, construction of homeownership and granted with mortgages. |
(1)Converted into Soles at the exchange rate of S/. 0.000891 per Colombian Peso as of December 31, 2025. As of December 31, 2025, Mibanco had 168,427 registered clients. All portfolio percentages and customer count in the table and the associated notes are as of December 31, 2025, unless otherwise disclosed.
(2)Mibanco’s commercial segment focuses on all credits other than Micro, Consumer and Mortgage. Commercial loans represent 21.7% of Mibanco’s total loans and 7,964 of its clients.
(3)Mibanco’s microbusiness segment focuses on financing production, trade, or service activities for companies that have total debt up to 120 statutory minimum wages (approximately S/149,980 thousand) and workers up to 10. Microbusiness loans represent 76.8% of Mibanco’s total loans and 159,049 of its clients.
(4)Mibanco’s consumer segment focuses on financing individuals to cover payments of goods and services or expenses unrelated to business. Consumer loans represent 0.1% of Mibanco’s total loans and 304 of its clients.
(5)Mibanco’s mortgage segment focuses on financing individuals’ acquisition, construction, renovation, remodeling, expansion, improvement, and subdivision of homes. Mortgage loans represent 1.5% of Mibanco’s total loans and 1,110 of its clients.
2.3Insurance & Pensions
2.3.1Grupo Pacífico
(I)Grupo Pacífico Overview
We conduct our insurance business exclusively through Grupo Pacífico, which operates in Peru and Bolivia and was the second-largest Peruvian insurance company by written premiums in 2025, according to the SBS and Peru’s National Health Superintendence (Superintendencia Nacional de Salud or SUSALUD by its Spanish Initials). Grupo Pacífico provides a broad range of insurance products focusing on three business areas: P&C insurance business, life insurance business and corporate health insurance and medical services. Grupo Pacífico, like other major Peruvian insurance companies, sells its products both directly (through its own sales force) and through independent brokers, bancassurance and sponsors.
For further information see “ITEM 4. INFORMATION ON THE COMPANY – 4.A History and Development of the Company”.
Purpose: Protect People's Happiness
Grupo Pacífico’s purpose is to protect people’s happiness. Looking forward, we will sustain growth by offering new and inclusive products that meet our country's needs at different stages of people's lives, protecting more Peruvians' peace of mind and well-being.
To achieve this vision, the goal is to lead the transformation of the insurance market by leveraging Credicorp's strength and building an integrated ecosystem of services. This approach will enable personalized and proactive protection in real time, ensuring that we safeguard what truly matters: the happiness and well-being of each person.
To fulfill our purpose, we have defined three areas of focus, our north stars: growth, experience, and efficiency.
Our North Stars:
•Growth:
•To boost sales and enhance customer protection, we aim to develop new products, establish additional distribution channels, and leverage our Credicorp channels. Our strategy focuses on premium growth exceeding the local market in personal insurance lines.
•Customer Experience:
•To achieve the highest NPS in the market by delighting our customers with an extraordinary journey and placing them at the heart of everything we do.
•Efficiency:
•To maintain market leadership in efficiency, allowing us to provide the best protection to our customers and deliver value to all our stakeholders.
These north stars are propelled by the development of strategic enablers:
Strategic Enablers:
•In 2025, these enablers have driven innovation and operational efficiency:
◦Digital Architecture: Enable architecture with platforms and solutions to deliver digital products using decoupled connections, accelerating capabilities with artificial intelligence, outstanding talent, and becoming a regional benchmark in the practice of DevSecOps (a software development approach that combines security, development, and operations).
◦Data & Analytics: Enable business strategies and initiatives through advanced analytics and AI, with maximum adoption and value generation, to transform Pacífico into a world-class organization in the use of data. Regarding Data & Analytics (D&A), the profit generated by the end of 2024 was S/ 31.6 million, and by 2025, it reached S/ 74.8 million. Also 46% of issued policies have been enabled through D&A (compared to 34% in 2024).
◦Pricing: Turn price management into the most dynamic and powerful lever for growth and profitability through models and technologies that develop and deliver the optimal price to our customers and distribution channels. Regarding pricing, the profit generated by the end of 2024 was S/ 28.7 million, and by 2025, it reached S/ 52.1 million.
◦Talent: Attract, develop, and retain the best talent, leveraging purpose and agile principles to accelerate the achievement of Pacífico's business strategies.
Distribution Channels
Digital channels
•Mi Espacio Pacífico App: In 2025, 750 thousand clients used Grupo Pacífico’s app, compared to 620 thousand in 2024.
•Pacífico Web: In 2025, over 16.1 million visits were made to Grupo Pacífico’s website, compared with the 13.9 million visits reported in 2024.
Physical channels
•Branches: At the end of 2025, Grupo Pacífico had 8 branches, (compared to 7 branches in 2024 and in 2023). The company has continued providing its clients with the services they need. Grupo Pacífico implemented a specialized call center with 14 executives and 2 supervisors, all working on-site, in order to continue providing its clients with the services they need.
As a result of the digitalization of our distribution channels, we currently have an NPS of 53 (compared to 48 in 2024) and a claims NPS of 65 (compared to 62 in 2024), along with AI-powered claims approval for vehicle, home, and life insurance products.
Corporate Health Insurance and Medical Services
The Group operates one of the largest private networks of medical facilities in Peru. Its healthcare delivery platform includes a network of hospitals and outpatient medical facilities operating under two main brands, San Felipe and Sanna. The network currently comprises of seven hospitals and nine outpatient medical centers, with hospitals located in Lima, Piura, Trujillo and Arequipa.
The Group’s hospitals provide a comprehensive range of healthcare services, including ambulatory care, emergency services and inpatient hospitalization, supported by operating rooms, hospital beds and diagnostic infrastructure. In addition to its hospitals and outpatient facilities, the Group operates ancillary healthcare services, including two clinical laboratories (ROE and Precisa), an oncology center (Aliada), dental care centers (COA) and a medical materials distributor (Prosemedic).
These medical facilities serve patients covered by private insurance plans, as well as patients who pay directly for services. Revenue is generated primarily through fee-for-service arrangements, service agreements with private health insurers and direct out-of-pocket payments. The operation of this network involves the management of physical healthcare infrastructure that specializes in clinical personnel and regulated healthcare delivery processes, which exposes the Group to clinical operations and a regulatory framework distinct from those of financial or insurance-only activities.
Credicorp, through its subsidiary Pacifico Seguros has been an active player in the health sector for more than 25 years, managing Pacifico EPS since 1999 and later on building the healthcare network.
The healthcare sector is strategic to the insurance business in Peru: (i) as part of the total offering to clients and to better manage the business in terms of efficiency, claims management, and diversification; and (ii) as a strategic hedge across our business portfolio.
In December 2014, Credicorp signed an agreement with Banmédica to jointly develop the health insurance and healthcare industry in Peru by merging their existing operations. Joint operations began in January 2015.
Pacifico Seguros contributed its private corporate health insurance business and medical services, including the Sanna network, to this joint enterprise while Banmédica contributed Clinica San Felipe and Laboratorios ROE.
After a 10-year partnership in Pacifico EPS and in the Medical Assistance business, both partners, through the joint venture, already have extensive knowledge and experience in the health insurance and healthcare sectors in Peru.
In 2025, Credicorp acquired Banmédica’s 50% stake in Pacífico EPS and terminated the agreement in Medical Assistance business between Banmédica and Pacífico Seguros.
This is a natural acquisition for Credicorp, that reinforces our long-term commitment to continue to develop the insurance and health-care businesses in Peru, offering high standard products and quality service.
(II)Risk Rating
Grupo Pacífico managed to reaffirm the solidity and solvency of the company, maintaining its international credit ratings despite the Peruvian context. AM Best affirmed Grupo Pacífico’s long-term issuer credit rating at “A-” with a stable outlook in December 2025, Fitch affirmed Grupo Pacífico’s credit rating at “BBB+” with a stable outlook in June 2025 and Moody’s affirmed Grupo Pacífico’s credit rating at “Baa2” with a stable outlook in February 2025.
2.3.2Prima AFP
(I)Prima AFP Overview
Credicorp conducts its pension business through Prima AFP, the second largest player in the private pension system in Peru based on the amount of assets under management according to the SBS. Prima AFP manages individual capitalization accounts and provides its affiliates with retirement, disability, survival and burial benefits. For this purpose, Prima AFP collects mandatory and voluntary contributions from its affiliates and invests the funds in local and global markets. The funds that Prima AFP holds in custody for its affiliates are non-attachable and are autonomous assets, which are not affected by Prima AFP’s financial results. Prima AFP offers four types of funds, which differ by the level of risk. The investment and risk management policies are defined by internal committees and supervised by the SBS and the SMV.
For further information see “ITEM 4. INFORMATION ON THE COMPANY – 4.B Business Overview – (5) Competition – 5.3 Insurance & Pensions – 5.3.2 Prima AFP” and “Item 4. INFORMATION ON THE COMPANY – 4.B Business Overview – (6) Supervision and regulation – 6.2. Subsidiaries – 6.2.1 Peru”.
Prima AFP’s strategy is focused in three objectives: (i) sustainable growth, (ii) deliver exceptional customer experience and (iii) build and maintain trust among our affiliates.
In 2025, Prima AFP pursued the following strategic projects:
•Digital First service model.
•Agile and efficient operating model.
•Culture that adapts and thrives in the face of change.
On September 18, 2025, Congress approved the extraordinary and optional withdrawal of private pension funds up to four tax units (UIT), equivalent to approximately S/21,400. The official schedule for submitting requests began on October 21, 2025, following a staggered calendar based on the last digit of the national ID, and later transitioned to a “free period” starting December 4, allowing all affiliates to register without restrictions until January 18, 2026. Requests were required to be submitted through the official AFP platforms, and disbursements are made in four installments of up to one UIT each, spaced 30 days apart. According to the SBS, this eighth withdrawal could mobilize more than S/18 billion over the SPP.
Distribution Channels
Digital channels
•Prima AFP’s App: In 2025, Prima AFP’s mobile application registered approximately 684,600 sessions, reflecting continued adoption and growth compared to 458,100 sessions in 2024.
•Prima AFP’s Web: Website activity reached 7.9 million sessions in 2025, representing a 49% year-over-year increase,
Physical channels
•Agencies: Prima has 1 office located in Lima, Peru.
2.4Investment Management and Advisory
Credicorp Capital carries out its Investment Management and Advisory operations through Credicorp Capital Peru, Credicorp Capital Colombia, Credicorp Capital Chile, Credicorp Capital US, CC Asset Management Mexico, ASB Bank Corp. and their respective subsidiaries. With operations in 6 countries, we are consolidating our leadership position through four main business units: Asset Management, Wealth Management, Capital Markets, and Trust Services.
Our Purpose
“We build trust-based relationships to promote well-being today, leading to a sustainable and inclusive tomorrow.”
Building trust-based relationships is the essence of our contribution to our customers. Trust is the cornerstone upon which we build relationships across generations, manage investments that fulfill dreams, and provide financial solutions that enhance business and wealth strategies.
We aim to foster and share our customers' deepest desire: Their well-being. We truly believe that behind a simple investment or a complex financial solution, there is always a goal, a project, or a dream aiming for the individual, family, and/or business well-being of those we have the privilege to advise. Contributing to this goal is the driving force behind everything we do.
None of the above is possible without a sustainable and inclusive future. Thus, we want to contribute today, along with our customers and talented team, to the creation of that sustainable and inclusive tomorrow. We do this through our responsible and sustainable investment proposals; our contribution to accessibility, simplicity, and financial advice, and a transparent, equitable, and respectful approach to building long-term relationships.
Our Principles
1.We put customers at the center: Our decisions are customer-oriented, whether they have a direct or indirect impact on our customers' experience with us and on our long-term relationship with them, regardless of the area to which we belong.
2.We move with agility and innovation: We work in an agile and flexible manner, with a sense of urgency in decision-making. We challenge ourselves to propose innovative solutions in response to the changing demands of the environment and the growing requirements of our customers in a timely and effective manner.
3.We take ownership: We promote ownership, empowerment, and accountability as the drivers of our culture. These are represented in our initiative to take on commitments, delegate effectively, and take responsibility for the results.
4.We collaborate across borders: We are a great team, working together without any country or role constraints to serve customers and create value, which are common goals for everyone in the company.
5.We make a conscious impact: All our actions are carried out with an awareness of their impact in creating value for the company, our people, society, and the planet.
Our Strategy
In recent years, we have faced significant shifts in market conditions and industry trends, operating in a highly challenging environment that prompted us to reflect and redefine our strategic approach. In 2023, we reorganized our business to achieve more stable, scalable revenue growth and more sustainable profitability levels.
Our North Stars
•Growth
•Profitability
•Customer Experience
Our strategy is built on five pillars:
i.Focus our business portfolio on less volatile and scalable businesses such as Wealth and Asset Management, complemented by transactional capabilities in Capital Markets. We will focus on those
businesses that account for over 85% of the company's contribution margin and for consistent growth in the past years,
ii.Develop and strengthen management capabilities to effectively execute plans and deliver results. This includes implementing a new governance model, a rigorous performance management framework, and fostering a culture of empowerment and accountability to enable streamlined decision-making.
iii.Continue investing in operational and technological capabilities as strategic enablers to consolidate our regional model and achieve efficient, scalable growth.
iv.Leverage our experience and lessons learned from three integration processes to explore and capitalize on new inorganic growth opportunities, allowing us to diversify beyond current businesses into new segments and/or geographies.
v.Evolve our organizational culture by redefining our identity, purpose, aspirations, and cultural principles to adapt to a new context.
Our Business Units
Asset Management
Credicorp Capital Asset Management provides investment management, administration, advisory, and distribution services of funds, products, investment trusts, and third-party funds. Through its regional platform, it offers a broad range of investment solutions for retail, high-net-worth corporate and institutional clients, including mutual funds or collective investment funds, funds and investment trusts, portfolios or mandates, and structured products that invest in fixed income, listed equities, mixed income instruments, and alternative assets.
Additionally, Credicorp Capital Asset Management acts as the exclusive distributor of traditional and alternative third-party funds in Latin America, representing global asset managers under exclusivity agreements. It also provides advisory services in the selection and monitoring of third-party funds for Wealth Management clients. Most of its clients are in Latin America -primarily in Peru, Chile and Colombia - while it also serves international customers with an interest in Latin American markets. Finally, Credicorp Capital Asset Management offers specialized advisory and outsourcing services covering the different stages and components of the investment management process.
Credicorp Capital Asset Management’s business is divided into four teams: Investments, Alternative Investments, Institutional Distribution, and Investment Products. Management operates under a matrix structure, with regional team leaders and country leaders in Chile, Colombia, and Peru, where the teams are based, and it also has presence in Mexico and the United States. The local presence of these teams, combined with an extensive network of local and regional contacts, provides a deep understanding of the dynamics of the Latin American market.
•Investments: This team manages mutual funds and mandates in fixed income, equity and mixed-income assets in Chile, Colombia, and Peru, as well as offshore funds domiciled in the Cayman Islands and Luxembourg for international clients.
•Alternative investments: This team oversees alternative investment funds in real estate assets, private debt and infrastructure.
•Institutional Distribution: This team is responsible for business development and engagement with institutional and wholesale investors in Chile, Colombia, Peru, Panama, and Mexico through global public and private market solutions.
•Investment Products: This team provides services related to the selection of third-party funds, the design of structured products, and support for funds domiciled abroad. Its regional coverage includes Wealth Management clients as well as institutional and retail investors.
Wealth Management
Credicorp Capital Wealth Management business provides advisory and wealth management services, complemented by a broad range of investment options and financial solutions tailored to clients' objectives and specific requirements. Its approach seeks to safeguard client’s wealth and manage it effectively to ensure a seamless transfer to future generations.
The Wealth Management structure is organized under a matrix model, by business and by country, with the purpose of achieving a regional strategic vision while incorporating local perspectives to deliver solutions that best meets clients’ needs.
Services are targeted at clients with more than US$1 million in investable assets. The five main services offered include: Investment Advisory, Credit Solutions, Wealth Planning, Financial Planning, and Multi-Family Office services, provided through Vicctus Multi-Family Office for clients with liquid assets exceeding US$10 million.
Capital Markets
Credicorp Capital’s Capital Markets business unit plays an active role in secondary markets, particularly in equity and fixed-income products, as well as in currencies and derivative instruments. It offers brokerage and custody services for securities to institutional, corporate, and individual clients in Chile, Colombia, Peru, Panama, and the United States. The unit also provides advisory and information services, equipping clients with decision-making tools such as market reports and recommendations.
Credicorp Capital also participates in the placement of equity and debt instruments in primary markets for corporate issuances in local markets. Additionally, it manages arbitrage, directional, spread strategies for proprietary trading in Chile, Colombia, Peru, and Panama (through ASB).
Capital Market’s services include local and international intermediation for fixed income, equities, foreign currency, ETFs, and derivatives; product distribution such as funds, structured notes; primary placement of public and private securities for entities seeking financing. In certain markets, the unit also provides cash management, fund distribution, basic custody, and leverage activities with collateralized securities.
In Colombia, Credicorp Capital Corporación Financiera offers savings accounts and USD/COP forwards to local and international corporate and institutional clients. These forwards are provided for currency hedging purposes.
Trust Services
Through its subsidiaries in Chile, US, Colombia and Peru, Credicorp Capital offers fiduciary services and trust management solutions focused on managing and planning the cash flows of retail, corporate, and institutional clients. These services include the administration of family, corporate, and real estate trusts, supported by an expert commercial team specializing in advisory and structuring, complemented by legal professionals with specialized knowledge in fiduciary and trust-related matters.
Digital channels
•Credicorp Capital Digital: This digital platform, developed by our Digital Channels Tribe, aims to enhance the digital experience for our clients. It enables clients in Peru to view and operate their onshore portfolios. For the Wealth Management clients, in Peru and Chile, view all on-shore and off-shore investments in one consolidated location. In Colombia, it facilitates operations for Cash Management products for corporate clients and provides comprehensive information on trusts for fiduciary business clients. Additionally, corporate clients in Peru can access their mutual funds portfolio, download statements, and execute transactions. Currently, we have 4,992 clients actively interacting with the digital platform.
•Tyba by Credicorp Capital: Our online application that operates as a digital broker in Colombia, Peru, and Chile, allowing clients to manage their personal finances, making investments according to their own risk profile and tailored to their own investment plans. It provides a simple and secure means for clients to access investment products in a digital platform, allowing investments with a minimum amount.
•CC Invest: Online web and mobile app investment platform that allows our clients in Peru, Colombia and Chile to invest in globally diversified portfolios in the most simple and efficient way. By opening an investment account online, clients can start investing with a minimum amount, supported by a specialized digital advisor.
•Credicorp Capital E-Trading WEB: Platform through which the client can trade stocks in a more transparent and straightforward manner than the traditional method, operating independently and directly in the Order Books of the Stock Market, capturing the best opportunities. With the E-Trading Portal, clients gain a more comprehensive view of the stock market and can identify the best available prices.
Physical channels and Telephone
•Offices: Credicorp Capital’s clients can be served through its 13 regional offices, which are distributed across Peru, Colombia, US, and Chile, and have a point of contact in Mexico. Additionally, BCP clients can access some of Credicorp Capital’s investment products through its network of agencies across Peru.
•Call center: Through a specialized team, we serve and advise our Capital Market clients in the intermediation of fixed-income and variable-income securities in Peru, Colombia, and Chile.
(3)Corporate compliance and ethics
Our Compliance and Ethics Management System is a key component of Credicorp's sustainability framework. We seek to meet the needs of both our businesses and stakeholders through: (i) ensuring the clarity of the terms and conditions of financial products and services, (ii) providing a framework and monitoring it to ensure a good work environment and equal opportunities for all employees and (iii) ensuring responsibility and integrity through all our businesses.
Credicorp and all its subsidiaries, using a comprehensive approach based on international best practices and our principles and ethical values, have established 12 corporate compliance and ethics programs that cover local and international regulations and mitigate conduct risks by encouraging ethical behavior to protect the reputation of the company. These programs include the following:
•Anti-money laundering and countering the financing of terrorism (AML/CFT)
•Global Sanctions
•Financial stability
•Tax transparency (FATCA & CRS)
•Regulatory compliance
•Ethics and integrity
•Anti-corruption
•Market abuse prevention
•Personal data protection
•Occupational safety and health
•Market conduct
•Antitrust
The programs listed above are overseen by the Chief Compliance and Ethics Officer who has full autonomy to carry out functions and duties independently and reports directly to our Board of Directors through the Sustainability Committee, providing regular and consolidated reports about the performance of the compliance and ethics programs at all our subsidiaries. Each subsidiary has a Compliance and Ethics Officer, who works with a specialized team and reports to the head office.
Anti-money laundering and Countering the financing of terrorism (AML/CFT)
Commitment to Financial Integrity
Credicorp’s Anti-Money Laundering and Countering the Financing of Terrorism (AML/CFT) Program establishes robust policies and measures to prevent, detect, and report suspicious activities. These efforts are critical to safeguarding the integrity of local and international markets and ensuring global financial stability.
Risk Management and Governance
Our program is designed to mitigate risks associated with illicit financial flows, including those linked to drug and human trafficking, corruption, illegal mining, embezzlement, and gambling. In 2025, we strengthened cash inflow controls through a risk-based approach, updated key metrics, and enhanced collaboration with frontline defense teams via specialized training and strategic initiatives.
Foundations and Continuous Improvement
The AML/CFT framework is anchored in Key Risk Indicators (KRIs), emphasizing:
•Strong governance and organizational culture
•Operational efficiency and automation
•Advanced technology, analytics, and AI integration. We continuously innovate to overcome challenges in traditional Know Your Customer (KYC) strategies and streamline processes to meet client expectations while achieving business objectives.
Driving Innovation Through Technology and Generative AI
Credicorp is committed to leveraging cutting-edge technologies to strengthen AML/CFT capabilities. Generative AI, machine learning, and advanced analytics will enable:
•Automated transaction monitoring and anomaly detection
•Predictive risk scoring and reduction of false positives
•Enhanced KYC processes and streamlined onboarding by integrating AI-driven insights and natural language processing, we will improve alert management and operational efficiency. These advancements position Credicorp as an industry leader in proactive financial crime prevention while ensuring compliance with global standards.
Strategic Outlook for 2026
•Enhance controls across client/ vendor / third parties onboarding and lifecycle processes using a risk-based approach.
•Implement improvement projects in KYC and alert management leveraging technology and AI.
•Align with international standards and best practices to ensure compliance supports business integrity and fosters sustainable growth.
Global Sanctions
The Corporate Global Sanctions Program at Credicorp manages and implements robust controls over customers’ international operations to ensure strict alignment with global restrictive lists and sanctions frameworks issued by leading authorities such as the Office of Foreign Assets Control (OFAC), the United Nations, the European Union, and the United Kingdom’s Office of Financial Sanctions Implementation (OFSI).
Global sanctions lists aim to impose restrictions on commercial and financial activities involving countries, individuals, or entities for economic, political, military, or social reasons within a global security framework. This program plays a critical role in mitigating the risk of exposure to illicit financial flows, including those linked to organized crime, weapons proliferation, drug trafficking, and other threats to international security. Our monitoring processes include advanced filtering and matching mechanisms to identify and block transactions involving sanctioned jurisdictions, entities, or individuals.
In 2025, we reviewed and monitored around 1,500,000 international operations, applying stringent controls to prevent restricted flows identified on international lists from entering our companies. Moving forward, we will continue to adhere to international standards and best practices, ensuring compliance with global sanctions and safeguarding the integrity of our businesses across all jurisdictions where Credicorp operates.
Leveraging Technology and Generative AI
To strengthen our compliance framework and enhance operational efficiency, Credicorp is committed to integrating advanced technologies, including generative AI and machine learning, into our sanctions screening and monitoring processes. Industry benchmarks highlight that leading financial institutions are adopting AI-driven solutions to improve detection accuracy, reduce false positives, and accelerate decision-making. By leveraging these technologies, we can automate complex screening workflows, analyze large volumes of transactional data in real time, and proactively identify emerging risks. This approach not only ensures compliance with global regulatory standards but also positions Credicorp at the forefront of innovation in financial crime prevention.
Financial stability
Our Financial Stability Program supports our compliance with the applicable regulations derived from the U.S. Dodd-Frank Wall Street Reform and Consumer Protection Act (Dodd-Frank Act), the European Market Infrastructure Regulation (EMIR) and the European Bank Recovery and Resolution Directive (BRRD).
The Volcker Rule (Section 619 of the Dodd Frank Act) generally restricts banking entities from engaging in proprietary trading and from owning, sponsoring, or having certain relationships with a hedge fund or private equity fund. With regard to proprietary trading, the Rule prohibits banks from engaging in short-term proprietary trading of certain securities, derivatives, commodity futures and options on these instruments, for their own account.
In 2020, U.S. regulatory authorities made significant changes to the Rule to limit its applicability to foreign banking entities as the Rule proved to have unintended consequences and extraterritorial impact. The updated Rule provides relief for foreign banking entities that were previously unduly burdened with the Rule’s restrictions in two ways: (1) tailoring compliance obligations based on the level of U.S. trading assets and liabilities, and (2) allowing exemptions on proprietary trading activities and covered funds outside the U.S. for foreign banking entities.
During 2025, we dedicated our efforts to identifying the changes introduced to the Volcker Rule, assessing their impact on our Financial Stability Policy to improve the effectiveness of our existing controls.
Tax Transparency
Credicorp’s Corporate Tax Transparency Program ensures adherence to two critical international regulations: FATCA (Foreign Account Tax Compliance Act) and CRS (Common Reporting Standard). These frameworks establish global standards for the automatic exchange of financial information between jurisdictions, aiming to combat tax evasion and strengthen tax collection through transparent information sharing.
2025 Achievements
In 2025, Credicorp’s financial institutions successfully:
•Submitted over 70 FATCA and CRS returns to tax authorities across eight jurisdictions: Peru, Bolivia, Chile, Colombia, Panama, Cayman Islands, and Luxembourg.
•Met all regulatory requirements by providing requested information within established deadlines, reinforcing trust with regulators and stakeholders.
Strategic Outlook Through Technology and Generative AI.
Our commitment extends beyond compliance. We aim to continuously improve processes, strengthen governance, and align with international best practices to ensure transparency and operational excellence. To remain aligned with industry benchmarks and enhance efficiency, Credicorp is integrating advanced technologies into its tax transparency processes through Generative AI and Machine Learning for automated data validation and reporting workflows, reducing manual errors and accelerating submission timelines.
These innovations will strengthen accuracy, improve operational resilience, and position Credicorp as a leader in global tax compliance while delivering a seamless experience for clients and stakeholders.
Regulatory compliance
Credicorp and its subsidiaries comply with all regulatory requirements set by the Superintendency of Banking, Insurance and AFPs (SBS), government bodies, and other authorities. We use risk-based methodologies aligned with international standards to manage compliance and minimize legal and reputational risks.
Our annual compliance plan ensures ongoing development and implementation of effective strategies. We foster a strong culture of compliance by providing employees with continuous training on their regulatory responsibilities.
Ethics and integrity
Our Ethics and integrity program manages the Corporate Code of Ethics (“the Code”) and complementary conduct policies to provide guidelines for employees to avoid misconduct and provide tools to properly manage potential conflict of interest scenarios. The Code is approved by the Board of Directors and is the conduct reference for our directors and employees, who must comply with it.
To manage potential conflict of interests, directors and employees must submit relevant information periodically, including their activities outside of our business. We also have policies to address operations between Credicorp's related parties, whereby relevant transactions are disclosed to the Sustainability Committee and to other stakeholders.
We are also responsible for the management of our complaints system called Alerta GenÉTICA. We continuously foster awareness through communication campaigns, dashboards, training and encouraging stakeholders to use the hotline.
In 2025, we updated our human rights policy with the goal to analyze and reduce possible risks that may be present in the main subsidiaries. We also continue training our employees about the main compliance risks associated to artificial intelligence.
Anti-corruption
Credicorp is committed to zero tolerance for corruption. We strictly adhere to regulations that strengthen prevention and investigation mechanisms, such as Peru’s Law 30424 and its amendments, and the U.S. Foreign Corrupt Practices Act (FCPA).
Our Corporate Policy on Anti-Corruption and Anti-Bribery sets clear guidelines for all Credicorp subsidiaries to maintain transparent relationships with stakeholders, mitigate related risks, and comply with local and international standards. This policy is implemented through a prevention model focused on four key pillars:
•Risk Assessment
•Training and Awareness
•Continuous Monitoring
•Supervision
As part of our Corporate Anti-Corruption Program, BCP Stand-alone, Mibanco Perú, and Pacífico Seguros have obtained ISO 37001 Anti-Bribery Management System certification. Additionally, BCP Stand-alone holds the “Empresarios por la Integridad” Anti-Bribery Certification in Peru, which relies on independent audits to verify compliance across the entire organization.
At Credicorp, we continuously strengthen our practices to prevent corruption and bribery. Through ongoing improvement of our prevention models, training programs, and monitoring systems, we ensure that our subsidiaries remain aligned with global best practices. This commitment reflects our determination to evolve proactively, reinforcing a culture of integrity and transparency across all operations.
Market abuse prevention
Through Credicorp’s Market Abuse Prevention program, guidelines and controls are established to prevent insider trading and market manipulation.
In 2025, we update our policies in accordance with regulatory changes and international standards. We implemented the “Insider Trading and Personal Investments Policy”. Furthermore, we strengthened insider information management in the mergers and acquisitions process at a corporate level through the implementation of a procedure.
Personal data protection
At Credicorp, we are committed to safeguarding the privacy of our users' personal information. We aim for absolute confidentiality to the extent permitted by applicable law and adhere to the highest security standards in compliance with the Personal Information Protection Law No. 29733, as well as other relevant regulations in the countries where we operate.
At Credicorp, we are committed to protecting the personal data we manage and ensuring that all processing complies with legal requirements and explicit consent where applicable. In this context, we launched a comprehensive corporate plan to transform consent into a true business enabler, guided by our core principles. This initiative encompasses end-to-end automation of consent management—covering data collection, usage, customer experience, transparency, and accessibility—supported by technology, data analytics, and detective alerts, among other measures. The plan will continue into 2026 with an even stronger focus on transparency and accessibility, reinforcing trust, and delivering added value for our clients.
During 2025, we also focused our efforts on the following strategic initiatives:
1.Ensuring the processing of personal data exclusively with free, prior, informed, explicit, and unequivocal consent.
2.Safeguarding recognized rights, including the implementation of the new right to data portability, introduced this year.
3.Promoting a privacy-first culture, fostering awareness and accountability through training programs and internal communications to ensure proper handling of personal data.
4.Aligning our Corporate Policy and implementing the necessary measures to guarantee that all responsible personnel understand and apply it effectively.
5.Establishing and consolidating a Data Leakage Prevention front, in collaboration with the CSIRT, to strengthen controls and mitigate risks related to personal data breaches.
6.Creating a Personal Data Enrichment Flow, an assessment process designed to evaluate any acquisition of data from external sources, ensuring compliance and transparency.
7.Launching the “Data Processing Agents” front, a new role introduced under the updated regulation, where service providers assume and clearly disclose their responsibilities regarding the use of data entrusted to them.
8.Designating the Credicorp Data Protection Officer (DPO) as the strategic focal point for engagement with the regulator, ensuring alignment and proactive compliance.
Occupational safety and health
At Credicorp, Occupational Health and Safety (OHS) is a strategic pillar for protecting people and ensuring business sustainability. The OHS management of the Group’s companies remains aligned with the ISO 45001 standard, fully integrated into operations and decision-making, with a preventive approach, continuous improvement, and comprehensive care for our employees, suppliers, visitors, and customers.
In 2025, BCP maintained its ISO 45001 certification, reaffirming its leadership as a benchmark within the financial sector and consolidating a management model that prioritizes safe, healthy, and resilient work environments. This achievement reflects a sustained commitment to visible leadership, with Senior Management actively involved in promoting a strong preventive culture and reinforcing organizational commitment to occupational health and safety.
Credicorp’s OHS management works to uphold the Group's sustainability and human rights-focused agenda, in direct alignment with the Sustainable Development Goals, particularly SDG 3 (Good Health and Well-being) and SDG 8 (Decent Work and Economic Growth). We continue to foster a strong Occupational Health and Safety culture in the countries where we operate, convinced that investing in people’s care is essential to business continuity and to building a solid, balanced, and sustainable future.
Market conduct
Credicorp’s market conduct program is aimed at promoting good business practices with customers, mitigating the risk of marketing and design of products that do not meet the needs of clients, ensuring information transparency, giving clarity of the terms and conditions of financial products and services, and properly managing claims for customers. These
actions allow us to encourage ethical behavior to protect the reputation of the company and achieve sustainable relationships with our customers.
During 2025, quarterly monitoring of information transparency was carried out to evaluate 75% of the bank branches and 1,944 calls made by telephone banking. This monitoring allows evaluating the knowledge of collaborators in the bank's products and services. As of the latest evaluation, 87% qualification was obtained, which corresponds to a Very Satisfied Customer, while the final assessment is still in progress. Additionally, responsible sales monitors were carried out, which aim to reduce non responsible practices in our sale force. At the end of 2025, the number of requests that do not comply with the sales guidelines was reduced by 28% compared to the same period last year. Likewise, activities have been deployed under a consequences model which seeks to correct these practices. Finally, we carry out culture and reinforcement activities with the commercial employees to raise awareness about the impacts of applying irresponsible practices. In 2025, we trained 48 teams across agencies and carried out activations for 1,893 contact center and exclusive digital banking executives.
Antitrust
Credicorp’s Antitrust program is aimed at promoting business relationships under the premise of respect and justice, maintaining high ethical standards in support of free competition.
During 2025, BCP has focused on strengthening our practices to prevent anticompetitive behavior. Through ongoing improvement of our internal procedures and protocols, training programs, and monitoring systems, we ensure that BCP remains aligned with global best practices. This commitment reflects our determination to promote economic efficiency in the markets for the benefit of consumers.
INDECOPI, as regulator of the Antitrust Law, issued Guidelines on Antitrust Compliance Programs in 2020. BCP adopted this standard to implement the program. To date, we have implemented the 8 elements considered in this model: (i) tone from the top, (ii) designation of a compliance officer, (iii) risk management, (iv) controls and protocols, (v) training, (vi) monitoring and (vii) a whistleblower system and (viii) internal auditing.
(4)Internal Audit
In 2025, our internal audit unit focused on creating a permanent risk-based framework to evaluate the effectiveness and efficiency of Credicorp’s risk management, control, and governance processes. The internal audit unit's objectives are to improve and protect the corporation’s value through an agile and timely independent assessment as well as data-based advising and risk analysis. For this purpose, our internal audit unit formulated the Annual Audit Plan using a risk-based audit methodology, which is aligned with the rules formulated by The Institute of Internal Auditors Global (the “IIA”) and approved by the SBS. Our work is founded on four pillars: Digital Transformation, Role Positioning, Culture and Talent, and Management Optimization.
This year, our purpose, mission and vision were:
•Purpose: To protect Credicorp's sustainability and strengthen its value-creation capacity by providing effective and cutting-edge audit services.
•Mission: To ensure and advise continuously and dynamically on strategic issues and key risks, through the intensive use of technology, data, innovation, anticipation, and motivated talent.
•Vision: To be a global leader in digital audit practices, oriented to fulfill our purpose.
We will pursue our purpose, mission and vision through the development of actions and plans based on four pillars:
1.Role positioning
2.Digital transformation
3.Culture and talent
4.Management optimization
The Quality Assurance Management team, whose role is independent of the audit and consulting functions, has executed annual Internal Quality Assessments since 2011, in compliance with IIA Standard 12.1, the result of which was “Fully Achieves” the Global Internal Audit Standards (Standards). This level of achievement demonstrates a clear intent and commitment to achieving the Purpose of Internal Auditing and the 15 Principles, conforming to the 52 standards of the Global Internal Audit Standards.
The Audit Satisfaction Index (ISA), which collects the opinion of our audited clients after each job, achieved a result of 4.62 out of 5.00, which shows the perceived value of the work of Internal Audit by Credicorp Ltd., its subsidiaries, and affiliates.
Additionally, the Internal Audit Function (IAF) continues to apply the Ambition Model (AM) as a framework for assessing internal audit maturity. This model, developed by the Netherlands Institute of Internal Auditors, provides a comprehensive structure for identifying gaps, strengthening capabilities, and progressing towards the performance level the organization aspires to achieve.
The AM integrates a set of essential activities for each dimension of the IAF and classifies them into levels, using a scoring scale from 1.00 to 5.00, which facilitates progress measurement. In 2024, Credicorp Ltd.'s Internal Audit function achieved a score of 4.16 points, at Level 4 Managed. For 2025, Credicorp Ltd.'s Internal Audit function remains at Level 4 Managed, achieving a consolidated score of 4.27 points (the aspirational goal was 4.25). The results demonstrate consistent progress across all evaluated dimensions, with notable improvements in Governance, Strategic Planning, and Professional Practices, evidencing Credicorp's ongoing effort and the establishment of enhancement mechanisms that strengthen the efficiency and effectiveness of internal audit of work.
The Credicorp Corporate Auditor continues in his role as a member of the Professional Certifications Board, whose function is to govern, defend and promote the IIA Global certification programs. He was also elected as member of the Stakeholders Advisory Council (SAC) of the International Auditing and Assurance Standards Board (IAASB) and the International Code of Ethics for Professional Accountants (IESBA). Likewise, the Auditor of Grupo Pacífico is serving as vice president of Information Systems Audit and Control Association (ISACA) of Lima. Furthermore, the Auditor of Credicorp's Microfinance segment serves as a member of the Financial Services Knowledge Group at the IIA Global.
Consistent with recommended industry practices, Credicorp applies the National Institute of Standards and Technology 2.0 (NIST - CSF), OWASP – Mobile & Application Security Standard, Cloud Security Alliance’s (CSA), Critical Security Controls (CIS), COBIT and MITRE ATT&CK Framework.
Data analytics methodologies were deployed and integrated with assurance evaluations in the Credicorp Internal Audit units. Subsequently, the process of decentralization of these tools to specialized audit teams continued. This entails democratizing access and use of these tools, with the aim of encouraging internal audit units to have the ability to exploit and use them as long as they comply with the guidelines of the Data & Analytics area. In this context, the Data & Analytics
unit not only develops digital or analytical solutions, but also socializes them so that the different audit units can carry out simple and specific analyzes according to their ad hoc needs. This ensures that Data, Data Governance, Advanced Analytics and Artificial Intelligence standards are met in each process and in the information used by said units. During 2025, we believe we achieved important advances in five main action fronts of data analytics: (i) the development of the first AI Agent, capable of identifying risks, designing controls, creating test plans, drafting audit observations and generating complete audit reports; (ii) the improvement in the performance of cognitive solutions, using Microsoft Azure Services to interpret and automatically analyze information from physical or telephone contracts to identify suspicious transactions or transactions with a greater probability of mistake, which should be audited; (ii) the automation of audit processes, allowing us to optimize our review; (iv) the digitization of audit evidence, reducing the time spent conducting our review; and (v) the carrying out of continuous audits of our key processes. At the end of 2025, there were 181 automated metrics with the objective of timely alerting the business about deviations or new emerging risks. The results of these metrics are shared with the business units, which evaluate the risks involved and implement solutions when needed.
In addition, to reinforce the skills of the audit team, 1,178 hours of training were offered during 2025 to promote the use of Data & Analytics, and the Virtual Audit Classroom, which includes Campus AI and offers courses on ad-hoc digital tools for the audit team.
The Model Risk Audit Management Department now uses, in addition to the traditional methodology, a specialized approach for auditing models called “Special Model Audit”. The purpose of this change is to address the review needs arising from the increase in the number and complexity of developed models, as well as to more quickly identify deficiencies that may exist in the different processes associated with the models' life cycle. By applying this method in projects, we have achieved significant improvements in our approach to auditing models: we expanded model review coverage, adopted deeper quantitative approaches, and efficiently monitored first- and second- line controls.
In 2025, we provided 20,191 hours of training to our internal auditors, with an average of 76.2 hours per auditor (above the 40 hours per auditor recommended by international practices), in topics related to new cybersecurity frameworks (such as those promulgated by the IIA, NIST or the FFIEC), artificial intelligence, data analytics, risk management, programming language, validation of models and other topics of financial and operational audit.
(5)Competition
5.1Universal Banking
As of December 31, 2025, there are 47 privately-owned financial institutions, and four state-owned financial institutions (Banco de la Nación, COFIDE, Banco Agropecuario (Agrobanco) and Fondo MiVivienda), in the Peruvian universal banking sector.
| | | | | | | | | | | | | | | | | | | | | | | |
| Private Financial System as of December 31, 2025 |
| Number of
entities | | Assets
(Soles in thousands) | | Deposits
(Soles in thousands) | | Loans
(Soles in thousands) |
| Banking Sector (1) | 19 | | 570,259,747 | | | 394,549,104 | | | 370,438,646 | |
| Financial firms (2) | 7 | | 10,333,118 | | | 5,229,299 | | | 8,432,307 | |
| Municipal savings banks (3) | 11 | | 47,478,453 | | | 35,172,166 | | | 39,657,509 | |
| Rural savings banks (4) | 5 | | 1,792,906 | | | 1,225,585 | | | 1,454,081 | |
| Credit firms (5) | 5 | | 3,222,979 | | | - | | | 2,839,958 | |
| Total(6) | 47 | | 633,087,203 | | | 436,176,154 | | | 422,822,501 | |
Source: SBS
(1)“Banca Multiple” under SBS definition and terminology
(2)“Empresas Financieras” under SBS definition and terminology
(3)“Cajas Municipales” under SBS definition and terminology
(4)“Cajas Rurales” under SBS definition and terminology
(5)“Empresas de Crédito” under SBS definition and terminology. Until Apr-23 it denominated EDPYME.
(6)The total Private Financial entities does not include savings and loans associations (COOPACS), because the information for COOPACS is not yet publicly available from the SBS.
(i)Banking Sector
The Banking Sector includes universal banks, offering financial services to retail and wholesale clients, among others. The following table sets forth the percentages, by assets, deposits, and loans, represented by the major Peruvian banking institutions.
| | | | | | | | | | | | | | | | | | | | | | | | | | | | | | | | | | | | | | |
| | As % of total Private Financial System | | As % of Banking Sector |
| as of December 31, 2025 | | Assets | | Deposits | | Loans | | Assets | | Deposits | | Loans |
| BCP Stand-alone | | 32.22 | % | | 32.99 | % | | 29.39 | % | | 35.77 | % | | 36.47 | % | | 33.54 | % |
| BBVA Banco Continental | | 17.75 | % | | 18.82 | % | | 19.33 | % | | 19.70 | % | | 20.81 | % | | 22.06 | % |
| Interbank | | 12.06 | % | | 12.14 | % | | 11.92 | % | | 13.39 | % | | 13.42 | % | | 13.60 | % |
| Scotiabank Peru | | 11.33 | % | | 10.70 | % | | 11.51 | % | | 12.58 | % | | 11.83 | % | | 13.14 | % |
| Banco Interamericano de Finanzas | | 3.67 | % | | 3.62 | % | | 3.43 | % | | 4.07 | % | | 4.00 | % | | 3.92 | % |
| Mibanco | | 2.88 | % | | 2.51 | % | | 3.19 | % | | 3.19 | % | | 2.77 | % | | 3.64 | % |
Source: SBS
As of December 31, 2025, BCP Stand-alone ranked first among all Peruvian multiple banks by assets, deposits, and loans, according to the SBS.
As of December 31, 2025, the principal Peruvian non-state financial institutions reported total loan balances of S/273,831 million in local currency and of US$28,727 million in foreign currency (in comparison to S/254,894 million and US$25,664 million as of December 31, 2024, respectively). These figures represented an expansion in local currency loan balances of 7.4% and an expansion in foreign currency loan balances of 11.9% from December 31, 2024 (compared to contraction of 3.2% and an expansion of 0.9%, respectively, from December 31, 2023, to December 31, 2024). As a result, the dollarization of loans reached 26.1% as of December 31, 2025 (compared to 27.5% as of December 31, 2024, and 28.0 as of December 31, 2023).
As of December 31, 2025, Peru’s total amount of multiple banking deposits was S/394,549 million, and the multiple banking dollarization rate for deposits was 35.28% (compared to 38.9% as of December 31, 2024, and 39.1% as of December 31, 2023). It should be noted that, as part of its plan to decrease the dollarization level of loans in the Peruvian financial system and reduce the risks of currency depreciation associated with borrowing in U.S. Dollars, the BCRP established a de-dollarization program beginning in January 2015. For further information, see “ITEM 4. INFORMATION ON THE COMPANY – 4.B Business Overview – (6) Supervision and Regulation – 6.2 Subsidiaries – 6.2.1 Peru – (i) Peruvian Regulators.”
Peruvian banks’ capital ratio (regulatory capital divided by RWAs) was 18.15% as of December 31, 2025, which was above the 10.0% temporal legal minimum that became effective in July 2011 and represented an increase of 74 basis points from the capital ratio reported as of December 31, 2024 (17.41%). As of 2024, the ratio increased by 94 basis points from a ratio of 16.47% as of December 31, 2023.
Peru’s loan portfolio quality indicators generally improved in 2025. As of December 31, 2025, the internal overdue ratio reached 3.26%, 49 bps below the ratio reported as of December 31, 2024 (3.75%). As of 2024, the ratio had decreased 56 bps compared to December 31, 2023 (4.31%). Also, the internal overdue, refinanced, and re-structured loans over total loans ratio was 5.07% as of December 31, 2025, 65 basis points lower than the 5.72% ratio reported at year-end 2024. Similarly, the coverage ratio of Peru’s internal overdue loan portfolio was 171.03% as of December 31, 2025 (compared to 156.10% as of December 31, 2024, and 144.64% as of December 31, 2023).
The liquidity of the Peruvian banking system remained at moderately high levels. As of December 31, 2025, the local currency liquidity ratio and the foreign currency liquidity ratio were 27.93% and 57.15%, respectively (compared to 29.59% and 56.09% in 2024, and to 30.54% and 44.12% in 2023, respectively. The decrease in the local currency liquidity ratio reflects changes in deposit balances and the resulting evolution of funding flows within the banking system. These liquidity ratio levels were well above the minimums required by SBS regulations, which was 8% for local currency and 20% for foreign currency as of December 31, 2025.
(ii)Other financial institutions
BCP Stand-alone faces strong competition from credit providers other than banking institutions or public financial institutions, primarily with respect to consumer loans and SME-Pyme loans. SME-Pyme loan providers from non-bank financial institutions lent S/30.9 billion to borrowers in 2025, compared to S/30.6 billion in 2024 and S/26.1 billion in 2023, according to the SBS. In 2025, overall SME-Pyme loans to customers of non-bank financial institutions represented 30.9% of the total loans in the Peruvian financial system (compared to 43.0% in 2024 and 55.8%).
Consumer loan providers from other financial institutions lent S/13.5 billion to borrowers in 2025, compared to S/15.5 billion in 2024 and S/16.4 billion in 2023, according to the SBS. In 2025, overall loans to consumers of other financial institutions represented 14.5% of total loans in the financial system (compared to 17.8% in 2024 and 18.2% in 2023).
(iii)Recent Competitive Developments
In recent years, several foreign companies have shown interest in entering the Peruvian universal banking market, while financial companies already in Peru have taken steps to expand operations and develop new businesses. In addition, non-traditional players, such as fintech and startup companies, began to operate in the financial sector in recent years. These new strong competitors may adversely affect our results, as they provide similar products and services. In particular, the following authorizations and applications from and to the SBS, as well as the following recent regulations, may be significant to our competitive environment in Peru:
(1)In February 2025, the SBS formalized the authorization for Compartamos Financiera to become Compartamos Banco, which will now operate as a banking entity.
(2)In May 2025, the SBS authorized the conversion of Financiera Santander Consumer into Santander Consumer Bank, officially recognizing it as a banking entity in Peru.
(3)In March 2025, BiPay entered a phase of broader adoption as the BCRP’s Digital Money Pilot moved into its evaluation stage, reinforcing Bitel’s competitive position in the digital‑payments ecosystem.
(4)In 2025, the SBS intervened four savings and loans cooperatives due to insolvency and the loss of their share capital and cooperative reserves (La Cumbre, Nuevo Milenio Limitada, Líderes Emprendedores Red Nacional and La Esperanza de Marcona).
(5)In November 2025, the SBS issued Resolution No. 04225‑2025, establishing a regulatory framework that permits certain regulated financial institutions, including banks, to participate in the administration of private pension funds.
(6)In January 2026, Revolut, which is a UK-based digital bank, applied for a full banking license in Peru with the SBS to operate as the first fully regulated digital bank in country.
(7)In January 2026, the SBS authorized BTG Pactual, the Latin America’s largest investment bank, the establishment of a banking entity in Peru, subject to the completion of the remaining licensing requirements.
5.2Microfinance
According to The Economist Intelligence Unit, Peru and Colombia are among the countries that have presented the best results in addressing financial inclusion in terms of factors such as regulation, infrastructure, consumer protection and financial stability. We are aware that a large portion of microbusiness owners in both countries are currently unbanked, which constitutes an opportunity to contribute to these economies while growing our businesses.
5.2.1Peruvian microfinance system
As of December 31, 2025, the Peruvian microfinance system is mainly regulated by the SBS and is comprised of entities that vary in size, client segments, and ambit of geographic action: two banks, Mibanco and Compartamos Banco; seven financial firms; eleven municipal savings banks; five rural savings banks; and five development entities for small and microbusinesses (Credit Firms). The Peruvian microfinance system also includes 228 savings and loan associations
(Cooperativa de Ahorro y Créditos or COOPACS by its Spanish initials), which have small portfolios and target specific geographic areas.
As of December 31, 2025, the Peruvian microfinance system (excluding COOPACS) represented around 64% of the total entities regulated by the Peruvian financial system, with microfinance loans totaling approximately S/70.5 billion (17% of Peruvian Financial System). As of December 31, 2025, according to the SBS, microfinance customers represented 55% of borrowers in the regulated Peruvian financial system.
| | | | | | | | | | | | | | | | | | | | | | | |
| Peruvian Microfinance System as of December 2025 |
| Number of
entities | | Assets (Soles in
thousands) | | Loans (Soles in
thousands) | | Deposits (Soles
in thousands) |
| Multiple banking | 2 | | 23,766,356 | | | 18,164,014 | | | 14,045,810 | |
| Financial firms | 7 | | 10,333,118 | | | 8,432,307 | | | 5,229,299 | |
| Municipal savings banks | 11 | | 47,478,453 | | | 39,657,509 | | | 35,172,166 | |
| Rural savings banks | 5 | | 1,792,906 | | | 1,454,081 | | | 1,225,585 | |
| Credit firms | 5 | | 3,222,979 | | | 2,839,958 | | | - | |
| Savings and loan associations (COOPACS) (1) | 228 | | N/A | | N/A | | N/A |
| Total | 258 | | 86,593,812 | | | 70,547,869 | | | 55,672,860 | |
(1)In 2019, SBS began overseeing COOPACS but there is still no financial information about them available.
Source: SBS
According to the SBS, as of December 31, 2025, Mibanco led the Peruvian market for loans in the micro business segment and ranks second in the small business segment regulated by the SBS, with shares of 20.9% and 14.0% respectively (compared to 27.3% and 11.8%, respectively, as of December 31, 2024 and 19.0% and 20.3%, respectively, as of December 31, 2023). The changes observed in the small business segment between 2023 and 2024, and in the micro business segment between 2024 and 2025, are mainly explained by the phased implementation of SBS Resolution No. 2368‑2023. This regulation introduced updated loan classification criteria based on sales or income levels and required a gradual portfolio reclassification process, which was fully completed in 2025 and resulted in client migration across segments.
Municipal savings banks are important players in the microfinance system in Peru. In 2025, 11 municipal savings banks were operating and represented 56% of the total loans at year-end. The business model used by municipal savings associations is similar to the traditional relational model used by Mibanco, which conducts an on-site cash flow assessment of the customer. Municipal savings associations are institutionally linked to local governments and operate within their administrative, regulatory, and political framework. As a result, their ability to innovate and to modify products and processes is constrained by the existence of multiple layers of approval.
In 2025, the Peruvian economy continued to consolidate the recovery that began in the second half of 2024, driven by stronger private demand, improving business confidence, and favorable macroeconomic conditions. GDP grew 3.4% for the year, driven by solid growth in construction, services, and trade, in line with broader national trends reported by Central Bank. This recovery was reinforced by low and stable inflation, which remained anchored within the Central Bank’s target band, reaching 1.5% in December 2025, as well as the gradual easing of monetary conditions following the decline in inflationary pressures. In this context, Mibanco maintained its focus on responsible, risk-adjusted growth. During the first half of 2025, the Bank continued to apply a disciplined credit strategy—particularly in regions and segments still showing uneven recovery—while gradually accelerating loan origination in the second semester as macroeconomic indicators gained strength. Mibanco continued to prioritize higher‑yield, lower‑ticket lending, consistent with its core business model, while strengthening risk‑management practices to preserve portfolio quality amid uncertainty and sector‑specific volatility. As of December 31, 2025, the Bank maintained an internal overdue loan coverage ratio of 155.7% in IFRS. In Peruvian GAAP, as of December 31, 2025, Mibanco’s internal overdue loan coverage ratio was 147.2% and the average for municipal savings banks was 156%. Mibanco’s global capital ratio was 21.3% at year-end 2025, which exceeded the 15.1% global capital ratio reported by municipal savings banks at year-end 2025. Furthermore, in 2025, the ROE for Mibanco was 21.6%, which exceeded the 16.8% ROE collectively reported by the municipal savings banks system.
Recent competitive developments
The most relevant news and developments in the Peruvian microfinance sector from 2023 to 2025 were:
(1)In August 2023, SBS intervened in Caja Raiz due to a significant deterioration in its solvency. Rural savings associations and cooperatives were the most affected by the pandemic, subsequent recession, and adverse economic environment in 2023, given that a large tranche of their portfolio is comprised of microbusinesses and small companies.
(2)In 2023, SBS dissolved more than 27 cooperatives for diverse reasons, including loss of share capital; failure to submit financial statements; work stoppage at main offices; among others. Since 2019 (when SBS took over as the supervisory entity for COOPACS or Savings and Loan Cooperatives), SBS has closed 137 cooperatives due to inactivity (84%) and total loss of share capital and reserves (22%).
(3)In July 2024 and September 2024, SBS intervened in Caja Sullana and Financiera Credinka, respectively. Both institutions were included in the program to strength equity for microfinances institutions that allowed SBS to transfer assets, liabilities and customers to Caja Piura and Caja Arequipa via auction. The closure of both institutions occurred due to a significant deterioration in solvency as a result of constant financial losses in recent years due to deficiencies in risk management, both in its credit granting policy and in its internal control system, which were aggravated by the pandemic, subsequent recession, adverse economic environment and climatological phenomena in 2023.
(4)In December 2025, through Ministerial Resolution No. 614‑2025‑EF/15, the Ministry of Economy and Finance (MEF) amended the operational framework of the Equity Strengthening Program for Microfinance Institutions (IEM). This modification exceptionally increased the potential support that the Deposit Insurance Fund (FSD) may provide to distressed microfinance entities up to ten times their equity value in order to safeguard depositors, prevent sudden closures, and enable orderly resolution processes for institutions facing severe solvency deterioration.
5.2.2Colombian microfinance system
The Colombian microfinance system is regulated by the SFC. As of December 2025, Colombian microfinance institutions represented around 21% of the total entities regulated by the Colombian financial system, with microfinance loans totaling approximately 25.08 billion Colombian Pesos. Mibanco Colombia, which belongs to the Multiple Banking sector, ranked second among its microcredit peers in the Colombian microfinance system, holding a 16.79% share of loans in this segment according to the SFC. Microfinance institutions reported a presence in 1,104 municipalities (100% of total municipalities in the country).
| | | | | | | | | | | | | | | | | | | | | | | | | | | | | |
| Colombian Financial System in December 2025 |
| Number of
entities | | Assets (Pesos
in millions) | | Deposits
(Pesos in
millions) | | Loans (Pesos
in millions) | | Microfinance Loans
(Pesos in millions) |
| Multiple banking | 30 | | 1,065,105,347 | | | 732,173,670 | | | 729,160,785 | | | 22,442,719 | |
| Financial corporations | 6 | | 35,818,054 | | | 9,398,970 | | | 3,593 | | | 0 | |
| Finance company | 15 | | 28,430,310 | | | 19,883,774 | | | 15,560,922 | | | 245,199 | |
| Financial cooperatives | 4 | | 5,422,805 | | | 3,359,985 | | | 4,761,069 | | | 373,818 | |
| Microfinance institutions | 13 | | N/A | | N/A | | N/A | | N/A |
| Total | 68 | | 1,134,776,516 | | | 764,816,399 | | | 749,486,369 | | | 23,061,736 | |
Source: SFC and Asomicrofinanzas
Recent competitive developments
The most relevant new developments in the Colombian microfinance sector from 2023 to 2025 were:
(1)In March 2023, via Decree 455, new lending modalities were created and interest rates on these products must now be certified by the Financial Superintendence of Colombia. The new modalities were popular loans for rural production (crédito popular productivo rural); popular loans for urban production (crédito popular productivo urbano); a rural production loan (crédito productivo rural); an urban production loan (crédito
productivo urbano); and a higher-ticket production loan (crédito productivo de mayor monto). Differentiated certifications were implemented for current interest, which led rates on Microloan disbursements to drop significantly.
(2)In December 2023, via Decree 2120, the program "CREO, un crédito para conocernos" was created to benefit the agricultural and non-agriculture sector of the popular economy by offering access to low-ticket loans that require no co-signers or collateral, with loan tenures of up to 24 months. The government is betting on La Economía Popular7 to drive the country’s economy by promoting financial inclusion with the support of Bancoldex and the Fondo Nacional de Garantías.
(3)In February 2024, the Financial Superintendence of Colombia (SFC) issued External Circular 004, establishing the basic legal and technological framework for the implementation of open finance in the country. This regulation calls upon financial entities -including banks, fintechs and other institutions- to enable standardized and secure access to clients’ financial data with explicit consumer consent. Despite these advancements, the regulatory framework for open finance in Colombia remains under development. However, the adoption of open finance is expected to empower consumers to control their financial information, facilitating tailored financial products and services, thereby promoting innovation and competition in the financial sector. For Mibanco Colombia and the overall microfinance sector, this regulation encourages innovation in credit scoring models, fosters more efficient customer onboarding processes and partnerships with digital platforms.
(4)In May 2024, through Decree 654, the government modified the structure of the National Fund for Guarantees (FNG) to optimize operations and help the organization adapt to the needs of the market. FNG and the entities grouped together under Asomicrofinanzas agreed, under the Credit Pact, to finance around 1.9 million Colombians to support FNG’s goal to increase the lending inclusion indicator from 35.3% to 40% in 2026.
(5)In August 2024, the Colombian Government reached an agreement with the banking sector known as the “Credit Pact.” Under this pact, financial entities, including Mibanco Colombia, committed to channeling 55 billion Colombian pesos to five strategic economic sectors over a period of 18 months. The prioritized sectors include housing, manufacturing, agriculture and livestock, the popular economy, and tourism. The main objective is to jump-start the economy and facilitate access to credit in traditionally unserved areas. Loan disbursements rose by 26% under the Credit Pact as of December 2024. These disbursements were concentrated in prioritized sectors to reactivate the country’s economy and boost financial inclusion.
(6)In October 2024, the Fundación Grupo Social, owner of Banco Caja Social, announced that it had acquired 51% of the shares of Banco W, which specializes in microfinance. Fundación WWB Colombia retained the remaining 49%. This transaction is pending approval from the Superintendency of Finance of Colombia, so for the time being the companies have announced that they will continue to operate independently and will maintain their strategies and product portfolios.
(7)In October 2025, the SFC authorized the operation of NEQUI S.A. as a Financing Company (Resolution 2002 of October 31, corrected by Resolution 2021 of November 4). This enables Nequi to function independently from Bancolombia, expanding digital financial services—including microcredits and payments—thereby increasing competition and access in the fintech-driven microfinance segment.
(8)On October 15, 2025. Decree 1068 was issued, adding Part 26 to Book 2 of Decree 1068 of 2015, thereby creating the "Colombia se transforma con Bancóldex" credit program. This initiative aims to facilitate financing access for micro, small, and medium enterprises (MiPyMEs), productive organizations, cooperatives, associations, and popular/community economy entities. It offers special credit lines with differential interest rates, capital abatements, and guarantees, emphasizing green finance, productive innovation, internationalization, and closing access gaps with a Diversity, Equity, and Inclusion (DEI) approach. Bancóldex executes the program as a second-tier bank, channeling resources from the National General Budget to promote productive modernization and financial inclusion for traditionally excluded populations, in alignment with the National Development Plan 2022-2026.
(9)On November 2025, the "Pacto por el Crédito" (launched August 2024) had disbursed COP 198.7 trillion (78% of the COP 254.7 trillion 18-month target ending February 2026), granting 29.9 million loans. Housing and infrastructure exceeded its sectoral goal (102.2%), while November disbursements reached COP 13 trillion (+10.5% YoY). The pact has significantly boosted credit access in priority sectors and underserved areas, contributing to meeting economic reactivation and financial inclusion targets.
(10)On November 2025, Bold —a leading Colombian fintech specializing in payment solutions and financial services for micro, small, and medium enterprises (MiPyMEs)—launched its Cuenta Pro, a fully digital
7 "La Economia Popular" refers to trade and occupations carried out by very small-scale economic units—such as individuals, families, micro‑businesses, or microenterprises—across any economic sector. CREO is the financial instrument designed by the Government to integrate this segment into the formal financial system through low‑amount, entry‑level loans with an inclusive focus.
business account designed to optimize cash flow management for businesses of all sizes, with a strong focus on underserved microentrepreneurs and popular economy actors. Offered by Bold CF Compañía de Financiamiento (supervised by the Superintendency of Finance), the account is free until December 2025 (with affordable fees thereafter) and includes features such as instant receipt of sales proceeds, unlimited free transfers, payroll and supplier payments, tax settlements, savings pockets yielding up to 10% E.A. (effective annual), and integration with existing payment tools (datáfonos, QR codes). The fully digital onboarding process takes minutes, eliminating lengthy traditional banking procedures. With Bold serving approximately 600,000 clients (many in the micro and small business segment) and processing around 6% of card payments in Colombia, this product enhances financial inclusion by providing accessible deposit and transaction services, potentially serving as a gateway to further credit products (e.g., working capital loans already offered by Bold). This development intensifies competition in the digital banking space for MiPyMEs, complementing regulatory efforts like open finance and credit pacts by lowering entry barriers and improving cash management for vulnerable sectors.
5.3Insurance & Pensions
5.3.1Grupo Pacífico
The Peruvian insurance market, which includes P&C, life, and corporate health insurance market, is comprised of 17 active companies, of which 8 are dedicated to P&C and lifelines, 6 are dedicated exclusively to P&C and 3 are dedicated exclusively to life. According to the SBS and SUSALUD, as of December 31, 2025, four companies (Rimac, Grupo Pacífico, La Positiva and Mapfre) represented a combined 78.3% market share in terms of written premiums, and the leading two companies (Rimac and Grupo Pacífico) had a combined market share of 54.9%.
In 2025, Grupo Pacífico was the second-largest insurance company in Peru in terms of written premiums, with a consolidated market share of 25.2% (compared to 26.8% in 2024), according to the SBS and SUSALUD. Grupo Pacífico had a 1.9% written premium increase from 2024 to 2025, which was lower than the Peruvian growth of 8.4%. Grupo Pacífico is the largest insurance company in the health insurance markets, with 42.3% of market share, according to SUSALUD. The following table lists the Peruvian market share of each of the top six insurers by annual written premiums in 2025:
| | | | | | | | | | | | | | | | | |
| Market Share by Annual Written Premiums (1) | 2023 | | 2024 | | 2025 |
| 1. Rimac | 30.5 | % | | 29.3 | % | | 29.7 | % |
| 2. Grupo Pacífico | 26.8 | % | | 26.8 | % | | 25.2 | % |
| 3. Mapfre | 12.9 | % | | 12.3 | % | | 12.2 | % |
| 4. La Positiva | 11.9 | % | | 11.8 | % | | 11.2 | % |
| 5. Interseguro | 4.9 | % | | 5.3 | % | | 8.1 | % |
| 6. Protecta | 2.3 | % | | 2.7 | % | | 3.0 | % |
| Annual Written Premiums (Soles in millions) | 23,437 | | | 25,623 | | | 27,765 | |
Source: SBS + SUSALUD
(1)P&C + Life + Corporate Health Insurance Businesses
We believe Grupo Pacífico has a relatively well-diversified product portfolio, with a composition comparable to that of the overall Peruvian insurance industry. In contrast to the Latin-American region, Peru maintains a low insurance penetration level: as of December 31, 2025, the region has an insurance penetration level of 3.2%, while Peru’s was 2.5% in 2025, according to the SBS and BCRP.
In 2025, the Peruvian insurance market registered an increase of 8.4% in total written premiums (S/27,765 million compared to S/25,623 million in 2024) driven by Annuities, Individual Life, and Credit life. This growth rate was higher than that of nominal gross domestic product (GDP), which increased 3.4% in the same period. The increase in direct premiums was mainly driven by the life segment, for which production increased 16.3% from 2024 to 2025, partially offset by P&C segment, where production declined by 1.1% over the same period.
Life and P&C insurance market
In 2025, total written premiums in the Peruvian life and P&C insurance sectors increased 8.3% compared to 2024, lower than the 9.5% increase from 2023 to 2024 (after an increase of 8.1% from 2022 to 2023). Written premiums in the Peruvian life and P&C insurance market totaled S/24,035 million in 2025, higher than S/22,186 million registered in 2024, and higher than S/20,266 million registered in 2023. Total written premiums in the Peruvian life insurance business increased 16.3% from 2024 to 2025 (after an increase of 14.4% from 2023 to 2024), and those in the Peruvian P&C business decreased 1.1% from 2024 to 2025 (after an increase of 4.1% from 2023 to 2024), according to the SBS.
According to the SBS, in 2025, Pacífico’s written premiums in Peru’s consolidated life and P&C businesses were 22.6% of the Peruvian market, compared to 24.2% in 2024 and 24.2% in 2023. Grupo Pacífico’s written premiums in 2025 were the second largest of any company in Peru’s consolidated life and P&C insurance market.
Life Insurance market
In 2025, written premiums in Peru’s life insurance market totaled S/14,004.8 million, which represents an increase of 16.3% from 2024 and 33.1% from 2023, according to the SBS. This was mainly attributable to Annuities (which increased 36.2% from 2024 and 89.2% from 2023), Individual Life (which increased 27.7% from 2024 and 56.5% from 2023), and to Credit Life (which increased 8.5% from 2024 and 13.2% from 2023).
According to the SBS, Grupo Pacífico had the second largest market share in the Peruvian life insurance market by written premiums (22.7%) in 2025, which was lower than its market share of 26.6% in 2024. In 2025, Grupo Pacífico’s written premiums decreased 0.8% from 2024, lower than Peru’s growth of 16.3%. The decrease in Grupo Pacífico’s written premiums was primarily attributable to D&S, which decreased 95.3% from 2024 after Pacifico was not awarded any tranche under the SISCO VIII contract. The drop in the D&S Line was partially attenuated by Individual Life, which increased 49.3% from 2024 due to higher sales in single premiums; and Credit Life, which increased 20.0% from 2024 due to growth in premiums through Bancassurance and Alliances (Banco de la Nación and Falabella).
P&C Insurance market
In 2025, written premiums in Peru’s P&C insurance market totaled S/10,029.8 million, a decrease of 1.1% compared to 2024 and 3.0% from 2023, according to the SBS. This result was primarily attributable to a decrease in P&C risk insurance policies, particularly fire risk insurance (which decreased 18.6% from 2024 and 16.9% from 2023), earthquake risk insurance (which decreased 11.3% from 2024 and 1.1% from 2023), and aviation risk insurance (which decreased 20.8% from 2024 and 16.4% from 2023). The decrease in P&C risk insurance policies was partially mitigated by medical assistance premiums (which increased 5.1% from 2024 and 5.2% from 2023) and cars premiums (which increased 3.5% from 2024 and 6.6% from 2023).
According to the SBS, Grupo Pacífico had the second largest market share in Peru’s P&C sector (22.4%) in 2025, which is higher than its 21.3% market share in 2024. Grupo Pacífico’s written premiums increased 3.6% from 2024, which is higher than Peru’s growth rate of -1.1%. The increase in Grupo Pacífico’s written premiums was mainly driven by Medical Assistance (which increased 8.0% from 2024) due to higher sales of oncological products; P&C risks premiums (which increased 4.2% from 2024), due to theft insurance for credit cards, earthquake risk and insurance and marine hull insurance; and SOAT (which increased 10.7% from 2024), due to higher sales in Yape.
Corporate Health Insurance and Medical Services market
According to SUSALUD, in 2025, written premiums in Peru’s health insurance market totaled S/3,730.5 million, which represented an increase of 8.6% compared to 2024 and 17.6% from 2023. Based on figures from SUSALUD, Grupo Pacífico had Peru’s largest market share in the health insurance market in 2025 (42.3%, compared to 43.6% in 2024 and 43.1% in 2023).
The healthcare services sector in Peru is marked by a significant concentration of public infrastructure and continues to demonstrate a shortfall in the number of hospital beds relative to the standards recommended by the World Health Organization. As of early 2026 figures, Peru had approximately 27,000 hospital beds, with 78% operated by the Ministry of Health (MINSA) and Regional Governments, 15% operated by ESSALUD, and 7% attributable to the private sector.
The market for private healthcare services in Peru is competitive and fragmented. The Group competes primarily with other private operators of hospitals and outpatient medical facilities, which vary in size, geographic presence and
scope of medical services. Competition is based on factors such as pricing, range and complexity of medical services offered, quality and continuity of care, availability of specialized physicians, location of facilities and relationships with private health insurers.
The private healthcare market includes operators that are vertically integrated with health insurance providers, combining the provision of medical services with the underwriting or administration of private health insurance plans. As part of Pacífico EPS, the Group’s medical services operations benefit from patient flows generated by affiliated private health insurance plans, while continuing to compete for patients covered by other private insurers and for out-of-pocket patients.
Key competitors include integrated healthcare groups operating hospital networks, oncology centers and outpatient services, such as Auna, as well as hospital networks affiliated with competing insurance providers, including Clínica Internacional, which has ties to Rímac Seguros. Certain private insurers operate or are affiliated with their own hospital and clinic networks, which compete directly with independent healthcare providers while also acting as payers for medical services. This market structure may affect pricing, referral patterns and contractual relationships between healthcare providers and private insurers.
5.3.2Prima AFP
As of December 31, 2025, there are four companies in the PPS, including Prima AFP.
According to the SBS, assets under management in the PPS reached S/ 115.1 billion, of which Prima AFP managed S/32.8 billion. This represented a market share of 28.5%, compared with a market share of around 30% in prior years, including 2024 (30.0%) and 2023 (30.0%).
As of December 31, 2025, the PPS reached 10.3 million affiliates, of which 2.4 million were Prima AFP’s customers, representing a market share of 22.9%. Collections in the PPS in 2025 reached S/17.3 billion, of which S/4.4 billion was collected by Prima AFP, representing a market share of 25.5%.
As discussed below under “PPS Reforms”, the Peruvian government began a process of reforming the PPS in 2012 through the passage of the PPS Reform Law. This reform contemplated a tender process to be held every 24 months, in which the AFP that offers the lowest management fee wins the tender. As a result, new workers who enter the PPS become members of the tender holder and remain in it for at least 24 months.
The following table shows the PPS tender processes held to date and their respective winners:
| | | | | | | | | | | |
| No. | Date Held | Period | Winner |
| - | September 2012 | October 2012 – May 2013 | Prima AFP |
| 1st | December 2012 | June 2013 – May 2015 | AFP Habitat |
| 2nd | December 2014 | June 2015 – May 2017 | AFP Habitat |
| 3rd | December 2016 | June 2017 – May 2019 | Prima AFP |
| 4th | December 2018 | June 2019 – May 2021 | AFP Integra |
| 5th | December 2020 | June 2021 - May 2023 | AFP Integra |
| 6th | December 2022 | June 2023 - May 2025 | AFP Integra |
| 7th | December 2024 | June 2025 - May 2027 | Profuturo AFP |
5.4Investment Management and Advisory
Asset Management
In Peru, we compete in the mutual funds market (where we maintain leadership with a 33% market share). We also compete with investment funds, and mandates with Fund Management Companies belonging to the main financial groups operating in the country, and non-banking Fund Management Companies with local and regional operations. This includes managing funds and mandates investing in traditional, alternative, and structured products.
In Colombia, we compete in the collective investment funds market (with a 8% market share). We also compete with private equity funds, and investment trusts that primarily invest in traditional and alternative assets with local stockbrokers and fiduciaries. Regarding voluntary pension funds, we compete with major mandatory pension funds and some fiduciaries.
In Chile, we compete in the mutual funds market (with a 1% market share). We also compete with investment funds (public and private), and third-party portfolio management with non-banking General Fund Managers (AGF) with regional operations and a focus on Latin America.
In Offshore Funds, we also compete with Global Asset Managers that have Latin American fixed or variable income funds and are regulated Undertaking for Collective Investment in Transferable Securities (UCITS) funds.
Wealth Management
In Wealth Management, we serve the Affluent, High-net-worth and ultra-high-net worth client segments with several competitors that we can aggregate into three groups:
1.Bank-associated wealth managers with local presence
2.Independent “pure play” wealth managers
3.Global wealth managers
We differentiate our offer from our competitors through a combination of tailored on-shore and off-shore investment solutions, specialized customer experience and a comprehensive view of our client’s portfolio regardless of the custodian.
Moreover, we directly compete with digital wealth management platforms, which have emerged in the region, with our proprietary digital solution “tyba por Credicorp Capital”.
Capital Markets
Through the Capital Market, we operate in the Securities Brokers and Intermediaries sector, which comprises establishments primarily engaged in the buying, selling, and brokerage of securities (secondary market), as well as the placement of securities issuances (primary market).
In capital markets, our brokerage house in Peru held the largest market share in equities (26% of traded volume) and the largest in fixed income (51% of traded volume), excluding the volumes outside of the stock market, according to the BVL. Similarly, our brokerage company in Colombia held the largest market share among brokers in equities (21% of traded volume) and in fixed income (29% of traded volume) according to the Colombian Stock Exchange. In Chile, we held a 4% market share in equities and a 9% share in fixed income, based on traded volume reported by the Santiago Stock Exchange.
Trust Services
In Peru, we hold a solid leadership position in fiduciary custody services for institutional clients; however, for more mass-market products, we believe there is room for growth, provided that we strengthen our distribution processes, considering that we operate in a market with limited size. On the other hand, in Colombia we see growth opportunities, given that we are a relatively young trust company and that the Colombian trust services market is deeper than the Peruvian one.
(6)Supervision and regulation
6.1Credicorp
Credicorp Ltd. is an exempted company located in Bermuda. Credicorp maintains a presence and conducts its activities in Peru, Cayman Islands, Bolivia, Colombia, Chile, Mexico, Panama, and the United States through its different LoBs and subsidiaries.
Other than as described under “ITEM 3. KEY INFORMATION – 3. D Risk Factors –9 Credicorp, as a Bermuda exempted company, may be adversely affected by any change in Bermuda law or regulation,” there are no applicable regulations under Bermuda law that are likely to materially impact our operations as they are currently structured. Under Bermuda law, there is no regulation applicable to Credicorp as a holding company that would require that we separate the operations of our subsidiaries incorporated and existing outside Bermuda.
Our common shares are listed on the NYSE. We are therefore subject to regulation by the NYSE and the SEC as a “foreign private issuer”. We also must comply with the Sarbanes-Oxley Act of 2002.
We are subject to certain requirements set forth by the Peruvian Banking and Insurance Law, as well by certain banking resolutions issued by the SBS, including the Peruvian Consolidated Supervision of Financial and Mixed Conglomerates Regulation. These regulations affect us primarily in the areas of reporting, risk control guidelines, limitations, ratios, and capital requirements.
Since our common shares are listed on the BVL in addition to the NYSE, we are subject to certain SMV and BVL reporting requirements. See “Item 9. The Offer and Listing – 9.C Markets – (2) Market Regulation”. The SMV issued SMV Resolution 016-2019-SMV/01 - “Guidelines for the qualification of Independent Directors”, which are not binding rules, but recommendations to the issuers listed on the BVL and under SMV supervision.
(i)Capital Adequacy Requirements
On September 29, 2010, the SBS issued SBS Resolution No. 11823-2010, which established the methodologies for calculating the regulatory capital and capital requirements for financial and mixed conglomerates. Article 4 of SBS Resolution 11823-2010 identifies two categories of consolidated groups: (i) the financial system consolidated group and (ii) the insurance system consolidated group. A combined group of companies formed by these two categories of entities is called a financial group. Each of the financial system consolidated group, the insurance system consolidated group and the financial group is required to hold regulatory capital that is greater than or equal to the capital requirements applicable to each respective group. These provisions have been further refined through subsequent amendments, particularly the 2025 update, which introduced additional adjustments to the accounting framework for consolidation, the determination of effective regulatory capital, and reporting requirements to the SBS.
The capital requirements applicable to the financial group are the sum of the capital requirements applicable to the financial system consolidated group and the insurance system consolidated group. The capital requirements applicable to the financial system consolidated group and to the insurance system consolidated group are the sum of the capital requirements applicable to each of the companies that belong to each respective group. For unsupervised companies, regulatory capital is required to be the greater of: (i) 10% of third-party assets or (ii) the ratio of third-party assets over total assets multiplied by the sum of paid-in-capital, legal reserves, supplementary capital premiums, voluntary reserves distributable only with prior SBS approval and retained earnings with capitalization agreements net of current and past years’ losses.
Article 6 of SBS Resolution No. 11823-2010 provides that regulatory capital of the consolidated groups comprises the sum of basic capital and supplementary capital and is calculated as follows:
•Basic Capital: Basic Capital or Tier 1 capital is comprised of:
(i)paid-in-capital (which includes common stock and perpetual non-cumulative preferred stock), legal reserves, supplementary capital premiums, voluntary reserves distributable only with prior SBS approval and retained earnings with capitalization agreements (that is, earnings that the shareholders or the Board of Directors, as the case may be, have committed to capitalize as common stock); and
(ii)other elements that have characteristics of permanence and loss absorption that are in compliance with regulations enacted by the SBS.
Items deducted from Tier 1 capital include:
(a)current and past years’ losses;
(b)deficits of loan loss provisions;
(c)goodwill resulting from corporate reorganizations or acquisitions; and
(d)half of the amount referred to in “Deductions” below. Absent any Tier 2 capital, 100% of the amount referred to in “Deductions” below must be deducted from Tier 1 capital.
The elements referred to in item (ii) above should not exceed 17.65% of the amount resulting from adding components from clause (i) of Basic Capital or Tier 1 capital, net of the deductions in (a), (b) and (c) in the list above.
•Supplementary Capital: Supplementary capital comprises the sum of Tier 2 and Tier 3 capital. Tier 2 capital elements include:
(a)paid-in-capital, legal reserves, supplementary capital premiums, and voluntary reserves that may be reduced without prior consent from the SBS;
(b)the eligible portion of the consolidated redeemable subordinated debt and of any other components that have characteristics of debt and equity as provided by the SBS;
(c)for banks using the SBS standardized approach method, the generic loan loss provision up to 1.25% of total credit Risk Weighted Assets (RWAs); or, alternatively, for banks using the internal ratings-based (IRB) method, the generic loan loss provision up to 0.6% of total credit RWAs (pursuant to Article 189 of Law No. 26702); and half of the amount referred to in “Deductions” below. Tier 3 capital comprises consolidated redeemable subordinated debt that is incurred with the sole purpose of covering market risk.
•Deductions: The following elements are deducted from Tier 1 and Tier 2 capital:
(a)for the financial system consolidated group, all investments in shares and subordinated debt issued by other local or foreign financial institutions and insurance companies; for the insurance system consolidated group, all investments in shares and subordinated debt issued by other local or foreign insurance companies;
(b)all investments in shares and subordinated debt issued by entities that are part of the holding but do not belong to any of the consolidated groups;
(c)for the financial system group, (i) the amount by which an investment in shares issued by a real sector company which is neither part of the holding nor part of the negotiable portfolio exceeds 15% of the financial system consolidated group’s regulatory capital; and (ii) the amount by which the aggregate amount of all investments in shares issued by real sector companies which are not part of the Conglomerate and which are not part of the financial system consolidated group’s negotiable portfolio exceeds 60% of the regulatory capital.
Article 7 of SBS Resolution No. 11823-2010 provides that the following limits apply when calculating regulatory capital: (i) the aggregate amount of supplementary capital must not exceed the aggregate amount of basic capital; (ii) the amount of redeemable Tier 2 subordinated instruments must be limited to 50% of the amount resulting from the sum of Tier 1 elements in “Basic Capital” above; and (iii) the amount of Tier 3 capital must be limited to 250% of the sum of Tier 1 elements.
Article 10 of SBS Resolution No. 11823-2010 provides that regulatory capital of the financial group is comprised of the sum of basic capital and supplementary capital and is calculated as follows:
•Basic Capital: Basic Capital or Tier 1 capital comprises:
(i)paid-in-capital (which includes common stock and perpetual non-cumulative preferred stock), legal reserves, supplementary capital premiums, voluntary reserves distributable only with prior SBS approval, and retained earnings with capitalization agreements (that is, earnings that the shareholders or the Board of Directors, as the case may be, have committed to capitalize as common stock); and
(ii)other elements that have characteristics of permanence and loss absorption that are in compliance with regulations enacted by the SBS.
•Items deducted from Tier 1 capital include:
(i)current and past years’ losses;
(ii)deficits of loan loss provisions;
(iii)goodwill resulting from corporate reorganizations or acquisitions; and
(iv)half of the amount referred to in “Deductions” below. Absent any Tier 2 capital, 100% of the amount referred to in “Deductions” below must be deducted from Tier 1 capital.
•Supplementary Capital: Supplementary capital is comprised of the sum of Tier 2 and Tier 3 capital. Tier 2 capital elements include:
(i)paid-in-capital, legal reserves, supplementary capital premiums, and voluntary reserves that may be reduced without prior consent from the SBS;
(ii)the eligible portion of the consolidated redeemable subordinated debt and of any other components that have characteristics of debt and equity as provided by the SBS;
(iii)the generic loan loss provision included in the supplementary capital of the financial consolidated group; and
(iv)half of the amount referred to in “Deductions” below.
Tier 3 capital comprises consolidated redeemable subordinated debt computed in the consolidated groups.
•Deductions: The following elements are deducted from Tier 1 and Tier 2 capital:
(i)all investments in shares and subordinated debt issued by other local or foreign financial institutions and insurance companies;
(ii)all investments in shares and subordinated debt issued by entities that are part of the conglomerate but do not belong to any of the consolidated groups; and
(iii)all investments in shares issued by real sector companies that are not part of the conglomerate and the negotiable portfolio, computed as deductions in the financial system consolidated group.
This regulatory framework must be read in conjunction with its subsequent amendments, including the latest modifications introduced by Resolution SBS No. 04200‑2025, which updated various consolidation, solvency, and reporting parameters effective January 1, 2026.
For further information, see “ITEM 5. OPERATING AND FINANCIAL REVIEW AND PROSPECTS – 5. B Liquidity and Capital Resources – (1) Capital Adequacy and Solvency Management – (1.1) Credicorp”.
Regulatory capital from January 2024.
On September 14, 2023, the SBS issued SBS Resolution No. 03004-2023, revising the methodologies for calculating the regulatory capital and capital requirements for financial and mixed conglomerates. Changes were made to the conglomerate regulation to reflect the regulatory capital changes implemented in the Peruvian financial system in 2023, according to the Legislative Decree No. 1531. The new regulatory capital framework defines three capital requirements: CET1, Tier 1 Capital and Total Regulatory Capital for the financial system consolidated group and the financial group.
Financial System Consolidated Group
Article 5-A of SBS Resolution No. 03004-2023 sets forth the capital requirements for the financial system consolidated group. The CET1 Capital requirement will be equal to or greater than the sum of 45% of the financial system consolidated group capital requirement, including 100% of combined buffers. The Tier 1 Capital requirement will be equal to or greater than the sum of 60% of the financial system consolidated group capital requirement, including 100% of combined buffers. The total capital requirement will be equal or greater than the sum of 100% of the financial system consolidated group capital requirement, including 100% of combined buffers and 100% of the additional risk buffer. Combined buffers are the sum of the conservation buffer, the economic cycle buffer and concentration risk buffer. Additional risk buffer refers to credit concentration risk.
Article 6-B of SBS Resolution No. 03004-2023 states that the capital requirement for companies within the financial system consolidated group should incorporate:
(a)For supervised companies with capital requirements subject to risk assumed in operations: the sum of credit risk capital requirements, market risk capital requirements and operational risk capital requirements; and
(b)For unsupervised companies, the greater of: (i) 10% of third-party assets or (ii) the ratio of third-party assets over total assets multiplied by the sum of paid-in-capital, legal reserves, supplementary capital premiums, voluntary reserves distributable only with prior SBS approval, and retained earnings with capitalization agreements net of current and past years’ losses.
Article 5-B of SBS Resolution No. 03004-2023 states that the financial system consolidated group regulatory capital is composed of CET1 Capital, Additional Tier 1 Capital and Tier 2 Capital.
CET 1 Capital:
(a)Common shares and other capital instruments, as long as they have been paid and comply with the conditions indicated by the SBS;
(b)Issue premium of common shares and other capital instruments indicated in subparagraph (a);
(c)Earnings from prior years and from the year in progress of Credicorp’s financial system consolidated group companies that comply with the SBS’s accounting regulations as designated by the SBS;
(d)Unrealized gains attributable to available for sale investments that meet the conditions designated by the SBS;
(e)Legal reserves and optional reserves;
(f)Donations that meet the conditions designated by the SBS;
(g)Regulatory adjustments that include the following deductions:
(i)Financial system consolidated group losses from prior years and from the current year as designated by the SBS;
(ii)Unrealized losses attributable to available for sale investments as designated by the SBS;
(iii)Shortfalls in provisions determined by the SBS;
(iv)Goodwill resulting from reorganizations or acquisitions;
(v)Intangible assets, other than those indicated in item (iv);
(vi)Deferred income tax assets originated due to carryover losses;
(vii)Deferred income tax assets, net of deferred income tax liabilities, originated due to temporary differences that exceed the threshold established by the SBS;
(viii)Direct or indirect holding of instruments of capital included in the computation of CET 1 Capital, which have been issued by the company itself and that are kept in treasury, and instruments owned by the company and included in the computation of CET 1 Capital for which there is a present or contingent obligation to acquire them by virtue of contractual obligations;
(ix)Investments in equity instruments included in the computation of CET 1 Capital, issued by companies in Peru or abroad that do not belong to the financial system consolidated group;
(x)For companies using internal models to calculate capital requirements for credit risk, the difference between expected loss and total provisions for credit risk, when this difference is positive;
(xi)Additional Tier 1 Capital deductions that exceed the Additional Tier 1 Capital additions; and
(xii)The portion of the difference between regulatory capital and capital requirements that come from elements of CET 1 Capital that do not correspond to controlling interests as calculated according to SBS methodology.
Additional Tier 1 Capital:
(a)Equity instruments and subordinated debt that meet the conditions of Additional Tier 1 Capital as determined by the SBS;
(b)Share premium of capital instruments indicated in item (a);
(c)Regulatory adjustments that include the following deductions from Additional Tier 1 Capital:
(i)Direct or indirect holding of instruments of capital and/or subordinated debt included in the computation of Additional Tier 1 Capital, which have been issued by the company itself and that are kept in the treasury, and instruments owned by the company and included in the computation of Additional Tier 1 Capital for which there is a present or contingent obligation to acquire them by virtue of contractual obligations;
(ii)Investments in equity and/or subordinated debt instruments included in the computation of Additional Tier 1 Capital issued by companies in Peru or abroad that do not belong to the financial system consolidated group;
(iii)Tier 2 Capital deductions that exceed the Tier 2 Capital additions; and
(iv)The portion of the difference between regulatory capital and capital requirement that comes from elements of Additional Tier 1 Capital that do not correspond to controlling interest as calculated according to SBS methodology.
Tier 2 Capital:
(a)Equity instruments and subordinated debt that meet the conditions of Tier 2 Capital as determined by the SBS;
(b)Share premium of capital instruments indicated in item (a);
(c)For companies within the financial system consolidated group subject to capital requirements for credit risk, the generic loan loss provision up to 1.25% of credit RWAs; or, alternatively, for banks using the internal ratings-based (IRB) method, the generic loan loss provision up to 0.6% of total credit RWAs;
(d)Regulatory adjustments that include the following Tier 2 net worth deductions:
(i)Direct or indirect holding of instruments of capital and/or subordinated debt included in the computation of Regulatory Tier 2 Capital, which have been issued by the company itself and that are kept in the treasury, and instruments owned by the company and included in the computation of Tier 2 Capital for which there is a present or contingent obligation to acquire them by virtue of contractual obligations;
(ii)Investments in equity and/or subordinated debt instruments included in the computation of Tier 2 Capital issued by companies in Peru or abroad that do not belong to the financial system consolidated group; and
(iii)The portion of the difference between regulatory capital and capital requirement that comes from elements of Tier 2 Capital that do not correspond to controlling interest as calculated according to SBS methodology.
Article 6-A of SBS Resolution No. 03004-2023 sets forth the following limits within regulatory capital:
(a)Additional Tier 1 Capital must not exceed one-third of CET 1 Capital. The excess above said limit can be included in certain companies as Regulatory Tier 2 Capital.
(b)Regulatory Tier 2 Capital should not be greater than two-thirds of the Regulatory Tier 1 Capital. The excess over said limit is not in the computation of total regulatory capital.
Insurance System Consolidated Group
Article 7-A of SBS Resolution No. 03004-2023 sets forth the capital requirements for the insurance system consolidated group, which will be equal to or greater than the sum of 100% of the insurance system consolidated group capital requirement.
Article 8-B of SBS Resolution No. 03004-2023 states that the capital requirement for companies within the insurance system consolidated group should incorporate:
a)For supervised companies with capital requirements subject to risk assumed in operation: the sum of capital requirements associated with solvency, guarantee fund, credit risk and additional risks;
b)For unsupervised companies, the greater of: (i) 10% of third-party assets or (ii) the ratio of third-party assets over total assets multiplied by the sum of paid-in-capital, legal reserves, supplementary capital premiums, voluntary reserves distributable only with prior SBS approval and retained earnings with capitalization agreements net of current and past years’ losses.
Article 7-B of SBS Resolution No. 03004-2023 states that the insurance system consolidated group regulatory capital is composed of:
(a)Common stock and perpetual non-cumulative preferred stock;
(b)Supplementary capital premiums;
(c)Legal reserves and voluntary reserves;
(d)Retained earnings with capitalization agreements (that is, earnings that the shareholders or the Board of Directors, as the case may be, have committed to capitalize as common stock);
(e)Donations that meet the conditions designated by the SBS;
(f)Equity instruments and subordinated debt that meet the conditions designated by the SBS; and
(g)Regulatory adjustments that include the following deductions:
(i)Losses from prior years and from the current year;
(ii)Unrealized losses in available for sale investments, as determined by the SBS;
(iii)Shortfalls in provisions determined by the SBS;
(iv)Goodwill;
(v)Intangible Assets;
(vi)Investments in equity or subordinated debt instruments, issued by companies that do not form part of the insurance system consolidated group, in Peru or abroad;
(vii)Additional Tier 1 Capital deductions that exceed the Additional Tier 1 Capital additions;
(viii)The portion of the difference between regulatory capital and the capital requirement that comes from capital or subordinated debt elements that do not correspond to controlling interest, as calculated according to the SBS methodology; and
(ix)Unrealized losses due to variations in the mathematical reserve following movements in interest rates, as determined by the SBS.
Financial Group
Article 9 of SBS Resolution No. 03004-2023 sets forth the capital requirements for the financial group. The CET 1 Capital requirement will be equal to or greater than the sum of 45% of the financial group capital requirement, including 100% of combined buffers. The Tier 1 Capital requirement will be equal to or greater than the sum of 60% of the financial system consolidated group capital requirement, including 100% of combined buffers. The total capital requirement will be equal to or greater than the sum of 100% of the financial system consolidated group capital requirement, including 100% of combined buffers and 100% of the additional risk buffer. Combined buffers are the sum of the conservation buffer, the economic cycle buffer and the concentration risk buffer. The additional risk buffer refers to credit concentration risk.
Article 11 of SBS Resolution No. 03004-2023 states that the capital requirement for companies within the financial group should incorporate the sum of the capital requirements for financial system consolidated group and the capital requirements for insurance system consolidated group.
Article 10 of SBS Resolution No. 03004-2023 states that the financial system consolidated group regulatory capital is composed of CET 1 Capital, Additional Tier 1 Capital and Tier 2 Capital.
CET 1 Capital:
(a)Common shares and other capital instruments, as long as they have been paid and comply with the conditions indicated by the SBS;
(b)Issue premium of common shares and other capital instruments indicated in subparagraph (a);
(c)Earnings from prior years and from the year in progress of Credicorp’s financial system consolidated group companies that comply with the SBS’s accounting regulations as designated by the SBS;
(d)Unrealized gains attributable to available for sale investments that meet the conditions designated by the SBS;
(e)Legal reserves and optional reserves;
(f)Donations that meet the conditions designated by the SBS; and
(g)Regulatory adjustments that include the following deductions:
(i)Financial group losses from prior years and from the current year as designated by the SBS;
(ii)Unrealized losses attributable to available for sale investments as designated by the SBS
(iii)Shortfalls in provisions determined by the SBS;
(iv)Goodwill resulting from reorganizations or acquisitions;
(v)Intangible assets, other than those indicated in item (iv);
(vi)Deferred income tax assets originated due to carryover losses;
(vii)Deferred income tax assets, net of deferred income tax liabilities, originated due to temporary differences that exceed the threshold established by the SBS;
(viii)Direct or indirect holding of instruments of capital included in the computation of CET 1 Capital, which have been issued by the company itself and that are kept in treasury, and instruments owned by the company and included in the computation of CET 1 Capital for which there is a present or contingent obligation to acquire them by virtue of contractual obligations;
(ix)Investments in equity instruments included in the computation of CET 1 Capital, issued by companies in Peru or abroad that do not belong to the financial group;
(x)For companies using internal models to calculate capital requirements for credit risk, the difference between expected loss and total provisions for credit risk, when this difference is positive;
(xi)Additional Tier 1 Capital deductions that exceed the Additional Tier 1 Capital additions; and
(xii)The portion of the difference between regulatory capital and capital requirements that come from elements of CET 1 Capital that do not correspond to controlling interest, as calculated according to SBS methodology.
Additional Tier 1 Capital:
(a)Equity instruments and subordinated debt that meet the conditions of Additional Tier 1 Capital as determined by the SBS;
(b)Share premium of capital instruments indicated in item (a); and
(c)Regulatory adjustments that include the following deductions from Additional Tier 1 Capital:
(i)Direct or indirect holding of instruments of capital and/or subordinated debt included in the computation of Additional Tier 1 Capital, which have been issued by the company itself and that are kept in the treasury, and instruments owned by the company and included in the computation of Additional Tier 1 Capital where there is a present or contingent obligation to acquire them by virtue of contractual obligations;
(ii)Investments in equity instruments included in the computation of CET 1 Capital, issued by companies in Peru or abroad that do not belong to the financial group;
(iii)Tier 2 Capital deductions that exceed the Tier 2 Capital additions; and
(iv)The portion of the difference between regulatory capital and capital requirement that comes from elements of Additional Tier 1 Capital that do not correspond to controlling interest, as calculated according to SBS methodology.
Tier 2 Capital:
(a)Equity instruments and subordinated debt that meet the conditions of Tier 2 Capital as indicated by the SBS;
(b)Share premium of capital instruments indicated in item (a);
(c)For companies within the financial system consolidated group subject to capital requirements for credit risk, the generic loan loss provision up to 1.25% of credit RWAs; or, alternatively, for banks using the internal ratings-based (IRB) method, the generic loan loss provision up to 0.6% of total credit RWAs; and
(d)Regulatory adjustments that include the following Tier 2 net worth deductions:
(i)Direct or indirect holding of instruments of capital and/or subordinated debt included in the computation of Regulatory Tier 2 Capital, which have been issued by the company itself and that are kept in the treasury, and instruments owned by the company and included in the computation of Tier 2 Capital for which there is a present or contingent obligation to acquire them by virtue of contractual obligations;
(ii)Investments in equity instruments included in the computation of CET 1 Capital, issued by companies in Peru or abroad that do not belong to the financial system consolidated group; and
(iii)The portion of the difference between regulatory capital and capital requirement that comes from elements of Tier 2 Capital that do not correspond to controlling interest, as calculated according to SBS methodology.
(ii)Other Regulations
The Dodd-Frank Act imposes obligations on swap dealers in respect of swap transactions, including trading relationship documentation and disclosure obligations.
EMIR is a European Union regulation aimed at reducing systemic counterparty risk by increasing transparency of both parties in over-the-counter transactions.
Credicorp complies with these Dodd-Frank Act and EMIR requirements through implementation of ISDA Protocols, addressing management of existing relationships and compliance with counterparty requirements.
6.2Subsidiaries
6.2.1Peru
Credicorp’s main subsidiaries, BCP Stand-alone, Mibanco, Grupo Pacífico, Prima AFP, and Credicorp Capital Peru, are located in Peru and they offer banking and financial services. Furthermore, they are regulated by Peruvian laws and supervised by Peruvian Financial Regulators.
In Peru, financial institutions, insurance companies and pension funds are regulated by the Peruvian Banking and Insurance Law. In general, it provides for loan loss reserve standards, brings asset risk weighting in line with Basel Committee on Banking Regulations and Supervisory Practices of International Settlements (Basel Committee) guidelines, empowers the SBS to supervise financial holding companies, and includes specific treatment of a series of recently developed products in the capital markets and derivatives areas.
(i)Peruvian Regulators
The Peruvian Central Bank (BCRP)
Article 84 of Chapter 5 of the 1993 Constitution establishes that the BCRP is a legal person of public rights and has autonomy within the framework of its Organic Law. BCRP’s primary role is to ensure the stability of the Peruvian monetary system. According to Article 2 of its Organic Law, the BCRP functions are to regulate Peru’s money supply, manage international reserves, issue bills and coins, and report on national finances.
The BCRP’s seven‑member Board of Directors is the highest decision‑making authority of the central bank and is responsible for formulating and overseeing monetary policy, establishing reserve requirements for entities within the financial system, and approving guidelines for the management of international reserves, decisions with which all entities in the Peruvian financial system must comply. Each Director serves a five‑year term, with four members appointed by the executive branch and three by Peru’s Congress; the Chairman is nominated by the executive branch but requires congressional approval. In practice, appointments to the Board are renewed every five years and broadly coincide with the presidential mandate.
The monetary policy of the BCRP has been conducted under an inflation-targeting scheme since January 2002. The BCRP seeks to anchor inflation expectations through the announcement of an inflation target range of 1% to 3% and makes monetary policy decisions by using a reference rate for the interbank market interest rate. Depending on economic conditions, the BCRP changes its reference interest rate preventively to keep inflation and its expectations in the target range. Once a month, the Board of Directors approves and announces the monetary program through a policy statement which includes a brief description of the recent macroeconomic evolution, the decision about the reference interest rate and rationale behind said decision, as well as interest rates for BCRP operations with the financial system.
The Central Reserve Bank of Peru’s (BCRP) current monetary easing cycle began in September 2023 and has reduced the policy interest rate from a historical peak of 7.75% to 4.25% as of April 2026. Over this period, the BCRP implemented cumulative rate cuts of 100 basis points in 2023, followed by 175 basis points in 2024 and an additional 75 basis points in 2025. The slower pace of monetary easing in 2025 reflected the policy rate’s convergence toward its estimated neutral level, as well as economic growth broadly aligned with potential output.The following table summarizes the reference interest rate changes from January 2023 to April 2026:
| | | | | |
Changes in BCRP's reference interest rate
(January 2023 – April 2026) |
| Date Held | Rate |
| January 2023 | 7.75% |
| September 2023 | 7.50% |
| October 2023 | 7.25% |
| November 2023 | 7.00% |
| December 2023 | 6.75% |
| January 2024 | 6.50% |
| February 2024 | 6.25% |
| April 2024 | 6.00% |
| May 2024 | 5.75% |
| August 2024 | 5.50% |
| September 2024 | 5.25% |
| November 2024 | 5.00% |
| January 2025 | 4.75% |
| May 2025 | 4.50% |
| September 2025 | 4.25% |
Additionally, the BCRP is responsible for managing the liquidity in the financial system so that the interbank rate stays close to the reference rate. Policy instruments include (i) market instruments, (ii) discount window instruments and (iii) reserve requirements.
(i)Market instruments
To remove liquidity from the financial system
BCRP Deposit Certificates (BCRP CD): BCRP CDs are used to regulate the liquidity of the financial system through the sterilization of banks’ surplus liquidity. They are issued through an auction mechanism for terms of between one month and three years. As of December 2025, the aggregate value of outstanding BCRP CDs was S/37.1 billion. Additionally to the traditional CDs in domestic currency, in 2026, the BCRP issued CDs and established that the issuance payment must be realized in US$; the payment at maturity is still in domestic currency. The stock of this CD (payable in Dollars) is US$ 2.2 billion, as of March 19, 2026.
BCRP Adjustable Deposit Certificates (BCRP CDRs): In addition to sterilizing banks’ surplus liquidity, BCRP CDRs target the reduction of depreciation pressures on the USDPEN exchange rate as the certificate is readjusted based on the variation in the exchange rate between the issue date and maturity date. The aggregate outstanding value of BCRP CDRs declined from S/7.8 billion in February 2021 to zero in May 2022. It increased afterwards in October 2023 to S/ 2.1 billion. As of December 2025, the aggregate value of outstanding BCRP CDRs was zero.
BCRP Deposit Certificates payable in U.S. Dollars (BCRP CDLDs): BCRP CDLDs were created in 2010 to address downward pressures on the exchange rate related to banks’ forward contracts. Through BCRP CDLDs, the BCRP issues a deposit certificate denominated in Soles but for which payment on the issue date and maturity date is done in U.S. Dollars. This is equivalent to a temporary purchase of dollars in the spot market sterilized by issuing BCRP CDs. This instrument has been used only twice–first at the end of 2010 and beginning of 2011 and second in 2017. Since March 2018, there have been no BCRP CDLDs outstanding.
BCRP Deposit Certificates at variable rate (BCRP CDVs): The yield of BCRP CDVs is subject to adjustment based on the reference interest rate or the overnight interbank index, as determined by the BCRP. BCRP CDVs are used to sterilize liquidity in an environment of high uncertainty about future interest rates that reduces demand for BCRP CD. Due to a macroeconomic environment characterized by high inflation and high interest rates, the instrument was used extensively starting in August 2021. Since June 2023, however, there have been no outstanding BCRP CDVs.
BCRP Term-deposits (BCRP DPs): BCRP DPs were created in 2010 in a context of significant short-term capital inflows to remove liquidity from the system when it replaced the issuance of BCRP CDs with terms of one month or less with BCRP DPs. In December 2025, the aggregate value of outstanding BCRP DPs was S/9.4 billion.
To inject liquidity into the financial system
Reverse-repo: Through reverse repurchase agreements (repos), the BCRP can buy from financial system entities, with the commitment that those entities repurchase on an agreed date all the CDs issued by the BCRP, as well as all treasury notes and treasury bonds issued in Soles. This is done through an auction mechanism, and the regular terms of these transactions are between one business day and one week. Since 2008, reverse-repo transactions in U.S. Dollars have been authorized as a way to inject liquidity in U.S. Dollars. In April 2020, pension funds were authorized to participate in these transactions in the case of securities issued by the Republic of Peru that are registered in CAVALI. In December 2025, the value of outstanding reverse-repos was S/13.2 billion.
Credit-repo transactions: In April 2009, the BCRP was authorized to purchase credit portfolios temporarily represented in securities. In May 2020, the Peruvian government, through Legislative Decree No. 1508, created a program for the guarantee of credit portfolios of financial entities to provide liquidity support. The size of the program was S/7 billion and could be expanded up to an additional 20%. Under this framework, in May 2021, through Circular No. 011-2021-BCRP, the BCRP created credit-repo transactions with a government guarantee for liquidity support. The value of outstanding credit-repo transactions in December 2024 was S/2.3 billion and, in December 2025 was zero.
Government-backed credit repo transactions: Government-backed credit repo transactions were introduced in April 2020 under the Reactiva Peru Program framework. These transactions were part of the policies implemented to mitigate the negative economic impact of the COVID-19 pandemic. In these transactions, the entities involved (banks and other financial companies) sell to BCRP securities representatives of credits guaranteed by the Peruvian government, receive Soles and, at the same time, agree to repurchase those securities at a future date. The BCRP determines the rate it will charge for the funds and the allocation variable is the maximum interest rate that entities are willing to charge for these guaranteed credits. The BCRP adjudicates the auctioned funds starting with the bids that have the lowest rate. In this way,
it encourages lower credit rates that are ultimately determined through market mechanisms. The outstanding value of government-backed credit Repo transactions reached a peak of S/50.7 billion in December 2020 and has decreased since then to S/1.3 billion in December 2024. In December 2025, the outstanding was zero.
Repo-transactions conditioned on credit portfolio rescheduling: From June 2020 to October 2021, repo transactions conditioned on credit portfolio rescheduling were established to incentivize financial entities to reduce their loan interest rates. Under this program, the entities sell securities (reverse-repo, foreign exchange swaps and credit-repo) or foreign currency to the BCRP, receive domestic currency and are obliged, at the same time, to repurchase those securities or foreign currency at a future date, against the payment of Soles. The terms of these transactions ranged from 6 to 48 months and were completed only if the financial entities rescheduled their clients’ loan portfolios or loans bought from other financial entities in an amount at least the size of the repo transaction. In addition, the BCRP set conditions that included a requirement that entities set the interest rate applicable to rescheduled credits at a minimum discount of 200 bps the original interest rate. The effects of these transactions were reflected in better conditions for debtors in the financial system and aimed at a faster recovery from the COVID-19 pandemic’s negative shock to the local economy.
Repo-transactions conditioned on long-term credit expansion: Repo transactions conditioned on long-term credit expansion were established in April 2021 and concluded in December 2021, with the objective of improving the monetary policy transmission channel and continue strengthening the expansion of credit to the private sector. This program worked in a similar way to the repo transactions conditioned on credit portfolio rescheduling mentioned above, but the completion of these transactions occurred only if financial institutions increased their outstanding amount of corporate loans or mortgages in domestic currencies with terms of at least three years compared to January 1, 2021, levels.
Currency repos: Since March 2007, the BCRP has been allowed to use currency repos to inject liquidity in Soles against U.S. Dollar delivery. Through these transactions, the BCRP temporarily purchases dollars from financial institutions that commit to repurchase them at a future date. Since April 2011, this instrument has also been used to inject liquidity in Dollars. To accelerate the de-dollarization process, in December 2014, the BCRP established two new types of currency repos: (1) Repo – Expansion, which would provide liquidity in local currency to financial institutions for an amount up to 20% of such institution’s Total Liabilities Subject to Reserve Requirements (TOSE by its Spanish Initials) in U.S. Dollars, and under no circumstance could the median reserve requirement decrease below 25%; and (2) Repo – Substitution, which would provide local currency to financial institutions at spot foreign exchange prices to finance the re-denomination of their loans in U.S. Dollars. The outstanding amount of both instruments has been zero since 2019. However, the outstanding of regular FX repo stood at S/. 1.8 billion in December 2025.
Interest rate swaps: Interest rate swaps were launched to strengthen the transmission of monetary policy and incentivize the expansion of long-term credit. The BCRP can carry out these transactions via auction or direct placements with terms between 3 and 7 years. Through these derivatives, the BCRP assumes the commitment to pay a variable interest rate in exchange for the financial entity's commitment to pay a fixed interest rate. Thus, the BCRP provides financial system entities a hedging instrument for future interest rates hikes, which then incentivizes them to make long-term loans. The aggregate outstanding amount of these transactions has been zero since September 2023.
Reduce FX volatility
Buy-sell US$ in the spot market: The BCRP intervenes in the exchange rate market at its discretion to reduce PEN volatility. These interventions are sterilized by other monetary operations to keep the interbank interest rate around the reference level. In 2022, the BCRP's net sales in the spot market were US$1.2 billion, equivalent to around 10% of 2021 net sales, with the intervention concentrated in the second half of 2022. In 2023, the monetary authority barely intervened in the spot market selling US$81 million, while in 2024, it sold US$318 million centered in the first half of the year. In 2025, the BCRP shifted to net purchases, acquiring US$2.8 billion during the last two months of the year, and had further accumulated US$3.5 billion in the spot market during the present year as of the end of February 2026.
FX swaps: Foreign exchange swaps were initiated in 2014 to reduce exchange rate volatility generated by pressures in the derivatives market. With an FX swap sell (purchase), the BCRP provides exposure to the exchange rate by committing to pay (or to receive) a fixed rate in foreign currency plus the exchange rate variation, in exchange for receiving (or paying) an interest rate in domestic currency that can be variable or fixed. With this type of transaction, the parties typically exchange only net payments rather than the full nominal amounts. As of December 2025, the BCRP’s stock of FX swaps sell was S/ 20.4 billion, significantly lower than the S/48.3 billion of December 2024 (S/45.2 billion stock at the end of 2023).
(ii)Discount window instruments
Credit for monetary regulation (rediscounts): Rediscounts have the purpose of covering temporary liquidity imbalances of financial institutions. The financial entity that requests the use of this facility has to provide collateral (such as BCRP CDs, Treasury notes, Treasury bonds, CDR BCRP, private sector bonds with at least credit rating AA, among others).
Direct reverse-repo: Similar to the reverse-repos and currency-repos explained above, through direct reverse-repos, the BCRP can provide liquidity that financial entities demand directly, instead of through an auction, and accept a greater range of collateral.
Purchase of Treasury bonds in domestic currency: Initially, in November 2022, when they started buying treasury bonds, the objective was to reduce its volatility caused by uncertainty in global financial markets and the sales by pension funds due to the withdrawal of pension fund accounts approved by Peru’s congress. Now, it is also used as a mechanism to inject liquidity. According to the December 2024 BCRP inflation report, the amount of net sovereign bonds purchased as of November 29 was S/2.4 billion, below the legal limit of 5% of the monetary base of the previous year (S/4.5 billion). The outstanding of purchases between 2020 and 2025, as of December 3, was S/ 17.3 billion.
Overnight deposits: Overnight domestic and foreign currency deposits (deposits repaid the next business day) of financial entities were established in 1998 and are used to remove the excess liquidity at the end of the day. The daily average of overnight deposits by financial institutions in December 2025 was S/318 million in domestic currency and US$7,333 million.
(iii)Reserve requirements
Under Law No. 26702, banks and financial institutions are required to maintain legal reserve requirements for certain obligations. The BCRP establishes the reserve requirements that financial entities are required to meet in Peru as a percentage of their obligations in foreign and domestic currencies for banking products and instruments such as demand and time deposits, savings accounts, securities, certain bonds, and funds administered by banks. Additionally, the BCRP requires reserves on amounts due to foreign banks and other foreign financial institutions. Since January 2011, obligations of foreign subsidiaries and affiliates also have been subject to the reserve requirement.
In August 2021, through Circular No. 024-2021, the BCRP decided to: (i) establish a marginal reserve rate of 25% of the average obligations during a base period, which corresponds to July 2021; (ii) establish a minimum media reserve requirement rate of 4%, which rose to 4.25% in October 2021 and to 4.50% in November 2021; and (iii) increase the minimum level of current account deposits that entities subject to reserve requirements must keep at the BCRP as reserve funds from 0.75% to 1.00% in October 2021.
Additionally, the BCRP increased the minimum legal reserve requirement rate to 4.50% in November 2021, to 4.75% in December 2021 and to 5.00% in January 2022. Later, there were further gradual increases to 5.25% in February 2022, 5.50% in March 2022, 5.75% in April 2022 and 6.0% in May 2022, with the objective of complementing the reference interest rate hiking cycle and have better control over liquidity. Conversely, as the Central Bank started easing its monetary policy stance by lowering the interest rate, the Central Bank lowered the minimum legal reserve requirement rate to 5.50% in March 2024 and established an applicable rate of 5.50% on general TOSE. Moreover, the BCRP establishes that the median reserve requirement rate increases if foreign currency sales operations through forward and swap contracts exceed weekly or total limits. Banks can have excess funds which the BCRP remunerates. By December 2025, the average effective reserve requirement ratio for domestic currency was 5.6% (2024: 5.6%, 2023: 6.1%).
Regarding reserve requirements in foreign currency, according to the BCRP, in a context of partial dollarization, this tool has constituted an important support for financial system liquidity as its rate is higher than the one in domestic currency, due to the greater liquidity risk implied by intermediation in foreign currency. Since July 2018, the marginal rate has been 35%. Furthermore, to reduce credit dollarization, the BCRP imposes additional U.S. Dollar reserve requirements on financial institutions based on limits to the credit balance in U.S. Dollars for total credit, as well as mortgage and vehicle loans. This was suspended between April 2020 and April 2021. Additionally, in June 2023 the reserve rate for obligations with terms of less than two years with foreign financial entities was increased from 9% to 35% starting July 2023, while the additional reserve requirements corresponding to the evolution of total loans in foreign currency were updated. During 2024 and 2025, no changes were introduced to foreign currency reserve requirements. Thus, by December 2025, the average effective reserve requirement ratio for foreign currency was 35.5% (2024: 35.5%, 2023: 35.7%).
Total obligations subject to reserve requirements (TOSE, by its Spanish initials) in local currency stood at S/ 258,415 million (2024: S/ 232,889 million, 2023: S/ 209,806 million). Moreover, TOSE in foreign currency stood at US$ 43,425 million (2024: US$ 39,912 million, 2023: US$ 36,505 million).
The Superintendence of Banks, Insurance and Pension Funds (SBS)
The SBS is the regulatory authority in charge of supervising and regulating all financial, insurance and pension fund institutions in Peru. Peru’s constitution and the Peruvian Banking and Insurance Law, which contains the statutory charter of the SBS, grant the SBS the authority to oversee and control banks and financial institutions (apart from brokerage firms, which are regulated by the SMV), insurance and reinsurance companies, companies that receive deposits from the general public, AFPs and those that carry out activities linked or complementary to the corporate purpose of said companies mentioned in the Peruvian Banking and Insurance Law. The SBS is also responsible for supervising the BCRP to ensure that it abides by its statutory charter and Bye-laws.
The SBS has administrative, financial, and operating autonomy. Its objectives include protecting the public interest, ensuring the financial stability of the institutions over which it has authority and punishing violators of its regulations. Its responsibilities include: (i) reviewing and approving, with the assistance of the BCRP, the establishment and organization of subsidiaries of the institutions it regulates; (ii) overseeing mergers, dissolutions and reorganizations of banks, financial institutions and insurance companies; (iii) supervising financial, insurance and related companies from which information on an individual or consolidated basis is required, through changes in ownership and management control (this supervision also applies to holding companies that are not banks, such as Credicorp); (iv) reviewing the Bye-laws and amendments to Bye-laws of these companies; (v) issuing criteria governing the transfer of bank shares, when permitted by law, for valuation of assets and liabilities and for minimum capital requirements; (vi) controlling the bank’s Risk Assessment Center, to which all banks are legally required to provide information regarding all businesses and individuals with whom they deal without regard to the amount of credit risk (the information provided is made available to all banks to allow them to monitor individual borrowers’ overall exposure to Peru’s banks), and (vii) overseeing compliance with the maximum interest rates set by the BCRP. The SBS is also responsible for setting criteria for the establishment of financial or mixed conglomerates in Peru and for supervising these entities. As a result, in addition to its supervision of BCP Stand-alone, Mibanco, Grupo Pacífico and Prima AFP, the SBS also supervises Credicorp Ltd. because Credicorp Ltd. is a financial conglomerate conducting most of its operations in Peru.
The Superintendence of the Securities Market (SMV)
The SMV is the Peruvian government institution in charge of: (i) promoting the securities markets, (ii) making sure fair competition takes place in the securities markets, (iii) supervising the management of businesses that trade in the securities markets, and (iv) regulating such businesses’ activities and accounting practices. The SMV enjoys functional, administrative, economic, technical, and budgetary autonomy relative to other branches of the Peruvian government. Financial institutions such as banks, insurance companies, pension funds and brokerage firms must inform the SMV of significant events that affect their business and are required to provide financial statements to both the SMV and the BVL each quarter. Those institutions are also regulated by the SMV when they conduct operations in the local Peruvian securities market.
National Institute for the Defense of Competition and the Protection of Intellectual Property (INDECOPI)
INDECOPI regulates the protection of consumer rights in the Peruvian Consumer Protection Code. INDECOPI has the authority to issue fines to financial institutions if they violate the laws and regulations regarding the protection of consumer rights. INDECOPI also protects brands, creations and inventions, and look up for the proper functioning of the market, sanctioning acts of deception and unfair competition.
Peruvian Data Privacy Authority (ANPDP)
The ANPDP regulates the protection of personal data in Peru. The primary governing regulation for the ANPDP is Peruvian Data Privacy Law and Peruvian Data Privacy Regulation. ANPDP has the authority to issue fines to financial institutions that violate the laws and regulations regarding personal data protection.
(ii)Supervised Institutions
Under Peruvian law, financial institutions are classified as universal banks, insurance companies, pension funds, finance companies or other financial institutions such as small business finance companies, savings and loan corporations, financial services companies, investment banks, mutual housing associations, municipal savings and credit associations, and savings and credit cooperatives.
Financial institutions must obtain the SBS’s authorization before beginning operations. BCP Stand-alone and Mibanco are each classified as a universal bank, Grupo Pacífico is classified as an insurance company and Prima AFP is classified as a pension fund company.
Universal Banks
A universal bank, or bank, is defined by Peruvian Banking and Insurance Law as an enterprise whose principal business consists of (i) receiving money from the public, whether by deposits or by any other form of contract, and (ii) using such money (together with the bank’s own capital and funds obtained from other sources) to grant loans or discount documents, or in operations that are subject to market risks.
Banks are permitted to carry out various types of financial operations, including the following:
•receiving demand deposits, time deposits, savings deposits, and deposits in trust;
•granting direct loans;
•discounting or advancing funds against bills of exchange, promissory notes, and other credit instruments;
•granting mortgage loans and accepting bills of exchange in connection with the mortgage loans;
•granting conditional and unconditional guarantees;
•issuing, confirming, receiving, and discounting letters of credit;
•acquiring and discounting certificates of deposit, warehouse receipts, bills of exchange and invoices of commercial transactions;
•performing credit operations with local and foreign banks, as well as making deposits in those institutions;
•issuing and placing local currency and foreign currency bonds, as well as promissory notes and negotiable certificates of deposits;
•issuing certificates in foreign currency and entering into foreign exchange transactions;
•purchasing banks and non-Peruvian institutions that conduct financial intermediation or securities exchange transactions in order to maintain an international presence;
•purchasing, holding, and selling gold and silver, as well as stocks and bonds listed on one of the Peruvian stock exchanges and issued by companies incorporated in Peru;
•acting as financial agent for investments in Peru for external parties;
•purchasing, holding, and selling instruments evidencing public debt, whether internal or external, as well as obligations of the BCRP;
•making collections, payments, and transfers of funds;
•receiving securities and other assets in trust and leasing safety deposit boxes; and
•issuing and administering credit cards and accepting and performing trust functions.
In addition, banks may carry out financial leasing operations by forming separate departments or subsidiaries. Banks may also promote and direct operations in foreign commerce, underwrite initial public offerings, and provide financial advisory services apart from the administration of their clients’ investment portfolios. By forming a separate department within the bank, a bank may also act as a trustee for trust agreements.
Under Peruvian law, universal banks may conduct brokerage operations and administer mutual funds but must do so through subsidiaries. However, universal bank employees may market the financial products of the bank’s brokerage and mutual fund subsidiaries. Banks are prohibited from issuing insurance policies but are not prohibited from distributing insurance policies issued by insurance companies.
Peruvian branches of foreign banks enjoy the same rights and are subject to the same obligations as Peruvian universal banks. Multinational banks, with operations in various countries, may perform the same activities as universal Peruvian banks, although their foreign activities are not subject to Peruvian regulations. To carry out banking operations in local Peruvian markets, multinational banks must maintain capital in Peru of at least the minimum capital requirement required of Peruvian banks. For more information about banks’ capital requirements, please see “ITEM 4. INFORMATION ON THE COMPANY – (6) Supervision and regulation – (iii) Peruvian Commercial Banks Regulation - BCP Stand-alone and Mibanco – Capital adequacy requirements and ITEM 5. OPERATING AND FINANCIAL REVIEW AND PROSPECTS – 5.B Liquidity and Capital Resources.”
Those universal banks that violate the Peruvian Banking and Insurance Law and its underlying regulations may be subject to administrative sanctions and criminal penalties. Additionally, the SBS and the BCRP have the authority to issue fines to financial institutions and their directors and officers if they violate the laws or regulations of Peru, or their own institutions’ Bye-laws.
Insurance Companies
Since the Peruvian insurance industry was deregulated in 1991, insurance companies have been authorized to conduct all types of operations and to enter into all forms of agreements that are needed to offer risk coverage to customers. Insurance companies may also invest in financial and non-financial assets in order to maintain liquidity and capital requirements to pay their clients when claims occur.
Peru’s Law No. 26702 (the General Law of the Financial, Insurance and Private Pension Administrators (AFP) and Organic Law of the Superintendency of Banking, Insurance and AFPs) and Law No. 29946, Ley del Contrato de Seguro (the “Peruvian Insurance Contract Law”), which are discussed below, are the main laws governing insurance companies and insurance in Peru. The SBS is the government agency charged with the supervision and regulation of all insurance companies. The incorporation of an insurance company requires prior authorization from the SBS. Also, the SMV supervises and regulates insurance companies through Peru’s Law No. 26126 and its amendments.
On May 27, 2013, Insurance Law No. 29946 became effective. Law No. 29946 governs all insurance contracts, except for those that are expressly governed by other regulations. It substantially changes how insurance policies are offered by insurance companies, regulates the information provided by the insured, and includes changes to termination and arbitration clauses included in insurance contracts. Law No. 29946 also provides a list of terms and conditions that cannot be included in any insurance contract and ensures that any changes in the contract can only be made if 45 days' notice is given to the policyholder prior to renewal of the policy. Other measures include restrictions on the duration and renewal of contracts, consumer protection rules, and regulations governing how to address non-payment of premium installments required under insurance contracts.
In September 2013, the SBS established a tender process for the exclusive right to manage a collective insurance policy for D&S and burial expenses of the PPS as part of its reform.
Peruvian insurance companies must submit regular reports to the SBS concerning their operations. In addition, the SBS conducts on-site reviews on an annual basis, primarily to evaluate compliance with solvency margin, reserve and investment requirements, and rules governing the recognition of premium income. If the SBS determines that a company is unable to meet the solvency margin or technical reserve requirements or is unable to pay claims as they become due, it may either liquidate the company or permit it to merge with another insurance company.
Under Peruvian law, insurance companies may engage in certain credit risk operations, such as guarantees, bonds, and trusteeships, but are prohibited from offering other banking services, operating mutual funds, or offering portfolio management services. In addition, insurance companies may not conduct brokerage operations for third parties.
Peruvian insurance companies are also prohibited by an SBS resolution (SBS Resolution No. 3930-2017) from having an ownership interest in other insurance or reinsurance companies of the same class unless such risks are offset by insurance companies acting as subsidiaries and that risk is withdrawn from the principal insurance company’s activities. This resolution also prohibits Peruvian insurance companies from having an ownership interest in private pension funds.
Peruvian law establishes certain minimum capital requirements for insurance and reinsurance companies, which must be satisfied by cash investments in the company.
Medical Services
The medical healthcare business is regulated, and companies must be authorized to attend to patients with coverage or outcome services. The Ministry of Health and the National Superintendency of Health (Superintendencia Nacional de Salud, SUSALUD) regulate all the activities.
Peru’s Law No. 26842 (the Health General Law), Law No. 26790, Ley de Modernización en Seguridad Social en Salud (the “Health Social Security Modernization Law”), and Law No. 29344, Ley Marco de Aseguramiento Universal en Salud (“Universal Insurance Health Law”) are the main legal framework of the healthcare companies in Peru. The SUSALUD is the government agency charged with the supervision and regulation of all EPS and healthcare companies.
Healthcare providers in Peru operate within a regulatory framework overseen primarily by the Ministry of Health (MINSA), which establishes health policies and technical standards, and the Superintendence of Health Services (SUSALUD), which supervises healthcare service providers (IPRESS) and health insurance entities, and has the authority to impose administrative sanctions.
Hospitals and clinics must obtain sanitary authorizations and operating licenses, subject to periodic renewal and compliance with regulations covering infrastructure, equipment, clinical personnel, patient safety and quality of care. Additional regulations may apply, depending on the services provided, including those governing laboratories, specialized medical services and pharmaceuticals. SUSALUD has the authority to investigate complaints, conduct inspections, impose fines, and suspend or revoke authorizations for non-compliance. The regulatory framework is subject to change, and new laws or regulations may affect healthcare providers’ operations, costs or compliance obligations.
Pension Funds
The operations of pension funds in Peru are regulated by the Unified Text of the Private System for the Administration of Funds Act, approved by Supreme Decree No. 054-97-EF, and modified by Law No. 29903, which has been in force in Peru since August 2013.
Under Peruvian legislation, AFPs must have only one business activity: managing pension funds through individual capitalization accounts, sourced by mandatory and/ or voluntary contributions. AFPs must also provide benefits for retirement, disability, and survivorship and finance funeral expenses.
In September 2025, the Pension System Modernization Law (Law No. 32123) and its regulations came into effect, initiating the gradual implementation of Peru's Integrated Pension System (SIPP). This included opening the system to new administrators, strengthening pension protections, and improving governance and oversight requirements.
The reform introduced significant structural changes, such as a general ban on withdrawals (with specific exceptions), the creation of the Contribution Unit (UdA), and the establishment of minimum pensions, among other modifications.
Implementation will take place in stages between 2025 and 2028, and will be subject to increased regulation by the SBS, which implies significant changes for the AFPs. As previously described, the regulatory framework implemented promotes increased competition by allowing the participation of banks, insurance companies, and other financial system entities, subject to transparency standards and equal operating conditions. The next phases of the reform are expected to
address the implementation of the minimum and proportional pension schemes, as well as the consumption-based pension. The relevant regulatory authorities continue to develop the necessary regulatory framework for these components.
Finance Companies
Under the Peruvian Banking and Insurance Law, finance companies are authorized to carry out the same operations as banks, except for (i) issuing loans as overdrafts in checking accounts and (ii) participating in derivative operations. These operations can be carried out by finance companies only if they fulfill the requirements stated by the SBS.
Other Financial Institutions
The Peruvian financial system has a number of less significant entities that may provide credit, accept deposits or otherwise act as financial intermediaries on a limited basis. Leasing companies may specialize in financial leasing operations where goods are leased over the term of the contract and in which one party has the option of purchasing the goods at a predetermined price. Savings and loans associations or cooperatives may accept certain types of savings deposits and provide other similar financial services.
Peru also has numerous mutual housing associations, municipal savings and credit associations, savings and credit cooperatives and municipal credit bureaus. Over the past years, the entry of new participants, including foreign banks and non-bank financial institutions, has increased the level of competition in Peru.
(iii)Peruvian Commercial Banks Regulation - BCP Stand-alone and Mibanco
Management of operational risk requirements
SBS Resolution No. 37-2008, Reglamento de la Gestión Integral de Riesgos (Risk Management Regulation), which had set forth the guidelines for enterprise risk management, was replaced by SBS Resolution No. 272-2017, Reglamento de Gobierno Corporativo y de la Gestión Integral de Riesgos (the “Corporate Governance and Risk Management Regulation”), which introduced the following guidelines regarding risk management:
a.Risk management must consider the macroeconomic environment that affects the markets in which the company operates;
b.New types of risk were incorporated into the regulation: (a) money laundering and terrorist financing risk, defined as the possibility of the company being used for money laundering and terrorist financing purposes; and (b) reinsurance risk, defined as the possibility of losses caused by the insufficiency of reinsurance coverage contracted by the assigning insurance company; and,
c.Liquidity risk may be understood as the possibility of losses due to anticipated or forced sale of assets at unusual discounts for the company to meet its obligations, as well as not being able to close open positions or cover positions in sufficient quantity. Before this modification, liquidity was understood as the possibility of losses caused by the failure to comply with the financing requirements and the application of funds arising from the mismatches of cash flows requirements.
In addition, the Corporate Governance and Risk Management Regulation provides that companies must incorporate a centralized unit or units specialized in specific risk management. Under the previous regulation, this was optional. The SBS may require companies to create specialized risk units if considered necessary. Under the previous regulation, if the company did not have a specialized risk unit, it was understood that these functions had been assigned to the CEO. With the new regulation, this provision has been eliminated.
Companies must submit their annual risk reports to the SBS within 90 days from the end of each year.
Credicorp, following these SBS requirements, as well as the guidelines issued by the Basel Committee and the advice of international consultants, has appointed a specialized team responsible for operational risk management across our organization. This team reports regularly to our risk committee, top managers, and the Board of Directors.
In evaluating operational risks and potential consequences, we mainly assess risks related to critical processes, critical suppliers, critical information assets, technological components, new products and significant changes to our services and channels. To support the operational risk management process, we have developed a Business Continuity Management (BCM) discipline, which involves the implementation of continuity plans for critical business processes,
incident management, and training and testing. In addition, our methodology and data processing team has developed procedures to register, collect, analyze, and report operational risk losses using advanced models for operational risk capital allocation. We also have monitoring and reporting procedures that are designed to monitor KRIs and other performance metrics.
We intend to be guided by the risk control standards of international financial institutions that are recognized for their leadership in this field. Our overall objective is to implement an efficient and permanent monitoring system to control operational risks, while training our operational units to mitigate risks directly.
Pursuant to Section 404 of the U.S. Sarbanes-Oxley Act of 2002, we are required to make certain certifications regarding our internal controls over financial reporting. We have developed internal methods to identify and evaluate risk and controls over our critical processes to determinate how effective internal controls are over financial reporting using the Committee of Sponsoring Organizations of the Treadway Commission (COSO) 2013 Internal Control Framework.
Capital adequacy requirements
Capital adequacy requirements applicable to our banking subsidiaries are set forth in Peru’s Law No. 26702. This law aligns the adequacy process with Basel III, which is a comprehensive set of reform measures and guidelines to strengthen the regulation, supervision and risk management of the banking sector. Capital adequacy requirements are also included in Peruvian GAAP guidelines. Financial institutions are required to hold regulatory capital that is greater than or equal to the sum of (i) 10% of credit RWAs and (ii) 10 times the amount required to cover market and operational risks.
Since July 2009, Peruvian financial institutions have generally applied a standardized approach to calculate their capital requirement related to credit, market, and operational risk. As an alternative to the standardized approach, financial institutions may request authorization from the SBS to use internal models for calculating the reserve amount associated with any of these three risks. If the amount of an institution’s reserve requirements would be higher using the standard model than it would be using the authorized Internal Models Method, then the institution will have to maintain between 80% and 95% of the standard amount during a phase-in period. Even after the phase-in period, institutions using an Internal Models Method are subject to regulatory capital floors.
On July 20, 2011, the SBS issued SBS Resolution No. 8425-2011, which established the methodologies and the implementation schedule for additional capital requirements consistent with certain aspects of Basel III. The additional capital requirements include requirements to cover concentration, excessive interest rate risk in the banking book and systemically important risk. Additionally, pro-cyclical capital requirements were established. These additional requirements were fully implemented in July 2016.
SBS Resolution No. 8548-2012, adopted in 2012, modified the regulatory capital requirements for credit RWAs in SBS Resolution No. 14354-2009 and established a schedule for implementing the modifications.
On February 24, 2016, the SBS issued Resolution 975-2016 (the “Subordinated Debt Regulation”), which aims to improve the quality of banks’ total regulatory capital and align Peruvian regulation towards Basel III by modifying:
•The characteristics that subordinated debt must meet to be considered in the calculation of total regulatory capital; and
•The calculation of RWAs.
Under the Subordinated Debt Regulation, subordinated debt issued prior to the regulation that did not meet the requirements should be recognized as total regulatory capital, according to the following:
•Tier 1 subordinated debt: as of January 2017, and for 10 years following, Tier 1 subordinated debt is subject to a 10% discount. However, the amount not included in the computation of Tier 1 Regulatory Capital may be computed as a Tier 2 instrument if it has a residual maturity equal to or greater than 15 years.
•In November 2019, BCP Stand-alone redeemed the total amount of its Tier 1 subordinated debt issuance (issued in 2009) totaling US$250 million. Thus, as of December 2019, neither Tier 1 nor Tier 2 of BCP’s regulatory capital was comprised of non-compliant Tier 1 subordinated debt.
•Tier 2 subordinated debt: during the five years prior to maturity, the principal balance will be discounted by 20%. In the year prior to its maturity, the Tier 2 subordinated debt will not be considered in the calculation
of Tier 2 Capital. This treatment did not change compared to previous regulations. As a result, Tier 2 subordinated debt issued previous to the rule was grandfathered.
In addition, the Subordinated Debt Regulation also included changes to the calculation of RWAs of the following accounting items:
•Intangibles (excluding goodwill);
•Deferred tax assets (DTAs) that are originated by operating losses; and
•DTAs that are associated with temporary differences and that exceed the threshold of 10% of the “adjusted total capital”. In each case, DTAs are to be net of deferred income tax liabilities.
These assets will experience a gradual increase in their risk weights (until they reach a maximum of 1,000% in 2026) to replicate the deductions established by Basel III. The RWAs calculated based on these risk weights will be used exclusively for calculating the Basel III ratios.
SBS Resolution No. 4280-2018, adopted in October 2018, modified the risk weight applied to intangibles (excluding goodwill) to speed up the increase in this risk weight towards 1000%, with the purpose of closing the regulatory gap with Basel III guidelines, which require intangibles to be fully deducted from core capital measurements.
In March 2020, as the scale of the global COVID-19-induced economic shock became apparent, the SBS passed Resolution 1264-2020, which suspended the countercyclical capital requirements for the banking system, unlocking a significant capital buffer for local banks that was built during the last several years to prevent a credit contraction.
As some of the COVID-19 restrictions and consequences continued into early 2021, Presidential Urgent Decree No. 037-2021 was approved in March 2021. The minimum global capital ratio, which is the minimum requirement mandated by the regulator, was temporarily reduced from 10% to 8%. This gave an additional buffer to financial institutions until the economic outlook started presenting stronger signs of improvement. A similar decree ordered the minimum global capital ratio to be lifted back to 10% in March 2022.
In December 2021, the SBS issued Resolution 3718-2021, modifying cyclical provisions from Resolution 11356-2008 and, as an extension, the thresholds for the activation of the countercyclical capital buffer. Among the main changes were decreasing the threshold for the activation of the countercyclical rule from 5% to 4% for the average of annualized percentage change in GDP for the last 30 months and the minimum rates for the cyclical provision component. The countercyclical capital buffer cannot be activated before January 1, 2024.
Additionally, in December 2021, the SBS adopted Resolution 3921-2021, which adds capital rules regarding the domestic systemically important capital requirement, which is a requirement similar to the D-SIB under Basel III where an additional requirement is calculated based on the relative size of the bank within the local financial system. This additional requirement affects both BCP Stand-alone and Mibanco by increasing Credicorp’s regulatory capital requirement. The changes have a transition phase of two years, with 75% of the additional requirements taking effect in December 2022 and the full requirement to become effective in December 2023.
The same decree also extended the temporary reduction of the minimum global capital ratio and contemplated whether to raise it again to 8.5% beginning September 2022, 9.0% beginning March 2023, 9.5% beginning September 2023 and finally back to 10% in March 2024.
In March 2022, Legislative Decree 1531 was passed by the Government, revising the regulatory capital definition rules in Banking Law 26702. Changes were aimed at better compliance with the standards established by Basel III. The new regulatory capital framework defines three minimum requirement limits: CET1 Capital at 4.5%, Tier 1 Capital at 6.0% and total regulatory capital at 10%.
Among other changes, Legislative Decree 1531 changed the definition of regulatory capital to the following:
CET 1 Capital:
(a)Common shares and other capital instruments, as long as they have been paid and comply with the conditions indicated by the SBS;
(b)Issue premium of common shares and other capital instruments indicated in subparagraph (a);
(c)Earnings from prior years and from the year in progress, in accordance with the provisions of the SBS;
(d)Unrealized gains, as designated by the SBS;
(e)Legal reserves and optional reserves;
(f)Donations that meet the conditions designated by the SBS;
(g)Other elements defined by the SBS by means of a general rule; and
(h)Regulatory adjustments that include the following deductions:
(i)Losses from prior years and from the current year;
(ii)Unrealized losses, as allowed by the SBS;
(iii)Shortfalls in provisions determined by the SBS;
(iv)Goodwill resulting from reorganizations or acquisitions;
(v)Intangible assets, other than those indicated in item (iv);
(vi)Deferred income tax assets originated due to carryover losses;
(vii)Deferred income tax assets, net of deferred income tax liabilities, originated due to temporary differences that exceed the threshold established by the SBS;
(viii)Investments in equity instruments included in the computation of CET 1 Capital issued by companies in the financial or insurance system, in Peru or abroad; and
(ix)Others defined in Legislative Decree 1531.
Additional Tier 1 Capital:
(a)Common shares and other capital instruments, as long as they have been paid, and subordinated debt that meet the conditions indicated by the SBS (with subordinated debt instruments required to comply with the provisions of article 233 of Legislative Decree 1531);
(b)Issue premium of common shares and other capital instruments indicated in subparagraph (a);
(c)Other elements defined by the Superintendency by means of a general rule; and
(d)Regulatory adjustments that include the following deductions from Additional Tier 1 Capital:
(i)Direct or indirect holding of instruments of capital and/or subordinated debt included in the computation of Additional Tier 1 Capital, which have been issued by the company itself and that are kept in the treasury, and instruments owned by the company and included in the computation of Additional Tier 1 Capital for which there is a present or contingent obligation to acquire them by virtue of contractual obligations;
(ii)Investments in equity and/or subordinated debt instruments included in the computation of Additional Tier 1 Capital issued by companies in the financial or insurance system, in Peru or abroad.
(iii)Equity instruments and subordinated debt eligible for Additional Tier 1 Capital, issued by companies with which a company consolidates financial statements, including certain holding companies and subsidiaries, in accordance with rules established by the SBS;
(iv)The amount of the items that must be deducted from Tier 2 effective equity that exceed the limit of such effective level 2 assets; and
(v)Other deductions determined by the SBS through a general regulation.
Regulatory Tier 2 Capital:
(a)Common shares and other capital instruments, as long as they have been paid, and subordinated debt not included in the Regulatory Tier 1 Capital, which meet the conditions indicated by the SBS (with subordinated debt instruments required to comply with the provisions of article 233 of Legislative Decree 1531);
(b)Issue premium of common shares and other capital instruments indicated in subparagraph (a);
(c)For banks using the SBS standardized approach method, the generic loan loss provision up to 1.25% of credit RWAs; or, alternatively, for banks using the internal ratings-based (IRB) method, the generic loan loss provision up to 0.6% of total credit RWAs (pursuant to Article 189 of Law No. 26702);
(d)Other elements defined by the SBS by means of a general rule; and
(e)Regulatory adjustments that include the following Tier 2 net worth deductions:
(i)Direct or indirect holding of instruments of capital and/or subordinated debt included in the computation of Regulatory Tier 2 Capital, which have been issued by the company itself and that are kept in the treasury, including instruments owned by the company and included in the computation of Tier 2
Capital for which there is a present or contingent obligation to acquire them by virtue of contractual obligations;
(ii)Investments in equity and/or debt instruments included in the computation of Regulatory Tier 2 Capital, issued by companies in the financial or insurance system, in Peru or abroad;
(iii)Equity instruments and subordinated debt included in the computation of Regulatory Tier 2 Capital, issued by companies with which a company consolidates financial statements (including holding companies), and subsidiaries (including certain holding companies and subsidiaries), in accordance with rules established by the SBS; and
(iv)Other deductions determined by the SBS through a general regulation.
Legislative Decree 1531 also provides that the following limits apply when calculating regulatory capital:
1.Additional Tier 1 Capital must not exceed one-third of CET 1 Capital. The excess above said limit may include certain holding companies as Regulatory Tier 2 Capital.
2.Regulatory Tier 2 Capital should not be greater than two-thirds of the Regulatory Tier 1 Capital. The excess over said limit is not included in the computation of total regulatory capital.
In December 2022, the pending resolutions referred to in the amendments to the Banking Law 26702 – established by Legislative Decree 1531 on March 2022 – were published (SBS N°03950-2022, SBS N°03951-2022, No. 03952-2022, No. 03953-2022, No. 03954-2022 and No. 03955-2022). Below we highlight the main changes defined in this set of resolutions:
•SBS Resolution No. 03952-2022 ordered the minimum total regulatory capital ratio to be gradually raised back to 10% from 8% under the following schedule: in January 2023 to 8.5%, in April 2023 to 9%, in March 2024 to 9.5% and in September 2024 to 10%.
•SBS Resolution No. 03954-2022 defined capital requirement buffers: conservation buffer, domestic systemically importance buffer and countercyclical buffer.
◦The conservation buffer was first introduced in local regulation. This buffer requires maintaining an additional capital of 2.5% of RWAs and it should be covered by CET 1 Capital. This requirement will have a transition phase of four years through December 2026.
◦Domestic systemically important capital requirement and countercyclical capital requirements (when activated) should be covered with CET 1 Capital.
•SBS Resolution No. 03953-2022 defined additional capital requirements. These requirements were maintained from previous regulation and should be covered with Regulatory Tier 2 Capital.
•SBS Resolution No. 03950-2022 defined the new subordinated debt regulation. No material changes were introduced compared to the previous regulation (SBS Resolution No. 975-2016).
In June 2023, the SBS published Resolution 02192-2023, which modified the schedule of solvency requirements established by Resolution 3952-2022 and proposed the following new schedule8:
•Minimum Common Equity Tier 1 (CET 1): in January 2023 to 3.825%, in April 2023 to 4.05%, in March 2024 to 4.275% and in September 2024 to 4.5%.
•Minimum Tier 1 Capital: in January 2023 to 5.1%, in April 2023 to 5.4%, in March 2024 to 5.7% and in September 2024 to 6%.
•Minimum Regulatory Capital: in January 2023 to 8.5%, in April 2023 to 9%, in March 2024 to 9.5% and in September 2024 to 10%.
In January 2024, the SBS published Resolution 00274-2024, which modified the schedule of solvency requirements established by Resolution 3952-2022 and proposed the new following schedule9:
•Minimum Common Equity Tier 1 (CET 1): in January 2023 to 3.825%, in April 2023 to 4.05%, in September 2024 to 4.275% and in March 2025 to 4.5%.
8 These requirements do not consider the conservation buffer, domestic systemically important buffer, countercyclical buffer, or additional capital requirements detailed in resolutions No. 03954-2022 and No. 03953-2022.
9 These requirements do not consider the conservation buffer, domestic systemically important buffer, countercyclical buffer, or additional capital requirements detailed in resolutions No. 03954-2022 and No. 03953-2022.
•Minimum Tier 1 Capital: in January 2023 to 5.1%, in April 2023 to 5.4%, in September 2024 to 5.7% and in March 2025 to 6%.
•Minimum Regulatory Capital: in January 2023 to 8.5%, in April 2023 to 9%, in September 2024 to 9.5% and in March 2025 to 10%.
In connection with regulatory adjustments, SBS Resolution No. 274-2024 updated the phase-in schedule for certain deductions from regulatory capital, including deductions related to intangible assets and other items specified in Article 184 of the Banking Law. Under the updated schedule, the applicable deduction percentage is 80% from January 2025, 90% from January 2026, and 100% from January 2027. Resolution No. 274-2024 also establishes the minimum portion of such deductions that must be applied to CET1 capital during the transition period.
Furthermore, in March 2025, the SBS issued Resolution No. 00774-2025, which introduced a new Regulation for Credit Currency Risk (RCC) Management. This regulation modifies the methodology for calculating the risk-weighted assets (RWA) of borrowers exposed to exchange rate fluctuations, directly impacting the denominator of the regulatory capital ratio. Although originally set for 2025, the full implementation of these capital requirements was postponed to June 1, 2026, by Resolution No. 03401-2025.
Surveillance, intervention and liquidation
The bankruptcy of financial institutions in Peru is regulated by the Peruvian Banking and Insurance Law and the rules and regulations enacted thereunder, including SBS Resolution No. 0455-99, Reglamento de los Regímenes Especiales de la Liquidación de las Empresas del Sistema Financiero y del Sistema de Seguros (the Banking Intervention and Liquidation Regulations).
Pursuant to the Peruvian Banking and Insurance Law, the SBS has the authority to seize the operations and assets of a bank. Under such regulations, prior to being liquidated and dissolved, banks undergo two separate and distinct stages: (i) a surveillance period (régimen de vigilancia) and (ii) an intervention period (intervención). The SBS will submit a bank to a surveillance or intervention regime if certain events occur, such as if the bank: (i) interrupts payments on its liabilities, (ii) repeatedly fails to comply with the regulations of the SBS or the BCRP, (iii) repeatedly violates the law or the provisions of the bank’s Bye-laws, (iv) repeatedly manages its operations in an unauthorized or unsound manner or (v) has its regulatory capital fall or be reduced by more than 50%.
The SBS may initiate surveillance of a financial institution when the financial institution breaches certain material obligations, or the overall financial stability of the institution becomes at risk. Surveillance could last for a period of up to 45 days, which may be renewable once for the same period of time. Within seven business days from the date on which the surveillance of a financial institution is commenced by the SBS, the institution must propose a recovery plan that, if approved by the SBS, should be expected to bring the financial institution to financial stability.
To the extent that a financial institution subject to surveillance by the SBS breaches the recovery plan approved by the SBS or otherwise becomes subject to intervention, the SBS must issue a public resolution stating that such financial institution has been intervened by the SBS.
Upon the publication of the SBS intervention resolution, the financial institution is subject to an automatic stay, protecting the assets of the intervened company, which is no longer allowed to operate, and the SBS is granted the ability to administer and dispose of part or all of the assets and liabilities of such company. Hence, the following actions are temporarily suspended: (i) collection of debts (judicially or administratively); (ii) execution of any judicial order; (iii) creation of liens; and (iv) making payments, advances or offsetting debts (though the statute regulates some specific cases where offsetting is admitted during the stay).
During the intervention regime, rather than seizing the operations and assets of a bank, the SBS may adopt other measures, including (i) placing additional requirements on the bank, (ii) ordering it to increase its capital stock or divest certain or all of its assets, or (iii) imposing a special supervision regime during which the bank must adhere to a financial restructuring plan.
The SBS intervention regime stops a bank’s operations for up to 45 days, which may be extended once for an additional 45-day period of time. During this time, the SBS may institute measures such as: (i) canceling losses by reducing reserves, capital and subordinated debt; (ii) segregating certain assets and liabilities for transfer to another financial institution; and (iii) merging the intervened bank with an acquiring institution according to the program established by
Presidential Urgent Decree No. 108-2000. After the intervention, the financial institution typically undergoes liquidation and is dissolved unless it is merged with an acquiring institution, as described in clause (iii) above.
Once the dissolution of the financial institution is declared by a resolution issued by the SBS, the settlement process begins, and all payments are made in accordance with the payments priority provided in the Peruvian Banking and Insurance Law: (a) wages and social benefits of the bank’s employees, (b) return of saving deposits (the portion not covered by the Deposit Insurance Fund), (c) tax obligations and (d) the rest of the obligations under general rules of payment.
Liens created against bank’s assets survive the dissolution, but the following rules apply:
1.Each encumbered asset is sold separately;
2.The proceeds of the sales are deposited separately from the rest of the bank’s assets to preferentially pay the secured obligations;
3.If the wages and social benefits of the bank’s employees are fully paid with the rest of the company’s assets, the proceeds described in clause (2) above are used to pay the secured obligations; otherwise, they are used to complete such payments, reducing pro-rata the amount available for payment of secured obligations;
4.If the secured obligations are fully paid and there is an excess from the proceeds described in clause (2) above, the balance is added to the rest of the bank’s assets; and
5.If the secured obligations are not fully paid, the unpaid balance is treated as an unsecured obligation and may be collected, if possible, against the rest of the bank’s assets.
Legal reserve requirements
In accordance with Peruvian regulation (article 67 of Law No. 26702), a reserve of up to at least 35% of paid-in capital of the Group’s subsidiaries operating in Peru is required to be established through annual transfers of at least 10% of their net profit.
Lending activities requirements
Law No. 26702 sets the maximum amount of credit that a financial institution may extend to a single borrower, whether the borrower is an individual or an economic group. SBS Resolution No. 00975-2025 establishes that an “economic group” is one that has a single or common risk exposure and includes a person, such person’s close relatives or the companies in which such person or his or her close relatives have significant share ownership or decision-making capability. Significant decision-making capability is deemed to be present when, among other factors, a person or group can exercise material and continuous influence over the decisions of a company, when a person or company holds seats on the Board of Directors or has principal officers in another company, or when it can be assumed that one company or person is the beneficiary of credit facilities granted to another company.
The limit on credit that may be extended to any single borrower varies according to the type of borrower and the collateral received. Under Peruvian law, the credit limit for any borrower is 15% of a bank’s regulatory Tier 1 capital, applied to both unconsolidated and consolidated records, and may be increased to up to 25% if the loan is collateralized in a manner acceptable under SBS Resolution No. 00975-2025. If a financial institution exceeds these limits, the SBS may impose a fine on the institution. As of December 31, 2023 and 2024, our regulatory single borrower credit limits were determined based on Regulatory Capital in accordance with applicable Peruvian banking regulations. During this period, the 10% unsecured credit limit per borrower, calculated as 10% of BCP’s stand alone Regulatory Capital, amounted to S/2,679.3 million and S/3,025.5 million, respectively. Similarly, the 30% secured credit limit, equivalent to 30% of Regulatory Capital, amounted to S/8,037.8 million and S/9,076.5 million, respectively. Beginning July, 2025, single borrower credit limits are determined based on Tier 1 Capital under applicable Peruvian banking regulations. Under this methodology, as of December 31, 2025, the unsecured credit limit, equivalent to 15% of Tier 1 Capital, amounted to S/ 3,442.3 million, while the secured credit limit, equivalent to 25% of Tier 1 Capital, amounted to S/ 5,737.2 million. Between December 31, 2024 and July 2025, single borrower credit limits continued to be calculated based on Regulatory Capital, in accordance with the Peruvian banking regulations in force during that period. No changes were made to the applicable methodology or to the unsecured and secured credit limit percentages until the transition to Tier 1 Capital became effective in July 2025.
Effective since April 2021, the BCRP, pursuant to article 52 of its Organic Law, established caps on interest rates that could be charged by commercial banks and other financial institutions for SME and personal loans. In the case of Banco de Crédito del Peru, the application of these caps had only a marginal impact on consumer loans.
In addition, according to SBS Resolution No. 6941-2008, as amended, banks and other financial entities must adopt a system to manage the risk of over-indebtedness that (a) allows the mitigation of such risk before and after making the loan, (b) permits permanent monitoring of the portfolio to identify over-indebted borrowers and (c) includes the periodic evaluation of the control mechanisms being used and corrective actions or required improvements, as the case may be.
Interest rates caps
On March 2021, the Peruvian Usury Law was enacted. It establishes, among other provisions, that the BCRP has the power to set caps on active interest rates in the financial system for consumer credits, low amount consumer credits (less than 2 Tax Units) and credits to micro and small enterprises (Micro y Pequeña Empresas or Mype by their Spanish initials). Through Circular No. 0008-2021-BCRP of April 2021, the BCRP determined that this interest rate cap is equivalent to twice the average interest rate for consumer loans in the financial system.
The interest rate cap will be calculated semi-annually based on the interest rates of consumption loans in the financial system between two and seven months prior to its validity. For the period between November 2025 and April 2026, the annual interest rate cap stood at 113.16% in domestic currency and 95.40% in foreign currency.
In December 2024, the Congress of Peru approved in a first vote the repeal of the Usury Law, motivated by the fact that the interest rate caps established by the law did not achieve the expected results, considering that according to the Central Reserve Bank of Peru (BCRP), these caps drove low-income individuals away from formal credit, pushing them towards informal loans. However, in March and June 2025, the Congress failed to obtain the required votes in the second vote to repeal the law, leaving the interest rate caps fully in force.
Portfolio classification requirement
In order to comply with the SBS regulation, we have a loan portfolio classified in accordance with SBS Resolution No. 11356-2008, which became effective as of July 1, 2010. For this reason, a bank's portfolio is classified into eight different categories: Corporate, Large Companies, Medium-sized Companies, Small Companies, Micro-companies. Commercial, Consumer Revolving, Non-renewable Consumer and Residential Mortgage loans. In October 2024, an adjustment to the regulation came into force, modifying the criteria for categorizing customers (SBS Resolution No 02368-2023). The new regulation establishes that the Corporate, Large Companies and Medium-sized Companies types of credit correspond only to legal entities with annual sales greater than S/5 million according to what the company has reported to the tax authority or its audited financial statements; companies that do not meet these conditions are categorized as Small or Micro Companies according to their level of indebtedness in the Peruvian Financial System. In turn, individuals can no longer be categorized as Medium-sized Companies.
Related party transactions requirements
The Peruvian Banking and Insurance Law regulates transactions between financial institutions and related parties or affiliates. The SBS and the SMV have also enacted regulations that define indirect ownership, related parties and economic groups to limit transactions with related parties and affiliates. In March 2025, the SBS approved a new Regulation on Economic Groups, Affiliation (“Vinculación”), the application of operational concentration limits and large exposures (Resolución SBS No. 00975-2025), which updates the regulatory framework and definitions used for these purposes. These regulations also provide standards for the supervision of financial and mixed conglomerates formed by financial institutions.
The total amount of loans to directors, employees, or close relatives of any such persons may not exceed 7% of a bank’s regulatory capital. All loans made to any single director or employee borrower, or to his or her close relatives, may not exceed 0.35% of regulatory capital (that is, 5% of the overall 7% limit).
Pursuant to the Peruvian Banking and Insurance Law, the aggregate amount of loans to related party borrowers considered to be part of an economic group (as defined above) may not exceed 30% of a bank’s regulatory capital. For purposes of this test, related party borrowers include (i) any person holding, directly or indirectly, 4% or more of a bank’s shares, (ii) directors, (iii) certain principal executive officers of a bank, and (iv) people affiliated with the administrators of
the bank. Loans to individual related party borrowers are also subject to the limits on lending to a single borrower described under “ITEM 4. INFORMATION ON THE COMPANY – 4.B Business Overview – (6) Supervision and Regulation – 6.2 Subsidiaries – 6.2.1 Peru”. All loans to related parties must be made on terms no more favorable than the best terms that BCP Stand-alone or Mibanco offers to the public.
Ownership restrictions
The Peruvian Banking and Insurance Law establishes certain restrictions on the ownership of a bank’s shares. Banks must have a minimum of two shareholders. Among other restrictions, those convicted of drug trafficking, money laundering, terrorism, or other felonies, and those who are directors, employees or advisors of public entities that regulate and supervise the activities of banks, are subject to ownership limitations. All transfers of shares in a bank must be recorded at the SBS. Transfers involving the acquisition by any individual or corporation, whether directly or indirectly, of more than 10% of a bank’s capital stock require prior authorization from the SBS. The SBS may deny authorization to such transfer of shares if the purchasers (or their shareholders, directors, or employees, in the case of juridical persons) are legally disabled or have engaged in illegal activity in the area of banking, finance, insurance or reinsurance, or if objections are raised on the basis of the purchaser’s moral fitness or economic solvency, among other reasons. The decision of the SBS on such matters is final and cannot be overturned by the courts. If a transfer is made without obtaining the prior approval of the SBS, the purchaser shall be fined with an amount equivalent to the value of the transferred shares and is obligated to sell the shares within 30 days, or the fine is doubled. In addition, the purchaser is not allowed to exercise its voting rights at the shareholders’ meetings. Foreign investors receive the same treatment as Peruvian nationals under the limitations described above.
Additionally, the Merger Control Law, which entered into force on June 14, 2021, provides that any transaction that causes ownership percentages to cross the threshold set by such law and can result in action in concert, must have the authorization of INDECOPI. According to the Merger Control Law, the prior concentration control operations of economic agents included in the scope of the regulation and supervision of the SBS and/or SMV is carried out by INDECOPI, without prejudice to the fact that prior control of a prudential nature and financial stability that corresponds to the SBS and/or SMV. The merger transaction proceeds if there is due authorization from INDECOPI and from the SBS and/or the SMV accordingly. In the case of merger transactions that include companies in the financial system that take deposits from the public or insurance companies, that show relevant and imminent risks or compromise the stability of the aforementioned companies or the systems that they integrate, only the prior authorization of the SBS is required within its area of competence, given the sensitive and confidential nature of the situation, as determined by such authority.
Finally, under the Peruvian Banking and Insurance Law, individuals or corporations that acquire, directly or indirectly, 1% of the capital stock of a bank in a period of 12 months, or acquire a 3% or more share participation, have the obligation to provide the information that the SBS may require to identify such individuals’ or corporations’ main economic activities and asset structure.
Risk rating requirements
Law No. 26702 and SBS Resolutions No. 672 and 18400-2010 require that all financial companies be rated by at least two risk rating companies on a semi-annual basis, in addition to undergoing the SBS’s assessment. Criteria considered in the rating include risk management and control procedures, loan quality, financial strength, profitability, liquidity, and financial efficiency. Five risk categories are assigned, from “A” (lowest risk) to “E” (highest risk), allowing for sub-categories within each category. In 2025, the Moody’s Local PE Clasificadora de Riesgo S.A. and Apoyo & Asociados Internacionales S.A.C. rating agencies affirmed their respective “A+” risk rating for BCP Stand-alone. In addition, both rating agencies affirmed their “A” risk rating for Mibanco. As of December 2025, BCP Stand-alone and Mibanco maintained the risk rating of “A+” and “A”, respectively, with both rating agencies.
Deposit insurance fund
The Peruvian Banking and Insurance Law provides for mandatory deposit insurance to protect the deposits of financial institutions by establishing the Deposit Insurance Fund for individuals, associations, not-for-profit companies, and demand deposits of non-financial companies. Financial institutions must pay an annual premium calculated and based on the type of deposits accepted by the entity and the risk classification of such entity, as rated by the SBS and at least two independent risk-rating agencies. The annual premium, as set by the SBS Resolution No. 0657-99, begins at 0.45% of total funds on deposit, for banks in the lowest risk category, and increases to 1.45%, for banks in the highest risk category. BCP Stand-alone and Mibanco are currently classified in the lowest risk category and pay at the 0.45% rate.
The maximum amount that a customer was entitled to recover from the Deposit Insurance Fund was S/116,700.00 for the period starting from December 2025 until February 2026. The maximum amount has now been updated to S/117,200.00 for the period starting from March 2026 until May 2026.
(iv)Peruvian Insurance Companies Regulation - Grupo Pacífico
Solvency requirements
Under Law No. 26702, the SBS regulates the solvency margin of Peruvian insurance companies. The solvency margin calculations consider the amount of premiums written and losses incurred during a specified period prior to the date of the calculation.
Insurance companies must also maintain solvency equity, which must be greater than (i) the solvency margin and (ii) the minimum capital requirement, as established by law. The required amount of solvency equity is recalculated at least quarterly. If an insurance company has outstanding credit risk operations, part of the solvency equity must be set aside for its coverage.
Legal reserve requirements
Peruvian law also requires that all insurance companies establish a legally guaranteed reserve for policyholders by setting aside 10% of income before taxes until the reserve reaches at least 35% of paid-in capital.
Technical reserve requirements
Under Law No. 26702 and the regulations issued by the SBS, Peruvian insurance companies must establish technical reserves. Law No. 26702 also requires insurance companies to create a reserve for incurred but not reported (IBNR) claims that are reflected as a liability in their consolidated financial statements. Reserves for IBNR claims are estimated by using generally accepted actuarial reserving methods. See Note 3(e) to our consolidated financial statements. Finally, Grupo Pacífico is required by the SBS to establish pre-event reserves to account for the risk of catastrophes, which, in accordance with IFRS principles, are not considered in our financial statements. See “ITEM 5. OPERATING AND FINANCIAL REVIEW AND PROSPECTS – 5.A Operating results – (6) Lines of Business (LoBs) – 6.3 Insurance & Pensions – (i) Grupo Pacífico”.
According to new regulations regarding actuarial management, SBS Resolution No. 3863-2016 and SBS Resolution No. 1143-2021, the actuarial function must (i) ensure the use of real and adequate parameters in both pricing and technical reserves calculation and (ii) guarantee the consistency of the results obtained. Likewise, based on the sufficiency evaluation analysis, actuarial management must propose changes in the methodologies applied in the calculation of technical or additional reserves.
Investment requirements
Under Law No. 26702 and SBS Resolutions No. 1041-2016, No. 1311-2019 and No. 2388-2021, the total amount of an insurance company’s solvency equity and technical reserves must be permanently supported by diversified assets, which may not be pledged or otherwise encumbered. The investment regulations further state that deposits in and bonds of a single financial institution together cannot exceed 7% of the total of an insurer’s solvency equity and technical reserves combined. In general, no more than 15% of an insurance company’s combined solvency equity and technical reserves may be invested in instruments (including stocks and bonds) issued by a single company or group of companies. In order for an insurance company to invest in non-Peruvian securities, the securities must be rated investment grade by an internationally recognized credit rating agency and the asset class must be authorized by Peruvian SBS regulations. Securities owned by insurance companies must be registered in the Public Registry of Securities of Peru or the comparable registry of their respective country.
Related party transactions requirements
Law No. 26702 provides that insurance companies may not extend credit to or guarantee the obligations of employees or members of the Board of Directors, except for certain home mortgage loans to employees.
Ownership restrictions
Law No. 26702 sets forth the same types of restrictions regarding the ownership and transfer of insurance company shares as it does regarding the ownership and transfer of shares in banks. See “ITEM 4. INFORMATION ON THE COMPANY – 4.B Business overview – (6) Supervision and Regulation – 6.2 Subsidiaries – 6.2.1. Peru”.
(v)Peruvian Pension Fund Regulation – Prima AFP
Minimum capital requirements
SBS authorization is required for an AFP to begin operations. Peruvian law requires a minimum capital requirement, paid in cash by shareholders. There are certain limitations on the ownership and transfer of AFP shares. Additionally, Peruvian law requires that companies maintain a legal reserve funded with 10% of their net profit until the reserve reaches the equivalent of 20% of their share capital.
Investment limits
The SBS has set investment limits, which restrict investments in certain asset classes, economic groups, and issuers. In addition, some of these limits differ according to the fund’s risk profile. The general limits are:
•The total amount invested in instruments issued or guaranteed by the Peruvian State cannot exceed 30% of the fund value.
•The total amount invested in instruments issued or guaranteed by the BCRP cannot exceed 30% of the fund value.
•The total amount invested in instruments issued or guaranteed by the Peruvian State and the BCRP overall cannot exceed 40% of the fund value; and
•The total amount invested in instruments issued by governments, financial institutions, and non-financial institutions whose commercial activities are mostly abroad cannot exceed 50% of the fund value.
The SBS requires that AFPs ensure a minimum yield. Part of the guarantee is the obligatory reserve requirement, which is paid with resources belonging to the AFPs. The amount depends on the assets in the portfolio, but it is approximately 1% of the AFP’s funds under management.10
PPS Reforms
Changes to PPS in 2023
On January 13, 2023, Law No. 31670 was published, which established a new option for retirement based on a minimum pension and created incentives to increase voluntary contributions. This new voluntary pension modality allows the affiliate to set a target pension for their retirement, which must be higher than the basic consumer basket, determined by INEI.
On February 16, 2023, Law No. 31690 was published to allow employers to restructure the debt generated by not making their employee’s pension contributions.
On June 23, 2023, Resolution No. 02186-SBS was published, which modified the methodology to calculate the legal reserve requirement. The new methodology multiplies the assets under management of each type of fund by a fixed factor (based on the level of risk of each fund) to calculate the amounts of legal reserve requirement. The fixed factor for Fund 0 is 0.70%, for Fund 1 is 0.85%, for Fund 2 is 1.00% and for Fund 3 is 1.15%.
On October 6, 2023, Law No. 31888 was published, similar to Law No. 31690, but applicable to public entities.
10 Since 2024, the net reserve fund profitability will be calculated by multiplying the total equity quotas for each fund by the following percentage: Fund 0 - Capital Protection Fund (0.70%), Fund 1 - Capital Preservation Fund (0.85%), Fund 2 - Mixed Fund (1.00%) and Fund 3 - Capital Appreciation Fund (1.15%).
Changes to PPS in 2024
On April 18, 2024, Law No. 32002 was published, which authorized affiliates of the Private Pension Fund Administration System to withdraw up to S/20,600 from their funds.
On September 24, 2024, Law No. 32123, the Law for the Modernization of the Peruvian Pension System, was published, creating the Comprehensive Peruvian Pension System (SIPP) to ensure pension protection for all citizens. The main changes established by Law No. 32123 are as follows:
•Minimum pension: The Peruvian government guarantees that all members of the Private Pension System who meet certain conditions have access to a minimum pension. If members do not have sufficient accumulated funds, the government will supplement the fund to reach the minimum pension.
•Productivity commission: Affiliates will be able to choose a new type of commission, called “productivity commission”, where the charge made by the PFA will vary depending on the positive or negative results of the fund’s profitability.
•Market opening: The entry of new entities such as banks, insurance companies, financial institutions, municipal banks, cooperatives, among others, for the administration of pension funds is permitted.
Changes to PPS in 2025
In September 2025, the Pension System Modernization Law (Law No. 32123) and its regulations came into effect, initiating the gradual implementation of Peru's Integrated Pension System (SIPP). This included opening the system to new administrators, strengthening pension protections, and improving governance and oversight requirements.
The reform introduced significant structural changes, such as a general ban on withdrawals (with specific exceptions), the creation of the Contribution Unit (UdA), and the establishment of minimum pensions, among other modifications.
Implementation will take place in stages between 2025 and 2028, and will be subject to increased regulation by the SBS, which implies significant changes for the AFPs.
On September 20, Law No. 32445 was published, authorizing an extraordinary and optional withdrawal of up to S/21,400 of pension fund balances by affiliates of the Private Pension System (PPS) from their funds.
For further information about the measures taken by the government, see “ITEM 3. KEY INFORMATION – 3.D Risk Factors – Regulatory changes and adoption of new international guidelines to sectors in which we operate could impact our earnings and adversely affect our operating performance” and “ITEM 5. OPERATING AND FINANCIAL REVIEW AND PROSPECTS – 5.A Operating results – (2) Political and Macroeconomic Environment”.
Peruvian Investment Management & Advisory Regulation - Credicorp Capital Peru
Credicorp Capital Peru is the main shareholder of Credicorp Capital Sociedad Agente de Bolsa S.A., Credicorp Capital Sociedad Titulizadora S.A., and Credicorp Capital S.A. Sociedad Administradora de Fondos.
These entities are supervised directly by the SMV. The SMV is a specialized technical body attached to the MEF that aims to ensure the protection of investors and the efficiency and transparency of the markets, as well as the diffusion of the information required for such purposes. The SMV enjoys functional, administrative, economic, technical, and budgetary autonomy.
Peru’s Securities Market Law (Legislative Decree No. 861), as amended, governs the public offering and trading of securities listed on the SMV and the BVL. The BVL, as the only stock exchange in Peru, also provides internal regulations that form part of the regulations and administrative rulings that govern the offering and trading of securities.
6.2.2Cayman Islands
Cayman Islands Regulation - Atlantic Security Holding Corporation (ASHC)
ASHC is incorporated as an exempted company under the Cayman Islands Companies Act (2025 Revision) and conducts pure equity holding activities. To remain in good standing, it must comply with the Companies Act by maintaining a registered office, statutory registers, and filing its annual return with government fees by the prescribed deadline.While ASHC was previously regulated by the Cayman Islands Monetary Authority (CIMA), following the Economic Substance Act (2021 Revision), ASHC is no longer regulated by CIMA and is instead required to submit an annual Economic Substance Notification and, where applicable, an Economic Substance Return under the reduced test for equity holding entities. Ongoing obligations also include maintaining an up-to-date Beneficial Ownership Register, adhering to Anti-Money Laundering and Counter-Terrorist Financing regulations, and complying with the Data Protection Act. Where relevant, ASHC must meet FATCA and CRS reporting requirements. These measures ensure continued compliance with Cayman Islands law and regulatory standards.
6.2.3Bolivia – BCP Bolivia, Inversiones Credicorp Bolivia S.A., Credifondo Sociedad Administradora de Fondos de Inversión S.A, Credibolsa S.A. Agencia de Bolsa
Bolivian Regulators
Pursuant to Supreme Decree No. 29894, in May 2009, the ASFI was vested with the authority to regulate the Bolivian banking system. The ASFI also supervises brokerage and mutual fund management activities that Credicorp Ltd. conducts through BCP Bolivia’s affiliates, Credibolsa and Credifondo. These affiliates operate under Securities Markets Law No. 1834, enacted on March 31, 1998. Additionally, the Central Bank of Bolivia (Banco Central de Bolivia or BCB by its Spanish initials) regulates financial intermediation and deposit activities, determines monetary and foreign exchange policy, and establishes reserve requirements on deposits.
Regulation of Bolivian Financial Institutions
Until November 2013, the Bolivian banking system operated under the Law of Banks and Financial Entities (Law No. 1488), enacted on April 14, 1993, and later modified by Law No. 3076 on June 20, 2005. On August 21, 2013, the Bolivian government enacted a new Banking Law (Law No. 393), which became effective on November 21, 2013. This new law envisions a more active role for government in the financial services industry and emphasizes the social objective of financial services.
On December 10, 2010, through the enactment in Bolivia of Law No. 065 (Ley de Pensiones), the supervision of all insurance activities in Bolivia was transferred from the ASFI to the APS (Autoridad de Fiscalización y Control de Pensiones y Seguros). Our life and P&C insurance affiliates in Bolivia, which operate under the commercial name Crediseguro, are thus regulated and supervised by the APS.
In 2012, the Bolivian government imposed an additional income tax of 12.5% on earnings before taxes, which applied to all financial institutions with a ratio of earnings before taxes to equity in excess of 13%. The additional income tax rate was subsequently increased to 22% in December 2015 and to 25% in March 2017, and was made applicable to all financial institutions with a ratio of earnings before taxes to equity in excess of 6%. Starting in 2021, the additional income tax applies also to Crediseguro, Credibolsa and Credifondo.
In 2013, Supreme Decree No. 1842 set interest rate caps for social housing loans ranging from 5.5% to 6.5%, and for loans to productive sectors (agriculture, tourism, manufacturing, etc.). The Decree established loan quotas pursuant to which, by December 31, 2018, and afterwards, at least 60% of the loan portfolio of all universal banks must be comprised of loans to productive sectors and social housing loans, with a sub-limit that establishes that loans to productive sectors must represent at least 25% of the portfolio.
Further to Law No. 393, in 2014, the Bolivian government, through Supreme Decrees No. 2136 and No. 2137, instructed banks in Bolivia to contribute 6% of that year’s total profits to create a guarantee fund – to be administered by the banks - intended to provide guarantees of up to 50% of the amount financed of productive sector and social housing loans. From 2015 to 2019, and again since 2021, the government instructed banks to contribute 6% of those years’ profits to either replenish the existing guarantee funds or to make contributions to newly established funds administered by the government-owned development bank.
In response to the COVID-19 pandemic, on April 1, 2020, the Bolivian government enacted Law No. 1294, which established the automatic deferral of all loan installments (capital, interest and other charges) payable to financial institutions for the duration of Bolivian Coronavirus Pandemic Emergency Declaration. These deferred installments would start to be collected after the final installment established on the original payment schedule. Supreme Decree No. 4206 established an initial deferral period from March 2020 to May 2020, which was subsequently extended to August 2020 through Supreme Decree No. 4248, and then to December 2020 through Law No. 1319.
On December 2, 2020, the Bolivian government issued Supreme Decree No. 4409, establishing that the capital portion of the installments that had been deferred in 2020 would not accrue interest until their cancellation. Supreme Decree No. 4409 also established that once the deferral period had concluded, upon request by the borrowers that had their installments deferred, banks must refinance and/or reschedule their loans, based on the borrowers’ economic situation and payment capacity. The refinanced and/or rescheduled loans have the benefit of a six-month grace period during which no interest or capital payments are required from the borrower. The collection of the amount of interest accrued but not collected during the aforementioned grace period would be made pro rata during the new term of the loan.
On December 28, 2020, the Bolivian government enacted Law No.1356, eliminating the tax-exemption for capital gains generated in the Bolivian Stock Exchange.
On February 20, 2024, ASFI established a range for fees for international transfers abroad in U.S. Dollars between 5% and 10%, applicable to transactions exceeding U.S. Dollar 1,000. Later, on July 23, 2024, the financial authority established another cap, of 20% for international transfers abroad in foreign currencies different than U.S. Dollars. On March 14, 2025, ASFI amended the Regulation on Interest Rates, Commissions, and Fees, introducing a revised methodology for calculating the maximum fee on international transfers applicable to transactions exceeding U.S. Dollar 1,000. The updated methodology includes a Variable Component (CMV), which is based on the weighted average purchase exchange rate for U.S. Dollars reported by the Bank System. This rate is updated daily and expressed as a percentage.
In accordance with Law No. 1670, promulgated on November 5, 2025, the government, as an exceptional measure, temporarily suspended foreclosures and the enforcement of judicial judgments related to social housing loans. Additionally, the law established an automatic six-month deferral of all loan installments—covering principal, interest, and other charges—payable to financial institutions on loans granted for social housing and to micro and small economic units. These deferred installments will become due after the deferral period.
In accordance with Bolivian regulations, a reserve of up to at least 50% of paid-in capital of the Group’s subsidiaries operating in Bolivia is required to be established through annual transfers of at least 10% of their net profit.
6.2.4Colombia
Colombian Regulation – Credicorp Holding Colombia, Mibanco Colombia & Credicorp Capital Colombia
Credicorp Holding Colombia S.A.S. is the main shareholder of Credicorp Capital Colombia S.A., Credicorp Capital Fiduciaria S.A., Credicorp Capital Servicios S.A.S., Credicorp Negocios Digitales S.A.S., Credicorp Capital Corporación Financiera S.A. and Mibanco Colombia S.A.
The SFC is an entity whose main function is to oversee Colombia’s financial sectors. Although it has an important role in monitoring and surveillance, it also has certain regulatory powers that permit it to issue regulations through regulatory circular letters, laws and decrees. Separately, the AMV supervises and regulates the conduct of securities intermediaries, as well as the certification of those who carry out such activities. The AMV is a private entity and is the product of a self-regulatory scheme established after the termination of Law No. 964 of 2005.
The regulation of the financial sector and the securities market in Colombia is directed by Colombia’s Congress, which issues laws, and the Colombian Ministry of Finance’s URF, which issues decrees. Also, the Taxes and National Customs Authority (Dirección de Impuestos y Aduanas Nacionales or DIAN by its Spanish initials) oversees the regulation related to FATCA and CRS.
The Superintendence of Industry and Commerce is the national authority for the protection of fair competition, personal data and legal metrology. The Superintendence of Industry and Commerce also protects the rights of consumers and administers the National System of Industrial Property, through the exercise of its administrative and jurisdictional functions.
Finally, the Colombian Ministry of Commerce, Industry and Tourism’s Superintendence of Corporations (Superintendencia de Sociedades) is a regulatory agency that oversees commercial corporations that are not under the supervision of other Superintendencies.
6.2.5Chile
Chilean Regulation – Credicorp Capital Chile
Credicorp Capital Holding Chile S.A. is the main shareholder of Credicorp Capital Chile S.A., Credicorp Capital Asesorías Financieras SpA, Credicorp Capital Administradora de Inversiones S.A., Credicorp Capital Corredores de Bolsa SpA, Credicorp Capital Asset Management S.A. Administradora General de Fondos, and IM Trust International S.A.
The Comisión para el Mercado Financiero (CMF) is responsible for the supervision of entities in the securities market, insurance, banks, financial institutions, and other financial entities. The CMF ensures that supervised institutions comply with laws, regulations, statutes, and other provisions governing the functioning of these markets. The CMF also authorizes companies to manage mutual and investment funds (known as Mutual Fund Administrators and General Fund Management or AFM and AGF, respectively, by their Spanish initials) and supervises such companies and their managed funds by monitoring their legal, financial, and accounting information to ensure compliance with applicable laws and regulations.
Chilean regulators have established several laws, regulations, and rules to address the various sectors of the stock market. One of those laws is the Chilean Securities Market Law, which governs the functioning of the Chilean market, its corporations, management of third-party funds (investment funds, mutual funds, pension funds and others), and deposit and custody of securities.
Chilean Bank Regulation – Tenpo SpA
Tenpo SpA is the main shareholder of Tenpo Technologies SpA, Tenpo Payments S.A. and Tenpo Bank Chile. Tenpo Payments S.A. and Tenpo Bank Chile (Tenpo's regulated companies) are supervised by the Comisión para el Mercado Financiero (CMF), the Chilean financial regulator responsible for overseeing, among others, banks and non-bank financial institutions. Tenpo Payments S.A. operates as a non-bank issuer of prepaid and credit cards and is subject to a regulatory framework designed to ensure the safety, transparency and integrity of payment services. Under the supervision of the CMF, Tenpo's regulated companies must comply with financial, operational, and consumer protection requirements, including the management of client funds, anti-money laundering measures, and information security standards. Tenpo Bank Chile, a newly established banking institution, has successfully obtained final approval to operate as a bank on January 19, 2026. Once active (must previously finalize technical and operational preparations which are expected by Q3 2026), Tenpo Bank will be subject to the full prudential regulatory regime applicable to banks under Chilean law, including requirements on capital adequacy, liquidity, corporate governance, risk management and depositor protection. The CMF’s oversight aims to ensure the soundness of the banking system while promoting innovation and competition in the financial sector.
6.2.6Panama
International Bank Regulation – BCP Panama
BCP Panama operates as a branch of BCP, having been officially registered as a branch in the Republic of Panama in 2002 under an international license issued by the Panamanian Superintendency of Banks (the "SBP") in accordance with Law Decree No. 9 of February 26, 1998, as amended.
Under this regulatory framework, BCP Panama is subject to periodic inspections conducted by auditors and inspectors from the SBP. These evaluations aim to assess various aspects of BCP Panama's operations, with a particular focus on its adherence to Panamanian banking laws. Notably, this includes compliance with Law Decrees No. 2 of February 22, 2008, and No. 23 of April 27, 2015, which pertain to the prevention of money laundering, terrorism financing, and financing the proliferation of weapons of mass destruction.
ASB Bank Corp.
ASB Bank Corp., a subsidiary of ASHC, operates under an international banking license issued by the Superintendency of Banks of Panama in 2020 pursuant to Law Decree No. 9 of February 26, 1998, as amended. This
license authorizes ASB Bank Corp. to conduct offshore banking activities from its Panama office and perform any other SBP-approved operations. The entity is prohibited from accepting deposits from residents of the Republic of Panama.
ASB Bank Corp. also holds a securities broker license issued by the Superintendency of the Securities Market (SMV), permitting it to act as broker, manager, and custodian. It must comply with regulations on corporate governance, capital adequacy, liquidity, accounting standards, recordkeeping, regulatory reporting, confidentiality, ethics, conflict-of-interest prevention, and anti-money laundering and counter-terrorism financing controls.
Prior approval from the SBP and SMV is required for: (i) changes to the Board of Directors or senior officers; (ii) issuance, transfer, or disposal of shares (waivers are rare except for branches of major international banks or widely held public companies); (iii) material changes to the business plan submitted with the original license applications; and (iv) establishment of subsidiaries, branches, agencies, or representative offices outside Panama.
6.2.7United States
International Bank Regulation – BCP Miami Agency
The BCP Miami Agency is licensed to operate as an international bank agency in the State of Florida and was authorized to transact business by the Comptroller of Florida on September 3, 2002. The BCP Miami Agency is regulated, supervised, and examined by the Office of Financial Regulation (OFR) of the State of Florida Department of Financial Services and by the FED through the Federal Reserve Bank of Atlanta. Our direct and indirect nonbanking subsidiaries doing business in the United States are also subject to the authority of relevant U.S. financial regulatory agencies depending on their U.S. activities.The OFR recently approved an application by BCP to convert BCP Miami’s license to that of an international branch. A corresponding application is pending approval from the FED.
Investment Management and Advisory – Credicorp Capital LLC.
Credicorp Capital LLC is a broker-dealer registered with FINRA and the SEC (CRD No. 136791). Credicorp Capital LLC is owned by Credicorp Capital USA, Inc., which is wholly owned by Credicorp Capital Ltd. Credicorp Capital LLC is headquartered at 1111 Brickell Avenue, Suite 2825, Miami, FL 33131. Credicorp Capital LLC provides brokerage services through a clearing agreement with Pershing, LLC. As of December 31, 2025, there are six registered principals at Credicorp Capital LLC, four of whom hold a Series 24 license, one holds a Series 27 license, and one has a Series 4 license. At the trading desk, all registered representatives maintain Series 7 licenses.
Credicorp Capital LLC has an affiliated SEC investment adviser (CRD No. 290081), Credicorp Capital Advisors LLC, which is headquartered at 1111 Brickell Avenue, Suite 2170, Miami, FL 33131. Both Companies share the same ownership.
(7)Selected statistical information
In the following tables, we have set forth certain selected statistical information and ratios regarding our business for the periods indicated. You should read the selected statistical information in conjunction with the information included in “ITEM 5. OPERATING AND FINANCIAL REVIEW AND PROSPECTS – 5.A Operating Results” and the consolidated financial statements (and the notes that accompany the consolidated financial statements). The statistical information and discussion and analysis given below for the years 2023 through 2025 reflect our consolidated financial position as well as that of our subsidiaries, as of December 31, 2023, 2024 and 2025 and our results of operations for the years then ended.
7.1Average statements of financial position. Income from interest-earning assets and interest paid on interest-bearing liabilities
The tables below set forth selected statistical information based on our average statements of financial position prepared on a consolidated basis. Except as otherwise indicated, we have classified average balances by currency (Soles or foreign currency, primarily U.S. Dollars) rather than by the domestic or international nature of the balance. For the years 2023, 2024 and 2025, the average balances are computed as the average of period-beginning and period-ending balances on a monthly basis. Any of these month-end balances that were denominated in U.S. Dollars have been converted into Soles using the applicable SBS exchange rate as of the date of such balance. Our management believes that the stated averages are representative of our operations, and that it would be too costly to produce daily averages using daily book balances in IFRS but does not believe that the stated averages present trends in a materially different manner from those that would be presented by daily averages.
Average Statements of Financial Position
Assets, Interest Earned and Average Interest Rates (1)
| | | | | | | | | | | | | | | | | | | | | | | | | | | | | | | | | | | | | | | | | | | | | | | | | | | | | |
| As of and for the year ended December 31, |
| 2023 | | 2024 | | 2025 |
| ASSETS: | Average | | Interest | | Nominal | | Average | | Interest | | Nominal | | Average | | Interest | | Nominal |
| Balance | | Earned | | Avg. Rate | | Balance | | Earned | | Avg. Rate | | Balance | | Earned | | Avg. Rate |
| (in thousands of Soles, except percentages) |
| Interest-earning assets: | | | | | | | | | | | | | | | | | |
| Deposits in BCRP | | | | | | | | | | | | | | | | | |
| Soles | 1,421,992 | | | 48,886 | | | 3.44 | | | 2,123,474 | | | 44,384 | | | 2.09 | | | 2,327,548 | | | 40,993 | | | 1.76 | |
| Foreign Currency | 22,622,596 | | | 916,482 | | | 4.05 | | | 28,082,604 | | | 1,173,205 | | | 4.18 | | | 30,737,474 | | | 1,090,966 | | | 3.55 | |
| Total | 24,044,588 | | | 965,368 | | | 4.01 | | | 30,206,078 | | | 1,217,589 | | | 4.03 | | | 33,065,022 | | | 1,131,959 | | | 3.42 | |
| Deposits in other Banks | | | | | | | | | | | | | | | | | |
| Soles | 353,701 | | | 21,002 | | | 5.94 | | | 426,191 | | | 16,206 | | | 3.80 | | | 779,785 | | | 17,352 | | | 2.23 | |
| Foreign Currency | 5,045,544 | | | 146,841 | | | 2.91 | | | 5,929,682 | | | 172,059 | | | 2.90 | | | 7,551,729 | | | 220,262 | | | 2.92 | |
| Total | 5,399,245 | | | 167,843 | | | 3.11 | | | 6,355,873 | | | 188,265 | | | 2.96 | | | 8,331,514 | | | 237,614 | | | 2.85 | |
| Investment securities | | | | | | | | | | | | | | | | | |
| Soles | 32,516,644 | | | 1,860,597 | | | 5.72 | | | 36,768,392 | | | 1,978,505 | | | 5.38 | | | 36,935,252 | | | 1,898,781 | | | 5.14 | |
| Foreign Currency | 17,494,284 | | | 628,730 | | | 3.59 | | | 17,872,951 | | | 681,817 | | | 3.81 | | | 16,794,033 | | | 648,303 | | | 3.86 | |
| Total | 50,010,928 | | | 2,489,327 | | | 4.98 | | | 54,641,343 | | | 2,660,322 | | | 4.87 | | | 53,729,285 | | | 2,547,084 | | | 4.74 | |
| Total loans (1) | | | | | | | | | | | | | | | | | |
| Soles | 93,973,071 | | | 11,384,353 | | | 12.11 | | | 91,878,934 | | | 11,667,721 | | | 12.70 | | | 94,318,597 | | | 12,134,441 | | | 12.87 | |
| Foreign Currency | 50,999,969 | | | 3,660,511 | | | 7.18 | | | 52,004,425 | | | 3,986,670 | | | 7.67 | | | 50,154,200 | | | 3,609,068 | | | 7.20 | |
| Total | 144,973,040 | | | 15,044,864 | | | 10.38 | | | 143,883,359 | | | 15,654,391 | | | 10.88 | | | 144,472,797 | | | 15,743,509 | | | 10.90 | |
| Total interest-earning assets | | | | | | | | | | | | | | | | | |
| Soles | 128,570,734 | | | 13,338,876 | | | 10.37 | | | 131,397,803 | | | 13,726,292 | | | 10.45 | | | 134,458,884 | | | 14,130,247 | | | 10.51 | |
| Foreign Currency | 96,235,917 | | | 5,374,606 | | | 5.58 | | | 103,984,957 | | | 6,043,744 | | | 5.81 | | | 105,336,643 | | | 5,617,194 | | | 5.33 | |
| Total | 224,806,651 | | | 18,713,482 | | | 8.32 | | | 235,382,760 | | | 19,770,036 | | | 8.40 | | | 239,795,527 | | | 19,747,441 | | | 8.24 | |
| Noninterest-earningassets: | | | | | | | | | | | | | | | | | |
| Cash and due from banks | | | | | | | | | | | | | | | | | |
| Soles | 2,793,182 | | | | | | | 2,753,097 | | | | | | | 2,874,184 | | | | | |
| Foreign Currency | 2,495,997 | | | | | | | 2,212,880 | | | | | | | 2,163,470 | | | | | |
| Total | 5,289,179 | | | | | | | 4,965,977 | | | | | | | 5,037,654 | | | | | |
| Allowance for direct loan losses | | | | | | | | | | | | | | | | | |
| Soles | (6,407,643) | | | | | | | (6,703,442) | | | | | | | (6,351,595) | | | | | |
| Foreign Currency | (1,636,324) | | | | | | | (1,546,473) | | | | | | | (1,365,918) | | | | | |
| Total | (8,043,967) | | | | | | | (8,249,915) | | | | | | | (7,717,513) | | | | | |
| Premises and equipment | | | | | | | | | | | | | | | | | |
| Soles | 803,396 | | | | | | | 793,622 | | | | | | | 1,519,839 | | | | | |
| Foreign Currency | 1,048,397 | | | | | | | 1,146,069 | | | | | | | 1,182,213 | | | | | |
| Total | 1,851,793 | | | | | | | 1,939,691 | | | | | | | 2,702,052 | | | | | |
| Other non-interest-earning assets, derivatives and other interest income | | | | | | | | | | | | | | | | | |
| Soles | 7,375,972 | | | 26,837 | | | | | 5,499,804 | | | 29,701 | | | | | 9,855,505 | | | 30,244 | | | |
| Foreign Currency | 5,110,201 | | | 58,176 | | | | | 9,007,200 | | | 69,519 | | | | | 7,187,722 | | | 152,484 | | | |
| Total | 12,486,173 | | | 85,013 | | | | | 14,507,004 | | | 99,220 | | | | | 17,043,227 | | | 182,728 | | | |
| Total non-interest-earning assets | | | | | | | | | | | | | | | | | |
| Soles | 4,564,907 | | | 26,837 | | | | | 2,343,081 | | | 29,701 | | | | | 7,897,933 | | | 30,244 | | | |
| Foreign Currency | 7,018,271 | | | 58,176 | | | | | 10,819,676 | | | 69,519 | | | | | 9,167,487 | | | 152,484 | | | |
| Total | 11,583,178 | | | 85,013 | | | | | 13,162,757 | | | 99,220 | | | | | 17,065,420 | | | 182,728 | | | |
| Total average assets | | | | | | | | | | | | | | | | | |
| Soles | 133,135,641 | | | 13,365,713 | | | 10.04 | | | 133,740,884 | | | 13,755,993 | | | 10.29 | | | 142,356,817 | | | 14,160,491 | | | 9.95 | |
| Foreign Currency | 103,254,188 | | | 5,432,782 | | | 5.26 | | | 114,804,633 | | | 6,113,263 | | | 5.32 | | | 114,504,130 | | | 5,769,678 | | | 5.04 | |
| Total | 236,389,829 | | | 18,798,495 | | | 7.95 | | | 248,545,517 | | | 19,869,256 | | | 7.99 | | | 256,860,947 | | | 19,930,169 | | | 7.76 | |
(1)Figures for total loans include internal overdue loans. Accrued interest is included.
Average Statements of Financial Position
Liabilities and Equity, Interest Paid and Average Interest Rates (1)
| | | | | | | | | | | | | | | | | | | | | | | | | | | | | | | | | | | | | | | | | | | | | | | | | | | | | |
| As of and for the year ended December 31, |
| 2023 | | 2024 | | 2025 |
| LIABILITIES | Average | | Interest | | Nominal | | Average | | Interest | | Nominal | | Average | | Interest | | Nominal |
| Balance | | Earned | | Avg. Rate | | Balance | | Earned | | Avg. Rate | | Balance | | Earned | | Avg. Rate |
| (in thousands of Soles, except percentages) |
| Interest-bearing liabilities: | | | | | | | | | | | | | | | | | |
| Savings deposits | | | | | | | | | | | | | | | | | |
Soles (1) | 28,590,670 | | | 134,799 | | | 0.47 | | | 31,978,061 | | | 154,474 | | | 0.48 | | | 37,656,392 | | | 192,790 | | | 0.51 | |
Foreign Currency (1) | 22,367,744 | | | 98,512 | | | 0.44 | | | 22,023,398 | | | 98,729 | | | 0.45 | | | 23,254,935 | | | 109,015 | | | 0.47 | |
| Total | 50,958,414 | | | 233,311 | | | 0.46 | | | 54,001,459 | | | 253,203 | | | 0.47 | | | 60,911,327 | | | 301,805 | | | 0.50 | |
| Time deposits | | | | | | | | | | | | | | | | | |
Soles (1) | 24,473,231 | | | 1,786,436 | | | 7.30 | | | 22,833,294 | | | 1,292,983 | | | 5.66 | | | 25,300,008 | | | 1,169,169 | | | 4.62 | |
Foreign Currency (1) | 24,922,780 | | | 1,118,189 | | | 4.49 | | | 26,237,616 | | | 1,228,905 | | | 4.68 | | | 21,482,586 | | | 872,175 | | | 4.06 | |
| Total | 49,396,011 | | | 2,904,625 | | | 5.88 | | | 49,070,910 | | | 2,521,888 | | | 5.14 | | | 46,782,594 | | | 2,041,344 | | | 4.36 | |
| Due to banks and correspondents | | | | | | | | | | | | | | | | | |
| Soles | 5,283,963 | | | 394,481 | | | 7.47 | | | 5,661,793 | | | 394,073 | | | 6.96 | | | 6,058,736 | | | 403,675 | | | 6.66 | |
| Foreign Currency | 5,026,762 | | | 301,493 | | | 6.00 | | | 5,945,340 | | | 379,036 | | | 6.38 | | | 5,144,649 | | | 270,308 | | | 5.25 | |
| Total | 10,310,725 | | | 695,974 | | | 6.75 | | | 11,607,133 | | | 773,109 | | | 6.66 | | | 11,203,385 | | | 673,983 | | | 6.02 | |
| Bonds | | | | | | | | | | | | | | | | | |
| Soles | 3,157,402 | | | 174,486 | | | 5.53 | | | 3,300,430 | | | 209,670 | | | 6.35 | | | 1,704,055 | | | 114,274 | | | 6.71 | |
| Foreign Currency | 11,824,668 | | | 459,813 | | | 3.89 | | | 14,226,495 | | | 589,553 | | | 4.14 | | | 12,265,412 | | | 596,116 | | | 4.86 | |
| Total | 14,982,070 | | | 634,299 | | | 4.23 | | | 17,526,925 | | | 799,223 | | | 4.56 | | | 13,969,467 | | | 710,390 | | | 5.09 | |
| Payables from repurchase agreements | | | | | | | | | | | | | | | | | |
| Soles | 10,145,022 | | | 440,515 | | | 4.34 | | | 6,295,059 | | | 283,939 | | | 4.51 | | | 6,418,091 | | | 316,349 | | | 4.93 | |
| Foreign Currency | 1,999,157 | | | 22,176 | | | 1.11 | | | 2,219,275 | | | 24,078 | | | 1.08 | | | 3,673,543 | | | 39,261 | | | 1.07 | |
| Total | 12,144,179 | | | 462,691 | | | 3.81 | | | 8,514,334 | | | 308,017 | | | 3.62 | | | 10,091,634 | | | 355,610 | | | 3.52 | |
| Total interest-bearing liabilities | | | | | | | | | | | | | | | | | |
| Soles | 71,650,288 | | | 2,930,717 | | | 4.09 | | | 70,068,637 | | | 2,335,139 | | | 3.33 | | | 77,137,282 | | | 2,196,257 | | | 2.85 | |
| Foreign Currency | 66,141,111 | | | 2,000,183 | | | 3.02 | | | 70,652,124 | | | 2,320,301 | | | 3.28 | | | 65,821,125 | | | 1,886,875 | | | 2.87 | |
| Total | 137,791,399 | | | 4,930,900 | | | 3.58 | | | 140,720,761 | | | 4,655,440 | | | 3.31 | | | 142,958,407 | | | 4,083,132 | | | 2.86 | |
| Other liabilities and equity: | | | | | | | | | | | | | | | | | |
Demand deposits (2) | | | | | | | | | | | | | | | | | |
Soles (1) | 21,326,565 | | | 140,673 | | | 0.66 | | | 24,323,612 | | | 208,568 | | | 0.86 | | | 25,039,818 | | | 142,234 | | | 0.57 | |
Foreign Currency (1) | 24,807,373 | | | 100,142 | | | 0.40 | | | 25,714,056 | | | 123,399 | | | 0.48 | | | 26,868,966 | | | 101,939 | | | 0.38 | |
| Total | 46,133,938 | | | 240,815 | | | 0.52 | | | 50,037,668 | | | 331,967 | | | 0.66 | | | 51,908,784 | | | 244,173 | | | 0.47 | |
| Other liabilities, derivatives and other interest expenses | | | | | | | | | | | | | | | | | |
| Soles | 11,704,076 | | | 337,277 | | | | | 13,086,782 | | | 362,644 | | | | | 14,715,452 | | | 425,760 | | | |
| Foreign Currency | 9,593,175 | | | 351,531 | | | | | 10,948,258 | | | 404,074 | | | | | 10,898,169 | | | 460,625 | | | |
| Total | 21,297,251 | | | 688,808 | | | | | 24,035,040 | | | 766,718 | | | | | 25,613,621 | | | 886,385 | | | |
| Equity attributable to Credicorp equity holders | | | | | | | | | | | | | | | | | |
| Soles | | | | | | | | | | | | | | | | | |
| Foreign Currency | 30,548,712 | | | | | | | 33,134,113 | | | | | | | 35,730,018 | | | | | |
| Total | 30,548,712 | | | | | | | 33,134,113 | | | | | | | 35,730,018 | | | | | |
| Non-controlling interest | | | | | | | | | | | | | | | | | |
| Soles | | | | | | | | | | | | | | | | | |
| Foreign Currency | 618,529 | | | | | | | 617,935 | | | | | | | 650,117 | | | | | |
| Total | 618,529 | | | | | | | 617,935 | | | | | | | 650,117 | | | | | |
| Total non-interest-bearing liabilities and equity | | | | | | | | | | | | | | | | | |
| Soles | 33,030,641 | | | 477,950 | | | | | 37,410,394 | | | 571,212 | | | | | 39,755,270 | | | 567,994 | | | |
| Foreign Currency | 65,567,789 | | | 451,673 | | | | | 70,414,362 | | | 527,473 | | | | | 74,147,270 | | | 562,564 | | | |
| Total | 98,598,430 | | | 929,623 | | | | | 107,824,756 | | | 1,098,685 | | | | | 113,902,540 | | | 1,130,558 | | | |
| Total average liabilities and equity | | | | | | | | | | | | | | | | | |
| Soles | 104,680,929 | | | 3,408,667 | | | 3.26 | | | 107,479,031 | | | 2,906,351 | | | 2.70 | | | 116,892,552 | | | 2,764,251 | | | 2.36 | |
| Foreign Currency | 131,708,900 | | | 2,451,856 | | | 1.86 | | | 141,066,486 | | | 2,847,774 | | | 2.02 | | | 139,968,395 | | | 2,449,439 | | | 1.75 | |
| Total | 236,389,829 | | | 5,860,523 | | | 2.48 | | | 248,545,517 | | | 5,754,125 | | | 2.32 | | | 256,860,947 | | | 5,213,690 | | | 2.03 | |
(1)Interest and average rate paid include the amount paid for the applicable deposit insurance fund.
(2)We typically do not pay interest for demand deposits; however, in exceptional circumstances the Group pays interest on certain demand deposits of corporate clients that hold balances exceeding certain amounts. See “7.4 Deposits” for the amounts of non-interest-bearing demand deposits and interest-bearing demand deposits as of December 31, 2023, 2024 and 2025. Interest paid on demand deposits is not considered material.
7.1.1 Changes in net interest, similar income, and expense: volume and rate analysis
The table below sets forth the net effect of increases and decreases due to changes in volume and rate on annual variation in interest income and interest expense. Volume and rate variations have been calculated based on variations in average balances over the period and changes in average rates on interest-earning assets and interest-bearing liabilities from one period to the other. The net changes in “Interest and similar income” and “Interest and similar expense” attributable to both changes in functional currency (Sol) and changes in foreign currency also are presented in the table:
| | | | | | | | | | | | | | | | | |
| 2025/2024 |
| Increase/(Decrease) due to changes in: |
| Volume | | Rate | | Net Change |
| | | | | |
| (in thousands of Soles) |
| Interest and similar income (1): | | | | | |
| Interest-earning deposits in BCRP | | | | | |
| Soles | 3,930 | | | (7,321) | | | (3,391) | |
| Foreign Currency | 102,571 | | | (184,810) | | | (82,239) | |
| Total | 106,501 | | | (192,131) | | | (85,630) | |
| Deposits in other banks | | | | | |
| Soles | 10,657 | | | (9,511) | | | 1,146 | |
| Foreign Currency | 47,188 | | | 1,015 | | | 48,203 | |
| Total | 57,845 | | | (8,496) | | | 49,349 | |
| Investment securities | | | | | |
| Soles | 8,778 | | | (88,502) | | | (79,724) | |
| Foreign Currency | (41,404) | | | 7,890 | | | (33,514) | |
| Total | (32,626) | | | (80,612) | | | (113,238) | |
| Total loans (2) | | | | | |
| Soles | 311,842 | | | 154,878 | | | 466,720 | |
| Foreign Currency | (137,490) | | | (240,112) | | | (377,602) | |
| Total | 174,352 | | | (85,234) | | | 89,118 | |
| Total dividend-earning assets | | | | | |
| Soles | (25,411) | | | 44,615 | | | 19,204 | |
| Foreign Currency | 1,574 | | | 17,028 | | | 18,602 | |
| Total | (23,837) | | | 61,643 | | | 37,806 | |
| Total interest-earning assets | | | | | |
| Soles | 320,730 | | | 83,225 | | | 403,955 | |
| Foreign Currency | 75,321 | | | (501,871) | | | (426,550) | |
| Total | 396,051 | | | (418,646) | | | (22,595) | |
| Interest and similar expense: | | | | | |
| Demand deposits | | | | | |
| Soles | 5,105 | | | (71,439) | | | (66,334) | |
| Foreign Currency | 4,962 | | | (26,422) | | | (21,460) | |
| Total | 10,067 | | | (97,861) | | | (87,794) | |
| Savings deposits | | | | | |
| | | | | | | | | | | | | | | | | |
| Soles | 28,251 | | | 10,065 | | | 38,316 | |
| Foreign Currency | 5,647 | | | 4,639 | | | 10,286 | |
| Total | 33,898 | | | 14,704 | | | 48,602 | |
| Time deposits | | | | | |
| Soles | 126,838 | | | (250,652) | | | (123,814) | |
| Foreign Currency | (207,882) | | | (148,848) | | | (356,730) | |
| Total | (81,044) | | | (399,500) | | | (480,544) | |
| Due to banks and correspondents and issued bonds | | | | | |
| Soles | 27,038 | | | (17,436) | | | 9,602 | |
| Foreign Currency | (46,558) | | | (62,169) | | | (108,727) | |
| Total | (19,520) | | | (79,605) | | | (99,125) | |
| Bonds | | | | | |
| Soles | (104,234) | | | 8,838 | | | (95,396) | |
| Foreign Currency | (88,290) | | | 94,853 | | | 6,563 | |
| Total | (192,524) | | | 103,691 | | | (88,833) | |
| Payables from repurchase agreements | | | | | |
| Soles | 5,807 | | | 26,603 | | | 32,410 | |
| Foreign Currency | 15,660 | | | (477) | | | 15,183 | |
| Total | 21,467 | | | 26,126 | | | 47,593 | |
| Total interest-bearing liabilities | | | | | |
| Soles | 218,416 | | | (357,298) | | | (138,882) | |
| Foreign Currency | (148,572) | | | (284,853) | | | (433,425) | |
| Total | 69,844 | | | (642,151) | | | (572,307) | |
(1)Annual changes due to interest earned or spent are reflected in the volume and rate indicated. Which is calculated as follows:
-Volume: The variation in volume from one year to the next, multiplied by the average rate yield.
-Rate: The average volume from one year to the next, multiplied by the rate yield variance
-Net change: The sum of the volume and the calculated rate.
(2)Figures for total loans include internal overdue loans. Accrued interest is included.
7.1.2 Average interest-earning assets, net interest margin (NIM), and yield spread
The following table shows, for each of the periods indicated, the levels of average interest-earning assets, net interest income, gross yield, NIM and yield spread by currency, all on a nominal basis:
| | | | | | | | | | | | | | | | | |
| 2023 | | 2024 | | 2025 |
| | | | | |
| (in thousands of Soles, except percentages) |
| Average interest-earning assets (1) | | | | | |
| Soles | 128,570,733 | | 131,397,803 | | 134,458,884 |
| Foreign Currency | 96,235,918 | | 103,984,957 | | 105,336,643 |
| Total | 224,806,651 | | 235,382,760 | | 239,795,527 |
| Net interest income from interest-earning assets | | | | | |
| Soles | 10,408,159 | | 11,391,153 | | 11,933,990 |
| Foreign Currency | 3,374,423 | | 3,723,443 | | 3,730,319 |
| Total (2) | 13,782,582 | | 15,114,596 | | 15,664,309 |
| Gross yield (3) | | | | | |
| Soles | 10.37 | % | | 10.45 | % | | 10.51 | % |
| Foreign Currency | 5.58 | % | | 5.81 | % | | 5.33 | % |
| Weighted-average rate | 8.32 | % | | 8.40 | % | | 8.24 | % |
| NIM (4) | | | | | |
| Soles | 8.10 | % | | 8.67 | % | | 8.88 | % |
| Foreign Currency | 3.51 | % | | 3.58 | % | | 3.54 | % |
| Weighted-average rate | 6.13 | % | | 6.42 | % | | 6.53 | % |
| Yield spread (5) | | | | | |
| Soles | 6.28 | % | | 7.11 | % | | 7.66 | % |
| Foreign Currency | 2.56 | % | | 2.53 | % | | 2.46 | % |
| Weighted-average rate | 4.75 | % | | 5.09 | % | | 5.38 | % |
(1)Monthly average balances.
(2)Net interest income includes the interest earned on total interest-earning assets and interest paid on total interest-bearing liabilities, as shown in section “7.1 Average statements of financial position and income from interest-earning assets”.
(3)Gross yield is interest income divided by average interest-earning assets.
(4)NIM represents “Net interest income from interest-earning assets” divided by “Average interest-earning assets”, both computed on a monthly basis.
(5)Yield spread on a nominal basis, represents the difference between gross yield on average interest-earning assets and average cost of interest-bearing liabilities.
7.1.3 Interest-earning deposits with other banks
The following table shows the short-term funds deposited with other banks. These deposits are denominated by currency as of the dates indicated. Deposits held in countries other than Peru are denominated in several currencies;
however, the majority of these deposits are denominated in U.S. Dollars. All currencies were converted to Soles using the applicable SBS exchange rate as of the dates indicated.
| | | | | | | | | | | | | | | | | |
| Year ended December 31, |
| 2023 | | 2024 | | 2025 |
| | | | | |
| (in thousands of Soles) |
| Sol-denominated: | | | | | |
| BCRP | 1,263,461 | | | 1,544,567 | | | 2,726,273 | |
| Commercial banks | 139,083 | | | 213,911 | | | 195,800 | |
| Total Sol-denominated | 1,402,544 | | | 1,758,478 | | | 2,922,073 | |
| Foreign Currency-denominated: | | | | | |
| BCRP (U.S. Dollars) | 21,434,215 | | | 34,385,375 | | | 33,903,646 | |
| Commercial banks (U.S. Dollars) | 2,824,558 | | | 3,450,168 | | | 3,279,630 | |
| Commercial banks (other currencies) | 317,260 | | | 525,916 | | | 1,289,468 | |
| Total Foreign Currency-denominated | 24,576,033 | | | 38,361,459 | | | 38,472,744 | |
| Total | 25,978,577 | | | 40,119,937 | | | 41,394,817 | |
7.2Investment portfolio
As of December 31, 2023, 2024 and 2025, the Group classified its investments in one of the categories defined by IFRS 9 based on the business model for managing the financial assets and the characteristics of the contractual cash flows of the investment.
For information about how we classify and measure investments, refer to Note 3(f) (Financial instruments: Initial recognition and subsequent measurement) to the consolidated financial statements.
The following table shows, for 2023, 2024 and 2025, the fair value of our investments at fair value through profit or loss, investments at fair value through other comprehensive income and the amortized cost of our investments at amortized cost under IFRS 9, in each case, without accrued interest and broken down by type of security at the dates indicated.
| | | | | | | | | | | | | | | | | |
| Year ended December 31, |
| 2023 | | 2024 | | 2025 |
| (in thousands of Soles) |
| Sol-denominated: | | | | | |
| Government treasury bonds | 17,334,217 | | | 18,579,739 | | | 19,605,197 | |
| Certificates of deposit BCRP | 10,935,253 | | | 11,435,757 | | | 10,884,030 | |
| Corporate bonds | 4,685,719 | | | 4,663,189 | | | 4,601,793 | |
| Securitization instruments | 402,921 | | | 425,251 | | | 710,625 | |
| Negotiable Certificates of Deposit | - | | | - | | | 4,877 | |
| Subordinated bonds | 111,536 | | | 105,326 | | | 49,531 | |
| Equity securities | 290,975 | | | 110,657 | | | 84,745 | |
| Restricted mutual funds | - | | | 306,759 | | | 335,803 | |
| Other investments of debt | 73,986 | | | 87,269 | | | 100,109 | |
| Other investments of equity | 337,861 | | | 561,210 | | | 657,235 | |
| Total Sol-denominated | 34,172,468 | | | 36,275,157 | | | 37,033,945 | |
| Foreign currency- denominated: | | | | | |
| Government treasury bonds | 3,999,661 | | | 3,466,781 | | | 2,838,956 | |
| Certificates of deposit BCRP | 192,666 | | | - | | | - | |
| Corporate bonds | 9,166,657 | | | 10,052,151 | | | 9,110,503 | |
| Securitization instruments | 280,198 | | | 285,239 | | | 298,325 | |
| Negotiable Certificates of Deposit | 517,973 | | | 448,037 | | | 235,738 | |
| Subordinated bonds | 227,512 | | | 132,489 | | | 207,140 | |
| Equity securities | 82,550 | | | 108,032 | | | 90,382 | |
| Participation in RAL Funds | 145,414 | | | 432,503 | | | 125,393 | |
| Restricted mutual funds | 334,162 | | | 466 | | | 356 | |
| Other investments of equity | 1,997,585 | | | 1,502,536 | | | 1,579,966 | |
| Other investments of debt | 398,313 | | | 369,150 | | | 517,511 | |
| Total foreign currency- denominated | 17,342,691 | | | 16,797,384 | | | 15,004,270 | |
Total securities holdings (1) | 51,515,159 | | | 53,072,541 | | | 52,038,215 | |
(1)Excludes accrued interest, which amounts to S/700.4 million, S/753.3 million and S/766.7 million as of December 31, 2023, 2024 and 2025, respectively. Also excludes provision for credit losses on investment at amortized cost.
The expected loss provision for marketable securities is debited individually to each security.
The weighted-average yield on our Sol-denominated interest-earning investment securities was 5.7% in 2023, 5.4% in 2024 and 5.1% in 2025. The weighted-average yield on our foreign currency-denominated portfolio was 3.6% in 2023, 3.8% in 2024 and 3.9% in 2025. The total weighted-average yield of our investment securities was 5.0% in 2023, 4.9% in 2024, and 4.7% in 2025.
As of December 31, 2025, the investments at fair value through other comprehensive income and investments at amortized cost pledged as collateral amounted to S/6,314.4 million. The following tables show the weighted average yield separate by maturity of investments at fair value through other comprehensive income and at amortized cost in each case, without accrued interest as of December 31, 2025:
Investments at fair value with changes in other comprehensive income:
| | | | | | | | | | | | | | | | | | | | | | | | | | | | | | | | | | | | | | | | | | | | | | | | | | | | | | | | | | | | | | | | | | | | | | | |
| Without
maturity | | Within 1 year | | Weighted
average yield
(1) | | After 1 year
but within
3 years | | Weighted
average
yield (1) | | Maturing after
3 years
but within 5 years | | Weighted
average
yield (1) | | Maturing after
5 years but
within 10
years | | Weighted
average
yield (1) | | After 10 years | | Weighted
average
yield (1) | | Total |
| (in thousands of Soles) |
| Sol-denominated: | | | | | | | | | | | | | | | | | | | | | | | |
| Government treasury bonds | - | | | 245,167 | | | 3.64 | % | | 21,662 | | | 4.14 | % | | 45,023 | | | 2.47 | % | | 7,759,684 | | | 5.11 | % | | 2,857,561 | | | 5.57 | % | | 10,929,097 | |
| Certificates of deposit BCRP | - | | | 10,700,287 | | | 4.05 | % | | 183,743 | | | 3.98 | % | | - | | | - | | | - | | | - | | | - | | | - | | | 10,884,030 | |
| Corporate bonds | 1,550 | | | 413,924 | | | 4.63 | % | | 957,431 | | | 4.77 | % | | 833,446 | | | 4.85 | % | | 1,512,263 | | | 5.87 | % | | 876,721 | | | 6.03 | % | | 4,595,335 | |
| Securitization instruments | - | | | 88 | | | 5.08 | % | | 4,488 | | | 4.48 | % | | 10,677 | | | 6.00 | % | | 268,081 | | | 7.67 | % | | 427,291 | | | 6.04 | % | | 710,625 | |
| Negotiable Certificates of Deposit | - | | | 972 | | | - | | | - | | | - | | | - | | | - | | | - | | | - | | | - | | | - | | | 972 | |
| Subordinated bonds | - | | | - | | | - | | | - | | | - | | | - | | | - | | | 49,531 | | | 6.21 | % | | - | | | - | | | 49,531 | |
| Other investments of debt | - | | | 12,185 | | | 2.55 | % | | 39,423 | | | 2.94 | % | | 20,706 | | | 2.62 | % | | 27,795 | | | 3.15 | % | | - | | | - | | | 100,109 | |
| Equity securities | 83,608 | | | - | | | - | | | - | | | - | | | - | | | - | | | - | | | - | | | - | | | - | | | 83,608 | |
| Total Sol-denominated | 85,158 | | | 11,372,623 | | | | | 1,206,747 | | | | | 909,852 | | | | | 9,617,354 | | | | | 4,161,573 | | | | | 27,353,307 | |
| Foreign Currency-denominated: | | | | | | | | | | | | | | | | | | | | | | | |
| Government treasury bonds | - | | | 142,732 | | | 4.50 | % | | 155,779 | | | 4.58 | % | | 257,481 | | | 4.98 | % | | 576,530 | | | 5.56 | % | | 334,539 | | | 5.41 | % | | 1,467,061 | |
| Corporate bonds | 1,036 | | | 841,963 | | | 4.17 | % | | 1,682,974 | | | 4.29 | % | | 1,511,368 | | | 4.99 | % | | 2,395,780 | | | 5.41 | % | | 2,191,858 | | | 5.87 | % | | 8,624,979 | |
| Securitization instruments | - | | | - | | | - | | | 12,320 | | | 4.25 | % | | 41,949 | | | 4.23 | % | | 111,461 | | | 7.47 | % | | 119,975 | | | 8.46 | % | | 285,705 | |
| Negotiable Certificates of Deposit | - | | | 128,790 | | | 3.82 | % | | 51,785 | | | 4.03 | % | | 19,063 | | | 4.21 | % | | 14,480 | | | 3.25 | % | | 16,180 | | | 2.14 | % | | 230,298 | |
| Subordinated bonds | - | | | 4,838 | | | 5.14 | % | | 26,076 | | | 4.24 | % | | 9,304 | | | 4.64 | % | | 55,510 | | | 5.12 | % | | 47,559 | | | 5.58 | % | | 143,287 | |
| Other investments of debt | - | | | 358,211 | | | 5.31 | % | | 4,117 | | | 7.49 | % | | - | | | - | | | - | | | - | | | - | | | - | | | 362,328 | |
| Equity securities | 6,713 | | | - | | | - | | | - | | | - | | | - | | | - | | | - | | | - | | | - | | | - | | | 6,713 | |
| Total Foreign Currency-denominated | 7,749 | | | 1,476,534 | | | | | 1,933,051 | | | | | 1,839,165 | | | | | 3,153,761 | | | | | 2,710,111 | | | | | 11,120,371 | |
| Total securities holdings (2): | 92,907 | | | 12,849,157 | | | | | 3,139,798 | | | | | 2,749,017 | | | | | 12,771,115 | | | | | 6,871,684 | | | | | 38,473,678 | |
(1)Rates have been presented on a non-taxable equivalent basis.
(2)Excludes accrued interest, which amounts to S/560.4 million as of December 31, 2025.
Investments at amortized cost:
| | | | | | | | | | | | | | | | | | | | | | | | | | | | | | | | | | | | | | | | | | | | | | | | | | | | | | | | | | | | | | | | | | | | | | | |
| Without
maturity | | Within 1 year | | Weighted
average
yield (1) | | After 1 year
but within
3 years | | Weighted
average
yield (1) | | Maturing after
3 years but
within 5 years | | Weighted
average
yield (1) | | Maturing
after 5 years
but within 10
years | | Weighted
average
yield (1) | | After 10
years | | Weighted
average
yield (1) | | Total |
| (in thousands of Soles) |
| Sol-denominated: | | | | | | | | | | | | | | | | | | | | | | | |
| Government treasury bonds | - | | | - | | | - | | | 1,168,037 | | | 4.13 | % | | 1,008,801 | | | 4.21 | % | | 4,093,342 | | | 4.96 | % | | 1,779,619 | | | 6.39 | % | | 8,049,799 | |
| Corporate bonds | - | | | - | | | - | | | 4,935 | | | 4.45 | % | | - | | | - | | | 1,499 | | | 6.25 | % | | - | | | - | | | 6,434 | |
| Negotiable certificates of deposit | - | | | 3,905 | | | - | | | - | | | - | | | - | | | - | | | - | | | - | | | - | | | - | | | 3,905 | |
| Total Sol-denominated | - | | | 3,905 | | | | | 1,172,972 | | | | | 1,008,801 | | | | | 4,094,841 | | | | | 1,779,619 | | | | | 8,060,138 | |
| Foreign Currency-denominated: | | | | | | | | | | | | | | | | | | | | | | | |
| Government treasury bonds | - | | | 40,238 | | | 7.21 | % | | 16,980 | | | 4.32 | % | | - | | | - | | | - | | | - | | | - | | | - | | | 57,218 | |
| Corporate bonds | - | | | 168,933 | | | 5.21 | % | | 222,436 | | | 4.72 | % | | 6,535 | | | 4.90 | % | | - | | | - | | | - | | | - | | | 397,904 | |
| Securitization instruments | - | | | - | | | - | | | 905 | | | 4.25 | % | | 1,895 | | | 4.27 | % | | 9,012 | | | 7.79 | % | | - | | | - | | | 11,812 | |
| Subordinated bonds | - | | | 28,175 | | | 5.14 | % | | - | | | - | | | - | | | - | | | - | | | - | | | - | | | - | | | 28,175 | |
| Other investments of debt | - | | | 68,628 | | | 6.46 | % | | - | | | - | | | - | | | - | | | - | | | - | | | - | | | - | | | 68,628 | |
| Total Foreign Currency-denominated | - | | | 305,974 | | | | | 240,321 | | | | | 8,430 | | | | | 9,012 | | | | | - | | | | | 563,737 | |
| Total securities holdings (2): | - | | | 309,879 | | | | | 1,413,293 | | | | | 1,017,231 | | | | | 4,103,853 | | | | | 1,779,619 | | | | | 8,623,875 | |
(1)Rates have been presented on a non-taxable equivalent basis.
(2)Excludes accrued interest, which amounts to S/189.8 million as of December 31, 2025.
The maturities of our investment securities classified as fair value through other comprehensive income, as of December 31, 2025, are described in “ITEM 11. QUANTITATIVE AND QUALITATIVE DISCLOSURES ABOUT RISK MANAGEMENT”.
As of December 31, 2023, 2024 and 2025, the Group had in investments at fair value with changes in other comprehensive income 111,613, 116,499 and 110,274 certificates of deposit of the BCRP, respectively, which are instruments issued at discount through public auction, negotiated in the Peruvian secondary market and payable in Soles.
The unrealized net result of our investments at fair value through other comprehensive income, as of December 31, 2023, 2024 and 2025, amounted to losses of S/362.4 million, S/284.0 million and a gains of S/805.8 million, respectively.
As of December 31, 2023, 2024 and 2025, for debt instruments measured at amortized cost or at fair value through other comprehensive income, expected credit losses are measured in accordance with a three-stage impairment model as required by IFRS 9. The allocation of financial assets to each stage is based on an assessment of whether there has been a significant increase in credit risk since initial recognition, which determines the amount of expected credit loss (ECL) recognized at each reporting date
The ECL is an estimate that considers multiple forward-looking macro-economic scenarios that result in more timely recognition of credit losses.
Management assesses investments in accordance with the business model under which they are managed and the contractual cash flow characteristics of the instruments, as required by IFRS 9.
Unrealized gains and losses are recognized in profit or loss or other comprehensive income based on the classification of the instrument. For debt instruments measured at amortized cost or at fair value through other comprehensive income, expected credit losses are recognized in the consolidated income statement in accordance with the IFRS 9 expected credit loss model.
7.3Loan portfolio
Except where otherwise specified, references to loans in this section 7.3 are to our direct loans. Our direct loans are distinct from our indirect loans (which are discussed in Note 18(a) of our consolidated financial statements) and our due from customers on banker’s acceptances (which are discussed in Note 3(n) of our consolidated financial statements).
7.3.1Loans by type of loan
The following table shows our loans by type of loan, at the dates indicated:
| | | | | | | | | | | | | | | | | |
| As of December 31, |
| 2023 | | 2024 | | 2025 |
| (in thousands of Soles) |
| Loans (1) | 122,282,426 | | | 124,620,531 | | | 129,025,454 | |
| Leasing receivables | 5,735,973 | | | 5,260,182 | | | 5,019,366 | |
| Discounted notes | 3,170,887 | | | 3,391,576 | | | 4,098,691 | |
| Factoring receivables and confirming | 3,431,323 | | | 3,243,531 | | | 3,598,101 | |
| Advances and overdrafts in current account | 321,962 | | | 132,231 | | | 56,637 | |
| Refinanced loans | 2,407,516 | | | 2,241,062 | | | 2,009,723 | |
| Total performing loans | 137,350,087 | | | 138,889,113 | | | 143,807,972 | |
| Internal overdue loans | 6,133,167 | | | 5,430,132 | | | 4,821,126 | |
| Accrued interest | 1,492,797 | | | 1,413,028 | | | 1,355,856 | |
| Total loans (2) | 144,976,051 | | | 145,732,273 | | | 149,984,954 | |
(1)The credit card loans balance amounts to S/7,112.3 million, S/6,223.7 million and S/6,716.7 million for the years 2023, 2024 and 2025, respectively.
(2)Due to current loans, we had off-balance-sheet items that amounted to S/20,051.6 million, S/22,139.3 million, and S/21,267.2 million, as of December 31, 2023, 2024 and 2025 respectively. See Note 18 to the consolidated financial statements.
The loan portfolio categories set forth in the table above are based on internal classifications, which apply to loans generated by BCP Stand-alone, SEAH, Mibanco, BCP Bolivia, Mibanco Colombia, Tenpo Payment and ASB Bank Corp. We categorize loans as follows:
•Loans: Basic term loans documented by promissory notes and other extensions of credit, such as mortgage loans, credit cards and other consumer loans in various forms, including trade finance loans to importers and exporters on specialized terms adapted to the needs of the international trade transaction.
•Leasing receivables: Transactions that involve our acquisition of an asset and the financial leasing of that asset to a client.
•Discounted notes: Loans discounted at the outset (the client signs a promissory note or other evidence of indebtedness for the principal amount payable at a future date). Discounted loans also include discounting of drafts, where we make a loan supported by a draft signed by one party and discounted by another party, with recourse to both parties.
•Factoring receivables: The sale of title of a company’s account receivables to a bank (or financial company). The receivables are sold without recourse, and the bank cannot recover from the seller in the event that the accounts are uncollectible. For factoring loans, the seller receives funds from the bank prior to the average maturity date based on the invoice amount of the receivable, less cash discounts and allowances for estimated claims and returns, among other items.
•Confirming: Confirming is an arrangement under which the financial institution facilitates the payment of suppliers’ invoices on behalf of a corporate client. The institution verifies the invoices and undertakes to pay them at the agreed maturity date or in advance, in accordance with the contractual terms, subsequently recovering the funds from the client.
•Advances and overdrafts in current account: Extensions of credit to clients by way of an overdraft facility in the client’s checking account. This category also includes secured short-term advances.
•Refinanced loans: Loans that were refinanced because the client was unable to pay at maturity. A loan is categorized as a refinanced loan when the debtor is experiencing payment problems and asks for a new payment schedule that will allow the debtor to comply with the installments. This policy is based on internal models and past experience as well as IFRS.
•Internal overdue loans: Includes overdue loans and under legal collection loans. See “ITEM 4. INFORMATION ON THE COMPANY – 4.B Business Overview – (7) Selected statistical information – 7.3 Loan Portfolio – 7.3.9 Internal overdue Loan Portfolio” for further detail.
7.3.2Loans by economic activity
The following table shows our total loan portfolio composition, net of unearned interest, based on the borrower’s principal economic activity:
| | | | | | | | | | | | | | | | | | | | | | | | | | | | | | | | | | | | | | |
| | As of December 31, |
| | 2023 | | 2024 | | 2025 |
| | (in thousands of Soles, except percentages) |
| | Amount | | % Total | | Amount | | % Total | | Amount | | % Total |
| Economic Activity | | | | | | | | | | | | |
| Mortgage Loans | | 22,519,807 | | | 15.53 | | | 25,092,057 | | | 17.22 | | | 26,187,586 | | | 17.46 | |
| Commerce | | 27,459,996 | | | 18.94 | | | 27,963,542 | | | 19.19 | | | 30,740,730 | | | 20.50 | |
| Manufacturing | | 22,473,754 | | | 15.50 | | | 21,698,829 | | | 14.89 | | | 20,590,394 | | | 13.73 | |
| Consumer Loans | | 17,797,051 | | | 12.28 | | | 19,527,440 | | | 13.40 | | | 22,266,769 | | | 14.85 | |
| Realty Business and Leasing Services | | 10,366,792 | | | 7.15 | | | 5,022,023 | | | 3.45 | | | 3,625,796 | | | 2.42 | |
| Communication, Storage and Transportation | | 6,689,075 | | | 4.61 | | | 10,025,110 | | | 6.88 | | | 10,822,070 | | | 7.22 | |
| Agriculture | | 5,173,903 | | | 3.57 | | | 4,714,818 | | | 3.24 | | | 4,665,889 | | | 3.11 | |
| Construction | | 3,719,611 | | | 2.57 | | | 3,112,587 | | | 2.14 | | | 2,658,586 | | | 1.77 | |
| Electricity, Gas and Water | | 4,935,557 | | | 3.40 | | | 5,793,985 | | | 3.98 | | | 5,599,755 | | | 3.73 | |
| Mining | | 4,076,503 | | | 2.81 | | | 3,709,582 | | | 2.55 | | | 4,820,923 | | | 3.21 | |
| Hotels and restaurants | | 2,866,999 | | | 1.98 | | | 2,868,637 | | | 1.97 | | | 2,471,134 | | | 1.65 | |
| Financial Services | | 4,393,267 | | | 3.03 | | | 4,685,749 | | | 3.22 | | | 4,420,419 | | | 2.95 | |
| Education, Health and Other Services | | 1,742,035 | | | 1.20 | | | 1,816,783 | | | 1.25 | | | 1,409,884 | | | 0.94 | |
| Fishing | | 607,047 | | | 0.42 | | | 674,928 | | | 0.46 | | | 835,160 | | | 0.56 | |
| Others | | 8,661,857 | | | 5.98 | | | 7,613,175 | | | 5.22 | | | 7,514,003 | | | 5.00 | |
| Sub total | | 143,483,254 | | | 98.97 | | | 144,319,245 | | | 99.03 | | | 148,629,098 | | | 99.10 | |
| Accrued interest | | 1,492,797 | | | 1.03 | | | 1,413,028 | | | 0.97 | | | 1,355,856 | | | 0.90 | |
| Total | | 144,976,051 | | | 100.00 | | | 145,732,273 | | | 100.00 | | | 149,984,954 | | | 100.00 | |
As of December 31, 2025, 92.11% and 5.04% of the loan portfolio was concentrated in Peru and Bolivia, respectively, which represent, separately, more than 51.67% and 2.82% of total assets of the Group, respectively. As of December 31, 2024, 90.55% and 6.82% of the loan portfolio was concentrated in Peru and Bolivia, respectively. As of December 31, 2023, 93.05% and 6.49% of the loan portfolio was concentrated in Peru and Bolivia, respectively.
7.3.3Concentrations of loan portfolio and lending limits
As of December 31, 2025, loans and other off-balance-sheet exposure to our 20 largest customers (considered as economic groups) totaled S/24,015.9 million and represented 16.16% of our total loan portfolio. See “ITEM 4. INFORMATION ON THE COMPANY – 4.B Business Overview (6) Supervision and Regulation – 6.2 Subsidiaries – 6.2.1 Peru” for the definition of “economic group”. Total loans and other off-balance-sheet exposure per economic group ranged from S/637.3 million to S/2,088.0 million, including 10 groups with exposures above S/1,104.0 million. Our 20 largest customers (considered as economic groups) comprise an aggregate of 186 individual customers. Risk classification is determined at the individual customer level. As of December 31, 2025, total loans and other off‑balance‑sheet exposure outstanding to these customers were distributed as follows: Class A (normal)—98.40%; Class B (potential problems)—0.8%; Class C (substandard)—0.8%; Class D (doubtful)—0.00%; and Class E (loss)—0.00%.. For further information, see “– 7.3 Loan Portfolio – 7.3.7 Classification of the Loan Portfolio”.
BCP Stand-alone’s loans to a single borrower are subject to lending limits imposed by Law No. 26702. See “ITEM 4. INFORMATION ON THE COMPANY – 4.B Business Overview – (6) Supervision and Regulation – 6.2 Subsidiaries – 6.2.1 Peru”. The lending limits depend on the nature of the borrower involved and the type of collateral received. The sum of BCP Stand-alone’s loans and deposits in either another Peruvian universal bank or Peruvian financial institution, plus
any guarantees of third-party performance received by BCP Stand-alone from such institution, may not exceed 30% of BCP Stand-alone’s regulatory capital (as defined by the SBS). The sum of BCP Stand-alone’s loans and deposits in non-Peruvian financial institutions, plus any guarantees of third-party performance received by BCP Stand-alone from such institutions, are limited to 5%, 10% or 30% of BCP Stand-alone’s regulatory capital, depending upon the level of government supervision of the institution and whether the institution is recognized by the BCRP as an international bank of prime credit quality. The limits on lending to non-Peruvian financial institutions increase to 50% of BCP Stand-alone’s regulatory capital if the amount by which such loans exceed the 5%, 10% or 30% limits is backed by certain letters of credit.
BCP Stand-alone’s loans to Directors and employees and their relatives have an aggregate limit of 7% of regulatory capital and an individual limit of 5% of such global limit.
Loans to non-Peruvian individuals or companies that are not financial institutions have a limit of 5% of BCP Stand-alone’s regulatory capital. However, this limit increases to 10% if the additional 5% is guaranteed by a mortgage or certain publicly traded securities. The limit rises to 30% if the additional amount is guaranteed by certain banks or by cash deposits in BCP Stand-alone. Lending on an unsecured basis to individuals or companies residing in Peru that are not financial institutions is limited to 10% of BCP Stand-alone’s regulatory capital. This limit rises to 15% if the additional 5% is guaranteed by a mortgage, certain securities, equipment or other collateral, and to 20% if the additional amount is either backed by certain debt instruments guaranteed by other local banks or a foreign bank determined by the BCRP to be of prime credit quality, or by other highly liquid securities at market value. The single-borrower lending limit for loans backed by a cash deposit at BCP Stand-alone or by debt obligations of the BCRP is 30% of BCP Stand-alone’s regulatory capital.
Considering the regulatory capital of BCP Stand-alone, which amounted to S/32,651.4 million on December 31, 2025, BCP Stand-alone’s legal lending limits varied from S/3,265.1 million to S/16,325.7 million. The Group’s consolidated lending limits, based on our regulatory capital on a consolidated basis of S/43,813.3 million on December 31, 2025, ranged from S/4,381.3 million to S/21,906.6 million. As of December 31, 2025, BCP Stand-alone was in compliance with the lending limits of Law No. 26702.
As of December 31, 2025, we complied with the applicable legal lending limits in each of the jurisdictions in which we operate. These limits are calculated quarterly based upon our consolidated equity plus reserves for impaired loans not specifically identified at quarter-end. We have also set internal lending limits, which are more restrictive than those imposed by law. A limited number of exceptions to our internal limits have been authorized by our Board of Directors based on the credit quality of the borrower, the term of the loan, and the amount and quality of collateral provided. We may, in appropriate and limited circumstances, increase or choose to exceed these internal limits as long as our credit exposure does not exceed the legal lending limits.
We may experience an adverse impact on our financial condition and results of operations if (i) customers to which we have significant credit exposure are not able to satisfy their obligations to us, and any related collateral is not sufficient to cover these obligations, or (ii) a reclassification of one or more of these loans or other off-balance sheet exposure results in an increase in provisions for loan losses.
7.3.4Loan portfolio denomination
The following table presents our Sol and foreign currency-denominated loan portfolio at the dates indicated:
| | | | | | | | | | | | | | | | | | | | | | | | | | | | | | | | | | | | | | |
| | As of December 31, |
| | 2023 | | 2024 | | 2025 |
| | (in thousands of Soles, except percentages) |
| Total loan portfolio: | | | | | | | | | | | | |
| Sol-denominated | | 93,045,426 | | | 64.18 | % | | 93,155,047 | | | 63.92 | % | | 98,232,430 | | | 65.49 | % |
| Foreign currency-denominated | | 51,930,625 | | | 35.82 | % | | 52,577,226 | | | 36.08 | % | | 51,752,524 | | | 34.51 | % |
| Total loans (1) | | 144,976,051 | | | 100.00 | % | | 145,732,273 | | | 100.00 | % | | 149,984,954 | | | 100.00 | % |
(1)Includes accrued interest.
7.3.5Maturity composition of the performing loan portfolio
The following table sets forth an analysis of our performing loan portfolio on December 31, 2025, by type and by time remaining to maturity. Loans are stated before deduction of the allowance for loan losses.
| | | | | | | | | | | | | | | | | | | | | | | | | | | | | | | | |
| | Maturing |
| | Amount at
December 31, 2025 | | Within 12
months | | After 1 year
but within 5
years | | After 5 years
but within 15
years | | After 15 years |
| | (in thousands of Soles, except percentages) |
| Loans | | 122,308,754 | | | 56,112,565 | | | 41,185,485 | | | 23,631,940 | | | 1,378,764 | |
| Credit Cards | | 6,716,700 | | | 4,668,666 | | | 2,012,952 | | | 35,082 | | | - | |
| Leasing receivables | | 5,019,366 | | | 4,059,778 | | | 959,588 | | | - | | | - | |
| Discounted notes | | 4,098,691 | | | 4,098,691 | | | - | | | - | | | - | |
| Factoring receivables and confirming | | 3,598,101 | | | 3,592,899 | | | 5,202 | | | - | | | - | |
| Refinanced loans | | 2,009,723 | | | 443,185 | | | 1,047,757 | | | 425,614 | | | 93,167 | |
| Advances and overdrafts in current account | | 56,637 | | | 56,637 | | | - | | | - | | | - | |
| Total performing loans | | 143,807,972 | | | 73,032,421 | | | 45,210,984 | | | 24,092,636 | | | 1,471,931 | |
| Internal overdue loans | | 4,821,126 | | | - | | | - | | | - | | | - | |
| Accrued interest | | 1,355,856 | | | - | | | - | | | - | | | - | |
| Total Loans | | 149,984,954 | | | - | | | - | | | - | | | - | |
| % of total performing loan portfolio | | 100.00 | % | | 50.80 | % | | 31.40 | % | | 16.80 | % | | 1.00 | % |
7.3.6Loan portfolio by interest rate type
The following table sets forth the breakdown of our loan portfolio as of December 31, 2025 by interest rate type, currency, and remaining maturity:
| | | | | | | | | | | | | | |
| | Amount at | | Maturing |
| | December 31, 2025 | | After 1 year |
| | (in thousands of Soles) |
| Variable Rate | | | | |
| Sol-denominated | | 29,758 | | | 22,856 | |
| Loans | | 29,412 | | | 22,545 | |
| Refinanced loans | | 346 | | | 311 | |
| Foreign Currency-denominated | | 5,951,820 | | | 4,784,776 | |
| Loans | | 5,698,097 | | | 4,704,220 | |
| Refinanced loans | | 176,739 | | | 3,571 | |
| Internal overdue loans and under legal collection loans | | 76,984 | | | 76,985 | |
| Total | | 5,981,578 | | | 4,807,632 | |
| Fixed Rate | | | | |
| Sol-denominated | | 102,037,368 | | | 54,955,346 | |
| Loans | | 85,887,704 | | | 49,259,493 | |
| Leasing receivables | | 1,703,827 | | | 804,008 | |
| Credit cards | | 5,201,755 | | | 678,587 | |
| Discounted notes | | 1,999,980 | | | - | |
| Factoring receivables | | 1,786,735 | | | - | |
| Advances and overdrafts in current account | | 50,506 | | | - | |
| Refinanced loans | | 1,517,514 | | | 1,224,478 | |
| Internal overdue loans and under legal collection loans | | 3,889,347 | | | 2,988,780 | |
| Foreign Currency-denominated | | 40,610,152 | | | 11,012,573 | |
| Loans | | 30,693,541 | | | 8,445,388 | |
| Leasing receivables | | 3,315,539 | | | 1,246,612 | |
| Credit cards | | 1,514,945 | | | 281,001 | |
| Discounted notes | | 2,098,711 | | | 5,967 | |
| Factoring receivables | | 1,811,366 | | | - | |
| Advances and overdrafts in current account | | 6,131 | | | - | |
| Refinanced loans | | 315,124 | | | 323,839 | |
| Internal overdue loans and under legal collection loans | | 854,795 | | | 709,766 | |
| Total | | 142,647,520 | | | 65,967,919 | |
| Sub total | | 148,629,098 | | | 70,775,551 | |
| Accrued interest | | 1,355,856 | | | |
| Total loans | | 149,984,954 | | | |
7.3.7Classification of the loan portfolio
We classify Credicorp’s loan portfolio in accordance with internal practices. According to these criteria, all loans and other credits are classified into one of four categories based upon the purpose of the loan. These categories are:
(1)Commercial loans, which generally finance the production and sale of goods and services, including commercial leases, as well as credit card debt on cards held by business entities.
(2)Microbusiness loans, which are exclusively targeted for the production and sale of goods and services, are made to individuals or companies with no more than S/300,000 in total loans received from the financial system (excluding mortgage loans).
(3)Consumer loans, which are generally granted to individuals, including credit card transactions, overdrafts on personal demand deposit accounts, leases, and financing goods or services that are not related to a business activity.
(4)Residential mortgage loans, which are all the loans granted to individuals for the purchase, construction, remodeling, subdivision or improvement of the individual’s home, in each case backed by a mortgage. Mortgage loans made to directors and employees of a company are also considered residential mortgage loans. Mortgage-backed loans are generally considered commercial loans.
The following table sets forth our direct loan portfolio by class at the dates indicated:
| | | | | | | | | | | | | | | | | | | | |
| | As of December 31, |
| | 2023 | | 2024 | | 2025 |
| | (In thousands of Soles) |
| Commercial loans | | 76,820,402 | | | 76,921,615 | | | 76,144,846 | |
| Residential mortgage loans | | 24,176,918 | | | 25,092,057 | | | 26,187,586 | |
| Small business loans | | 22,425,750 | | | 22,778,133 | | | 24,029,897 | |
| Consumer loans | | 20,060,184 | | | 19,527,440 | | | 22,266,769 | |
| Total | | 143,483,254 | | | 144,319,245 | | | 148,629,098 | |
| Accrued interest | | 1,492,797 | | | 1,413,028 | | | 1,355,856 | |
| Total loans | | 144,976,051 | | | 145,732,273 | | | 149,984,954 | |
We employ a range of policies and practices to mitigate credit risk. Our usual practice is to take security for fund advances. We implement guidelines on the acceptability of specific classes of collateral or credit risk mitigation. The principal collateral types for loans and advances are mortgages over residential properties, liens over business assets (such as premises, inventory and accounts receivable), and liens over financial instruments (such as debt securities and equities).
Long-term financing and lending to corporate entities are generally secured, while revolving individual credit facilities are generally unsecured. In order to minimize credit loss, we seek additional collateral as soon as impairment indicators become apparent.
We determine the appropriate collateral to hold as security for financial assets (other than loans) according to the nature of the instrument. Debt securities, treasury and other eligible bills are generally unsecured, except for asset-backed securities and other similar instruments, which are secured by portfolios of financial instruments.
Our management monitors the market value of collateral, requests additional collateral in accordance with the underlying agreement, and monitors the market value of the additional collateral obtained during its review of the allowance for impairment losses. Our policy is to dispose of repossessed properties in an orderly manner. We use the proceeds to reduce or repay the outstanding claim. In general, we do not use repossessed properties for our own business.
We review our loan portfolio on a continuing basis, and we classify our loans based upon credit risk by assessing the following factors: (i) the payment history of the particular loans; (ii) the history of our dealings with the borrower, (iii) the borrower’s management; (iv) the borrower’s operating history; (v) the borrower’s repayment capability; (vi) the borrower’s availability of funds; (vii) the status of collateral or guarantees; (viii) the borrower’s financial statements; (ix) the general risk of the sector in which the borrower operates; (x) the borrower’s risk classification made by other financial institutions and (xi) other relevant factors.
In accordance with IFRS 7, we classify our loan portfolio, according to its credit risk quality, in one of the following three levels:
•Loans neither past due nor impaired: this level comprises those direct loans which are zero days past due and which are not in default.
•Past due but not impaired loans: this level comprises those direct loans for which debtors have failed to make a payment on the contractually agreed due date but are not in default.
•Impaired loans: this level comprises all the direct loans in default.
We continually review our loan portfolio to assess the completeness and accuracy of our loan classifications.
We assess financial guarantees and letters of credit in the same way we assess loans.
When a borrower is in a country where there is an increased risk of difficulty servicing external debt, we assess the political and economic conditions in that country and factor additional country risk into our assessment.
When we determine that a loan is uncollectible, it is written off against the provision for loan impairment. We write off these loans after all necessary procedures have been completed and the amount of the loss is determined. Subsequent recoveries of amounts previously written off decrease the amount of the provision for loan impairment in our consolidated income statements.
The following tables show our direct loan portfolio without accrued interest at the dates indicated:
| | | | | | | | | | | | | | | | | | | | | | | | | | | | | | | | |
| | As of December 31, 2025 |
| | (in thousands of Soles, except percentages) |
| Level of Risk | | Stage 1 | | Stage 2 | | Stage 3 | | Total | | |
| Classification | | Amount | | Amount | | Amount | | Amount | | % Total |
| Neither past due nor impaired | | 123,867,161 | | | 12,808,686 | | | - | | | 136,675,847 | | | 92.0 | |
| Past due but not impaired | | 1,337,791 | | | 1,733,346 | | | - | | | 3,071,137 | | | 2.1 | |
| Impaired debt | | - | | | - | | | 8,882,114 | | | 8,882,114 | | | 6.0 | |
| Total (1) | | 125,204,952 | | | 14,542,032 | | | 8,882,114 | | | 148,629,098 | | | 100.0 | |
| | | | | | | | | | | | | | | | | | | | | | | | | | | | | | | | |
| | As of December 31, 2024 |
| | (in thousands of Soles, except percentages) |
| Level of Risk | | Stage 1 | | Stage 2 | | Stage 3 | | Total | | |
| Classification | | Amount | | Amount | | Amount | | Amount | | % Total |
| Neither past due nor impaired | | 116,533,046 | | | 14,334,623 | | | - | | | 130,867,669 | | | 90.7 | |
| Past due but not impaired | | 1,535,821 | | | 2,097,725 | | | - | | | 3,633,546 | | | 2.5 | |
| Impaired debt | | - | | | - | | | 9,818,030 | | | 9,818,030 | | | 6.8 | |
| Total (1) | | 118,068,867 | | | 16,432,348 | | | 9,818,030 | | | 144,319,245 | | | 100.0 | |
| | | | | | | | | | | | | | | | | | | | | | | | | | | | | | | | |
| | |
| | As of December 31, 2023 |
| | (in thousands of Soles, except percentages) |
| Level of Risk | | Stage 1 | | Stage 2 | | Stage 3 | | Total | | |
| Classification | | Amount | | Amount | | Amount | | Amount | | % Total |
| Neither past due nor impaired | | 114,266,020 | | | 13,720,340 | | | - | | | 127,986,360 | | | 89.2 | |
| Past due but not impaired | | 2,023,488 | | | 2,555,260 | | | - | | | 4,578,748 | | | 3.2 | |
| Impaired debt | | - | | | - | | | 10,918,146 | | | 10,918,146 | | | 7.6 | |
| Total (1) | | 116,289,508 | | | 16,275,600 | | | 10,918,146 | | | 143,483,254 | | | 100.0 | |
7.3.8Classification of the loan portfolio based on the borrower’s payment performance
We classify a loan as internal overdue according to three criteria: (i) the number of days past-due based on the contractually agreed due date; (ii) the banking subsidiary; and (iii) the type of loan. In that sense:
•BCP Stand-alone, SEAH and Mibanco consider loans as internal overdue: (i) after 15 days for corporate, large business and medium business loans; (ii) after 30 days for small and micro business loans and (iii) after 30 days for overdrafts. In the case of consumer, mortgage and leasing loans, the past-due installments are considered overdue after 30 to 90 days; after 90 days, the outstanding balance of the loan is considered overdue.
•Mibanco Colombia considers loans as internal overdue: (i) after 90 days for commercial loans; (ii) after 60 days for micro business loans; (iii) after 60 days for consumer loans and (iv) after 30 days for mortgage loans.
•ASB considers loans as internal overdue when they are 1 or more days past due.
•BCP Bolivia considers loans as internal overdue when they have 30 or more days past due.
Furthermore, with regards to refinanced loans, Credicorp’s policy categorizes a loan as “refinanced” when a debtor is experiencing payment problems and asks for a new payment schedule that will allow the debtor to comply with the installments. This policy is based on internal models and experience, which are consistent with IFRS.
Finally, non-performing loans are composed of internal overdue (overdue loans and under legal collection loans), refinanced, and restructured loans. For further detail on non-performing loans, see Note 30.1(c) to the consolidated financial statements.
| | | | | | | | | | | | | | | | | | | | |
| | As of December 31, |
| | 2023 | | 2024 | | 2025 |
| | (in thousands of Soles, except percentages) |
| Current | | 137,350,087 | | 138,889,113 | | 143,807,972 |
| Internal overdue loans: | | | | | | |
| Overdue up to 90 days | | 1,459,603 | | 1,046,337 | | 747,943 |
| Overdue 90 days or more | | 4,673,564 | | 4,383,795 | | 4,073,183 |
| Subtotal internal overdue | | 6,133,167 | | 5,430,132 | | 4,821,126 |
| Total | | 143,483,254 | | 144,319,245 | | 148,629,098 |
| Accrued interest | | 1,492,797 | | 1,413,028 | | 1,355,856 |
| Total direct loans | | 144,976,051 | | 145,732,273 | | 149,984,954 |
| Internal overdue loans amount as % of total loans (1) | | 4.3 | % | | 3.8 | % | | 3.2 | % |
(1)Includes overdue loans (overdue loans and under legal collection loans) without accrued interest.
For IFRS 7 disclosure requirements on past-due loans, see Note 30.1 to the consolidated financial statements.
7.3.9Internal overdue loan portfolio
The following table analyzes our internal overdue loans portfolio by the type of loan at the dates indicated:
| | | | | | | | | | | | | | | | | |
| As of December 31, |
| 2023 | | 2024 | | 2025 |
| (in thousands of Soles) |
| Internal overdue loan amounts: | | | | | |
| Loans | 5,036,429 | | | 4,639,405 | | | 4,214,180 | |
| Discounted notes | 33,925 | | | 32,167 | | | 32,890 | |
| Advances and overdrafts in demand deposits | 166,803 | | | 152,566 | | | 129,371 | |
| Leasing transactions | 143,003 | | | 128,896 | | | 63,243 | |
| Refinanced loans | 753,007 | | | 477,098 | | | 381,442 | |
| Total internal overdue loans | 6,133,167 | | | 5,430,132 | | | 4,821,126 | |
7.3.10Total Non-performing loans
Total non-performing loans include internal overdue loans and under legal collection loans (S/4,821.1 million as of December 31, 2025), as well as current refinanced loans (S/2,009.7 million as of December 31, 2025). Therefore, non-performing loans amounted to S/6,830.8 million. As of December 31, 2025, our delinquency ratio (internal overdue-loan ratio) was 3.21% and our non-performing loan ratio (including internal overdue and refinanced loans) was 4.55%. As of December 31, 2024, our delinquency ratio was 3.73% and our non-performing loan ratio was 5.26%. As of December 31, 2023, our delinquency ratio was 4.23% and our non-performing loan ratio was 5.89%. See “ITEM 5. OPERATING AND FINANCIAL REVIEW AND PROSPECTS – 5.A Operating Results – (5) Financial Position – 5.1 Total Assets – Portfolio quality”. For the ratio of non-performing loans to total loans and the ratio of allowance for loan losses to non-performing loans (which we refer to as coverage of non-performing loans) as of December 31, 2023, 2024 and 2025, see “ITEM 5. OPERATING AND FINANCIAL REVIEW AND PROSPECTS – 5.A Operating Results – (4) Historical Discussion and Analysis – 4.2 Financial performance.
7.3.11Allowance for loan losses
The following table shows the changes in our allowance for loan losses during the years 2023, 2024 and 2025 under IFRS 9 methodology:
| | | | | | | | | | | | | | | | | |
| Year ended December 31, |
| 2023 | | 2024 | | 2025 |
| (In thousands of Soles) |
| Allowance for loan losses at the beginning of the year | 8,530,986 | | | 8,645,945 | | | 8,378,895 | |
| Credit loss of the period: | | | | | |
| New loans and liquidation, net | (817,292) | | | (537,802) | | | (481,749) | |
| Changes in PD, LGDs, EADs | 4,774,435 | | | 4,481,103 | | | 3,355,203 | |
| Write-offs and forgiven | (3,461,262) | | | (4,070,559) | | | (2,925,480) | |
| Sale of loan portfolio | (343,646) | | | (122,418) | | | (2,637) | |
| Exchange difference and others (1) | (37,276) | | | (17,374) | | | (282,706) | |
| Total allowance for loan losses at the end of the year | 8,645,945 | | | 8,378,895 | | | 8,041,526 | |
(1)Corresponds to the effect of fluctuation in the exchange rate for foreign currency loans. Considering that the functional currency is the Peruvian Sol, and that the main impact of foreign currency is the US Dollar; the effects presented in this account are primarily driven by changes in the Sol/US Dollar exchange rate.
For a discussion of the risk elements in the loan portfolio and the factors considered in determining the amount of specific reserves, see “ITEM 4. INFORMATION ON THE COMPANY – 4.B Business Overview – 7.3.7 Classification of the Loan Portfolio” and “– 7.3.8 Classification of the loan portfolio based on the borrower’s payment performance”. The
balance of the allowance for loan losses as of December 31, 2023, 2024 and 2025 are included in Note 7(c) to the consolidated financial statements.
As of December 31, 2025, the allowance for loan losses was S/8,041.5 million which meant a decrease of 4.03% compared to S/8,378.9 million in 2024. The allowance for loan losses, as of December 31, 2025, included S/7,670.0 million for direct loans losses and S/371.6 million for indirect loan losses or off-balance-sheet exposure losses as compared to S/7,994.9 million and S/383.9 million, respectively, in 2024. The allowance for indirect loans is included in the “Other liabilities” caption of or consolidated statement of financial position. See Notes 7(c) and 12(a) to the consolidated financial statements.
The write-off process is performed with prior approval of our board of Directors. Potential write-offs are considered by the board of Directors on a case-by-case basis. Provision for credit losses on loan portfolio, net of recoveries, decreased to S/2,406.3 million in 2025 from S/3,519.4 million in 2024.
7.3.12Allocation of allowance for loan losses
The following table sets forth the amounts of our allowance for loan losses attributable to commercial, microbusiness, consumer, and residential mortgage loans at the dates indicated (see also Note 7(c) to the consolidated financial statements):
| | | | | | | | | | | | | | | | | | | | |
| | As of December 31, |
| | 2023 | | 2024 | | 2025 |
| Allowance for loan losses for: | | (in thousands of Soles) |
| Commercial loans | | 3,583,222 | | | 3,328,009 | | | 3,130,621 | |
| Microbusiness | | 2,067,488 | | | 1,948,281 | | | 1,834,613 | |
| Consumer loans | | 2,034,614 | | | 2,048,478 | | | 2,109,709 | |
| Residential mortgage loans | | 960,621 | | | 1,054,127 | | | 966,583 | |
| Total | | 8,645,945 | | | 8,378,895 | | | 8,041,526 | |
Credicorp's total allowance for loan losses decreased by 4.03% from December 31, 2024 to December 31, 2025. This was mainly driven by (i) better payment performance that reflects strengthened portfolio management policies and healthy growth; (ii) the write-off of uncollectible loans; (iii) the decrease of the exchange rate PEN/U.S. Dollar; and (iv) specifically in BCP Bolivia, a non-cash accounting adjustment that involved updating the exchange rate used to translate BCP Bolivia's balance sheet to more accurately reflect prevailing market conditions.
7.3.13Credit Ratios
The following table sets forth our ratio of allowance for loan losses to total loans outstanding and, for both total loans and each type of loan, net write-offs to average loans outstanding, as well as the components of these ratios, at and for the years ended December 31, 2023, 2024 and 2025.
| | | | | | | | | | | | | | | | | | | | |
| | Year ended December 31, |
| | 2023 | | 2024 | | 2025 |
| | (in thousands of Soles, except percentages) |
| Allowance for loan losses to total loans outstanding | | 6.29 | % | | 6.03 | % | | 5.59 | % |
| Allowance for loan losses | | (8,645,945) | | | (8,378,895) | | | (8,041,526) | |
| Total loans outstanding | | 137,350,087 | | | 138,889,113 | | | 143,807,972 | |
| Total net write-offs during the period to average loans outstanding | | 2.4 | % | | 2.9 | % | | 2.0 | % |
| Total net charge-offs during the period | | (3,324,667) | | | (3,887,584) | | | (2,787,188) | |
| Average loans outstanding | | 137,241,513 | | | 136,355,524 | | | 138,053,898 | |
| Net write-offs during the period to average loans outstanding | | | | |
| Loans: | | | | | | |
| Average amount outstanding | | 135,064,506 | | | 133,900,521 | | | 136,021,044 | |
| Net charge-offs during the period | | (2,387,523) | | | (2,908,945) | | | (1,835,467) | |
| Ratio of net charge-off/average amount outstanding | | 1.8 | % | | 2.2 | % | | 1.3 | % |
| Credit cards: | | | | | | |
| Average amount outstanding | | 6,426,866 | | | 6,260,473 | | | 6,360,746 | |
| Net charge-offs during the period | | (548,932) | | | (547,121) | | | (542,546) | |
| Ratio of net charge-off/average amount outstanding | | 8.5 | % | | 8.7 | % | | 8.5 | % |
| Leasing receivables: | | | | | | |
| Average amount outstanding | | 5,896,141 | | | 5,511,085 | | | 5,053,224 | |
| Net charge-offs during the period | | - | | | - | | | - | |
| Ratio of net charge-off/average amount outstanding | | 0.0 | % | | 0.0 | % | | 0.0 | % |
| Discounted notes: | | | | | | |
| Average amount outstanding | | 2,660,493 | | | 2,927,143 | | | 3,522,968 | |
| Net charge-offs during the period | | - | | | - | | | - | |
| Ratio of net charge-off/average amount outstanding | | 0.0 | % | | 0.0 | % | | 0.0 | % |
| Factoring receivables and confirming | | | | | | |
| Average amount outstanding | | 3,184,821 | | | 2,915,033 | | | 3,026,247 | |
| Net charge-offs during the period | | - | | | - | | | - | |
| Ratio of net charge-off/average amount outstanding | | 0.0 | % | | 0.0 | % | | 0.0 | % |
| Advances and overdrafts in current account: | | | | | | |
| Average amount outstanding | | 253,353 | | | 237,659 | | | 202,940 | |
| Net charge-offs during the period | | - | | | - | | | - | |
| Ratio of net charge-off/average amount outstanding | | 0.0 | % | | 0.0 | % | | 0.0 | % |
| Refinanced loans: | | | | | | |
| Average amount outstanding | | 2,177,007 | | | 2,455,003 | | | 2,032,854 | |
| Net charge-offs during the period | | (388,212) | | | (431,518) | | | (409,175) | |
| Ratio of net charge-off/average amount outstanding | | 17.8 | % | | 17.6 | % | | 20.1 | % |
The ratio of allowance for loan losses to total loans outstanding decreased from 6.03% in 2024 to 5.59% in 2025. This reduction was mainly driven by two factors: (i) lower expected credit loss provisions under IFRS 9 resulting from changes in estimates related to the El Niño phenomenon, which did not materialize, and (ii) a better payment performance in SMEs and Individuals mainly during the second semester of the year due to an increase in household's liquidity due to pension funds withdrawal, and as we reached a turning point particularly in the segments that have been the most impacted in the recent credit cycle.
For more information about Credicorp’s Portfolio quality, please see “5.A Operating results – (5) Financial Position – 5.1 Total Assets”.
7.4 Deposits
The following table presents the components of our deposit base at the dates indicated:
| | | | | | | | | | | | | | | | | | | | |
| | As of December 31, |
| | 2023 | | 2024 | | 2025 |
| | (in thousands of Soles) |
| Demand deposits: | | | | | | |
| Sol-denominated | | 22,398,875 | | | 25,989,592 | | | 28,563,230 | |
| Foreign currency-denominated | | 25,830,448 | | | 26,601,360 | | | 28,488,740 | |
| Total | | 48,229,323 | | | 52,590,952 | | | 57,051,970 | |
| Savings deposits: | | | | | | |
| Sol-denominated | | 30,280,631 | | | 36,617,684 | | | 43,630,011 | |
| Foreign currency-denominated | | 22,095,182 | | | 23,140,141 | | | 24,181,934 | |
| Total | | 52,375,813 | | | 59,757,825 | | | 67,811,945 | |
| Time deposits: | | | | | | |
| Sol-denominated | | 19,265,835 | | | 20,542,136 | | | 22,527,982 | |
| Foreign currency-denominated | | 22,024,176 | | | 23,574,302 | | | 17,834,451 | |
| Total | | 41,290,011 | | | 44,116,438 | | | 40,362,433 | |
| Severance indemnity deposits | | | | | | |
| Sol-denominated | | 2,295,879 | | | 2,229,080 | | | 2,497,307 | |
| Foreign currency-denominated | | 889,724 | | | 766,940 | | | 695,257 | |
| Total | | 3,185,603 | | | 2,996,020 | | | 3,192,564 | |
| Bank certificates | | | | | | |
| Sol-denominated | | 504,020 | | | 453,199 | | | 435,196 | |
| Foreign currency-denominated | | 690,633 | | | 648,148 | | | 546,626 | |
| Total | | 1,194,653 | | | 1,101,347 | | | 981,822 | |
| Total deposits: | | | | | | |
| Sol-denominated | | 74,745,240 | | | 85,831,691 | | | 97,653,725 | |
| Foreign currency-denominated | | 71,530,163 | | | 74,730,891 | | | 71,747,009 | |
| Total deposits and obligations without interest payable | | 146,275,403 | | | 160,562,582 | | | 169,400,734 | |
Our total deposits and obligations without interest payable increased 5.5% from December 31, 2024, to December 31, 2025, which is attributable to an increase in the level of saving and demand deposits, mainly at BCP Stand-alone.
The following table presents the non-interest-bearing demand deposits and the interest-bearing demand deposits at the dates indicated:
| | | | | | | | | | | | | | | | | | | | |
| | As of December 31, |
| | 2023 | | 2024 | | 2025 |
| | (in thousands of Soles) |
| Sol-denominated: | | | | | | |
| Non-interest-bearing demand deposits | | 19,825,177 | | | 22,326,582 | | | 26,514,958 | |
| Interest-bearing demand deposits | | 2,573,698 | | | 3,663,010 | | | 2,048,272 | |
| Total | | 22,398,875 | | | 25,989,592 | | | 28,563,230 | |
| Foreign currency-denominated: | | | | | | |
| Non-interest-bearing demand deposits | | 22,409,322 | | | 24,833,609 | | | 25,702,328 | |
| Interest-bearing demand deposits | | 3,421,126 | | | 1,767,751 | | | 2,786,412 | |
| Total | | 25,830,448 | | | 26,601,360 | | | 28,488,740 | |
Deposits are generally insured to mitigate depositor losses in the event of financial institution bankruptcy. The insured value of any deposit will vary depending on the country where the bank is located. As of December 31, 2025, deposits in Peru are insured by the Deposit Insurance Fund up to a maximum of S/116,700 (US$34,701) per depositor; in Colombia they are insured by the “Financial Institutions Guarantee Fund” (Fogafín) up to a maximum of S/44,550 (US$13,247) per depositor; in Bolivia they are insured by the Saver Protection Fund (FPAH) up to a maximum of S/62,164 (US$18,484) per depositor; in Panama deposits are not insured. In Peru, the insurance coverage supports nominal deposits, under any modality, of natural and private non-profit legal persons, as well as demand deposits of other legal persons. These amounts include all insured deposits that a depositor has in the same financial institution. As of December 31, 2023, 2024 and 2025 the total insured deposits of the Group, which were estimated with the methodologies and assumptions used for regulatory requirements, totaled S/52,688.7 million, S/60,225.3 million and S/70,307.0 million, in Peru, Colombia, Chile and Bolivia, respectively. As of December 31, 2023, 2024 and 2025, the total uninsured deposits, without considering interest, totaled S/93,586.7 million, S/100,337.3 million and S/99,093.7million, in Peru, Colombia, Panama and Bolivia, respectively.
Below are the Group’s aggregate estimated uninsured time deposits as of December 31, 2023, 2024, and 2025:
| | | | | | | | | | | | | | | | | |
| As of December 31, |
| 2023 | | 2024 | | 2025 |
| (in thousands of Soles) |
| Time deposits: | | | | | |
| Maturing within 60 days | 17,551,941 | | | 20,642,795 | | | 19,769,343 | |
| Maturing after 61 but within 90 days | 3,268,967 | | | 3,584,523 | | | 4,138,144 | |
| Maturing after 91 but within 180 days | 3,924,564 | | | 3,583,118 | | | 3,254,483 | |
| Maturing after 181 but within 360 days | 4,723,712 | | | 4,674,141 | | | 2,914,007 | |
| Maturing after 361 days | 5,517,415 | | | 5,272,499 | | | 4,081,008 | |
| Total time deposits | 34,986,599 | | | 37,757,076 | | | 34,156,985 | |
4.COrganizational structure
(1)Credicorp
The following tables show our organizational structure and the organization of our main subsidiaries as of December 31, 2025, indicating in each case its country of incorporation and ownership interest in the identified entities:
(1)Grupo Crédito holds 100% of Tenpo under its control, which is the Fintech group of companies.
(2)Grupo Crédito holds 33.66% of Pacífico Compañía De Seguros y Reaseguros S.A.
(3)Grupo Crédito holds the other 50.00% of Pacífico S.A. Entidad Prestadora de Salud.
(4)Credicorp Capital Holding Peru S.A. holds 85.35% of Credicorp Capital Peru S.A.A., and Credicorp Capital Ltd holds an additional 12.84% of Credicorp Capital Peru S.A.A.
(5)Grupo Crédito S.A. participates in 14.26% of Credicorp Holding Colombia S.A.S.
(6)Inversiones Credicorp Bolivia S.A. holds 51.95%.
(7)Inversiones Credicorp Bolivia S.A. holds 51.87%.
(8)Grupo Crédito holds 4.99% of Mibanco Banco de la Microempresa S.A.
4.DProperty, furniture, and equipment, net
As of December 31, 2025, we owned 250 properties (238 in Peru, 10 in Bolivia and 2 in Colombia) and leased 738 properties (558 in Peru, 49 in Bolivia, 126 in Colombia, 2 in Chile, 2 in United States and 1 in Panama), which we use for the operation of our branch network and our business. We own the buildings where our headquarters are located in Lima, Peru and La Paz, Bolivia. As of December 31, 2025, we had 651 bank branches, of which 318 were BCP Stand-alone branches, 51 were BCP Bolivia branches and 282 were Mibanco branches in Peru.
There are no significant encumbrances on any of our properties, and both our owned and leased properties have multi-risk property insurance. The respective policies are renewed annually and cover our properties against the risks of fire, natural disasters, and socio-political risks among others.
During the year 2025, the principal property disbursement was related mainly to computer equipment and the remodeling of its various agencies. For more details on the balance of properties, furniture and equipment in progress, see Note 9 to the consolidated financial statements.
ITEM 4A.UNRESOLVED STAFF COMMENTS
None.
ITEM 5.OPERATING AND FINANCIAL REVIEW AND PROSPECTS
5. AOperating results
(1)Management Discussion and Analysis
a)General Economic Conditions
In 2025, the global economy remained resilient despite elevated policy uncertainty, shifting trade policies, and ongoing geopolitical and domestic political tensions. Global economic activity was supported by accommodative financial conditions and the adaptability of the private sector, with growth increasingly driven by investment in technology‑related sectors, including artificial intelligence, particularly in the United States and parts of Asia. Inflation continued to stabilize during the year, supported by easing demand pressures and lower energy prices, although the pace of disinflation varied across countries. In the United States, inflation proved more persistent than in other major economies, reflecting continued pass‑through from higher tariffs and elevated price expectations, while inflation in most other advanced economies moved closer to central bank targets. Emerging economies benefited from a combination of resilient macroeconomic fundamentals, still‑elevated real yields, and a relatively benign global interest‑rate environment. In contrast, China’s economy continued to face structural headwinds, including weak domestic demand and a prolonged adjustment in the real estate sector, partly offset by resilient exports and policy support. Favorable conditions for emerging markets were reflected in strong capital inflows, driven by historically high metal prices, expectations of further Federal Reserve rate cuts, and local currencies appreciation amid global U.S. Dollar depreciation. In Perú, the GDP grew 3.4%, which was driven by an improvement in terms of trade, reflecting higher export prices relative to import prices, along with lower interest rates in both foreign and domestic currency, which supported domestic demand and investment, and the economy’s progression into a mid‑stage of the business cycle.
Inflation measured using the Consumer Price Index of Metropolitan Lima (CPI), closed 2025 at 1.5% YoY, remaining comfortably within the BCRP’s target range of 1% to 3%. The core CPI (excludes energy and food prices) ended the year at 1.8% YoY. Year‑end headline inflation declined to its lowest level in seven years, while core inflation reached its lowest level in five years. During the year, the BCRP reduced its policy rate by 25 basis points across three meetings, a more gradual pace than in previous years, as the policy rate moved closer to its neutral level. Since September 2023, the BCRP has lowered its monetary policy rate by a cumulative 350 basis points, ending 2025 at 4.25%.
b)Credicorp 2025 Financial Performance
In 2025, Credicorp generated S/6,925.4 million of net profit attributable to its equity holders, with net basic earnings of S/87.3 per common share attributable to its equity holders, as compared with S/5,501.3 million of net profit attributable to its equity holders, with net basic earnings of S/69.2 per common share attributable to its equity holders in 2024. This translates to a return on average assets (ROAA) of 2.65% and a return on average equity (ROAE) of 19.05% in 2025, up from 2.22% and 16.47% in 2024, respectively.
As of December 31, 2025, total loans totaled S/149,985.0 million, representing an increase of 2.9% (+8.5% at a Neutral Exchange Rate11) compared to S/145,732.3 million as of December 31, 2024. This growth was mainly driven by higher loan disbursements in Retail Banking —particularly in the Individuals segment— and, secondarily, by an uptick in disbursements of medium and long-term loans in Wholesale Banking at BCP Stand-Alone. Mibanco also contributed to this growth, having recorded double-digit growth in 2025. Total deposits without interest payable were S/169,400.7 million as of December 31, 2025, representing an increase of S/8,838.1 million from S/160,562.6 million as of December 31, 2024. This rise was mainly driven by a 13.5% increase in savings deposits, from S/59,757.8 million as of December 31, 2024, to S/67,811.9 as of December 31, 2025. This expansion was attributable to inflows from pension fund withdrawals and improvements in our transactional offerings.
In 2025, net interest income was S/14,716.5 million, up from S/14,115.1 million in 2024, representing an increase of 4.3%. This evolution was driven mainly by a drop in interest expenses. Such drop was fueled by a decrease in interest on deposits, which fell due to both lower market rates and an increase in low-cost deposits’ share of the funding mix. Interest income remained relatively stable (+0.3%) as loan growth acceleration was partially offset by lower interest rates. In this context, interest on deposits from other banks from securities decreased compared to 2024. Given these dynamics and a decline in market interest rates, both the funding cost (-43 bps) and the yield on interest-earning assets (-36 bps) fell
11 See also Non-GAAP Measures of Financial Performance in Item 5 - 5A - (4) Historical Discussion and Analysis.
compared to 2024. In this context, NIM stood at 6.27% in 2025 (considering the average of the beginning of period and end of period balances), relatively stable (-2 bps) compared to 2024.
The provisions for credit losses on the loan portfolio, net of recoveries, totaled S/2,406.3 million for 2025, representing a decrease of 31.6% compared to S/3,519.4 million for 2024. The drop in provisions was mainly driven by BCP Stand-alone and Mibanco, and was supported by strengthening risk management capabilities amid a sustained improvement in the Peruvian economy. At BCP Stand-alone, the decline was primarily triggered by the Individuals segment, followed by SME-Pyme, as both segments registered an improvement in payment performance and an increase in lower-risk vintages’ share of total loans. At Mibanco, the decline was driven mainly by an improvement in underlying risk as low-risk vintages gained terrain and currently represent 84% of the portfolio. Thus, the cost of risk in 2025 was 1.63% as compared to 2.42% in 2024. Additionally, the contraction registered by the non-performing loan portfolio led to a subsequent increase in the coverage ratio for the non-performing loan portfolio, which was 112.45% in 2025, as compared to 104.3% in 2024. For further information, see “ITEM 4. INFORMATION ON THE COMPANY – 4.B Business Overview – (7) Selected Statistical Information – 7.3 Loan Portfolio – 7.3.10 Total Non-performing loans”.
In 2025, other income totaled S/6,821.3 million, representing a 6.5% increase compared to S/6,404.1 million in 2024. This was mainly attributable to growth in Commissions and fees, which grew 3.6% from S/4,052.1 million in 2024 to S/4,199.7 in 2025, and to Net Gain on Foreign Exchange Transactions, which grew 13.4% from S/1,359.8 million in 2024 to S/1,542.3 in 2025. Commissions and fees increased mainly as a result of higher activity from the banking and transactional businesses, particularly at BCP Stand‑alone. Net Gains on Foreign Exchange Transactions were mainly generated by BCP Stand‑alone, driven by improved pricing execution in the Retail segments and higher volumes from Wholesale clients.
Credicorp’s insurance and reinsurance result was S/1,389.2 million in 2025, representing an increase of S/190.2 million, compared to S/1,199.0 million in 2024. This variation was primarily driven by a higher Insurance Service Income, mainly boosted by the consolidation of Pacifico EPS, after Credicorp, through Grupo Crédito S.A., acquired the 50% interest that Banmédica held in Pacifico EPS, and secondarily by a drop in Reinsurance Result, in Life and P&C businesses. These dynamics were partially offset by an increase in Insurance Service Expenses, reflecting the aforementioned consolidation and, secondarily, in P&C.
Operating Expenses (which include Salaries and employee benefits, administrative expenses, depreciation and amortization, and association in participation) totaled S/10,426.8 million, representing an 8.6% increase compared to S/9,602.0 million in 2024. This was mainly attributable to growth in personnel expenses at BCP Stand-alone. As a result, the efficiency ratio in 2025 increased by 77 bps to stand at 46.6% (as compared to 45.8% in 2024), which was due to a faster growth rate of operating expenses compared to operating income.
c)LoBs Highlights
| | | | | | | | |
Universal Banking ROAE BCP Stand-alone: 24.7% BCP Bolivia: 9.2% | | Microfinance ROAE Mibanco: 16.6% Mibanco Colombia: 10.3% |
•BCP Stand-alone's net interest income was S/11,137.3 million in 2025, up by 3.0% compared to S/10,815.2 million in 2024. •BCP Stand-alone's cost of risk was 1.28% in 2025, down 85 bps from 2.13 in 2024. •BCP Stand-alone's other income was S/5,679.5 million in 2025, up by S/553.3 million, or 10.8%, from 2024. •BCP Stand-alone's efficiency ratio was 39.7% for 2025, up by 40 bps compared to 39.3% in 2024. •BCP Stand-alone's CET1 ratio was 13.99% in 2025, compared to 13.32% in 2024.
| | •Mibanco's net interest income was S/2,477.8 million in 2025, up by 10.6% compared to S/2,240.3 total in 2024. •Mibanco's cost of risk was 5.06% in 2025, down by 64 bps from 5.71% in 2024. •Mibanco's non-interest income in 2025 was S/142.8 million, up by 9.3% from S/130.7 million in 2024. •Mibanco's efficiency ratio was 50.9% for 2025, down by 176 bps compared to 52.7% for 2024. •Mibanco's CET1 ratio was 17.30% in 2025, compared to 17.53% in 2024. |
| | |
Insurance and Pension Funds
ROAE
Grupo Pacífico: 21.4%
Prima AFP: 31.6% | | Investment Management & Advisory ROAE Credicorp Capital: 13.2% Atlantic Security Bank: 19.0% |
•Grupo Pacífico’s income for insurance service was S/4,162.0 million in 2025, up 25.9% from S/3,307.0 million in 2024. •Grupo Pacífico’s expenses for insurance service were S/2,796.0 million in 2025, up 25.6% from S/2,226.7 million in 2024. •Grupo Pacífico's insurance underwriting result was S/881.9 million in 2025, compared to S/699.7 million in 2024. This increase was mainly boosted by the consolidation of Pacifico EPS, after Credicorp, through Grupo Crédito S.A., acquired the 50% interest that Banmédica held in Pacifico EPS, •Prima AFP's income from commission was S/383.3 million in 2025, up 2.9% from S/372.5 million in 2024.
| | •Credicorp Capital's net income was S/100.2 million in 2025, down by 9.7% from S/111.0 million reported in 2024. •ASB Bank Corp.’s net income was S/124.8 million in 2025, up by 48.0% from S/84.3 million reported in 2024. •Total assets under management in the Asset management business were S/117,133 million as of December 31, 2025, up from S/85,938 million as of December 31, 2024. •Total assets under management in the Wealth Management business was S/80,799 million as of December 31, 2025, compared to S/73,428 million as of December 31, 2024.
|
(2)Political and Macroeconomic Environment
Although Credicorp Ltd. is incorporated in Bermuda, the Group, through BCP Stand-alone, has been present in the Peruvian financial sector for over 135 years. In addition, most of the operations and customers of BCP Stand-alone, Prima AFP and Mibanco, and a significant part of Credicorp Capital’s and Grupo Pacífico’s operations and customers, are located in Peru. Furthermore, although ASHC is based outside of Peru, a substantial number of its customers are also located in Peru. We also have operations in Bolivia, Chile, Colombia and Panama. Therefore, our results of operations and financial health could be affected by political and economic changes or policies in Peru or these other countries.
For further details, see “ITEM 3. KEY INFORMATION – 3.D Risk Factors – Our geographic location exposes us to risk related to Peruvian political, social and economic conditions”.
Political Environment
Historically, Peru has experienced political instability, including domestic terrorism, military coups, and a succession of regimes that featured heavy government intervention, particularly before the 2000s. In 1995, when Credicorp was established, President Alberto Fujimori was re-elected, despite the administration being accused of authoritarian
behavior, which included dissolving Peru’s congress in 1992 and crafting a new constitution in 1993. In 2000, Fujimori, after his second consecutive reelection, was ousted and succeeded by a transitional government led by Valentin Paniagua, who called for elections in April 2001.
Since 2001, Peru has had several presidents: Alejandro Toledo (2001–2006), Alan Garcia (2006–2011), Ollanta Humala (2011–2016), Pedro Pablo Kuczynski (2016–2018), Martin Vizcarra (2018–2020), Manuel Merino (November 10–15, 2020), Francisco Sagasti (November 2020–July 2021), Pedro Castillo (2021–2022), Dina Boluarte (late 2022–October 2025), José Jerí (October 2025-Mid February 2026) and Jose María Balcázar (Mid-February-Present). Notably, the last two elected presidents (Kuczynski and Castillo) did not complete their terms due to political instability and corruption scandals, resulting in their vice presidents—Martín Vizcarra and Dina Boluarte, respectively—assuming the presidency. Political instability continued thereafter: Dina Boluarte was impeached in October 2025 on grounds of permanent moral incapacity, leading to the appointment of José Jerí as interim president. However, Jerí’s tenure was short‑lived, as he was censured by Congress on February 17, 2026. Following his removal, José María Balcázar assumed the presidency in mid‑February 2026 through congressional succession.
The Odebrecht corruption scandal significantly impacted Peru's political landscape. The Brazilian construction company Odebrecht was found to have paid millions in bribes to secure public contracts across Latin America, including in Peru and other countries in which we operate, in circumstances involving former and current high-profile officials. Kuczynski resigned in 2018 amid political turmoil and corruption investigations, leading to Martin Vizcarra taking office. Vizcarra's term was also marked by continued political instability, including a nationwide referendum that approved: (i) a ban on the re-election of members of Peru’s congress, (ii) reforms regarding financing for political parties, and (iii) a reform of the judiciary system. His term also saw the dissolution of congress and his eventual removal in 2020. Manuel Merino briefly took over (November 10, 2020) but resigned just 5 days after (November 15, 2020) due to widespread protests, and Francisco Sagasti then assumed the presidency until July 2021.
In June 2021, the political environment worsened after Pedro Castillo, of the far-left party Peru Libre, won the presidential elections with 50.13% of the votes (representing a margin of 44,263 votes) in the second round against Keiko Fujimori, daughter of the former president Alberto Fujimori. It was the third consecutive loss for the presidential candidate Fujimori. These results fragmented Peru’s congress, with 10 political parties becoming part of the congress’s composition. This fragmentation of political forces was noted by all major rating agencies. Risk perception and political and regulatory uncertainty in Peru also increased following messages from the executive promoting a new constituent assembly. As a result of this risky and uncertain environment, in the second quarter of 2021, short-term capital outflows reached 13.2% of GDP, its highest level since the third quarter of 1983. The total amount of short-term capital outflows between 2021 and 2022 was US$20.9 billion (9.1% of GDP).
Between July 2021 and December 2022, former Peruvian President Pedro Castillo appointed five prime ministers and over 70 other ministers. He also ratified Julio Velarde as President of the BCRP for a fourth consecutive term until 2026. Castillo faced three impeachment trials: the first in November 2021, the second in March 2022, and the third in December 2022. All of these trials cited moral incapacity as the reason for his removal from office, which was based on various allegations of illicit financing, corruption and lying.
Peru experienced a severe political crisis on December 7, 2022, following a failed coup attempt by President Pedro Castillo. On the day of a congressional debate regarding his third impeachment, Castillo announced the dissolution of Congress, calling for new elections and judicial reforms. However, the police and armed forces upheld the constitutional order, and key government members rejected the coup. Consequently, Congress removed Castillo from office for moral incapacity, leading to his arrest on charges of rebellion and conspiracy. Vice President Dina Boluarte was then sworn in as Peru's first female president. Remarkably, all of this transpired within a few hours. On November 27, 2025, the Special Criminal Chamber of the Supreme Court sentenced former President Pedro Castillo to 11 years, 5 months, and 15 days in prison for the crime of conspiracy to commit rebellion, in connection with the attempted coup d’état of December 7, 2022.
Her administration was marked by low approval ratings, persistent security challenges and recurring political tensions with Congress. In October 2025, she was impeached by Congress on grounds of permanent moral incapacity, bringing her presidency to an abrupt end. Given that Boluarte did not have a vice president, the then‑President of Congress, José Jerí, assumed the presidency. Jerí, a 39‑year‑old congressman from the Somos Perú party, took office amid significant institutional uncertainty and fragmented congressional support. However, political instability persisted during his short tenure. On February 17, 2026, President Jerí was censured by Congress and removed from office following allegations of undisclosed meetings with a Chinese businessman, raising concerns related to transparency and potential conflicts of
interest. Following his removal, José María Balcázar, a senior congressional leader from the left‑wing Perú Libre party, assumed the presidency through congressional succession.
Peru held general elections on April 12, 2026, with a second‑round presidential runoff scheduled for June 7, 2026, after no candidate secured an absolute majority in the first round. Peruvians will also elect members of Congress and the Senate of a restored bicameral legislature, as well as representatives to the Andean Parliament. As of now, there are 35 political parties officially registered for these elections. Peru's 2026 presidential election moved to a runoff after no candidate secured a majority in the first round (12–13 April). Keiko Fujimori leads with about 17% and is expected to advance to the June 7 runoff. The second finalist remains uncertain: Roberto Sánchez is ahead of Rafael López Aliaga and some tally sheets are still under review, so confirmation may take until mid-May. The fragmented vote underscores Peru’s divided political landscape and the final runoff pairing hinges on completing the official count and resolving appeal.
Macroeconomic Environment
The adoption of market-oriented macroeconomic policies since the early 1990s, and three decades of a strong macroeconomic fundamental outlook for Peru’s economy along with credit rating improvements (which reached investment grade in 2008) allowed the country's GDP to grow at an average annual rate of 4.9% from 2001 to 2019, according to data from the BCRP. Between 2004 and 2013, the Peruvian economy, on average, outperformed the global economy primarily due to favorable metal prices and financial condition with an average annual GDP growth rate close to 6.5%. Nonetheless, since 2014, the Peruvian economy has been affected by several economic shocks such as the decline in metal prices in 2014 and 2015, the contraction in public investment, the El Niño Phenomenon of 2017 and 2023, the Lava Jato corruption investigations, the COVID-19 pandemic, higher inflation rates primarily due to global factors, and political turmoil. As such, the average annual growth rate for the Peruvian economy from 2014 through 2019, before the global COVID-19 pandemic, was 3.1%, which still was among the highest rates of economic growth in the Latin American region, the 3rd out of 10. After the initial shock of the pandemic in 2020, the economy rebounded by 13.4% in 2021 and grew an additional 2.8% in 2022. In 2023, affected by multiple factors (such as social protests in the beginning of the year and weather events such as Cyclone Yaku and “Coastal El Niño”), the GDP fell 0.4%, its first economic contraction in 25 years, excluding the pandemic. In 2024, Peru experienced a gradual and cyclical recovery, resulting in GDP and domestic demand growth of 3.5% and 4.0%, respectively. In 2025, the GDP expanded around 3.4% in 2025 while domestic demand grew 5.8%, as growth was supported by the economy's mid-cycle momentum and a boost from terms of trade, which reached their highest level in 75 years.
Peruvian economic policy has been based on three main pillars: favorable environment for private investment, prudent macroeconomic policies and trade openness. Peru has an investment-friendly legal framework enshrined in its constitution. For instance, Article 62 of the 1993 Constitution guarantees the freedom of contracts, meaning that contractual terms cannot be modified by laws or other provisions of any kind. Furthermore, Article 63 stipulates that foreign and local investments are subject to the same conditions (non-discriminatory treatment) while Article 64 establishes that the state guarantees the free holding and disposal of foreign currency.
Peruvian policymakers have maintained a conservative and prudent approach to fiscal policy and government spending. Since 1999, Peru’s fiscal policy has evolved to promote sound macroeconomic fundamentals. The public debt-to-GDP ratio fell from 51.5% in 1999 to 26.2% in 2019 (pre-pandemic) as the government reduced spending and privatized most state-run enterprises. Peru’s fiscal position also benefited from the accumulation of surpluses in various years between 2004 and 2013, which helped the country face the pandemic in 2020 and 2021. After the initial shock of the COVID-19 pandemic, which led the fiscal deficit to increase to 8.7% of GDP, the deficit fell to 2.5% of GDP in 2021 and to 1.7% of GDP in 2022. In 2023, it increased to 2.7% of GDP, largely due to a decline in fiscal revenues from 22.1% of GDP to 19.8% of GDP, and in 2024 it rose even further to 3.5% of GDP, its highest level in 32 years (excluding the pandemic period) and surpassing the fiscal rule limit for the second year in a row. In 2025, it fell to 2.2% of GDP, driven by higher fiscal revenues, reflecting elevated metal prices and solid domestic demand growth, and was in line with the fiscal rule limit in force this year. The public debt-to-GDP remained around 30% of GDP in 2025, one of the lowest in emerging markets.
In 1999, Peru enacted the Law of Responsibility and Fiscal Transparency (Law No. 27245), establishing a framework of macro‑fiscal rules aimed at preserving fiscal sustainability. These rules evolved over time and were temporarily suspended during the COVID‑19 pandemic in 2020–2021. As part of the gradual normalization of fiscal policy, Legislative Decree No. 1621, which was issued in June 2024, regulated the return to macro‑fiscal rules for the non‑financial public sector. Among other provisions, the decree raised the fiscal deficit ceiling for 2024 from 2.0% to 2.8%
of GDP and established a declining deficit path, setting limits of 2.2% of GDP for 2025, 1.8% for 2026, 1.4% for 2027, and 1.0% for 2028, while maintaining the objective of preserving medium‑term debt sustainability.
However, according to the Fiscal Council, fiscal conditions came under increasing pressure as Congress approved a rising number of laws with adverse fiscal impacts, weakening fiscal institutional safeguards and increasing risks to medium‑ and long‑term debt sustainability. According to the Fiscal Council’s analysis, since August 2021, a total of 229 laws with adverse fiscal impact had been promulgated as of October 18, 2025. In February 2026, the Minister of Economy, Denisse Miralles, announced that the Executive branch would initiate constitutional proceedings before the Constitutional Court against congressional legislation that has generated spending obligations.
Regarding monetary policy, the BCRP has enjoyed constitutional independence since 1992 and operates as the authority in charge of the reserve banking system. Its highest decision‑making body is a seven‑member Board of Directors, whose members serve five‑year terms that broadly coincide with Peru’s presidential mandate. Of the seven Directors, three are appointed by the executive branch and three by Congress, while the President of the BCRP is nominated by the executive branch and ratified by the Permanent Commission of Congress. The actual president, Julio Velarde, has held this position since October 2006. In October 2021, Peru’s newly elected government and congress ratified him as the BCRP’s president, a position that he has held since 2006, for a fourth consecutive term until 2026. They also elected three of the six directors on the Board to join Velarde: the economists Roxana Barrantes, José Távara and Germán Alarco. Congress appointed the other three directors: Carlos Oliva (ex-Minister of Finance), Diego Macera and Marylin Choy.
Regarding the inflation targeting scheme adopted by the BCRP in 2002, the BCRP established an inflation target of 2.5% (+/- 1%). In 2007, the target was reduced to 2.0% (+/- 1%), the lowest in Latin America and Emerging Markets, reflecting the BCRP’s commitment to price stability, similar to the Federal Reserve's target of 2%. The BCRP had foreign reserves at the end of 2025 of US$90 billion (approximately 26.5% of Peru’s GDP), among the highest ratios worldwide. The BCRP has a set of mechanisms to provide liquidity to Peru’s domestic financial system. In coordination with the SBS, the BCRP also sets regulations for the financial system, including pension funds. The SBS is the entity in charge of regulating all financial institutions, insurance companies and pension funds administrators.
Regarding the exchange rate, the BCRP abandoned its exchange rate peg (also known as a fixed exchange rate) in August 1990 and moved to a so-called dirty floating exchange rate regime. Since its inception, the dirty floating exchange rate regime has been subject to intervention by the central bank to smooth out exchange rate volatility. One key motivation to intervene in this manner in the foreign exchange market is Peru’s high degree of financial dollarization, although it has been on a clearly decreasing path. The loans financial dollarization (loans denominated in U.S. Dollars as a percentage of total loans) has decreased from 80.5% in December 2000 to 43.9% in December 2010 and to 21.9% in December 2025. BCRP’s current dirty floating exchange rate regime pursues a discretionary type of intervention, based on daily assessments of foreign exchange market conditions. In 2025, the exchange rate closed the year at 3.36 soles per dollar, its lowest level since the beginning of 2020.
For further information, see “Item 4.B Business Overview – (6) Supervision and Regulation – 6.2 Subsidiaries – 6.2.1 Peru”.
Macroeconomic Results
Peru
In 2022, Peruvian GDP grew 2.8% a decrease in growth from the prior year, as private investment fell, business confidence remained low and policy stimulus was withdrawn. However, private consumption remained strong, especially in the first half of 2022, driven by the release of pent-up demand, the recovery of employment and availability from savings in AFPs and Severance Indemnity deposits. In the second half of 2022, the rebound in consumption after the acute effects of the COVID-19 pandemic faded and was limited almost entirely to inbound tourism from abroad.
In 2023, GDP fell 0.4%, the first decline in economic activity since 1998 (-0.4%), excluding the pandemic. Several factors explained this contraction. Among the most important, social conflicts and the El Niño weather phenomenon reduced GDP growth by almost two percentage points combined, according to the BCRP. In addition to these factors, the Peruvian economy was also affected by: (i) inflation that remained high (especially the food component) despite the recent slowdown, (ii) real wages that remained below pre-pandemic levels, (iii) real interest rates at two-decade highs due to the Central Bank's effort to control inflation, (iv) political uncertainty, and (v) absence of new large projects for private investment. Domestic demand fell 1.0% due to the drop of 6.1% in private investment (lack of large new projects after the
entry into production of Quellaveco mine, which meant an investment of US$5.5 billion) and private consumption that grew just 0.1%, its worst record since 1999, excluding the pandemic.
In 2024 economic activity rebounded as GDP grew 3.5% and Domestic Demand expanded 4.0%, reflecting the early stages of the recovery phase in the business cycle. On one hand, private spending was more dynamic as: i) private consumption grew 2.8% aided by lower average inflation and a recovery of employment, as well as benefited by the 7th pension fund withdrawal, and ii) private investment grew 3.3% in a context of more dynamic capital goods imports and recovery of capital good non-primary manufacturing. In addition, public investment had an important contribution to growth as it expanded 15% during 2024 in line with a counter-cyclical fiscal stimulus. From an economic sector view, the reversal of supply-side shocks such as El Niño had a very favorable effect in the fishing and agriculture sectors, which rebounded 25% and 7%, respectively.
In 2025 economic activity grew 3.4% while domestic demand expanded 5.8%. Growth was supported by cyclical inertia, terms of trade at their highest in 75 years as they grew 19% during 2025, and low controlled inflation and economic expectations which improved throughout the year. It should be noted that even though Peru had a political transition from former president Dina Boluarte to President Jose Jeri, economic expectations reported by the Central Bank were not affected and stood around its highest level in almost 7 years excluding the post-pandemic rebound. Private consumption grew 3.6% while private investment expanded 10.0%, both accelerating compared to 2024's expansion. It is important to note that in relation to favorable key commodity prices, towards the end of 2025, the mining project Tia Maria (with a total investment of US$ 1.8 billion) started their investment in the south of the country.
In 2022 inflation became a global issue, as many countries grappled with soaring prices. In 2023, inflation fell faster than expected in most regions due to the unwinding of supply-side issues, falling oil and agricultural prices and restrictive monetary policies. In Peru, the weakness of domestic demand also had a role in reducing inflation; as measured using the consumer price index (CPI), inflation fell from a peak of 8.8% (the highest in 26 years) in June 2022 to 3.2% in December 2023 due to the reversal of supply shocks in the agricultural sector of the beginning of the year, normalization of global supply chains and lower commodity prices (2023 average; wheat: -28%, corn: -18%; soy: -8% and crude oil: WTI -17%). Core inflation (excludes food and energy) closed 2023 at 2.9% after reaching a peak of 5.9% in May 2023, returning to the BCRP target range of between 1% - 3% after two consecutive years of surpassing such range, marking Peru as one of the first countries where core inflation returned to target. Inflation continued to gradually decline as supply-side pressures continued to dissipate and stood at 2.0% by December 2024, at the mid-point of the target range, while core inflation decelerated to 2.6%. During 2025 inflation remained subdued below the mid-point of the target range and stood at 1.5% in December 2025, while core inflation also continued to decrease and closed 2025 at 1.8%, It should be noted that the wholesale price index exhibited year-over-year declines since mid-2023, which paired with a lower exchange rate contributed to lower observed inflation.
| | | | | | | | | | | |
| Macroeconomic Indicators for Peru | 2023 | 2024 | 2025 |
| GDP (Billions of US Dollars) | 272 | | 296 | | 341 | |
| Real GDP (% change) | (0.4) | | 3.5 | | 3.4 | |
| Real Domestic Demand (% change) | (1.0) | | 4.0 | | 5.8 | |
| Inflation (% change) | 3.20 | 2.00 | 1.50 |
| Reference Rate (%) | 6.75 | 5.00 | 4.25 |
| Fiscal Balance (% GDP) | (2.7) | | (3.4) | | (2.2) | |
| Public Debt (% GDP) | 32 | | 32 | | 30 | |
| Financial System Loans (% change) 1/ | 2.8 | | 1.3 | | 4.4 | |
| Financial System Loans (% change, FX-neutral) 1/ 2/ | 3.6 | | 0.9 | | 7.3 | |
| Current Account Balance (% GDP) | 0.3 | % | 2.2 | % | 3.1 | % |
| Exchange rate, end of period | 3.71 | 3.76 | 3.36 |
| Exchange rate, (% change) | (2.7) | | 1.3 | | (10.6) | |
| 1/ Excludes Reactiva Perú. 2/ Foreign currency balances valued at end-2024 exchange rate | | | |
In 2023, the Public Treasury returned to the international markets with a successful bond issuance in local currency, something not seen since 2019. In June 2023, the government issued S/9,185 million (equivalent to approximately US$2.5
billion) of its first sustainable bonds in soles, with a 10-year maturity (due in 2033). The issuance of this new bond, which constitutes a new 10-year reference, was characterized by a large demand (around S/20,000 million at its best) that pushed rates lower (7.35%) below the initial offering (7.70%). According to the Minister of Economy and Finance, with this debt issuance, investors recognized the strength and resilience of the Peruvian economy, its solid macroeconomic fundamentals, and the responsible management of its fiscal accounts. It was the largest operation in local currency in 2023 in Latin America.
In 2024, the Public Treasury carried out two international issuances in the context of higher fiscal deficit. In June 2024 the Ministry of Finance carried out a liability management operation which most importantly included: i) the issuance of a new sustainable sovereign bond maturing 2039 for S/ 7 billion, yield of 7.65%, ii) the exchange of sovereign bonds maturing 2024, 2026, 2028 and 2029, including Global Depositary Notes for the new 2039 sovereign bond, and repurchase of global dollar bonds maturing 2025, 2026, 2027, 2030 and 2031, and Euros maturing in 2026 and 2030, for a total of S/ 15,345 million (S/ 8,236 million for the exchange of the recently issued sovereign 2039 bonds and S/ 7,109 million for the repurchases in exchange for cash), and iii) the repurchase for cash of global dollar bonds maturing in 2025, 2026, 2027, 2030 and 2031 for a total of US$ 1,185 million. With this operation the total outstanding of sovereign 2039 bonds stood at S/ 15,436 million. Moreover, in August 2024 the Peruvian government made two issuances for a total of US$ 3 billion: i) US$ 1.25 billion of a global bond maturing 2035 with a coupon of 5.375%, and ii) US$ 1.75 billion of a global bond maturing 2054 with a coupon of 5.875%. The total demand for these two bonds reached of S/18 billion.
In 2025, the Public Treasury carried out several liability management operations (LMO) to attend to financing needs, further develop the public debt market, and increase the public debt maturity profile. On June 5th, 2025 the first LMO was announced which included: i) the issuance of a new sovereign bond maturing 2035 for S/ 10 billion, yield of 6.90%, and ii) the tender exchange and repurchase of sovereign bonds maturing 2026, 2028, 2029 and 2031 for the new 2035 sovereign bond which added up to S/ 13.7 billion (S/ 9.4 billion in exchange for new the new sovereign bond 2035 and S/ 4.3 billion in repurchases for cash). The operation resulted in a total issuance of the 2035 new sovereign bond of S/ 19.4 billion. On June 25th 2025, the Treasury announced a second LMO which included: i) the issuance of two new global bonds for USD 3 billion maturing in 11 and 30 years respectively (USD 1.6 billion for a bond maturing 2036, yield 5.543% and USD 1.4 billion for a bond maturing 2055, yield 6.237%), ii) the tender exchange and repurchase of global bonds in USD maturing 2025, 2026, 2027, 2030 and 2031 for the new 2036 global bond which added up to USD 951 million (USD 516 million in the exchange for the new 2036 global bond and USD 434 million in repurchases for cash), and iii) the repurchases for cash of euro-denominated global bonds 2026 and 2030 for a total of EUR 230 million. Moreover, on August 25th 2025 the Public Treasury announced another LMO to exchange sovereign bonds maturing 2026 and 2028 for the 2034 sovereign bond. The Treasury tapped sovereign bond 2034 for S/ 2.6 billion (yield 5.40%) and exchanged 2026 sovereign bonds for S/ 2.1 billion and 2028 sovereign bonds for S/ 303 million (the operation netted out an increase in outstanding bonds of S/ 209 million). Lastly, on December 11th, 2025 the Treasury carried out its final LMO of the year to exchange sovereign bonds which included: i) tapping into 2035 and 2039 sovereign bonds for S/ 907 million and S/ 95 million, respectively, and ii) the exchange for sovereign bonds 2026 and 2028 for a total of S/ 1,055 million. The net result of this operation was a decrease of outstanding sovereign bonds of S/ 53 million.
In 2025, Bolivia, Colombia, Chile, and Panama faced varied economic challenges, with GDP growth rates of 1.5%, 2.6%, 2.4%, and 4.3% respectively, influenced by factors such as inflation, political unrest, and sector-specific issues.
Other Countries in which We Operate
| | | | | | | | | | | | | | |
| Macroeconomic Indicators 2025 | Bolivia | Colombia | Chile | Panama |
| Real GDP (% change) | 1.5 | 2.6 | 2.4 | 4.3 |
| Inflation | 20.4 | 5.1 | 3.5 | 0.2 |
| Reference Rate | N/A | 9.25 | 4.50 | N/A |
| Public Debt (as % GDP) | 90.4 | 64.7 | 41.7 | 65.5 |
| Exchange rate, end of period | 6.96 | 3,775 | 901 | N/A |
| Exchange rate, (% change) | 0.0 | 14.3 | 9.6 | N/A |
N/A – Not Applicable
Bolivia’s GDP is estimated to have grown 1.5% in 2025. Inflation accelerated sharply, reaching 20.4% year over year, the highest year‑end rate since 1988 (21.5%), while the fiscal deficit widened to an estimated 12.7% of GDP, according to the Central Bank. Reflecting mounting macroeconomic imbalances, Bolivia’s sovereign credit rating was
downgraded repeatedly in 2025 (Fitch: from CCC to CCC‑ in January; Moody’s: from Caa3 to Ca in April; and S&P: from CCC+ to CCC‑ in June). On the political front, the first round of presidential elections in August 2025 led to a runoff between Rodrigo Paz and Jorge Quiroga. Paz, a center‑right candidate, won the October 2025 runoff and has been in office since November 2025, marking the end of the MAS party’s 20‑year legislative dominance. In this context, the parallel market exchange rate closed the year at 9.6 bolivianos per U.S. Dollar, after having depreciated to nearly 20 bolivianos per dollar prior to the elections.
In Colombia, according to the Colombian National Statistics Bureau (DANE), GDP grew 2.6% in 2025. Economic activity continued to be driven primarily by consumption, resulting in a strong expansion in domestic demand (3.9%). Private consumption was supported by higher real wages, record‑low unemployment amid strong job creation, historically high workers’ remittances, government transfers, higher incomes among coffee‑growing households, and increased consumer credit. Public consumption also contributed significantly to growth, reflecting elevated government spending amid ongoing fiscal deterioration and limited fiscal consolidation, particularly during the electoral period. In contrast, investment remained weak, constrained by high interest rates and heightened regulatory and political uncertainty, posing risks to potential GDP growth. Inflation stood at 5.1% year-over-year in December 2025, above the upper limit of the Central Bank target range (3% + - 1pp.) for fifth consecutive year while inflation, excluding food and administered prices, stood at 5.0% year-over-year. As such, the BanRep, only delivered one policy rate cut of 25 basis points throughout the year to 9.25%. The fiscal deficit reached 6.2% of GDP, while the primary deficit stood at approximately 3.0% of GDP, highlighting the structural weaknesses in public finances. Under this context, Fitch cut the sovereign rating from BB+ to BB in Dec-25, matching Standard & Poor's. The exchange rate closed 2025 at 3,775 Colombian Pesos per dollar, an appreciation of 14.3% compared to the end of 2024, due to the weakening of the global dollar and the externalities of the national government’s financial engineering maneuvers.
In Chile, according to the Central Bank of Chile (BCCh), GDP grew 2.5% in 2025, while domestic demand expanded 4.4%. Private consumption was supported by rising consumer confidence and an improving labor market. Investment growth exceeded expectations, driven by higher copper prices, improved financial conditions, and stronger investment sentiment. Inflation stood at 3.5% in December 2025, down from 4.5% a year earlier and slightly above the Central Bank’s target range of 3% ±1 percentage point. Inflation declined faster than anticipated during the year, particularly in the goods component, reflecting the strong appreciation of the Chilean peso and the impact of trade diversion on the prices of certain imported goods. In this context, the BCCh continued its monetary policy normalization process, cutting the policy rate by 50 basis points in 2025 to 4.50%, bringing cumulative rate cuts since July 2023 to 675 basis points. The exchange rate appreciated by nearly 10% over the year, closing at 901 Chilean Pesos per U.S. Dollar. Notably, the peso strengthened by 6.4% in the fourth quarter (December 31 compared to September 30). On the political front, José Antonio Kast was elected President of Chile in a decisive victory. However, the elections resulted in a fragmented Congress, with no coalition securing an absolute majority in either chamber. Finally, regarding fiscal accounts, the fiscal deficit closed 2025 at 2.8% of GDP, while gross public debt remained at 41.7% of GDP. The recent surge in copper prices is likely to provide short‑term relief to fiscal pressures. In this context, both S&P and Moody’s reaffirmed Chile’s sovereign credit rating with a stable outlook.
In 2025, Panama’s economic growth recovered to around 4% year over year in 2025, rebounding from a weak 2.7% expansion in 2024, its slowest pace since the 2009 global financial crisis excluding the pandemic period. The recovery was driven primarily by private consumption and services, despite episodes of social unrest between April and July 2025 and persistent uncertainty related to fiscal and social security reforms. Jose Raul Mulino, from the Realizando Metas party of former president Ricardo Martinelli, won the May 2024 presidential election and achieved important accomplishments in 2025. First, the approval of the social security reform and second, the agreement with First Quantum to discontinue two arbitration proceedings due to the closing of Minera Cobre Panamá in 2023. U.S. pressure regarding the Panama Canal emerged as an additional challenge for President Mulino’s administration. President Trump threatened to take control of the Canal, citing concerns over China’s regional influence, prompting Panama to terminate its Belt and Road agreement with China and deepen cooperation with the United States. In parallel, the government launched audits of port concessions. In January 2026, Panama’s Supreme Court ruled unconstitutional the concession held by CK Hutchison to operate the ports of Balboa and Cristóbal. Finally, Panama’s public debt, as a percentage of GDP, closed 2025 at 65.5% of GDP.
For further information, see “ITEM 3. KEY INFORMATION – 3.D Risk Factors – “Economic and market conditions in other countries may affect the Peruvian economy and the market price of Peruvian securities” and “Our business and results of operations could be negatively impacted by the pandemic virus (include COVID-19) outbreak or other public health crises beyond our control."
(3)Material accounting policies
Not applicable.
(4)Historical Discussion and Analysis
Credicorp monitors the results of its operating segments separately for the purpose of making decisions about resource allocation and performance assessment. Regarding Credicorp’s LoBs, total external income from the universal banking LoB amounted to 72.6%, 73.2% and 70.8% of Credicorp’s total external income (which corresponds to total interest and similar income, including income and expenses on commissions, net premiums earned from insurance activities and medical services results) in 2023, 2024 and 2025, respectively. Therefore, the following historical discussion and analysis is presented principally for the universal banking LoB, except when otherwise indicated, and is based upon information contained in our consolidated financial statements and should be read in conjunction therewith. The discussion in this section regarding interest rates is based on nominal interest rates.
The financial information and the discussion and analysis presented below for 2023, 2024 and 2025 reflects the financial position and results of operations of our subsidiaries.
4.1Consolidated contributions
See “Item 4.B Business Overview – (1) Credicorp Overview” for the contribution to the consolidated net profit attributable to our equity holders by each of our principal LoBs and subsidiaries, as well as for the percentage contribution to Credicorp total assets, total revenues, net profit, and equity attributable to Credicorp’s equity holders.
4.2Financial performance
In 2025, we recorded a net profit, after non-controlling interest, of S/6,925.4 (compared to S/5,501.3 million in 2024 and S/4,865.5 million in 2023). This represented an increase of 25.9% as compared to the results in 2024. The increase was attributable to a higher net income from Universal Banking, which stemmed from increasing margins after provisions amid an acceleration in loan growth and diversified sources of revenue, as reflected by an increase in fee income and gains on FX transactions. The Microfinance business, in turn, also made a positive contribution driven by higher risk-adjusted margins that reflect a lower cost of funding; improved asset quality; and a shift in the loan mix toward small ticket, higher-yield loans. In 2025, operating expenses grew 8.6%, fueled primarily by core businesses at BCP and by investments in our innovation portfolio. Growth in core expenses at BCP was driven mainly by an increase in personnel expenses related to commercial and technological and transactional capabilities development. In 2025, ROAE was 19.0% (compared to 16.5% in 2024 and 15.8% in 2023), and ROAA was 2.6% (compared to 2.2% in 2024 and 2.0% in 2023).
The main factors behind Credicorp’s results were:
•Year-end total loan balances increased 2.9% from 2024 to 2025 (+8.5% at a Neutral Exchange Rate), supported by a more dynamic economic backdrop. This growth was fueled by higher loan disbursements across all segments at BCP Stand-Alone, followed by Mibanco with similar loan disbursements dynamics, which registered sustained growth throughout 2025. Mibanco Colombia also contributed to this increase. See also Non-GAAP Measures of Financial Performance in this section.
•The cost of risk decreased by 79 bps from 2024 to 1.63% in 2025. This result was mainly driven by a decrease in provisions across segments at BCP Stand-Alone and Mibanco, and secondarily by loan growth dynamics described above. At BCP Stand-alone, the decline was primarily triggered by the Individuals segment, which registered an improvement in payment performance and an increase in lower-risk vintages’ share of total loans. At Mibanco, the decline was driven mainly by an improvement in underlying risk as low-risk vintages gained terrain and currently represent 84% of the portfolio. See also “ITEM 5. OPERATING AND FINANCIAL REVIEW AND PROSPECTS – 5.A Operating Results – (5) Financial Position – 5.1 Total Assets – Portfolio quality”.
•Interest income, which is the largest single component of total external income, rose 0.3% in 2025. This growth was driven mainly by an increase in interest on loans, which was buoyed by a positive volume effect across segments and solid growth in retail loans in particular, which improved the mix of the portfolio. Interest expenses fell 9.4%, driven by a reduction in interest on deposits, which fell due to both lower market rates and an increase in low-cost deposits’ share of the funding mix. In this context, net interest income (NII) rose 4.3% from 2024 to 2025. At the end of 2025, full-year net interest margin (NIM) stood at 6.27%, which reflects a 2-bps decrease
from its 2024 level. Finally, an improvement in client payment performance, as evidenced by the decline in Cost of Risk, led to an uptick in Risk-adjusted NIM, from 4.77% in 2024 to 5.28% in 2025.
•Other income increased by 6.5% as compared to 2024, respectively. This was driven by an increase in Net Fee Income (S/147.6 million increase compared to 2024), as a result of higher transactional activity at BCP Stand-alone. Growth was also supported, to a lesser extent, by Mibanco, due to higher insurance fees associated with increased loan disbursements, and by Credicorp Capital, reflecting higher fund management fees. Likewise, this was driven by an increase in Net Gains on Foreign Exchange Transactions (S/182.5 million increase compared to 2024), mainly driven by improved pricing execution and higher transactional volumes at BCP Stand- alone.
•Total insurance and reinsurance results (income from insurance services, less expenses from insurance services and reinsurance results) rose 15.9% compared to 2024. This variation was primarily driven by an increase in Insurance Service Income (+23.0%), mainly boosted by the consolidation of Pacifico EPS, after Credicorp, through Grupo Crédito S.A., acquired the 50% interest that Banmédica held in Pacifico EPS, and secondarily by more favorable Reinsurance Results (-7.2%), mainly in Life Business, P&C business and Crediseguros. These dynamics were partially offset by an increase in insurance service expenses (+34.3%), mainly reflecting the aforementioned consolidation.
•Results for Medical Services contributed S/414.6 million. 2025 was the first year we registered this financial line in our financial statements. as a result of the full consolidation of the Medical Services, after Credicorp acquired the remaining 50% of Banmédica's stake from March 2025.
•Operating Expenses increased 8.6% compared to 2024, mainly due to (i) BCP, where salary and benefit expenses rose from hiring more talent for new initiatives related to commercial, technological and transactional capabilities development, and variable compensation provisioning, and (ii) disruptive initiatives at the Credicorp level.
•The efficiency ratio stood at 46.6% (compared to 45.8% in 2024), primarily due to an expansion in operating expenses.
Main ratios
| | | | | | | | | | | | | | | | | | | | | | | | | | |
| | As of and for the year ended on December 31, | | |
| | 2023 | | 2024 | | 2025 | | 2025 – 2024 (bps) |
ROAE (1) | | 15.83 | % | | 16.47 | % | | 19.05 | % | | 258 |
ROAA (2) | | 2.01 | % | | 2.22 | % | | 2.65 | % | | 43 |
NIM (3) | | 6.01 | % | | 6.29 | % | | 6.27 | % | | (2) |
Funding cost (4) | | 2.91 | % | | 2.74 | % | | 2.31 | % | | (43) |
Cost of risk (5) | | 2.50 | % | | 2.42 | % | | 1.63 | % | | (79) |
Loan to deposit (6) | | 98.15 | % | | 90.05 | % | | 88.02 | % | | (203) |
Internal overdue ratio (7) | | 4.23 | % | | 3.73 | % | | 3.21 | % | | (52) |
Non-performing loan ratio (8) | | 5.89 | % | | 5.26 | % | | 4.55 | % | | (71) |
Coverage of Internal overdue loans (9) | | 135.12 | % | | 147.42 | % | | 159.34 | % | | 1,192 |
Coverage on Non-performing loans (10) | | 97.02 | % | | 104.34 | % | | 112.45 | % | | 811 |
Operating efficiency (11) | | 46.08 | % | | 45.78 | % | | 46.55 | % | | 77 |
(1)Net profit attributable to Credicorp / Average** equity before non-controlling interest.
(2)Net profit attributable to Credicorp / Average** assets.
(3)Net Interest Income / Average** interest earning assets.
(4)Interest expense / Average** total funding.
(5)Provisions for loan losses, net of recoveries / Total loans.
(6)Total loans, net of unearned income / Total deposits and obligations.
(7)Internal overdue loans / Total loans.
(8)Non-performing loans / Total loans. Non-performing loans = Internal Overdue Loans + Refinanced Loans + Restructured Loans
(9)Allowance for loan losses / Internal overdue loans.
(10)Allowance for loan losses / Non-performing loans.
(11)(Salaries and employee benefits + Administrative expenses + Depreciation and amortization + Acquisition cost + Association in participation) / (Net interest income + Commissions and fees + Net gain from exchange differences + Net gain in associates + Net premiums earned + Net gain on foreign exchange transactions + Net loss(gains) on financial assets designated at fair value through profit or loss + Net gain on derivatives held for trading + Net loss from exchange differences). Acquisition cost includes net fees, underwriting expenses, and underwriting income.
(**)Averages are determined as the average of period-beginning and period-ending balances.
4.3Results of operations for the three years ending on December 31, 2023, 2024 and 2025
The following table sets forth, for the years 2023, 2024 and 2025, the principal components of our net profit:
| | | | | | | | | | | | | | | | | |
| As of and for the year ended on December 31, |
| 2023 | | 2024 | | 2025 |
| (in thousands of Soles) |
| Interest and similar income | 18,798,495 | | | 19,869,256 | | | 19,930,169 | |
| Interest and similar expenses | (5,860,523) | | | (5,754,125) | | | (5,213,690) | |
| Net interest, similar income and expenses | 12,937,972 | | | 14,115,131 | | | 14,716,479 | |
| Provision for credit losses on loan portfolio | (3,957,143) | | | (3,943,301) | | | (2,873,454) | |
| Recoveries of written-off loans | 334,798 | | | 423,854 | | | 467,198 | |
| Provision for credit losses on loan portfolio, net of recoveries | (3,622,345) | | | (3,519,447) | | | (2,406,256) | |
| Net interest, similar income and expenses, after provision for credit losses on loan portfolio | 9,315,627 | | | 10,595,684 | | | 12,310,223 | |
| Total non-interest income | 5,655,825 | | | 6,404,119 | | | 6,821,279 | |
| Total insurance and reinsurance result | 1,211,100 | | | 1,199,020 | | | 1,389,200 | |
| Total medical services results | — | | | — | | | 414,634 | |
| Total other expenses | (9,334,223) | | | (10,374,296) | | | (10,987,783) | |
| Profit before income tax | 6,848,329 | | | 7,824,527 | | | 9,947,553 | |
| Income tax | (1,888,451) | | | (2,201,275) | | | (2,864,899) | |
| Net profit | 4,959,878 | | | 5,623,252 | | | 7,082,654 | |
| Net profit attributable to: | | | | | |
| Credicorp’s equity holders | 4,865,540 | | | 5,501,254 | | | 6,925,377 | |
| Non-controlling interest | 94,338 | | | 121,998 | | | 157,277 | |
Net income attributable to our shareholders for 2025 reflected an increase of 25.9% compared to 2024. This result was mainly due to lower interest and similar expenses, which decreased by 9.4% compared to 2024, and a lower provision for credit losses on the loan portfolio, which decreased by 27.1% compared to 2024. It was also due to higher total non-financial income, which increased by 6.5% compared to 2024, and the total result of medical services mainly boosted by the consolidation of Pacifico EPS, after Credicorp, through Grupo Crédito S.A., acquired the 50% interest that Banmédica held in Pacifico EPS
4.3.1Net Interest, similar income, and expenses
The following table sets forth the components of net interest, similar income, and expenses:
| | | | | | | | | | | | | | | | | |
| As of and for the year ended on December 31, |
| 2023 | | 2024 | | 2025 |
| (in thousands of Soles) |
| Interest and similar income | | | | | |
| Interest on loans | 15,044,864 | | | 15,654,391 | | | 15,743,509 | |
| Interest on investments at fair value through other comprehensive income | 1,984,408 | | | 2,136,099 | | | 2,058,897 | |
| Interest on due from banks | 1,133,211 | | | 1,405,854 | | | 1,369,573 | |
| Interest on investments at amortized cost | 456,543 | | | 469,224 | | | 441,899 | |
| Dividends received | 46,080 | | | 49,469 | | | 87,275 | |
| Interest on investments at fair value through profit or loss | 48,376 | | | 54,999 | | | 46,288 | |
| Other interest and similar income | 85,013 | | | 99,220 | | | 182,728 | |
| Total Interest and similar income | 18,798,495 | | | 19,869,256 | | | 19,930,169 | |
| | | | | |
| Interest and similar expense | | | | | |
| Interest on deposits and obligations | (3,141,307) | | | (2,850,474) | | | (2,303,616) | |
| Interest on due to banks and correspondents | (1,158,665) | | | (1,081,126) | | | (1,029,593) | |
| Interest on bonds and notes issued | (634,299) | | | (799,223) | | | (710,390) | |
| Financial expenses of insurance activities | (466,814) | | | (507,356) | | | (560,081) | |
| Deposit Insurance Fund | (237,441) | | | (256,583) | | | (283,706) | |
| Interest on lease liabilities | (25,574) | | | (22,828) | | | (37,169) | |
| Other interest and similar expense | (196,423) | | | (236,535) | | | (289,135) | |
| Total Interest and similar expense | (5,860,523) | | | (5,754,125) | | | (5,213,690) | |
| Net interest income | 12,937,972 | | | 14,115,131 | | | 14,716,479 | |
Net interest income grew by 4.3%, from 2024 to 2025 (and rose 9.1% from 2023 to 2024). This evolution was mainly due to a 9.4% decline in Interest and similar expenses due to lower interest rates and a higher share of low-cost deposits within the funding structure. In 2024, Interest and similar expenses registered a 1.8% decrease compared to 2023.
Interest and similar income remained relatively stable (+0.3%) as loan growth acceleration was partially offset by lower interest rates. In this context, interest on deposits from other banks and securities decreased compared to the previous year. In 2024, Interest and similar income rose 5.7% compared to 2023.
The average balance of our foreign currency-denominated loan portfolio decreased by 3.6% to S/50.1 billion in 2025, as compared to S/52.0 billion in 2024.
The average balance of the Sol-denominated loan portfolio increased by 2.7% to S/94.3 billion in 2025, compared to S/91.9 billion in 2024.
The average nominal interest rates earned on loans increased 10.9% in 2025. The average nominal interest rate for foreign currency-denominated loans decreased to 7.2% in 2025. Average nominal interest rates for Sol- denominated loans increased to 12.9% in 2025.
Interest and similar expenses decreased by 9.4% in 2025 compared to the level registered in 2024. In 2024, interest expense registered a decline of 1.8% compared to 2023. The 2025 decrease in interest expenses was attributable to lower market interest rates and a higher proportion of low-cost deposits in the funding mix.
Average interest-bearing foreign currency-denominated deposits decreased in 2025 by 3.2% to S/71,606.5 million from S/73,975.1 million in 2024. Our average interest-bearing Sol-denominated deposits increased by 11.2% in 2025 to S/87,996.2 million from S/79,135.0 million in 2024.
Average nominal interest rates paid on foreign currency-denominated deposits was 1.8%, 2.0%, and 1.5% in 2023, 2024, and 2025, respectively. Average nominal interest paid on Sol-denominated deposits was 2.8% in 2023, decreased to 2.1% in 2024 and decreased to 1.7% in 2025. NIM (net interest income divided by monthly average interest-earning assets) was 6.53% in 2025, 6.42% in 2024 and 6.13% in 2023.
For more detail, see “ITEM 4. INFORMATION ON THE COMPANY – 4.B Business Overview – (7) Selected Statistical Information”.
4.3.2Provisions for Loan Losses
The following tables set forth the changes in our provisions for loan losses:
| | | | | | | | | | | | | | | | | |
| As of and for the year ended on December 31, |
| 2023 | | 2024 | | 2025 |
| (in thousands of Soles) |
| Provision for credit losses on loan portfolio | (3,957,143) | | | (3,943,301) | | | (2,873,454) | |
| Recoveries of written-off loans | 334,798 | | | 423,854 | | | 467,198 | |
| Provision for credit losses on loan portfolio, net of recoveries | (3,622,345) | | | (3,519,447) | | | (2,406,256) | |
Provisions for credit losses on loan portfolios, net of recoveries, decreased by 31.6% in 2025 to S/2,406.3 million as compared to S/3,519.4 million in 2024 and to S/3,622.3 million in 2023. The contraction reflects lower provisions established across Credicorp’s banking businesses, particularly for BCP Stand-alone and Mibanco, driven by fortified risk management and backed by improvements in the Peruvian economy and payment performance.
At BCP Stand-alone, the decline was primarily triggered by the Individuals segment, which registered an improvement in payment performance and an increase in lower-risk vintages’ share of total loans; and, secondarily, by the SME segment, which exhibited similar dynamics. This evolution was partially offset by higher provisions at Wholesale Banking, mainly due to an increase in risk at indirect exposure related to specific clients in the construction sector. At Mibanco, the decline was driven mainly by an improvement in underlying risk as low-risk vintages gained terrain and currently represent 84% of the portfolio:
Total recoveries of written-off loans reached S/467.2 million in 2025, as compared to S/423.9 million in 2024 and to S/334.8 million in 2023.
4.3.3Other Income
The following table reflects the components of our other income:
| | | | | | | | | | | | | | | | | |
| As of and for the year ended on December 31, |
| 2023 | | 2024 | | 2025 |
| (in thousands of Soles) |
| Commissions and fees | 3,804,459 | | | 4,052,103 | | | 4,199,719 | |
| Net gain on foreign exchange transactions | 886,126 | | | 1,359,805 | | | 1,542,318 | |
| Net gain on securities | 425,144 | | | 362,295 | | | 400,686 | |
| Net gain on derivatives held for trading | 53,665 | | | 156,195 | | | 51,917 | |
| Net exchange difference result | 45,778 | | | (41,058) | | | 41,991 | |
| Others | 440,653 | | | 514,779 | | | 584,648 | |
| Total other income | 5,655,825 | | | 6,404,119 | | | 6,821,279 | |
Other income, excluding insurance and medical services results, increased by 6.5% to S/6,821.3 million in 2025, compared to S/6,404.1 million in 2024. This growth was mainly driven by higher Other Core Income, reflecting stronger Net Fee Income and Net Gains from Foreign Exchange Transactions, in line with the continued execution of our revenue diversification strategy and sustained growth in transactional volumes at BCP Stand‑alone.
Commissions and fees increased by 3.6% to S/4,199.7 million in 2025, compared to S/4,052.1 million in 2024. Growth was primarily driven by Yape, reflecting higher adoption and usage of income‑generating functionalities, particularly QR/POS payments, bill payments and checkout solutions, as well as by core banking products such as Liability and transactional accounts, which rose through higher transactional volumes in Wires and Transfers, as well as Current Account gains, mainly at BCP Stand‑alone.
Net Gains from Foreign Exchange Transactions increased by 13.4% to S/1,542.3 million in 2025, compared to S/1,359.8 million in 2024, driven by sustained transactional dynamism, particularly at BCP Stand‑alone, supported by disciplined pricing strategies and greater use of digital channels from Retail clients, as well as higher volumes from Wholesale clients.
Other Non‑Core Income increased by 8.8% to S/1,079.2 million in 2025, compared to S/992.2 million in 2024, mainly explained by higher Net Gains on Securities, Net Gain from Exchange Difference and Other Non‑operating Income. Net Gains on Securities increased mainly due to BCP Stand‑alone, driven by sovereign bond exchange transactions, and, to a lesser extent, by Credicorp Capital and ASB, reflecting improved results in their fixed income portfolios. Net Gains from Exchange Differences were primarily generated by ASB. Other non‑operating income included an extraordinary gain related to the acquisition of the remaining 50% stake of the joint venture with Empresas Banmédica.
4.3.4Exchange difference
The exchange difference reflects exposure to the appreciation and depreciation of net monetary positions in foreign currencies, principally US Dollars, in 2023, 2024 and 2025, to Peruvian Soles. We recorded a net gain from exchange difference of S/45.8 million, a net loss from exchange difference of S/41.1 million and a net gain from exchange difference of S/42.0 million in 2023, 2024 and 2025 respectively.
Credicorp manages foreign exchange risk by monitoring and controlling the position values due to changes in exchange rates. We measure our performance in Soles (since 2014, when we changed our functional currency from US Dollars) such that if the net foreign exchange position (mainly US Dollar) is an asset, any depreciation of Soles with respect to the relevant foreign currency would positively affect Credicorp’s consolidated statements of financial position. The current position in a foreign currency comprises exchange rate-linked assets and liabilities in that currency. An institution’s open position in individual currencies comprises assets, liabilities and off-balance sheet items denominated in the respective foreign currency for which the institution itself bears the risk; any appreciation/depreciation of the foreign exchange would affect the consolidated statements of income.
As of December 31, 2023, 2024 and 2025, Credicorp’s net foreign exchange balance is the sum of its positive open non-Soles positions (net long position) less the sum of its negative open non-Soles positions (net short position). For further details, see “ITEM 11. QUANTITATIVE AND QUALITATIVE DISCLOSURES ABOUT RISK MANAGEMENT – Foreign Currency Exchange Rate Risk".
4.3.5Insurance and reinsurance result
The following table reflects the result of insurance and reinsurance service under IFRS 17:
| | | | | | | | | | | | | | | | | |
| As of and for year ended December 31, |
| 2023 | | 2024 | | 2025 |
| (in thousands of Soles) |
| Insurance service result | 1,602,421 | | | 1,693,617 | | | 1,848,025 | |
| Reinsurance result | (391,321) | | | (494,597) | | | (458,825) | |
| Total insurance and reinsurance result | 1,211,100 | | | 1,199,020 | | | 1,389,200 | |
Insurance and reinsurance result rose 15.9% to S/1,389.2 million in 2025, compared to S/1,199.0 million in 2024. This variation was primarily driven by a higher Insurance Service Income, mainly boosted by the consolidation of Pacifico EPS, after Credicorp, through Grupo Crédito S.A., acquired the 50% interest that Banmédica held in Pacifico EPS, and secondarily by a more favorable Reinsurance Result, particularly in Life and P&C businesses. These dynamics were partially offset by an increase in Insurance Service Expenses, mainly reflecting the aforementioned consolidation and, secondarily, due to the P&C business.
4.3.6Results for Medical Services
Results for Medical Services contributed S/414.6 million. 2025 was the first year we registered this financial line in our financial statements, as a result of the full consolidation of the Medical Services, after Credicorp, through Grupo Crédito S.A., acquired the 50% interest that Banmédica held in Pacífico EPS in March 2025.
4.3.7Other Expenses
The following table reflects the components of our expenses:
| | | | | | | | | | | | | | | | | |
| As of and for the year ended on December 31, |
| 2023 | | 2024 | | 2025 |
| (in thousands of Soles) |
| Salaries and employee benefits | (4,265,453) | | | (4,676,436) | | | (5,435,471) | |
| Administrative expenses | (3,803,203) | | | (4,183,775) | | | (4,090,784) | |
| Depreciation and amortization | (511,174) | | | (570,830) | | | (746,243) | |
| Impairment loss on goodwill | (71,959) | | | (27,346) | | | - | |
| Depreciation for right-of-use assets | (147,833) | | | (142,640) | | | (146,899) | |
| Others | (534,601) | | | (773,269) | | | (568,386) | |
| Total other expenses | (9,334,223) | | | (10,374,296) | | | (10,987,783) | |
Total other expenses increased by 5.9% to S/10,987.8 million in 2025, compared to S/10,374.3 million in 2024 Operating Expenses increased by 8.6% to S/10,426.8 million in 2025, compared to S/9,602.0 million in 2024. This was mainly attributable to (i) BCP, where salary and employee benefit expenses rose from hiring more talent, and variable compensation provisioning, and (ii) disruptive initiatives at the Credicorp level.
Salaries and employee benefits increased by 16.2% to S/5,435.5 million in 2025 as compared to S/4,676.4 million in 2024 (and compared to S/4,265.4 million in 2023).
Administrative expenses decreased by 2.2% to S/4,090.8 million in 2025 as compared to S/4,183.8 million in 2024 (and compared to S/3,803.2 million in 2023).
4.3.8Income Taxes
The Group’s income tax expense increased from S/2,201.3 million in 2024 to S/2,865.0 million in 2025, primarily as a result of a higher income before income tax in 2025.
While the statutory income tax rate in Peru remained unchanged at 29.5%, the effective income tax rate increased from 28.15% in 2024 to 29.01% in 2025, mainly due to a lower net impact of non‑taxable income and a reduced favorable effect from profits generated by subsidiaries not domiciled in Peru, partially offset by the effect of dividend withholding taxes.
At present, Credicorp is not subject to any withholding tax, capital transfer tax, estate duty, inheritance tax, or property tax in Bermuda. However, on December 27, 2023, the Government of Bermuda enacted the Corporate Income Tax Act 2023 (CIT Act), in connection with the implementation of the Pillar Two rules. This legislation introduces a 15.0 percent corporate income tax, applicable to entities that are part of multinational groups with consolidated revenues equal to or exceeding EUR 750 million, for fiscal years beginning on or after January 1, 2025, as determined in accordance with, and
subject to, the adjustments set out in such legislation. Credicorp Ltd. and its subsidiaries domiciled in Bermuda fall within the scope of this regulation. As of December 31, 2025, Management has assessed the impact of this tax and concluded that it is not material to the consolidated financial statements.
Additionally, some of our subsidiaries are subject to income tax and taxes on dividends paid to us, depending on the legislation of the jurisdictions in which they generate income.
Peru
Our Peruvian subsidiaries, including BCP Stand-alone, are subject to corporate taxation on income under Peruvian Tax Law. As of December 31, 2023, 2024, and 2025, the Peruvian statutory income tax rate was 29.5% on taxable profit after calculating the workers’ profit sharing, which is determined using a 5.0% rate.
Peruvian tax legislation is applicable to legal entities established in Peru and on an individual (not consolidated) basis. Our non-Peruvian subsidiaries are not subject to taxation in Peru, and their assets are not included in the calculation of the Peruvian extraordinary tax on net assets, except if these entities have income from Peruvian source that is subject to Peruvian withholding tax.
The SUNAT has the right to review and, if necessary, request to amend the Tax returns filed by Peruvian subsidiaries for up to four years after their filing date. However, this period may be suspended according to the criteria established in the tax legislation. As of December 31, 2025, income tax returns of the major subsidiaries open for examination by the tax authorities are as follows:
| | | | | | | | |
| - | Banco de Crédito del Peru S.A. | 2021 to 2024 |
| | |
| - | Mibanco, Banco de la Microempresa S.A. | 2023 to 2024 |
| | |
| - | Pacífico Compañía de Seguros y Reaseguros S.A. | 2021 to 2024 |
| | |
| - | Credicorp Capital Servicios Financieros S.A. | 2022 to 2024 |
| | |
| - | Credicorp Capital Peru S.A.A. | 2022 to 2024 |
| | |
| - | Grupo Crédito | 2021 to 2024 |
Bolivia
The corporate income tax rate in Bolivia is 25.0 percent as of December 31, 2023, 2024, and 2025. Bolivian financial entities are subject to an additional rate to the extent that the ROE exceeds 6.0 percent; in that case, they must consider an additional rate of 25.0 percent, which would bring the rate to 50.0 percent.
The Bolivian Tax Authority has the right to review and, if applicable, to make a new income tax assessment. It also regulates the terms for review after the filing of the income tax returns. The annual income tax declarations of BCP Bolivia, which are pending examination by the Bolivian tax authority, correspond to fiscal years 2017 to 2024.
Chile
In Chile, the tax legislation changed in 2020, establishing two new regimes currently in force: the general regime and the Pro-Pyme regime, with the latter applicable to smaller companies. Credicorp Capital Holding Chile, as well as all its subsidiaries, are taxed under the general regime, whose corporate income tax rate for domiciled legal entities remains at 27.0 percent as of December 31, 2023, 2024, and 2025.
Individuals or legal entities not domiciled in Chile will be subject to an additional tax at rates between 4.0 percent and 35.0 percent, depending on the nature of the income.
The Chilean Tax Authority has the power to review and, if applicable and if necessary, amend the annual income tax returns filed by the Chilean subsidiaries up to three years after their filing date and make a new determination for the income tax. The Chilean Tax Authority is currently auditing the 2022 corporate income tax returns of Credicorp Capital
Chile and the 2022 corporate tax return of Credicorp Capital Asset Management S.A. Administradora General de Fondos. No material issues have been raised in connection with either of these audits.
Colombia
In Colombia, the income tax rate has been set at 35.0 percent for the years 2023, 2024 and 2025.
The rate of 40.0 percent will be applicable only to financial institutions that, in the corresponding taxable year, have a taxable income equal to or greater than 120,000 Unidad de Valor Tributario (“UVT”), which as of December 31, 2025, 2024 and 2023 is equivalent to a total of S/5.3 million, S/5.1 million and S/4.4 million, respectively.
Additionally, for occasional profits, listed and established by the National Government in the Tax Statute and which are not subject to income tax, a differential rate of 15.0 percent must be applied on the net profit and the associated expenses respectively.
Dividends and participations are subject to a 20.0 percent rate as withholding at source on income, which will be transferable and imputable to the resident individual or investor residing abroad.
The Colombian Tax Authorities have the power to review and, if applicable, to make a new Income Tax assessment of the subsidiaries of Credicorp located in Colombia, which also regulate the terms for the review after the filing of the Income Tax returns. Additionally, in the case of Colombia, a period of 6 years was established for the taxpayers obliged to apply Transfer Prices or taxpayers who report tax losses. The Colombian annual tax returns pending review by the foreign tax authorities are the following:
| | | | | | | | |
| - | Mibanco Colombia S.A.S. | 2020 to 2024 |
| | |
| - | Credicorp Capital Colombia S.A. | 2020 to 2024 |
| | |
| - | Credicorp Capital Fiduciaria | 2020 to 2024 |
Since tax regulations are subject to interpretation by the different Tax Authorities where Credicorp’s subsidiaries are located, it is not possible to determine at the present date whether any significant additional liabilities may arise from any eventual tax examinations of the Credicorp’s subsidiaries. Any resulting unpaid taxes, tax penalties or interest that may arise will be recognized as expenses in the year in which they are determined. However, Management of Credicorp and its Subsidiaries and their legal counsel consider that any additional tax assessments would not have a significant impact on the consolidated financial statements as of December 31, 2023, 2024 and 2025.
Non-GAAP Measures of Financial Performance
To supplement our audited consolidated financial statements prepared in accordance with IFRS as issued by the IASB, we present Neutral‑Exchange Rate Loan Growth, a non‑IFRS financial measure. We use this measure to evaluate loan portfolio performance excluding the effects of foreign exchange fluctuations. A reconciliation to the most directly comparable IFRS measure is presented in the tables below.
This non‑IFRS financial measure should not be considered in isolation or as a substitute for the analysis of our results prepared in accordance with IFRS, and may differ from measures with similar titles used by other companies. In addition, this measure is not based on a comprehensive set of accounting rules. Non‑IFRS measures have inherent limitations, as they do not reflect all amounts associated with our results of operations under IFRS. Accordingly, this measure should be used only in conjunction with the most directly comparable IFRS financial measure.
We believe that providing a reconciliation of this non‑IFRS financial measure to its most directly comparable IFRS measure helps investors better understand our underlying loan portfolio performance and enhances comparability across periods.
Neutral-Exchange Rate Loan Growth
We believe that Neutral-Exchange Rate Loan Growth provides useful information to both Management and investors by excluding the foreign currency exchange rate impact that may not be indicative of the core dynamics of our loan portfolio. In addition, during the first quarter of 2025, our consolidated balance sheet was impacted by an update to the exchange rate used to translate BCP Bolivia’s balance sheet published on March 14, 2025 in Circular No. 857/2025 issued by the Financial System Supervisory Authority of Bolivia (ASFI), which significantly changed the rates at which Bolivian financial institutions can buy or sell U.S. dollars. The Neutral‑Exchange Rate Loan Growth measure presented excludes both the impact associated with the change in the exchange rate used in Bolivia and also the effects of the depreciation of the U.S. dollar against the PEN in 2025, providing a view of underlying loan portfolio growth trends in local currency excluding the impacts of changes in foreign exchange rates. For clarity, aside from the Bolivia exchange rate change and the U.S. dollar–PEN depreciation in Peru, this calculation does not neutralize the effects of movements in any other foreign currencies.
The Neutral-Exchange Rate Loan Growth measures were calculated by using the year-end foreign exchange rates for 2024 and applying them to the corresponding year-end balances for 2025, so as to calculate what our loan balance would have been had exchange rates remained stable from one year to the next.
The following table sets forth the Neutral-Exchange Rate Loan Growth for year ended December 31, 2025:
| | | | | | | | | | | | | | | | | | | | | | | |
Total Loans
| Year Ended on December 31, |
| As reported | Percentage Change
| FX Neutral Measures | As reported | Percentage Change
| Reconciliation |
| 2025 | 2024 | 2025 | 2024 | 2025 |
| (In millions, except percentages) | (In millions, except percentages) | (In millions) |
| Wholesale Banking | 54,142 | 53,525 | 1.2% | 57,775 | 53,525 | 7.9% | 3,633 |
| Corporate | 31,958 | 31,388 | 1.8% | 34,067 | 31,388 | 8.5% | 2,109 |
| Middle-Market | 22,184 | 22,136 | 0.2% | 23,708 | 22,136 | 7.1% | 1,524 |
| Retail Banking | 69,501 | 65,014 | 6.9% | 70,513 | 65,014 | 8.5% | 1,012 |
| SME-Business | 8,434 | 8,185 | 3.0% | 8,871 | 8,185 | 8.4% | 437 |
| SME-Pyme | 16,735 | 16,163 | 3.5% | 16,750 | 16,163 | 3.6% | 15 |
| Mortgage | 23,822 | 21,838 | 9.1% | 24,007 | 21,838 | 9.9% | 185 |
| Consumer | 14,074 | 12,866 | 9.4% | 14,326 | 12,866 | 11.3% | 252 |
| Credit Card | 6,437 | 5,962 | 8.0% | 6,559 | 5,962 | 10.0% | 122 |
| Others | 1,558 | 2,032 | (23.4)% | 1,674 | 2,032 | (17.6)% | 116 |
| BCP Stand-Alone | 125,201 | 120,571 | 3.8% | 129,963 | 120,571 | 7.8% | 4,762 |
| Credicorp | 149,985 | 145,732 | 2.9% | 158,065 | 145,732 | 8.5% | 8,080 |
(5)Financial Position
5.1Total Assets
The following table shows changes to the principal assets of Credicorp from 2023 through 2025:
| | | | | | | | | | | | | | | | | | | | | | | | | | |
| | As of and for the year ended on December 31, | | |
| | 2023 | | 2024 | | 2025 | | 2025 - 2024 |
| | (in millions of Soles) | | % Change |
| Cash and due from banks | | 33,931 | | | 47,655 | | | 49,044 | | | 2.9 | |
| Cash collateral, reverse repurchase agreements and securities borrowings | | 1,411 | | | 1,033 | | | 2,177 | | | 110.7 | |
| Investments: | | | | | | | | |
| At fair value through profit or loss | | 4,983 | | | 4,715 | | | 4,957 | | | 5.1 | |
| At fair value through other comprehensive income | | 37,044 | | | 40,143 | | | 39,034 | | | (2.8) | |
| Amortized cost | | 10,189 | | | 8,968 | | | 8,814 | | | (1.7) | |
| Net loans | | 136,698 | | | 137,737 | | | 142,315 | | | 3.3 | |
| Other assets (1) | | 14,584 | | | 15,838 | | | 21,022 | | | 32.7 | |
| Total assets | | 238,840 | | | 256,089 | | | 267,363 | | | 4.4 | |
(1)Includes financial assets designated at fair value through profit or loss, reinsurance contract assets, property, furniture and equipment net, deferred income tax asset, due from customers on banker’s acceptances, intangible assets and goodwill, and other assets. Also included is the claim filed with the tax authority issued by SUNAT to Grupo Crédito on June 27, 2025, in the amount of S/1,568.0 million, together with accrued interest from the date of issuance of such resolutions up to the settlement date, amounting to S/9.2 million.
As of December 31, 2025, Credicorp had total assets of S/267.4 billion, an increase of 4.4% as compared to the total assets of S/256.1 billion in 2024. In 2023 total assets equalled S/238.8 billion.
As of December 31, 2025, our total loans, which correspond to direct loans, including accrued interest and excluding unearned interest, equalled S/150.0 billion, which represented 56.1% of total assets. Loans, net of allowance for loan losses, totaled S/142.3 billion in 2025, representing an increase of 3.3% from 2024. As of December 31, 2024, total loans totaled S/145.7 billion, representing 56.9% of total assets, and net of allowance for loan losses totaled S/137.7 billion. As of December 31, 2023, total loans totaled S/145.0 billion, representing 60.7% of total assets, and net of allowance for loan losses totaled S/136.7 billion.
Our total deposits with the BCRP increased to S/36,718.6 million as of December 31, 2025, from S/36,665.5 million as of December 31, 2024. As of December 31, 2025, 2024 and 2023, our securities holdings include investments at fair value through profit or loss, investments at fair value through other comprehensive income and amortized cost investments, which amount to S/52,804.9 million, S/53,825.9 million and S/52,215.5 million, respectively.
•Loan evolution
| | | | | | | | | | | | | | | | | | | | | | | | | | | | | | | | | | | | | | | | | | | | |
| | 2023 | | 2024 | | 2025 | 2025 | 2025 - % | | 2024 - % |
Total year-end
balances | | (in millions of Soles) | % Change | Local Currency (1) | | Foreign Currency(2) | | Local Currency (1) | | Foreign Currency(2) |
| BCP Stand-alone (3) | | 119,425 | | | 120,571 | | | 125,201 | | 3.8 | | 68.1 | | | 31.9 | | | 67.8 | | | 32.2 | |
| Mibanco | | 13,269 | | | 12,239 | | | 13,607 | | 11.2 | | 99.9 | | | 0.1 | | | 99.9 | | | 0.1 | |
| Bolivia | | 9,402 | | | 9,939 | | | 7,552 | | (24.0) | | 0.0 | | | 100.0 | | | 0.0 | | | 100.0 | |
| ASB Bank Corp. | | 2,150 | | | 1,802 | | | 1,462 | | (18.9) | | 0.0 | | | 100.0 | | | 0.0 | | | 100.0 | |
| Others (4) | | 730 | | | 1,181 | | | 2,163 | | 83.1 | | N/A | | N/A | | N/A | | N/A |
| Total loans | | 144,976 | | | 145,732 | | | 149,985 | | 2.9 | | 65.5 | | | 34.5 | | | 63.9 | | | 36.1 | |
(1)Peruvian Sol is considered local currency.
(2)Includes mainly US dollar currency and other foreign currencies (BOB, COP, and CLP).
(3)Includes BCP Panama and BCP Miami.
(4)Includes Tenpo Payment, SEAH and eliminations for Credicorp’s consolidation purposes.
The increase of 2.9% (+8.5% at a Neutral Exchange Rate12) of Credicorp’s total loans from 2024 to 2025 was led by BCP Stand-alone (+3.8%), followed by Mibanco (+11.2%), as both results were bolstered by economic reactivation throughout the year. At Mibanco, loans increased on the back of an increase in disbursements, which began to gain traction in the last quarter of 2024. Mibanco Colombia also contributed to this increase, where loans continued to register significant recovery thanks to both the adjustments to origination guidelines implemented last year and a more favorable environment for microfinance.
The following table shows the composition of Credicorp’s loan portfolio for loans issued in local currency in year-end balances:
| | | | | | | | | | | | | | | | | | | | | | | | | | |
| | 2023 | | 2024 | | 2025 | | 2025 - 2024 |
Local currency year-end
balances | | (In millions of Soles) | | % Change |
| BCP Stand-alone | | 80,376 | | | 81,744 | | | 85,270 | | | 4.3 | % |
| Mibanco | | 13,252 | | | 12,227 | | | 13,598 | | | 11.2 | % |
The following table shows the composition of Credicorp’s loan portfolio in foreign currency in year-end balances:
| | | | | | | | | | | | | | | | | | | | | | | | | | |
| | 2023 | | 2024 | | 2025 | | 2025 - 2024 |
| Foreign currency year-end balances | | (In millions US Dollars) | | % Change |
| BCP Stand-alone | | 10,528 | | | 10,315 | | | 11,873 | | | 15.1 | |
| Mibanco | | 5 | | | 3 | | | 3 | | | — | |
| BCP Bolivia | | 2,535 | | | 2,641 | | | 2,246 | | | (15.0) | |
| ASB Bank Corp. | | 580 | | | 479 | | | 435 | | | (9.2) | |
The following table shows the composition of BCP’s loan portfolio, measured in end-of-year balances:
| | | | | | | | | | | | | | | | | | | | | | | | | | | | | | | | | | | | | | |
| | As of and for the year ended on December 31, | | | | | | |
| | 2023 | | 2024 | | 2025 | | 2024 - 2023 | | 2025 - 2024 | | 2025 - 2024 |
| | (in millions of Soles) | | % Change | | % Change | | % Change FX Neutral (1) |
| Wholesale Banking | | 53,235 | | | 53,525 | | | 54,142 | | | 0.5 | % | | 1.2 | % | | 7.9 | % |
| Corporate | | 31,144 | | | 31,388 | | | 31,958 | | | 0.8 | % | | 1.8 | % | | 8.5 | % |
| Middle-Market | | 22,091 | | | 22,136 | | | 22,184 | | | 0.2 | % | | 0.2 | % | | 7.1 | % |
| Retail Banking | | 64,220 | | | 65,014 | | | 69,501 | | | 1.2 | % | | 6.9 | % | | 8.5 | % |
| SME-Business | | 7,780 | | | 8,185 | | | 8,434 | | | 5.2 | % | | 3.0 | % | | 8.4 | % |
| SME-Pyme | | 16,652 | | | 16,163 | | | 16,735 | | | (2.9 | %) | | 3.5 | % | | 3.6 | % |
| Mortgage | | 20,995 | | | 21,838 | | | 23,822 | | | 4.0 | % | | 9.1 | % | | 9.9 | % |
| Consumer | | 12,771 | | | 12,866 | | | 14,074 | | | 0.7 | % | | 9.4 | % | | 11.3 | % |
| Credit card | | 6,022 | | | 5,962 | | | 6,437 | | | (1.0 | %) | | 8.0 | % | | 10.0 | % |
| Others | | 1,971 | | | 2,032 | | | 1,558 | | | 3.1 | % | | (23.3 | %) | | (17.6 | %) |
| BCP Stand-alone | | 119,426 | | | 120,571 | | | 125,201 | | | 1.0 | % | | 3.8 | % | | 7.8 | % |
(1)Excludes the depreciation of the USD against PEN, calculated at a constant exchange rate based on the Peruvian Superintendence of Banks, Insurance and Pension Funds (SBS) information. Please, refer to Non-GAAP Measures of Financial Performance section in Item 5 - 5A - (4) Historical Discussion and Analysis.
12 It excludes the impact of both a non-cash accounting adjustment at BCP Bolivia and the depreciation of the USD against PEN, which was calculated at a constant exchange rate based on the Peruvian Superintendence of Banks, Insurance and Pension Funds (SBS) information. For more information about the non-cash accounting adjustment at BCP Bolivia, please refer to Non-GAAP Measures of Financial Performance section in Item 5 - 5A - (4) Historical Discussion and Analysis and to Note 30, 30.2, (ii) to the consolidated financial statements.
In 2025, the increase in total loans at BCP Stand-Alone, measured at a neutral exchange rate13 (+7.8%), was primarily attributable to an increase in the loan portfolio of Retail Banking (+8.5%), followed by Wholesale Banking (+7.9%), in line with the following main dynamics:
•Mortage’s end-of-year balances rose S/2,168.7 million, or 9.9%, from 2024 to 2025. This evolution was fueled by an increase in the demand for loans in a context marked by more favorable macroeconomic conditions and interest rates that remained low.
•Consumer’s end-of-year balances rose S/1,460.0 million, or 11.3%, from 2024 to 2025. This evolution was driven by growth in disbursements, which was fueled mainly by an increase in the appetite for risk at BCP Stand-Alone and secondarily by an uptick in disbursements through Yape.
•SMEs’ end-of-year balances, which include SME-Business and SME-Pyme, rose S/1,273.5 million, or 5.2%, from 2024 to 2025. In SME-Business, end-of-year balances increased S/686.2 million, or 8.4%, mainly due to growth in disbursements of negotiable invoices. In SME-Pyme, end-of-year balances increased S/587.2 million, or 3.6%, mainly due to growth in disbursements of working capital loans.
•Wholesale Banking’s end-of-year balances, which include the Middle Market and Corporate Banking segments, rose S/4,250.2 million, or 7.9%, from 2024 to 2025. Corporate Banking was the largest contributor to this growth, driven primarily by an uptick in disbursements of medium and long-term loans as businesses showed a larger appetite for borrowing in a more favorable economic environment marked by recovery in private investment.
•Portfolio quality14
In terms of portfolio quality, our internal overdue ratio (which includes loans under legal collection) was 3.21% at the end of 2025, 51 bps lower than the 3.72% ratio recorded at the end of 2024 (and 4.23% at the end of 2023). The non-performing loan ratio decreased by 71 bps to 4.55% in 2025 from 5.26% in 2024 (representing a decrease of 63 bps in 2024 from 5.89% in 2023). This was mainly due to a decline of overdue and refinanced loans, which was primarily driven by fortified risk management and backed by improvements in the Peruvian economy and payment performance at both BCP and Mibanco.
An analysis of the non-performing loan ratio by class shows that:
•Wholesale Banking: An improvement of 86 bps was registered, situating its non-performing loan ratio at 1.62% compared to 2.49% in 2024. This improvement was driven by a decrease in non-performing loan balances, fueled mainly by the debt cancellation of two corporate clients in the Construction and Transportation sectors, and one refinanced client in the real estate sector.
•SME-Business: An improvement of 68 bps was registered, situating its non-performing loan ratio at 9.94% compared to 10.62% in 2024. This improvement was driven by a decrease in non-performing loan balances, which reported a drop in refinance loans after improvements in debt collection management led to stronger recoveries.
•SME-Pyme: An improvement of 127 bps was registered, situating its non-performing loan ratio at 12.03% compared to 13.30% in 2024. This improvement was driven by a decrease in non-performing loan balances, fueled by a drop in overdue loans via debt repayments by clients with loans under judicial recovery.
•Mortgage: An improvement of 26 bps was registered, situating its non-performing loan ratio at 3.49% versus 3.75% in 2024. This improvement was propelled by loan growth, partially offset by a slight increase in non-performing loan balances.
13 See also Non-GAAP Measures of Financial Performance in Item 5 - 5A - (4) Historical Discussion and Analysis.
14 BCP's segmentation criteria have been updated and historical information restated to ensure comparability and better alignment with managerial reporting standards.
•Consumer and Credit Cards: Consumer registered an improvement of 104 bps, situating its non-performing loan ratio at 5.60% compared to 6.63% in 2024, while Credit Cards posted a 54bps improvement, situating its non-performing loan ratio at 4.12% compared to 4.66% in 2024. These results were mainly driven by an increase in loan volumes and, secondarily, by a decrease in non-performing loan balances thanks to an improvement in the quality of origination and in collections management and backed by a more favorable economic backdrop.
•Mibanco: An improvement of 216 bps was registered, situating its non-performing loan ratio at 5.27% compared to 7.43% in 2024. This improvement was propelled by a decrease in non-performing loan balances, fueled by a decrease in overdue loans, which was driven by a more cautious approach to origination and improvements in collections management in play since 2024.
•BCP Bolivia: A deterioration of 38 bps was registered, situating its non-performing loan ratio at 3.69% compared to 3.32% in 2024. This deterioration was driven by a contraction in the loan portfolio.
It is important to keep in mind that traditional delinquency ratios such as internal overdue loan and non-performing loan ratios continue to be affected by the presence of loans with real estate collateral (commercial and residential properties). This means that a significant portion of loans that are more than 150 days past due cannot be written off (despite the fact that provisions have been set aside) without initiating a judicial process to liquidate the collateral, which may take several years to conclude.
The Coverage ratio of non-performing loans increased from 104.3% in 2024 to 112.4% at the end of 2025. This growth was mainly driven by a decrease in the non-performing loans portfolio across segments at BCP, followed by Mibanco, as described above.
5.2Total Liabilities
| | | | | | | | | | | | | | | | | | | | | | | | | | |
| | As of and for the year ended
on December 31, | | |
| | 2023 | | 2024 | | 2025 | | 2025 - 2024 |
| | (In millions of Soles) | | % Change |
| Time deposits | | 41,290 | | | 44,116 | | | 40,362 | | | (8.5) | |
| Demand deposits | | 48,229 | | | 52,591 | | | 57,052 | | | 8.5 | |
| Saving deposits | | 52,376 | | | 59,758 | | | 67,812 | | | 13.5 | |
| Severance indemnity deposits | | 3,186 | | | 2,996 | | | 3,193 | | | 6.6 | |
| Bank's negotiable certificates | | 1,195 | | | 1,101 | | | 982 | | | (10.8) | |
| Interest payable | | 1,429 | | | 1,280 | | | 1,001 | | | (21.8) | |
| Total deposits | | 147,705 | | | 161,842 | | | 170,402 | | | 5.3 | |
| | | | | | | | |
| Payables from repurchase agreements and security lending | | 10,168 | | | 9,061 | | | 8,244 | | | (9.0) | |
| Due to banks and correspondents | | 12,279 | | | 10,754 | | | 10,675 | | | (0.7) | |
| Bonds and notes issued | | 14,595 | | | 17,268 | | | 14,026 | | | (18.8) | |
| Other liabilities (1) | | 20,986 | | | 22,187 | | | 24,919 | | | 12.3 | |
| Total liabilities | | 205,733 | | | 221,112 | | | 228,266 | | | 3.2 | |
(1)As of December 31, 2025, 2024, and 2023 includes banker’s acceptances outstanding, lease liabilities, financial liabilities at fair value through profit or loss, insurance contract liability, deferred tax liabilities, net, and other liabilities.
As of December 31, 2025, liabilities totaled S/228.3 billion, a 3.2% increase from S/221.1 billion as of December 31, 2024. As of December 31, 2023, total liabilities were S/205.7 billion.
As of December 31, 2025, total deposits were S/170.4 billion, a 5.3% increase from S/161.8 billion on December 31, 2024. The increase in 2025 was primarily due to an increase in the Savings Deposit balance (+13.5%), which was driven primarily by Retail clients at BCP, which was attributable to inflows from pension funds withdrawals and improvements in
our transactional offerings, which has enabled us to attract inflows. This increase was also driven, to a lesser extent, by Demand Deposits (+8.5%), due to pension funds withdrawals.
According to the SBS, as of December 31, 2025, Credicorp (Mibanco and BCP) accounted for 42.3% of total savings deposits, 38.8% of total demand deposits, 25.2% of total time deposits, and 35.5% of total deposits in the Peruvian banking system, the highest of any Peruvian bank in all these types of deposits. In addition, as of December 31, 2025, we were in possession of 35.1% of the entire Peruvian banking system’s severance indemnity deposits.
As of December 31, 2025, our total due to banks and correspondents was S/10.7 billion, representing a 0.7% decrease from S/10.8 billion as of December 31, 2024, which in turn represented an decrease of 12.4% from S/12.3 billion on December 31, 2023. This evolution is attributable to a greater prominence of funding from deposits.
As of December 31, 2025, our total bonds and notes issued were S/14.0 billion, a 18.8% decrease from S/17.3 billion as of December 31, 2024 (the end of period balance of 2024 represented a 18.3% increase from S/14.6 billion in 2023). The decrease in 2025 was attributable to the expiration of BCP bonds, which occurred during the year.
As of December 31, 2025, our payables from repurchase agreements and securities lending were S/8.2 billion, a 9.0% decrease from S/9.1 billion as of December 31, 2024 (the end of period balance of 2024 represented a 10.9% decrease from S/10.2 billion as of December 31, 2023). During 2025, the balance of BCRP instruments decreased, primarily in BCP Stand-alone, driven by lower supply of repo financing from BCRP, given the ample liquidity in the market.
5.2.1Funding Structure
At the end of 2025, Credicorp’s total funding was S/203.3 billion, which represents a 2.2% increase as compared to S/198.9 billion at the end of 2024.
Credicorp’s funding structure shows an increase in total deposits throughout 2025, due to an uptick in low-cost deposits (demand deposits and saving deposits), given high levels of liquidity in the market. At the end of 2025, deposits accounted for 83.8% share of total funding, as compared to 81.4% at the end of 2024 (and 79.9% at the end of 2023).
The increase in deposits was mainly associated with savings deposits and demand deposits, which increased their share of the deposits mix (73.3% at the end of 2025, as compared to 69.4% in 2024 and 68.1% in 2023). On the other hand, time deposits decreased 8.5% at the end of 2025, compared to an increase of 6.4% in 2024 and 9.2% in 2023.
With respect to other funding sources, the balance of Bonds and notes issued posted a decline and represented 6.9% of total funding as of December 31, 2025 (compared to 8.7% and 7.9% of total funding on December 31, 2024 and December 2023, respectively). This decrease was due to the maturity of BCP bonds during 2025.
5.3Total Equity
| | | | | | | | | | | | | | | | | | | | | | | | | | |
| | As of and for the year ended on December 31, |
| | 2023 | | 2024 | | 2025 | | 2025 - 2024 |
| | in millions of Soles | | % Change |
| Capital stock | | 1,319 | | | 1,319 | | | 1,319 | | | - | |
| Treasury stock | | (208) | | | (209) | | | (210) | | | 0.5 | |
| Capital surplus | | 228 | | | 176 | | | 149 | | | (15.3) | |
| Reserves and others | | 26,549 | | | 27,417 | | | 30,193 | | | 10.1 | |
| Retained earnings | | 4,572 | | | 5,643 | | | 6,916 | | | 22.6 | |
| Equity before non-controlling interest | | 32,460 | | | 34,346 | | | 38,367 | | | 11.7 | |
| Non-controlling interest | | 647 | | | 631 | | | 729 | | | 15.5 | |
| Total equity | | 33,107 | | | 34,977 | | | 39,096 | | | 11.8 | |
As of December 31, 2025, our total equity was S/39.1 billion, which represented an 11.8% increase from S/35.0 billion as of December 31, 2024.
During 2023, 2024 and 2025, we had 94,382,317 issued shares each at US$5.00 par value.
As provided in Note 16 to our consolidated financial statements, on December 31, 2025, 15,015,729 of our issued shares were treasury stock. The term "treasury stock," as used in this Annual Report and our consolidated financial statements, follows the IFRS definition of treasury stock, which includes (i) shares acquired and held by subsidiaries and members of the consolidated group and (ii) shares sold, issued or cancelled in connection with employee share option plans, employee share purchase plans and all other share-based payments arrangements. The term “treasury stock” is not related to the term "treasury shares" as used under the Companies Act 1981 of Bermuda, which defines “treasury shares” (in Section 42B of such Act) as shares that (i) were (or are treated as having been) acquired directly by the company that issued the shares and have not been cancelled and (ii) have been continuously held by the company since they were acquired. Credicorp is not allowed to hold "treasury shares" as such term is used under Bermuda Law. Under Bermuda law, a company cannot (i) exercise any rights with respect to treasury shares, including any right to attend and vote at meetings or (ii) pay dividends with respect to treasury shares.
The following table presents our treasury stock as of December 31, 2025:
| | | | | | | | | | | | | | | | | | | | | | | | | | | | | | | | | | | | | | |
| | As of and for the year ended on December 31, 2025 |
| | Shares of the Group | | Shared-based
payment (1) | | Total Treasury stock |
| | Soles in
thousands | | Units | | Soles in
thousands | | Units | | Soles in
thousands | | Units |
| Atlantic Security Holding Corporation | | 204,326 | | | 14,620,846 | | | - | | | - | | | 204,326 | | | 14,620,846 | |
| Atlantic Security International Financial Services | | - | | | - | | | 3,151 | | | 225,456 | | | 3,151 | | | 225,456 | |
| BCP | | - | | | - | | | 1099 | | | 78,670 | | | 1099 | | | 78,670 | |
| Grupo Crédito | | - | | | - | | | 484 | | | 34,664 | | | 484 | | | 34,664 | |
| Pacífico Seguros | | - | | | - | | | 211 | | | 15,113 | | | 211 | | | 15,113 | |
| Mibanco | | - | | | - | | | 141 | | | 10,079 | | | 141 | | | 10,079 | |
| ASB Bank Corp | | - | | | - | | | 109 | | | 7,828 | | | 109 | | | 7,828 | |
| Credicorp Capital Servicios Financieros | | - | | | - | | | 109 | | | 7,803 | | | 109 | | | 7,803 | |
| Prima AFP | | - | | | - | | | 35 | | | 2,539 | | | 35 | | | 2,539 | |
| Other subsidiaries | | - | | | - | | | 180 | | | 12,731 | | | 180 | | | 12,731 | |
| Total | | 204,326 | | | 14,620,846 | | | 5,519 | | | 394,883 | | | 209,845 | | | 15,015,729 | |
(1)This mainly relates to treasury stocks acquired by the Group in order to cover the obligations of the share‑based compensation and retention program. Such stocks include those granted to employees and senior management which, as of the reporting date, have not yet vested in accordance with the terms and conditions of the program. For further detail refer to Note 16 to the consolidated financial statements and ITEM 7. MAJOR SHAREHOLDERS AND RELATED PARTY TRANSACTIONS – 7. A Major Shareholders.
At meetings held on February 27, 2025, April 27, 2024 and April 27, 2023, the Board of Directors approved the transfer of S/5,637.7 million, S/1,778.8 million and S/2,593.6 million, respectively, from “Retained earnings” to “Reserves”.
In 2025, Credicorp paid cash dividends, net of the effect of treasury stock, of approximately US$875.8 million (equivalent to approximately S/3,181.5 million, respectively). During 2024, Credicorp paid cash dividends, net of the effect of treasury stock, of approximately US$739.9 million and US$232.3 million (equivalent to approximately S/2,788.7 million and S/875.9 million, respectively). For 2025, cash dividend payouts per share totaled US$11.0 (equivalent to S/40.0, respectively). In 2024, cash dividend payouts per share totaled US$9.3 and US$2.9 (equivalent to S/35.0 and S/11.0, respectively). In accordance with current Peruvian legislation, there is no restriction for overseas remittance of
dividends or the repatriation of foreign investment. As of December 31, 2025 and 2024, dividends paid by our Peruvian subsidiaries to Credicorp were subject to a 5.0% withholding tax.
For further detail about 2024 and 2023 evolution please refer to Credicorp’s previous 2024 20-F document, see “ITEM 5. OPERATING AND FINANCIAL REVIEW AND PROSPECTS – 5.A. Operating results – (5) Financial Position. – 5.3 Equity.”
5.4Off-Balance Sheet Arrangements
We record various contractual obligations as liabilities in our consolidated financial statements. We do not recognize other contractual arrangements, such as off-balance-sheet exposures, as liabilities in our consolidated financial statements. These other contractual arrangements are required to be registered in off-balance-sheet accounts. We enter into these off-balance-sheet arrangements in the ordinary course of business to provide support to our clients and to hedge risks in our statement of financial position, including through use of guarantees, letters of credit, derivatives and swaps.
The following table reflects our off-balance sheet arrangements as of December 31, 2023, 2024 and 2025:
| | | | | | | | | | | | | | | | | |
| As of December 31, |
| 2023 | | 2024 | | 2025 |
| (in thousands of Soles) |
| Off-balance-sheet exposure | | | | | |
| Guarantees and stand-by letters | 17,737,645 | | | 19,557,938 | | | 18,815,322 | |
| Import and export letters of credit | 2,313,970 | | | 2,581,383 | | | 2,451,835 | |
| Sub Total | 20,051,615 | | | 22,139,321 | | | 21,267,157 | |
| | | | | |
| Responsibilities under credit line agreements (*) | 87,091,701 | | | 85,269,774 | | | 80,250,985 | |
| | | | | |
| Derivatives (notional amount) | | | | | |
| Interest rate swaps | 18,250,519 | | | 48,909,869 | | | 53,516,248 | |
| Forwards | 32,261,233 | | | 33,978,249 | | | 32,730,887 | |
| Currency swaps | 12,895,649 | | | 13,625,101 | | | 10,928,546 | |
| Cross currency swaps | 1,244,113 | | | 1,172,830 | | | — | |
| Options | 501,189 | | | 743,202 | | | 842,734 | |
| Cross interest rate swaps | 556,350 | | | 564,600 | | | 504,450 | |
| Futures | 40,428 | | | 23,713 | | | 38,338 | |
| Sub Total | 65,749,481 | | | 99,017,564 | | | 98,561,203 | |
| | | | | |
| Total | 172,892,797 | | | 206,426,659 | | | 200,079,345 | |
(*)Lines of credit include consumer loans and other consumer credit facilities (credit card receivables) granted to customers, which are cancelable upon prior notice to the customer.
In the normal course of business, our banking subsidiaries are parties to transactions with off-balance-sheet risk. These transactions expose them to additional credit risks relative to amounts recognized in the consolidated statements of financial position.
Credit risk for off-balance sheet financial instruments is defined as the possibility of sustaining a loss as a result of any other party to a financial instrument failing to perform in accordance with the terms of the contract. The exposures to losses are represented by the contractual amount specified in the related contracts. We apply the same credit policies in making commitments and conditional obligations as we do for on-balance sheet instruments (see Note 18(a) of the consolidated financial statements), including the requirement to obtain collateral when necessary. The type and amount of collateral held varies, but may include deposits in financial institutions, securities or other assets. Many contingent transactions are expected to expire without any performance being required. Therefore, the total committed amounts do not necessarily represent future cash requirements.
Credicorp has currency-forwards derivatives. Currency-forwards are commitments to buy or sell currency at a future date at a contracted price. Risk arises from the possibility that the counterparty to the transaction will not perform as agreed and from the changes in the prices of the underlying currencies. As of December 31, 2025, and 2024, the nominal amounts for forward currency purchase and sale agreements amounted to approximately S/212.1 million and S/261.8 million for hedging derivatives, and to S/32,518.7 million and S/33,716.5 million for trading derivatives, which in general have maturities of less than one year, respectively.
These agreements are entered into to satisfy client requirements and are recognized in the consolidated financial statements at their fair value. As of December 31, 2025, and 2024, the forward contracts’ net position expressed in soles was approximately S/13,858.5 million and S/(33,537.4) million, respectively.
Credicorp’s swap contracts include interest rate and currency swap contracts, as well as cross-currency swap contracts. Interest rate and currency swap contracts are derivatives contracts, where counterparties exchange variable interest rates for fixed interest rates or different currencies, respectively, in the terms and conditions established at the contract’s inception. The risk arises each time the projected level of the variable rate during the term of the contract is higher than the swap rate, as well as from non-compliance with contractual terms by one of the parties. As of December 31, 2025, the notional amount of open interest rate and currency swap contracts was approximately S/64,444.8 million, compared to approximately S/62,535.0 million as of December 31, 2024, see Note 12(c) to the consolidated financial statements.
Cross-currency swap contracts involve the exchange of interest payments based on two different currency principal balances and referenced interest rates. They generally also include the exchange of principal amounts at the start and end of the contract. The notional amount of outstanding cross‑currency swap contracts was zero as of December 31, 2025, compared to approximately S/1,172.8 million as of December 31, 2024. See Note 12(c) to the consolidated financial statements.
As of December 31, 2025, the fair values of the asset and liability forward-exchange contracts, options, futures and interest rate and cross-currency swaps amounted to approximately S/1,231.9 million and S/1,047.9 million, respectively (compared to approximately S/904.8 million and S/819.5 million as of December 31, 2024) and are included under the “Other assets and other liabilities” section of the consolidated statements of financial position, respectively, see Note 12(c) to the consolidated financial statements.
(6)Lines of Business (LoBs)
6.1Universal Banking
6.1.1BCP Stand-alone
Asset Structure
At the end of 2025, BCP Stand-alone’s total assets amounted to S/204.9 billion, which represents a 3.8% increase compared to S/197.5 billion in 2024 (and S/180.9 billion in 2023). The increase in total assets in 2025 was mainly driven by a higher balance of loans in end-of-year balances, which rose 3.8% to S/125.2 billion in 2025, compared to S/120.6 billion in 2024 and S/119.4 billion in 2023.
This increase was driven primarily by higher loan disbursements in Retail Banking —particularly in the Individuals segment— and, secondarily, by an uptick in disbursements of medium and long-term loans in Wholesale Banking at BCP Stand-Alone. For analysis of Credicorp’s loan portfolio, please see “Item 5.A Operating results – (5) Financial position – 5.1 Total Assets – Loan evolution”.
For further analysis of our asset structure, please see “Item 5.A Operating results – (5) Financial position – 5.1 Total Assets”.
Portfolio Quality
The internal overdue loan ratio at BCP Stand-alone decreased to 3.11% in 2025, compared to 3.53% in 2024 (which represented a decline from 4.17% in 2023). This improvement was mainly driven by Wholesale and SME segments. For
analysis of Credicorp’s non-performing loan ratios by business segment, see the second paragraph of “Item 5.A Operating results – (5) Financial position – 5.1 Total Assets – Portfolio quality”.
BCP Stand-alone’s provisions for credit losses on loan portfolio, net of recoveries, decreased by 38.5% from 2024 to 2025 (compared to the 3.0% decrease from 2023 to 2024), which was driven primarily by a decrease in provisions for Individuals and, to a lesser extent, for SMEs. In this context, BCP Stand-alone’s cost of risk was 1.28% in 2025 (in comparison to 2.13% and 2.17% in 2024 and 2023, respectively). For analysis of Credicorp’s provisions by business segment, see “Item 5.A Operating results – (4) Historical Discussion and Analysis – 4.3.2 Provisions for Loan Losses”.
Funding Structure
At the end of 2025, BCP Stand-alone’s total funding increased by 2.6% (from S/165.8 billion in 2024 to S/170.2 billion in 2025), driven primarily by an uptick in Deposits, which rose by 6.8% (+11.7 from 2023 to 2024).
Total deposits rose to S/146.1 billion (as compared to S/136.8 billion in 2024, which represented an increase from S/9.3 billion). The increase was mainly driven by savings deposits, which increased 14.8%. In 2024, total deposits rose 11.7% from S/122.4 billion in 2023.
Financial Ratios
BCP Stand-alone’s net earnings contribution to Credicorp totaled S/5,907.6 million in 2025, which represented an increase of 20.8% compared to S/4,889.1 million reported in 2024. In 2024, the net earnings contribution to Credicorp grew 14.2%, from S/4,280.8 in 2023. This evolution was the result of a higher net interest income, fueled by a lower cost of funding amid lower interest rates and an increasing share of low-cost deposits in the funding mix. Meanwhile, the yield on Interest-earning assets declined due to the impact of lower interest rates.
BCP Stand-alone’s ROAE contribution to Credicorp was 24.7% in 2025 (compared to 22.0% in 2024 and 20.6% in 2023). The higher contribution in 2025 reflects a reduction in provisions and diversified revenue streams.
NIM stood at 5.8% in 2025, representing a decrease of 16 bps with regard to a 2024 NIM of 6.0% (In 2023, NIM stood at 5.7%). This decline was due mainly to lower interest rates, and was partially offset by a lower cost of funding.
In 2025, the efficiency ratio at BCP Stand-alone stood at 39.7% (versus 39.3% in 2024 and 38.8% in 2023). This was a result of growth in operating expenses which were driven by an increase in headcount and in provisions for variable compensation in core businesses. IT expenses stemming from growth in specialized personnel, expenses for licenses and third-party services, were a secondary driver of BCP’s operating expenses.
6.1.2BCP Bolivia
Asset Structure
By the end of 2025, BCP Bolivia’s total assets amounted to S/10.9 billion, which represents a 22.3% decrease compared to S/14.0 billion in 2024. The decrease in Bolivia’s loan portfolio was approximately 23.9%. At the same time, temporary and permanent investments decreased by 31.3%. Adjusting for variations in the Peruvian Sol to the Boliviano exchange rate, in 2025 total assets would have increased by 6.7%, the loan portfolio would have increased by 4.5%, and temporary and permanent investments would have decreased by 5.6%.
For further analysis of our asset structure, please see “Item 5.A Operating results – (5) Financial position – 5.1 Total Assets – Loan evolution”.
Portfolio Quality
The past-due ratio has decreased from 2.75% in 2024 to 2.58% in 2025.
Funding Structure
By the end of 2025, BCP Bolivia decreased its total liabilities by 22.5%, in comparison to the 2.8% increase in 2024. This includes a decrease in total customer deposits of 22.7%. Adjusting for variations in the Peruvian Sol to Boliviano exchange rate, total liabilities would have increased by 6.4% and total deposits would have increased by 6.1%.
Net profit
BCP Bolivia’s net profit amounted to S/85.9 million in 2025, which represents a 8.2% decrease compared to S/93.5 million in 2024. Adjusting for variations in the Peruvian Sol to Boliviano exchange rate, the increase would have been 49.5%.
For further information on exchange rate exposure, see “ITEM 11. QUANTITATIVE AND QUALITATIVE DISCLOSURES ABOUT RISK MANAGEMENT – Foreign Currency Exchange Rate Risk”.
6.2Microfinance
6.2.1Mibanco Peru
Asset Structure
Total assets at Mibanco were S/18.4 billion as of December 31, 2025, which represented an increase of 8.3% from S/16.9 billion as of December 31, 2024 (and an increase of 8.7% from S/16.9 billion as of December 31, 2023). The 8.3% increase in total assets in 2025 is due to sustained growth of the bank's loan portfolio during the year.
On December 31, 2025, Mibanco’s loans totaled S/13.6 billion, which represents an increase of 11.2% compared to 2024 (compared to 7.8% decrease from 2023 to 2024). This increase was driven by the small business segment, which registered a growth of 24.7% in loans in 2025. The Microbusiness segment, in contrast, reported a 29.8% decrease in its loan level in 2025. Likewise, loans in our focus segment S/0-150 thousand (mainly micro and small business) increased their share of total loans in 2025, with shares of 83.0% (as compared to 81.3% and 81.0% in 2024 and 2023, respectively). Finally, Mibanco’s loan portfolio represented 73.7% of total interest-earning assets in 2025 (as compared to 71.8% in 2024 and 78.2% in 2023).
Cash and investments increased by 1.3% in 2025 (as compared to an increase of 29.2% in 2024 from 2023). We slightly increased the amount in cash in order to maintain strong internal and regulatory liquidity indicators.
Portfolio Quality
The quality of our portfolio continued improving during 2025 (the non‑performing loan ratio decreased by 216 bps from 7.4% to 5.3%). Throughout 2025, we continued strengthening the risk culture, maintained a conservative profile for credit admission, applied agile collection practices, and updated our models in partnership with a world‑class academic institution which allowed the disbursement volume to increase to S/16 billion, 20% more compared to 2024. In this context, the cost of risk and the provision‑over‑margin ratio reached levels of 5.1% and 24.8% respectively at the close of 2025 (compared to 5.7% and 31.3% in 2024) and the risk vintages have remained within the approved limits throughout the year.
Funding Structure
As of December 31, 2025, total liabilities at Mibanco amounted to S/15.6 billion, which represent an increase of 9.0% as compared to S/14.3 billion at the end of 2024 (and an increase of 11.9% as compared to S/13.9 billion at the end of 2023). In 2025, Mibanco's funding strategy reflected the growth in savings as well as an expansion of long-term structural funding. This shift was given by the bank's decision to capitalize on lower capital-market funding rates and to further diversify its funding sources.
Bond issuances increased by 117%, as compared to 2024, due to the attractive environment of competitive interest rates in the short‑term issuance market, as well as the subordinated bond issuances carried out to meet corporate capital requirements.
In 2025, deposits continued to represent the largest source of funding, accounting for 71.2% of average total liabilities (as compared to 77.1% in 2024 and 71.0% in 2023). The significant growth in retail savings was driven by the bank's strategic commitment to strengthening its stable funding sources, supported by clear targets for expanding retail deposits. This performance was also aligned with the continued growth of the loan portfolio, ensuring a balanced funding structure to sustain business expansion. The increase in bonds, whose average balance in 2025 was S/671.3 million (up 116.7% from S/309.6 million in 2024 and up 9.7% from S/611.2 million in 2023) was driven by the higher issuance of short-term securities due to lower market rates compared to other sources of funding, as well as the issuance of Tier 2 subordinated bonds supporting the strategy of maintaining strong and conservative capital ratios. The 40% increase due to banks and correspondents was driven by higher funding requirements aligning with the growth of the loan portfolio. This debt rebalancing combined with lower market rates, brought our funding cost to 4.4% by the end of 2025 (compared to 5.1% at the end of 2024 and 7.2% at the end of 2023).
In this context, Mibanco leveraged more stable sources of funding, particularly retail savings deposits and long-term structural debt to meet it's financing needs, as these instruments offered lower rated amid a declining interest rate environment.
Financial ratios
Mibanco’s net earnings contribution to Credicorp totaled S/445.2 million in 2025, as compared to S/302.2 million in 2024 and S/199.2 million in 2023.
Mibanco’s ROAE contribution to Credicorp was 16.6% in 2025, compared to its contributions of 10.9% in 2024 and 7.1% in 2023. This substantial increase in Mibanco’s ROAE contribution reflects (i) a decrease in net provisions for loan losses, in line with lower delinquencies due to conservative lending guidelines, a differentiated strategy for early and overdue collections, and a comprehensive vision of risk and profitability; (ii) an increase in net interest income driven by lower cost of funds in line with lower market rates and higher retail share, higher rates of loans due to smaller and more profitable ticket, enhanced by higher loan volumes; and (iii) higher non-interest income driven by insurance commissions for higher disbursements. The aforementioned increase was partially offset by operating expenses, due to advanced strategic initiatives to strengthen its commercial, digital, and operational capabilities.
Mibanco’s NIM was situated at 14.6% in 2025, which represents an increase of 76 bps from 13.8% in 2024 and an increase of 64 bps from 13.2% in 2023. The increase in NIM was fueled by a decrease in interest expenses due to lower market interest rates and better mix of retail funds, higher interest rates in loan portfolio and investments, and a better mix of structural loans guided by smaller tickets which increased their share in nearly 180 bps.
In 2025, Mibanco’s efficiency ratio was 50.9%, lower compared to the 52.7% in 2024 (and similar compared to 52.7% in 2023). This result was primarily attributable to faster growth of net interest income than of operating expenses due to sustained expansion of the current loan portfolio. Additionally, the higher share of smaller ticket loans has contributed to higher margins, while delinquency levels have remained within controlled and sustainable parameters.
6.2.2Mibanco Colombia
As of year-end, Mibanco Colombia's loan portfolio reached a total of $2,546.9 billion COP, marking a 23.9% year-over-year increase ($2,055.7 billion COP in 2024 and $1,780.2 billion COP in 2023). This growth was driven by an increase in the average rate, which rose from 40.15% in 2024 to 41.59% in 2025. The microcredit segment continues to represent the largest portion of the loan portfolio, accounting for 76.7% of the total gross loans as of December 2025.
The growth in interest income and other non-financial income aligned with the increase in gross loan amounts. Interest income grew by 25%, while non-financial income increased by 18.6% year-over-year.
During 2025, our funding cost decreased 69 basis points (bps) from 2024, primarily due to a reduction at the beginning of the year in the Colombian Central Bank’s benchmark interest rate as part of its strategy to curb inflation. As of December 31, 2025, the benchmark interest rate was 9.3% (down from 10.3% on December 31, 2024, and 13.0% on December 31, 2023). Consequently, our financial expenses grew by only 2% year-over-year. However, despite cuts in interest rates, the monetary policy is currently highly contractionary given the prevailing political uncertainty.
The Central Bank is operating in a challenging policy environment after the Government implemented a 23% increase in the minimum wage, which poses significant risks to inflation control.
Throughout 2025, the market environment experienced a notable recovery, closing with a 30-day non-performing loan ratio below to the average of the last five years, reaching 4.2% at December 31, 2025, 204 bps lower than December 31, 2024 and 169 bps lower than December 31, 2023. As a result, there has been a clear slowdown in the deterioration of the loan portfolio, supported by a strong slowdown in defaults and write-offs. Consequently, Mibanco's cost of risk was 4.3% as of December 31, 2025, down 164 bps from December 2024.
2025's annual inflation stood at 5.1%, down from 5.2% in 2024 and 9.3% in 2023. However, due to an increase in the advisor headcount and the execution of certain projects, operating expenses increased by 18%. Mibanco continued to implement a robust efficiency program that enabled expense prioritization and process automation, and branch mergers. As a result of these efforts, the efficiency ratio closed at 66%, compared to 77% in 2024 and 93% in 2023.
6.3Insurance & Pensions
6.3.1Grupo Pacífico
Net Profits
Grupo Pacífico’s net profit before non-controlling interest was S/871.8 million in 2025, S/102.0 million higher than the S/769.8 million reported in 2024 (compared to S/810.4 million in 2023). This higher net profit was mainly driven by:
•An increase in net profit for the P&C insurance business, which totaled S/143.8 million in 2025, 34.3% higher than the S/107.1 million reported in 2024 (compared to S/53.5 million in 2023). This is explained by (i) higher insurance and reinsurance performance led by Personal Lines, Soat, Medical Assistance and Cars, offset by Commercial Lines; (ii) Higher Net Financial Result supported by increased yields on investments; and (iii) lower Medical Assistance deduction and higher other income.
•An increase in net profit for the Life insurance business, which totaled S/552.6 million in 2025, 0.4% higher than the S/550.5 million reported in 2024 (compared to S/639.7 million in 2023). This increase was primarily due to (i) higher insurance and reinsurance result, which increased S/39.7 million primarily due to Credit Life and Individual Life, offset by D&S; (ii) higher other income, which increased S/50.2 million, attenuated by (iii) lower Net Financial Result, which decreased S/46.6 million due to the impact of credit downgrades on certain investment portfolio assets and higher financial expenses.
•An increase in net profit for Corporate health insurance and medical services due to the complete consolidation of Pacifico EPS and Medical services as of March 2025, while last year only 50% of these business profits were attributable to Grupo Pacífico, given its previous partnership with Banmédica, which totaled S/171.8 million in 2025, 65.8% higher than the S/103.6 million reported in 2024 and higher the S/102.4 million reported in 2023.
•An increase in net profit for the Crediseguro business, which amounted to S/8.0 million in 2025, 4.1% higher than the S/7.7 million reported in 2024.
Financial Ratios
Grupo Pacífico’s ROAE was 21.40% in 2025, lower than its ROAE 23.7% in 2024. This was driven by (i) the consolidation of Pacífico EPS, after Credicorp through Grupo Crédito S.A., acquired the 50% interest that Empresas Banmédica held in Pacifico EPS, thereby increasing the denominator and reducing the ratio, (ii) an increase in the Net Loss on Securities, which was impacted by credit downgrades on a couple of assets in the investment portfolio, and (iii) increased Operating Expenses.
| | | | | | | | | | | | | | | | | |
| As of and for the year ended December 31, | | | |
| ROAE (1) | 2023 | | 2024 | | 2025 |
| Grupo Pacífico | 29.50 | % | | 23.70 | % | | 21.40 | % |
| | | | | |
(1)Annualized and average are determined as the average of period beginning and period ending. For 2023 and 2024, these numbers include 50% of the corporate health insurance and medical services business results, due to the
agreement with Banmédica. For 2025, includes 100% of corporate health insurance and medical services business results due to the acquisition of the 50% interest that Banmédica held in Pacifico EPS.
P&C Insurance Business
The 2025 total insurance and reinsurance results increased 18.9% from 2024, which was mainly driven by an increase in insurance service revenue and a reduction in insurance service expenses; partially offset by the reinsurance result.
The Insurance revenue increased 5.0%, due to written premiums that totaled S/2,206.1 million in 2025, reflecting a 3.4% increase compared to 2024. This increase is primarily driven by (i) Personal Lines, due to the higher sales of Credit card protection product through BCP and Falabella, (ii) Medical Assistance due to the volume of policy renewals in healthcare and oncological products, and (iii) Soat, due to an increase in sales through Yape. The aforementioned was attenuated by Commercial Lines and Cars, affected by the exchange rate differences and lower sales.
The insurance service expenses decreased by 4.8%, mainly due to an 11.3% reduction in claims in 2025 and added claims recovered from the reinsurer, the net claims decreased 2.0%. This was attributable to decrease in (i) Personal Lines, explained by lower frequency of claims on credit card protection product, and (ii) Cars business unit reflecting a reduction in claims. The aforementioned was mitigated by Commercial Lines, which reported an uptick in claims for its Fire and Third-Party Liability products; and Medical Assistance, due to higher frequency of claims in healthcare insurance products. In addition, the attributable expenses showed an increase of 17.1% in 2025, explained by higher sales expenses and personnel expenses.
Net financial results increased over the previous year (+4.2%), driven by higher yields on investments due to the disciplined management of our investment portfolio. On the other hand, there was lower Medical Assistance deductions as a result of the full consolidation, incorporating the remaining 50% of Banmédica's stake, ending the joint venture with Pacífico; and Other income registered an increase due to releases of provisions. The aforementioned was attenuated by higher non attributable personal expenses.
Net Profit and Selected Ratios for Grupo Pacífico’s - P&C business(1)
| | | | | | | | | | | | | | | | | | | | | | | | | | | | | |
| As of and for the year ended December 31, |
| 2023 | | 2024 | | 2025 | | 2025 - 2024 |
| (in thousands of Soles) | | Change (S/) | | Change (%) |
| Insurance revenue | 1,645,467 | | | 1,790,635 | | | 1,880,865 | | | 90,230 | | | 5.0 | % |
| Insurance service expenses | (1,158,972) | | | (1,318,655) | | | (1,255,695) | | | 62,960 | | | (4.8 | %) |
| Insurance service result | 486,496 | | | 471,980 | | | 625,170 | | | 153,190 | | | 32.5 | % |
| Reinsurance result | (322,308) | | | (298,428) | | | (418,808) | | | (120,380) | | | 40.3 | % |
| Total insurance and reinsurance result | 164,187 | | | 173,552 | | | 206,362 | | | 32,810 | | | 18.9 | % |
| Financial income | 55,589 | | | 62,727 | | | 65,439 | | | 2,712 | | | 4.3 | % |
| Financial expenses of the insurance service | (695) | | | (189) | | | (277) | | | (88) | | | 46.6 | % |
| Net Financial Result | 54,894 | | | 62,538 | | | 65,162 | | | 2,624 | | | 4.2 | % |
| Non attributable expenses | (105,874) | | | (116,304) | | | (134,320) | | | (18,016) | | | 15.5 | % |
| Other income/expenses | (10,652) | | | 14,528 | | | 14,946 | | | 418 | | | 2.9 | % |
| Exchange rate difference | 5,095 | | | 1,007 | | | (96) | | | (1,103) | | | (109.5 | %) |
| Medical Assistance insurance deduction | (53,097) | | | (28,269) | | | (6,998) | | | 21,271 | | | (75.2 | %) |
| Income tax | (1,052) | | | — | | | (1,302) | | | (1,302) | | | n.a. |
| Net profit | 53,502 | | | 107,052 | | | 143,754 | | | 36,702 | | | 34.3 | % |
(1)Financial statements without consolidation adjustments.
Life Insurance Business
Grupo Pacífico’s life insurance business’s net profit was S/552.6 million in 2025, compared to S/550.5 million reported in 2024. This increase was mainly attributable to (i) higher insurance and reinsurance results in Credit Life and Individual Life, mitigated by D&S, and (ii) higher Other income.
The 2025 total insurance and reinsurance result increased 8.5% from 2024, which such increase was mainly attributable to lower insurance service expenses and favorable reinsurance results, partially offset by a decrease in insurance revenue.
Grupo Pacífico’s life insurance business reported a decline in the Insurance revenue, -37.1%, due to written premiums which totaled S/1,327.4 million in 2025, reflecting a 24.5% decline as compared to 2024. This result is primarily explained by (i) D&S, as Pacifico was not awarded any tranche under SISCO VIII in 2025 (after securing a tranche under SISCO VII last year), and (ii) Group Life, by SCTR products for lower renewal premiums in corporate accounts. The aforementioned was mitigated mainly by Credit Life, which was fueled by an uptick in premiums through Bancassurance and Alliances (Banco de la Nación and Falabella).
In 2025, Insurance service expenses declined by 62.0%, mainly through D&S, given that no tranches of the SISCO VIII were awarded, Credit Life, due to a reduction in claims through the Bancassurance Channel, and Individual Life, which reported a drop in claims. This result was partially attenuated by Annuities, which reported an increase in claims and loss component variation, and Group Life.
Net Financial results decreased by 17.9% in 2025 compared to 2024 as a result of higher financial expenses of the insurance service due to higher credited interest as a result of the increased business volume, mitigated by higher financial income explained by higher dividends on investments due to rate effect and assets under management (AUM), and higher interest on bank deposits, attenuated by higher impairment loss due to the impact of credit downgrades on a couple of assets in the investment portfolio.
Net Profit and Selected Ratios for Grupo Pacífico’s- Life business (1)
| | | | | | | | | | | | | | | | | | | | | | | | | | | | | |
| As of and for the year ended December 31, |
| 2023 | | 2024 | | 2025 | | 2025 - 2024 |
| (in thousands of Soles) | | Change (S/) | | Change (%) |
| Insurance revenue | 1,647,101 | | | 1,439,260 | | | 905,648 | | | (533,612) | | | (37.1 | %) |
| Insurance service expenses | (1,076,250) | | | (910,497) | | | (346,402) | | | 564,095 | | | (62.0 | %) |
| Insurance Service result | 570,851 | | | 528,763 | | | 559,246 | | | 30,483 | | | 5.8 | % |
| Reinsurance result | (82,998) | | | (61,850) | | | (52,625) | | | 9,225 | | | (14.9 | %) |
| Total insurance and reinsurance result | 487,853 | | | 466,913 | | | 506,621 | | | 39,708 | | | 8.5 | % |
| Financial result of insurance activity (VFA) | 877 | | | (3,541) | | | (25,158) | | | (21,617) | | | 610.5 | % |
| Financial income | 755,267 | | | 771,024 | | | 798,669 | | | 27,645 | | | 3.6 | % |
| Financial expenses of the insurance service | (466,119) | | | (507,167) | | | (559,805) | | | (52,638) | | | 10.4 | % |
| Net financial result | 290,026 | | | 260,316 | | | 213,706 | | | (46,610) | | | (17.9 | %) |
| Non attributable expenses | (101,847) | | | (112,277) | | | (111,063) | | | 1,214 | | | (1.1 | %) |
| Other Income/Expenses | (23,280) | | | (27,647) | | | 22,600 | | | 50,247 | | | (181.7 | %) |
| Exchange rate difference | 10,864 | | | (1,571) | | | (3,533) | | | (1,962) | | | 124.9 | % |
| Income tax | (23,932) | | | (35,242) | | | (75,739) | | | (40,497) | | | 114.9 | % |
| Net profit | 639,683 | | | 550,492 | | | 552,592 | | | 2,100 | | | 0.4 | % |
(1)Financial statements without consolidation adjustments.
Corporate Health and Medical Services Insurance Business
As a business unit, Corporate health insurance and medical services achieved a net profit of S/190.3 million in 2025, which was 8.2% lower than the S/207.2 million reported in 2024. This decrease in net profit can be attributed to lower net profit in corporate health insurance, explained by higher claims due to the increase in the frequency of EPS plans.
The aforementioned was offset by an increase in medical services income, which was mainly attributable to health clinics and specialized clinics (S/156.5 million in 2025 versus S/138.2 million in 2024) as a result of an increase in the demand for services.
In the consolidation view, there was higher net profit (S/172 million versus S/103 million in 2024) as a result of the full consolidation, incorporating the remaining 50% of Banmédica's stake from March 2025.
Net Profit and Selected Ratios for Grupo Pacífico’s Corporate Health Insurance & Medical Services (1)
| | | | | | | | | | | | | | | | | | | | | | | | | | |
| As of and for the year ended December 31, |
| 2023 | | 2024 | | 2025 | | 2025 - 2024 |
| (in thousands of Soles) | | S/ | % |
| Insurance revenue | 1,313,640 | | | 1,439,482 | | | 1,514,161 | | | 74,679 | | 5.2 | % |
| Insurance service expenses | (1,124,371) | | | (1,264,284) | | | (1,391,154) | | | (126,870) | | 10.0 | % |
| Insurance service result | 189,270 | | | 175,198 | | | 123,007 | | | (52,191) | | (29.8 | %) |
| Reinsurance result | (16,658) | | | (34,261) | | | (39,651) | | | (5,390) | | 15.7 | % |
| Total insurance and reinsurance result | 172,612 | | | 140,938 | | | 83,356 | | | (57,581) | | (40.9 | %) |
| Financial income from the insurance service | 16,562 | | | 22,501 | | | 40,197 | | | 17,696 | | 78.6 | % |
| Non attributable expenses | (52,843) | | | (82,386) | | | (83,977) | | | (1,591) | | 1.9 | % |
| Other income/expenses | (2,686) | | | 15,795 | | | 21,233 | | | 5,438 | | 34.4 | % |
| Exchange rate difference | (2,423) | | | 1,004 | | | (8,781) | | | (9,785) | | (974.6 | %) |
| Income tax | (44,855) | | | (28,760) | | | (18,221) | | | 10,539 | | (36.6 | %) |
| Net profit corporate health insurance | 86,367 | | | 69,092 | | | 33,807 | | | (35,285) | | (51.1 | %) |
| Net profit medical services | 118,449 | | | 138,156 | | | 156,524 | | | 18,368 | | 13.3 | % |
| Net profit | 204,816 | | | 207,248 | | | 190,331 | | | (16,917) | | (8.2 | %) |
(1)Financial statements without consolidation adjustments.
Underwriting, Actuarial and Reinsurance
Underwriting guidelines for substantially all the risks associated with the P&C and corporate health insurance businesses are developed by insurance underwriting staff in collaboration with the actuarial and pricing staff. Grupo Pacífico’s P&C insurance business unit has an engineering staff that ensures that most medium and medium-to-large commercial properties are insured for risks prior to underwriting, while third-party surveyors are employed to inspect smaller and/or lower-risk properties. Pricing and underwriting guidelines, rates, and approval thresholds for these risks are periodically reviewed by the staff, reported to the Risk and Pricing Committees, and continuously monitored to ensure alignment with competitive market conditions and profitability targets.
Grupo Pacífico’s P&C insurance business transfers risks to reinsurers in order to limit maximum aggregate potential losses and minimize exposures to large individual risks. Reinsurance companies are chosen based on the evaluation of the credit quality of the reinsurer, financial rating, terms of coverage, price, and service. The P&C insurance business acts as a reinsurer on a very limited basis, providing facultative reinsurance capacity to other Peruvian insurers that are unable to satisfy their reinsurance requirements and/or the interests of Peruvian clients in the Latin American region.
Historically, Grupo Pacífico’s P&C insurance business has obtained reinsurance for a substantial portion of its earthquake-related (and other catastrophic risks) insurance portfolio through quota share and excess of loss reinsurance treaties. The insurance business has property catastrophe reinsurance coverage that covers its probable maximum loss under local regulatory requirements and according to international modeling agencies. However, there is no guarantee that a major catastrophe would not have a material adverse impact on Grupo Pacífico’s financial condition and/or its operations. However, we model the portfolio periodically to review potential increase in exposures and assess stress test for the portfolio.
In 2025, Grupo Pacífico’s total ceded reinsurance premiums totaled approximately US$ 206.73 million, of which approximately 93% were ceded to carriers with A- and above ratings.
Grupo Pacífico’s life insurance business holds excess of loss reinsurance contracts for its Individual Life, Personal Accident, Group Life and Credit Life products; in the case of the Disability and Survivorship risk (D&S), the company has no participation in the current 2025-2026 contract, maintaining a runoff portfolio for the quota share reinsurance contracts of previous years. Workers’ compensation (SCTR) and the Annuity business do not have a proportional reinsurance contract. Catastrophic reinsurance contracts cover all of Pacífico’s line of business (Individual Life, Personal Accident, Group Life, Credit Life, SCTR and D&S), except for the annuity line. Life premiums ceded to reinsurers represented around 1.4% of the life insurance businesses' written premiums in 2025.
Investment Portfolio
Grupo Pacífico’s investments are primarily made to meet its solvency equity ratio and provide reserves for its claims. Investments are managed by product within the P&C and life insurance businesses and are designed to contain sufficient assets to match the company’s liabilities. Grupo Pacífico has adopted strict policies related to investment decisions that are reviewed and approved by Grupo Pacífico’s Board of Directors on a monthly basis. Grupo Pacífico invests in local and international markets, with emphasis on investments in Peru, the United States, and Latin America.
As of December 31, 2025, the value of Pacífico’s investment portfolio stood at S/16,790 million, which included mainly S/14,063 million in fixed-income instruments (including deposits and cash considered as eligible assets under SBS regulation), S/840 million in investment properties, S/786 million in equity securities, and S/1,102 million in alternative investments. This diversified portfolio follows an asset-liability management strategy focused on cash flow, duration, and currency matching of assets (portfolio) and liabilities (reserves), as well as on supporting Pacífico’s capital structure. Pacífico’s financial income increased by 4% in 2025 to S/864 million from S/834 million in 2024.
6.3.2Prima AFP
As of December 31, 2025, the number of affiliates in Prima AFP was 2.4 million, in line with the previous two years.
Prima AFP’s assets under management reached S/32.8 billion, which was 2% higher than the S/32.1 billion in 2024 and 11% lower than the S/36.9 billion in 2023. In 2025, nominal annual yields were 4.8%, 9.8%, 9.7%, and 13.4% for Funds 0, 1, 2, and 3, respectively. Since 2006, Prima AFP’s nominal annualized yields were 6.2%, 6.7%, and 5.7% for Funds 1, 2, and 3, respectively.
Prima AFP’s revenues were S/383.3 million in 2025, which was higher than S/372.8 million in 2024 and higher than S/ 351.0 million in 2023. The increase compared to 2024 was explained by a higher flow commission due to clients’ wage growth and higher voluntary pension savings (APV) commission due to higher fund profitability for 2025 clients. However, this was affected by lower mixed‑balance commission due to reduced profitability in the first months of the year, as well as the impact of withdrawals during the last months of 2025.
Operating expenses reached S/208.0 million in 2025, which was S/5.6 million and S/26.7 million higher than in 2024 and 2023, respectively, due to increased strategic expenses.
Prima AFP’s net profit was S/146.5 million in 2025, which was S/13.6 million higher than in 2024 mainly due to higher net reserve fund profitability. Nevertheless, it was S/3.0 million lower than in 2023 due to lower net reserve fund profitability.
In 2025, Prima AFP’s ROAE increased to 31.6% compared to 27.2% in 2024. Also, it increased by 155 basis points compared to 30.0% in 2023.
The following table summarizes the administration fees charged by the AFPs’ for PPS in 2025:
| | | | | | | | | | | | | | |
| | Remuneration scheme | | Balance commission scheme |
| AFP | | Monthly fee on salary | | Annual fee on funds |
| Prima AFP | | 1.60 | % | | 1.25 | % |
| AFP Integra | | 1.55 | % | | 0.78 | % |
| Profuturo AFP | | 1.69 | % | | 0.68 | % |
| AFP Habitat | | 1.47 | % | | 1.25 | % |
As of December 31, 2025, Prima AFP had S/684.5 million in assets (compared to S/658.0 million and S/740.7 million as of December 31, 2024, and December 31, 2023, respectively), S/231.2 million in liabilities (compared to S/182.4 million and S/240.7 million as of December 31, 2024 and December 31, 2023, respectively), and shareholders’ equity of S/453.3 million (compared to S/475.6 million and S/500.1 million as of December 31, 2024 and December 31, 2023, respectively).
6.4 Investment Management and Advisory
By the end of 2025, our Investment Management and Advisory Line of Business15 (LoB) recorded a net profit attributable to Credicorp of S/225.0 million, a 15% increase compared to S/195.3 million achieved in 2024. Overall, our businesses generated revenues that exceeded those of 2024 by 3%, while expenses increased by 6%.
6.4.1Asset Management
In our Asset Management business, total assets under management (AUM), including institutional, corporate, and retail clients, exceeded S/117.1 billion in 2025, a 20% increase compared to S/97.3 billion registered in the previous year. The increase was mainly driven by our investments institutional distribution, and alternative investments businesses.
Investments in traditional assets reached S/38.0 billion in AUM, a 13% increase compared to S/33.5 billion in 2024.
Investments in alternative assets reached S/8.6 billion in AUM, an increase of 19% compared to S/7.2 billion in the previous year.
Institutional distribution exhibited great dynamism at a regional level. In this business, AUMs reached S/63.7 billion, 68% higher than the previous year.
Investment products reached S/6.8 billion in AUMs; a 7% decrease compared to S/7.3 billion in the previous year due to reduced demand for such products among Private Banking clients.
Overall, total revenues in the Asset Management business reached S/226.5 million, a 7% increase compared to the S/212.4 million recorded in 2024.
Assets Under Management
| | | | | | | | | | | | | | | | | |
| As of and for the year ended on
December 31, |
| 2023 | | 2024 | | 2025 |
| (in millions of Soles) |
| Traditional Investments | 28,123 | | | 33,533 | | | 38,026 | |
| Alternative Investments | 7,363 | | | 7,204 | | | 8,577 | |
| Institutional Distribution | 30,022 | | | 37,864 | | | 63,738 | |
| Investment Products | 7,628 | | | 7,337 | | | 6,792 | |
| Total assets under management | 73,136 | | | 85,938 | | | 117,133 | |
15 Includes Credicorp Capital and ASB.
6.4.2Capital Markets
In our Capital Markets unit, total revenue for 2025 was S/369.1 million. Revenues for the sales business was S/246.2 million, which was an increase of 9% as compared with 2024. Revenues from individuals increased 7% compared to those in 2024, and those from institutional clients increased 16% compared to last year, despite a decrease in traded volume, due to volatility in financial markets. In addition, revenues from corporate clients grew by 8% as compared to 2024. This result was boosted by the performance of the Colombian business, which reached an increase of 7% as compared to 2024 due to an increase in foreign exchange transactions that capitalized on the volatility of the foreign exchange markets.
Capital Markets Securities Portfolio
| | | | | | | | | | | | | | | | | |
| As of and for the year
ended on December 31, |
| Traded volume | 2023 | | 2024 | | 2025 |
| (in millions of Soles) |
| Equity securities – Peru (1) | 2,967 | | | 9,324 | | | 7,169 | |
| Fixed income – Peru (1) | 2,057 | | | 1,751 | | | 794 | |
| Equity securities – Colombia (2) | 3,819 | | | 7,587 | | | 11,868 | |
| Fixed income – Colombia (2) | 152,368 | | | 186,153 | | | 165,936 | |
| Equity securities – Chile (3) | 13,123 | | | 12,661 | | | 16,468 | |
| Fixed income – Chile (3) | 71,358 | | | 60,237 | | | 57,282 | |
(1)Peru: BVL information. Fixed income data also includes information from Datatec platform. Does not include repo operations.
(2)Colombia: Colombia Stock Exchange information. Fixed income data also includes Banco de la República’s information. Does not include repo operations.
(3)Chile: Santiago Stock Exchange information. Fixed income data includes financial intermediation operations. Equity securities include operations with investment fund shares and foreign stock. Does not include repo operations.
On the other hand, revenues in the management of proprietary trading positions, including long and short positioning strategies, together with hedging strategies with derivatives instruments, were higher than expected, exceeding those achieved in 2024 by more than 21%.
6.4.3Wealth Management
In our Wealth Management business, total assets under management (AUM) reached S/80.8 billion, an 11% growth compared to S/73.0 billion in 2024. By the end of 2025, revenues reached S/386.2 million, a 7% decrease compared to S/417.3 million in 2024, driven by growth in investment products and mitigated by lower deposit revenue from Private Banking accounts due to interest rate reductions during the year.
In Peru, revenues reached S/308.5 million, a 9% reduction compared to S/339.7 million in the previous year. The growth of AUM’s is explained by the growth in investment products. Revenues were driven by investment products from both asset management and capital markets.
On the other hand, Colombia revenues reached S/48.3 million, a 12% of increase compared to the S/43.1 million recorded in 2024. In Chile, revenues reached S/25.2 million, a 15% decrease compared to S/29.7 million in 2024.
Wealth Management Assets under Management
| | | | | | | | | | | | | | | | | |
| 2023 | | 2024 | | 2025 |
| | | |
| Assets under management – Peru (1) | 41,474 | | | 47,388 | | | 53,117 | |
| Assets under management – Colombia | 9,269 | | | 9,312 | | | 11,518 | |
| Assets under management – Chile | 11,394 | | | 15,149 | | | 14,875 | |
| Assets under management – US (2) | 1,369 | | | 1,429 | | | 1,290 | |
| Total assets under management (3) | 63,506 | | | 73,278 | | | 80,799 | |
| | | | | |
| Total Customers (4) | 4,939 | | | 5,384 | | | 5,599 | |
(1)Includes assets under management from ASB Bank Corp and BCP Wealth Management business (on and off balance).
(2)Includes AUMs only from US persons. AUMs from Peruvian, Colombian and Chilean customers are included in the corresponding country.
(3)Includes AUMs from Asset Management products totaling S/16,274, S/17,185 and S/17,751 million as of 2023, 2024 and 2025, respectively.
(4)Estimated. Includes customers with net worth over US$1 million. Figures include the effect of annual customer re-segmentation.
6.4.4Trust Services
Our Trust Services Business, which mainly includes income from custody of securities in Peru and administration of trusts in Peru and Colombia, had a positive year in 2025 with a growth of 3% as compared to 2024.
5. BLiquidity and Capital Resources
(1)Capital Adequacy and Solvency Management
1.1Credicorp
Our solvency buffers, measured by either regulatory or internal capital ratios, are deemed appropriate in order to comply with both current and expected capital requirements as well as to support our business growth in the coming years. In a similar fashion, our working capital and other liquidity measures are deemed sufficient for current and projected business and regulatory requirements.
The following table shows regulatory capital and capital adequacy requirements applicable to the financial group, as of December 31, 2023:
Regulatory Capital and Capital Adequacy Ratios
| | | | | |
| (In millions of Soles) | As of and for the year ended on
December 31, |
| 2023 |
| Capital stock | 1,319 | |
| Treasury stocks | (208) | |
| Capital surplus | 228 | |
| Legal and other capital reserves (1) | 26,253 | |
| Minority interest (2) | 206 | |
| Loan loss reserves (3) | 1,969 | |
| Perpetual subordinated debt | - | |
| Subordinated debt | 5,720 | |
| Investments in equity and subordinated debt of financial and insurance companies | (1,235) | |
| Goodwill | (798) | |
| Deduction for subordinated debt limit (50% of Tier I excluding deductions) (4) | - | |
| Deduction for Tier I limit (50% of regulatory capital) (4) | - | |
| Total regulatory capital (A) | 33,454 | |
| |
| Tier I (5) | 17,877 | |
| Tier II (6) + Tier III (7) | 15,577 | |
| |
| Financial Consolidated Group (FCG) Regulatory Capital Requirements | 24,780 | |
| Insurance Consolidated Group (ICG) Capital Requirements | 1,594 | |
| FCG Capital Requirements related to operations with ICG (8) | (653) | |
| ICG Capital Requirements related to operations with FCG (9) | - | |
| Total Regulatory Capital Requirements (B) | 25,721 | |
| Regulatory Capital Ratio (A) / (B) | 1.30 | |
Required Regulatory Capital Ratio (10) | 1.00 | |
(1)Legal and other capital reserves include restricted capital reserves (PEN 13,465 million) and optional capital reserves (PEN 5,972 million).
(2)Minority interest includes Tier 1 (PEN 000 million)
(3)Up to 1.25% of total RWAs of Banco de Credito del Peru, Solucion Empresa Administradora Hipotecaria, Mibanco and Atlantic Security Bank.
(4)Tier 2 + Tier 3 cannot be more than 50% of total regulatory capital.
(5)Tier 1 = capital + restricted capital reserves + Tier 1 minority interest - goodwill - (0.5 x investment in equity and subordinated debt of financial and insurance companies) + perpetual subordinated debt.
(6)Tier 2 = subordinated debt + Tier 2 minority interest tier + loan loss reserves - (0.5 x investment in equity and subordinated debt of financial and insurance companies).
(7)Tier 3 = Subordinated debt covering market risk only.
(8)Includes regulatory capital requirements of the financial consolidated group.
(9)Includes regulatory capital requirements of the insurance consolidated group.
(10)Regulatory Capital / Total Regulatory Capital Requirements (legal minimum = 1.00).
The following table presents regulatory capital information for Credicorp as of December 31, 2024 and 2025, calculated according to the SBS Resolution No. 03004-2023 approach, which became effective in January 2024 and aims to ensure a closer alignment with the guidelines established by Basel III. Changes were made to the conglomerate
regulation to reflect the regulatory capital changes implemented in the Peruvian financial system in 2023, according to the legislative decree No. 1531. The new regulatory capital framework defines three capital requirements: CET1, Tier 1 Capital and Total Regulatory Capital.
| | | | | | | | | | | |
| (In millions of Soles) | As of and for the year ended on December 31, 2024 | | As of and for the year ended on December 31, 2025 |
| Capital Stock | 1,319 | | | 1,319 | |
| Treasury Stocks | (209) | | | (210) | |
| Capital Surplus | 176 | | | 149 | |
| Legal and Other Capital reserves | 27,203 | | | 29,649 | |
| Minority interest | 468 | | | 475 | |
| Current and Accumulated Earnings (1) | 6,592 | | | 8,330 | |
| Unrealized Gains or Losses (2) | (504) | | | 159 | |
| Goodwill | (722) | | | (1,253) | |
| Intangible Assets (3) | (2,397) | | | (3,586) | |
| Deductions in Common Equity Tier 1 instruments (4) | (674) | | | (99) | |
| Total Regulatory Common Equity Tier 1 Capital (A) | 31,252 | | | 34,933 | |
| Total Regulatory Common Equity Tier 1 Capital Requirement (B) | 15,445 | | | 17,500 | |
| Regulatory Common Equity Tier 1 Capital Ratio (A) / (B) | 202 | % | | 200 | % |
| Required Common Equity Tier 1 Capital Ratio | 100 | % | | 100 | % |
| | | |
| Perpetual subordinated debt | - | | | - | |
| Total Regulatory Tier 1 Capital (C) | 31,252 | | | 34,933 | |
| Total Regulatory Tier 1 Capital Requirement (D) | 18,682 | | | 20,978 | |
| Regulatory Tier 1 Capital Ratio (C) / (D) | 167 | % | | 167 | % |
| Required Tier 1 Capital Ratio | 100 | % | | 100 | % |
| | | |
| Subordinated Debt | 8,047 | | | 8,855 | |
| Loan loss reserves (5) | 2,033 | | | 2,063 | |
| Deductions in Tier 2 instruments (6) | (1,322) | | | (2,037) | |
| Total Regulatory Capital (E) | 40,009 | | | 43,814 | |
| Total Regulatory Capital Requirement (F) | 29,124 | | | 32,347 | |
| Regulatory Capital Ratio (E) / (F) | 137 | % | | 135 | % |
| Required Capital Ratio | 100 | % | | 100 | % |
(1)Earnings include Banco de Crédito del Perú and Mibanco Perú. Losses include all subsidiaries.
(2)Gains include Investment Grade Government Bonds and Peruvian Central Bank Certificates of Deposits. Losses include all bonds.
(3)Different to Goodwill. Includes Deferred Tax Assets.
(4)Investments in Equity.
(5)Up to 1.25% of total risk-weighted assets of Banco de Crédito del Perú, Solución Empresa Administradora Hipotecaria, Mibanco and Atlantic Security Bank.
(6)Investments in Tier 2 Subordinated Debt.
1.2BCP Stand-alone and Mibanco
BCP Stand-alone and Mibanco actively manage their capital resources, in order to comply with both solvency regulatory requirements and their own internal limits.
Internal Common Equity Tier 1 (CET 1)
In November 2013, BCP Stand-alone’s Board of Directors decided to track the Basel III ratio known as CET 1. CET 1 comprises:
•paid-in-capital (which includes common stock and perpetual non-cumulative preferred stock);
•legal and other capital reserves;
•accumulated earnings;
•unrealized profits (losses);
•deficits of loan loss provisions;
•intangibles;
•net deferred taxes that rely on future profitability;
•goodwill resulting from corporate reorganizations or acquisitions; and
•100% of the amount referred to in “deductions” above.
CET1 Internal Targets
During the first quarter of 2023, BCP’s and Grupo Credito’s Risk Committees approved keeping the CET 1 ratio limits for BCP Stand-alone and Mibanco Peru, targeting them at 11% and 15%, respectively. These limits are part of their risk appetite framework. Both the BCP Stand-alone’s and Mibanco Peru CET 1 ratios are calculated based on their understanding of the Basel III requirements adopted by Peruvian regulation. Beginning January 21, 2022, the Risk Committee has monitored the CET 1 with IFRS balances, rather than local ones.
The following table presents regulatory capital information for BCP Stand-alone as of December 31, 2023, 2024, and 2025, calculated according to the Legislative Decree 1531 approach, which became effective in January 2023 and aims to ensure a closer alignment with the guidelines established by Basel III:
BCP Stand-alone Regulatory Capital Information (in millions of Soles)
| | | | | | | | | | | | | | | | | |
| As of and for the year ended on December 31, 2023 | | As of and for the year ended on December 31, 2024 | | As of and for the year ended on December 31, 2025 |
| Capital stock | 12,973 | | | 12,973 | | | 12,973 | |
| Legal and other capital reserves | 6,591 | | | 6,124 | | | 6,125 | |
| Retained earnings and net income for the year | 5,384 | | | 6,589 | | | 8,321 | |
| Generic provisions for credits (1) | 1,696 | | | 1,757 | | | 1,800 | |
| Perpetual subordinated debt | — | | | — | | | — | |
| Subordinated debt | 5,007 | | | 7,340 | | | 7,903 | |
| Unrealized gain (loss) | (669) | | | (414) | | | 139 | |
| Investment in subsidiaries and others, net of unrealized profit and net income | (2,773) | | | (2,478) | | | (2,692) | |
| Intangible assets | (1,294) | | | (1,515) | | | (1,796) | |
| Goodwill | (122) | | | (122) | | | (122) | |
| | | | | |
| Total Regulatory Capital | 26,793 | | | 30,255 | | | 32,651 | |
| CET 1 (2) | 20,090 | | | 21,158 | | | 22,949 | |
| Regulatory Tier 1 Capital (3) | 20,090 | | | 21,158 | | | 22,949 | |
| Regulatory Tier 2 Capital (4) | 6,703 | | | 9,097 | | | 9,703 | |
| | | | | |
| Total RWAs | 153,473 | | | 161,734 | | | 167,948 | |
| Market RWAs | 2,680 | | | 3,922 | | | 5,019 | |
| Credit RWAs | 134,427 | | | 139,403 | | | 142,806 | |
| Operational RWAs | 16,366 | | | 18,409 | | | 20,123 | |
| | | | | |
| Capital ratios | | | | | |
| CET1 ratio | 13.09 | % | | 13.08 | % | | 13.66 | % |
| Tier 1 ratio | 13.09 | % | | 13.08 | % | | 13.66 | % |
| Total Regulatory capital ratio | 17.46 | % | | 18.71 | % | | 19.44 | % |
| CET1 IFRS 9 | 13.20 | % | | 13.32 | % | | 13.99 | % |
| RWAs / Regulatory capital | 5.73 | | | 5.35 | | | 5.14 | |
(1)Up to 1.25% of total RWAs.
(2)CET1 = Capital + Reserves + Earnings from prior years and from the year in progress + Unrealized gain (loss) – deductions as designated by the SBS (investments in subsidiaries, goodwill, intangible assets).
(3)Regulatory Tier 1 Capital = CET 1 + Perpetual subordinated debt (Tier1) as designated by the SBS
(4)Regulatory Tier 2 Capital = Subordinated debt + Loan loss reserves (tier 2) as designated by the SBS
At the end of December 2023, December 2024, and December 2025, BCP's Stand-alone CET1 under IFRS balance sheets were 13.20%, 13.32%, and 13.99% of its RWAs, respectively.
The following table presents regulatory capital information for Mibanco, calculated according to the Legislative Decree 1531 approach, which became effective in January 2023 and aims to ensure a closer alignment with the guidelines established by Basel III.
Mibanco Regulatory Capital and Capital Adequacy Ratios (in millions of Soles)
| | | | | | | | | | | | | | | | | |
| As of and for the year ended on December 31, 2023 | | As of and for the year ended on December 31, 2024 | | As of and for the year ended on December 31, 2025 |
| Capital stock | 1,840.6 | | | 1,840.6 | | | 1,840.6 | |
| Legal and other capital reserves | 308.1 | | | 334.7 | | | 365.8 | |
| Earnings from prior years and from the year in progress | 717.9 | | | 369.6 | | | 550.2 | |
| Loan loss reserves (1) | 157.4 | | | 144.8 | | | 167.5 | |
| Subordinated debt | 173.0 | | | 167.0 | | | 382.6 | |
| Unrealized gain (loss) | (1.7) | | | (3.7) | | | 12.0 | |
| Investment in subsidiaries and others, net of unrealized profit and net income | (0.282) | | | (0.298) | | | (0.216) | |
| Intangible assets | (156.9) | | | (136.7) | | | (138.6) | |
| Goodwill | (139.2) | | | (139.2) | | | (139.2) | |
| | | | | |
| Total Regulatory Capital | 2,898.9 | | | 2,576.7 | | | 3,040.6 | |
| CET 1 (2) | 2,568.5 | | | 2,264.9 | | | 2,490.6 | |
| Regulatory Tier 1 Capital (3) | 2,568.5 | | | 2,264.9 | | | 2,490.6 | |
| Regulatory Tier 2 Capital (4) | 330.4 | | | 311.8 | | | 550.0 | |
| | | | | |
| Total RWAs | 14,096.9 | | | 13,267.6 | | | 14,307.6 | |
| Market RWAs | 220.3 | | | 242.0 | | | 157.4 | |
| Credit RWAs | 12,349.4 | | | 11,419.7 | | | 13,221.3 | |
| Operational RWAs | 1,527.1 | | | 1,606.0 | | | 928.9 | |
| | | | | |
| Capital ratios | | | | | |
| CET1 ratio | 18.22 | % | | 17.07 | % | | 17.41 | % |
| Tier 1 ratio | 18.22 | % | | 17.07 | % | | 17.41 | % |
| Total Regulatory capital ratio | 20.56 | % | | 19.42 | % | | 21.25 | % |
| CET1 IFRS (5) | 18.37 | % | | 17.53 | % | | 17.30 | % |
| RWAs / Regulatory capital | 5.44 | | | 5.15 | | | 4.71 | |
(1)Up to 1.25% of total RWAs.
(2)CET1 = Capital + Reserves + Earnings from prior years and from the year in progress + Unrealized gain (loss) – deductions as designated by the SBS (investments in subsidiaries, goodwill, intangible assets).
(3)Regulatory Tier 1 Capital = CET 1 + AT1 as designated by the SBS.
(4)Regulatory Tier 2 Capital = Subordinated debt + Loan loss reserves (tier 2) as designated by the SBS.
(5)CET1 = Capital + Reserves – 100% of applicable deductions (investment in subsidiaries, goodwill, intangibles, and net deferred taxes that rely on future profitability) + retained earnings + unrealized gains. It is calculated under IFRS balance sheets.
As of December 31, 2025, Mibanco Peru’s regulatory capital with the new regulation was 21.25% of its unconsolidated RWAs, December 31, 2024, Mibanco’s regulatory capital was 19.42%, and December 31, 2023 Mibanco's regulatory capital was 20.56%.
At the end of December 2025, December 2024, and December 2023 Mibanco’s CET1 under IFRS balance sheets were 17.30%, 17.53%, and 18.37%, respectively.
1.3 Grupo Pacífico
Grupo Pacífico’s solvency indicators, given the equity requirements of the insurance business, have allowed Grupo Pacífico to satisfy its obligations to its policyholders and thus have an adequate level of financial leverage.
(1)Regulatory capital adequacy requirements
The following table shows the regulatory capital adequacy requirements applicable to Grupo Pacífico, as of December 31, 2023, 2024 and 2025:
Grupo Pacífico Regulatory Ratios
| | | | | | | | | | | | | | | | | |
| As of and for the year ended on December 31, |
| 2023 | | 2024 | | 2025 |
| (in thousands of Soles) |
| (A) Capital Adequacy | 1,796,778 | | | 2,144,847 | | | 2,496,560 | |
| (B) Regulatory Capital Requirement | 1,593,590 | | | 1,732,620 | | | 2,040,455 | |
| (B.1) Solvency I Required capital | 1,085,780 | | | 1,113,226 | | | 1,241,904 | |
| (B.2) Security Fund | 506,848 | | | 558,834 | | | 600,775 | |
| (B.3) Credit risk | 0 | | | 0 | | | 0 | |
| (B.4) Other Capital Requirement | 962 | | | 60,560 | | | 197,776 | |
| (C) Leverage | 1,063,351 | | | 931,945 | | | 1,237,080 | |
| Surplus 1 = (A) - (B) | 203,188 | | | 412,228 | | | 456,105 | |
| Ratio (A)/(B) | 1.13 | | | 1.24 | | | 1.22 | |
| Surplus 1 = (A) - (C) | 733,427 | | | 1,212,902 | | | 1,259,480 | |
| Ratio (A)/(C) | 1.69 | | | 2.30 | | | 2.02 | |
(2)Cash flows and Capital Expenditures
The following table shows net cash from operating, investing and financing activities, for the periods indicated:
| | | | | | | | | | | | | | | | | |
| As of and for the year ended on December 31, |
| 2023 | | 2024 | | 2025 |
| (In thousands of Soles) |
| Net cash flow from operating activities | 4,079,719 | | | 14,522,093 | | | 8,606,201 | |
| Net cash flows from investing activities | (1,255,064) | | | 527,559 | | | (1,593,133) | |
| Net cash flows from financing activities | (2,264,352) | | | (1,810,421) | | | (1,837,570) | |
| Net increase (decrease) of cash and cash equivalents before effect of changes in exchange rate | 560,303 | | | 13,239,231 | | | 5,175,498 | |
| Effect of changes in exchange rate of cash and cash equivalents | (760,651) | | | 410,258 | | | (3,771,899) | |
| Cash and cash equivalents at the beginning of the period | 34,120,962 | | | 33,920,614 | | | 47,570,103 | |
| Cash and cash equivalents at the end of the period | 33,920,614 | | | 47,570,103 | | | 48,973,702 | |
Operating Activities
Net cash flow from operating activities decreased by S/5,916 million from 2024 to 2025, primarily due to loan growth (S/8,986 million); full repayment of a BCP bond maturing in January 2025 (S/4,403 million); increased funds in collateral, resale agreements, and securities financing (S/1,635 million); and the disbursement made to settle Assessment and Penalty Resolutions issued by the Tax Authority, which were disputed by the Company. See note 31 to the audited financial statements. This was partially offset by lower investments at fair value through changes in other comprehensive income (S/4,016 million) mainly related to corporate bonds and BCRP certificates of deposit; higher deposits and liabilities (S/3,961 million) driven by savings and current accounts, mainly at BCP; and increased debt with banks and correspondent banks (S/1,980 million) primarily with Wells Fargo Bank.
Net cash flow from operating activities increased by S/10,442 million from 2023 to 2024, due to an increase in deposits and liabilities (S/11,015 million) driven by savings and current accounts, mainly at BCP; lower growth in investments at fair value through other comprehensive income (S/2,609 million) mainly related to BCRP Certificates of Deposit; increase in bonds and notes issued at BCP (S/2,562 million); lower reduction in accounts payable for repurchase agreements and securities lending (S/1,679 million) in line with the increase in accounts payable with BCRP and; decrease in investments at fair value through results (S/869 million) for Mutual Funds. The above was partially offset by a decrease in debts to banks and correspondents (S/5,056 million) mainly with Wells Fargo Bank and Bank of America. Also, higher cash requirement in loans, as a result of the growth in credits (S/3,356 million).
Investing Activities
The variations in net cash flow from investing activities were mainly due to lower cash inflow from the sale and redemption of investments at amortized cost (S/881 million) and the acquisition transaction with Banmédica in 2025, related to the purchase of 50% of the shares of Pacifico EPS (S/ 727 million, net of acquired cash) and the payment made upon the completion of the joint participation agreement in the medical assistance business (S/180 million).
In 2025, 2024 and 2023 the purchase of intangible assets consumed cash of S/984 million, S/801 million and S/829 million, respectively, mainly related to the development, acquisition, and strengthening of these assets.
Financing Activities
In 2025, net cash flow used for financing activities was S/1,837.6 million, an increase of S/27 million compared to 2024. This increase was primarily due to lower issuance of subordinated bonds by BCP (S/492 million). This was partially offset by a decrease in dividends paid (S/483 million).
In 2024, net cash flows used in financing activities were S/1,810.4 million, which represented S/454 million less than what was used in financing activities than in 2023. This decrease was mainly due to higher issuance of subordinated bonds in BCP (S/2,222 million). The above was partially offset by an increase in dividends paid as a result of higher net profits (S/1,670 million).
(3)Liquidity Risk
We manage our assets and liabilities to ensure that we have sufficient liquidity to meet our present and future financial obligations and to take advantage of appropriate business opportunities as they arise. Liquidity risk represents the potential for loss as a result of limitations on our ability to adjust future cash flows to meet the needs of depositors and borrowers and to fund operations on a timely and cost-effective basis. Financial obligations arise from withdrawals of deposits, repayment on maturity of purchased funds, extensions of loans or other forms of credit, and working capital needs.
The growth of our deposit base over the years has enabled us to significantly increase our lending activity. BCP Stand-alone and Mibanco are subject to SBS Resolution No. 9075-2012, enacted in December 2012, which set responsibilities for liquidity management within the different committees and risk units, and established minimum liquidity ratios. In January 2024, the Regulation for Liquidity Risk Management was updated by SBS Resolution No. 3296-2022 in order to incorporate the guidelines of the latest BCBS document (Basel III: The Liquidity Coverage Ratio and liquidity risk monitoring tools). The LCR, in soles-based transactions, must exceed 80% and for both foreign exchange-based transactions and the aggregate ratio must exceed 100%. The aggregate daily ratios of BCP and Mibanco in December 2025 were 156% and 230% for soles and foreign exchange transactions, respectively, demonstrating a robust level of liquidity.
We have never defaulted on any of our debt or been forced to reschedule any of our obligations. Even during the early 1980s, when the government of Peru and many Peruvian companies and banks were forced to restructure their debt as a result of the Latin American debt crisis and government restrictions, BCP Stand-alone and Grupo Pacífico complied with all of their payment obligations.
The LCR’s information with respect to BCP and Mibanco has been aggregated for December 2023, 2024 and 2025:
Liquidity Coverage Ratio Local Currency
| | | | | | | | | | | | | | | | | |
| 2023 | | 2024 | | 2025 |
| Liquidity Coverage Ratio Soles | in thousands of
Soles | | in thousands of
Soles | | in thousands of
Soles |
| | | | | |
Total High Liquidity Assets (HQLA)(1) | 23,178,510 | | | 24,174,982 | | | 27,354,228 | |
Cash Inflows(2) | 5,419,692 | | | 4,590,698 | | | 5,464,073 | |
Cash Outflows(3) | 17,577,626 | | | 18,684,834 | | | 21,007,272 | |
| Total Net Cash Outflows | 11,020,576 | | | 10,080,846 | | | 11,811,029 | |
| LCR% | 162.7 | % | | 154.0 | % | | 156.2 | % |
1)High Quality Liquidity Assets: Correspond to investments, in some cases weighted by a discount factor, of assets that remain liquid in the market even in periods of stress, that can easily be converted into cash and that are classified as low risk.
2)Inflows: Total potential cash inflows for a 30-day horizon, calculated for a standard stress scenario as defined by SBS.
3)Outflows: Total potential cash outflows for a 30-day horizon, calculated for a standard stress scenario as defined by SBS.
Liquidity Coverage Ratio Foreign Currency
| | | | | | | | | | | | | | | | | |
| 2023 | | 2024 | | 2025 |
| in thousands of Soles | | in thousands of Soles | | in thousands of Soles |
| Total High Liquidity Assets (HQLA) (1) | 19,394,117 | | | 32,164,246 | | | 31,627,529 | |
| Cash Inflows (2) | 5,696,268 | | | 5,794,974 | | | 8,047,532 | |
| Cash Outflows (3) | 14,517,454 | | | 20,088,604 | | | 17,241,887 | |
| Total Net Cash Outflows | 10,572,931 | | | 17,870,616 | | | 22,433,174 | |
| LCR% | 172.8 | % | | 189.0 | % | | 230.1 | % |
1)High Quality Liquidity Assets: Correspond to investments, in some cases weighted by a discount factor, of assets that remain liquid in the market even in periods of stress, that can easily be converted into cash an that are classified as low risk..
2)Inflows: Total potential cash inflows for a 30-day horizon, calculated for a standard stress scenario as defined by SBS.
3)Outflows: Total potential cash outflows for a 30-day horizon, calculated for a standard stress scenario as defined by SBS.
The capability of replacing interest-bearing deposits at their maturity is a key factor in determining liquidity requirements, as well as the exposure to interest and exchange rate risks. RBG, as well as BCP Stand-alone’s private banking group, has developed a diversified and stable deposit base that, in each case, provides us with a low-cost source of funding. This deposit base has traditionally been one of our greatest strengths. The deposit-gathering strategy has focused on products considered to be BCP Stand-alone’s core deposits: demand deposits, savings, time deposits, and severance indemnity deposits. Other sources of funds and liquidity, which are mostly short- and long-term borrowings from correspondent banks and other financial institutions, issued bonds, and notes issued, are of a considerably lower significance compared to our core deposits.
Corporate policies have been implemented by the Group for liquidity risk management. These policies are consistent with the appropriate characteristics of each operating segment, where each of the Group companies operates. The Risk Committee establishes limits and autonomy models to determine the adequate liquidity indicators to be managed.
During 2025, the Group continuously assessed and monitored the sufficiency of its liquid assets in order to cover or mitigate contingencies that could stress the funding requirements of the Group's companies.
Universal banking and Microfinance
Liquidity risk exposure is based on indicators such as the Internal Liquidity Coverage Ratio (ILCR) which measures the amount of liquid assets available to meet needs that would result from cash outflows within a given stress scenario for a period of 30 days, and the Internal Net Stable Funding Ratio, which is intended to ensure that long-term assets are financed with a minimum number of stable liabilities within a prolonged liquidity crisis scenario (funding crisis); the latter indicator functions as a minimum compliance mechanism that supplements the ILCR. The core limits of these indicators are 100% and any excess is presented to the Credicorp Treasury and ALM Risk Committee, Credicorp Risk Committee and ALM Committee of the respective subsidiary. Furthermore, Credicorp has internal appetite risk limits that are monitored and reported to the Credicorp Treasury and ALM Risk Committee.
Insurance
Liquidity risk management follows a particular approach reflecting the nature of the business. For annually renewable businesses, the focus of liquidity is the quick availability of resources in the event of a systemic event (for example, an earthquake). For this purpose, there are minimum investment indicators in place relating to local cash/time deposits and foreign fixed-income instruments of high quality and liquidity.
For long-term insurance businesses, given the nature of the products offered and the contractual relationship with customers, the liquidity risk is not material. Rather, the focus is on maintaining a sufficient flow of assets and matching their maturities with the maturities of obligations (for example, through the mathematical reserve). For this purpose, there are indicators that measure the asset/liability sufficiency and adequacy, as well as calculations of economic capital subject to interest rate risk.
Pension funds
Liquidity risk management is differentiated between the fund administrator and the funds being managed. Liquidity risk management regarding the fund administrator is focused on meeting periodic operating expense needs, which are supported by the collection of commissions. The fund administrator does not record unexpected outflows of liquidity because its main financial obligations are payroll payments, taxes, reserve requirements and other accounts payable to suppliers. Liquidity risk in the funds managed (pension funds) is focused on meeting liquidity requirements due to scheduled pension payments, funds transfers to other AFPs, withdrawals of voluntary contributions, or anything else deemed necessary to be included in estimations. For this purpose, the Company holds highly liquid assets as part of the managed portfolios to meet these cash requirements.
Investment banking
Liquidity risk principally affects the security brokerage. In managing this risk, limits on the use of liquidity have been implemented to promote matching maturities by dealing desk. Follow-up liquidity assessments are performed on a daily basis for a short-term horizon covering imminent settlements. If short-term unmatched maturities are observed, repurchase agreements are used. On the other hand, structural risk is not significant given the low levels of debt, which are monitored regularly using financial planning tools.
Funding Sources
The following table presents the components of our funding sources without interest payable at the dates indicated:
| | | | | | | | | | | | | | | | | |
| As of December 31, |
| 2023 | | 2024 | | 2025 |
| (in thousands of Soles, except percentages) |
| Core Deposits: | | | | | |
| Demand deposits | 48,229,323 | | 52,590,952 | | 57,051,970 |
| Savings deposits | 52,375,813 | | 59,757,825 | | 67,811,945 |
| Severance indemnity deposits | 3,185,603 | | 2,996,020 | | 3,192,564 |
| Total core deposits | 103,790,739 | | 115,344,797 | | 128,056,479 |
| | | | | |
| Other Deposits: | | | | | |
| Time deposits | 41,290,011 | | 44,116,438 | | 40,362,433 |
| Bank certificates | 1,194,653 | | 1,101,347 | | 981,822 |
| Total deposits | 146,275,403 | | 160,562,582 | | 169,400,734 |
| | | | | |
| Payables from repurchase agreements and security lending | 10,168,427 | | 9,060,710 | | 8,243,787 |
| | | | | |
| Due to banks and correspondents | 12,076,567 | | 10,721,829 | | 10,632,471 |
| | | | | |
| Bonds and notes issued | 14,373,760 | | 17,023,586 | | 13,735,609 |
| | | | | |
| Total sources of funds | 182,894,157 | | 197,368,707 | | 202,012,601 |
| Core deposits as a percentage of total deposits | 71.0 | % | | 71.8 | % | | 75.6 | % |
| Core deposits as a percentage of total sources of liquid funds | 56.7 | % | | 58.4 | % | | 63.4 | % |
BCP Stand-alone is required to keep deposits with the BCRP as legal reserves. The amount of required deposits in the BCRP is determined as a percentage of the deposits and other liabilities owed by BCP Stand-alone to its clients. The current requirement is approximately 5.61% of BCP Stand-alone’s Soles-denominated deposits and approximately 34.59% of BCP Stand-alone’s US Dollar-denominated deposits as of December 31, 2025. For further detail, see “ITEM 4. INFORMATION ON THE COMPANY – 4.B Business Overview - (6) Supervision and Regulation – 6.2 Subsidiaries – 6.2.1 Peru.”
The following table presents our deposits at the BCRP and our investments in the BCRP’s certificates of deposit at the dates indicated:
| | | | | | | | | | | | | | | | | |
| As of December 31, |
| 2023 | | 2024 | | 2025 |
| (in thousands of Soles, except percentages) |
| Funds at the BCRP | | | | | |
| Deposits | 23,673,777 | | 36,665,481 | | 36,718,552 |
| Certificates of deposit | 11,127,919 | | 11,435,757 | | 10,884,030 |
| Total funds at the BCRP | 34,801,696 | | 48,101,238 | | 47,602,582 |
| Total funds at BCRP as a percentage of total deposits (*) | 23.8 | % | | 30.0 | % | | 28.1 | % |
(*)Total deposits exclude interest payable.
As of December 31, 2025, we had uncommitted credit lines, including long-term facilities that are mainly used for project financing, of which no significant amount was drawn down. We have also received long term funding from COFIDE and other international lenders. These funding sources have average annual rates (including Libor) ranging from 4.78% to 11.40% in soles and from 0.45% to 10.68% in foreign currency. As of December 31, 2025, we maintained
S/10,632.5 million in due to banks and correspondents, secured by the collection of BCP Stand-alone’s (including its foreign branches) instructing correspondent banks to make a payment of a certain amount to a beneficiary that is not an FI. For further details, see Notes 14(a), (b) and (c) to the consolidated financial statements. As of December 31, 2023, 2024 and 2025, borrowed funds due to banks and correspondents, including payable interests, amounted to S/12,278.7 million, S/10,754.4 million and S/10,675.2 million, respectively.
In addition, another source of funds arises out of issuing bonds and notes. The following table presents our principal issued bonds from 2023 to 2025:
| | | | | | | | | | | | | | | | | | | | |
| | Years ended December 31, |
| | 2023 | | 2024 | | 2025 |
| | (in millions of Soles) |
| Issued bonds | | | | | | |
| Senior notes | | 79 | | | 3,019 | | | 83 | |
| Corporate bonds | | - | | | - | | | 34 | |
| Subordinated bonds | | 251 | | | 2,284 | | | 4,548 | |
| Total issuance | | 330 | | | 5,303 | | | 4,665 | |
On September 28, 2017, Pacífico S.A. Entidad Prestadora de Salud carried out the issuance of Senior Notes for an amount of approximately S/130.0 million. These securities bear a fixed annual interest rate of 6.59 percent, with a maturity date of September 28, 2037.
On June 26, 2025, Banco de Crédito de Bolivia issued a Corporate Bond under its First Program, Single Series, for Bs85.0 million at a semiannual coupon rate of 6.40 percent per year, with a maturity date of April 23, 2037. The principal will be paid at maturity or in the event of early redemption by the entity.
On April 30, 2025, the Bank issued Subordinated Notes under the Medium-Term Note Program for US$750.0 million at a semiannual coupon rate of 6.45 percent, maturing on July 30, 2035.
On October 15, 2025, the Bank issued Subordinated Notes under the Medium-Term Note Program for US$500 million at a semiannual coupon rate of 5.65 percent, maturing on January 15, 2037.
On December 19, 2025, Pacífico S.A. Entidad Prestadora de Salud issued Senior Notes for approximately US$45.0 million. These securities bear a fixed annual interest rate of 6.03 percent, with a maturity date of December 19, 2035.
On August 20, 2025, Mibanco S.A. carried out the issuance under the Fifth Subordinated Bond Program, Series B, for S/127.6 million, at a semiannual coupon rate of 7.00 percent per year, with a maturity date of August 20, 2035.
On March 28, 2025, Mibanco S.A. carried out the issuance under the Fifth Subordinated Bond Program, Series A, for S/100.0 million, at a fixed annual interest rate of 7.56 percent, with a maturity date of March 28, 2035.
5. CResearch and Development, Patents and Licenses, Etc.
Credicorp is not materially dependent on patents or licenses, industrial, commercial or financial contracts or new manufacturing processes.
5. DTrend Information
The following list sets forth the most important trends, uncertainties and events that are reasonably likely to have a material effect on our revenues, income from continuing operations, profitability, liquidity, or capital resources, or that would cause reported financial information not necessarily to be indicative of future operating results or financial condition. Some of these trends, uncertainties and events are beyond our ability to influence.
Macroeconomic and Socio-Political Context
Timely and complete achievement of our strategic targets and aspirations may be adversely affected by reductions in the revenue-generating capacities of some of our core businesses if macroeconomic and socio-political risks crystallize.
Notwithstanding strong economic performance and the absence of major conflicts amid political tensions and government changes, several material risks remain. These risks include, among others, the following:
1.On the domestic front, an adverse electoral outcome in the general elections—with an upcoming second round scheduled for June 7, 2026—could undermine economic confidence, weigh on GDP growth through weaker private investment, generate depreciation pressures on the Peruvian currency, and lead to a widening of sovereign bond spreads. Additionally, as of April 17, the probability of a moderate El Niño event from June to July stands. Given that the rainy season on the northern coast typically extends through March, there is a risk of infrastructure damage, while potential impacts on agriculture, the first anchovy fishing season, and sectors sensitive to warmer‑than‑usual winter conditions could weigh on economic activity.
2.On the external front, trade and geopolitical tensions—particularly the conflict involving the United States, Israel and Iran—have increased global uncertainty and pushed energy prices higher. These developments may affect global growth dynamics and renew inflationary pressures, especially if energy prices remain elevated for an extended period. In turn, a less favorable external environment and episodes of higher risk aversion could weigh on financial conditions and moderate activity across markets relevant to Credicorp’s businesses.
In late February 2026, a war erupted involving the United States, Israel and Iran, triggering a sharp increase in energy commodity prices amid heightened concerns over supply disruptions. Transit through the Strait of Hormuz—through which approximately 20% of global oil supplies normally pass—has largely come to a halt, while regional energy infrastructure has sustained material damage. In addition, several Middle Eastern oil‑producing countries have announced production cuts, further tightening global energy supply and reinforcing upward price pressures. If elevated oil prices persist, they could fuel global inflation, dampen economic growth, tighten global financial conditions and reduce risk appetite toward emerging markets such as Peru, leading to depreciation pressures on the domestic currency and wider sovereign bond spreads.
Since August 1, 2025, the United States has imposed 50% Section 232 tariffs on semi‑finished copper products, while refined copper, ores, and scrap remain exempt. The U.S. administration is currently reviewing refined copper imports under Section 232, with a policy decision expected by June 30, 2026. Any announcement of tariffs on refined copper or copper concentrate could increase price volatility and widen price differentials between the COMEX (New York Metals Exchange) and the LME (London Metals Exchange), affecting global trade flows. Copper accounts for approximately 30% of Peru’s total exports, with around 65% directed to China and only about 4% exported to the United States. Peru’s exports are predominantly copper concentrate, while U.S. imports consist primarily of refined copper.
For further information about these and other key risks and uncertainties for the Group, please see “ITEM 3. KEY INFORMATION – 3.D Risk Factors.”
We expect Peru’s GDP to grow between 3.0% and 3.5% in 2026, supported by a resilient domestic demand, despite three unexpected supply‑side shocks: the spike in international oil prices due to the Middle East conflict, a two‑week domestic gas disruption, and the El Niño weather phenomenon. Private spending will remain the main growth driver, following a 10% increase in private investment in 2025, the strongest performance in 13 years excluding the post‑pandemic rebound. In addition, historically high terms of trade—which reached their highest level in 75 years in 2025—continue to provide strong tailwinds. This outlook is underpinned by: (i) a favorable contribution from the maturation of the economic cycle; (ii) positive external tailwinds from elevated export prices, particularly copper and gold; (iii) inflation levels that remain low relative to both emerging and developed economies; (iv) accelerating credit origination amid strong aggregate demand; and (v) still‑favorable expectations, despite some moderation in recent activity indicators. Inflation is expected to close 2025 above 3.0%, the upper bound of the BCRP’s target range (1.0%–3.0%), with upside risks stemming from the global oil price shock. While our base scenario assumes the policy rate remains unchanged at 4.25%, the BCRP could discuss a rate hike in the coming months if inflation expectations become unanchored from the target range.
For further information regarding GDP expectations from the countries where Credicorp operates, see “ITEM 4. INFORMATION ON THE COMPANY".
On February 24, 2026, Gerardo Arturo López Gonzáles was appointed Minister of Economy and Finance by President José María Balcázar, succeeding Denisse Miralles, who became President of the Council of Ministers. Prior to his appointment, López Gonzáles served as Vice Minister of Economy during Miralles’s tenure at the Ministry of Economy and Finance. He is an economist by training and built most of his professional career as a senior civil servant at the National Superintendence of Customs and Tax Administration (SUNAT), where he held various senior management roles
over nearly two decades. López Gonzáles has also served as a consultant to the International Monetary Fund’s Fiscal Affairs Department.
For further information about the political environment, please see “ITEM 5. OPERATING AND FINANCIAL REVIEW AND PROSPECTS – 5.A Operating results – Political environment”.
Competitive Environment
In January 2026, Revolut, a UK-based digital bank, began the process of applying to the SBS for a full banking license in Peru. This initiative aims to establish Revolut as the first fully regulated digital bank in the country.
In January 2026, the SBS granted BTG Pactual, the largest investment bank in Latin America, authorization to establish a banking entity in Peru, pending the completion of remaining licensing requirements.
We will monitor the evolution of the aforementioned factors as they may impact Credicorp’s results and operations.
With this in mind, we expect the following performance for Credicorp:
•Loans: Amid a more dynamic economic backdrop and strengthened origination levels in the past year, we expect growth in balances to continue accelerating in 2026, driven primarily by Retail Banking at BCP and by Mibanco.
•NIM: The acceleration anticipated for loan growth and the shift in the mix towards retail should support NIM, under a scenario of stable policy rates or limited upward pressure in soles and dollars.
•Portfolio quality and cost of risk: We expect the cost of risk to increase slightly and remain within our risk appetite, reflecting continued improvements in asset quality and the ongoing shift of our loan portfolio mix toward higher-yielding segments, as we further accelerate retail origination while prudently managing risk.
•Operating efficiency: In 2026, we will continue to invest in digital transformation and disruptive initiatives to bolster our long-term competitive position but we expect some of the efficiencies from scale to begin to materialize.
In a medium-term perspective, we review our strategic initiatives on a constant basis, and are well prepared to implement tactic moves to rapidly adapt accordingly to navigate our changing environment:
•We are conscious that we have a responsibility to positively impact the communities in which we operate. We are committed to ensuring that all people have access to, and make use of, quality financial and health services; mobilizing resources to drive social transformation, and an environmentally sustainable economy; and strengthening trust in Credicorp and in the private sector as a whole. In order to accomplish this commitment, we will continue to advance in our three strategic priorities. The priorities are (i) ensuring the best Talent through a compelling value proposition, (ii) accelerating digital transformation and innovation at Credicorp and its subsidiaries, and (iii) integrating sustainability at the core of our strategy.
•Universal Banking: Digital leadership, efficiency and disciplined risk management.
◦At BCP Stand-alone, we aim to sustain long‑term performance by continuing to invest in strengthening our risk management framework, technological infrastructure and digital capabilities, while further improving commercial productivity and resource allocation. Building on this foundation, we will continue to deepen customer principality and consolidate our position as the bank of reference for millions of Peruvians. It is worth noting that the increased use of digital channels has enhanced operational efficiency and strengthened customer preference, and that the strengthening of digital capabilities and multichannel distribution has been key to consolidating our leadership in transactional services and deposits.
◦At Yape, the payments business will continue to drive growth in the short-term as we strive to reach our goal of becoming the main payments network in Peru. In addition, we will maintain the focus on growing the share of lending within Yape's revenue mix by solving the financial needs of our clients. Finally, we strive to be present in the lives of Yaperos and aim to become the main E-commerce in Peru in terms of gross merchant volume.
•Microfinance: We seek to consolidate our presence at the base of the pyramid and continue to accompany client growth.
◦At Mibanco Peru, we expect to continue consolidating our market leadership and profitability by further advancing our hybrid operating model, integrating in‑person advisory with digital tools and AI in risk management, sustaining improvements in commercial productivity, expanding conversational banking
through WhatsApp, and further diversifying revenues through transactional services and savings deposits that provide stable and efficient funding.
◦At Mibanco Colombia, despite challenging market conditions, we expect performance to continue improving, driven by a sustained focus on efficiency, disciplined risk management and continued strong loan growth, supporting our positioning as a leading microfinance player in the market.
•Insurance and Pensions:
◦At Grupo Pacífico, we will continue offering our products and services through the Credicorp ecosystem, particularly for retail segments, via bancassurance and Yape. In addition, we will continue to make use of partnerships with retail businesses to develop embedded insurance products.
◦At Pacífico EPS, we will continue to provide a comprehensive range of healthcare services, strengthening the social impact through expanded access to insurance and improved quality of the offer directed to clients and communities through medical services.
◦At Prima AFP, we will maintain our focus on client experience and in digitalization of distribution channels and communications, while leveraging artificial intelligence to enhance the efficiency and quality of our service.
•At Investment Management and Advisory, we expect our strategic focus on businesses that provide stable income streams will continue to drive profitable and sustainable growth.
5. ECritical accounting estimates
Not applicable.
ITEM 6.DIRECTORS, SENIOR MANAGEMENT AND EMPLOYEES
6.ADirectors and Senior Management
(1)Board of Directors
The following table sets forth information about the Directors of Credicorp Ltd. at the end of 2025:
| | | | | | | | | | | |
| Name | Position | Years served as a Director (1) | Birth Date |
| Luis Enrique Romero Belismelis | Chairman | 16 | 09/01/1961 |
| Jose Raimundo Morales Dasso | Vice Chairman | 17 | 11/09/1946 |
| Patricia Lizarraga Guthertz | Director | 8 | 07/14/1966 |
| Pedro Rubio Feijóo | Director | 7 | 09/14/1955 |
| Antonio Abruña Puyol | Director | 5 | 04/08/1954 |
| Alexandre Gouvêa | Director | 5 | 12/02/1959 |
| Maria Teresa Aranzábal Harreguy | Director | 5 | 02/22/1963 |
| Leslie Pierce Diez Canseco | Director | 5 | 12/31/1948 |
| Nuria Aliño Pérez | Director | 2 | 02/03/1971 |
(1)In Credicorp or BCP Stand-alone as of December 31, 2025.
Luis Enrique Romero Belismelis
Mr. Romero has served as the Chairman of the Board and Executive Chairman of Credicorp Ltd. since June 9, 2020, and has been a Director since March 31, 2017.
Through his participation on the boards of various Credicorp subsidiaries, Mr. Romero has gained broad insight into the Group's businesses. He has also served as Chairman of the Board of Banco de Crédito del Peru since April 5, 2021, and has been a Director since March 31, 2009. He has been a member and Chairman of the Board of Grupo Crédito S.A. since October 29, 2020. In addition, he chairs the boards of Pacífico Compañía de Seguros y Reaseguros, Credicorp Peru S.A.C., and Mibanco - Banco de la Microempresa S.A., and serves as a board member of Atlantic Security Holding Corporation and Patronato BCP.
Mr. Romero has also held senior executive and management positions in different consumer and services companies within the Grupo Romero.
Mr. Romero holds a bachelor’s degree in Economics from Boston University (United States).
Jose Raimundo Morales Dasso
Mr. Morales has served as the Vice Chairman of the Boards of Directors of Credicorp Ltd. and Banco de Crédito del Peru since March 28, 2008, and March 31, 2009, respectively. He is also a director of Grupo Crédito S.A., Pacífico Compañía de Seguros y Reaseguros, and Atlantic Security Holding Corporation.
He joined Banco de Crédito del Peru in 1980 and held several senior management positions, such as Executive Vice President of Wholesale Banking and Credit Risk Management, as well as CEO from 1990 to 2008. Additionally, he served as Chairman of the Board of Directors and CEO of Atlantic Security Bank (now ASB Bank Corp., a subsidiary of Credicorp). Mr. Morales led Credicorp's initial public offering of shares on the New York Stock Exchange (NYSE) in October 1995.
He has also been involved in various industry organizations, including the Peruvian Bank Association (ASBANC), Peruvian Association of AFP, and of National Confederation of Private Business Institutions of Peru (CONFIEP), where he served as Vice-Chairman. Prior to joining Credicorp, Mr. Morales worked for 10 years at Wells Fargo Bank in its offices in San Francisco and Miami (United States), São Paulo (Brazil), Caracas (Venezuela), and Buenos Aires (Argentina). His last position at Wells Fargo was as Regional Vice President.
He currently serves as Vice Chairman of Cementos Pacasmayo S.A.A.and as a board member of Fosfatos del Pacífico S.A. and GRIO S.A.
Mr. Morales holds a bachelor’s degree in Economics and Administration from Universidad del Pacífico (Peru) and an MBA from Wharton Graduate School of Finance of the University of Pennsylvania (United States).
Patricia Lizarraga Guthertz - Independent Director
Ms. Lizárraga has served as a member of the Boards of Directors of Credicorp Ltd. and Banco de Crédito del Peru since March 31 and March 22, 2017, respectively. She has also served as a director of Grupo Crédito S.A. since October 29, 2020. Since June 2020, she has served as the Chairwoman of Credicorp's Audit Committee.
Ms. Lizárraga is a Wall Street executive with over 25 years of experience in international mergers & acquisitions, capital markets, private equity and valuation practice with Allen & Company, Donaldson Lufkin & Jenrette, and Citigroup. In 2007, she became the founder and CEO of Hypatia Capital Group, the asset manager of the WCEO ETF.
Ms. Lizárraga's board experience includes serving as both Chair of the Board and Chair of the Audit Committee of non-profit organizations, and private companies. She has also served as Chair of Peruvian Toll Roads Privatization Committee.
Ms. Lizárraga holds a Bachelor of Arts degree from Yale University (United States) and an MBA from Harvard Business School (United States).
Pedro Rubio Feijóo
Mr. Rubio has served as a director of Credicorp Ltd. and Grupo Crédito S.A. since March 27 and March 31, 2023, respectively. He also serves as a director of Banco de Crédito del Peru, Prima AFP, Credicorp Capital Ltd., Credicorp Capital Holding Peru S.A., ASB Bank Corp., Atlantic Security Holding Corporation, Banco de Crédito de Bolivia, and Inversiones Credicorp Bolivia S.A. He currently serves as Chairman of the Risk Committee of Credicorp Ltd. and Grupo Crédito S.A.
He began his career at Banco de Crédito del Peru in 1983 as a commercial executive, then went on to hold progressively senior roles including Head of the International Business Department, CEO of Banco Tequendama in Bogotá (Colombia) and Head of the Corporate and Business Banking Division. Until March 2018, he served as Senior Vice President of Wholesale Banking at Banco de Crédito del Peru, reporting directly to the CEO.
Mr. Rubio has a degree in Industrial Engineering from North Carolina State University (United States).
Antonio Abruña Puyol – Independent Director
Mr. Abruña has served as a member of the Boards of Directors of Credicorp Ltd. and Grupo Crédito S.A. since June 5 and October 29, 2020, respectively. He served as a member of the Board of Directors of Banco de Crédito del Peru from March 31, 2021 to March 27, 2024.
Mr. Abruña is a Spanish-Peruvian attorney-at-law and one of Peru's leading legal scholars, with decades of experience as a legal scholar and administrator of academic institutions. Mr. Abruña served as Rector of the Universidad de Piura (Peru) from 2003 to 2012 and from 2018 to 2024, where he developed a long academic career. He participated in the creation of the Faculty of Law, where he served as a professor and dean. He has held other academic and administrative positions and participated in various projects at the university.
Mr. Abruña was member of the Special Commission appointed by the Peruvian government to designate the seven members of the National Justice Council. He also served as the Peruvian representative of the lstituto per la Cooperazione Universitaria (ICU) (Italy) and as director of Universia Peru.
Mr. Abruña holds a law degree from Universidad Complutense de Madrid (Spain) and a doctorate in Law from the Universidad de Navarra (Spain).
Alexandre Gouvêa – Independent Director
Mr. Gouvêa has served as a member of the Boards of Directors of Credicorp Ltd. and Banco de Crédito del Peru since June 5 and June 24, 2020, respectively, and as director of Grupo Credito S.A. since October 29, 2020. Since February 2023, he has served as a director of Monokera, an Insurtech company recently acquired in Colombia by Credicorp's Corporate Venture Capital Krealo, and he also serves a director of Aval Digital Labs. In addition, since December 2024, he has served as a director of Grupo Financiero Banamex. He currently serves as Chairman of the Compensation and Nominations Committee of Credicorp and Grupo Crédito S.A.
Mr. Gouvêa has over 30 years of international experience at McKinsey & Co., specializing in advising financial services clients. Mr. Gouvêa is an expert in retail banking and insurance (including technological transition and digital transformation). He worked in financial services across Latin America and led the creation of the Organizations Practice and the Recovery and Transformation Unit of McKinsey & Co. He previously served as a director of McKinsey & Co. Mr. Gouvêa served as a member of the board of directors of leading publicly listed Brazilian retailers, Lojas Renner between 2019 and January 2023. He also spent over 8 years on the board of the nonprofit organization, Habitat for Humanity International.
Mr. Gouvêa holds a degree in Mechanical Engineering from Universidade Federal do Rio de Janeiro (Brazil) and an MBA from UCLA's Anderson School of Management (United States).
Maria Teresa (Maite) Aranzábal Harreguy - Independent Director
Ms. Aranzábal has served as a member of the Boards of Directors of Credicorp and Banco de Crédito del Peru since June 5 and June 24, 2020, respectively, and as director of Grupo Crédito S.A. since October 29, 2020. She currently serves as Chairwoman of the Sustainability Committee of Credicorp and Grupo Credito S.A.
Ms. Aranzábal is an Spanish executive with relevant experience advising leading publicly listed and privately owned companies worldwide, as well as holding senior executive roles with responsibilities for strategy, business development and transformation, customer experience and international expansion. Throughout her international career, she has worked across a variety of sectors, spanning retail banking, retail, fashion, consumer goods and real estate. She brings relevant experience through her service on the boards of public and private companies, as well as non-profit organizations.
She began her career at McKinsey & Co. in Spain and Argentina, advising clients in various industries, including retail banking. She later joined Grupo Cortefiel, a family-owned retailer, where she led business development, strategy, and international growth. She also collaborated with Advent lnternational, a private equity firm, as a retail expert, and was later in charge of the turnaround of KA lnternational.
Ms. Aranzábal currently serves as an independent advisor to the Board of Directors of the Corporación Hijos de Rivera and as Chair of the Board of Trustees of the Novia Salcedo Foundation. She also leads Alir Consulting and Trade, her own consulting company, which specializes in strategic consulting and leadership training.
Ms. Aranzábal holds a degree in Business Administration from ICADE (Spain), an MBA from The Wharton School of the University of Pennsylvania (United States), and a Board Director Certification from the Spanish Institute of Directors (IC-A).
Leslie Pierce Diez-Canseco
Mr. Pierce has served as a member of the Board of Directors of Credicorp Ltd. and Grupo Crédito S.A. since October 16 and October 29, 2020, respectively, and as a director of Banco de Crédito del Peru since March 31, 2021, and of Atlantic Security Holding Corporation since April 30, 2021.
Mr. Pierce has held executive leadership positions, primarily in Peruvian companies, for nearly 40 years. He served as CEO of Alicorp S.A.A., Peru's largest consumer goods company with operations throughout Latin America, from 1991 to 2011. Prior to that, Mr. Pierce served as a Vice Minister of Commerce in the Ministry of Economy and Finance of Peru from 1983 to 1984.
Mr. Pierce currently serves as a member of the board of directors of Peruvian-listed companies Empresa Siderúrgica del Peru S.A.A. and Alicorp S.A.A., as well as a director in a number of private businesses, including Cerámica Lima S.A., Transber S.A.C, HV Contratistas S.A., Redondos S.A., Esmeralda Corp. S.A.C., GRIO S.A., Instituto Bicentenario, and Negocios Industriales Real NIRSA S.A. (Ecuador). He also participates in philanthropic organizations such as Vida Peru and Banco de Alimentos del Peru.
Mr. Pierce holds a bachelor's degree in Economics from the Pontificia Universidad Católica de Peru (Peru) and a postgraduate degree in Economics from the Pontificia Universidad Católica de Chile (Chile).
Nuria Aliño Pérez – Independent Director
Ms. Aliño has served as a director of Credicorp and Grupo Crédito S.A. since March 27 and March 31, 2023, respectively. She has served as director of Banco de Crédito del Perú since March 27, 2024.
Ms. Aliño is a Spanish corporate and investment banking professional with over 25 years of experience in developed and emerging markets.
Since 2016, she has held positions with the World Bank Group’s International Finance Corporation (IFC), including Head of Partnerships and Innovations in the financial sector, and currently serves as Open Banking & Digital Transformation Specialist, providing guidance on digital transformation strategies to financial institutions in emerging markets.
Previously, she served as an advisor to the CEO of IDB Invest (Inter-American Development Bank) and spent over 15 years at BBVA in corporate and investment banking.
Ms. Aliño serves as an independent director of Unicaja Banco, Spain’s sixth-largest bank, and of the European credit rating agency Inbonis. Ms. Aliño has also held advisory board roles for tech companies and private equity and venture capital firms in Latin America and Europe.
Ms. Aliño holds degrees in Law and Economics from Universidad Pontificia Comillas – ICADE (Spain), and has completed the Advanced Management Program at IESE Business School in Madrid (Spain).
See “ITEM 4. INFORMATION ON THE COMPANY - 4. A History and development of the Company – Recent Developments” for updated information about changes to the composition of our Board of Directors since January 1, 2026.
Corporate Secretary
Conyers Corporate Services (Bermuda) Limited serves as Credicorp’s Corporate Secretary. Mr. Guillermo Morales Valentin is Credicorp’s Deputy Secretary.
(2)Senior Management
Credicorp believes that a unified financial group with a coordinated strategy is best able to take advantage of growth in the Peruvian economy and achieve synergies from cross-selling financial services and products (such as through BCP’s extensive branch network). Pursuant to Credicorp’s Bye-laws, the Board of Directors has the power to delegate its authority to oversee the day-to-day management of the company to one or more Directors or officers.
The following table sets forth the name, position(s), and principal Credicorp entities for each member of our senior management:
| | | | | | | | |
| Position(s) (1) | Name | Entity(ies) |
| Executive Chairman | Luis Enrique Romero B. | Credicorp |
| Chief Executive Officer | Gianfranco Ferrari | Credicorp |
| Chief Risk Officer | Cesar Rios | Credicorp, BCP |
| Chief Financial Officer | Alejandro Perez-Reyes | Credicorp, BCP |
| Chief Strategy Officer | Michelle Labarthe | Credicorp |
| Chief Innovation Officer | Francesca Raffo | Credicorp |
| Head of Universal Banking (Credicorp), CEO (BCP Stand-alone) | Diego Cavero | Credicorp, BCP |
| Head of Microfinance (Credicorp), CEO (Mibanco) | Javier Ichazo | Credicorp, Mibanco |
| Head of Insurance & Pensions (Credicorp), CEO (Grupo Pacífico) | Cesar Rivera | Credicorp, Grupo Pacífico |
| Head of Investment Management and Advisory (Credicorp), CEO (Credicorp Capital) | Eduardo Montero | Credicorp, Credicorp Capital |
| Chief Corporate Audit Officer | Jose Esposito | Credicorp, BCP |
| Chief Compliance and Ethics Officer | Barbara Falero | Credicorp, BCP |
| Head of Legal | Guillermo Morales | Credicorp |
| Head of People Strategy | Ursula Alvarez | Credicorp |
| Head of Corporate Affairs | Enrique Pasquel | Credicorp |
1.At Credicorp or in any subsidiary as of December 31, 2025.
Gianfranco Ferrari
Mr. Ferrari has been the CEO of Credicorp, since January 2022. Previously, he served as Deputy CEO and Head of Universal Banking at Credicorp Ltd., as well as CEO of BCP from April 1, 2018 to December 31, 2021.
He currently serves as Chairman of the Board of Prima AFP S.A., Credicorp Capital Ltd., Credicorp Capital Holding Perú S.A., Krealo Management S.A., ASB Bank Corp., Pacífico S.A. Entidad Prestadora de Salud, and CCR Inc. He is Vice Chairman of the Board of Mibanco – Banco de la Microempresa S.A., and sits on the boards of Credicorp Perú S.A.C., Pacífico Compañía de Seguros y Reaseguros S.A., and Yape Market S.A.C. He also serves on the boards of Inversiones Centenario S.A.A., the Peruvian Institute of Economics, the Private Council for Competitiveness, and the organizations Perú 21 Una Nueva Visión (Perú Sostenible), Asociación Civil Es Hoy, and Red de Estudios para el Desarrollo (Redes). In addition, he chairs the Governing Board of the Universidad del Pacífico Foundation.
Mr. Ferrari has worked within the Credicorp Group since 1995, gaining experience across various strategic areas. For over 17 years, between 2000 and 2017, Mr. Ferrari was the Head of Corporate Banking and Corporate Finance, Retail
Banking and Wealth Management at BCP, where, from 2015 to 2017, he led the digital transformation strategy. He was also CEO of BCP Bolivia from 2005 to 2008.
Mr. Ferrari holds a degree in Business Administration from Universidad del Pacífico (Peru) and an MBA from Kellogg Graduate School of Management at Northwestern University (United States).
Alejandro Perez-Reyes
Mr. Perez-Reyes has served as Chief Financial Officer of Credicorp Ltd and Banco de Crédito del Perú since July 2024. Previously, he served as Chief Operating Officer (COO) of Credicorp Ltd. from January 2022 to June 2024. He has built a career of more than 25 years within the Credicorp Group. Throughout this time, he has held multiple roles across several companies of the group, including Manager of Financial Derivatives at BCP — where he executed the bank’s first-ever swaps — Investments Manager at Prima AFP, Asset Management Manager, and COO and Country Head for Peru at Credicorp Capital, where he was part of the company since its creation and led the transformation of its operating model, among other senior responsibilities.
He serves on the boards of several Credicorp subsidiaries, including Solución Empresa Administradora Hipotecaria S.A., Prima AFP S.A., Inversiones Credicorp Bolivia S.A., Banco de Crédito de Bolivia S.A., Credicorp Capital Holding Chile S.A., Credicorp Capital Asset Management S.A. Administradora General de Fondos, Credicorp Holding Colombia S.A.S., Credicorp Negocios Digitales S.A.S., Sami Shop S.A.C., and Krealo Management S.A.
Mr. Perez-Reyes holds a bachelor’s degree in Economics from University of Lima (Peru) and an MBA from Harvard Business School (United States).
Cesar Rios
Mr. Rios has served as the Chief Risk Officer (CRO) of Credicorp Ltd. and Banco de Credito del Peru since July 2024. He has been a part of the Credicorp Group since 1993, when he joined as a Corporate Finance associate. In 1997, he was appointed as the CFO and COO of Banco Capital in El Salvador following its acquisition by Credicorp. In 2003, Mr. Rios rejoined BCP, where he held strategic roles such as Head of Credit and Operating Risk in the Risk Management Unit, Head of Collections for Retail Banking, and Head of Corporate Strategy, which includes internal consulting, mergers and acquisitions, and corporate strategy. In 2013, he became Head of Financial Planning and Control at BCP. From April 2018 to June 2024, he served as CFO of Credicorp Ltd. and BCP.
Mr. Rios currently serves on the boards of several Credicorp subsidiaries, including Mibanco Banco de la Microempresa S.A., Credicorp Perú S.A.C., CCR Inc., Pacifico S.A. Entidad Prestadora de Salud, Yape Market S.A.C., Inversiones 2020 S.A., Soluciones en Procesamiento S.A., Atlantic Private Equity Investment Advisor, Atlantic Security International Financial Services Inc., and Atlantic Security Private Equity General Partner.
Mr. Rios holds a bachelor’s degree in Engineering from Pontificia Universidad Católica del Peru (Peru); a master’s degree from ESAN Escuela de Administración de Negocios para Graduados (Peru); and an MBA from the Sloan Fellows Program at the Massachusetts Institute of Technology (United States).
Francesca Raffo
Ms. Raffo has served as Chief Innovation Officer of Credicorp since February 2022. Prior to that, she served as Retail Banking Deputy CEO at BCP until October 2024.
Ms. Raffo’s career at BCP spans 26 years and includes leading key initiatives such as BCP’s transformation agenda, the Satisfied Customers Division, the creation of BCP’s first Innovation Center, and the Marketing Services function. Ms. Raffo joined BCP in 1994 as a member of the Process Reengineering pioneer team and subsequently led various strategic projects within Retail Banking. Ms. Raffo currently serves as director of several Credicorp subsidiaries, including Yape Market S.A.C., Mibanco – Banco de la Microempresa de Colombia S.A., Krealo Management S.A., Inversiones Credicorp Bolivia S.A. and Banco de Crédito de Bolivia.
Ms. Raffo holds a bachelor’s degree in Business Administration and an MBA in Management Information Systems, both from The American University in Washington D.C. (United States).
Michelle Labarthe
Ms. Labarthe has serves as Chief Strategy Officer of Credicorp Ltd. since January 2024. She has 25 years of experience in finance and has worked in Investment Banking in London and Lima covering financial institutions in Europe and Latin America. Previous to joining Credicorp, she was Country Head for Peru at Lazard and held various positions at Rothschild & Co. and Lehman Brothers. Ms. Labarthe started her professional career at BCP where she worked between 2000 and 2004 in Process Improvement and Quality, Strategy and Planning for the Wholesale Banking Division and Corporate Finance.
Ms. Labarthe holds a degree in Industrial Engineering from Universidad de Lima (Peru) and has an MBA from HEC Paris (France).
Diego Cavero
Mr. Cavero has served as Head of Universal Banking for Credicorp Ltd. which includes Banco de Crédito del Perú and Banco de Crédito de Bolivia, as well as CEO of Banco de Crédito del Perú since January 2022.
Previously he served as Deputy CEO at BCP focusing on Wholesale Banking, from July 1, 2020 until December 2021, and as Head Wholesale Banking at BCP beginning in April 2018. In 2013, Mr. Cavero led the creation of the Efficiency Division, a model later implemented across other divisions of the Group. Prior to this, he was CEO of BCP Bolivia from 2008 to 2012 and currently he serves as Chairman of its Board.
Mr. Cavero is currently Chairman of the Board of Directors of Yape Market S.A.C. and a member of the Board of Directors of Inversiones 2020, Inversiones Credicorp Bolivia S.A., CCR Inc., Atlantic Security International Financial Services Inc., Atlantic Security Private Equity General Partner, Atlantic Private Equity Investment Advisor, Inversiones Credicorp Bolivia S.A., Banco de Crédito de Bolivia and Patronato BCP. He joined Credicorp Ltd. in 1994.
Mr. Cavero holds a degree in Business Administration from Universidad de Lima (Peru) and holds an MBA from the University of Texas (United States).
Javier Ichazo
Mr. Ichazo is the CEO of Mibanco and Head of Microfinance of Credicorp. He began his career at Banco de Credito del Peru in 1996 and has held different positions across various regions of Peru. In addition to his knowledge in banking and finance, Mr. Ichazo brings experience from his role as Business Manager at Banco de Credito del Peru from 2004 to 2017.
Mr. Ichazo is the Chairman of the Board of Mibanco Colombia, and Vice Chairman of the Board of ASOMIF (Association of Microfinance Institutions of Peru) and director of Credicorp Holding Colombia S.A.S.
Mr. Ichazo holds a degree on Business Administration from the University of Piura (Peru) and holds an MBA from the School of Management of the University of Piura (Peru).
Cesar Rivera
Mr. Rivera served as the CEO of Pacífico Seguros and Head of the Insurance and Pension Funds Business Line until December 31, 2025. With over 30 years of experience in the Pensions and Insurance sector, he has also held the positions of CEO at Santander Life Insurance Company in Peru, Deputy CEO at American Life Insurance Company in Argentina, and CEO at Pacífico Vida Life Insurance Company in Peru.
He served as a professor of the Business and Economy Faculty at the Universidad de Piura and was a member of the Board of Directors at the Ibero-American Foundation for Occupational Health and Safety (FISO by its Spanish initials).
Mr. Rivera holds a degree in Industrial Engineering from the Universidad de Piura and an MBA from ESAN (Peru). He also holds a Diploma in Corporate Finance from the Universidad del Pacífico (Peru) and an International Certificate in Company Direction, issued by the Institute of Directors in United Kingdom. He has studied different programs in
management and technical areas, such as the Management Program at Wharton School University of Pennsylvania (United States), and the Life Insurance Program at the Swiss Insurance Training Centre in Zurich (Switzerland).
Eduardo Montero
Mr. Montero served as Head of the Investment Management and Advisory business line of Credicorp Ltd. and CEO of Credicorp Capital Ltd. from January 2019 to December 31, 2025. He has been working at Credicorp since 1994. His broad experience within the organization includes different roles in Corporate Finance, Business Solutions, as well as Personal Banking and Wealth Management at Banco de Credito del Peru. He also served as CEO at Atlantic Security Bank, BCP Miami and Credicorp Capital Securities (United States).
Mr. Montero holds a bachelor's degree in Economics from Lehigh University (United States), and an MBA from the Wharton School of Business at the University of Pennsylvania (United States).
Jose Esposito
Mr. Esposito has served as Chief Corporate Audit Officer of Credicorp Ltd. since January 2010. He also serves as Head of the Audit Division at BCP.
He is member of the Professional Certifications Board (PCB) of the Institute of Internal Auditors Global (IIA GLobal), where he serves on its Investment Committee, and is a director of the Institute of Internal Auditors of Peru. He is also a member of the Stakeholders Advisory Council (SAC) of the International Auditing and Assurance Standards Board (IAASB) and the International Code of Ethics for Professional Accountants (IESBA). Formerly he served as member of the Board of Directors, a member of the Audit Committee and Chairman of the Financial Services Guidance Committee (FSGC) Board of the IIA. Mr. Esposito has also served as Chairman of the Committee of Internal Auditors of the Latin American Federation of Banks (FELABAN), Chairman of the Committee of Internal Auditors of ASBANC, and Chairman of the Audit Committee of Visanet Peru (now Niubiz). Currently, he is a lecturer and director of the Master's Program in Finance with a specialization in Integrated Risk Management at the Universidad del Pacífico in Peru.
Since 1996, Mr. Esposito has worked for various Credicorp Ltd Divisions. His last position prior to leading the Audit Division at Credicorp Ltd. was at Pacífico Peruano Suiza Compañía de Seguros y Reaseguros S.A., where he was the CFO and the Controller’s Officer. He was also Vice Chairman of the Board of Directors of Pacífico Salud EPS S.A., Vice Chairman and Board member of the Lima Stock Exchange, Director of Cavali ICLV S.A. and Chairman of the Board and CEO of Credibolsa SAB S.A. (now Credicorp Capital Sociedad Agente de Bolsa).
Mr. Esposito holds a bachelor’s degree in Economics from Universidad del Pacífico, Lima (Peru), and a master’s degree in Economics with a specialization in Econometrics from the University of Wisconsin – Milwaukee, (United States). He is a Certified Internal Auditor (CIA) and holds a Certification in Risk Management Assurance (CRMA) from the Institute of Internal Auditors Global (IIA); a Certification in Risk and Information Systems Control (CRISC) by ISACA; and is an Anti-Money Laundering Certified Associate (AML/CA) from the Florida International Bankers Association and Florida International University (United States).
Barbara Falero
Ms. Falero has served as Chief Compliance and Ethics Officer at Credicorp Ltd. and Banco de Credito del Peru since February 2008, reporting directly to Credicorp Ltd.’s Board.
Between 2000 and 2006, she worked as a regulator at the U.S. Federal Reserve Bank, where she was responsible for the supervision of international banks. She later served as Compliance Officer at BCP Miami Agency from 2006 to 2008. Prior to joining the Federal Reserve, she held various positions at BAC Florida Bank in Miami (United States).
Ms. Falero has held roles such as President of the Committee of Compliance Officers of ASBANC and a Member of the Advisory Committee of the Florida International Bankers Association (FIBA) for a three-year period.
Ms. Falero holds a bachelor’s degree in Finance from Florida International University (United States), and an MBA from St. Thomas University in Miami, Florida (United States).
Guillermo Morales
Mr. Morales has served as Head of Legal at Credicorp Ltd. since April 1, 2018. He served as Head of the Legal Division of Banco de Crédito del Peru from January 1, 2010 to January 31, 2022. Previously, he was the Manager of the Legal Advisory Area at BCP from September 2007 to December 2009, Legal Manager of Grupo Santander Peru S.A. from January 2003 to July 2007, and Legal Manager of Banco Santander Central Hispano Peru from April 2000 to December 2002.
Mr. Morales holds a law degree from the Pontificia Universidad Católica del Peru (Peru) and has a Master of Laws (LL.M.) from the University of Texas at Austin (United States).
Ursula Alvarez
Ms. Alvarez has served as Head of People Strategy at Credicorp since 2024. She began her career at BCP in 2006 as Manager of Selection in Human Resources Management, and later served as Head of Talent Management at Credicorp from 2009 to 2024.
Ms. Alvarez holds a bachelor’s degree in Psychology from University of Lima (Peru) and a master’s degree in Development from Universidad de los Andes in Bogota (Colombia).
Enrique Pasquel
Mr. Pasquel has served as Head of Corporate Affairs at Credicorp Ltd. since April 2018 and as Head of Corporate Affairs of BCP since 2017. Previously, between 2011 and 2017, he worked at El Comercio newspaper, where he held the positions of Deputy Opinion Editor, Politics Editor, and Deputy Editor in Chief. Prior to his journalism career, he worked as an attorney in INDECOPI, the Peruvian antitrust agency, where he served as Commissioner of the Bureaucratic Barriers Commission and Technical Secretary of the Competition Chamber.
Mr. Pasquel holds a law degree from the Pontificia Universidad Católica del Peru (Peru), and a Master of Laws (LL.M.) from Yale Law School (United States).
“See “ITEM 4. INFORMATION ON THE COMPANY - 4. A History and development of the Company – Recent Developments” for updated information about changes to the composition of the Senior Management since January 1, 2026.”
6.BCompensation
The following section contains the compensations of the members of Credicorp Ltd.’s Board of Directors and senior management for 2023, 2024, and 2025:
| | | | | | | | | | | | | | | | | |
| As of December 31, |
| 2023 | | 2024 | | 2025 |
| (in thousands of Soles) |
| | | | | |
Director’s compensation (1) | 7,387 | | | 8,628 | | | 11,221 | |
Senior Management Compensation (2) | | | | | |
i)Remuneration | 49,573 | | | 62,258 | | | 66,485 | |
Expense for long‑term incentive programs (Stock awards) (3) | | | | | |
i)Value Generation | 7,127 | | | 15,066 | | | 20,954 | |
ii)Retention | 22,316 | | | 21,773 | | | 19,857 | |
| Total | 86,403 | | | 107,725 | | | 118,517 | |
(1)This item includes amounts paid by Credicorp Ltd. and its subsidiaries to the nine Directors of Credicorp Ltd. as exclusive compensation for their service as members of the Board of Directors, the Audit Committee, the Compensation and Nomination Committee, the Sustainability Committee, and the Risk Committee of Credicorp Ltd., as well as for their service on the Boards of Directors and the Executive Committees of Credicorp Ltd.’s subsidiaries.
The members of the Board of Directors are listed in ITEM 6. DIRECTORS, SENIOR MANAGEMENT AND EMPLOYEES - 6.A Directors and Senior Management - (1) Board of Directors.
(2)The members of senior management according to ITEM 6. DIRECTORS, SENIOR MANAGEMENT AND EMPLOYEES - 6. A Directors and Senior Management.
(3)This item includes the amounts correspond to the expenses accrued in the period in accordance with the terms of the Group's long-term incentive programs.
Credicorp and its subsidiaries do not set aside or accrue funds to provide pension, retirement, or similar benefits for the directors and other members in management.
For further details about the compensation of Directors and Senior Management, see “ITEM 6. DIRECTORS, SENIOR MANAGEMENT AND EMPLOYEES – 6.C Board Practices”.
Board of Directors Compensation
Information on the annual remuneration of directors, the remuneration of the Board Committees, as well as the list of members of the Board Committees, once approved at the respective Annual Shareholders Meeting and the Board of Directors, respectively, is made public through material event disclosures in Peru and through Form 6-K disclosures.
Board Remuneration
The remuneration of the Directors of Credicorp Ltd. and its subsidiaries is approved at their respective Annual General Meetings (AGM).
The total compensation of the Members of Credicorp Ltd.’s Board of Directors is composed of a gross annual remuneration of US$50,000 to each Director, as approved on March 27, 2023; gross annual remuneration of US$40,000 to each Director who serves in the Audit Committee; and up to US$1,500 per attended session to each Director who participates in one or more of the Board Committees other than the Audit Committee.
Additionally, the Directors of Credicorp Ltd. who also serve as Directors of its subsidiaries might receive a remuneration from such subsidiary. Those who participate in the Board of Directors of BCP Stan-alone, the main subsidiary of Credicorp Ltd., receive a gross annual remuneration of US$130,000 each and US$1,500 for each session attended by each Director serving on its Executive Committee. Directors who participate in BCP’s Risk Committee receive US$750 (gross amount) per session attended. This remuneration is applicable to those Directors who do not receive remuneration, or allowances, for the exercise of a similar function in Credicorp Ltd. or Grupo Crédito S.A.
Directors received no other compensation or benefits in their capacities as directors of Credicorp Ltd. in 2025. Neither Credicorp Ltd. nor any of its subsidiaries has any type of agreement with Credicorp Ltd.’s Directors providing for benefits upon termination of their term as Directors.
Senior Management Compensation
Our senior management’s compensation comprises a fixed salary and a variable compensation:
•Fixed Salary
The fixed salary is that assured for under the law of the country where Credicorp operates. It is based on the position’s value and the degree of responsibility, has no variable component and is never linked to results achieved.
•Variable Compensation
Variable compensation is comprised of:
(i)Short-term incentive compensation that encourages senior management to achieve Credicorp’s annual goals by meeting individual and organizational objectives. This incentive payment is triggered when Credicorp’s minimum net profit is delivered, calculated as a proportion of that total target met, and on the individual’s results against their particular objectives related to indicators such as profitability, efficiency, customer
experience, transformation and sustainability (ESG) indicators, which vary by subsidiary and are aligned with the company’s business strategy and/or the overall Credicorp strategy.
(ii)Long-term incentive compensation (stock awards) aims to align the interests of the senior management with those of the shareholders so that they all share Credicorp’s successes and risks and to foster long-term value creation for the organization and its stakeholders. It has two components:
•Retention: The aim is to retain executives by delivering an amount of restricted BAP shares which are vested over three years, with 1/3 released each year.
•Value generation: The aim is to guide executives’ performance toward creating long-term value for Credicorp by linking payment to the fulfillment of long-term strategic indicators.
Retention Stock Awards to Senior Management and Employees
As part of the Group’s long‑term incentive program designed to promote employee retention, Credicorp grants shares of its common stock to certain key executives between February and March of each year under two long‑term incentive plans: the Retention Plan and the Value Creation Plan. Under the Retention Plan, the granted shares vest on a straight‑line basis over a three‑year period, with 33.3% of the total shares vesting each year. Under the Value Creation Plan, the shares are delivered at the end of a three‑year performance period, subject to the achievement of specifics performance metrics.
We present below the common stock granted to both Credicorp’s senior management and employees during the years 2023, 2024, and 2025, and granted but unvested shares as of December 31, 2023, 2024, and 2025.
| | | | | | | | | | | | | | | | | | | | | | | | | | | | | | | | | | | | | | |
| | Year ended December 31, | | As of December 31, |
| | 2023 | | 2024 | | 2025 | | 2023 | | 2024 | | 2025 |
| | Granted shares in units | | Granted but unvested shares in units |
| Senior Management | | 35,445 | | 23,268 | | 20,465 | | 62,302 | | 57,803 | | 47,792 |
| Employees | | 83,359 | | 59,319 | | 54,569 | | 202,948 | | 267,988 | | 347,091 |
| Total | | 118,804 | | 82,587 | | 75,034 | | 265,250 | | 325,791 | | 394,883 |
6.CBoard Practices
Board Structure
Credicorp’s management is the responsibility of its Board of Directors, which, pursuant to Credicorp’s Bye-laws, is composed of nine members. As of December 31, 2025, five Directors were independent. Directors may be, but are not required to be, shareholders. Directors are elected, and their remuneration is determined at the Annual General Meeting of Shareholders. Directors hold office for three-year terms. As of December 31, 2025, all Directors had been elected at the Annual General Meeting of Shareholders held on March 27, 2023, and held office until the Annual General Meeting of Shareholders in 2026. The Board of Directors has the power to appoint any person as a Director to fill a vacancy as a result of the death, disability, disqualification, or resignation of any Director for the remainder of such Director’s term. Pursuant to Credicorp’s Bye-laws, the required quorum for business to take place during a Board meeting is a simple majority of the Directors. A resolution in writing signed by all directors will be valid as if it had been passed at a Board meeting duly called and constituted. For further details, see “ITEM 6. DIRECTORS, SENIOR MANAGEMENT AND EMPLOYEES – 6.A Directors and Senior Management”.
Board Decision-making
For the purposes of complying with the Bermuda Government’s Economic Substance regulations, the Board of Directors decided to limit its decisions to matters pertaining to the strategy, objectives, and goals of the Company, as well as main action plans and policies, risk control and management, annual budgets, business plans and control of their implementation, supervision of main expenses, investments, and acquisitions and dispositions, among other decisions of a “passive” nature related to the Company, beginning in October 29, 2020.
Following these changes, the Board of Directors of Grupo Crédito S.A., a subsidiary of Credicorp, has the authority to make “active” decisions pertaining to Credicorp’s subsidiaries, such as making relevant strategic or management
decisions, incurring expenditures on behalf of affiliates, coordinating group activities, and providing credit facilities to its affiliates.
Board Committee Structure
The Boards of Directors (and Board Committees) of Credicorp and Grupo Crédito S.A. are composed of the same individuals and the management structure in both companies has been standardized. Credicorp’s and Grupo Crédito S.A.’s Boards of Directors, acting on the recommendation of the Compensation and Nominations Committee, decide on the appointment, ratification, or removal of committee members. Directors who are members of committees are appointed to an initial term of up to three-years and maintain such appointments only while being a member of the Board. Regarding Board Committees, the Board of Directors of Credicorp and Grupo Crédito S.A. designates a chairperson among its members and approves the respective charters.
On February 5, 2020, the Board of Directors agreed to simplify the structure of its committees, reducing the number of committees from seven to four. As a result, the Executive Committee and the Investment Committee were eliminated, and the Compensation Committee and the Nominating Committee were integrated.
On June 3, 2020, the Board of Directors approved new criteria to define which Directors are categorized as independent. International references for best practice were utilized to improve and broaden the independence criteria. The new scope can be found in Credicorp’s Corporate Governance Policy, which is available on Credicorp’s web page.
For the purposes of complying with the Bermuda Government’s Economic Substance regulations, Credicorp’s Board of Directors decided to limit its decisions to “passive” matters related to the Company, beginning on October 29, 2020. For further details, see “ITEM 6. DIRECTORS, SENIOR MANAGEMENT AND EMPLOYEES – 6.C Board Decision-Making”.
On December 17, 2020, the Board of Directors of Credicorp approved an initiative to broaden the scope of the Corporate Governance Committee, which was renamed to “Sustainability Committee” to reflect its goal to lead and supervise Credicorp’s Sustainability program. For further information, see “ITEM 4. INFORMATION ON THE COMPANY – 4.B Business Overview – (1) Credicorp Overview – Our ESG Approach”.
Credicorp’s Board of Directors has established the following Committees:
(1)The Audit Committee was created on October 31, 2002.
(2)The Corporate Governance Committee was created on June 23, 2010. On December 17, 2020 it expanded its functions and renamed as the Sustainability Committee.
(3)The Compensation and Nominations Committee was formed on June 5, 2020, as a result of the integration of the Compensation Committee (created on January 25, 2012) and the Nominations Committee (created on March 28, 2012).
(4)The Risk Committee was created on March 28, 2012.
(1)Audit Committee
As of December 31, 2025, the Audit Committee’s membership is composed of three Directors from Credicorp’s Board. The Committee must include at least one member who is a financial expert and at least one member should be a woman. The Chairman of the Board of Directors cannot be a member of the Committee. All members of the Committee must be independent, according to the definition of independence set forth by Rule 10A-3 under the Securities Exchange Act of 1934 (the “Exchange Act”). In order to be considered independent, an Audit Committee member must not (i) accept from Credicorp or any of its subsidiaries, directly or indirectly, any consulting, advisory or other compensatory fee, other than the compensation paid to him or her in his/her capacity as a Director with the exception of retirement plans that meet the conditions established by the SEC; nor (ii) be an affiliated person of Credicorp or its subsidiaries (that is, they must not own or control, directly or indirectly, more than 10% of the Company's voting shares and they must not be an executive officer of Credicorp, according to Rule 10A-3 under the Exchange Act and the U.S. SEC).
The Committee has the purpose of carrying out the supervision, monitoring, and independent review of:
•The processes for submission of the financial and accounting information of Credicorp and subsidiaries;
•The internal control procedures of Credicorp and subsidiaries; specifically, the financial reporting internal control system;
•The audits conducted on the financial statements of Credicorp and subsidiaries;
•The completeness of the financial statements of Credicorp and subsidiaries;
•The procedures for the receipt, retention and treatment of complaints regarding accounting, internal accounting controls and auditing matters, through Credicorp’s Complaint System; and
•The appointment of the independent auditor and the internal auditor of the Credicorp and subsidiaries.
The Audit Committee safeguards the interests of investors and oversees compliance with the rules of the SEC and other regulatory entities.
The Audit Committee should act as supervisor over Credicorp's financial information system, helping to ensure that:
•Management implements an adequate internal control system; in particular, the financial reporting internal control systems;
•Appropriate procedures to assess the Credicorp’s and its subsidiaries’ internal control system objectively and regulatory and
•External auditors, through their own assessment, review the accounting and financial policies applied in the preparation of Credicorp and subsidiaries’ financial statements.
Furthermore, the Committee must facilitate communication among the external auditors, general managements of Credicorp and subsidiaries, the Internal Audit Division of BCP, in charge of the internal audit duties of Credicorp, hereinafter, the “Internal Audit Division”, and the Board of Directors of Credicorp.
As of December 31, 2025, the Audit Committee comprised three members: Ms. Patricia Lizarraga Guthertz (financial expert, independent, Chairwoman since June 9, 2020, and member since April 26, 2017), Ms. Maria Teresa Aranzabal Harreguy (independent, member since June 9, 2020) and Ms. Nuria Aliño Pérez (independent, member since April 27, 2023). On June 9, 2020, Mr. Raimundo Morales Dasso was appointed advisor to this committee. Credicorp’s Audit Committee held twelve meetings in 2025.
The Board of Directors has also assigned the Audit Committee the responsibility of overseeing the audit committees at all Credicorp’s subsidiaries, to the extent permitted by local regulations. According to SBS regulations, Credicorp’s Audit Committee functions as the statutory audit committee for BCP, SEAH, Mibanco Peru, Pacífico Seguros, Pacífico Salud and Prima AFP. Credicorp Capital Colombia, Credicorp Holding Colombia, Credicorp Capital Chile, ASB Bank Corp., Mibanco Colombia, BCP Bolivia and ICBSA are bound by special audit committee requirements set by local regulators. Nevertheless, the Audit Committee receives and oversees periodic information from the Corporate Chief Audit Executive and/or the unit’s chief auditors for all relevant Credicorp’s subsidiaries, including Credicorp Capital Colombia, Credicorp Holding Colombia, Credicorp Capital Chile, ASB Bank Corp., Mibanco Colombia, BCP Bolivia and ICBSA. Therefore, in practice, Credicorp’s Audit Committee oversees all of its relevant subsidiaries’ systems of internal control. For further information, please refer to "Item 16G. A The New York Stock Exchange – Corporate Governance”.
On April 1, 2026, Mr. Juan Paredes Manrique, a recently elected member of Credicorp's Board of Directors, was named to the Audit Committee of the Board. Mr. Paredes is a financial expert. He will be replacing Ms. Patricia Lizárraga as Chair of the Audit Committee. See “ITEM 4. INFORMATION ON THE COMPANY - 4. A History and development of the Company – Recent Developments.” The Audit Committee as composed as of the date of the filing of this Annual Report has approved the Form 20-F.
(2)Sustainability Committee
On December 17, 2020, the Board of Directors renamed the Corporate Governance Committee as the Sustainability Committee. As of December 31, 2025, Credicorp’s Sustainability Committee comprised five directors from Credicorp. At least two members should be independent: one of them chairs the Committee, and at least one should be a woman.
As of December 31, 2025, the Sustainability Committee is composed of Ms. María Teresa Aranzábal (Chairwoman, independent), Mr. Antonio Abruña (independent), Ms. Patricia Lizárraga (independent), Mr. Leslie Pierce (non-independent), and Mr. Pedro Rubio (non-independent). In 2025, Credicorp’s Sustainability Committee held six meetings.
The Sustainability Committee is responsible, among other functions, for (i) reviewing Credicorp's Sustainability and ESG strategy and initiatives and following up on its most relevant activities, including the Sustainability program; (ii) proposing to the Board of Directors and ensuring the execution of good practices, sustainability and corporate governance policies to be implemented throughout the Company; (iii) supervising the development of the strategic initiatives of the Corporate Compliance and Ethics Division, including assessing its performance as well as reviewing its Strategic Plan and objectives, annual work plan, periodic reports, and changes in policies; (iv) supervising the operation of the complaints system; (v) ensuring the adequate attention to conflicts of interest or ethics of Directors and senior executives, as well as transparency in relationships with related parties; and (vi) proposing to the Board of Directors the independence criteria of the Directors and the members of the Audit Committee and reviewing them periodically to ensure their validity over time.
On April 1, 2026, Mr. Manuel Romero, a recently elected member of Credicorp's Board of Directors, and Ms. Nuria Aliño Pérez, were named to the Sustainability Committee of the Board. See “ITEM 4. INFORMATION ON THE COMPANY - 4. A History and development of the Company – Recent Developments.”
(3)Compensation and Nominations Committee
Until June 5, 2020, Credicorp's Board of Directors had separate committees for Compensation and Nominations. These committees were subsequently combined to form the Compensation and Nominations Committee. As of December 31, 2025, Credicorp’s Compensation and Nominations Committee consisted of five directors. At least two members should be independent, one of whom chairs the Committee, and at least one should be a woman.
As of December 31, 2025, the members of the Compensation and Nominations Committee were Mr. Alexandre Gouvêa (Chairman, independent), Mr. Luis Enrique Romero Belismelis (non-independent), Mr. Jose Raimundo Morales (non-independent), Mr. Antonio Abruña (independent) and Ms. María Teresa Aranzábal (independent). The Compensation and Nominations Committee held two meetings in 2025.
Credicorp does not have a fully independent Compensation and Nominations Committee. When the Committee was created, the Board of Directors determined that the most important criterion to select Directors to serve on the Committee was deep knowledge of the organization and its people, which, coupled with the leadership and continuity provided by senior management, ensures that the organization functions efficiently. The Board of Directors believes that each individual on the Committee makes quality, independent judgments in the best interests of Credicorp with regard to all relevant issues and that the committee’s structure currently represents the best possible configuration to ensure that goals are met.
The Compensation and Nominations Committee is responsible for (i) selecting and recommending to the Board of Directors the nominees to be Directors of Credicorp Ltd. for submission to the General Meeting of Shareholders of Credicorp, as well as the nominees to fill any vacancies in the Board of Directors; (ii) performing an evaluation of the candidates for the Board of Directors to determine if they meet Credicorp's independence criteria; (iii) proposing to the Board of Directors of Credicorp, for submission to the General Meeting of Shareholders, the attendance fees, remuneration levels and other compensation and benefit policies of the members of the Credicorp Board of Directors and its Committees; and (iv) establishing the general guidelines of the Compensation Policy that must be implemented in Credicorp. The Compensation and Nominations Committee operates in accordance with the terms of reference outlined in the
Compensation and Nominations Regulations, which is an internal regulation of Credicorp, and defines the Committee’s composition, functions, meeting procedures, and minute recording, among other aspects.
On April 1, 2026, Ms. Nuria Aliño and Mr. Pedro Rubio were named to the Compensation and Nominations Committee of the Board. Ms. Aliño will be replacing Mr. Alexandre Gouvêa as Chair of the Compensation and Nominations Committee. See “ITEM 4. INFORMATION ON THE COMPANY - 4. A History and development of the Company – Recent Developments.”
(4)Risk Committee
As of December 31, 2025, Credicorp’s Risk Committee’s consisted of five directors from Credicorp or its subsidiaries. At least two members must be independent, and one should be a woman.
As of December 31, 2025, the members of the Risk Committee were Mr. Pedro Rubio (Chairman, non-independent), Mr. Luis Enrique Romero Belismelis (Chairman of the Board of Directors, non-independent), Mr. Alexandre Gouvêa (independent), Ms. Nuria Aliño (independent), and Mr. Jose Raimundo Morales (non-independent). The Risk Committee held one meeting on December 1, 2025.
The Risk Committee’s duties are: (i) acknowledging and informing Credicorp’s Board of Directors the level of compliance with the risk appetite and the level of exposure assumed by the Group; (ii) acknowledging the relevant improvements in the comprehensive risk management of the Group; and (iii) proposing to the Board the acceptable risk appetite and risk tolerance for Credicorp.
On April 1, 2026, Ms. María Inés Álvarez and Mr. Juan Paredes were named to the Risk Committee of the Board. Furthermore, Ms. Nuria Aliño Pérez no longer serves as a member to such Committee. See “ITEM 4. INFORMATION ON THE COMPANY - 4. A History and development of the Company – Recent Developments.”
6.DEmployees
As of December 31, 2025, Credicorp had a total of 49,581 employees, comprising 48,320 full-time and 1,261 part-time employees, as presented in the table below. This total excludes 1,424 interns, which would increase total employees to 51,005.
| | | | | | | | | | | | | | | | | | | | |
| As of December 31, | | | | | | |
| | 2023 | | 2024 | | 2025 |
| Universal Banking | | | | | | |
BCP Stand-alone (1) | | 17,895 | | 19,030 | | 21,064 |
Inversiones Credicorp Bolivia (ICBSA) (2) | | 1,803 | | 1,900 | | 2,042 |
| Microfinance | | | | | | |
| Mibanco | | 9,842 | | 9,950 | | 9,536 |
Mibanco Colombia (3) | | 2,296 | | 2,228 | | 2,627 |
| Insurance and Pensions | | | | | | |
Grupo Pacífico (4) | | 2,601 | | 2,828 | | 10,704 |
| Prima AFP | | 569 | | 555 | | 534 |
| Investment Management and Advisory | | | | | | |
| ASB Bank Corp. | | 145 | | 155 | | 167 |
Credicorp Capital Ltd. (5) | | 1,784 | | 1,828 | | 1,939 |
| Others | | | | | | |
Grupo Crédito S.A.(6) | | 139 | | 202 | | 267 |
Krealo Management S.A.(7) | | – | | – | | 683 |
| Wally | | – | | – | | 15 |
| Instituto Bicentenario | | – | | – | | 3 |
| Total Credicorp | | 37,074 | | 38,676 | | 49,581 |
(1)BCP Stand-alone includes employees from BCP Miami and BCP Panama and, since 2025 includes YapeMarket and Culqi.
(2)ICBSA includes BCP Bolivia, Credibolsa, Credifondo, Crediseguro Seguros Personales and Crediseguro Seguros Generales.
(3)Mibanco Colombia is a result of the merger of Encumbra and Bancompartir. 2019 figures only include Encumbra employees.
(4)Employees of the Pacific corporate health insurance are included from 2025, also including employees of private hospitals, since in 2025 Credicorp acquired the remaining 50% of shares becoming the sole owner.
(5)Includes Credicorp Capital Colombia, Credicorp Capital Chile, Credicorp Capital Securities, Credicorp Capital USA and Credicorp Capital Peru.
(6)Started operations in April 2018. Previously called Credicorp Peru.
(7)Includes Tenpo, Tyba and Monokera.
The following table shows employees by geographic location based on where the company operates:
| | | | | | | | | | | | | | | | | | | | |
| As of December 31, |
| | 2023 | | 2024 | | 2025 |
| Perú | | 31,578 | | 33,049 | | 43,373 |
| Colombia | | 3,279 | | 3,297 | | 3,705 |
| Bolivia | | 1,803 | | 1,900 | | 2,042 |
| Chile | | 188 | | 182 | | 192 |
| Panamá | | 143 | | 163 | | 175 |
| USA | | 83 | | 84 | | 93 |
| México | | — | | 1 | | 1 |
| Total Credicorp | | 37,074 | | 38,676 | | 49,581 |
In 2025, the number of Credicorp’s employees increased by 10,905, or 28.2%, mainly due to the incorporation of Pacífico corporate health insurance employees and private hospitals, that represents 7,792 or 20.1%, and the increase in technology and commercial teams at BCP Stand-alone.
All bank employees in Peru have the option of belonging to an employee union. The last strike of employees of BCP Stand-alone occurred in 1991 and did not interfere with our operations. In July 2013, we were informed of the establishment of the BCP Stand-alone independent employee union, which represented 0.17% of BCP Stand-alone’s employees at that time. Today, the employee union represents 0.6% of the total employees of BCP Stand-alone. The relationship with this union has been cordial with agreements reached since April 2016 and we are currently negotiating the 2025–2026 collective bargaining agreement.
6.EShare Ownership
Board of Directors
The following persons were beneficial owners of the listed numbers of common shares of Credicorp Ltd. (as the term “beneficial owner” is defined in Form 20-F) as of December 31, 2025.
| | | | | | | | | | | | | | | | | |
| Director | | Share Ownership | | | Percentage |
| Luis Enrique Romero B. | | 11,596,742 | (1) | | 12.29 | % |
| Raimundo Morales D. | | - | | | - | |
| Nuria Aliño P. | | - | | | - | |
| Patricia Lizarraga G. | | - | | | - | |
| Antonio Abruña P. | | - | | | - | |
| Maria Teresa Aranzábal H. | | - | | | - | |
| Alexandre Gouvea | | - | | | - | |
| Pedro Rubio F. | | - | | | - | |
| Leslie Pierce D. | | - | | | - | |
(1)Includes beneficially owned shares of the Romero family (Mr. Luis Enrique Romero B. and their family or companies owned or controlled by them).
Common shares held by our directors and our senior management do not have voting rights different from shares held by our other shareholders. As of December 31, 2025, there are no stock options granted by Credicorp to acquire any of Credicorp’s outstanding common shares.
Senior Management
Excluding Mr. Luis Romero Belismelis, our Executive Chairman, whose share ownership is set forth above, as of December 31, 2025, members of our senior management, as defined in “ITEM 6. DIRECTORS, SENIOR MANAGEMENT AND EMPLOYEES” own 157,089 Credicorp shares, which represents 0.17% of our total outstanding shares. While each member of our senior management owns Credicorp shares, none (other than our Executive Chairman) owns more than 1% of our total outstanding shares.
Employees
As of December 31, 2025, Credicorp’s employees, excluding members of our senior management, own 402,049 Credicorp shares (granted by Credicorp as part of Credicorp’s long-term compensation program for its key employees and purchased by Credicorp’s employees), which represents 0.43% of our total outstanding shares.
6.FDisclosure of a Registrant’s Action to Recover Erroneously Awarded Compensation
Not applicable.
ITEM 7.MAJOR SHAREHOLDERS AND RELATED PARTY TRANSACTIONS
7.AMajor Shareholders
As of December 31, 2025, Credicorp had issued 94,382,317 common shares, of which 14,620,846 were held by ASHC. Under Bermuda law, ASHC has voting rights on the common shares it holds. Until 2003, ASHC held 10,158,204 common shares. In April 2004, common shares held by BCP and Grupo Pacífico were transferred to ASHC, totaling 14,620,846 common shares. The table below provides details about the percentage of Credicorp’s common shares owned by holders of 5% or more of our total common shares based on available information. There have been no significant changes in the percentage of ownership held by any major shareholders in the past three years.
| | | | | | | | | | | | | | |
| Owner | | Common Shares | | Percent of Class (1) |
| Atlantic Security Holding Corporation | | 14,620,846 | | 15.49 | % |
Romero family (2) | | 11,596,742 | | 12.29 | % |
(1)As a percentage of all issued and outstanding shares (including shares held by ASHC).
(2)It includes common shares directly or indirectly owned by Luis Romero Belismelis and his family or companies owned or controlled by them. Mr. Romero B. is the Chairman of the Board.
Voting rights of major shareholders are not different from voting rights of other shareholders. Each share has right to one vote, including the shares owned by Atlantic Security Holding Corporation.
Approximately 9.43% of Credicorp’s total issued and outstanding common shares are currently held in 3,492 individual accounts with Cavalli, a Peruvian security clearing company.
As of December 31, 2025, Credicorp had 79,366,588 floating common shares (excluding the 14,620,846 shares held by ASHC and 394,883 shares held by Credicorp’s subsidiaries that correspond to Credicorp’s long-term compensation program for its key employees). For more details regarding our treasury stock see Note 16 (b) to our consolidated financial statements. Approximately 90% of the 94,382,317 Credicorp’s issued common shares were held in the United States. There were approximately fifty registered holders of Credicorp’s common shares in the United States. Because many of these common shares were held by brokers or other nominees, and because of the impracticability of obtaining accurate residence information for all beneficial shareholders, the number of registered holders in the United States is not a representative figure of the beneficial holders or of the residence of beneficial holders. Credicorp is neither directly nor indirectly controlled by another corporation or by any foreign government.
7.BRelated Party Transactions
Under Bermuda law, Credicorp is not subject to any restrictions on transactions with affiliates, other than such restrictions as are applicable to Bermuda companies generally. Credicorp’s Bye-laws provide that a Director may not vote with respect to any contract or proposed contract or arrangement in which that Director has an interest or a conflict of interest. Credicorp has not engaged in any transactions with related parties except through our subsidiaries.
Credicorp’s consolidated financial statements as of December 31, 2023, 2024 and 2025 include transactions with related parties, including (i) related companies such as associates or others, (ii) its Board of Directors, (iii) its senior management, (iv) close members of the families of its Directors or members of its senior management and (v) enterprises that are controlled by these individuals or entities through majority shareholding or their role as chairman or principal executive officer in those companies.
Transactions between the Credicorp companies and those related to Credicorp that exceed US$1 million must have the approval either of the Board of Directors involved or of the body to which this Board has delegated the responsibility. The Finance Areas of each company are responsible of identifying these operations and escalating them to the Board of Directors.
Transactions between Credicorp companies and between Credicorp companies and their employees (without being limited to banking, financial, securities brokerage, investment, other financial services, payments of tariffs and regulatory contributions) that are made in the normal course of its operations, at market prices and values, or in substantially the same terms, including yields, interest rates and collateral, as compared to those prevailing at the same time with third parties, and
that do not imply a higher collectability risk and do not present any additional unfavorable terms for Credicorp company, are expressly exempted from this requirement. These transactions are considered pre-approved by Credicorp's Board of Directors and may be reported to the Sustainability Committee in order to ensure good practices and detect potential conflicts of interest. For the daily approval of these transactions, the current policies and regulations of each Credicorp company will be followed.
The following table shows Credicorp subsidiaries’ main transactions with related companies as of and for the years ended December 31, 2023, 2024 and 2025.
| | | | | | | | | | | | | | | | | |
| Year ended December 31, (2) |
| 2023 | | 2024 | | 2025 |
| Statement of financial position | (in thousands of soles) |
| Direct loans | 2,063,739 | | | 2,472,179 | | | 1,855,712 | |
| Investments (1) | 806,700 | | | 611,271 | | | 874,937 | |
| Deposits | (713,503) | | | (1,839,980) | | | (659,231) | |
| Derivatives at fair value | 516,292 | | | 280,624 | | | 354,610 | |
| | | | | |
| Statement of income - | | | | | |
| Interest income related to loans – income | 31,892 | | | 55,485 | | | 7,715 | |
| Interest expense related to deposits – expense | (30,914) | | | (37,308) | | | (5,122) | |
| Non-interest income | 9,452 | | | 22,735 | | | 19,644 | |
| | | | | |
| Contingent risks and commitments | | | | | |
| Indirect loans | 584,463 | | | 746,992 | | | 518,493 | |
(1)As of December 31, 2025, the balance includes mainly S/206.3 million of corporate bonds of Alicorp S.A.A., S/151.7 million of corporate bonds issued by Pluz Energía Perú S.A.A., S/150.8 million of corporate bonds issued by Corporacion Primax and S/95.3 million of corporate bonds of Cementos Pacasmayo S.A.
As of December 31, 2024, the balance includes mainly S/155.7 million of corporate bonds of Alicorp S.A.A., S/93.9 million of corporate bonds issued by Cementos Pacasmayo S.A., and S/104.2 million of shares of Inversiones Centenario.
(2)Excludes transactions with subsidiaries.
Credicorp subsidiaries entered into these transactions with related parties in the ordinary course of business and in accordance with normal market terms, including interest rate and collateral, which were available to other customers for comparable transactions at that time, and they did not involve more than the normal risk of collectability or present other unfavorable features. Outstanding loan balances at year-end were guaranteed by the related party. The Peruvian financial system law prohibits us from giving more favorable conditions to related parties. On December 31, 2025, direct loans had guarantees and collateral provided by the related party, mature between January 2026 and July 2032, and accrue an average annual interest in soles of 10.08 percent and an average annual interest rate in foreign currency of 8.23 percent (as of December 31, 2024, they mature between January 2025 and December 2030, and accrued an average annual interest in soles of 10.78 percent and an average annual interest rate in foreign currency of 9.56 percent). Also, as of December 31, 2025, the Group maintains S/87.4 million of allowances for loan losses to related parties (as of December 31, 2024 it maintains S/58.1 million). The amount of this provision is adjusted on a continuous basis and based on the financial position of each related party and the market in which it operates.
As of December 31, 2025, the related company that had the largest debt balance of direct loans with Credicorp was in the cement sector with a total balance of S/422.9 million. This balance included short-term financing. Interest rates of the operations ranged from 4.53% to 60.10% in soles. As of December 31, 2024, the related company that had the largest debt balance of direct loans with Credicorp was in the cement sector with a total balance of S/540.8 million. This balance included short-term financing. Interest rates of the operations ranged from 5.82% to 26.68% in soles. As of December 31, 2023, the related company that had the largest debt balance of direct loans with Credicorp was in the cement sector with a total balance of S/428.9 million. This balance included short-term financing. Interest rates of the operations ranged from 5.82% to 9.44% in soles.
As of December 31, 2023, 2024 and 2025, Credicorp’s Directors, officers and employees had been involved, directly and indirectly, in credit transactions with certain subsidiaries of the Group, as permitted by Peruvian Banking and Insurance Law No. 26702, which regulates and limits certain transactions with employees, Directors and officers of a bank and insurance company. On December 31, 2023, 2024 and 2025, direct loans to employees, Directors, senior management, and their family members amounted to S/1.4 billion, S/1.4 billion and S/1.5 billion, respectively. These loans have been granted in the ordinary course of business and on market terms as allowed by regulations promulgated under Section 402 of the Sarbanes-Oxley Act. Therefore, no privileged conditions have been granted on any type of loans to Directors and executive officers. These loans are paid monthly and earn interest at rates that are similar to market rates for comparable loans.
In 2025, Credicorp and subsidiaries made payments totaling approximately US$17 million to the following related suppliers: Grupo Romero and subsidiaries, Grupo Centenario and subsidiaries, Pluz Energía Peru SAA, Edenred Peru SA, Entel SA and CIA Latinoamericana de Radiodifusion SA. This information is being disclosed in accordance with our Corporate Policy on Related Parties, which came into effect in December 2019.
Subsidiaries Transactions
The following table shows Credicorp’s main transactions with subsidiaries companies as of and for the years ended December 31, 2023, 2024 and 2025 which does not consider related party transactions.
| | | | | | | | | | | | | | | | | |
| As of December 31, |
| 2023 | | 2024 | | 2025 |
| Statement of financial position | (in thousands of soles) |
| Direct loans / receivables (1) | 1,132,893 | | | 932,949 | | | 721,269 | |
| Investments | 199,503 | | | 883,659 | | | 65,985 | |
| Funds / Deposits (2) | (1,824,745) | | | (2,455,731) | | | (1,123,074) | |
| Derivatives at fair value receivable / payable (*) | 8,841 | | | 3,628 | | | 3,848 | |
| Statement of income - | | | | | |
| Interest income related to loans – income (**) | 126,457 | | | 88,592 | | | 58,834 | |
| Interest expense related to deposits – expense (**) | (42,032) | | | (60,313) | | | (40,606) | |
| Non-interest income (**) | 119,813 | | | 112,198 | | | 175,451 | |
| Off-balance sheet | | | | | |
| Indirect loans | 450,799 | | | 1,209,529 | | | 1,218,773 | |
(1)The loans granted by these companies are recognized as receivable by the group companies that received the placement. These transactions are eliminated from the Statement of Financial Position.
(2)Funds available from various group companies are received by these subsidiaries as deposits. These operations are eliminated in the Statement of Financial Position.
(*) Accounts receivable for derivatives held by group companies will be accounts payable for the subsidiaries with which the derivative is agreed and vice versa. These transactions are eliminated from the Statement of Financial Position.
(**) Income recognized by group companies will be an expense for the subsidiaries with which the transaction was agreed. These transactions are eliminated from the statement of income.
The main direct loans and receivables between subsidiaries of the group are:
| | | | | | | | | | | |
| Grant the Loan | Receive the Loan | | At December 2025 (in thousands of Soles) |
| Sol-denominated: | | | |
| BCP Stand-alone | Mibanco - Banco de la Microempresa S.A. | | 520,274 | |
| BCP Stand-alone | Cía. Incubadora de Soluciones Móviles S.A.C. (Culqi) | | 64,393 | |
| BCP Stand-alone | Atlantic Security Holding Corporation | | 56,700 | |
| BCP Stand-alone | Solución Empresa Administradora Hipotecaria S.A. | | 18,400 | |
| BCP Stand-alone | Clinica San Felipe S.A. | | 4,610 | |
| BCP Stand-alone | Sistemas de Administración Hospitalaria S.A.C. | | 3,820 | |
| Others | | | 8,479 | |
| Total Sol-denominated | | | 676,676 | |
| Foreign currency-denominated: | | |
| BCP Stand-alone | Credicorp Capital SAB | | 20,460 | |
| ASB Bank Corp | Credicorp Capital Chile S.A. | | 11,776 | |
| BCP Stand-alone | Solución Empresa Administradora Hipotecaria S.A. | | 11,098 | |
| BCP Stand-alone | Credicorp Capital SAFI | | 842 | |
| Others | | | 417 | |
| Total foreign currency-denominated | | 44,593 | |
| Total | | | 721,269 | |
Main loans granted between group companies in soles amount to S/670.6 million with an average rate of 6.9% and with maturity between January 2026 and December 2028; in US Dollars amount to S/44.3 million with an average rate of 5.3% and with maturity between January 2026 and July 2026.
7.CInterests of Experts and Counsel
Not applicable.
ITEM 8.FINANCIAL INFORMATION
8.AConsolidated Statements and Other Financial Information
Our annual consolidated financial statements, audited by an independent registered public accounting firm (for years 2023, 2024 and 2025) and accompanied by an audit report, are included beginning on page F-1 of this Annual Report.
(1)Government Investigations
Credicorp was subject to an Administrative Sanctioning Proceeding (Procedimiento Administrativo Sancionador) initiated by the SMV in 2019, for the alleged failure to timely disclose to the market political contributions made in the years 2011 and 2016 (the latter made by three of its subsidiaries). Credicorp was notified of a first‑instance administrative resolution imposing monetary penalties, which was duly appealed. As the SMV did not resolve the appeal within the legally established term, Credicorp filed a judicial action (a contentious‑administrative lawsuit), which was admitted by the competent court. Accordingly, the administrative sanctioning proceeding was terminated, and the dispute is currently under judicial review and will be decided by the judicial branch. Notwithstanding the foregoing, Credicorp paid the fine imposed by the first‑instance administrative resolution in compliance with the applicable regulations in force.
Likewise, three subsidiaries of Credicorp (Banco de Crédito del Perú, Mibanco and Grupo Pacífico) were each subject to separate Administrative Sanctioning Proceedings initiated by the SMV for the alleged failure to timely disclose to the market political contributions made during the 2016 political campaign. Each of these entities was notified of first‑instance administrative resolutions imposing monetary penalties, which were duly appealed by each company. As the SMV did not resolve the appeals within the legally established term, each of the three subsidiaries filed a judicial action (a contentious‑administrative lawsuit), which was admitted by the competent courts. Consequently, the administrative
sanctioning proceedings were terminated, and the disputes are currently under judicial review and will be decided by the judicial branch. Notwithstanding the foregoing, each of the three subsidiaries paid the fine imposed by the first‑instance administrative resolution in compliance with applicable regulations in force.
In the opinion of Credicorp’s management, none of the judicial or administrative proceedings described above is expected to have a material adverse effect on the normal course of the company’s operations or business.
(2)Claim regarding alleged withholding on stock exchange transactions
Credicorp, through its subsidiary Grupo Crédito S.A., is subject to an administrative proceeding before the Peruvian Tax Superintendency (Superintendencia Nacional de Aduanas y de Administración Tributaria – SUNAT), relating to alleged taxes and interest arising from securities transactions carried out in 2018 and 2019. In June 2025, SUNAT issued Tax Assessment and Penalty Resolutions in an aggregate amount of approximately S/1,568 million, based on the alleged obligation to withhold income tax on certain transactions that, in the opinion of the Company and its legal advisors, satisfied the requirements under the regulations in effect at the time to qualify for an exemption.
On August 13, 2025, the amounts included in the Tax Assessment and Penalty Resolutions issued by SUNAT were paid, without prejudice to the Company's position and without constituting and acknowledgement of an enforceable tax liability. The corresponding amounts have been recognized as an asset under the caption “Claim filed with the Tax Authority” within the line item “Other assets” in accordance with IFRS. The amount is classified as an asset relating to an uncertain tax position.
Grupo Crédito has formally challenged the aforementioned Tax Assessment and Penalty Resolutions by filing an Administrative Claim with SUNAT, and the administrative proceeding is currently pending resolution by the tax authority. If necessary, the Company will continue to defend its position at subsequent administrative and judicial levels, including the Tax Court and the judiciary.
(3)Regulatory Sanctions
SBS Resolution No. 2755-2018, which approves the Regulation on Infringements and Sanctions of the SBS, requires the Board of Directors to inform the General Shareholders’ Meeting of the sanctions imposed by the SBS on supervised entities, as well as on their shareholders, directors, managers, and principal officers, when such sanctions arise from the commission of infringements classified as serious or very serious.
In accordance with this sector-specific provision and with the obligations established under the capital markets regulations applicable to the Group, we hereby report: (i) the serious and/or very serious sanctions imposed by the SBS which, pursuant to the applicable sector regulations, were required to be reported to the Board of Directors and to the General Shareholders’ Meeting; and (ii) the serious and/or very serious sanctions imposed by other local and foreign supervisory authorities that perform supervisory and oversight functions over the Group’s companies, including, among others, the Superintendency of the Securities Market (SMV) and the National Authority for the Protection of Personal Data (ANPDP), which, due to their materiality, were disclosed to the market by Credicorp as a Material Event during the past year.
In April 2025, the SBS imposed on Banco de Crédito del Perú a fine of sixty‑five (65) Tax Units (S/ 357,500) for having incurred in a serious infringement classified under item (e) of numeral 79, Section II, of Annex 1 of the SBS Regulations on Infractions and Sanctions. The sanction was imposed due to the Bank’s failure to assess the risks associated with a significant service provided by a third party responsible for the operation and maintenance of the primary and alternate Data Processing Centers (Centros de Procesamiento de Datos – CPD), including the air‑conditioning systems of both facilities. This failure affected the operational continuity of services on July 30 (for eight hours) and August 5, 2024 (for two hours), as set forth in SBS Resolution No. 1423‑2025‑SBS.
In May 2025, the SBS imposed on Banco de Crédito del Perú a fine of twenty (20) Tax Units (S/ 110,000) for having incurred in a serious infringement classified under numeral 14, Section II, of Annex 1 of the SBS Regulations on Infractions and Sanctions, due to non‑compliance with the Manual for the Prevention and Management of Money Laundering and Terrorist Financing Risks related to limits on cash U.S. Dollar purchase and sale transactions. Such limits were exceeded in six (6) transactions out of a sample of twenty (20) transactions, as set forth in SBS Resolution No. 1859‑2025‑SBS.
(4)Dividend Policy
Under Bermuda law, a dividend may only be declared and paid if (i) the Company is able to pay its liabilities as they become due, and (ii) the realizable value of its assets is not less than the aggregate value of its liabilities, issued share capital and share premium accounts.
Each year, the Company intends to declare and pay dividends in cash of at least 25% of the Company’s consolidated net profits based on the last audited financial accounts. The Board of Directors shall take into consideration the following when deciding whether to distribute dividends:
•There being dividends from the Company’s subsidiaries;
•That the declaration and payment of dividends shall not cause the Company to breach any applicable laws or adversely impact the equity growth requirements of the Company or its subsidiaries;
•The financial performance of the Company;
•The overall business and the economic-financial conditions affecting the Company;
•Regulatory requirements related to consolidated solvency; and
•Any other factors that the Board may deem relevant.
The Board of Directors may in its sole discretion declare and pay a dividend below 25%, if any of the aforementioned conditions fail to be met. Subject to the foregoing, it is expected that dividend payments are to be made once a year within 90 calendar days of the meeting held by the Board to approve the dividend declaration and payment. No interim dividends are to be paid. This policy has been in force since 2016 and was amended in February 2026 solely to include regulatory requirements related to consolidated solvency among the factors considered by the Board of Directors when determining whether to distribute dividends. All other provisions of the policy approved in 2016 remain unchanged, and the policy will continue to be applicable until amended or rescinded by the Board of Directors. For further details about the risk associated with our ability to pay dividends, please refer to “ITEM 3. KEY INFORMATION – 3.D Risk Factors – Our ability to pay dividends to shareholders and to pay corporate expenses may be adversely affected by the ability of our subsidiaries to pay dividends to us.”
Furthermore, the Board of Directors of the Company, in its session held on December 23, 2021, resolved that, subject to the provisions of Credicorp’s Dividend Policy, the Board of Directors expects that Credicorp will declare dividends, if any, each year in April or thereafter, once the Company’s subsidiaries have agreed on the declaration and payment dates of any dividends in their respective shareholder and board meetings. This decision aligns with Credicorp’s Dividend Policy.
The following table shows the cash and stock dividends that we paid based on the results of our operations in the periods indicated:
| | | | | | | | | | | | | | | | | | | | |
| Year ended December 31, | | Number of Shares Entitled to Dividends | | Cash Dividends Per Share | | Stock Dividends Per Share |
| | | | | | |
| 2002 | | 94,382,317 | | US$ | 0.40 | | | 0 |
| 2003 | | 94,382,317 | | US$ | 0.30 | | | 0 |
| 2004 | | 94,382,317 | | US$ | 0.40 | | | 0 |
| 2005 | | 94,382,317 | | US$ | 0.80 | | | 0 |
| 2006 | | 94,382,317 | | US$ | 1.10 | | | 0 |
| 2007 | | 94,382,317 | | US$ | 1.30 | | | 0 |
| 2008 | | 94,382,317 | | US$ | 1.50 | | | 0 |
| 2009 | | 94,382,317 | | US$ | 1.70 | | | 0 |
| 2010 | | 94,382,317 | | US$ | 1.95 | | | 0 |
| 2011 | | 94,382,317 | | US$ | 2.30 | | | 0 |
| 2012 | | 94,382,317 | | US$ | 2.6 | | | 0 |
| 2013 | | 94,382,317 | | US$ | 1.90 | | | 0 |
| 2014 | | 94,382,317 | | US$ | 2.19 | | | 0 |
| 2015 | | 94,382,317 | | US$ | 2.3160 | | | 0 |
| 2016 | | 94,382,317 | | US$ | 12.2865 | | | 0 |
| 2016 | | 94,382,317 | | S/ | 15.7000 | | | 0 |
| 2017 | | 94,382,317 | | S/ | 14.1726 | | | 0 |
| 2018 | | 94,382,317 | | S/ | 20.0000 | | | 0 |
| 2018 | | 94,382,317 | | S/ | 8.0000 | | | 0 |
| 2019(1) | | 94,382,317 | | S/ | 30.0000 | | | 0 |
| 2020(2) | | 94,382,317 | | S/ | 5.0000 | | | 0 |
| 2021(3) | | 94,382,317 | | S/ | 15.0000 | | | 0 |
| 2022(4) | | 94,382,317 | | S/ | 25.0000 | | | 0 |
| 2023(5) | | 94,382,317 | | S/ | 35.0000 | | | 0 |
| 2023(6) | | 94,382,317 | | S/ | 11.0000 | | | 0 |
| 2024(7) | | 94,382,317 | | S/ | 40.0000 | | | 0 |
| 2025(8) | | 94,382,317 | | S/ | 50.0000 | | | 0 |
(1)At a meeting held on February 27, 2020, the Board of Directors declared a cash dividend of S/30.0000 per common share. The cash dividend was paid in US Dollars using the weighted exchange rate registered by the SBS for the transactions at the close of business on May 6, 2020. The US Dollar dividend amount was rounded up to four decimals. The aforementioned cash dividend was paid on May 8, 2020, to those shareholders that were registered as shareholders of Credicorp as of the close of business on April 13, 2020.
(2)At a meeting held on February 25, 2021, the Board of Directors discussed the probability of approving a distribution of dividends for the results obtained in 2020. Due to the uncertainty in the health and economic expectations of Peru and the countries in which we operate, this decision was defined in the following directories agreed during 2021, taking into account the evolution of the pandemic and its possible impact on the solvency, liquidity and profitability of Credicorp. At a meeting held on August 26, 2021, the Board of Directors declared a cash dividend of S/5.0000 per common share. The cash dividend was paid in U.S. Dollars using the weighted exchange rate registered by the SBS for the transactions at the close of business on October 5, 2021. The U.S. Dollar dividend amount was rounded up to four decimals. The aforementioned cash dividend was paid on October 7, 2021, to those shareholders that were registered as shareholders of Credicorp as of the close of business on September 15, 2021.
(3)In a meeting held on April 28, 2022, the Board of Directors of Credicorp Ltd. declared a cash dividend of S/15.0000 per share. The cash dividend was paid in US Dollars using the weighted exchange rate recorded by the SBS for
transactions at the close of business on June 8, 2022. The dividend amount in US Dollars was rounded to four decimal places. The aforementioned cash dividend was paid on June 10, 2022, to those shareholders who were registered as shareholders of Credicorp at the close of operations on May 20, 2022.
(4)In a meeting held on April 27, 2023, the Board of Directors of Credicorp Ltd. declared a cash dividend of S/25.0000 per share. The cash dividend was paid in US Dollars using the weighted exchange rate recorded by the SBS for transactions at the close of business on June 7, 2023. The dividend amount in US Dollars was rounded to four decimal places. The aforementioned cash dividend was paid on June 9, 2023, to those shareholders who were registered as shareholders of Credicorp at the close of operations on May 19, 2023.
(5)In a meeting held on April 25, 2024, the Board of Directors of Credicorp Ltd. declared a cash dividend of S/35.0000 per share. The cash dividend was paid in US Dollars using the weighted exchange rate recorded by the SBS for transactions at the close of business on June 12, 2024. The dividend amount in US Dollars was rounded to four decimal places. The aforementioned cash dividend was paid on June 14, 2024, to those shareholders who were registered as shareholders of Credicorp at the close of operations on May 20, 2024.
(6)In a meeting held on August 29, 2024, the Board of Directors of Credicorp Ltd. declared a cash dividend of S/11.0000 per share. The cash dividend was paid in US dollars using the weighted exchange rate recorded by the SBS for transactions at the close of business on October 16, 2024. The dividend amount in US dollars was rounded to four decimal places. The aforementioned cash dividend was paid on October 18, 2024, to those shareholders who were registered as shareholders of Credicorp at the close of operations on September 23, 2024.
(7)In a meeting held on April 24, 2025, the Board of Directors of Credicorp Ltd. declared a cash dividend of S/40.0000 per share. The cash dividend was paid in US dollars using the weighted exchange rate recorded by the SBS for transactions at the close of business on June 11, 2025. The dividend amount in US dollars was rounded to four decimal places. The aforementioned cash dividend was paid on June 13, 2025, to those shareholders who were registered as shareholders of Credicorp at the close of operations on May 19, 2025.
(8)In a meeting held on April 23, 2026, the Board of Directors of Credicorp Ltd. declared a cash dividend of S/50.0000 per share. The cash dividend will be paid out on June 12, 2026, without withholding tax at source, to shareholders of record on May 18, 2026. The dividend will be paid in US Dollars using the weighted exchange rate published by the SBS for transactions at the close of business on June 10, 2026
8.BSignificant changes
There have not been any significant changes since the date of our consolidated financial statements.
ITEM 9.THE OFFER AND LISTING
9.AOffer and Listing Details
Our common shares have been traded on the NYSE since October 25, 1995. Our common shares also trade on the BVL. They are quoted in US Dollars and trade under the symbol BAP on both exchanges.
As of December 31, 2025, Credicorp issued 94,382,317 registered common shares with a nominal par value of US$5.00 per share. Under Credicorp’s Bye-laws, any holder of such shares is entitled to one vote per share, such dividends as the Board of Directors may from time to time declare and the surplus assets of Credicorp in the event of a winding-up or dissolution. Credicorp’s shareholders do not have preemptive purchase rights under the Company’s Bye-laws.
9.BPlan of Distribution
Not applicable.
9.CMarkets
The BVL is the principal non-U.S. trading market for our common shares. See “Item 9. THE OFFER AND LISTING – 9.A Offer and Listing Details” for information regarding the trading of our common shares on the NYSE.
(1)Trading
As of December 2025, there were 236 companies listed on the BVL, which is Peru’s only securities exchange and was established in 1970. Trading on the BVL is primarily done on an electronic trading system, though trading may also occur in an open outcry auction floor session. Trading hours occur from Monday through Friday as follows:
| | | | | | | | | | | | | | |
| From the second Sunday of March through the first Sunday of November of each year: | Pre-Opening | 07:30 | - | 08:20 |
| Opening session: | 08:20 | - | 08:30 |
| Trading I: | 08:30 | - | 14:22 |
| Trading II | 14:22 | - | 14:52 |
| Closing session: | 14:52 | - | 15:00 |
| Closing Price publication | 15:00 | - | 15:02 |
| Trading at closing price: | 15:02 | - | 15:10 |
| Post-Closing | 15:10 | - | 15:30 |
| From the first Sunday of November through the second Sunday of March of each year: | Pre-Opening | 07:30 | - | 09:00 |
| Opening session: | 09:00 | - | 09:30 |
| Trading I: | 09:30 | - | 15:22 |
| Trading II | 15:22 | - | 15:52 |
| Closing session: | 15:52 | - | 16:00 |
| Closing Price publication | 16:00 | - | 16:02 |
| Trading at closing price: | 16:02 | - | 16:10 |
| Post-Closing | 16:10 | - | 16:30 |
Transactions during both the open trading and the electronic sessions are executed through brokerage firms and stockbrokers on behalf of their clients. Brokers submit their orders in strict accordance with written instructions, following the chronological order in which they were received. The orders specify the type of security ordered or offered as well as the amounts and price of the sale or purchase. In general, share prices are allowed to increase or decrease up to 15% for Peruvian companies, and up to 30% for foreign companies, within a single trading day.
The total amount traded on the BVL was US$4.4 billion in 2025, below the 2024 level of US$6.3 billion but higher than the level of the previous five years (US$2.2 billion in 2023, US$3.7 billion in 2022, US$5.7 billion in 2021, US$5.8 billion in 2020 and US$5.5 billion in 2019). The 2024 figure is half the record level obtained in 2007, in which trading volume reached US$12.4 billion. The Peruvian stock market capitalization amounted to US$266.5 billion, compared to US$184.7 billion in 2024, US$177.7 billion in 2023, US$141.7 billion in 2022, US$148.5 billion in 2021, US$165.5 billion in 2020 and US$162.0 billion in 2019.
(2)Market Regulation
Peruvian Securities Market Law (the consolidated text currently in force, approved by Supreme Decree No. 020‑2023‑EF) addresses matters such as transparency and disclosure, takeovers and corporate actions, capital market instruments and operations, the securities markets and broker-dealers, and risk rating agencies. The SMV, which is a governmental entity attached to the MEF, was given additional responsibilities relating to the supervision, regulation, and development of the securities market, while the BVL and its member firms were given the status of self-regulatory organizations. Additionally, a unified system of guarantees and capital requirements was established for the BVL and its member firms.
The SMV is governed by a five-member board, which includes the Securities Market Superintendent, who presides over the board, and four directors appointed by the executive branch: one proposed by the MEF, one proposed by BCRP, one by SBS and one Independent Director. The SMV has broad regulatory powers, which include studying, promoting, and establishing rules for the securities market; supervising its participants; and approving the registration of public offerings of securities.
On August 22, 1995, the SMV approved regulations governing the public offering of securities in Peru by entities organized outside of Peru and, for the first time, authorized foreign companies to be listed on the BVL. On October 25,
1995, we became the first non-Peruvian company to list our shares on the BVL. For further details, see “ITEM 4. INFORMATION ON THE COMPANY – 4.B Business Overview – (6) Supervision and Regulation – 6.2 Subsidiaries – 6.2.1 Peru”.
Pursuant to the Peruvian Securities Market Law, the BVL must maintain a guarantee fund that is funded by its member firms. The actual contributions to be made by the 24 member firms of the BVL are based on volume traded over the exchange. In addition to the guarantee fund managed by the BVL, each member firm is required to maintain a guarantee for operations carried out outside the exchange in favor of SMV. Such guarantees are generally established through bank guarantees issued by local banks.
9.DSelling Shareholders
Not applicable.
9.EDilution
Not applicable.
9.FExpenses of the Issue
Not applicable.
ITEM 10.ADDITIONAL INFORMATION
10.AShare Capital
Not applicable.
10.BMemorandum of Association and Bye-laws
The registration number of Credicorp with the Registrar of Companies in Bermuda is EC21045.
The following sections set forth certain information concerning Credicorp’s Board of Directors and its share capital, and a summary of certain significant provisions of Credicorp’s Memorandum of Association and Bye-laws and Bermuda corporate law. This description does not purport to be complete and is qualified by reference to Credicorp’s Memorandum of Association and Bye-laws and to applicable corporate law. For further information on Credicorp’s current Bye-laws, as amended in 2020, see Exhibit 1.1 to this Annual Report.
(1)Credicorp Ltd.’s Objects
The objects under which Credicorp is formed and incorporated are located in Item 6 of its Memorandum of Association and are:
(1)To act and perform all the functions of a holding company in all of its branches and to coordinate the policy and administration of any subsidiary company or companies wherever incorporated or carrying on business or of any group of companies of which Credicorp or any subsidiary company is a member, or which are in any manner controlled directly or indirectly by Credicorp;
(2)To carry on the business of an investment company and for that purpose to acquire and hold, whether in the name of Credicorp or in that of any nominee, shares, stocks, debentures, debenture stock, bonds, notes, obligations, and securities issued or guaranteed by any company however incorporated or carrying on business; and
(3)Certain other standard objects of Bermuda exempted companies as set out in the Second Schedule to the Bermuda Companies Act 1981.
Credicorp’s business falls within the scope of its objects under its Memorandum of Association.
(2)Directors
Credicorp’s business is managed and conducted by the Board of Directors, which is fixed by Credicorp’s Bye-laws at nine Directors. For additional information regarding the membership and operation of Credicorp’s Board of Directors, see “ITEM 6. DIRECTORS, SENIOR MANAGEMENT AND EMPLOYEES – 6. A Directors and Senior Management” and “– 6. C Board Practices”.
Each Director holds office for a period (the Election Period) commencing at the annual general meeting in which the Director was elected and ending at the annual general meeting in the third successive year of his or her election or until his or her successor is elected or appointed subject to his or her office being vacated.
There are no age limit requirements regarding retirement or non-retirement of Directors. Holding shares is not a requirement in order to be appointed as a Director of the Company.
The office of Director shall be vacated if the Director: (i) is removed from office pursuant to Credicorp’s Bye-laws or is prohibited from being a Director by law; (ii) is or becomes bankrupt or makes any arrangement or composition with his creditors generally; (iii) is or becomes of unsound mind or dies; or (iv) resigns his or her office by notice in writing to the Company. At any general meeting, the shareholders may authorize the Board to fill for the remainder of the Election Period any vacancy in their numbers left unfilled at the general meeting. Shareholders in general meeting or the Board shall have the power to appoint any person as a Director to fill a vacancy on the Board for the remainder of the Election Period occurring as a result of the death, disability, disqualification, or resignation of any Director.
A Director may not vote on any contract or proposed contract or arrangement in which such Director is interested or when such Director has a conflict of interest.
Directors’ remuneration is determined by Credicorp’s shareholders in general meetings. Directors living outside Lima may also be paid all travel, hotel, and other expenses properly incurred in attending meetings of the Board of Directors, meetings of any committee appointed by the Board of Directors, general meetings of the Company, or any meetings in connection with the business of the Company or their duties as Directors generally.
Any Director, or any Director’s firm, partner, or any company with whom any Director is associated, may act in a professional capacity for Credicorp, and such Director or such Director’s firm, partner or such company may be entitled to remuneration for professional services as if such Director were not a Director, provided that a Director or Director’s firm, partner or such company is not authorized to act as auditor of the Company.
The Board of Directors may exercise all the powers of the Company to borrow money and to mortgage or charge its undertaking, property and uncalled share capital, or any part thereof. The Board of Directors may also issue debentures, debenture stock and other securities whether outright or as security for any debt, liability, or obligation of the Company or any third party.
(3)Common Shares
Credicorp’s Memorandum of Association and Bye-laws provide for its share capital to be a single class of common shares, with a par value of $5.00 per share, subject to any resolution of the shareholders to the contrary. To date, Credicorp has issued 94,382,317 common shares with a par value of US$5.00 per share, each fully paid.
Under Credicorp’s Bye-laws, any holder of Credicorp’s common shares is entitled to one vote per share, such dividends as the Board of Directors may from time to time declare, and the surplus assets of Credicorp in the event of winding-up or dissolution whether voluntary or involuntary or for the purpose of a reorganization or otherwise, or upon any distribution of share capital. Unclaimed dividends do not earn interest. Dividends unclaimed for three years after they are declared revert back to the Company, and shareholders do not have any rights to such dividends. For more information regarding Credicorp’s dividend policy and applicable Bermuda law, refer to “ITEM 8. FINANCIAL INFORMATION – 8. A Consolidated Statements and Other Financial Information – (3) Dividend Policy”.
Credicorp can, from time to time, purchase its own shares in accordance with Section 42A of the Companies Act 1981 of Bermuda. Section 42A of the Companies Act 1981 of Bermuda provides that a company cannot purchase its shares if there are reasonable grounds for believing that the company is, or after the purchase would be, unable to pay its liabilities as they become due. Shares purchased under Section 42A are treated as cancelled, and the amount of the company’s issued
capital, but not its authorized share capital, is diminished by the nominal value of the cancelled shares. Credicorp’s shareholders do not have preemptive purchase rights under the Company’s Bye-laws.
Under Section 46 of the Companies Act 1981 of Bermuda, where permitted under its memorandum of association and Bye-laws, shareholders of a Bermuda company may resolve in a general meeting to reduce the company’s share capital. No company shall reduce the amount of its share capital unless: (i) it publishes a notice in an appointed newspaper not more than 30 and not less than 15 days before the date on which the reduction in share capital is to become effective, stating (a) the amount of share capital as last determined by the company; (b) the amount by which the share capital is to be reduced; and (c) the date on which the reduction will become effective; and (ii) on the date the reduction is to be effected, there are no reasonable grounds for believing that the company is, or after the reduction would be, unable to pay its liabilities as they become due. Subject to the foregoing, the Company may reduce its share capital in any way, including by (i) extinguishing or reducing the liability on any of its shares in respect of capital not paid up; (ii) with or without extinguishing or reducing liability on any of its shares, cancelling any paid up capital that is lost or unrepresented by available assets; or (iii) with or without extinguishing or reducing liability of any of its shares, and with or without reducing the number of such shares, paying off any paid-up capital that is in excess of the requirements of the Company. Subject to Credicorp’s Bye-laws, when share capital is to be reduced by cancellation of part of a class of shares, the shares to be cancelled must be selected (i) by lot, in such manner as the Directors determine; (ii) as nearly as may be in proportion to the number of shares of the class registered in the name of each shareholder; or (iii) in such other manner as the Directors, with the consent of the majority of shareholders of the share class to be cancelled, determine. When shares are to be cancelled to reduce the Company’s share capital, the shares shall be acquired at the lowest price at which the shares are obtainable, in the opinion of the Directors, but not exceeding an amount, if any, stated in the Bye-laws. Credicorp’s Bye-laws do not state any amount or price at which shares are to be cancelled when undertaking a share capital reduction of this kind. There are no conditions in our Memorandum of Association or Bye-laws governing changes in our share capital that are more stringent than those required under Bermuda law.
The rights of Credicorp’s shareholders can be changed by amendment of Credicorp’s Bye-laws. Amendments, rescissions, or alterations to Credicorp’s Bye-laws generally require approval by a resolution of its Board of Directors and a resolution of the shareholders passed by a majority of the votes cast in accordance with the provisions of the Bye-laws. Amending Bye-laws 4.11 and 4.23 of Credicorp’s Bye-laws, regarding the number of Directors, tenure, election process and filling of vacancies, among other matters, requires affirmative votes of at least two-thirds of the total issued voting shares of the Company. Bye-law amendments may be made at the annual general meeting or at a special general meeting.
Credicorp’s annual general meeting is held each year to consider and adopt resolutions, to receive the report of the auditors and the consolidated financial statements for the last fiscal year, to elect Directors, to consider fees payable to Directors, to appoint auditors and to consider other matters properly brought before the meeting. At least fourteen days’ notice of an annual general meeting shall be given to each shareholder. Notice of an annual general meeting will state the date, place and time at which the meeting is to be held, that the election of Directors will take place at the meeting and, as far as practicable, the other business to be conducted at the meeting. At least ten days’ notice of a special general meeting shall be given to each shareholder. Notice of a special general meeting will state the date, time, place and the general nature of the business to be considered at the meeting. Subject to the provisions of the Bermuda Companies Act 1981 and Credicorp’s Bye-laws, any question proposed for the consideration of the shareholders at any general meeting will be decided by the affirmative votes of a majority of the votes cast. In the case of a tie, the resolution fails.
Subject to compliance with applicable laws, there are no limitations on the rights to own our securities, or on the rights of non-resident or foreign shareholders to hold or exercise voting rights on those securities, which are imposed by the Companies Act 1981 of Bermuda or by the Memorandum of Association or Bye-laws of Credicorp.
There is no provision of the Company’s Memorandum of Association or Bye-laws that would delay, defer, or prevent a change in control of the Company, which would operate only with respect to a merger, acquisition or corporate restructuring involving the Company (or any of its subsidiaries).
Assuming Credicorp remains listed on an appointed stock exchange, there are no Bye-laws provisions or provisions of Bermuda law governing the ownership threshold above which ownership of Credicorp shares must be disclosed. Under Peruvian law, any individual or legal entity who acquires, directly or indirectly, 1% or more of the share capital of a company operating in the financial and insurance systems (or that is engaged in activities that are either associated with or complementary to the purpose of such companies) in a 12-month period, or who obtains a shareholder stake of 3% or more, must provide the SBS with the information that the SBS requests to identify the shareholder’s main economic activities and, the structure of its assets, their financial information, among others. In addition, the acquisition of shares of a company
operating in the financial or insurance system exceeding 10% of the company’s share capital (or resulting, when aggregated with previous holdings, in the holding of 10% of the company’s share capital) by a single individual or entity, whether directly or indirectly, require prior authorization from the SBS. In order to acquire more than 10% of the share capital of a legal person domiciled in Peru that holds shares in a financial or insurance company, prior authorization from the SBS is required. If the shareholder is a legal person that is not domiciled in Peru, such as Credicorp, the SBS must be informed if there is a modification in the composition of the shareholders in proportions that exceed 10%, including the names of such shareholders.
Under Peruvian securities market regulation, any issuer with shares registered on a centralized exchange, such as Credicorp, must present to the SMV a list of its shareholders who hold more than 0.5% of its capital stock and update the list within the first 15 calendar days of the following month in which a change occurs. The issuer must also update the Securities Market Public Register with information on shareholders holding 4% or more of their share capital following any change.
Under the U.S. Securities Exchange Act of 1934, as amended, holders of more than 5% of our shares are generally required to report their holdings to the SEC on Schedule 13D or Schedule 13G, as applicable. This is an obligation of the shareholders, not of Credicorp Ltd. as the issuer of the shares.
10.CMaterial Contracts
As of the date hereof, we have not, nor have our subsidiaries, entered into any material contracts in the immediately preceding two years other than those contracts entered into in the ordinary course of our business.
10.DExchange Controls
We rely almost exclusively on dividends from Grupo Crédito S.A., BCP Stand-alone, BCP Bolivia, ASHC, Grupo Pacífico, Credicorp Capital, and our other subsidiaries for the payment of dividends to holders of our common shares. To the extent that our subsidiaries are legally restricted from paying us dividends, our ability to pay dividends on our common shares will be adversely affected.
Although substantially all of the clients of BCP Stand-alone, ASB, and Grupo Pacífico are located in Peru, as of December 31, 2025, approximately 31.9% of BCP Stand-alone’s loan portfolio, 94.5% of ASB Bank Corp’s loan portfolio, and 40.5% of Grupo Pacífico’s insurance contract liability were denominated in US Dollars.
Since March 1991, there have been no exchange rate controls in Peru, and all foreign exchange transactions are based on market exchange rates. The Peruvian constitution establishes equal treatment between national and foreign investment in Article 63, and Legislative Decree No. 662 allows foreign holders of equity shares of Peruvian companies to receive and repatriate 100% of the cash dividends distributed by the Company. These investors are allowed to purchase foreign exchange at market exchange rates through any member of the Peruvian banking system. The existence of the parallel exchange rate in Bolivia does not generate operational restrictions in BCP Bolivia. Bolivian financial institutions carry out their foreign exchange transactions in legal and regulated markets in compliance with the foreign exchange regulations issued by the Central Bank of Bolivia (Banco Central de Bolivia or BCB by its Spanish initials) and supervised by the Financial System Supervisory Authority (ASFI).
One circumstance that could lead to depreciation is a decline in Peruvian foreign reserves. Although the current level of Peru’s foreign reserves (US$90.2 billion or 26% of GDP as of December 31, 2025) compares favorably with those of other Latin American countries, there can be no assurance that Peru will be able to maintain adequate foreign reserves levels to meet its foreign currency-denominated obligations. See “Item 3. Key Information – 3.D Risk Factors – Macroeconomic Risks”.
We have been designated as a non-resident for Bermuda exchange control purposes under the Bermuda Exchange Control Act 1972 and associated regulations and are able to conduct our day-to-day operations free of Bermuda exchange control formalities. We are able to pay dividends, distribute capital, and open and maintain bank accounts in any foreign currency without reference to the Bermuda Monetary Authority.
10.ETaxation
The disclosures in the following sections describe certain material implications to shareholders under the tax laws of Bermuda, Peru, Chile, Colombia, and the United States, but are not intended to provide legal advice to investors. Investors should consult with their own tax advisers in these and other jurisdictions. For details on income tax review by the tax authorities in the jurisdictions in which we operate, please refer to Note 17 (a) and (e) to the consolidated financial statements.
Credicorp’s dividends are paid without withholding tax at the source.
10.1 Bermuda regulation
On 27 December 2023, the Government of Bermuda enacted the CIT Act, which introduced a corporate income tax applicable to Bermuda constituent entities that are part of an MNE group with consolidated annual revenue of at least €750,000,000 in at least two out of the four previous fiscal years. If a Bermuda constituent entity of an MNE group is subject to tax under the CIT Act, such tax is charged at a rate of 15% effective for fiscal years beginning on or after 1 January 2025 as determined in accordance with and subject to the adjustments set out in the CIT Act.
Notwithstanding the above, there will not be Bermuda income or profits tax, withholding tax, capital gains tax, capital transfer tax, estate duty, or inheritance tax that must be paid or that the shareholders must pay with respect to their shares for fiscal year 20255. A Bermuda exempted company is liable to pay an annual government fee based on the authorized share capital and the premium on the issued common shares, which amounts to approximately US$19,605 (2025 Bermuda annual government fee for an exempted company where assessable capital is $100,000,001 - $500,000,000).
10.2 Peruvian regulation
On February 15, 2011, the Peruvian government enacted Law No. 29663, which was subsequently amended on July 21, 2011, by Law No. 29757. This law partially modifies the country’s income tax regime by (i) subjecting to taxation in Peru capital gains derived from an indirect transfer of shares issued by a domiciled entity and (ii) introducing more types of income that will qualify as Peruvian source income. Under the law, an indirect transfer of shares issued by a domiciled entity occurs, and is subject to the Peruvian Income Tax (at a 5% or 30% rate) when the shares of a non-domiciled entity, which in turn owns (directly or indirectly through other entities) shares issued by a domiciled entity, are transferred, provided that both of the following conditions are met:
(1)During the 12 months prior to the transfer, the fair market value (FMV) of the shares of the domiciled entity owned by the non-domiciled entity equals 50% or more of the FMV of the shares of the non-domiciled entity. There is a rebuttable presumption that this condition is met if the non-domiciled entity is a resident in a tax haven; and
(2)During any given 12-month period, shares representing 10% or more of the non-domiciled entity’s share capital are transferred.
The Legislative Decree No. 1424 (published on September 13, 2018) established an additional rule according to which if the "total amount" of the domiciled entity’s shares indirectly transferred is equal to or exceeds 40,000 Peruvian Tax Units (approximately US$57 million as of 2025), an indirect transfer of Peruvian shares would always be deemed to be triggered, regardless of whether either of conditions (1) or (2) above is met. This new rule based on the sales price is in force as of January 1, 2019, jointly with the general rule referred above, and, for purposes of verifying compliance with both the requirement to transfer 10% or more of the capital of the non‑domiciled entity and the 40,000 Tax Units threshold, the transfers carried out by related parties must also be taken into account, with the related‑party relationship being determined in accordance with subsection (b) of Article 32‑A of the Income Tax Law.
5 Currently, an analysis is being conducted to determine the potential impact of the new Corporate Income Tax to the Company. Based on the preliminary evaluation of the recently enacted legislation, it is expected that the new tax in Bermuda will not have a material impact on the Company’s consolidated financial statements, subject to further analysis.
On April 21, 2020, Supreme Decree No. 085-2020-EF established that, for purposes of determining the FMV of the non-domiciled shares and the Peruvian entities, the following methods must be followed:
•Higher listed value: In the case of shares listed on the Stock Exchange, the market value will be the highest listed value.
•Discounted cash flow (DCF): In the case of shares that are not listed on the Stock Exchange, the market value will be the discounted cash flow value where the entity evidences a predictable horizon of future cash flows or has elements such as licenses, authorizations or intangibles that allow the existence of such cash flows to be anticipated. If the Company has several business units, a projection must be made for each business unit.
The DCF methodology of the Company will be applied if there is no expectation of debt linked to the economic activity or business unit of the Company; otherwise, the DCF methodology of the shareholder will apply.
For the development of the projection, the following will be considered:
(1)The cash flow period should be at least 10 years. If the Company has a shorter duration, the balance of the duration will be considered.
(2)If the Company's cash flow is applied, the discount rate is the weighted average cost of capital, which must consider the opportunity cost of capital and the cost of debt. If the shareholder's cash flow is applied, the opportunity cost of capital must be considered as the discount rate, which includes the minimum profitability expected by the shareholder at market value.
(3)Continuity value, when the Company is expected to receive income for an unspecified period of time or the residual value, as applicable.
In case the domiciled entity directly or indirectly owns shares of another or other domiciled entities and/or non-domiciled entities, the market value of such shares must include the market value of these other companies.
For the determination of the discounted cash flow value to be credited, the taxpayer must have a technical report containing at least the following information: (i) an executive summary; (ii) an analysis of the sector in which the Company operates; (iii) an analysis of the Company; (iv) valuation; and (v) annexes that accredit the results obtained.
•Equity Participation Value (EPV): If the methods described above are not complied with, the EPV is calculated on the basis of the last audited balance sheet of the issuing Company closed within 90 days prior to the disposal. This is applicable in the case of entities that are under the supervision of the SMV, or entities authorized to perform the same functions in other jurisdictions. If, within 90 days prior to the sale, a reduction in the share capital of the non-resident entity is made, the balance sheet of the non-resident entity will be the one corresponding before the reduction.
•Residual Method: If the previous methods are not applicable, the EPV will be one of the following:
1The EPV shall be the result of dividing the equity value of the entity based on the last balance sheet closed within 90 days prior to the disposal, in accordance with the accounting standards officialized or approved by the competent body of the country, increased by the average monthly active market rate in local currency (TAMN), and by the number of shares issued, provided the following conditions are met:
•The entity's shares are not listed on a stock exchange or in any centralized trading mechanism, and;
•The entity is not under the control and supervision of an entity that is entitled to perform the same functions as the SMV under its country of residence.
2The EPV will be the appraised value established within the six months prior to the date of the transfer.
The tax rate will apply according to the following table:
| | | | | |
| Tax rate applicable for direct and indirect transfer of shares qualifying as Peruvian‑source income |
| Non-domiciled |
| 5% | If the transfer of shares is realized through the Lima Stock Exchange by a non-domiciled subject. |
| 30% | If the transfer of shares is not realized through the BVL by a non-domiciled subject, even if the shares are listed in the Lima Stock Exchange. |
| Domiciled |
| 29.50% | If the transfer of shares is realized by a domiciled entity |
| 5% | If the transfer of shares is realized by a domiciled individual. However, if the shares do not qualify as an indirect transfer, the applicable tax rate will be up to 30%. |
In addition, the following obligations were imposed on domiciled entities that have “economic relationships” (defined below) with non-domiciled sellers:
•Reporting to the SUNAT the direct or indirect transfer of its shares, and;
•To the extent that shares of a domiciled company are being directly or indirectly transferred by a non-domiciled seller, the domiciled company is jointly liable for the income tax that is not paid by the non-domiciled seller when such seller and the Peruvian domiciled company are deemed to be economically related for Peruvian Income Tax purposes for any period of time, within 12 months prior to the transfer. However, the joint income tax liability does not apply when the purchaser or acquirer of the transferred shares is a domiciled individual or entity. This is because they qualify as withholding agents when they pay income arising from the indirect transfer of shares of a domiciled company.
According to Supreme Decree No. 275-2013-EF, enacted on November 7, 2013, a domiciled entity is considered to be economically related to a non-domiciled seller, if, in any given time within the 12-month period prior to the transfer, at least one of the following conditions is met:
◦The non-domiciled seller owns more than 10% of the equity of the domiciled entity, directly or through a third party;
◦10% or more of the equity of each of the domiciled entities and the non-domiciled seller is owned by common shareholders;
◦The domiciled entity and the non-domiciled seller have one or more common Directors, managers, or administrators, with authority over financial, operative, and commercial agreements;
◦The domiciled entity and the non-domiciled seller prepare joint consolidated financial statements; or
◦The non-domiciled seller has a dominant influence on the decisions of the administrative areas of the domiciled entity, or vice-versa.
10.3 Chilean Regulation
The Chilean Statutory Corporate Income Tax rate applicable to resident legal entities is 27% under the semi-integrated regime which is mandatory to big companies or investment companies and, in general, companies that belong to big corporate groups. Dividends distributed by Chilean companies and received by foreign individuals or any type of entity not resident or domiciled in Chile are subject to a 35% dividend withholding tax. This tax applies at the moment of the effective remittance of the dividend and the corporate income tax can be used as a credit. In the case of non-treaty country resident shareholders, the corporate tax credit is limited to 65% of the corporate income tax associated with such dividend (the 65% limit works as an obligation for the shareholder to “reimburse” 35% of the credit). Therefore, in this case, the total tax burden for foreign taxpayers will be 44.45%. Nonetheless, the “65% limit” does not apply to those investors domiciled or resident in a country with which Chile has a Double Taxation Treaty in force, which may use 100% of the corporate tax paid by the Chilean company as credit against the dividend withholding tax (effective rate of 35%).
10.4 Colombian Regulation
The Colombian general corporate income tax rate of 35% remains unchanged (for 2022 and the following years). In addition, a temporary surtax will be applied to financial institutions whose taxable income equals or exceeds approximately US$1.3 million. Credicorp Capital Colombia, Credicorp Capital Fiduciaria, and Mibanco Colombia, are subject to the surtax rate of 5 percentage points, applicable from 2022 until 2027. Therefore, the combined income tax rate for financial institutions in Colombia is 40% for 2023 onwards. Legislative Decrees No. 1390 and 1474 issued on December 22 and
December 29, 2025, respectively, declared a State of Economic Emergency in Colombia and introduced increases in certain taxes. Specifically, with respect to corporate income tax, the surtax rate applicable to entities in the financial sector was increased from 5% to 15%, resulting in a nominal corporate income tax rate of 50%. However, through Orders (Autos) No. 82 and No. 84 of 2026 issued by the Constitutional Court, Legislative Decrees No. 1390 and No. 1474 were provisionally suspended pending a final decision on the merits by the Court. As a result, corporate income tax is currently being calculated at the 40% rate.
Credicorp Capital Corporación Financiera is also subject to the surtax applicable to financial institutions; however, such surtax has not yet been accrued, as the entity is currently generating a tax loss. Once taxable income is generated and exceeds the threshold of 120,000 UVTs (COP 6,284,880,000 for fiscal year 2026), the surtax will be calculated, and the nominal corporate income tax rate will increase to 40%.
In addition, since 2023 Colombia has implemented its own version of a minimum domestic tax. Under such minimum domestic tax, the current tax reported in the income tax return (with some adjustments) cannot be less than 15% of the accounting profit (with some adjustments). Deferred tax is not considered for these purposes.
Without prejudice of the provisions established in tax treaties, distribution of dividends to non-residents will now be subject to a 20% dividend tax (previously 10%). If the corresponding profits were not taxed at the level of the distributing company, the corporate income tax rate would be applied over the dividends (35% general rate; however, for financial institutions, this rate could be 40% from 2023 to 2027), and after that, the 20% dividend tax is applied. Foreign portfolio investments are also subject to the 20% withholding tax. However, in the case of previously untaxed corporate profits, instead of applying the general income tax rate, the recapture tax would be a withholding tax of 25%. Corporate profits earned up to December 31, 2016, are not subject to the 20% withholding tax on dividends, even though the distribution occurs from and after January 1, 2017.
In the case of dividends distributed to Colombian companies, besides the recapture tax, if applicable, they are subject to the 10% withholding tax rate (previously at 7.5%). In any case, the tax paid by the Colombian company over the dividends can be transferred to its foreign investors, to be used against the 20% dividend tax in the distribution to such foreign investor. Therefore, they are entitled to use it as a tax credit against their own taxes when they receive dividends. The 10% withholding tax may not apply in serval circumstances, including when the dividend distribution is made within a registered group of companies or when there is a registered control situation. Finally, under recent court decisions, the dividend distributions within Colombian companies may be subject to the industry and commerce tax (ICA) at a rate of approximately 1%. There is a discussion on whether the ICA may also be applicable to distributions to non-resident shareholders, which should be evaluated in each case.
Additionally, Colombian legislation establishes an equity tax that is applicable for Colombian individuals and companies. Regarding individuals, the equity tax shall be applicable for those individuals with a net wealth (i.e. assets minus allowable liabilities) that surpass 72,000 Colombian Tax Units (approximately USD 1,041,410.78 for 2026) as of January 1 of each year. The tax rate is progressive, with the following applicable tax rates:
•0.5% on net wealth that exceeds the 72,000 Tax Units,
•1% on the excess over 122,000 Tax Units (approximately USD 1,765,093.20 for 2026), and
•1.5% on the excess over 239,000 Tax Units (approximately USD 3,457,846.52 for 2026).
Moreover, in 2026 the equity tax shall be applicable to legal entities and companies with a net equity that is equal to or exceeds 200,000 Tax Units (approximately USD 2,893,693.88 for 2026) as of March 1, 2026. The general applicable tax rate is 0.5%, with a special tax rate of 1.6% for the financial sector, which shall be applicable on the gross equity minus liabilities. Please note that this tax applicable to legal entities is temporary only for FY 2026
10.5 Material U.S. Federal Income Tax Consequences
This section describes certain material U.S. federal income tax consequences of the purchase, ownership and disposition of our common shares held by U.S. Shareholders (as defined below) that hold our common shares as capital assets for U.S. federal income tax purposes (generally, property held for investment). This summary is based on the U.S. Internal Revenue Code of 1986, as amended (the Code), applicable regulations of the U.S. Department of the Treasury promulgated thereunder (the Treasury Regulations), Internal Revenue Service (IRS) rulings and decisions, and judicial decisions thereon and existing interpretations thereof, all as in effect on the date of this Annual Report. These authorities
may be subject to different interpretations or changes, possibly with retroactive effect, which may result in U.S. federal income tax consequences different from those summarized below.
We have not sought any ruling from the IRS in respect of the statements made and the conclusions reached in this discussion, and there can be no assurance that the IRS will agree with such statements and conclusions, or that the IRS will not challenge any of the positions taken by us and that such challenge, if any, will not be sustained. A different treatment from that described below could adversely affect the tax consequences of the ownership and disposition of our common shares as set forth in this summary.
This summary does not purport to deal with all aspects of U.S. federal income taxation that may be relevant to a particular holder in light of such holder’s circumstances. In particular, this summary does not address all of the tax consequences that may apply to members of a special class of holders subject to special rules, including:
(1)dealers in securities or currencies;
(2)persons subject to special tax accounting rules under Section 451(b) of the Code;
(3)regulated investment companies;
(4)real estate investment companies;
(5)traders in securities that elect to use a mark-to-market method of accounting for securities holdings;
(6)tax-exempt organizations;
(7)banks, insurance companies, or any other financial institution;
(8)persons that actually or constructively own 10% or more, by vote or value, of our common shares;
(9)persons subject to alternative minimum tax;
(10)persons that hold our common shares as part of a straddle or a hedging, conversion, or other integrated transaction for U.S. federal income tax purposes;
(11)persons that purchase or sell common shares as part of a wash sale for U.S. federal income tax purposes;
(12)partnerships or other pass-through entities (including grantor trusts) and investors therein; or
(13)persons whose functional currency is not the US Dollar.
If a partnership (including any entity treated as a partnership for U.S. federal income tax purposes) is a beneficial owner of common shares, the U.S. federal income tax treatment of a partner in that partnership generally will depend on the status of the partner and the activities of the partnership. Partners of a partnership holding common shares should consult with their own tax advisors regarding the U.S. federal income tax consequences to them.
The One Big Beautiful Bill Act (OBBBA), enacted on July 4, 2025, introduced, among other things, significant changes to the U.S. federal income tax rules applicable to individuals, including the permanent extension of the reduced individual tax rates enacted under the Tax Cuts and Jobs Act of 2017, increases to the standard deduction beginning in 2025 and temporary increases to the cap on the U.S. federal tax deductibility of state and local taxes. The tax law changes introduced by the OBBBA may affect the overall U.S. federal income tax liability of U.S. Shareholders. U.S. Shareholders should consult their own tax advisors regarding the effect of the tax law changes introduced by the OBBBA on their particular tax circumstances.
Prospective investors of our common shares should consult with their own tax advisors regarding the U.S. federal, state, local and non-U.S. and other tax consequences of owning and disposing of the common shares in their particular circumstances.
This summary applies to U.S. Shareholders. As used in this section 10.5, a "U.S. Shareholder" means a beneficial owner of our common shares who or that is, for U.S. federal income tax purposes, any of the following:
•an individual who is a citizen or resident of the United States,
•a corporation, or other entity taxable as a corporation, created or organized under the laws of the United States, any state thereof or the District of Columbia,
•an estate whose income is subject to U.S. federal income tax regardless of its source, or
•a trust if a U.S. court can exercise primary supervision over the trust's administration and one or more U.S. persons (as defined in the Code and Treasury Regulations) are authorized to control all substantial decisions of the trust.
Taxation of Dividends
Subject to the discussion of the “passive foreign investment company” rules below, the gross amount of any distributions of cash or property with respect to our common shares generally will be treated as dividends for U.S. federal income tax purposes to the extent paid out of our current or accumulated earnings and profits, as determined under U.S. federal income tax principles. Distributions in excess of current and accumulated earnings and profits, as determined for U.S. federal income tax purposes, will be treated first as a return of capital that is applied against and reduces the U.S. Shareholder's adjusted tax basis in the common shares, but not below zero, and thereafter as capital gain realized on the sale or other disposition of the common shares. Because we do not maintain calculations of our earnings and profits under U.S. federal income tax principles, it is expected that distributions generally will be reported to U.S. Shareholders as dividends. The amount of any distribution paid in a foreign currency will be equal to the U.S. Dollar value of such currency, translated at the spot rate of exchange on the date such distribution is received, regardless of whether the payment is in fact converted into U.S. Dollars at that time.
Any dividends that a U.S. Shareholder receives will be includable in such holder’s gross income as ordinary income on the day such holder actually or constructively receives them. Such dividends will not be eligible for the dividends-received deduction generally allowed to certain corporate U.S. Shareholders. Dividends paid by us generally will be non-U.S. source income for purposes of the U.S. “foreign tax credit” rules. The rules governing U.S. foreign tax credits are complex and involve the application of rules that depend on the particular circumstances of each U.S. Shareholder. Therefore, each U.S. Shareholder should consult with his, her or its own tax advisor with respect to the availability of U.S. foreign tax credits in such U.S. Shareholder’s particular circumstances. Please note that, in January 2022, the U.S. Department of the Treasury published new Treasury Regulations that significantly modified the requirements that a foreign tax must satisfy to be claimed as a credit. It is important to note, however, that most of the requirements provided by such Treasury Regulations have been temporarily suspended. Each U.S. Shareholder is encouraged to reevaluate with his, her or its own tax advisors whether foreign income taxes would be creditable for U.S. federal income tax purposes in light of the recent changes.
Subject to certain limitations, including certain limitations based on taxable income and filing status, and subject to certain minimum holding period requirements, dividends paid to non-corporate U.S. Shareholders, including individuals, may be eligible for a reduced rate of taxation if we are deemed to be a “qualified foreign corporation” for U.S. federal income tax purposes. A qualified foreign corporation includes a non-U.S. corporation if (1) its stock is readily tradable on an established securities market in the United States or (2) it is eligible for the benefits of a comprehensive income tax treaty with the United States that meets certain requirements. However, a corporation is not a qualified foreign corporation if it is a “passive foreign investment company” (as discussed below) for the taxable year in which the dividend is paid or the preceding taxable year. The common shares are traded on the NYSE, which is an established securities market in the United States. However, the United States does not have a comprehensive income tax treaty with either Bermuda or Peru. Each U.S. Shareholder should consult with his, her or its own tax advisor regarding the treatment of dividends and such holder’s eligibility for a reduced rate of taxation on dividends.
Taxation of Capital Gains
Subject to the discussion of the “passive foreign investment company" rules below, a U.S. Shareholder generally will recognize gain or loss on the sale or exchange of common shares equal to the difference between the amount realized on the sale or exchange and the U.S. Shareholder’s adjusted tax basis in the common shares. Any gain or loss will be classified as a capital gain or loss, and it will be treated as a long-term capital gain or loss if the common shares were held for more than one year. Gain or loss, if any, recognized by a U.S. Shareholder generally will be treated as U.S.-source gain or loss for purposes of calculating the U.S. foreign tax credit limitation. Therefore, U.S. Shareholders may not be able to use any U.S. foreign tax credit arising from Peruvian tax imposed on the sale or exchange of common shares, unless the credit can be applied (subject to applicable limitations) against tax due on other non-U.S. source income. A U.S. Shareholder’s adjusted tax basis in its common shares generally is equal to its purchase price for such shares, adjusted according to U.S. federal income tax principles. Any long-term capital gain recognized by non-corporate U.S. Shareholders generally will be subject to tax at reduced rates. The deductibility of capital losses is subject to limitations. Each U.S. Shareholder should consult with his, her or its own tax advisor regarding the taxation of capital gains and deductibility of capital losses in light of their particular facts and circumstances.
Passive Foreign Investment Company (PFIC)
A non-U.S. corporation will be classified as a passive foreign investment company (PFIC) for U.S. federal income tax purposes if either:
•75% or more of its gross income for the taxable year is passive income; or
•on a quarterly average for the taxable year by value (or by adjusted basis, if it is not a publicly traded corporation and it is a so-called controlled foreign corporation (as the definition of that term is modified under the PFIC rules) or it so elects), 50% or more of its assets produce or are held for the production of passive income.
For the purposes of this test, such non-U.S. corporation will be treated as owning its proportionate share of the assets and earning its proportionate share of the income of any other corporation in which it owns, directly or indirectly, 25% or more (by value) of the stock.
We have not determined whether we have previously been a PFIC for any year, or whether we are currently, or will be a PFIC in future years. Furthermore, because this determination is made on an annual basis, no assurance can be given that we will not be classified as a PFIC in future taxable years. If we are classified as a PFIC for U.S. federal income tax purposes, a U.S. Shareholder that does not make an election to treat us as a “qualified electing fund” and did not make a “mark-to-market” election, each as described below, will be subject to the following U.S. federal income tax consequences:
1.“Excess distributions” we make to a U.S. Shareholder will be taxed in a special way. “Excess distributions” are amounts received by a U.S. Shareholder with respect to our common shares in any taxable year that exceed 125% of the average distributions received by the U.S. Shareholder from us in the shorter of either of the three previous years or the U.S. Shareholder’s holding period for such common shares before the current taxable year. Excess distributions must be allocated ratably to each day that a U.S. Shareholder has held our common shares. A U.S. Shareholder must include amounts allocated to the current taxable year and to any non-PFIC years in his or her gross income as ordinary income for that year. A U.S. Shareholder must pay U.S. federal income tax on amounts allocated to each prior taxable PFIC year at the highest marginal tax rate in effect for that year on ordinary income and the tax is subject to an interest charge at the rate applicable to deficiencies for U.S. federal income tax.
2.The entire amount of gain that is realized by a U.S. Shareholder upon the sale or other disposition of our common shares will also be considered an excess distribution and will be subject to U.S. federal income tax as described above.
3.A U.S. Shareholder’s adjusted tax basis in shares that were acquired from a U.S. decedent would not receive a step-up to fair market value (FMV) as of the date of the decedent’s death but instead would be equal to the decedent’s adjusted tax basis, if lower than such value.
The special PFIC rules do not apply to a U.S. Shareholder if the U.S. Shareholder makes an election to treat us as a “qualified electing fund” in the first taxable year in which the U.S. Shareholder owns our common shares and if we comply with certain reporting requirements. Instead, a shareholder of a qualified electing fund is required for each taxable year to include in income a pro rata share of the ordinary earnings of the qualified electing fund as ordinary income and a pro rata share of the net capital gain of the qualified electing fund as long-term capital gain, subject to a separate election to defer payment of taxes, which deferral is subject to an interest charge. The election generally is made on a shareholder-by-shareholder basis and may be revoked only with the consent of the IRS. A U.S. Shareholder makes the election by attaching a completed IRS Form 8621, which includes the PFIC annual information statement, to a timely filed U.S. federal income tax return. Even if an election is not made, a U.S. Shareholder generally must file a completed IRS Form 8621 in each year that we are a PFIC. U.S. Shareholders should be aware that, for each taxable year, if any, that we are a PFIC, we can provide no assurances that we will satisfy the record keeping requirements of a PFIC, or that we will make available to U.S. Shareholders the information such U.S. Shareholders require to make a “qualified electing fund” election with respect to us.
A U.S. Shareholder who owns PFIC shares that are publicly traded could elect to mark the shares to market annually, recognizing as ordinary income or loss each year an amount equal to the difference as of the close of the taxable year between the FMV of the PFIC shares and the U.S. Shareholder’s adjusted tax basis in the PFIC shares. If such a mark-to-market election is made, then the rules set forth above would not apply for periods covered by the election. Assuming that we are trading on the NYSE, our common shares are expected to be treated as publicly traded for purposes of the mark-to-market election and, therefore, such election should be able to be made if we are classified as a PFIC. A mark-to-
market election is, however, subject to complex and specific rules and requirements, and U.S. Shareholders are strongly urged to consult with their tax advisors concerning this election if we are classified as a PFIC.
U.S. Shareholders are urged to consult with their tax advisors regarding the adverse tax consequences of owning our common shares if we are, or become, a PFIC, and the possibility of making certain elections designed to lessen those adverse consequences.
Medicare Tax on Net Investment Income
A U.S. Shareholder that is an individual or estate, or a trust that does not fall into a special class of trusts that is exempt from such tax, is subject to a 3.8% net investment income tax (NIIT or the Medicare tax) on the lesser of (i) such holder’s "net investment income" (or "undistributed net investment income" in the case of an estate or trust) for the relevant taxable year and (ii) the excess of such holder’s modified adjusted gross income for the taxable year over a certain threshold (which in the case of individuals is between $125,000 and $250,000, depending on the individual's circumstances and tax filing status). A U.S. Shareholder’s net investment income generally includes its dividend income and its net capital gains from the disposition of our common shares unless such dividends or net capital gains are derived in the ordinary course of the conduct of a trade or business (other than a trade or business that consists of certain passive or trading activities). A U.S. Shareholder that is an individual, estate or trust is urged to consult with his, her or its own tax advisor regarding the applicability of the Medicare tax in respect of its investment in our common shares.
Information with Respect to Foreign Financial Assets
Certain U.S. Shareholders of “specified foreign financial assets” with an aggregate value in excess of $50,000 on the last day of the taxable year, or in excess of $75,000 at any point during the taxable year, generally are required to file information reports with respect to such assets with their U.S. federal income tax returns. Depending on your circumstances, higher threshold amounts may apply. The term “specified foreign financial assets” includes any financial accounts maintained by non-U.S. financial institutions, as well as any of the following, but only if they are held for investment and not held in accounts maintained by financial institutions: (i) stocks and securities issued by a non-U.S. entity and not held in an account maintained by a financial institution, (ii) financial instruments and contracts that have non-U.S. issuers or counterparties, and (iii) interests in non-U.S. entities. Our common shares may be treated as specified foreign financial assets. Therefore, the holders of our shares may be subject to this information reporting regime. Failure to file information reports may subject holders to penalties. The holders of our shares should consult with their own tax advisors regarding their obligation to file information reports with respect to the common shares.
Backup Withholding and Information Reporting
Dividends paid, if any, on our common shares to a U.S. Shareholder may be subject to information reporting and may also be subject to U.S. backup withholding tax (currently at a rate of 24%), unless a U.S. Shareholder either furnishes its taxpayer identification number or otherwise establishes an exemption. In addition, information reporting generally will apply to payments of proceeds from the sale, exchange, redemption or other disposition of our common shares by a paying agent, including a broker, within the United States to a U.S. Shareholder. A paying agent within the United States will be required to impose backup withholding on any payments of the proceeds from the sale, exchange, redemption or other disposition of the common shares within the United States to a U.S. Shareholder, provided such U.S. Shareholder fails to furnish his, her or its correct taxpayer identification number or otherwise fails to establish an exemption or comply with such backup withholding requirements. Backup withholding is not an additional tax and may be refunded (or credited against the U.S. Shareholder’s U.S. federal income tax liability, if any), provided certain required information is furnished to the IRS. The information reporting requirements may apply regardless of whether withholding is required.
Foreign Account Tax Compliance Act (FATCA)
Sections 1471 through 1474 of the Code (commonly known as the Foreign Account Tax Compliance Act, or FATCA) generally impose a 30% U.S. federal withholding tax on certain payments to certain non-U.S. financial institutions that fail to comply with certain information reporting, account identification, withholding, certification, and other FATCA-related requirements in respect of their direct and indirect U.S. shareholders and/or U.S. accountholders, under certain circumstances. To avoid becoming subject to FATCA withholding, we may be required to report information to the Bermuda government or the IRS regarding our U.S. Shareholders. Each U.S. Shareholder should consult with his, her or its own tax advisor to obtain a more detailed explanation of FATCA and to learn how FATCA might affect that U.S. Shareholder in his, her or its particular circumstances.
10.6.Double tax treaties
As of December 2025, Peru has tax treaties with the following jurisdictions: Brazil, Canada, Chile, Japan, Mexico, Portugal, South Korea, Switzerland, and the member countries of the Andean Pact (Bolivia, Colombia, and Ecuador). In addition, the treaty with the United Kingdom will apply as of April 2026 with regards to UK source income (earned by Peruvian entities or individuals), and as of January 2027 regarding Peruvian source income (earned by UK entities or individuals).
As of January 2026, the Multilateral Instrument (MLI) is applicable in Peru, incorporating anti‑abuse measures and minimum international standards into certain tax treaties without the need for individual renegotiation. These measures apply to Peru’s tax treaties with Canada, Chile, South Korea, Mexico, and Portugal, but do not apply to Peru’s other tax treaties.
Peru does not have a tax treaty with Bermuda, and the United States does not have a comprehensive income tax treaty with Bermuda or Peru.
10.FDividends and Paying Agents
Not applicable.
10.GStatement by Experts
Not applicable.
10.HDocuments on Display
As a foreign private issuer, we are subject to the information reporting requirements of the Exchange Act. As such we must file or furnish reports and other information to the SEC, which typically may be inspected at the public reference facilities of the SEC, at 100 F Street, N.E., Washington, D.C. 20549. The public reference room is open to the public on Wednesdays, from 10 a.m. to 3:30 p.m. Members of the public who have questions about the information available from the public reference room should contact the Commission’s Office of FOIA Services by email at oiapa@sec.gov, or by telephone at 202-551-7900.
In addition, the SEC maintains a website at which the documents concerning the Group that have been filed or furnished electronically may be inspected. These documents can be obtained in electronic form at http://www.sec.gov, as well as from certain commercial document retrieval services. Neither information contained on the SEC’s website nor information gathered from commercial document retrieval services forms part of this Form 20-F. Any other Credicorp policies mentioned in this Form 20-F can be accessed on our Investor Relations website at https://credicorp.gcs-web.com/.
10.ISubsidiary Information
Not applicable.
ITEM 11.QUANTITATIVE AND QUALITATIVE DISCLOSURES ABOUT MARKET RISK
The following section describes the risks to which Credicorp is exposed and the management tools used to measure and control them. Due to its financial activities, including lending, borrowing, trading and investing, the Group faces risks which could incur potential losses if adverse changes occur.
The Group’s principal activity consists of receiving deposits from customers, mainly at fixed rates and for different periods, and investing these funds in high-quality assets, using financial instruments (such as derivatives) to cover potential risk factors and to take advantage of market movements on securities, bonds, currencies and interest rates. Additionally, the Group places these deposits with legal entities and individuals, considering the financial costs and expected profitability.
We also seek to raise margins by lending to commercial and retail customers through a range of financial products. These activities involve not only on-balance sheet loans and advances but also off-balance sheet facilities and other commitments, such as letters of credit and performance bonds.
Given the Group’s activities, it has a framework for risk appetite, a cornerstone of its risk management. The risk management processes involve continuous identification, measurement, treatment, and monitoring of potential risks. The Group is exposed, principally, to credit, non-financial risks, market risk, liquidity risk, model risk and insurance technical risk.
11.1Risk Management Governance
In order to carry out adequate risk management, Credicorp has established a structure of government with different levels of oversight.
Governance Structure
The highest level of hierarchy in risk governance in Credicorp Ltd. and Grupo Credito S.A. is the Board of Directors:
•Credicorp’s Board of Directors is responsible for the approval of the levels of risk appetite that Credicorp Ltd. is prepared to assume. The Board of Directors also acknowledges the Group’s level of compliance with the risk appetite and level of risk exposure, as well as the relevant improvements in the risk management approaches of the Group.
•Grupo Credito S.A.’s Board of Directors is responsible for the overall risk management approach and the approval of the levels of risk appetite that Grupo Credito S.A. and its subsidiaries are prepared to assume. Furthermore, it approves the guidelines and policies for comprehensive risk management. The Board also establishes an organizational culture that emphasizes the importance of risk management, oversees the internal control system and ensures compliance to the risk appetite.
•The Board of Directors of each subsidiary is responsible for aligning the risk management approach established by Credicorp’s Board of Directors with the particular context. To that end, each Board establishes a framework for risk appetite, policies and guidelines.
The second level of oversight of risk governance of Credicorp Ltd. and Grupo Credito S.A. is the Risk Committee:
•The Credicorp Risk Committee, representing Credicorp’s Board of Directors, proposes risk appetite levels for Credicorp Ltd. Furthermore, it considers the level of compliance to the risk appetite and level of risk exposure, as well as the relevant improvements, when assessing the Group’s comprehensive risk management.
•The Grupo Credito Risk Committee, representing Grupo Credito’s Board of Directors (including risk management of Credicorp subsidiaries), defines the strategies used for the adequate management of the different types of risks and the supervision of risk appetite. In addition, the committee establishes principles, policies and guidelines.
For more information about The Board of Directors, The Risk Committees and its functions, please refer to the following section: ITEM 6. DIRECTORS, SENIOR MANAGEMENT AND EMPLOYEES – 6.C Board Practices.
The Grupo Credito Risk Committee (including risk management of Credicorp subsidiaries) is supported by the following committees (with the exception of Model Risk functions), which report periodically on all relevant changes or issues relating to the risks being managed:
a)Corporate Credit Risk Committees
The Corporate Credit Risk Committees (retail and wholesale) are responsible for proposing credit risk management guidelines within the framework of governance and organization for the comprehensive management of credit risks. Furthermore, the committees propose the approval of any changes to the credit risk management functions and report important findings to the Risk Committee.
b)Corporate Methodological Operational Risk Committee
The Corporate Methodological Operational Risk Committee is responsible for monitoring the operational risk indicators of each of the Group’s companies and the progress of the implementation of operational risk and business continuity methodologies. Additionally, the committee shares best practices relevant to major challenges faced by the Group’s companies.
c)Corporate Structural, Negotiation and Liquidity Market Risk Committee
The Corporate Structural, Negotiation and Liquidity Market Risk Committee is responsible for analyzing and proposing objectives, guidelines, and policies for the Market and Liquidity risk management of the Group’s companies. Furthermore, the committee is responsible for monitoring indicators and appetite limits for Credicorp and each of the Group’s companies, as well as the implementation of corrective measures in case of deviations. Additionally, the Committee is responsible for the integration of a corporate model within the Group.
11.2Risk Management Structure
In order to carry out appropriate risk management, Credicorp maintains a management structure according to its needs and based on the risks to which it is exposed.
Credicorp Risk Management Structure
Chief Risk Officer (CRO)
The CRO is responsible for implementing policies, procedures, methodologies, and actions to identify, measure, monitor, mitigate, report and control the different types of risks to which the Group is exposed. The CRO also participates in the creation of the strategic plans of the business units to ensure compliance with the risk appetite metrics approved by the Board of Directors.
Likewise, the CRO is responsible for the level of compliance with the risk appetite and the level of exposure assumed by Grupo Crédito S.A. and other Credicorp subsidiaries. Also, the CRO reports the relevant improvements in the comprehensive risk management of Grupo Crédito S.A. and other Credicorp subsidiaries. In addition, the CRO proposes to the Credicorp Risk Committee the risk appetite levels for Credicorp Ltd.
All issues regarding Credicorp’s corporate risk management are under the responsibility of Credicorp's CRO, who is also the CRO of Credicorp Ltd. and Grupo Crédito S.A. To ensure effective fulfillment of this responsibility, it was
decided that those three positions should be held by the same person. Credicorp’s CRO reports to the CEO but has full independence regarding risk decisions, which are discussed in Credicorp’s Risk Committee.
The Central Risk Management units are the following:
a.Wholesale Banking Risk Division
This Division is responsible for proposing credit policies and criteria for evaluating and managing credit risks assumed by lending to wholesale clients. It evaluates and approves loan proposals and recommends approval to higher authorities for those that exceed its autonomy. These policies and criteria are established based on policies set by the Board of Directors and in accordance with applicable laws and regulations. In addition, it measures the evolution of the risk faced by wholesale clients, identifies possible signs of deterioration in their payment capacity, and takes actions to mitigate or resolve them.
b.Retail Banking Risk Division
The Retail Banking Risk Division is responsible for managing the risk profile of the retail portfolio and promoting retail credit risk specific guidelines that are consistent with the overall guidelines and risk policies set by the Board of Directors. Additionally, this Division assists in defining the products and campaigns aligned with these policies, as well as in the design, optimization and integration of credit assessment tools and income estimation for credit management.
c.Risk Management Division
The Risk Management Division is responsible for ensuring that risk management directives and policies comply with those established by the Board of Directors. In addition, it is responsible for supervising the process of risk management, coordinating with the Group’s companies involved in the process, and promoting standard risk management aligned with best practices. It also has the task of informing the Board of Directors of global exposure to risks, by type of risk, as well as the specific exposure of each of the Group’s companies.
d.Non-Financial Risks Division
The Non-Financial Risks Division is responsible for defining a non-financial risks strategy aligned with the objectives and risk appetite set by the Board. This strategy seeks to strengthen the management process, generate synergies, optimize resources, and achieve better results among the units responsible for managing non-financial risks. Additionally, in order to achieve the objectives defined in the non-financial risk strategy, the Division is responsible for promoting responsible risk culture, developing talent, defining indicators and generating and following-up strategic projects and initiatives.
The Non-Financial Risks Division is composed of the following areas: Operational Risk Management, Cybersecurity; and Corporate Security and Cyber Crime Management.
e.Risk Transformation Office
The Risk Transformation office aims to transform our Risk Management into a competitive advantage, enhancing our capabilities in: i) origination, ii) portfolio monitoring, iii) life cycle of credit models, and iv) talent.
f.Center of Excellence of Pricing
The Group's Pricing Expertise Center’s main objective is the efficient scaling of the Pricing practice in the Group's business lines, identifying opportunities and deploying initiatives that allow the development of the Pricing practice. During 2024, the monitoring tools of the pricing management strategy were strengthened to assign an appropriate price based on the risk profile of our clients.
g.Corporate Risk Management Division
The Corporate Risk Management Division’s scope covers the risk management of Credicorp’s subsidiaries (not including BCP Stand-alone) and is responsible for managing day-to-day risk under the risk appetite framework approved by our senior management; ensuring that corporate policies and guidelines are applied uniformly between the subsidiaries.
This Division also proposes strategic initiatives for better risk management as well as criteria and methodologies to facilitate the process of risk management.
11.3Risk Appetite
To manage the risks to which it is exposed, Credicorp uses different guidelines. This allows Credicorp to maintain adequate risk levels to generate value for the organization and investors.
Risk Appetite
The Board of Directors annually approves the risk appetite framework defining the maximum level of risk that the organization is willing to tolerate, as it seeks to attain its strategic and financial objectives. In order to ensure consistency with the Group’s corporate risk vision, the Board of Directors, through the corporate Risk Committee, reviews and approves the risk appetite of each subsidiary while considering its business model. This risk appetite framework is based on "core" and "specific" metrics:
•Core metrics: are intended to preserve the organization’s strategic pillars, defined as solvency, liquidity, profit and growth, income stability and balance sheet structure.
•Specific metrics: are intended to monitor on a qualitative and quantitative basis the various risks to which every company of the Group is exposed and establish a tolerance threshold of each of those risks, so that the risk profile set by the Board of Directors is preserved and any risk concentration is anticipated on a more granular basis. These metrics are related to credit risk, market risk and cybersecurity risk.
Risk appetite is measured based on the following guidelines:
(1)A risk appetite statement establishes general principles and the qualitative declarations that complement the risk strategy.
(2)A metric scorecard is used to define the levels of risk exposure in the different strategic pillars.
(3)Risk limits allow control over the risk-taking process within the tolerance threshold established by the Board. Limits also provide accountability for the risk-taking process and define guidelines regarding the target risk profile.
(4)A governance scheme seeks to guarantee compliance with the framework through different roles and responsibilities assigned to the units involved.
The risk appetite is integrated in the processes of strategic and capital guidelines, as well as in the definition of the budget exercise, facilitating the strategic decision-making process of the organization.
11.4Managed Risks
Credicorp's governance and risk management seek to adequately manage the risks to which we are exposed as an organization.
a)Credit Risk
The Group is exposed to credit risk, which is the probability of suffering losses caused by debtors or counterparties failing to comply with payment obligations whether on or off the balance sheet.
Credit risk is the most important risk affecting the Group’s business due to relevance of the Universal Banking and Microfinance LoB and its exposure to this type of risk; therefore, Management carefully manages its exposure to credit risk. Credit risk exposures arise principally from lending activities that lead to direct loans, though they also result from investment activities. There is also credit risk in off-balance sheet financial instruments, such as contingent credits (indirect loans), which expose Credicorp to risks similar to direct loans. Likewise, credit risk can also arise from derivative financial instruments as counterparty risk in those derivatives currently show positive fair values.
Credit risk levels are defined based on risk exposure limits, which are frequently monitored. Risk exposure limits are established in relation to one borrower or group of borrowers, geography, and industry segments. Furthermore, the risk limits by product, industry sector and geographical area are approved by the Risk Committee.
a.Credit Risk Measurement
All exposures to credit risk (direct or indirect) are mitigated by the Group’s control processes and policies. Exposure to credit risk is managed through regular analysis of the ability of debtors and potential debtors to meet interest and principal repayment obligations and changes in the credit limits as appropriate.
As part of managing credit risk, provisions for impairment of its portfolio are assigned as of the date of the statement of financial position.
Provisions for loan losses
In accordance with the IFRS 9 standard, all the financial assets classified or designated as an amortized cost, debt instruments classified as investments at fair value through other comprehensive income, and indirect loans presented in off-balance accounts are subject to an impairment evaluation.
Measurement of expected credit losses
Measurement of expected credit losses is mainly based on three parameters: probability of default (PD), loss given default (LGD), and exposure at default (EAD), discounted at the reporting date using the effective interest rate. The estimates, pursuant to IFRS 9 parameters, consider not only past due information, but also all relevant credit information, including actual conditions and expected macroeconomic effects in three scenarios (base, optimistic and pessimistic).
The definitions of the three parameters are as follows:
•Probability of Default (PD): This is a measurement assigned internally to customers and is designed to estimate their probability of default within a specific time horizon. This measurement is obtained through three main components: (i) the observed credit risk of the portfolio, (ii) the macroeconomic conditions of the main countries where Credicorp operates, and (iii) the individual credit risk of each loan, which is measured through scoring and rating tools. The definition of default in IFRS 9 is consistent with the one used for internal credit risk management purposes, as follows:
1.In the case of retail products, clients are in default if (i) at a specific moment, they are 60 or more days past due, except for mortgages, for which we allow 120 days; or (ii) if they have operations in one of the following situations: refinanced, restructured, pre-judicial, judicial or write off.
2.In wholesale banking, clients are in default if (i) they pass to Wholesale Collections; (ii) they have an internal classification of deficient with recurrence, deficient with more than 60 days past due, doubtful or loss; (iii) they have operations in refinanced, pre-judicial, judicial or write off; (iv) they have significant qualitative signs of impairment. For clients in default with significant exposure, the Risk Management Division makes a specific analysis for each one of them to determine the expected credit loss, considering the knowledge of the specific situation of the client, the collaterals and guarantees, and the available financial information.
•Loss Given Default (LGD): This is a measurement that estimates the severity of the loss that would be incurred at the time of the default. It is based on the difference between the contractual cash flows owed and those that the lender would expect to receive, even after the liquidation of the guarantees (for example: deposits or the equivalent, commodity warrants, immovable properties, ships, machinery and equipment). LGD also considers all the costs incurred during the recovery process. It is important to mention that when the Group writes off a position, it adjusts the LGD to 100% to add the allowance necessary to reach the required level, in accordance with our internal policy of write-offs, in which Credicorp’s subsidiaries do not have reasonable expectations of recovering the financial asset in its entirety or a portion thereof.
•Exposure at Default (EAD): This is a measurement that estimates the exposure at the time that the customer goes into default, considering changes in future exposure, for example, in the case of prepayments and/or greater utilization of unused lines.
Provisions for credit losses are measured on each reporting date following a three-stage model of expected credit losses based on the degree of a financial asset’s credit impairment:
(1)Stage 1: For financial assets with credit risk that has not increased significantly since their initial recognition, a reserve is recognized for losses equivalent to the credit losses expected to occur from defaults in the following 12 months.
(2)Stage 2: For financial assets that have presented a significant increase in credit risk since their initial recognition, but are not considered impaired, a reserve is recognized for losses equivalent to the credit losses expected to occur during the remaining life of the asset.
The definition of “significant increase in credit risk” used on the reporting date compared with the origination date considers the following criteria:
•Whether an account has been more than 30 days in arrears.
•Absolute and relative risk thresholds have been assigned by portfolio and risk level, which depend on the credit risk of the instrument on the origination date. For example, less risky PD assets have a broad threshold to move in without migrating to stage 2, in comparison to risky PD assets for which a small increase in PD can force them to migrate to stage 2.
•Follow-up systems, alerts and monitoring of portfolios are integrated in the staging process, as established by the current risk policy in the Wholesale and Retail Banking segments.
•Alignment criteria are applied to clients that have more than 20% of their position in stage 2. All the rest of their assets in stage 1 get automatically classified as stage 2.
(3)Stage 3: For financial assets classified as defaults, with objective evidence of impairment on the reporting date, the provision reflects the expected credit losses during the residual life of the assets. Alignment criteria are also applied at this stage.
The fundamental difference in the measurement of expected credit losses between stage 1 and stage 2 is the PD horizon. The estimates for stage 1 use a 12-month time horizon, while the estimates for stage 2 calculate the expected credit loss based on the remaining life of the asset and consider the effect of the significant increase in credit risk. Finally, estimates for stage 3 are based on a “best estimate” approach, according to the collection process of each asset, and are made for the remaining life of the asset.
For certain less material portfolios, the Group extrapolates the expected credit loss ratios from portfolios with similar credit risk characteristics.
In line with the internal model governance framework, the main parameters used in the measurement of credit risk (including PD and LGD) were continuously monitored throughout 2025. The models are calibrated when performance monitoring reveals material deviations from their expected behavior, thereby ensuring an adequate and consistent estimation of credit risk.
The Group’s expected credit losses are a weighted estimate of three macroeconomic scenarios (base, optimistic and pessimistic), which are based on macroeconomic projections provided by the internal team of economic researchers and approved by senior management. These projections are made for the main countries in which Credicorp operates. In each scenario, the Group considers a wide variety of prospective information as economic inputs, including the growth of the GDP, the inflation rate and the exchange rate.
The macroeconomic scenarios consider the fact that Peru is a small and open economy, with about 60.0% of GDP growth volatility explained by external factors. These external factors include Peru’s terms of trade, growth of Peru’s main trade partners, and external interest rates. Information on each of these factors is collected to model each scenario for the next three years.
The aforementioned variables are then incorporated into economic models for the Peruvian economy along with local variables (fiscal and monetary).
Through this process, projections of GDP growth, inflation, exchange rate and other macroeconomic variables were obtained for the years 2025, 2026 and 2027. As of December 31, 2025, we expected GDP to grow around 3.3 percent in 2026, which is explained, among other reasons, by:
•Highly favorable external conditions driven by record-high terms of trade and lower global interest rates.
•Positive momentum associated with the maturing economic cycle.
•Low inflation supporting real wage recovery.
•An acceleration in credit origination aligned with higher aggregate demand and improved financial health of economic agents.
•Economic expectations remaining in optimistic territory and continuing to improve.
In addition, a usual degree of uncertainty arising from the political environment inherent to the electoral cycle is recognized.
For 2026, probabilities of 50 percent, 25 percent and 25 percent were considered for the baseline, optimistic and pessimistic scenarios, respectively.
The probabilities assigned to each scenario and projection year are validated by fan chart analysis, which uses the likelihood function to identify and analyze:
•The central tendency of the projections.
•The dispersion that is expected around this value.
•The values that are higher or lower than the central value that are more or less probable.
The following table provides a comparison of the reported expected credit loss for Credicorp’s loan portfolio and the expected credit loss under the three scenarios:
| | | | | | | | | | | | | | |
| At December 31, 2025 (in thousands of Soles) | Optimistic Scenario | Base Case Scenario | Pessimistic Scenario | Reported ECL under
IFRS 9 |
| Total Loans | 7,960,895 | 8,031,548 | 8,142,114 | 8,041,526 |
For further information about the IFRS 9 measurement of the expected credit loss, see Note 3(i) to the consolidated financial statements.
For historical data regarding our loan loss reserves, see “ITEM 4. INFORMATION ON THE COMPANY – 4.B Business Overview – (7) Selected Statistical Information – 7.3 Loan Portfolio – 7.3.12 Allocation of Loan Loss Reserves”.
ESG Risk Management
Credicorp manages ESG topics by focusing on the incorporation of factors to mitigate risks, preserve value and generate value from its loan books and investment portfolios. Credicorp does this by implementing their ESG Risk Management Framework allowing them to:
•Incorporate ESG risk management into their financing and investment decisions
•Encourage financing and investment with a sustainable component and
•Accompany their clients in the transition towards sustainability
Below are the 2025 achievements related to the scope of the ESG Risk Team from the different fronts:
Appetite
Our risk appetite is defined at the corporate level through policies and guidelines aligned with the governance of social, environmental, and governance exclusions, and is complemented by the specific policies of each subsidiary. During 2025, the exclusions assessment was integrated into the evaluation processes of our financing and investment portfolios, ensuring consistency with the corresponding risk‑appetite level. Additionally, at Prima, the ESG risk appetite was specifically implemented for alternative funds.
Identification, Evaluation and Treatment
BCP and BCP Bolivia
The clients and sectors prioritized under the ESG Risk Credit Policy were evaluated, resulting in a controlled level of risk as of year-end 2025.
As complementary initiatives to strengthen ESG risk management in 2025, the following actions were developed:
•Scope expansion: A multisector ESG questionnaire was designed with the objective of incorporating new sectors and clients into the ESG Risk Credit Policy.
•Deforestation risk: Work began on identifying the impacted portfolio to manage deforestation risk, mainly among clients in the agriculture sector.
•Real estate collateral: The analysis of exposure and coverage of real estate collateral was initiated to assess their sensitivity to the materialization of physical risks related to climate change and natural events.
BCP
•Monitoring: A control dashboard was developed for managing ESG risk across the portfolio.
Mi Banco
The Environmental and Social Risk Analysis System (SARAS) was implemented within the credit admission process, using a preventive approach aimed at identifying and mitigating potential impacts before credit origination. This implementation enabled access to financing from multilateral institutions, specifically the Inter-American Development Bank (IDB) and the Japan International Cooperation Agency (JICA), amounting to USD 100MM.
Mi Banco Colombia
SARAS was strengthened through the incorporation of geographic information systems, improving accuracy in the assessment of physical, environmental, and climate risks. Additionally, the ENCORE tool was used for analyzing nature-related risks.
At the corporate level, work was carried out on the harmonization of heat maps for the identification of climate risks (both physical and transition risks). Likewise, to strengthen ESG risk management in the investment subsidiaries (Prima, Pacífico and Credicorp Capital), sector‑specific ESG KPIs were defined, progress was made in designing a corporate collaborative engagement strategy, and ESG expectations for issuers were established. At Pacífico, the portfolio’s carbon‑footprint measurement coverage improved, and climate metrics were approved for its overseas investments.
As a result of continuous work, the investment subsidiaries were able to remain in the first quartile of PRI (Principles for Responsible Investment) signatories and received recognition from ALAS20 (an initiative in Latin America and Spain that acknowledges excellence in public disclosure on sustainability, investor relations, and responsible investment).
Reporting
At Pacífico, the first Responsible Investment Report and the second annual edition of the TCFD report were published as an integrated part of the Pacífico Seguros Annual Report.
In Mi Banco Colombia, the first TNFD report was published.
Environmental Taxonomy
BCP and BCP Bolivia
A robust sustainable‑labeling governance framework is in place to manage the risk of greenwashing and social‑washing in financings classified as green and/or social. This framework includes a decision‑making process for the use of the sustainable label, as well as the ongoing update of the eligibility criteria within BCP’s socio‑environmental taxonomy, ensuring alignment with international standards and market best practices.
b)Non-Financial Risk
The Non-Financial Risks Division manages the following types of risks:
Non-Financial Risk Tribe - Operational Risk
Operational risk is the possibility of the occurrence of losses arising from inadequate processes, human error, failure of IT, relations with third parties or external events. Operational risks are tied to internal or external fraud, labor relations, job security, relations with customers, business products and practices, damages to material assets, business and systems interruption, and failures in process execution, delivery, and management of processes. Operational risks exclude strategic
and reputational risks (with the exception of companies under Colombian regulations, under which reputational risk is included in operational risk). Operational risks can lead to financial losses and have legal or regulatory consequences.
To develop an efficient risk culture, the Group records operational risks and their respective process controls. The Risk Map, which is a document that lists all the risks that could affect the organization and their characteristics, permits monitoring, prioritization and proposed treatment of the risks. The Group also carries out an active cybersecurity program, which is aligned with the best international practices.
Moreover, the business continuity management system enables the establishing, implementing, operating, monitoring, reviewing, maintaining, and improving of business continuity based on best practices and regulatory requirements. The Group implements recovery strategies for the resources that support important products and services, which are periodically tested to measure the effectiveness of such strategies. Information security management is carried out through a systematic process, which is documented and known by the entire organization, pursuant to best practices and regulatory requirements. The Group designs and develops the guidelines described in the policies and procedures to have strategies for the availability, confidentiality, and integrity of the information of assets of the organization. To manage operational risk, cybersecurity, fraud prevention and business continuity, corporate guidelines are used, and methodologies and best practices are shared among the Group’s companies.
In the event of the materialization of operational risks, the Group maintains a diverse portfolio with non-financial risk transfer options, mainly through its contracted insurance policies. These policies cover losses arising from fraud, civil and professional liability, cyber risks, and damage to physical assets, among other things. The coverage needs of key areas and new emerging risks are constantly being analyzed, leading to modifications to the existing policies and the incorporation of new insurances, considering the Group’s risk appetite and the expected and unexpected levels of our losses. This practice allows us to optimize the Group's insured risk profile.
Cybersecurity
See “ITEM 16K. CYBERSECURITY”.
Corporate Security and Cyber Crime
As part of non-financial risk management, the Corporate Security, Investigations & Cybercrime Area is responsible for detecting and responding to incidents related to fraud, cybercrime, and physical security.
These activities are carried out by specialized teams in investigations, cybercrime, electronic security, disaster risk management, and strategic intelligence activities, including social conflicts. Furthermore, new capabilities have been incorporated into our infrastructure's video surveillance system, which not only ensures compliance with new standards and regulations but also facilitates the integration of cutting-edge video intelligence functions. These include smart cameras supported by algorithms, analytics, and artificial intelligence, thus optimizing risk management through the greater reach offered by current technology. Along the same lines, drone squadrons have been incorporated for disaster risk management and perimeter surveillance, especially of critical infrastructure.
Finally, we contribute to the security of the Financial System through collaborative efforts developed at both the local and regional levels. At the local level, these are channeled through participation in the Peruvian Banking Association (ASBANC), while at the Latin American level, they are carried out through the Security Experts Committee of the Latin American Federation of Banks (FELABAN).
c)Market and Liquidity Risk
Market Risk
The Group is exposed to market risk, which is the risk that the fair value or future cash flows of a financial instrument will fluctuate because of changes in market prices. Market risks arise from open positions in interest rates, currency, commodities and equity products; all of which are exposed to general and specific market movements and changes in the level of volatility of prices such as interest rates, credit spreads, foreign exchange rates and equity prices. Due to the nature of the Group’s current activities, commodity price risk has not been approved; thus, this type of instrument is not traded.
1.Market Risk Measurements
The Group separates exposures to market risk into two groups: (i) risks arising from value fluctuation of trading portfolios recognized at fair value through profit or loss, due to movements of market rates or prices (Trading Book) and (ii) risks arising from changes in the structural positions of non-trading portfolios, due to movements of the interest rates, prices and foreign exchange ratios (Banking Book). Most of the structural portfolios are recorded at amortized cost and at fair value with changes in other comprehensive income.
The risks that trading portfolios (Trading book) face are managed through Value at Risk (VaR) historical simulation techniques, while non-trading portfolios (Banking Book) are monitored using rate sensitivity metrics, which are a part of ALM.
Trading Book
The trading book is characterized by liquid positions in stocks, bonds, foreign currencies and derivatives, arising from transactions in which the Group acts as counterparty with the customers or with the market. This portfolio includes investments and derivatives classified by Management as held for trading.
Value at Risk (VaR)
Based on a number of assumptions about changes in market conditions, we apply VaR to our trading portfolios to estimate the market risk of our positions and our maximum losses.
Daily calculation of VaR is a statistically-based estimate of the potential loss on our current portfolio caused by adverse market movements.
VaR expresses the “maximum” amount the Group might lose, but only to a certain level of confidence (99%). There is therefore a specified statistical probability (1%) that actual loss could be greater than the VaR estimate.
The time period used to calculate VaR is one day. However, because the VaR model assumes a ten-day “holding period” within which positions can be closed, the one-day VaR is amplified to a ten-day time frame and calculated by multiplying the one-day VaR by the square root of 10. This adjustment is exact only if the changes in the portfolio in the following days have a normal distribution identical and independent; otherwise, the 10-day VaR is an approximation.
VaR limits and assumptions are based on the risk appetite and trading strategy of each subsidiary. The assessment of past movements is based on historical one-year data and 71 market risk factors, which are comprised as follows: 21 market curves, 31 stock prices, 17 mutual funds values and 2 volatility series. The Group applies these historical changes into rates to its current positions (a method known as historical simulation). Management believes that the market risk factors incorporated into its VaR model are adequate to measure the market risk to which the Group’s trading book is exposed.
The use of this approach does not prevent losses outside of these limits in the event of more significant market movements. Losses exceeding the VaR figure should occur, on average under normal market conditions, not more than once every hundred days. VaR limits have been established to control and keep track of our risks taken. These risks arise from the size of our positions and/or the volatility of the risk factors embedded in each financial instrument. Regular reports are prepared for the Treasury and ALM Risk Committee, our risk management committees and our senior officers.
VaR results are used to generate economic capital estimates by market risk, which are periodically monitored and are part of the overall risk appetite of each subsidiary. Furthermore, Credicorp has internal appetite risk limits for the trading book which are monitored and reported to the Credicorp Market Risk Committee. In VaR calculations, the foreign exchange effect is not included, and as such the calculation is measured assuming a constant exchange rate. For further information, see “ITEM 11. QUANTITATIVE AND QUALITATIVE DISCLOSURES ABOUT RISK MANAGEMENT – Foreign Currency Exchange Rate Risk”.
Credicorp’s VaR remained stable as December 31, 2025. During this year, the VaR remained contained within the limits of the risk appetite established by the Group's Risk Management and its subsidiaries.
As of December 31, 2023, 2024 and 2025, our VaR by risk type were as follows:
| | | | | | | | | | | | | | | | | |
| 2023 | | 2024 | | 2025 |
| in thousands of Soles |
| Interest rate risk | 29,399 | | 29,138 | | 27,569 |
| Price risk | 5,291 | | 933 | | 1,631 |
| Volatility risk | 20 | | 462 | | 286 |
| Diversification effect | (5,850) | | (1,685) | | (611) |
| Consolidated VaR by risk type (1) | 28,860 | | 28,848 | | 28,875 |
(1)Amplified to the holding period, adjusted by a 10-days period of liquidation.
Only financial instruments from the trading book were considered in the VaR calculation.
On the other hand, the instruments recorded as fair values through profit or loss, which are not part of the selling business model are considered as part of the sensitivity analysis of rates and market prices in the next section (11.11). See the chart of sensitivity of earnings at risk, net economic value and price sensitivity.
The information disclosed in these charts addresses the VaR calculation for the entire consolidated Group. However, minimum, maximum and average VaR calculations are estimated only for BCP Stand-alone’s trading book. The reason for this is that, although there is a daily VaR calculation for all subsidiaries with trading book positions, the entire Group is consolidated once a month in order to calculate a VaR for reporting purposes and to monitor the economic capital limit. Therefore, since there is not a sufficient sample for the Group, minimum, maximum and average VaR are calculated only for the BCP Stand-alone subsidiary. Nonetheless, the Company believes it is relevant information considering that BCP Stand-alone’s trading risk is close to the total trading risk of the Group’s portfolio.
For the years ending on December 31, 2023, 2024 and 2025, the BCP Stand-alone’s VaR statistics were as follows:
| | | | | | | | | | | | | | | | | | | | |
| | 2023 | | 2024 | | 2025 |
| | in thousands of Soles |
| Average daily | | 23,157 | | 35,938 | | 34,519 |
| Highest | | 32,435 | | 53,397 | | 52,491 |
| Lowest | | 16,463 | | 24,267 | | 18,648 |
Backtesting
Backtesting is performed on the trading book to verify the predictive power of the VaR calculations. Backtesting compares results of the positions considered for the calculation of VaR and the calculation of the VaR from the previous day. Backtesting exceptions occur when real losses exceed the estimated VaR for the previous day. In order for a backtesting analysis to be considered valid, it should be based on a minimum of 252 observations. Every month, backtesting exceptions are analyzed and reports are prepared to explain the results. These reports are presented to the Treasury and ALM Risk Committee and our Senior Officers. Backtesting is estimated only for BCP Stand-alone’s trading book, since it should be based on a minimum of 252 observations and the Group’s VaR is consolidated only once a month for reporting purposes and to monitor the Group’s economic capital limit.
VaR Backtesting – VaR (1-Day, 99% in millions of Soles) – 2025:
The backtesting analysis uses the Kupiec “proportion of failures” test to determine if the number of exceptions is statistically different from the one expected by the VaR confidence level. Since the test uses the last 252 observations and a 99% VaR confidence level, the model will indicate an underestimation of the probability of large losses from the sixth exception, unless a fitting factor is applied to the VaR to correct the model underestimation.
During 2025, BCP Stand-alone did not record any backtesting exceptions. According to the selected test, we believe that the VaR model is statistically correct.
Stress test
A stress test is used to calculate the maximum loss that the Group incurs in light of daily shocks to the market risk factors from March 18, 2008, until the effective date of the stress test. The maximum loss is considered the outcome for the stress test.
The methodology for the stress test assumes a certain “holding period” until positions can be closed (1 - 10 days). The time period used to calculate the losses is one day; however, the final figures are amplified to a 10-day time period, and the final calculation is determined by multiplying the one-day losses times by the square root of 10. This adjustment will be exact only if the changes in the portfolio in the following days follow a normal distribution that is identical and independent; otherwise, the worst loss of the ten-day period will be an approximation.
The results of our stress test as of December 31, 2023, 2024, 2025, by risk type, were as follows:
| | | | | | | | | | | | | | | | | |
| 2023 | | 2024 | | 2025 |
| in thousands of Soles |
| Interest rate risk | 86,438 | | 215,448 | | 264,544 |
| Price risk | 6,558 | | 7,494 | | 39,022 |
| Volatility risk (1) | 38 | | 3,216 | | 2,678 |
| Diversification effect | (6,569) | | (10,608) | | (41,419) |
| Consolidated VaR by risk type | 86,465 | | 215,550 | | 264,825 |
(1)Volatility risk is the potential loss that result from fluctuations in option implied volatilities
Given the possibility of any scenario of local or international uncertainty, continuous evaluations of stress test scenarios were carried out in order to anticipate potential losses for the Group and generate action plans to mitigate losses. Additionally, we reviewed the current models and methodologies carried out to ensure that volatility was included in the market risk indicators and valuations of the instruments.
Banking Book
The management of risks associated with long-term and structural positions is called ALM. Non-trading portfolios, which comprise the banking book, are exposed to different sensitivities that can deteriorate the value of the Group’s assets relative to its liabilities and hence can reduce the Group’s net worth. Management of the banking book includes management of interest rates and the analysis of the repricing GAP.
Interest Rate Risk
The ALM-related interest rate risk arises from eventual changes in interest rates that may adversely affect the expected gains (risk gains) or market value of financial assets and liabilities reported on the statement of financial position (net economic value). The Group assumes the exposure to the interest rate risk that may affect their fair value as well as the cash flow risk of future assets and liabilities.
The Risk Committee sets the guidelines regarding the level of unmatched repricing of interest rates that can be tolerated, which is periodically monitored by our ALCO monthly.
Corporate policies include guidelines for the management of the Group’s exposure to the interest rate risk. These guidelines are implemented considering the features of each segment of business in which the Group entities operate.
In this regard, Group companies that are exposed to the interest rate risk are those in which earnings are based on interest, such as credits, investments and technical reserves. Interest rate risk management at BCP Stand-alone, BCP Bolivia, Mibanco, ASB, Grupo Pacífico and Mibanco Colombia is carried out by performing a repricing gap analysis, sensitivity analysis of the financial margin (EAR) and sensitivity analysis of the net economic value (EVE). These calculations consider different rate shocks in stress scenarios.
Repricing Gap- Analysis
Repricing gap analysis identifies the term structure of interest rate mismatches within the Group’s balance and out of balance assets and liabilities. Different time bucket schemes may be used in the report. Through this analysis, Management can identify the time period in which interest rate variations may have potential impacts.
The tables below provide information about our financial instruments that are sensitive to interest rates, including deposits, bonds and other obligations, and summarize our exposure to interest rate risks as of December 31, 2023, 2024 and 2025. It includes the Group’s financial instruments at carrying amounts, categorized into columns based on the earlier of their contractual repricing date and maturity/call date. The products are distributed according to their contractual behavior or distribution assumptions (for those without contractual maturity). In addition, some credit products prepayment assumptions are considered.
| | | | | | | | | | | | | | | | | | | | | | | | | | | | | | | | | | | | | | | | | |
| As of December 31, 2023 |
| Up to 1 | | 1 to 3 | | 3 to 12 | | 1 to 5 | | More than 5 | | Non-interest | | Total |
| month | | months | | Months | | years | | years | | bearing | | |
| in thousands of Soles |
| Assets | | | | | | | | | | | | | |
Cash, due from banks, receivables from reverse repurchase agreements and security borrowing | 13,900,784 | | | 1,707,822 | | | 3,050,481 | | | 8,674,709 | | | 273,214 | | | 7,734,585 | | | 35,341,595 | |
| Investments | 1,331,553 | | | 4,489,604 | | | 9,475,564 | | | 12,827,007 | | | 18,773,061 | | | 336,078 | | | 47,232,867 | |
| Loans, net | 19,650,760 | | | 16,975,402 | | | 38,874,328 | | | 46,963,496 | | | 14,420,760 | | | (186,611) | | | 136,698,135 | |
Financial assets designated at fair value through profit and loss | - | | | - | | | - | | | - | | | - | | | 810,932 | | | 810,932 | |
Reinsurance and insurance contract assets | 872,046 | | | - | | | - | | | - | | | - | | | - | | | 872,046 | |
| Other assets | 143,214 | | | 7,053 | | | 31,753 | | | - | | | - | | | 2,381,135 | | | 2,563,155 | |
| Total assets | 35,898,357 | | | 23,179,881 | | | 51,432,126 | | | 68,465,212 | | | 33,467,035 | | | 11,076,119 | | | 223,518,730 | |
| Liabilities | | | | | | | | | | | | | |
| Deposits and obligations | 40,740,255 | | | 16,793,946 | | | 22,762,047 | | | 57,611,088 | | | 8,418,281 | | | 1,379,377 | | | 147,704,994 | |
Payables from repurchase agreements, security lending, due to banks and correspondents | 5,987,961 | | | 6,344,769 | | | 3,477,433 | | | 3,238,356 | | | 3,026,066 | | | 372,523 | | | 22,447,108 | |
Financial Liabilities designated at fair value through profit or loss | - | | | - | | | - | | | - | | | - | | | 641,915 | | | 641,915 | |
Insurance and reinsurance contract liability | 116,515 | | | 178,525 | | | 496,768 | | | 1,862,006 | | | 6,822,694 | | | 2,841,625 | | | 12,318,133 | |
| Bonds and notes issued | 81,635 | | | 94,831 | | | 5,711,424 | | | 7,944,189 | | | 603,511 | | | 159,195 | | | 14,594,785 | |
| Other liabilities | 497,682 | | | - | | | 2,046 | | | - | | | - | | | 4,546,082 | | | 5,045,810 | |
| Equity | - | | | - | | | - | | | - | | | - | | | 33,107,065 | | | 33,107,065 | |
| Total liabilities and equity | 47,424,048 | | | 23,412,071 | | | 32,449,718 | | | 70,655,639 | | | 18,870,552 | | | 43,047,782 | | | 235,859,810 | |
| Off-Balance sheet items | | | | | | | | | | | | | |
| Derivatives assets | 72,943 | | | - | | | 676,380 | | | - | | | - | | | - | | | 749,323 | |
| Derivatives liabilities | 630,109 | | | 401,730 | | | 54,849 | | | 1,936,331 | | | - | | | - | | | 3,023,019 | |
| Total Off-Balance Sheet items | (557,166) | | | (401,730) | | | 621,531 | | | (1,936,331) | | | - | | | - | | | (2,273,696) | |
| Marginal gap | (12,082,857) | | | (633,920) | | | 19,603,939 | | | (4,126,758) | | | 14,596,483 | | | (31,971,663) | | | (14,614,776) | |
| Accumulated gap | (12,082,857) | | | (12,716,777) | | | 6,887,162 | | | 2,760,404 | | | 17,356,887 | | | (14,614,776) | | | - | |
(1)Other assets and other liabilities only include financial instrument accounts.
| | | | | | | | | | | | | | | | | | | | | | | | | | | | | | | | | | | | | | | | | |
| As of December 31, 2024 |
| Up to 1 | | 1 to 3 | | 3 to 12 | | 1 to 5 | | More than 5 | | Non-interest | | Total |
| month | | months | | Months | | years | | years | | bearing | | |
| in thousands of Soles |
| Assets | | | | | | | | | | | | | |
Cash, due from banks,
receivables from reverse
repurchase agreements and
security borrowing | 35,573,543 | | | 1,085,329 | | | 1,609,783 | | | 2,012,826 | | | 2,342,288 | | | 6,064,604 | | | 48,688,373 | |
| Investments | 1,548,776 | | | 3,604,634 | | | 10,192,970 | | | 12,690,421 | | | 20,926,450 | | | 147,264 | | | 49,110,515 | |
| Loans, net | 19,023,450 | | | 17,337,262 | | | 40,333,482 | | | 46,077,476 | | | 16,239,454 | | | (1,273,828) | | | 137,737,296 | |
Financial assets designated at fair value through profit and loss | - | | | - | | | - | | | - | | | - | | | 932,734 | | | 932,734 | |
Reinsurance and insurance contract assets | 841,170 | | | - | | | - | | | - | | | - | | | - | | | 841,170 | |
| Other assets (1) | 110,454 | | | - | | | - | | | - | | | 74,073 | | | 3,675,254 | | | 3,859,781 | |
| Total assets | 57,097,393 | | | 22,027,225 | | | 52,136,235 | | | 60,780,723 | | | 39,582,265 | | | 9,546,028 | | | 241,169,869 | |
| Liabilities | | | | | | | | | | | | | |
| Deposits and obligations | 30,965,685 | | | 20,248,915 | | | 35,585,502 | | | 47,713,442 | | | 26,875,898 | | | 452,624 | | | 161,842,066 | |
Payables from repurchase agreements, security lending, due to banks and correspondents | 3,371,128 | | | 6,893,979 | | | 4,410,854 | | | 1,749,262 | | | 3,074,502 | | | 315,370 | | | 19,815,095 | |
Financial Liabilities designated at fair value through profit or loss | - | | | - | | | - | | | - | | | - | | | 151,485 | | | 151,485 | |
Insurance and reinsurance contract liability | 121,965 | | | 189,997 | | | 582,662 | | | 2,149,411 | | | 7,271,617 | | | 3,106,633 | | | 13,422,285 | |
| Bonds and notes issued | 2,913,005 | | | 2,108,291 | | | 3,977,975 | | | 5,284,838 | | | 2,787,909 | | | 196,425 | | | 17,268,443 | |
| Other liabilities (1) | 442,572 | | | - | | | - | | | 4 | | | 101,587 | | | 5,220,609 | | | 5,764,772 | |
| Equity | - | | | - | | | - | | | - | | | - | | | 34,977,234 | | | 34,977,234 | |
| Total liabilities and equity | 37,814,355 | | | 29,441,182 | | | 44,556,993 | | | 56,896,957 | | | 40,111,513 | | | 44,420,380 | | | 253,241,380 | |
| Off-Balance sheet items | | | | | | | | | | | | | |
| Derivatives assets | 865,949 | | | 508,140 | | | 592,591 | | | 564,599 | | | - | | | - | | | 2,531,279 | |
| Derivatives liabilities | 1,382,049 | | | 112,920 | | | 354,289 | | | 658,699 | | | - | | | - | | | 2,507,957 | |
| Total Off-Balance Sheet items | (516,100) | | | 395,220 | | | 238,302 | | | (94,100) | | | - | | | - | | | 23,322 | |
| Marginal gap | 18,766,938 | | | (7,018,737) | | | 7,817,544 | | | 3,789,666 | | | (529,248) | | | (34,874,352) | | | (12,048,189) | |
| Accumulated gap | 18,766,938 | | | 11,748,201 | | | 19,565,745 | | | 23,355,411 | | | 22,826,163 | | | (12,048,189) | | | - | |
(1) Other assets and other liabilities only include financial instrument accounts.
| | | | | | | | | | | | | | | | | | | | | | | | | | | | | | | | | | | | | | | | | |
| As of December 31, 2025 |
| Up to 1 | | 1 to 3 | | 3 to 12 | | 1 to 5 | | More than 5 | | Non-interest | | Total |
| month | | months | | Months | | years | | years | | bearing | | |
| in thousands of Soles |
| Assets | | | | | | | | | | | | | |
Cash, due from banks, receivables from reverse repurchase agreements and security borrowing | 37,746,584 | | | 759,032 | | | 1,095,107 | | | 2,167,637 | | | 2,882,800 | | | 6,570,497 | | | 51,221,657 | |
| Investments | 2,206,670 | | | 4,454,362 | | | 7,626,855 | | | 8,288,755 | | | 25,180,743 | | | 90,321 | | | 47,847,706 | |
| Loans, net | 21,146,870 | | | 18,801,001 | | | 44,294,644 | | | 45,817,210 | | | 13,917,135 | | | (1,661,856) | | | 142,315,004 | |
Financial assets designated at fair value through profit and loss | - | | | - | | | - | | | - | | | - | | | 992,429 | | | 992,429 | |
Reinsurance and insurance contract assets | 708,560 | | | - | | | - | | | - | | | - | | | - | | | 708,560 | |
| Other assets (1) | 544,074 | | | 133,545 | | | 1,332 | | | - | | | 72,840 | | | 4,708,147 | | | 5,459,938 | |
| Total assets | 62,352,758 | | | 24,147,940 | | | 53,017,938 | | | 56,273,602 | | | 42,053,518 | | | 10,699,538 | | | 248,545,294 | |
| Liabilities | | | | | | | | | | | | | |
| Deposits and obligations | 26,910,364 | | | 22,259,382 | | | 28,940,310 | | | 52,514,477 | | | 39,448,884 | | | 328,216 | | | 170,401,633 | |
Payables from repurchase agreements, security lending, due to banks and correspondents | 6,438,412 | | | 5,628,624 | | | 1,145,888 | | | 2,654,255 | | | 2,894,222 | | | 157,624 | | | 18,919,025 | |
Financial Liabilities designated at fair value through profit or loss | - | | | - | | | - | | | - | | | - | | | 1,055,893 | | | 1,055,893 | |
Insurance and reinsurance contract liability | 136,545 | | | 210,611 | | | 599,093 | | | 2,460,841 | | | 7,610,781 | | | 3,246,284 | | | 14,264,155 | |
| Bonds and notes issued | 226,853 | | | 423,133 | | | 2,866,745 | | | 7,532,602 | | | 2,707,559 | | | 268,643 | | | 14,025,535 | |
| Other liabilities (1) | 1,219,594 | | | 25,236 | | | 10,043 | | | 12 | | | 129,525 | | | 4,678,502 | | | 6,062,912 | |
| Equity | - | | | - | | | - | | | - | | | - | | | 39,096,109 | | | 39,096,109 | |
| Total liabilities and equity | 34,931,768 | | | 28,546,986 | | | 33,562,079 | | | 65,162,187 | | | 52,790,971 | | | 48,831,271 | | | 263,825,262 | |
| Off-Balance sheet items | | | | | | | | | | | | | |
| Derivatives assets | - | | | 353,115 | | | 823,935 | | | - | | | - | | | - | | | 1,177,050 | |
| Derivatives liabilities | 504,450 | | | - | | | 184,965 | | | 502,585 | | | - | | | - | | | 1,192,000 | |
| Total Off-Balance Sheet items | (504,450) | | | 353,115 | | | 638,970 | | | (502,585) | | | - | | | - | | | (14,950) | |
| Marginal gap | 26,916,540 | | | (4,045,931) | | | 20,094,829 | | | (9,391,170) | | | (10,737,453) | | | (38,131,733) | | | (15,294,918) | |
| Accumulated gap | 26,916,540 | | | 22,870,609 | | | 42,965,438 | | | 33,574,268 | | | 22,836,815 | | | (15,294,918) | | | - | |
(1)Other assets and other liabilities only include financial instruments accounts.
Investments and derivatives classified by our management as held for trading are not considered in our repricing gap analysis because these instruments are included in the trading book. Instead of repricing gap analysis, we use VaR methodology to assess risk arising from these instruments. Other assets and other liabilities include only financial accounts.
Sensitivity to Changes in Interest Rates
The sensitivity analysis of a reasonable possible change in interest rates on the ALM book comprises an assessment of the sensibility of the financial margin, which seeks to measure the potential changes in interest accruals over a period of time due to the expected parallel movement of the interest rate curves, as well as the sensitivity of the net economic value, which is a long-term metric measured as the difference between the economic value of net assets and liabilities before and after a variation in interest rates.
The sensitivity of the financial margin is the effect of the assumed changes in interest rates on the net interest income before income tax for one year and is based on non-trading financial assets and financial liabilities held on December 31, 2022, 2023 and 2024, including the effect of derivative instruments. The sensitivity of net economic value is calculated by reassessing the financial assets and liabilities that comprise the banking book, including the effect of any associated hedge and derivative instruments designated as a cash flow hedge. In managing interest rate risk, no distinction
is made by accounting category of the investments comprising the banking book, including instruments classified as fair value through other comprehensive income and amortized cost investments.
The tables below summarize our exposure to interest rate changes as of December 31, 2023, 2024 and 2025:
| | | | | | | | | | | | | | | | | | | | | | | | | | | | | | | | | | | |
| As of December 31, 2023 |
| Currency | Interest rates
changes in | | Sensitivity of | | Sensitivity of |
| basis points | | net profit | | economic value |
| | | | | in thousands of Soles |
| Soles | +/- | | 50 | | | +/- | | 15,052 | | | -/+ | | 511,851 | |
| Soles | +/- | | 75 | | | +/- | | 22,578 | | | -/+ | | 767,776 | |
| Soles | +/- | | 100 | | | +/- | | 30,104 | | | -/+ | | 1,023,702 | |
| Soles | +/- | | 150 | | | +/- | | 45,156 | | | -/+ | | 1,535,553 | |
| US Dollar | +/- | | 50 | | | +/- | | 48,060 | | | +/- | | 119,342 | |
| US Dollar | +/- | | 75 | | | +/- | | 72,090 | | | +/- | | 179,013 | |
| US Dollar | +/- | | 100 | | | +/- | | 96,120 | | | +/- | | 238,684 | |
| US Dollar | +/- | | 150 | | | +/- | | 144,180 | | | +/- | | 358,026 | |
| | | | | | | | | | | | | | | | | | | | | | | | | | | | | | | | | | | |
| As of December 31, 2024 |
| Currency | Interest rates
changes in | | Sensitivity of | | Sensitivity of |
| basis points | | net profit | | economic value |
| | | | | in thousands of Soles |
| Soles | +/- | | 50 | | | +/- | | 30,754 | | | -/+ | | 425,783 | |
| Soles | +/- | | 75 | | | +/- | | 46,132 | | | -/+ | | 638,675 | |
| Soles | +/- | | 100 | | | +/- | | 61,509 | | | -/+ | | 851,567 | |
| Soles | +/- | | 150 | | | +/- | | 92,263 | | | -/+ | | 1,277,350 | |
| US Dollar | +/- | | 50 | | | +/- | | 134,532 | | | +/- | | 191,211 | |
| US Dollar | +/- | | 75 | | | +/- | | 201,798 | | | +/- | | 286,816 | |
| US Dollar | +/- | | 100 | | | +/- | | 269,064 | | | +/- | | 382,421 | |
| US Dollar | +/- | | 150 | | | +/- | | 403,595 | | | +/- | | 573,632 | |
| | | | | | | | | | | | | | | | | | | | | | | | | | | | | | | | | | | |
| As of December 31, 2025 |
| Currency | Interest rates
changes in | | Sensitivity of | | Sensitivity of |
| basis points | | net profit | | economic value |
| | | | | in thousands of Soles |
| Soles | +/- | | 50 | | | +/- | | 51,429 | | | -/+ | | 297,149 | |
| Soles | +/- | | 75 | | | +/- | | 77,143 | | | -/+ | | 445,724 | |
| Soles | +/- | | 100 | | | +/- | | 102,857 | | | -/+ | | 594,298 | |
| Soles | +/- | | 150 | | | +/- | | 154,286 | | | -/+ | | 891,447 | |
| US Dollar | +/- | | 50 | | | +/- | | 173,047 | | | +/- | | 338,248 | |
| US Dollar | +/- | | 75 | | | +/- | | 259,571 | | | +/- | | 507,372 | |
| US Dollar | +/- | | 100 | | | +/- | | 346,095 | | | +/- | | 676,496 | |
| US Dollar | +/- | | 150 | | | +/- | | 519,142 | | | +/- | | 1,014,745 | |
The interest rate sensitivities set out in the tables above are illustrative only and are based on simplified scenarios. These figures represent the effect of the preform movements in the net interest income based on the projected yield curve scenarios and the Group’s current interest rate risk profile. This effect, however, does not incorporate actions that would be
taken by Management to mitigate the impact of this interest rate risk. In addition, the Group proactively seeks to change the interest rate risk profile to minimize losses and optimize net revenues. The projections above also assume that interest rate of all maturities move by the same amount and, therefore, do not reflect the potential impact on net interest income of some rates changing while others remain unchanged.
As of December 31, 2023, 2024 and 2025, investments in equity securities and funds that are non-trading, recorded at fair value through other comprehensive income and at fair value through profit or loss, respectively, are not considered as comprising investment securities for interest rate sensitivity calculation purposes; however, 10%, 25% and 30% changes in market prices are conducted to these price-sensitivity securities.
The market price sensitivity tests as of December 31, 2023, 2024 and 2025 are presented below:
| | | | | | | | | | | | | | | | | | | | | | | | | | |
Equity at fair value through
other comprehensive income | | | | 2023 | | 2024 | | 2025 |
| Changes in market prices % | | in thousands of Soles |
| Equity securities | | +/- 10 | | 33,480 | | | 14,726 | | | 9,032 | |
| Equity securities | | +/- 25 | | 83,700 | | | 36,816 | | | 22,581 | |
| Equity securities | | +/- 30 | | 100,440 | | | 44,179 | | | 27,097 | |
| | | | | | | | | | | | | | | | | | | | | | | | | | |
| Funds at fair value through profit or loss | | | | 2023 | | 2024 | | 2025 |
| Changes in market prices % | | in thousands of Soles |
| Mutual funds | | +/- 10 | | 108,747 | | | 62,216 | | | 70,494 | |
| Mutual funds | | +/- 25 | | 271,867 | | | 155,539 | | | 176,234 | |
| Mutual funds | | +/- 30 | | 326,241 | | | 186,647 | | | 211,481 | |
| Restricted mutual funds | | +/- 10 | | 33,416 | | | 31,820 | | | 33,616 | |
| Restricted mutual funds | | +/- 25 | | 83,541 | | | 79,549 | | | 84,040 | |
| Restricted mutual funds | | +/- 30 | | 100,249 | | | 95,459 | | | 100,848 | |
| Fund of Liquid Assets Requirement (RAL) | | +/- 10 | | 14,541 | | | 43,250 | | | 12,539 | |
| Fund of Liquid Assets Requirement (RAL) | | +/- 25 | | 36,354 | | | 108,126 | | | 31,348 | |
| Fund of Liquid Assets Requirement (RAL) | | +/- 30 | | 43,624 | | | 129,751 | | | 37,618 | |
| Investment Funds | | +/- 10 | | 118,071 | | | 140,196 | | | 149,817 | |
| Investment Funds | | +/- 25 | | 295,178 | | | 350,489 | | | 374,542 | |
| Investment Funds | | +/- 30 | | 354,214 | | | 420,587 | | | 449,451 | |
| Hedge Funds | | +/- 10 | | 29 | | | 32 | | | - | |
| Hedge Funds | | +/- 25 | | 73 | | | 81 | | | - | |
| Hedge Funds | | +/- 30 | | 87 | | | 97 | | | - | |
| Exchange Traded Funds | | +/- 10 | | 2,958 | | | 3,931 | | | 3,410 | |
| Exchange Traded Funds | | +/- 25 | | 7,396 | | | 9,827 | | | 8,524 | |
| Exchange Traded Funds | | +/- 30 | | 8,875 | | | 11,793 | | | 10,229 | |
Foreign Currency Exchange Rate Risk
The Group is exposed to fluctuations in foreign currency exchange rates, which impact net open monetary positions and equity positions in a different currency than the group's functional currency.
The group's monetary position is made up of the net open position of monetary assets, monetary liabilities and off-balance sheet items expressed in foreign currency for which the entity itself assumes the risk; as well as the equity position generated by the investment in the group's subsidiaries whose functional currency is different from soles. In the first case, any appreciation/depreciation of the foreign currency would affect the consolidated income statement, on the contrary, in the case of the equity position, any appreciation/depreciation of the foreign currency will be recognized in other comprehensive income.
The Group manages foreign currency exchange risk, which affects the income statement, by monitoring and controlling currency positions exposed to movements in exchange rates. The market risk units of each subsidiary establish limits for said positions, which are approved by their own committees, and monitor and follow up the limits considering their foreign exchange trading positions, their most structural foreign exchange positions, as well as their sensitivities. Additionally, there is a monetary position limit at the Credicorp level, which is monitored and reported to the Group's Risk Committee.
On the other hand, the Group manages foreign currency exchange risk whose fluctuation is recognized in other comprehensive income, monitoring and controlling equity positions and their sensitivities, which are reported to the Group's Risk Committee.
Net foreign exchange gains/losses recognized in the consolidated statement of income are disclosed in the following items:
•Net gain on foreign exchange transactions
•Net gain on derivatives held for trading
•Net exchange difference result
As of December 31, 2025, the foreign currency in which the Group has the greatest exposure is the U.S. Dollar. The free market-exchange rate for purchase and sale transactions of each U.S. Dollar as of December 31, 2025 was S/3.363 (S/3.764 as of December 31, 2024).
Foreign currency transactions are made at market exchange rates of the countries where Credicorp’s Subsidiaries are established. As of December 31, 2023, 2024, and 2025, the net open monetary position with effect on results and the equity position of the group was as follows:
| | | | | | | | | | | | | | |
| 2023 | | U.S. Dollar | | Other currencies |
| | | | |
| | in thousands of Soles |
| Total monetary assets | | 77,387,709 | | | 495,553 | |
| Total monetary liabilities | | (79,779,686) | | | (102,500) | |
| | (2,391,977) | | | 393,053 | |
| Total position in currency derivatives | | 2,622,188 | | | (369,458) | |
| Net monetary position with effect on consolidated statement of income | | 230,211 | | | 23,595 | |
| Net monetary position with effect on equity | | 904,434 | | | 2,204,984 | |
| Net monetary position | | 1,134,645 | | | 2,228,579 | |
| | | | | | | | | | | | | | |
| 2024 | | U.S. Dollar | | Other currencies |
| | | | |
| | in thousands of Soles |
| Total monetary assets | | 93,696,321 | | | 435,107 | |
| Total monetary liabilities | | (86,859,546) | | | (104,858) | |
| | 6,836,775 | | | 330,249 | |
| Total position in currency derivatives | | (6,142,485) | | | 144,889 | |
| Net monetary position with effect on consolidated statement of income | | 694,290 | | | 475,138 | |
| Net monetary position with effect on equity | | 754,769 | | | 2,291,428 | |
| Net monetary position | | 1,449,059 | | | 2,766,566 | |
| | | | | | | | | | | | | | |
| 2025 | | U.S. Dollar | | Other currencies |
| | | | |
| | in thousands of Soles |
| Total monetary assets | | 92,302,409 | | | 403,672 | |
| Total monetary liabilities | | (82,319,334) | | | (78,107) | |
| | 9,983,075 | | | 325,565 | |
| Total position in currency derivatives | | (9,163,066) | | | 174,608 | |
| Net monetary position with effect on consolidated statement of income | | 820,009 | | | 500,173 | |
| Net monetary position with effect on equity | | 1,157,602 | | | 2,355,753 | |
| Net monetary position | | 1,977,611 | | | 2,855,926 | |
As of December 31, 2023, 2024 and 2025, the monetary position with effect on equity in other currencies is mainly made up of the equity of subsidiaries in Bolivianos for S/860.3 million, S/962.7 million and S/799.2 million, respectively; in Colombian Pesos for S/961.9 million, S/901.3 million and S/1,031.4 million, respectively and in Chilean Pesos for S/380.9 million, S/425.7 million and S/522.5 million, respectively.
Starting in March 2025, Management has decided to use, for the conversion of its investments in companies incorporated in Bolivia, the exchange rate applied by financial institutions, as published on March 14, 2025 in Circular No.857/2025 issued by the Financial System Supervisory Authority of Bolivia (ASFI), as this determines the value at which Bolivian financial institutions can buy/sell U.S. Dollars. This update has resulted in a decrease in the Group’s consolidated statement of financial position of S/2,315.2 million in assets, S/2,193.8 million in liabilities, and S/121.5 million in equity as of December 31, 2025.
The following tables show the sensitivity analysis of the main currencies to which the Group is exposed and which affect the consolidated income statement and other comprehensive income as of December 31, 2023, 2024 and 2025.
The analysis determines the effect of a reasonably possible variation of the exchange rate against the Sol for each of the currencies independently, considering all other variables constant. A negative amount shows a potential net reduction in the consolidated income statement and other comprehensive income, while a positive amount reflects a potential increase.
The sensitivity analysis of the foreign currency position with an effect on the consolidated income, with the U.S. Dollar as the main currency of exposure. This analysis is shown as of December 31, 2023, 2024 and 2025:
| | | | | | | | | | | | | | | | | | | | | | | | | | |
| Currency rate sensibility | | Change in Currency Rates | | 2023 | | 2024 | | 2025 |
| | % | | in thousands of Soles |
| Depreciation | | | | | | | | |
| Sol in relation to US Dollar | | 5 | | | 10,962 | | | 33,061 | | | 39,048 | |
| Sol in relation to US Dollar | | 10 | | | 20,928 | | | 63,117 | | | 74,546 | |
| Appreciation | | | | | | | | |
| Sol in relation to US Dollar | | 5 | | | (12,116) | | | (36,542) | | | (43,158) | |
| Sol in relation to US Dollar | | 10 | | | (25,579) | | | (77,143) | | | (91,112) | |
The following is the sensitivity analysis of the foreign exchange position with effect in other comprehensive income, with the U.S. Dollar, the Bolivian Peso, the Colombian Peso and the Chilean Peso being the main currencies of exposure. This analysis is shown as of December 31, 2023, 2024 and 2025:
| | | | | | | | | | | | | | | | | | | | | | | | | | |
| Currency rate sensibility | | Change in Currency Rates | | 2023 | | 2024 | | 2025 |
| | % | | in thousands of Soles |
| Depreciation | | | | | | | | |
| Sol in relation to US Dollar | | 5 | | | 43,377 | | | 35,941 | | | 55,124 | |
| Sol in relation to US Dollar | | 10 | | | 82,812 | | | 68,615 | | | 105,237 | |
| Appreciation | | | | | | | | |
| Sol in relation to US Dollar | | 5 | | | (47,944) | | | (39,725) | | | (60,926) | |
| Sol in relation to US Dollar | | 10 | | | (101,214) | | | (83,863) | | | (128,622) | |
| | | | | | | | | | | | | | | | | | | | | | | | | | |
| Currency rate sensibility | | Change in Currency Rates | | 2023 | | 2024 | | 2025 |
| | % | | in thousands of Soles |
| Depreciation | | | | | | | | |
| Sol in relation to Boliviano | | 5 | | | 40,969 | | | 45,842 | | | 38,056 | |
| Sol in relation to Boliviano | | 10 | | | 78,214 | | | 87,516 | | | 72,652 | |
| Appreciation | | | | | | | | |
| Sol in relation to Boliviano | | 5 | | | (45,282) | | | (50,667) | | | (42,062) | |
| Sol in relation to Boliviano | | 10 | | | (95,595) | | | (106,964) | | | (88,797) | |
| | | | | | | | | | | | | | | | | | | | | | | | | | |
| Currency rate sensibility | | Change in Currency Rates | | 2023 | | 2024 | | 2025 |
| | % | | in thousands of Soles |
| Depreciation | | | | | | | | |
| Sol in relation to Colombian Peso | | 5 | | | 45,804 | | | 42,919 | | | 49,115 | |
| Sol in relation to Colombian Peso | | 10 | | | 87,444 | | | 81,936 | | | 93,765 | |
| Appreciation | | | | | | | | |
| Sol in relation to Colombian Peso | | 5 | | | (50,626) | | | (47,437) | | | (54,285) | |
| Sol in relation to Colombian Peso | | 10 | | | (106,876) | | | (100,144) | | | (114,602) | |
| | | | | | | | | | | | | | | | | | | | | | | | | | |
| Currency rate sensibility | | Change in Currency Rates | | 2023 | | 2024 | | 2025 |
| | % | | in thousands of Soles |
| Depreciation | | | | | | | | |
| Sol in relation to Chilean Peso | | 5 | | | 18,136 | | | 20,272 | | | 24,882 | |
| Sol in relation to Chilean Peso | | 10 | | | 34,624 | | | 38,702 | | | 47,501 | |
| Appreciation | | | | | | | | |
| Sol in relation to Chilean Peso | | 5 | | | (20,046) | | | (22,406) | | | (27,501) | |
| Sol in relation to Chilean Peso | | 10 | | | (42,318) | | | (47,302) | | | (58,057) | |
Liquidity Risk
Liquidity risk is the risk that the Group is unable to meet its short-term payment obligations associated with its financial liabilities when they are due and to replace funds when they are withdrawn. In this sense, a company that is facing a liquidity crisis would be failing to comply with the obligations to pay depositors and with commitments to lend or satisfy other operational cash needs.
For further information about liquidity risk management, please refer to ITEM 5. OPERATING AND FINANCIAL REVIEW AND PROSPECTS – 5.B Liquidity and Capital Resources - (3) Liquidity Risk.
Crypto Risk
The Group does not maintain direct or indirect exposure to cryptoassets in its balance sheet, nor does it engage in proprietary trading, investment, custody or issuance of cryptoassets. Accordingly, the Group is not exposed to price volatility, liquidity risk, or valuation risk associated with cryptoassets.
d)Model Risk
Model risk is defined as the probability of loss resulting from decisions (credit, market, among others) based on the use of poorly designed and/or poorly implemented models. The main sources of this risk are deficiencies in data, errors in the model (from design to implementation) or wrongful use of the model.
The Group uses models for different purposes, such as credit admission, internal capital calculation, monitoring behavior of payment, determination of loan reserves, market risk and liquidity. Model risk management is structured around a set of processes known as the life cycle of the model. The phases of the life cycle of the model in the Group are: identification, planning, development, internal validation, approval, implementation and use, and monitoring and control.
Management of model risk is proportional to the importance of each model. To this end, a tiered approach is used to synthesize the level of importance of a model, from which the level of model management is then determined.
e)Risk in Insurance Activity and Operational Risk
Both our operational risk, which measures the probability of loss of the business operations, and our insurance activity risk, which measures the real cost of claims and benefit payments and the timing thereof, are important for the Group’s risk management. How we identify, evaluate, measure, treat and control operational risk and insurance activity risk is defined and explained in the following notes to our audited consolidated financial statements: 30.5 Operational risk and 30.9 Risk of the insurance activity.
The main risk faced by the Group related to insurance contracts is that the real cost of claims and payments, or the opportunity cost of claims and payments, may differ from what was expected. The magnitude of this risk is influenced by the frequency of claims, the severity of claims, the real benefits paid and the development of long-term claims. Therefore, the Group seeks to ensure that sufficient reserves are available to cover these obligations. The Group constantly monitors the adequacy of its technical reserves by taking appropriate measures against possible adverse results. It also contracts with independent, recognized actuarial services firms to conduct periodic reviews regarding the sufficiency of reserves for the companies that make up the Insurance & Pensions LoB.
ITEM 12.DESCRIPTION OF SECURITIES OTHER THAN EQUITY SECURITIES
Not applicable.
PART II
ITEM 13.DEFAULTS, DIVIDEND ARREARAGES AND DELINQUENCIES
13.AMaterial Defaults
Neither we, nor any of our subsidiaries, have ever defaulted on any of our debt or have ever been forced to reschedule any of our obligations.
13.BDividend Arrearages and Delinquencies
None of our dividends are in arrears, and there has not been any other material delinquency not cured within 30 days relating to any class of preferred stock of our significant subsidiaries. Credicorp Ltd. does not have any preferred stock outstanding.
ITEM 14.MATERIAL MODIFICATIONS TO THE RIGHTS OF SECURITY HOLDERS AND USE OF PROCEEDS
There has not been any modification to the rights of security holders.
ITEM 15.CONTROLS AND PROCEDURES
15.ADisclosure Controls and Procedures
Our management, with the participation of and under the supervision of our principal executive officer and principal financial officer, has evaluated the effectiveness of the design and operation of our disclosure controls and procedures (as defined in Exchange Act Rules 13a-15(e) and 15d-15(e)) as of December 31, 2025. Based on this evaluation, our management, principal executive officer, and principal financial officer have concluded that our disclosure controls and procedures are effective in ensuring that information that we are required to disclose in reports that we file or submit under the Exchange Act is recorded, processed, summarized, and reported within the time periods specified in SEC rules and forms.
15.BManagement’s Annual Report on Internal Control over Financial Reporting
Our Board of Directors and management are responsible for establishing and maintaining adequate internal control over financial reporting. Our framework for internal control over financial reporting is designed to provide reasonable assurance regarding the reliability of financial reporting and the preparation and fair presentation of published financial statements in accordance with IFRS accounting standards, as issued by the IASB.
Our framework for internal control over financial reporting includes policies and procedures that:
•pertain to the maintenance of records that, in reasonable detail, accurately and fairly reflect transactions and dispositions of assets;
•provide reasonable assurance that transactions are recorded as necessary to permit preparation of financial statements, and our receipts and expenditures are being made only in accordance with authorizations of our management and IFRS; and
•provide reasonable assurance regarding prevention or timely detection of unauthorized acquisition, use, or disposition of our assets that could have a material effect on our financial statements.
Because of inherent limitations, internal controls over financial reporting may not prevent or detect misstatements. Also, projections about the effectiveness of our internal controls are subject to the risk that controls may become inadequate due to changes in conditions or deterioration in compliance with policies or procedures.
Our management assessed the effectiveness of our internal control over financial reporting as of December 31, 2025, based on the framework set forth by the COSO in Internal Control-Integrated Framework (2013 Framework). Based on this assessment, our management identified no material weakness in our internal control over financial reporting and believed that, as of December 31, 2025, our internal control over financial reporting was effective, which means that each of the relevant components and seventeen principles are present and functioning and the five components operate together in an integrated manner, as required by COSO.
Our assessment of, and conclusion on the effectiveness of internal control over financial reporting did not include the internal controls of Pacifico S.A. Entidad Prestadora de Salud and subsidiaries, which is included in the 2025 consolidated financial statements of the Company and constituted 0.75% and 2.88% of total and net assets, respectively, as of December 31, 2025 and (0.52%) of the net result before income tax for the year then ended.
The effectiveness of the Company’s internal control over financial reporting as of December 31, 2025, has been audited by Tanaka, Valdivia, Arribas & Asociados Sociedad Civil de Responsabilidad Limitada located in Lima, Peru, an independent registered public accounting firm, and a member of Ernst & Young Global Limited.
15.CAttestation Report of Independent Registered Public Accounting Firm
Report of Independent Registered Public Accounting Firm
To the Shareholders and Board of Directors of Credicorp Ltd.
Opinion on Internal Control Over Financial Reporting
We have audited Credicorp Ltd. and subsidiaries’ internal control over financial reporting as of December 31, 2025, based on criteria established in Internal Control—Integrated Framework issued by the Committee of Sponsoring Organizations of the Treadway Commission (2013 framework) (the COSO criteria). In our opinion, Credicorp Ltd. and subsidiaries (the Company) maintained, in all material respects, effective internal control over financial reporting as of December 31, 2025, based on the COSO criteria.
As indicated in the accompanying Management’s Annual Report on Internal Control over Financial Reporting, management’s assessment of and conclusion on the effectiveness of internal control over financial reporting did not include the internal controls of Pacifico S.A. Entidad Prestadora de Salud and subsidiaries, which is included in the 2025 consolidated financial statements of the Company and constituted 0.75% and 2.88% of total and net assets, respectively, as of December 31, 2025 and (0.52%) of the net result before income tax for the year then ended. Our audit of internal control over financial reporting of the Company also did not include an evaluation of the internal control over financial reporting of Pacifico S.A. Entidad Prestadora de Salud and subsidiaries.
We also have audited, in accordance with the standards of the Public Company Accounting Oversight Board (United States) (PCAOB), the consolidated statements of financial position of the Company as of December 31, 2025 and 2024, the related consolidated statements of income, comprehensive income, changes in equity and cash flows for each of the three years in the period ended December 31, 2025, and the related notes and our report dated April 27, 2026 expressed an unqualified opinion thereon.
Basis for Opinion
The Company’s management is responsible for maintaining effective internal control over financial reporting and for its assessment of the effectiveness of internal control over financial reporting included in the accompanying Management’s Annual Report on Internal Control over Financial Reporting. Our responsibility is to express an opinion on the Company’s internal control over financial reporting based on our audit. We are a public accounting firm registered with the PCAOB and are required to be independent with respect to the Company in accordance with the U.S. federal securities laws and the applicable rules and regulations of the Securities and Exchange Commission and the PCAOB.
We conducted our audit in accordance with the standards of the PCAOB. Those standards require that we plan and perform the audit to obtain reasonable assurance about whether effective internal control over financial reporting was maintained in all material respects.
Our audit included obtaining an understanding of internal control over financial reporting, assessing the risk that a material weakness exists, testing and evaluating the design and operating effectiveness of internal control based on the assessed risk, and performing such other procedures as we considered necessary in the circumstances. We believe that our audit provides a reasonable basis for our opinion.
Definition and Limitations of Internal Control Over Financial Reporting
A company’s internal control over financial reporting is a process designed to provide reasonable assurance regarding the reliability of financial reporting and the preparation of financial statements for external purposes in accordance with generally accepted accounting principles. A company’s internal control over financial reporting includes those policies and procedures that (1) pertain to the maintenance of records that, in reasonable detail, accurately and fairly reflect the transactions and dispositions of the assets of the company; (2) provide reasonable assurance that transactions are recorded as necessary to permit preparation of financial statements in accordance with generally accepted accounting principles, and that receipts and expenditures of the company are being made only in accordance with authorizations of management and directors of the company; and (3) provide reasonable assurance regarding prevention or timely detection of unauthorized acquisition, use, or disposition of the company’s assets that could have a material effect on the financial statements.
Because of its inherent limitations, internal control over financial reporting may not prevent or detect misstatements. Also, projections of any evaluation of effectiveness to future periods are subject to the risk that controls may become inadequate because of changes in conditions, or that the degree of compliance with the policies or procedures may deteriorate.
/s/ Tanaka, Valdivia, Arribas & Asociados Sociedad Civil de Responsabilidad Limitada
A member of Ernst & Young Global Limited
Lima, Peru
April 27, 2026
15.DChanges in Internal Control over Financial Reporting
During the period covered by this Annual Report, no changes were made to our internal control over financial reporting that have materially affected, or are likely to materially affect, our internal control over financial reporting.
ITEM 16A.AUDIT COMMITTEE FINANCIAL EXPERT
At the Annual General Meeting of Shareholders held on March 27, 2023, shareholders elected the members of the Board of Directors of Credicorp as discussed in “ITEM 6. DIRECTORS, SENIOR MANAGEMENT AND EMPLOYEES – 6. A Directors and Senior Management”. Furthermore, our Board of Directors, at its meeting held on April 27, 2023, appointed the following members to the Audit Committee: Ms. Patricia Lizarraga Guthertz (independent, chairwoman of the Audit Committee since June 2020), Ms. Maria Teresa Aranzábal Harreguy (independent, member of the Audit Committee) and Ms. Nuria Aliño Pérez (independent, member of the Audit Committee since April 27, 2023). Mr. Jose Raimundo Morales Dasso, former Chairman of the Audit Committee, has been appointed as Advisor of the Audit Committee.
Ms. Lizarraga, Ms. Aranzábal and Ms. Aliño are “independent” as defined in Rule 10A-3 under the Exchange Act and in Section 303A.02 of the NYSE Listed Company Manual.
Ms. Lizarraga, our Audit Committee Financial Expert as determined by the Board of Directors, is Director of Credicorp Ltd., Banco de Crédito del Perú S.A. and Grupo Crédito S.A. Ms. Lizarraga is an experienced Wall Street executive with over 25 years of experience working in international mergers and acquisitions, capital markets, private equity, and valuation experience. She is the founder and CEO of Hypatia Capital Group and a major shareholder of the family group Grupo del Ande. Through her extensive financial career, Ms. Lizarraga has developed a thorough understanding of generally accepted accounting principles and financial statements, experience in applying such principles in connection with the accounting for estimates, accruals and reserves, experience with internal controls over financial reporting, and a deep understanding of audit committee functions and responsibilities. Ms. Lizarraga’s Board experience includes serving as both President of the Board and Chairman of the Audit Committee of non-profit organizations, as well as serving on the board of a private company. She served as President of the Privatization Committee of Toll Roads of Peru. Ms. Lizarraga received her Bachelor of Arts degree from Yale University and her MBA from Harvard Business School.
The composition of the Audit Committee described above remained unchanged as of December 31, 2025.
See "ITEM 4. INFORMATION ON THE COMPANY - 4. A History and development of the Company – Recent Developments” for updated information about the composition of our Audit Committee as of April 1, 2026.
ITEM 16B.CODE OF ETHICS
We have adopted a code of ethics (Código de Ética) that applies to our Board of Directors and to our CEO, our CFO, and our other principal executive officers, as well as to all of our other employees. The Code is supported by mandatory corporate policies and establishes a principles‑based framework requiring compliance with applicable laws, alignment with Credicorp’s values, and consideration of reputational and stakeholder impacts. Its implementation is reinforced through leadership accountability and integration into key business processes, including customer relationships, supplier
management, information security and corporate governance. Credicorp maintains a confidential whistleblowing system (Alerta GenÉTICA) available to employees and third parties, with protections against retaliation; reported concerns are reviewed and investigated by Compliance and Ethics teams. Violations of the Code may result in termination of employment or applicable sanctions and, where applicable, civil or criminal liability.
In addition, we have adopted a code of ethics for professionals with financial responsibility (Código de Ética Para Profesionales con Responsabilidad Financiera) that applies to employees with financial management responsibilities. Our code of ethics and code of ethics for professionals with financial responsibility are available on the corporate governance section of our web site at https://grupocredicorp.com/ or at https://credicorp.gcs-web.com/corporate-governance/corporate-governance-documents (in English). Credicorp has elected to satisfy the code of ethics filing requirement by posting the code on its website at the address listed above rather than filing it as an exhibit to this Annual Report. During 2025, there have been no amendments, waivers, including implicit waivers, of the codes granted to the CEO, CFO or any other principal executive officers.
ITEM 16C.PRINCIPAL ACCOUNTANT FEES AND SERVICES
Audit Committee Pre-Approval Policies and Procedures
The Audit Committee must approve all the services that the independent external auditor provides as part of its responsibility to supervise the internal auditor’s work. The Audit Committee provides two types of approvals as set forth below:
(1)The Audit Committee grants a “general approval” in advance for services that the independent external auditor may provide. After a general approval is given, further approval from the Audit Committee is required. A general approval is valid for 12 months from the date of approval unless the Audit Committee determines a different period shall apply. The Audit Committee is regularly informed of the services provided through the general approval process.
(2)The Audit Committee also grants “specific approval” on a case-by-case basis for services that do not obtain general approval. All the services that are not granted general approval need specific approval from the Audit Committee before any agreement is signed with the independent external auditor to provide such services. Any service that exceeds approved costs or budgets will need specific approval from the Audit Committee.
The Audit Committee has set a limit on all tax and other fees, which cannot be greater than 35% of total auditor’s fees during a fiscal year. The Audit Committee may change this limit based upon our corporate needs and the complexity of the service provided by the independent external auditor. When considering granting any type of approval, the Audit Committee considers whether the requested services are consistent with the SEC’s rules regarding the independence of the independent external auditor.
As necessary, the Audit Committee supervises the execution of services provided by the independent external auditor. It approves, when necessary, any modification to the terms, conditions, fees, and extent of the audit services. The Audit Committee may give general approval for other audit services where the independent external auditor is in the best position to provide those services. As part of this process, the Audit Committee evaluates the nature and scope of proposed services to determine whether general or specific approval is appropriate. Such services typically include audit services required by regulations, financial audits for our subsidiaries or affiliates, and services associated with the presentation of documents to the SEC or other documents published in connection with the trading of our shares.
The Audit Committee may grant general approval to audit-related services if the committee believes that these services will not negatively affect the integrity of the independent external auditor and are consistent with SEC rules.
The Audit Committee may grant specific approval for other services provided by the independent external auditor as long as they do not impair the independence of the independent external auditor and are permissible under SEC rules.
The Audit Committee designated Tanaka, Valdivia, Arribas & Asociados Sociedad Civil de Responsabilidad Limitada, a member firm of Ernst & Young Global Limited, as Credicorp’s external auditors for fiscal years 2023 to 2027.
The following table sets forth the agreed fees for our independent external auditors, Tanaka, Valdivia, Arribas & Asociados Sociedad Civil de Responsabilidad Limitada for 2024 and 2025 in connection with the audit of our financial
statements, assurance and related services, tax compliance, tax advisory and tax planning services and other services. All services were pre-approved by the audit committee following its corporate policy.
| | | | | | | | | | | | | | |
| Year-end December 31, |
| | 2024 | | 2025 |
| (in thousands of Soles) |
| Audit | | 22,776 | | | 21,263 | |
| Audit Related Fees | | 1,404 | | | 1,141 | |
| Tax | | 2,580 | | | 3,059 | |
| All Other | | 830 | | | 957 | |
| Total | | 27,590 | | | 26,420 | |
Audit Fees
Audit and audit related fees correspond to audit services performed (i) reviewing the consolidated financial statements of Credicorp and its subsidiaries, (ii) establishing the procedures that the independent auditor needs to perform in order to form an opinion about Credicorp’s consolidated financial statements, and (iii) complying with the statutory requirements applicable to Credicorp’s subsidiaries. Audit fees also include the audit work in connection with reviews of interim financial information. During 2025 and 2024, the Audit Committee approved all fees and there were no services approved by the Audit Committee pursuant to paragraph (c)(7)(i)(C) of Rule 2-01 of Regulation S-X.
Audit-Related Fees
Audit-related fees correspond to the total fees billed by Tanaka, Valdivia, Arribas & Asociados Sociedad Civil de Responsabilidad Limitada for services related to the performance of the audit or review of Credicorp’s financial statements and are not reported under “audit fees”. For the years ended December 31, 2024 and 2025, these fees correspond to services related to review of BCP offering memoranda and to issuance of comfort letters for international debt issuances.
Tax Fees
Tax fees relate to tax services which include all services performed by Credicorp’s independent auditor’s tax personnel, except those services specifically related to the review and preparation of Credicorp’s financial statements, and which principally consist of tax compliance and advisory services approved by the Audit Committee. Tax fees correspond mainly to business tax advisory services, including for the following matters: tax implications of compensation systems, expatriate tax services, effects arising from acquiring new firms or businesses, appropriate determination of tax obligations in compliance with applicable laws, tax matters involving inquiries and examination by taxing authorities and local taxes and miscellaneous domestic taxes including industry- and sector-related taxes.
All Other Fees
In 2025 and 2024, other fees were mainly related to fees for immigration services.
Audit fees corresponding to “Taxes” and “All other” paid in 2024 and 2025 were subject to the 35% limit described under “ – Audit Committee Pre-Approval Policies and Procedures” above.
ITEM 16D.EXEMPTIONS FROM THE LISTING STANDARDS FOR AUDIT COMMITTEES
Not applicable.
ITEM 16E.PURCHASES OF EQUITY SECURITIES BY THE ISSUER AND AFFILIATED PURCHASERS
During 2025, purchases of our common shares were made in open market operations on behalf of our clients.
In addition, we and our affiliated purchasers repurchased common shares for our 2025 long-term retention plan for certain employees, as explained in Note 16 to the consolidated financial statements. The following table sets forth, for the months of February and March 2025 in which such repurchases occurred, the total number of shares purchased, and the
average price paid per share. None of the repurchased shares were purchased as part of publicly announced plans or programs.
| | | | | | | | | | | | | | | | | | | | | | | | | | |
| Period | | Total Number of Shares Purchased (1) | | Average
Price Paid
per Share | | Total Number of Shares Purchased
as Part of Publicly Announced
Plans or Programs | | Maximum Number (or Approximate
Dollar Value) of Shares that May
Yet Be Purchased Under the Plans
or Programs |
| February 2025 | | 26,000 | | US$180.41 | | - | | - |
| March 2025 | | 149,400 | | US$186.65 | | - | | - |
(1)Shares repurchased in open-market transactions.
The share repurchase transactions were conducted at market prices. None of the repurchased shares were acquired as part of publicly announced plans or programs.
ITEM 16F.CHANGE IN REGISTRANT’S CERTIFYING ACCOUNTANT
Not applicable.
ITEM 16G.CORPORATE GOVERNANCE
16G.AThe New York Stock Exchange – Corporate Governance
The NYSE’s corporate governance rules, codified in Section 303A of the NYSE’s Listed Company Manual, apply, with certain exceptions for foreign private issuers like Credicorp, in full to companies listing common equity securities on the exchange. The chart below provides a brief description of the significant differences between our corporate governance practices and those followed by U.S. companies under NYSE listing standards. All Credicorp policies mentioned under “Credicorp Corporate Governance Policies” in the chart below can be accessed on our Investor Relations website at https://credicorp.gcs-web.com/.
| | | | | | | | |
Section of NYSE Listed Company Manual | NYSE Corporate Governance Rules for US Domestic Issuers | Credicorp Corporate Governance Practices |
| 303A.01 | A majority of the members of the Board of Directors must be “Independent Directors”, as defined by the NYSE. | Credicorp is not required under Bermuda law to maintain a Board of Directors with a majority being Independent Directors. As of December 31, 2025, five Directors out of nine are independent. |
| | | | | | | | |
Section of NYSE Listed Company Manual | NYSE Corporate Governance Rules for US Domestic Issuers | Credicorp Corporate Governance Practices |
| 303A.02 | A Director cannot be “independent” unless the Board of Directors affirmatively determines that the Director has no material relationship with the listed company. In affirmatively determining the independence of any Director who will serve on the compensation committee of the listed company’s Board of Directors, the Board of Directors must consider all factors specifically relevant to determining whether a Director has a relationship with the listed company that is material to that director’s ability to be independent from management in connection with the duties of a compensation committee member, including, but not limited to: (i)the source of compensation of such Director, including any consulting, advisory or other compensatory fee paid by the listed company to such Director (ii)whether such Director is affiliated with the listed company, a subsidiary of the listed company or an affiliate of a subsidiary of the listed company In addition, a Director is not independent if the Director: (iii)is, or has been within the last three years, an employee of the listed company, or an immediate family member is, or has been within the last three years, an executive officer of the listed company (iv)has received, or has an immediate family member who has received, during any twelve-month period within the last three years, more than US$120,000 in direct compensation from the listed company, other than Director and committee fees and pension or other forms of deferred compensation for prior service. | Credicorp has adopted an “independence” standard that is different from the standard established by the NYSE. Credicorp’s independence standard incorporates the SEC’s minimum independence requirements applicable to Directors serving on audit committees. The definition of independence is included in Credicorp’s Corporate Governance Policy. There is no similar requirement under Bermuda law. Under our definition, a Director shall be deemed to be independent if he/she meets each of the following conditions: (i)Not being or having been, in the last three years, a Related Director or employee of Credicorp and/or subsidiaries. (ii)Not being or having been, in the last three years, a Director or employee of a company holding ≥5% interest in Credicorp. This criterion shall not apply to Directors with an independent status in Credicorp and/or subsidiaries. (iii)Not being a shareholder with >1% interest in Credicorp, not being entitled to exercise voting rights in excess of such percentage nor have preferential voting rights nor have any agreement or agreements allowing such shareholder to exercise the rights to purchase Credicorp shares in excess of such percentage. |
| | | | | | | | |
Section of NYSE Listed Company Manual | NYSE Corporate Governance Rules for US Domestic Issuers | Credicorp Corporate Governance Practices |
| (v)(a) is a current partner or employee of a firm that is the listed company's internal or external auditor; (b) has an immediate family member who is a current partner of such a firm; (c) has an immediate family member who is a current employee of such a firm and personally works on the listed company's audit; or (d) was, or an immediate family member was, within the last three years a partner or employee of such a firm and personally worked on the listed company's audit within that time (vi)is, or has been with the last three years, employed as an executive officer of another company where any of the listed company's present executive officers at the same time serves or served on that company’s compensation committee. (vii)is a current employee, or an immediate family member is a current executive officer, of a company that has made payments to, or received payments from, the listed company for property or services in an amount which, in any of the last three fiscal years, exceeds the greater of US$1 million, or 2% of such other company’s consolidated gross revenues. | (iv)Not being a Director or a member of the Senior Management of a company in which any Related Director or member of the Senior Management of Credicorp is a member of the Board of Directors. Such restriction shall not apply when cross Directorship is with respect to Credicorp subsidiaries. (v)Not being or having been a member of the Senior Management of a company in which any Related Director or member of the Senior Management of Credicorp is or has been a member of the Compensation Committee (or equivalent) of the Board of Directors in the last three years. (vi)Not being a shareholder with >5% interest, partner, Director, or member of the Senior Management of a third-party company which makes or has made business or contractual transactions for >1% of the annual revenue of Credicorp or >5% of the third-party company, or >5% of the annual income of the proposed Director in the last three fiscal years. (vii)Not having received, and any Relatives not having received, from Credicorp and/or subsidiaries any compensation >$120,000 over a period of 12 months during the last three years, excluding Directors’ fees and revenue from investments in financial instruments (bonds, shares, term deposits, among others) of Credicorp and/or subsidiaries. (viii)Not being or having been an employee or partner of the auditing firm of Credicorp and/or subsidiaries in the last three years. (ix)Not being a Relative of shareholders with ≥5% interest in Credicorp, or of members of the Board of Directors or the Senior Management of Credicorp. |
| | | | | | | | |
Section of NYSE Listed Company Manual | NYSE Corporate Governance Rules for US Domestic Issuers | Credicorp Corporate Governance Practices |
| | (x)Not acting as an Independent Director in >5 Boards of Directors of companies entered in the Securities Market Public Registry (RMPV), excluding Board of Directors of Credicorp and/or subsidiaries. (xi)Not being or having been an Independent Director for over 10 continuous or alternate years during the last 15 years with Credicorp and/or subsidiaries. (xii)The Board of Directors shall be entitled to determine the Independence of a Director in situations calling for interpretation or which have not been contemplated in this document. Definitions Senior Management: is made up of the following roles: (i)Executive Chairman (ii)Chief Executive Officer (iii)Managers in charge of the four Business Units (Universal Banking, Microfinance, Insurance and Retirement, and Investment Banking and Asset Management) (iv)Managers with the following Corporate Roles: •Chief Financial Officer •Chief Risk Officer •Chief Corporate Audit Officer •Chief Compliance and Ethics Officer •Head of Legal •Head of People Strategy •Chief Innovation Officer •Head of Corporate Affairs •Chief Strategy Officer Related Director: the Credicorp Director who is not considered independent. Relative: a person having an up to second-degree blood or affinity relation, including common law or similar affective relationships. Corporate Role: it is the function of corporate scope that implies direct or shared responsibility with the management of the business units. |
| | | | | | | | |
Section of NYSE Listed Company Manual | NYSE Corporate Governance Rules for US Domestic Issuers | Credicorp Corporate Governance Practices |
| | |
| 303A.03 | Non-management Directors of a listed company must meet at regularly scheduled executive sessions without management. | Credicorp is not required by Bermuda law to hold regular meetings of the board of Directors at which only independent Directors are present. |
| | |
| 303A.04 | Listed companies must have a nominating/corporate governance committee composed entirely of Independent Directors, with a written charter that addresses specific minimum requirements and annual performance evaluation of the committee. | Credicorp has established a Compensation and Nominations Committee and a Sustainability Committee (formerly the Corporate Governance Committee). The minimum requirements and procedures to be followed by each committee are set forth in Credicorp’s Corporate Governance Policy. Credicorp has adopted a charter for the Sustainability Committee and for the Compensation and Nominations Committee. Although these committees are not required by law to be composed entirely of independent Directors (as defined by the NYSE), under Credicorp’s current Corporate Governance Policy: –the Compensation and Nominations Committee (the current name after being known as the “Compensations Committee” before it merged with the “Nominations Committee” in June 2020) shall consist of no less than three Directors, at least two of them must be independent and one should be a woman. It will be chaired by one of the independent Directors, and –the Sustainability Committee must be composed of at least three Directors of Credicorp, at least two of whom must be independent (as determined by Credicorp) and one should be a woman. Additionally, the Board of Directors may incorporate as a member one or more Directors of subsidiaries of the Corporation. The chairman of the Board may not be part of the committee. There is no similar requirement under Bermuda law. |
| | |
| | | | | | | | |
Section of NYSE Listed Company Manual | NYSE Corporate Governance Rules for US Domestic Issuers | Credicorp Corporate Governance Practices |
| 303A.05 | Listed companies must have a compensation committee composed entirely of independent Directors, who satisfy the additional independence requirements specific to compensation committee membership set forth in Section 303A.02, with a written charter that addresses specific minimum requirements. | Under Bermuda law, compensation of executive officers does not need to be determined by an independent committee. However, Credicorp has established a Compensation and Nominations Committee that reviews and approves the compensation and benefits for Credicorp’s executive officers and other key executives of Credicorp. Credicorp’s Board of Directors has adopted a Compensation and Nominations Committee charter. |
| | |
| 303A.06 | Listed companies must have an audit committee that satisfies the requirements of Rule 10A-3 under the Exchange Act. | Credicorp has an Audit Committee that satisfies the requirements of Rule 10A-3 under the Exchange Act. There is no similar requirement under Bermuda law. |
| | |
| 303A.07 | Listed companies must have an audit committee with at least three members, and all members of the committee must satisfy the “independence” requirements set forth in Section 303A.02 of the NYSE Listed Company Manual (described above). The audit committee must also have a written charter that addresses specific minimum requirements, and listed companies must have an internal audit function. | Credicorp has formed an Audit Committee responsible for advising the General Meeting of Shareholders regarding the selection of independent auditors and evaluating Credicorp’s internal controls. Credicorp’s Audit Committee has three members, and the members satisfy the independence requirements of Rule 10A-3 under the Exchange Act as a foreign private issuer. The Committee shall have at least one member who is considered a financial expert. Credicorp’s Board of Directors has adopted an Audit Committee charter. There is no similar requirement under Bermuda law. |
| | |
| 303A.08 | Shareholders must be given the opportunity to vote on equity-compensation plans and material revisions thereto, with limited exemptions set forth in the NYSE rules. | Under Bermuda law, Credicorp is not required to obtain shareholder consent prior to adopting share compensation plans. |
| | |
| 303A.09 | Listed companies must adopt and disclose corporate governance guidelines addressing specific minimum requirements: director qualification standards, director responsibilities, director access to management and, as necessary and appropriate, independent advisors, director compensation, director orientation and continuing education, management succession, and annual performance evaluation of the board. Also, listed companies must make the corporate governance guidelines available on or through their website. | Credicorp has adopted a set of corporate governance guidelines. Credicorp has policies that regulate the criteria for the selection of directors as well as independence qualification standards, director’s responsibilities and duties, the director’s right to access, as necessary and appropriate, to independent advisors, director orientation and continuing education, management succession, and annual performance evaluation of the board. Credicorp has made the set of corporate governance principles available on the Company’s website (https://credicorp.gcs-web.com/). |
| | |
| | | | | | | | |
Section of NYSE Listed Company Manual | NYSE Corporate Governance Rules for US Domestic Issuers | Credicorp Corporate Governance Practices |
| 303A.10 | Listed companies must adopt and disclose a code of business conduct and ethics for Directors, officers and employees and promptly disclose any waivers of the code for Directors or executive officers. Each code of business conduct and ethics must require that any waiver of the code may be made only by the Board of Directors or a Board committee and must contain compliance standard and procedures to facilitate the effective operation of the code, including action against violations of the code. Each listed company may determine its own policies, but all listed companies should address the following topics: conflicts of interest, corporate opportunities, confidentiality, fair dealing, protection and proper use of listed company assets, compliance with laws, rules and regulations (including insider trading laws), and encouraging the reporting of any illegal or unethical behavior. | Credicorp has adopted and published on the Company’s website (https://credicorp.gcs-web.com/) a Code of Ethics for Directors, officers and employees and has adopted a Code of Ethics for professionals with financial responsibility. In accordance with our corporate policies, all Directors, executives, employees and suppliers must comply with the laws, regulations and government requirements applicable to business conducted both in Peru and in other jurisdictions where the Corporation operates, acting with honesty and integrity as described in Credicorp’s Corporate Compliance Manual, Credicorp’s Code of Ethics, Credicorp’s Corporate Ethics and Conduct Policy, the Anti-Money Laundering and Financing of Terrorism Manual, and other internal documents related to compliance. |
| | |
| 303A.12 | Each listed company must submit an executed written affirmation annually to the NYSE. Each listed company CEO must (i) certify to the NYSE each year that he or she is not aware of any violation by the listed company of NYSE corporate governance listing standards, qualifying the certification to the extent necessary and (ii) promptly notify the NYSE in writing after any executive officer of the listed company becomes aware of any non-compliance with any applicable provisions of Section 303A.
In addition, each listed company must submit an interim Written Affirmation as and when required by the interim Written Affirmation form specified by the NYSE.
| As a NYSE-listed company, Credicorp must submit an executed written affirmation annually to the NYSE, and its CEO must promptly notify the NYSE in writing after any executive officer of Credicorp becomes aware of any non-compliance with any applicable provisions of Section 303A. There is no similar requirement under Bermuda law. |
| | |
| | | | | | | | |
Section of NYSE Listed Company Manual | NYSE Corporate Governance Rules for US Domestic Issuers | Credicorp Corporate Governance Practices |
| 303A.14 | Each listed company must adopt and comply with a written recovery policy providing that it will recover reasonably promptly the amount of erroneously awarded incentive-based compensation in the event that it is required to prepare an accounting restatement due to the material noncompliance with any financial reporting requirement under the securities laws, including any required accounting restatement to correct an error in previously issued financial statements that is material, or that would result in a material misstatement if the error were corrected in the current period or left uncorrected in the current period. | In accordance with Rule 10D-1 of the Securities Exchange Act of 1934, as amended, and Section 303A.14 of the NYSE Listed Company Manual, the Board of Directors of Credicorp approved a Clawback Policy, which became effective as of December 1, 2023.
Under the Clawback Policy, in the event of an accounting restatement due to the material noncompliance of the Company with any financial reporting requirement under the U.S. securities laws, the Company is required to recover from executive officers of the Company and its subsidiaries incentive compensation paid to executive officers in any form that the executive officers would not have been entitled to receive based on the restated amounts. |
| | |
| 314.00 | A company's audit committee or another independent body of the board of directors, shall conduct a reasonable prior review and oversight of all related party transactions for potential conflicts of interest and will prohibit such a transaction if it determines it to be inconsistent with the interests of the company and its shareholders. | Under Bermuda law, Credicorp is not subject to any restrictions on transactions with affiliates, other than such restrictions as are applicable to Bermuda companies generally. Credicorp’s Bye-laws provide that a Director may not vote with respect to any contract or proposed contract or arrangement in which that Director has an interest or a conflict of interest. Credicorp has not engaged in any transactions with related parties except through its subsidiaries.
Transactions between the Credicorp companies and those related to Credicorp that exceed US$1 million must have the approval of the Board of Directors involved or the body to which this Board has delegated the responsibility.
Transactions between Credicorp companies and between Credicorp companies and their employees conducted under the normal course of its operations, at market prices and values, or in substantially similar terms to those with third parties, and that do not imply a higher collectability risk and do not present any additional unfavorable terms for Credicorp, are exempted from this requirement. These transactions are considered pre-approved by Credicorp's Board of Directors and may be reported to the Sustainability Committee in order to ensure good practices and detect potential conflicts of interest. |
16G.BBermuda law – Corporate Governance
We are a company incorporated under the laws of Bermuda and are subject to Bermuda laws related to corporate governance. Under Bermuda law, there are no statutory requirements with respect to the independence of a Board of Directors, meetings of non-management Directors, the establishment and composition of certain committees or the adoption and disclosure of corporate governance guidelines or codes of business conduct and ethics. Certain Bermuda common law and statutory provisions, however, relate to duties and obligations of a company and its Directors that are similar to some of the duties and obligations arising from the provisions of Section 303A of the NYSE’s Listed Company Manual.
(1)Fiduciary Duties and Duties of Skill and Care Under Bermuda law
Under section 97(1) of the Companies Act 1981 of Bermuda, as amended (also referred to as the Companies Act), every Director and officer of a company must act honestly and in good faith with a view to the best interests of the company (often referred to as a “fiduciary duty”) and must exercise the care, diligence, and skill that a reasonably prudent person would exercise in comparable circumstances (often referred to as a “duty of skill and care”).
Fiduciary Duty
Under the common law applicable to Bermuda companies, the fiduciary duty of Directors has four aspects which may be briefly summarized as follows:
A duty to act honestly and in good faith. A Director has a duty to act honestly and in good faith in what he considers are the best interests of the company and not for any collateral purpose. The courts allow the Director wide discretion in determining this, interfering only if no reasonable Director could have believed that a course of action was in the best interests of the company. However, a Director acting honestly, but not in the best interests of the company, is in breach of such duty.
A duty to exercise powers for a proper purpose. Directors must act within the powers set out in the company’s memorandum of association and bye-laws and exercise their powers in the company’s interests and for the purposes for which those powers were conferred. Even if the Directors are acting in good faith in the interests of the company as a whole, they must still use their powers for the purposes for which they were intended. For example, in general Directors are not allowed to exercise their powers in such a way as to prevent a majority of the members from exercising their rights.
A duty to avoid conflicts of interest. A Director must not put himself in a position where there is an actual or potential conflict between a personal interest and his duty to the company. However, a Director may enter into a contract where a conflict of interest might arise if the Bye-laws allow it or the company gives its approval in a general meeting. Our bye-laws do not prohibit a Director from entering into a contract where a conflict of interest may arise, but they do prohibit a Director from voting with respect to any contract or proposed contract or arrangement in which such Director is interested or with which such Director has a conflict of interest. In addition, section 97(4) of the Companies Act requires our Directors and officers to disclose at the first opportunity any interest in a material contract, proposed material contract or person that is a party to a material contract or proposed material contract with us or any of our subsidiaries.
A duty not to appropriate, divert or personally profit from corporate opportunities. Unless the bye-laws specifically provide otherwise, a Director’s fiduciary position precludes him from appropriating, diverting, or taking a personal profit from any opportunities that result from the directorship. Our Bye-laws do provide an exception to this rule. They provide that any Director, any Director’s firm or partner, or any company with which any Director is associated may act for us in a professional capacity. Such Director, firm, partner, or company will be entitled to compensation for professional services as if the Director were not a member of our Board of Directors. However, such Director, firm, partner, or company may not act as our auditor.
Duty of Skill and Care
Under the common law, applicable to Bermuda companies, the duty of skill and care has three aspects which may be briefly summarized as follows:
Degree of Skill. A Director need not exhibit in the performance of his duties a greater degree of skill than may reasonably be expected from a person of like knowledge and experience. A Director is not expected to exercise a level of
skill he does not have. The level of skill required of a Director is subjective, in that the Director is not expected, merely by virtue of the office, to possess any particular skills. Performance must be judged by the way the Director applies any skills which he actually has. However, Directors ought to acquire and maintain a sufficient knowledge and understanding of the company’s business to enable them to properly discharge their duties as Directors.
Attention to the Business. A Director must diligently attend to the affairs of the company. In the performance of this duty, a Director must at a minimum display the reasonable care an ordinary person acting in a comparable role would be expected to take in the same circumstances on his own behalf. Mere errors of judgment have been held not to breach the duty of skill and care. A Director, as such, is not bound to give continuous attention to the affairs of the company, as his or her duties are of an intermittent nature.
Reliance on Others. A Director is not liable for the acts of Co-Directors or other company officers solely by virtue of the position. A Director is entitled to rely on his Co-Directors or company officers as well as subordinates who are expressly put in charge of attending to the detail of management, provided such reliance is honest and reasonable (although a Director cannot absolve himself entirely of responsibility by delegation to others). As a general rule, before delegating responsibility to others, the Directors in question should satisfy themselves that the delegates have the requisite skills to discharge the functions delegated to them. In addition, the Directors must ensure that there is set up an adequate system of monitoring such delegates (e.g., managers). The Directors must, on a regular basis, ensure that their delegates have fulfilled their obligations. The Directors should require a regular flow of information from the delegates to ensure that they are carrying out their duties satisfactorily. In addition, section 97(5A) of the Companies Act provides that a Director shall not have breached the fiduciary duty or duty of skill and care required by section 97(1) if he relies in good faith upon financial statements of the company represented to him by another Director or officer of the company or a report of an attorney, accountant, engineer, appraiser, or other person whose profession lends credibility to a statement made by him.
(2)Other Statutory Duties and Obligations
The Companies Act imposes certain specific duties and obligations on companies and Directors, both directly and indirectly, including duties and obligations with respect to (i) loans to Directors and related persons, (ii) limits on indemnities for Directors and officers and (iii) the keeping of proper books of account.
Loans to Directors and Related Persons
It is not lawful for a company to make a loan or to enter into a guarantee or provide security in connection with a loan to a Director or certain persons related to a Director without the consent of the members of the company holding in the aggregate not less than 90% of the total voting rights of all the members having the right to vote at any meeting of the members of the company, except in certain specific circumstances as provided under the Companies Act.
Limits on Indemnity for Directors and officers
Section 98 of the Companies Act provides generally that a Bermuda company may indemnify its Directors, officers, and auditors against any liability which, by virtue of any rule of law, would otherwise be imposed on them with respect to any negligence, default, breach of duty or breach of trust. However, this rule does not apply in cases where such liability arises from fraud or dishonesty of which such Director, officer or auditor may be guilty in relation to the company or any of its subsidiaries. Any provision, whether contained in the Bye-laws of a company or in any contract or arrangement between the company and one of its Directors which would exempt such Director from, or indemnify him against, any liability that would otherwise attach to him with respect to his fraud or dishonesty in relation to the company will be void. Section 98 further provides that a Bermuda company may indemnify its Directors, officers and auditors against any liability incurred by them in defending any proceedings, whether civil or criminal, in which judgment is awarded in their favor or in which they are acquitted or granted relief by the Supreme Court of Bermuda pursuant to section 281 of the Companies Act. In the event that an allegation of fraud or dishonesty is proven, the Director is obligated to disgorge any money provided for his defense.
Books of Account
It is the duty of the Directors to cause to be kept proper books of account with respect to all sums of money received and expended by the company and the matters with respect to which the receipts and expenditures take place, all sales and purchases by the company, and the assets and liabilities of the company.
16G.CPeruvian Law – Corporate Governance
Although we are a holding company whose principal subsidiaries (Grupo Crédito S.A., BCP Stand-alone, and Grupo Pacífico) are incorporated under and subject to the laws of Peru, initially we were registered in Peru as a foreign issuer and were consequently subject only to Peruvian regulations applicable to foreign issuers. Due to a regulatory amendment enacted in December 2017, our stock is now considered a valor nacional (or domestic security), which has resulted in changes to our reporting requirements for the SMV. Currently, there are no corporate governance provisions under Peruvian law applicable to us that are similar to the provisions of Section 303A of the NYSE’s Listed Company Manual.
ITEM 16H. MINE SAFETY DISCLOSURE
Not applicable.
ITEM 16I. DISCLOSURE REGARDING FOREIGN JURISDICTIONS THAT PREVENT INSPECTION
Not applicable.
ITEM 16J. INSIDER TRADING POLICIES
The Board of Directors of Credicorp approved its Insider Trading Policy, which provides the guidelines to assist directors, executive officers, managers and employees of Credicorp Ltd. and its subsidiaries, who by their jobs, professions or functions have access to material non-public information of Credicorp Ltd. and its subsidiaries, in order to comply with their obligations under the applicable laws and regulations. The policy defines the Subject Persons and establishes the investment guidelines they must comply with, such as blackout periods, preapproval, investment rules with company securities and other securities. Likewise, the policy may be reviewed and updated from time-to-time as appropriate or as required by applicable law. A copy of our insider trading prevention policy is attached hereto as Exhibit No. 11.1 to this Annual Report. The Insider Trading Policy is also referred to herein as Insider Trading and Personal Investment Policy.
ITEM 16K. CYBERSECURITY
Overview
For Credicorp and its subsidiaries, technological progress imposes significant challenges in terms of data privacy, security and other information-related risks. With the increasing use of AI, cybersecurity risks to companies are also increasing, including threats such as denial-of-service attacks, malicious use of deepfakes and more advanced social engineering attacks. Cybercriminals can employ machine learning techniques to automate malware campaigns. Sophisticated and financially motivated cyberattacks, including with the use of ransomware, are constant threats across many industries, including financial services; and we expect they will become more common. With the rapid development and dissemination of AI tools, increasingly sophisticated and effective cybersecurity threats continue to emerge, creating a challenging environment for developing new digital solutions for our clients.
Cybersecurity Risk Management
The effective integration of cybersecurity processes into risk management is a strategic imperative for financial institutions in an increasingly digital and threatening environment. For Credicorp, this integration is not just a matter of regulatory compliance but also an essential measure to protect assets, reputation, and customer trust. By proactively addressing cybersecurity challenges, organizations within the group strengthen their resilience and maintain a strong competitive position in the market. Integrating cybersecurity processes into risk management involves identifying, assessing, mitigating and monitoring operational, fraud, and cybersecurity risks. This requires a holistic approach encompassing people, policies, procedures, technologies, and an organizational culture oriented towards risk management, embedded within Credicorp's broader enterprise risk management framework.
Our goal is to support our business strategy by creating a cyber-resilient organization that protects our products and services and honors the trust our customers have placed in us. Our organization operates under a three lines model. The first line is responsible for managing risks daily, including by designing and implementing controls to mitigate risks. The second line is responsible for developing the cybersecurity strategy and governance program, as well as challenging and overseeing the first line. The third line operates independently and evaluates the processes and functions of both the first and second lines.
Cybersecurity Governance
In terms of personnel, our Chief Information Security Officer (the CISO) is the principal leader of the corporate cybersecurity team, and the CISO’s responsibilities include defining a comprehensive cybersecurity strategy aligned with the business and regulatory objectives affecting any of Credicorp’s subsidiaries and the organization’s risk appetite; providing guidance and advice to senior management on cybersecurity, risk, and compliance issues; coordinating responses and decision-making regarding major security crises; and acting as the focal point for communication with internal and external stakeholders, including regulators and government agencies, to ensure compliance with regulations and other relevant standards, such as preparing periodic reports and audits. Our CISO has broad experience in cybersecurity and information risk management, supported by extensive training, and is supported by dedicated cybersecurity and IT security teams across the group.
Credicorp has internal teams of cybersecurity and IT security experts distributed across the group’s companies, which also work with external cybersecurity service providers for specific tasks. These teams are responsible for protecting technological infrastructure, confidential data, and business operations against cyber threats. Among the security capabilities and technologies that Credicorp and its subsidiaries have are vulnerability assessment and scanning tools, intrusion detection and prevention systems, security event and incident monitoring systems, penetration testing, adversary emulation exercises, data management (including classification, encryption at rest and in transit, and access management), multi-factor authentication requirements and other logical, physical and technical controls designed to prevent, deter, mitigate, and respond to cybersecurity threats.
Additionally, our employees play a role in protecting Credicorp against cybersecurity threats and, therefore, receive mandatory periodic training on cybersecurity-related topics, including phishing exercises.
Monitoring and identifying risks related to external providers are a fundamental part of our cybersecurity strategy. Given the interconnection and dependence on external services, robust mechanisms are implemented to assess and mitigate risks associated with external service providers.
Finally, we have adopted the National Institute of Standards and Technology (NIST) Cybersecurity Framework (CSF) as the basis for our cybersecurity framework and have established our cybersecurity program to address evolving threats, and have dedicated significant resources to implementing and maintaining processes and controls to manage cybersecurity risk within our appetite.
Board Governance
We believe that we have implemented robust cybersecurity risk governance with clear roles and responsibilities, committees, policies, and procedures to ensure the proper prevention, detection, and response to incidents, as well as the continuous improvement of the program. Cybersecurity risk is overseen by the Board of Directors’ Risk Committee. Our Appetite Dashboard incorporates a set of cybersecurity risk appetite metrics, which are monitored monthly. Any deviation from our appetite is reported to the Risk Committee, including action plans to resolve such deviation. Additionally, periodic updates on our cybersecurity program and any cybersecurity incidents or threats are also reported to the Risk Committee, the Audit Committee, or the Board of Directors, as necessary. These reports are consolidated by our CISO team, include contributions from the first and second-line teams of individual companies as needed, and are delivered to the Board and relevant committees by our CISO. By adopting a proactive and collaborative approach and staying abreast of industry best practices and regulatory requirements, the Board, the Risk Committee, and the Audit Committee play key roles in governing the protection of the organization’s assets and reputation in an increasingly challenging cybersecurity environment.
Protocols and Materiality Analysis Regarding Cybersecurity Incidents
We have established a crisis management structure and a multifunctional crisis management team, with defined protocols for different scenarios and periodic simulation exercises to ensure that an up-to-date and adequate response is available for any potential future incident.
Given the new SEC rules regarding the disclosure of material cybersecurity incidents, our Risk Committee has approved and established criteria for determining the materiality of cybersecurity incidents. These criteria include financial, business continuity, reputational, and legal impacts, as well as a detailed additional review by a committee formed by our Chief Financial Officer (CFO), Chief Risk Officer (CRO), and Corporate Legal Counsel.
Currently, we are not aware of any cybersecurity incidents that could have a material effect on our business strategy, operating results, or financial condition.
Cybersecurity Risk Management Regarding the Use of Artificial Intelligence
At Credicorp, we see the value of AI both in increasing the productivity of our employees and processes and in improving the customer experience. In terms of risk management, we ensure that each AI initiative undergoes a risk assessment process led by each company in the group. This assessment considers cybersecurity-related aspects such as data-related risks (e.g., sensitive data leakage or data theft), technological risks (e.g., malicious command injection or availability failures), regulatory and compliance risks (e.g., non-compliance with privacy regulations and insufficient audit and traceability of records), among others.
Credicorp has developed and deployed a Responsible AI Use Policy across the group, which has been developed with the participation of various specialized second-line units (Cybersecurity, Operational Risk, Compliance, Ethics, Legal, Fraud, among others). Credicorp has defined organizational and technical policies regarding the use of chats with generative AI interactions to prevent information leakage risks or misuse of data by our employees concerning the information provided to them to perform their operations.
Finally, we complement these actions with a training and awareness program to strengthen risk management skills and promote the use of standardized AI tools at Credicorp. In this way, we ensure that the risks and impact of technology on our business are managed effectively and proportionally to their magnitude. Thus, we ensure adequate risk management corresponding to regulatory and operational risks regarding the correct use of AI to identify and monitor these risks properly to protect our customers and investors, complying with the expectations of the SEC and other local government regulators.
PART III
ITEM 17. FINANCIAL STATEMENTS
See Item 18.
ITEM 18. FINANCIAL STATEMENTS
Credicorp Consolidated Financial Statements and the report of the independent public accounting firm in connection therewith are filed as part of this Annual Report on Form 20-F, as noted below:
ITEM 19. EXHIBITS
•Index to Exhibits
1.1 Bye-laws of Credicorp Ltd. incorporated herein by reference to Exhibit 1.1 to Credicorp’s Annual Report on Form 20-F filed on April 28, 2021 1.2 Memorandum of Association of Credicorp Ltd. incorporated herein by reference to Exhibit 1.2 to Credicorp’s Annual Report on Form 20-F dated May 29, 2020 2.1 Description of Securities incorporated herein by reference to Exhibit 2.1 to Credicorp’s Annual Report on Form 20-F dated April 28, 2021 2.2 Indenture dated June 17, 2020, among Credicorp Ltd., as issuer, The Bank of New York Mellon, as Trustee, Paying Agent and Registrar. We hereby agree to furnish to the SEC, upon its request, a copy of any instrument defining the rights of holders of long-term debt of us or of our subsidiaries for which consolidated or unconsolidated financial statements are required to be filed.
11.1 Credicorp Ltd. Insider Trading and Personal Investments Policy. Updated on January 29, 2026 12.1 Certification by the Chief Executive Officer Pursuant to Section 302 of the U.S. Sarbanes-Oxley Act of 2002 12.2 Certification by the Chief Financial Officer Pursuant to Section 302 of the U.S. Sarbanes-Oxley Act of 2002 13.1 Certification by the Chief Executive Officer Pursuant to Section 906 of the U.S. Sarbanes-Oxley Act of 2002 13.2 Certification by the Chief Financial Officer Pursuant to Section 906 of the U.S. Sarbanes-Oxley Act of 2002 97.1 Credicorp LTD. Clawback Policy incorporated herein by reference to Exhibit 97.1 to Credicorp’s Annual Report on Form 20-F dated April 24, 2024.
101.INS Inline XBRL Instance Document (the instance document does not appear in the Interactive Data File because its XBRL tags are embedded within the Inline XBRL document)
101.SCH Inline XBRL Taxonomy Extension Schema
101.CAL Inline XBRL Taxonomy Extension Calculation Linkbase
101.DEF Inline XBRL Taxonomy Extension Definition Linkbase
101.LAB Inline XBRL Taxonomy Extension Label Linkbase
101.PRE Inline XBRL Taxonomy Extension Presentation Linkbase
104 Cover Page Interactive Data File (formatted as Inline XBRL and contained in Exhibit 101)
SIGNATURE
The registrant hereby certifies that it meets all of the requirements for filing on Form 20-F and that it has duly caused and authorized the undersigned to sign this Annual Report on its behalf
| | | | | | | | |
| CREDICORP LTD. | |
| | |
| By: | /s/ ALEJANDRO PEREZ-REYES | |
| Name: | Alejandro Perez-Reyes | |
| Title: | Chief Financial Officer | |
Dated: April 27, 2026 | |
CREDICORP LTD. AND SUBSIDIARIES
CONSOLIDATED FINANCIAL STATEMENTS
AS OF DECEMBER 31, 2025 AND 2024
CREDICORP LTD. AND SUBSIDIARIES
CONSOLIDATED FINANCIAL STATEMENTS
AS OF DECEMBER 31, 2025 AND 2024
| | | | | |
| S/ | = Sol |
| US$ | = U.S. Dollar |
| Bs | = Boliviano |
| $ | = Colombian Peso |
| $ | = Chilean Peso |
| ¥, Yen | = Japanese Yen |
Report of Independent Registered Public Accounting Firm
To the Shareholders and the Board of Directors of Credicorp Ltd.
Opinion on the Financial Statements
We have audited the accompanying consolidated statements of financial position of Credicorp Ltd. and subsidiaries (the Company) as of December 31, 2025 and 2024, the related consolidated statements of income, comprehensive income, changes in equity and cash flows for each of the three years in the period ended December 31, 2025, and the related notes (collectively referred to as the “consolidated financial statements”). In our opinion, the consolidated financial statements present fairly, in all material respects, the financial position of the Company at December 31, 2025 and 2024, and the results of its operations and its cash flows for each of the three years in the period ended December 31, 2025, in conformity with IFRS accounting standards as issued by the International Accounting Standards Board.
We also have audited, in accordance with the standards of the Public Company Accounting Oversight Board (United States) (PCAOB), the Company’s internal control over financial reporting as of December 31, 2025, based on criteria established in Internal Control-Integrated Framework issued by the Committee of Sponsoring Organizations of the Treadway Commission (2013 framework), and our report dated April 27, 2026 expressed an unqualified opinion thereon.
Basis for Opinion
These financial statements are the responsibility of the Company’s management. Our responsibility is to express an opinion on the Company’s financial statements based on our audits. We are a public accounting firm registered with the PCAOB and are required to be independent with respect to the Company in accordance with the U.S. federal securities laws and the applicable rules and regulations of the Securities and Exchange Commission and the PCAOB.
We conducted our audits in accordance with the standards of the PCAOB. Those standards require that we plan and perform the audit to obtain reasonable assurance about whether the financial statements are free of material misstatement, whether due to error or fraud. Our audits included performing procedures to assess the risks of material misstatement of the financial statements, whether due to error or fraud, and performing procedures that respond to those risks. Such procedures included examining, on a test basis, evidence regarding the amounts and disclosures in the financial statements. Our audits also included evaluating the accounting principles used and significant estimates made by management, as well as evaluating the overall presentation of the financial statements. We believe that our audits provide a reasonable basis for our opinion.
Critical Audit Matters
The critical audit matters communicated below are matters arising from the current period audit of the financial statements that were communicated or required to be communicated to the audit committee and that: (1) relate to accounts or disclosures that are material to the financial statements and (2) involved our especially challenging, subjective or complex judgments. The communication of critical audit matters does not alter in any way our opinion on the consolidated financial statements, taken as a whole, and we are not, by communicating the critical audit matters below, providing separate opinions on the critical audit matters or on the accounts or disclosures to which they relate.
Impairment of financial assets
Description of the Matter
At December 31, 2025, the allowance for loan losses was S/8,042 million, as disclosed in Note 7 to the consolidated financial statements. As more fully disclosed in Notes 3(i) and 30.1 to the consolidated financial statements, the allowance for loan losses was calculated using an expected credit loss (ECL) model. The ECL model utilizes the probability of default (PD) as a key assumption.
Auditing the allowance for loan losses was complex and required the application of significant auditor effort in evaluating management’s calculation due to the inherent complexity related to the PD assumption, including the forward-looking forecasts across multiple economic scenarios and their associated probability weighting. The ECL is a significant estimate for which variations in model methodology, assumptions and judgments could have a material effect on the measurement of the allowance for loan losses.
How We Addressed the Matter in Our Audit
We obtained an understanding, evaluated the design, and tested the operating effectiveness of management’s controls over the calculation of the allowance for loan losses. The controls we tested related, among others, to the significant assumptions described above, which included controls over the calculation of the PD, including the data inputs used and the governance and oversight controls over the review of the overall ECL model.
Our audit procedures, in which we involved professionals with specialized skills and knowledge to assist in evaluating the audit evidence obtained, included, among others, assessing whether the methodology and assumptions used to estimate the ECL were consistent with the requirements of IFRS 9, Financial Instruments. We also performed an independent recalculation of the allowance for loan losses for a sample of loan portfolio included PD assumption due to its relevance within the ECL measurement and assessed the reasonableness of certain forward-looking assumptions used in the calculation of the PD by analyzing publicly available information from third-party sources. We also assessed the adequacy of the related disclosures included in the consolidated financial statements.
Valuation of the liability for life insurance contracts under the general measurement model
Description of the Matter
At December 31, 2025, the liability for life insurance contracts under the general measurement model was S/10,507 million, as disclosed in Note 8 to the consolidated financial statements. Notes 3(e) and 30.9 also provide disclosures in respect of the foregoing. The determination of the liability for life insurance contracts under the general measurement model is calculated as the sum of cash flow projections related to each portfolio of insurance contracts considering their probability of occurrence and includes cash flow projections that are within the limit of each contract in the portfolio. Cash flow projections are computed based on current mortality tables and current discount interest rates as key assumptions.
Auditing the liability for life insurance contracts under the general measurement model was complex and required the application of significant auditor judgment due to the complexity of the actuarial models, the selection and use of judgmental assumptions and the interrelationship of these variables in measuring the liability. Changes in these assumptions, particularly the discount interest rate could have a material effect on the liability for life insurance contracts under the general measurement model.
How We Addressed the Matter in Our Audit
We obtained an understanding, evaluated the design, and tested the operating effectiveness of management’s controls, related to the liability for life insurance contracts under the general measurement model. The controls we tested related to, among others, the governance and oversight controls over the review of the actuarial models, the related assumptions and data inputs used.
Our audit procedures, in which we involved our actuarial specialists to assist in evaluating the audit evidence obtained, included, among others, the evaluation of the methodology, actuarial models and assumptions used by the Company to measure life insurance contract liabilities in accordance with IFRS 17, Insurance Contracts. We also tested the completeness and accuracy of the underlying data used in the measurement of the liability for life insurance contracts. With the support of our actuarial specialists, we performed an independent recalculation of the liability for life insurance contracts under the general measurement model and evaluated the discount interest rate used for a sample of contracts. We also assessed the adequacy of the related disclosures included in the consolidated financial statements.
Recognition of an asset related to a dispute with the tax authority
Description of the Matter
At December 31, 2025, the Company recognized an asset of S/ 1,577 million derived from a payment made due to a dispute with the Peruvian tax authority regarding income tax withholding on payments to a non-domiciled entity in 2018 and 2019, as disclosed in Notes 12(a) and 31(ii) to the consolidated financial statements. The related dispute gives rise to an uncertain tax position due to the uncertainty regarding the applicability of Peruvian income tax laws to transactions with non-domiciled entities in Peru. The Company used significant judgement to determine, based on the technical merits, whether it was more likely than not that its tax position would prevail when determining the amount recognized.
Auditing the estimation of the outcome and measurement of the uncertain tax position and the related recoverability of the asset for payments, before the uncertain tax treatment is resolved, required a high degree of auditor judgment and significant audit effort due to the complexity and judgment used by the Company in the assessment.
How We Addressed the Matter in Our Audit
We obtained an understanding, evaluated the design, and tested the operating effectiveness of management’s controls over the process for recognizing an asset related to a dispute with the Peruvian tax authority, as well as the process for evaluating the uncertain tax position.
Our audit procedures included, among others, evaluating the assumptions used by the Company to assess its uncertain tax positions based on relevant Peruvian income tax laws, including the inspection of the Company’s external counsel’s analysis of these matters and evaluated the completeness and accuracy of the data used to determine the amount recognized and tested such calculations. In addition, we involved our tax subject matter professionals to assess the technical merits of the Company’s tax position and evaluate the application of relevant tax law in assessing the recoverability of payments made. We also assessed the adequacy of the related disclosures in the consolidated financial statements.
/s/ Tanaka, Valdivia, Arribas & Asociados Sociedad Civil de Responsabilidad Limitada
A member of Ernst & Young Global Limited
We have served as the Company’s auditor since 2023.
Lima, Peru
April 27, 2026
CREDICORP LTD. AND SUBSIDIARIES
CONSOLIDATED STATEMENT OF FINANCIAL POSITION
AS OF DECEMBER 31, 2025 AND 2024
| | | | | | | | | | | | | | | | | |
| Note | | 2025 | | 2024 |
| | | S/(000) | | S/(000) |
| Assets | | | | | |
| | | | | |
Cash and due from banks: | | | | | |
Non-interest-bearing | | | 7,649,640 | | | 7,535,259 | |
Interest-bearing | | | 41,394,817 | | | 40,119,937 | |
| 4 | | 49,044,457 | | | 47,655,196 | |
| | | | | |
| Cash collateral, reverse repurchase agreements and securities borrowing | 5(a) | | 2,177,200 | | | 1,033,177 | |
| | | | | |
| Investments: | | | | | |
| At fair value through profit or loss | 6(a) | | 4,957,236 | | | 4,715,343 | |
| | | | | |
| At fair value through other comprehensive income | | | 33,043,160 | | | 34,208,187 | |
| At fair value through other comprehensive income pledged as collateral | | | 5,990,889 | | | 5,934,451 | |
| 6(b) | | 39,034,049 | | | 40,142,638 | |
| | | | | |
| Amortized cost | | | 8,490,126 | | | 7,904,517 | |
| Amortized cost pledged as collateral | | | 323,531 | | | 1,063,360 | |
| 6(c) | | 8,813,657 | | | 8,967,877 | |
| Loans, net: | 7 | | | | |
| Loans, net of unearned income | | | 149,984,954 | | | 145,732,273 | |
| Allowance for loan losses | | | (7,669,950) | | | (7,994,977) | |
| | | 142,315,004 | | | 137,737,296 | |
| | | | | |
| Financial assets designated at fair value through profit or loss | 3(f) | | 992,429 | | | 932,734 | |
| Reinsurance contract assets | 8(a) | | 708,560 | | | 841,170 | |
| Property, furniture and equipment, net | 9 | | 2,069,017 | | | 1,438,609 | |
| Due from customers on banker’s acceptances | 7(b) | | 345,906 | | | 528,184 | |
| Intangible assets and goodwill, net | 10 | | 4,764,394 | | | 3,289,157 | |
| Right-of-use assets, net | 11(a) | | 603,441 | | | 402,538 | |
| Deferred tax assets, net | 17(c) | | 1,391,636 | | | 1,170,866 | |
| Other assets | 12 | | 10,145,547 | | | 7,234,155 | |
| Total assets | | | 267,362,533 | | | 256,088,940 | |
| | | | | |
| Liabilities | | | | | |
| | | | | |
| Deposits and obligations: | | | | | |
| Non-interest-bearing | | | 52,217,286 | | | 47,160,191 | |
| Interest-bearing | | | 118,184,347 | | | 114,681,875 | |
| 13(a) | | 170,401,633 | | | 161,842,066 | |
| | | | | |
| Payables from repurchase agreements and securities lending | 5(b) | | 8,243,787 | | | 9,060,710 | |
| Due to banks and correspondents | 14(a) | | 10,675,238 | | | 10,754,385 | |
| Due from customers on banker’s acceptances | 3(n) | | 345,906 | | | 528,184 | |
| Lease liabilities | 11(b) | | 612,259 | | | 404,817 | |
| Financial liabilities at fair value through profit or loss | 3(y) | | 1,055,893 | | | 151,485 | |
| Insurance contract liability | 8(b) | | 14,264,155 | | | 13,422,285 | |
| Bonds and notes issued | 15 | | 14,025,535 | | | 17,268,443 | |
| Deferred tax liabilities, net | 17(c) | | 376,939 | | | 59,025 | |
| Other liabilities | 12 | | 8,265,079 | | | 7,620,306 | |
| | | | | |
| Total liabilities | | | 228,266,424 | | | 221,111,706 | |
| | | | | |
Equity | 16 | | | | |
| | | | | |
| Equity attributable to Credicorp’s equity holders: | | | | | |
| | | | | |
| Capital stock | | | 1,318,993 | | | 1,318,993 | |
| Treasury stock | | | (209,845) | | | (208,879) | |
| Capital surplus | | | 148,729 | | | 176,307 | |
Reserves | | | 29,648,582 | | | 27,202,665 | |
| Other Reserves | | | 544,767 | | | 214,627 | |
| Retained earnings | | | 6,915,724 | | | 5,642,738 | |
| | | 38,366,950 | | | 34,346,451 | |
| Non-controlling interest | | | 729,159 | | | 630,783 | |
| Total equity | | | 39,096,109 | | | 34,977,234 | |
| | | | | |
| Total liabilities and equity | | | 267,362,533 | | | 256,088,940 | |
The accompanying notes are an integral part of these consolidated financial statements.
CREDICORP LTD. AND SUBSIDIARIES
CONSOLIDATED STATEMENT OF INCOME
FOR THE YEARS ENDED DECEMBER 31, 2025, 2024 AND 2023
| | | | | | | | | | | | | | | | | | | | | | | |
| Note | | 2025 | | 2024 | | 2023 |
| | | S/(000) | | S/(000) | | S/(000) |
| | | | | | | |
| Interest and similar income | 19 | | 19,930,169 | | | 19,869,256 | | | 18,798,495 | |
| Interest and similar expenses | 19 | | (5,213,690) | | | (5,754,125) | | | (5,860,523) | |
| Net interest, similar income and expenses | | | 14,716,479 | | | 14,115,131 | | | 12,937,972 | |
| | | | | | | |
| Provision for credit losses on loan portfolio | 7(c) | | (2,873,454) | | | (3,943,301) | | | (3,957,143) | |
| Recoveries of written-off loans | | | 467,198 | | | 423,854 | | | 334,798 | |
| Provision for credit losses on loan portfolio, net of recoveries | | | (2,406,256) | | | (3,519,447) | | | (3,622,345) | |
| | | | | | | |
| Net interest, similar income and expenses, after provision for credit losses on loan portfolio | | | 12,310,223 | | | 10,595,684 | | | 9,315,627 | |
| | | | | | | |
| Other income | | | | | | | |
| Commissions and fees | 20 | | 4,199,719 | | | 4,052,103 | | | 3,804,459 | |
| Net gain on foreign exchange transactions | | | 1,542,318 | | | 1,359,805 | | | 886,126 | |
| Net gain on securities | 21 | | 400,686 | | | 362,295 | | | 425,144 | |
| Net gain on derivatives held for trading | | | 51,917 | | | 156,195 | | | 53,665 | |
| Net exchange difference result | | | 41,991 | | | (41,058) | | | 45,778 | |
| Others | 25 | | 584,648 | | | 514,779 | | | 440,653 | |
| Total other income | | | 6,821,279 | | | 6,404,119 | | | 5,655,825 | |
| | | | | | | |
| Insurance and reinsurance result | | | | | | | |
| Insurance service result | 22 | | 1,848,025 | | | 1,693,617 | | | 1,602,421 | |
| Reinsurance result | 22 | | (458,825) | | | (494,597) | | | (391,321) | |
| Total insurance and reinsurance result | | | 1,389,200 | | | 1,199,020 | | | 1,211,100 | |
| | | | | | | |
| Medical services results | | | | | | | |
| Sales of medical services and medicines | 3(d) | | 1,387,341 | | | — | | | — | |
| Cost of sales of medical services and medicines | 3(d) | | (972,707) | | | — | | | — | |
| Total medical services results | | | 414,634 | | | — | | | — | |
| | | | | | | |
| Other expenses | | | | | | | |
| Salaries and employee benefits | 23 | | (5,435,471) | | | (4,676,436) | | | (4,265,453) | |
| Administrative expenses | 24 | | (4,090,784) | | | (4,183,775) | | | (3,803,203) | |
| Depreciation and amortization | 9(a) and 10(a) | | (746,243) | | | (570,830) | | | (511,174) | |
| Impairment loss on goodwill | 10(b) | | — | | | (27,346) | | | (71,959) | |
| Depreciation of right-of-use assets | 11(a) | | (146,899) | | | (142,640) | | | (147,833) | |
| Others | 25 | | (568,386) | | | (773,269) | | | (534,601) | |
| Total other expenses | | | (10,987,783) | | | (10,374,296) | | | (9,334,223) | |
CONSOLIDATED STATEMENT OF INCOME
FOR THE YEARS ENDED DECEMBER 31, 2025, 2024 AND 2023 (CONTINUED)
| | | | | | | | | | | | | | | | | | | | | | | |
| Note | | 2025 | | 2024 | | 2023 |
| | | S/(000) | | S/(000) | | S/(000) |
| | | | | | | |
Net result before income tax | | | 9,947,553 | | | 7,824,527 | | | 6,848,329 | |
| Income tax | 17(b) | | (2,864,899) | | | (2,201,275) | | | (1,888,451) | |
| Net result after income tax | | | 7,082,654 | | | 5,623,252 | | | 4,959,878 | |
| | | | | | | |
| Attributable to: | | | | | | | |
| Credicorp’s equity holders | | | 6,925,377 | | | 5,501,254 | | | 4,865,540 | |
| Non-controlling interest | | | 157,277 | | | 121,998 | | | 94,338 | |
| | | 7,082,654 | | | 5,623,252 | | | 4,959,878 | |
| | | | | | | |
| Net basic and dilutive earnings per share attributable to Credicorp’s equity holders (in soles): | | | | | | | |
| | | | | | | |
| Basic | 26 | | 87.25 | | | 69.24 | | | 61.22 | |
| Diluted | 26 | | 87.08 | | | 69.09 | | | 61.08 | |
The accompanying notes are an integral part of these consolidated financial statements.
CREDICORP LTD. AND SUBSIDIARIES
CONSOLIDATED STATEMENT OF COMPREHENSIVE INCOME
FOR THE YEARS ENDED DECEMBER 31, 2025, 2024 AND 2023
| | | | | | | | | | | | | | | | | | | | | | | |
| | | 2025 | | 2024 | | 2023 |
| | | S/(000) | | S/(000) | | S/(000) |
| | | | | | | |
Net result after income tax | | | 7,082,654 | | | 5,623,252 | | | 4,959,878 | |
| Other comprehensive income: | | | | | | | |
| To be reclassified to profit or loss in subsequent periods: | | | | | | | |
| | | | | | | |
| Net gain on investments at fair value through other comprehensive income | 16(d) | | 1,259,728 | | | 205,765 | | | 1,334,943 | |
| Income tax | 16(d) | | 24,152 | | | 5,118 | | | (58,489) | |
| | | 1,283,880 | | | 210,883 | | | 1,276,454 | |
| | | | | | | |
Net movement of cash flow hedge reserves | 16(d) | | 3,464 | | | 13,925 | | | (17,443) | |
| Income tax | 16(d) | | (1,575) | | | (4,030) | | | 5,104 | |
| | | 1,889 | | | 9,895 | | | (12,339) | |
| | | | | | | |
| Insurance reserves | 16(d) | | (523,992) | | | (70,176) | | | (762,811) | |
| | | (523,992) | | | (70,176) | | | (762,811) | |
| | | | | | | |
| Exchange differences on translation of foreign operations | 16(d) | | (406,955) | | | (114,142) | | | 73,464 | |
| Net movement in hedges of net investments in foreign businesses | 16(d) | | – | | | — | | | 18,950 | |
| | | (406,955) | | | (114,142) | | | 92,414 | |
| | | | | | | |
| Total | | | 354,822 | | | 36,460 | | | 593,718 | |
| | | | | | | |
| Not to be reclassified to profit or loss in subsequent periods: | | | | | | | |
| | | | | | | |
| Net (loss) gain on equity instruments designated at fair value through other comprehensive income | 16(d) | | (18,599) | | | 15,684 | | | (8,329) | |
| Transfer of the fair value reserve of equity instruments to retained earnings | 16(d) | | 8,336 | | | (137,787) | | | – | |
| Income tax | 16(d) | | (2,332) | | | 8,439 | | | (3,791) | |
| Total | | | (12,595) | | | (113,664) | | | (12,120) | |
| | | | | | | |
| Total other comprehensive income | 16(d) | | 342,227 | | | (77,204) | | | 581,598 | |
| | | | | | | |
| Total comprehensive income for the period, net of income tax | | | 7,424,881 | | | 5,546,048 | | | 5,541,476 | |
| | | | | | | |
| Attributable to: | | | | | | | |
| Credicorp’s equity holders | | | 7,255,517 | | | 5,420,098 | | | 5,437,495 | |
| Non-controlling interest | | | 169,364 | | | 125,950 | | | 103,981 | |
| | | 7,424,881 | | | 5,546,048 | | | 5,541,476 | |
The accompanying notes are an integral part of these consolidated financial statements.
CREDICORP LTD. AND SUBSIDIARIES
CONSOLIDATED STATEMENT OF CHANGES IN EQUITY
FOR THE YEARS ENDED DECEMBER 31, 2025, 2024 AND 2023
| | | | | | | | | | | | | | | | | | | | | | | | | | | | | | | | | | | | | | | | | | | | | | | | | | | | | | | | | | | | | | | | | | | | | | | | | | | | | | | | | | | |
| Attributable to Credicorp’s equity holders. | | | | |
| | | | | | | | | | | Other reserves | | | | | | | | |
| | | Treasury stock | | | | | | Instruments
that will not
be
reclassified
to income | | Instruments that will be reclassified to the
consolidated statement of income | | | | | | | | |
| Capital
stock | | Shares of
the Group | | Share-
based
payment | | Capital
surplus | | Reserves | | Investments
in equity
instruments | | Investments
in debt
instruments | | Cash
flow
hedge
reserve | | Insurance
reserves | | Foreign
currency
translation
reserve | | Retained
earnings | | Total | | Non-
controlling
interest | | Total
equity |
| S/(000) | | S/(000) | | S/(000) | | S/(000) | | S/(000) | | S/(000) | | S/(000) | | S/(000) | | S/(000) | | S/(000) | | S/(000) | | S/(000) | | S/(000) | | S/(000) |
| | | | | | | | | | | | | | | | | | | | | | | | | | | |
Balances as of January 1, 2023 | 1,318,993 | | | (204,326) | | | (3,192) | | | 231,556 | | | 23,659,626 | | | 170,408 | | | (1,655,559) | | | 788 | | | 1,133,536 | | | 74,655 | | | 4,277,159 | | | 29,003,644 | | | 591,569 | | | 29,595,213 | |
| Changes in equity in 2023 | | | | | | | | | | | | | | | | | | | | | | | | | | | |
| Net result after income tax | – | | | – | | | – | | | – | | | – | | | – | | | – | | | – | | | – | | | – | | | 4,865,540 | | | 4,865,540 | | | 94,338 | | | 4,959,878 | |
| Other comprehensive income, Note 16(d) | – | | | – | | | – | | | – | | | – | | | (12,247) | | | 1,258,137 | | | (12,191) | | | (754,192) | | | 92,448 | | | – | | | 571,955 | | | 9,643 | | | 581,598 | |
| Total comprehensive income | – | | | – | | | – | | | – | | | – | | | (12,247) | | | 1,258,137 | | | (12,191) | | | (754,192) | | | 92,448 | | | 4,865,540 | | | 5,437,495 | | | 103,981 | | | 5,541,476 | |
| Transfer of retained earnings to reserves, Note 16(c) | – | | | – | | | – | | | – | | | 2,593,598 | | | – | | | – | | | – | | | – | | | – | | | (2,593,598) | | | – | | | – | | | – | |
| Dividend distribution, Note 16(e) | – | | | – | | | – | | | – | | | – | | | – | | | – | | | – | | | – | | | – | | | (1,994,037) | | | (1,994,037) | | | – | | | (1,994,037) | |
| Dividends paid to non-controlling interest of subsidiaries | – | | | – | | | – | | | – | | | – | | | – | | | – | | | – | | | – | | | – | | | – | | | – | | | (62,051) | | | (62,051) | |
| Subsidiary acquisition | – | | | – | | | – | | | – | | | – | | | – | | | – | | | – | | | – | | | – | | | – | | | | | 14,192 | | | 14,192 | |
Minority purchase | – | | | – | | | – | | | – | | | – | | | – | | | – | | | – | | | – | | | – | | | – | | | – | | | (1,773) | | | (1,773) | |
| Purchase of treasury stock, Note 16(b) | – | | | – | | | (2,279) | | | (83,296) | | | – | | | – | | | – | | | – | | | – | | | – | | | – | | | (85,575) | | | – | | | (85,575) | |
| Share-based payment transactions | – | | | – | | | 1,764 | | | 79,979 | | | (12,225) | | | – | | | – | | | – | | | – | | | – | | | – | | | 69,518 | | | – | | | 69,518 | |
| Dividends not collected | – | | | – | | | – | | | – | | | 11,579 | | | – | | | – | | | – | | | – | | | – | | | – | | | 11,579 | | | – | | | 11,579 | |
| Result from exchange of strategic shares | – | | | – | | | – | | | – | | | – | | | – | | | – | | | – | | | – | | | – | | | 14,425 | | | 14,425 | | | – | | | 14,425 | |
| Others | – | | | – | | | – | | | – | | | – | | | – | | | – | | | – | | | – | | | – | | | 2,955 | | | 2,955 | | | 1,143 | | | 4,098 | |
| Balances as of December 31, 2023 | 1,318,993 | | | (204,326) | | | (3,707) | | | 228,239 | | | 26,252,578 | | | 158,161 | | | (397,422) | | | (11,403) | | | 379,344 | | | 167,103 | | | 4,572,444 | | | 32,460,004 | | | 647,061 | | | 33,107,065 | |
| | | | | | | | | | | | | | | | | | | | | | | | | | | | | | | | | | | | | | | | | | | | | | | | | | | | | | | | | | | | | | | | | | | | | | | | | | | | | | | | | | | |
| Attributable to Credicorp’s equity holders. | | | | |
| | | | | | | | | | | Other reserves | | | | | | | | |
| | | Treasury stock | | | | | | Instruments
that will not
be
reclassified
to income | | Instruments that will be reclassified to the
consolidated statement of income | | | | | | | | |
| Capital
stock | | Shares of
the Group | | Share-
based
payment | | Capital
surplus | | Reserves | | Investments
in equity
instruments | | Investments
in debt
instruments | | Cash
flow
hedge
reserve | | Insurance
reserves | | Foreign
currency
translation
reserve | | Retained
earnings | | Total | | Non-
controlling
interest | | Total
equity |
| S/(000) | | S/(000) | | S/(000) | | S/(000) | | S/(000) | | S/(000) | | S/(000) | | S/(000) | | S/(000) | | S/(000) | | S/(000) | | S/(000) | | S/(000) | | S/(000) |
| | | | | | | | | | | | | | | | | | | | | | | | | | | |
| Balances as of January 1, 2024 | 1,318,993 | | | (204,326) | | | (3,707) | | | 228,239 | | | 26,252,578 | | | 158,161 | | | (397,422) | | | (11,403) | | | 379,344 | | | 167,103 | | | 4,572,444 | | | 32,460,004 | | | 647,061 | | | 33,107,065 | |
| Changes in equity in 2024 | | | | | | | | | | | | | | | | | | | | | | | | | | | |
| Net result after income tax | – | | | – | | | – | | | – | | | – | | | – | | | – | | | – | | | – | | | – | | | 5,501,254 | | | 5,501,254 | | | 121,998 | | | 5,623,252 | |
| Other comprehensive income, Note 16(d) | – | | | – | | | – | | | – | | | – | | | 24,116 | | | 206,271 | | | 9,770 | | | (69,383) | | | (114,143) | | | – | | | 56,631 | | | 3,952 | | | 60,583 | |
| Transfer of fair value reserve to accumulated results, Note 16(d) | – | | | – | | | – | | | – | | | – | | | (137,787) | | | – | | | – | | | – | | | – | | | – | | | (137,787) | | | – | | | (137,787) | |
| Total comprehensive income | – | | | – | | | – | | | – | | | – | | | (113,671) | | | 206,271 | | | 9,770 | | | (69,383) | | | (114,143) | | | 5,501,254 | | | 5,420,098 | | | 125,950 | | | 5,546,048 | |
| Transfer of fair value reserve of equity instruments designated at FVOCI due to Sale of Alicorp shares | – | | | – | | | – | | | – | | | – | | | – | | | – | | | – | | | – | | | – | | | 137,787 | | | 137,787 | | | – | | | 137,787 | |
| Transfer of retained earnings to reserves, Note 16(c) | – | | | – | | | – | | | – | | | 1,778,787 | | | – | | | – | | | – | | | – | | | – | | | (1,778,787) | | | – | | | – | | | – | |
| Dividend distribution, Note 16(e) | – | | | – | | | – | | | – | | | – | | | – | | | – | | | – | | | – | | | – | | | (2,788,657) | | | (2,788,657) | | | – | | | (2,788,657) | |
| Distribution of extraordinary dividends, Note 16(e) | – | | | – | | | – | | | – | | | (875,991) | | | – | | | – | | | – | | | – | | | – | | | – | | | (875,991) | | | – | | | (875,991) | |
| Dividends paid to non-controlling interest of subsidiaries | – | | | – | | | – | | | – | | | – | | | – | | | – | | | – | | | – | | | – | | | – | | | – | | | (106,922) | | | (106,922) | |
| Minority purchase Mibanco Colombia | – | | | – | | | – | | | – | | | 42,964 | | | – | | | – | | | – | | | – | | | – | | | – | | | 42,964 | | | (36,781) | | | 6,183 | |
| Purchase of treasury stock, Note 16(b) | – | | | – | | | (2,434) | | | (108,460) | | | – | | | – | | | – | | | – | | | – | | | – | | | – | | | (110,894) | | | – | | | (110,894) | |
| Share-based payment transactions | – | | | – | | | 1,588 | | | 56,528 | | | (954) | | | – | | | – | | | – | | | – | | | – | | | – | | | 57,162 | | | – | | | 57,162 | |
| Dividends not collected | – | | | – | | | – | | | – | | | 5,281 | | | – | | | – | | | – | | | – | | | – | | | – | | | 5,281 | | | – | | | 5,281 | |
| | | | | | | | | | | | | | | | | | | | | | | | | | | | | | | | | | | | | | | | | | | | | | | | | | | | | | | | | | | | | | | | | | | | | | | | | | | | | | | | | | | |
| Attributable to Credicorp’s equity holders. | | | | |
| | | | | | | | | | | Other reserves | | | | | | | | |
| | | Treasury stock | | | | | | Instruments
that will not
be
reclassified
to income | | Instruments that will be reclassified to the
consolidated statement of income | | | | | | | | |
| Capital
stock | | Shares of
the Group | | Share-
based
payment | | Capital
surplus | | Reserves | | Investments
in equity
instruments | | Investments
in debt
instruments | | Cash
flow
hedge
reserve | | Insurance
reserves | | Foreign
currency
translation
reserve | | Retained
earnings | | Total | | Non-
controlling
interest | | Total
equity |
| S/(000) | | S/(000) | | S/(000) | | S/(000) | | S/(000) | | S/(000) | | S/(000) | | S/(000) | | S/(000) | | S/(000) | | S/(000) | | S/(000) | | S/(000) | | S/(000) |
| Others | – | | | – | | | – | | | – | | | – | | | – | | | – | | | – | | | – | | | – | | | (1,303) | | | (1,303) | | | 1,475 | | | 172 | |
| Balances as of December 31, 2024 | 1,318,993 | | | (204,326) | | | (4,553) | | | 176,307 | | | 27,202,665 | | | 44,490 | | | (191,151) | | | (1,633) | | | 309,961 | | | 52,960 | | | 5,642,738 | | | 34,346,451 | | | 630,783 | | | 34,977,234 | |
CONSOLIDATED STATEMENT OF CHANGES IN EQUITY
FOR THE YEARS ENDED DECEMBER 31, 2025, 2024 AND 2023 (CONTINUED)
| | | | | | | | | | | | | | | | | | | | | | | | | | | | | | | | | | | | | | | | | | | | | | | | | | | | | | | | | | | | | | | | | | | | | | | | | | | | | | | | | | | |
| Attributable to Credicorp’s equity holders. | | | | |
| | | | | | | | | | | Other reserves | | | | | | | | |
| | | Treasury stock | | | | | | Instruments
that will not
be
reclassified to
income | | Instruments that will be reclassified to the
consolidated statement of income | | | | | | | | |
| Capital
stock | | Shares of
the Group | | Share-
based
payment | | Capital
surplus | | Reserves | | Investments
in equity
instruments | | Investments
in debt
instruments | | Cash
flow
hedge
reserve | | Insurance
reserves | | Foreign
currency
translation
reserve | | Retained
earnings | | Total | | Non-
controlling
interest | | Total
equity |
| S/(000) | | S/(000) | | S/(000) | | S/(000) | | S/(000) | | S/(000) | | S/(000) | | S/(000) | | S/(000) | | S/(000) | | S/(000) | | S/(000) | | S/(000) | | S/(000) |
| | | | | | | | | | | | | | | | | | | | | | | | | | | |
| Balances as of January 1, 2025 | 1,318,993 | | | (204,326) | | | (4,553) | | | 176,307 | | | 27,202,665 | | | 44,490 | | | (191,151) | | | (1,633) | | | 309,961 | | | 52,960 | | | 5,642,738 | | | 34,346,451 | | | 630,783 | | | 34,977,234 | |
| Changes in equity in 2025 | | | | | | | | | | | | | | | | | | | | | | | | | | | |
| Net result after income tax | – | | | – | | | – | | | – | | | – | | | – | | | – | | | – | | | – | | | – | | | 6,925,377 | | | 6,925,377 | | | 157,277 | | | 7,082,654 | |
| Other comprehensive income, Note 16(d) | – | | | – | | | – | | | – | | | – | | | (20,927) | | | 1,265,461 | | | 1,860 | | | (518,071) | | | (406,519) | | | – | | | 321,804 | | | 12,087 | | | 333,891 | |
| Transfer of the fair value reserve of equity instruments designated at FVOCI for sale, Note 16(d) | – | | | – | | | – | | | – | | | – | | | 8,336 | | | – | | | – | | | – | | | – | | | – | | | 8,336 | | | – | | | 8,336 | |
| Total comprehensive income | – | | | – | | | – | | | – | | | – | | | (12,591) | | | 1,265,461 | | | 1,860 | | | (518,071) | | | (406,519) | | | 6,925,377 | | | 7,255,517 | | | 169,364 | | | 7,424,881 | |
| Transfer of retained earnings to reserves, Note 16(c) | – | | | – | | | – | | | – | | | 5,637,738 | | | – | | | – | | | – | | | – | | | – | | | (5,637,738) | | | – | | | – | | | – | |
| Dividend distribution, Note 16(e) | – | | | – | | | – | | | – | | | (3,181,454) | | | – | | | – | | | – | | | – | | | – | | | – | | | (3,181,454) | | | – | | | (3,181,454) | |
| Dividends paid to non-controlling interest of subsidiaries | – | | | – | | | – | | | – | | | – | | | – | | | – | | | – | | | – | | | – | | | – | | | – | | | (120,855) | | | (120,855) | |
| Purchase of treasury stock, Note 16(b) | – | | | – | | | (2,451) | | | (116,800) | | | – | | | – | | | – | | | – | | | – | | | – | | | – | | | (119,251) | | | – | | | (119,251) | |
| Share-based payment transactions | – | | | – | | | 1,485 | | | 89,222 | | | 64,746 | | | – | | | – | | | – | | | – | | | – | | | – | | | 155,453 | | | – | | | 155,453 | |
| Release of optional reserve | – | | | – | | | – | | | – | | | (76,441) | | | – | | | – | | | – | | | – | | | – | | | – | | | (76,441) | | | – | | | (76,441) | |
| Non-controlling interest from Pacifico EPS, Note 2(a) | – | | | – | | | – | | | – | | | – | | | – | | | – | | | – | | | – | | | – | | | – | | | – | | | 57,177 | | | 57,177 | |
| Minority purchase | – | | | – | | | – | | | – | | | – | | | – | | | – | | | – | | | – | | | – | | | (9,142) | | | (9,142) | | | (8,783) | | | (17,925) | |
| | | | | | | | | | | | | | | | | | | | | | | | | | | | | | | | | | | | | | | | | | | | | | | | | | | | | | | | | | | | | | | | | | | | | | | | | | | | | | | | | | | |
| Attributable to Credicorp’s equity holders. | | | | |
| | | | | | | | | | | Other reserves | | | | | | | | |
| | | Treasury stock | | | | | | Instruments
that will not
be
reclassified to
income | | Instruments that will be reclassified to the
consolidated statement of income | | | | | | | | |
| Capital
stock | | Shares of
the Group | | Share-
based
payment | | Capital
surplus | | Reserves | | Investments
in equity
instruments | | Investments
in debt
instruments | | Cash
flow
hedge
reserve | | Insurance
reserves | | Foreign
currency
translation
reserve | | Retained
earnings | | Total | | Non-
controlling
interest | | Total
equity |
| Transfer of fair value reserve of equity instruments designated at FVOCI for sale | – | | | – | | | – | | | – | | | – | | | – | | | – | | | – | | | – | | | – | | | (8,336) | | | (8,336) | | | – | | | (8,336) | |
Dividends not collected | – | | | – | | | – | | | – | | | 1,314 | | | – | | | – | | | – | | | – | | | – | | | – | | | 1,314 | | | – | | | 1,314 | |
| Others | – | | | – | | | – | | | – | | | 14 | | | – | | | – | | | – | | | – | | | – | | | 2,825 | | | 2,839 | | | 1,473 | | | 4,312 | |
| Balances as of December 31, 2025 | 1,318,993 | | | (204,326) | | | (5,519) | | | 148,729 | | | 29,648,582 | | | 31,899 | | | 1,074,310 | | | 227 | | | (208,110) | | | (353,559) | | | 6,915,724 | | | 38,366,950 | | | 729,159 | | | 39,096,109 | |
The accompanying notes are an integral part of these consolidated financial statements.
CREDICORP LTD. AND SUBSIDIARIES
CONSOLIDATED STATEMENT OF CASH FLOWS
FOR THE YEARS ENDED DECEMBER 31, 2025, 2024 AND 2023
| | | | | | | | | | | | | | | | | | | | | | | |
| Note | | 2025 | | 2024 | | 2023 |
| | | S/(000) | | S/(000) | | S/(000) |
| | | | | | | |
| CASH AND CASH EQUIVALENTS FROM OPERATING ACTIVITIES | | | | | | | |
| Net result after income tax | | | 7,082,654 | | | 5,623,252 | | | 4,959,878 | |
| | | | | | | |
| Adjustment to reconcile net profit to net cash arising from operating activities: | | | | | | | |
| Provision for credit losses on loan portfolio | 7(c) | | 2,873,454 | | | 3,943,301 | | | 3,957,143 | |
| Depreciation and amortization | 9(a) and 10(a) | | 746,243 | | | 570,830 | | | 511,174 | |
| Depreciation of right-of-use assets | 11(a) | | 146,899 | | | 142,640 | | | 147,833 | |
| Depreciation of investment properties | 12(g) | | 8,803 | | | 9,098 | | | 8,115 | |
| Provision for sundry risks | 25 | | 149,651 | | | 315,214 | | | 95,873 | |
| Deferred income tax | 17(b) | | (125,724) | | | (54,943) | | | (76,088) | |
| Net gain on sale of securities | 21 | | (400,686) | | | (362,295) | | | (425,144) | |
| Impairment loss on goodwill | 10(b) | | — | | | 27,346 | | | 71,959 | |
| Net gain of trading derivatives | | | (51,917) | | | (156,195) | | | (53,665) | |
| Net gain from sale of property, furniture and equipment | 25 | | (37,636) | | | (68,037) | | | (1,654) | |
| Net gain from sale of foreclosed assets | | | (30,139) | | | (27,172) | | | 1,867 | |
| Expense for share-based payment transactions | 23 | | 149,037 | | | 104,848 | | | 83,328 | |
| Net gain from sale of loan portfolio | 25 | | (1,778) | | | (21,295) | | | (83,515) | |
| Intangible losses due to withdrawals and dismissed projects | 25 | | 79,335 | | | 131,142 | | | 96,978 | |
| Gain on remeasurement of previously held equity interest in Pacifico Entidad Prestadora de Salud | 25 | | (235,490) | | | — | | | — | |
| Others | | | 65,027 | | | 145,492 | | | 3,005 | |
| Net changes in assets and liabilities | | | | | | | |
| Net (increase) decrease in assets: | | | | | | | |
| Loans | | | (13,447,331) | | | (4,461,273) | | | (1,105,306) | |
| Investments at fair value through profit or loss | | | (204,871) | | | 412,376 | | | (456,626) | |
| Investments at fair value through other comprehensive income | | | 1,459,872 | | | (2,555,702) | | | (5,164,701) | |
| Cash collateral, reverse repurchase agreements and securities borrowings | | | (1,251,363) | | | 383,427 | | | (330,448) | |
| Sale of written off portfolio | | | 7,320 | | | 55,230 | | | 239,599 | |
| Claim filed with the Tax Authority | 12(a) and 31 | | (1,577,175) | | | — | | | — | |
| Other assets | | | (2,045,992) | | | (1,111,692) | | | 520,331 | |
| | | | | | | |
| Net increase (decrease) in liabilities | | | | | | | |
| Deposits and obligations | | | 17,248,164 | | | 13,286,449 | | | 2,271,524 | |
| Due to Banks and correspondents | | | 379,613 | | | (1,600,761) | | | 3,455,502 | |
| Payables from repurchase agreements and securities lending | | | (704,293) | | | (1,111,676) | | | (2,790,671) | |
| | | | | | | | | | | | | | | | | | | | | | | |
| Note | | 2025 | | 2024 | | 2023 |
| | | S/(000) | | S/(000) | | S/(000) |
| Bonds and notes issued | | | (4,054,938) | | | 348,532 | | | (2,213,122) | |
| Short-term and low-value lease payments | | | (143,855) | | | (118,156) | | | (108,357) | |
| Other liabilities | | | 5,183,948 | | | 2,375,248 | | | 2,604,047 | |
| Net income for the period after the net change in assets and liabilities, and adjustments | | | 11,266,832 | | | 16,225,228 | | | 6,218,859 | |
| Income tax paid | | | (2,660,631) | | | (1,703,135) | | | (2,139,140) | |
| Net cash flow from operating activities | | | 8,606,201 | | | 14,522,093 | | | 4,079,719 | |
| | | | | | | | | | | | | | | | | | | | | | | |
| Note | | 2025 | | 2024 | | 2023 |
| | | S/(000) | | S/(000) | | S/(000) |
| NET CASH FLOWS FROM INVESTING ACTIVITIES | | | | | | | |
| Proceeds from sale of property, furniture and equipment | | | 160,264 | | | 98,223 | | | 53,152 | |
| Proceeds from sale of investment property | | | 1,282 | | | 47,100 | | | — | |
| Collections for maturities and coupons of investment at amortized cost | | | 859,930 | | | 1,740,670 | | | 1,245,434 | |
| Purchase of property, furniture and equipment | 9 | | (284,710) | | | (310,144) | | | (322,371) | |
| Purchase of investment property | 12(g) | | (183,563) | | | (70,399) | | | (37,667) | |
| Purchase of intangible assets | 10(a) | | (983,971) | | | (801,290) | | | (828,803) | |
| Purchase of investment at amortized cost | | | (255,185) | | | (176,601) | | | (1,359,245) | |
| Acquisition of Pacifico EPS shares, net cash acquired | 2(a) | | (727,180) | | | — | | | (5,564) | |
| Termination of the Joint Venture Agreement | | | (180,000) | | | — | | | – | |
| Net cash flows from investing activities | | | (1,593,133) | | | 527,559 | | | (1,255,064) | |
| | | | | | | |
| NET CASH FLOWS FROM FINANCING ACTIVITIES | | | | | | | |
| Dividends paid | 16(e) | | (3,181,454) | | | (3,664,648) | | | (1,994,037) | |
| Dividends paid to non-controlling interest of subsidiaries | | | (120,855) | | | (106,777) | | | (62,051) | |
| Principal payments of leasing contracts | | | (152,899) | | | (152,693) | | | (157,386) | |
| Interest payments of leasing contracts | | | (37,169) | | | (22,828) | | | (25,574) | |
| Purchase of treasury stock | 16(b) | | (119,251) | | | (110,894) | | | (85,575) | |
| Purchase of non-controlling interest of subsidiaries | | | (17,925) | | | (36,781) | | | (1,773) | |
| Subordinated bonds, net | | | 1,791,983 | | | 2,284,200 | | | 62,044 | |
| Net cash flows from financing activities | | | (1,837,570) | | | (1,810,421) | | | (2,264,352) | |
| | | | | | | |
| Net increase of cash and cash equivalents before effect of changes in exchange rate | | | 5,175,498 | | | 13,239,231 | | | 560,303 | |
| Effect of changes in exchange rate of cash and cash equivalents | | | (3,771,899) | | | 410,258 | | | (760,651) | |
| Cash and cash equivalents at the beginning of the period | | | 47,570,103 | | | 33,920,614 | | | 34,120,962 | |
| Cash and cash equivalents at the end of the period | 4(a) | | 48,973,702 | | | 47,570,103 | | | 33,920,614 | |
| | | | | | | |
| Additional information | | | | | | | |
| Interest received | | | 19,973,931 | | | 19,896,077 | | | 18,658,791 | |
| Interest paid | | | (5,160,077) | | | (5,852,580) | | | (5,080,522) | |
| | | | | | | |
Reconciliation of liabilities arising from financing activities:
| | | | | | | | | | | | | | | | | | | | | | | | | | | | | | | | | | | | | | |
| | | | Changes that generate
cash flows | | Changes that do not generate cash
flows | | |
| 2025 | | As of January 1, 2025 | | Received | | Paid | | Exchange
difference | | Others | | As of December 31, 2025 |
| | S/(000) | | S/(000) | | S/(000) | | S/(000) | | S/(000) | | S/(000) |
| Subordinated bonds | | 8,016,712 | | | 4,842,529 | | | (3,050,546) | | | (967,963) | | | (3,013) | | | 8,837,719 | |
| Lease liabilities | | 404,817 | | | – | | | (190,068) | | | (31,727) | | | 429,237 | | | 612,259 | |
| | 8,421,529 | | | 4,842,529 | | | (3,240,614) | | | (999,690) | | | 426,224 | | | 9,449,978 | |
| | | | | | | | | | | | | | | | | | | | | | | | | | | | | | | | | | | | | | |
| | | | Changes that generate
cash flows | | Changes that do not generate cash
flows | | |
| 2024 | | As of January 1, 2024 | | Received | | Paid | | Exchange
difference | | Others | | As of December 31, 2024 |
| | S/(000) | | S/(000) | | S/(000) | | S/(000) | | S/(000) | | S/(000) |
| Subordinated bonds | | 5,680,120 | | | 2,284,200 | | | — | | | 48,509 | | | 3,883 | | | 8,016,712 | |
| Lease liabilities | | 512,579 | | | – | | | (175,521) | | | 3,986 | | | 63,773 | | | 404,817 | |
| | 6,192,699 | | | 2,284,200 | | | (175,521) | | | 52,495 | | | 67,656 | | | 8,421,529 | |
| | | | | | | | | | | | | | | | | | | | | | | | | | | | | | | | | | | | | | |
| | | | Changes that generate
cash flows | | Changes that do not generate cash
flows | | |
| 2023 | | As of January 1, 2023 | | Received | | Paid | | Exchange
difference | | Others | | As of December 31, 2023 |
| | S/(000) | | S/(000) | | S/(000) | | S/(000) | | S/(000) | | S/(000) |
| Subordinated bonds | | 5,738,414 | | | 284,944 | | | (222,900) | | | (150,568) | | | 30,230 | | | 5,680,120 | |
| Lease liabilities | | 578,074 | | | – | | | (182,960) | | | (8,627) | | | 126,092 | | | 512,579 | |
| | 6,316,488 | | | 284,944 | | | (405,860) | | | (159,195) | | | 156,322 | | | 6,192,699 | |
The accompanying notes are an integral part of these consolidated financial statements.
CREDICORP LTD. AND SUBSIDIARIES
NOTES TO THE CONSOLIDATED FINANCIAL STATEMENTS
AS OF DECEMBER 31, 2025 AND 2024
1 OPERATIONS
Credicorp Ltd. (hereinafter “Credicorp” or the “Group”) is a limited liability company incorporated in Bermuda in 1995 to act as a holding company and according to Bermuda’s economic substance regulation, Credicorp Ltd. as an independent legal entity, is considered a “Pure Equity Holding Entity” (PEHE). Credicorp’s activity is to maintain equity interests and receive passive income such as dividends, capital gains and other income from investments in securities.
In order to keep Credicorp's structure and organization fully aligned with the new legislation on economic substance approved by the Government of Bermuda on January 11, 2019, the decisions of the Credicorp Board of Directors will be limited to issues related to Credicorp's strategy, objectives and goals, main action plans and policies, annual budgets, business plans and control of their implementation, supervision of the main expenses, investments, acquisitions and disposals, among other “passive” decisions related to Credicorp. The authority to make decisions applicable to Credicorp's subsidiaries, such as the adoption of relevant strategic or management decisions, the assumption of expenses for the benefit of its affiliates, the coordination of group activities, and the granting of credit facilities in favor of its affiliates, it has been transferred to Grupo Crédito S.A., a subsidiary of Credicorp.
Credicorp, through its banking and non-banking subsidiaries and its subsidiary Pacífico S.A. Entidad Prestadora de Salud (hereinafter Pacífico EPS), offers a wide range of financial, insurance and health services and products, mainly throughout Peru and in other countries (see Note 3 (b). Its main subsidiary is Banco de Crédito del Perú (hereinafter “BCP” or the “Bank”), a multiple bank incorporated in Perú.
Credicorp’s legal address is Clarendon House 2 Church Street Hamilton, Bermuda; likewise, the main offices from where Credicorp’s businesses are managed are located at Calle Centenario N° 156, La Molina, Lima, Perú.
These consolidated financial statements were approved and authorized for issuance by Management and the Audit Committee on April 23, 2026. No significant events or transactions were identified between April 24, 2026 and April 27, 2026.
Credicorp is listed on the Lima and New York Stock Exchanges.
2 BUSINESS ACQUISITIONS
a) Acquisition of a majority interest in Pacífico EPS
On November 01, 2024 Credicorp entered into an agreement to acquire the 50.0 percent interest from Empresas Banmédica (“Banmédica” hereafter) in the partnership and participation agreement entered into in December 2014 between Pacifico Compañía de Seguros y Reaseguros S.A. (“Pacifico Seguros”) and Banmédica.
Pursuant to this agreement, Banmédica agreed to transfer its 50.0 percent interest in the private health insurance business in Peru (Joint Venture Agreement) to Pacifico Seguros. In addition, Banmédica agreed to transfer its 50.0 percent interest in Pacifico S.A. Entidad Prestadora de Salud (“Pacifico EPS”), which manages the corporate employee health insurance and medical services businesses in Peru, to Credicorp's subsidiary, Grupo Crédito S.A.
As of March 13, 2025, the Company completed the acquisition of the remaining 50.0 percent interest in Pacífico EPS (representing 24,627,219 shares) and 50.0 percent of the co-investment agreement with Banmédica. The consideration paid for the acquisition of the interest in Pacífico EPS amounted to S/950.9 million.
The business combination was recognized using the acquisition method in accordance with IFRS 3 "Business Combinations". A business combination achieved in stages requires the acquirer to remeasure its previously held equity interest at fair value at the acquisition date, with any resulting gain or loss recognized in profit or
loss. Accordingly, the Group remeasured its previously held interest in Pacífico EPS at fair value, recognizing a gain of S/235.5 million, see Note 25.
At the date of acquisition, the carrying amount and fair value of the identified assets and liabilities of the entities purchased were the following:
| | | | | | | | | | | | | | | | | |
| Carrying amount | | Fair value adjustments | | Fair value recognized at acquisition |
| S/(000) | | S/(000) | | S/(000) |
| | | | | |
| Assets | | | | | |
| Cash | 223,670 | | | – | | | 223,670 | |
| Investments | 320,161 | | | – | | | 320,161 | |
| Property, furniture and equipment, net, Note 9(a) | 522,895 | | | 208,821 | | | 731,716 | |
| Investment property, Note 12(g) | 948 | | | 5 | | | 953 | |
| Right-of-use assets, net, Note 11 | 128,049 | | | – | | | 128,049 | |
| Intangible assets, Note 10(a) | 27,036 | | | 681,571 | | | 708,607 | |
| Other assets | 484,974 | | | — | | | 484,974 | |
| Total assets | 1,707,733 | | | 890,397 | | | 2,598,130 | |
| | | | | |
| Liabilities | | | | | |
| Due to banks and correspondents | 15,795 | | | – | | | 15,795 | |
| Bonds and notes issued | 115,520 | | | – | | | 115,520 | |
| Lease liabilities | 156,245 | | | – | | | 156,245 | |
| Deferred tax liabilities, net | 2,375 | | | 262,667 | | | 265,042 | |
| Other liabilities | 615,150 | | | – | | | 615,150 | |
| Total liabilities | 905,085 | | | 262,667 | | | 1,167,752 | |
| Total net assets identified at fair value | 802,648 | | | 627,730 | | | 1,430,378 | |
| | | | | |
| Existing shareholding | | | | | (950,850) | |
| | | | | |
| Non-controlling interest | | | | | (57,177) | |
| | | | | |
| Goodwill arising on acquisition, Note 10(b) | | | | | 528,499 | |
| | | | | |
| Total purchase consideration | | | | | 950,850 | |
| | | | | |
| Analysis of cash flows on acquisition | | | | | |
| | | | | |
| Net cash acquired with the subsidiary (included in investing cash flows) | | | | | 223,670 | |
| Cash paid | | | | | (950,850) | |
| | | | | |
| Net cash flow on acquisition | | | | | (727,180) | |
The fair value at the acquisition date and the carrying amount of trade receivables amount to S/271.2 million, which are included under “other assets”, and the full contractual amounts were collected.
From the date of acquisition, Pacífico EPS has contributed S/524.4 million of net operating income and S/153.4 million to net profit before tax from the continuing operations of the Group. If the acquisition had taken place at the beginning of the year, net operating income from continuing operations would have been S/611.4 million and the profit before tax from continuing operations for the period would have been S/190.3 million.
The goodwill recognized reflects the market position of the acquired business and the anticipated benefits associated with its continuing operations. It is not expected to be deductible for income tax purposes.
b) Agreement to Acquire Shares of Helm Bank USA –
On December 29, 2025, Banco de Crédito del Perú (“BCP”) entered into a Stock Purchase Agreement (“SPA”) with the shareholders of Helm Bank USA to acquire 100.0 percent of the issued and outstanding shares of Helm Bank USA (“Helm Bank”). Pursuant to the terms of the SPA, BCP will pay an amount of US$180.0 million, subject to customary purchase price adjustments as of the closing date (“Purchase Price”).
Helm Bank is a community bank authorized to operate in the State of Florida, United States of America, by the Florida Office of Financial Regulation (“OFR”), regulated by the OFR, and is a member of the Federal Deposit Insurance Corporation (“FDIC”).
The transaction is subject to obtaining the required regulatory approvals in the United States from the OFR and the Federal Reserve (“FED”), and in Peru from the Superintendencia de Banca, Seguros y AFP (“SBS”), as well as the fulfillment of other customary closing conditions. As of the date of this report, such approvals remain pending.
3 MATERIAL ACCOUNTING POLICIES
The material accounting policies used in the preparation of Credicorp’s consolidated financial statements are detailed below:
a) Basis of presentation, use of estimates and changes in accounting policies -
The accompanying consolidated financial statements have been prepared in accordance with IFRS Accounting Standards as issued by the International Accounting Standards Board (IASB).
The consolidated financial statements as of December 31, 2025, and 2024, have been prepared following the historical cost criteria, except for investments at fair value through profit or loss, investments at fair value through other comprehensive income, financial assets designated at fair value through profit or loss, derivative financial instruments, and financial liabilities at fair value through profit or loss, which have been measured at fair value.
The consolidated financial statements are presented in Soles (S/), which is the functional currency of Credicorp Ltd and subsidiaries, see paragraph (c) below, and values are rounded to thousands of soles, except when otherwise indicated.
The preparation of the consolidated financial statements in accordance with IFRS Accounting Standards requires Management to make estimates and use assumptions that affect the reported amounts of assets, liabilities, revenues and expenses, as well as the disclosure of significant events in notes to the consolidated financial statements.
Estimates and judgments are continually evaluated and are based on historical experience and other factors, including expectations of future events that are believed to be reasonable under the current circumstances. The final results could differ from said estimates.
The most significant estimates included in the consolidated financial statements relate to the calculation of the expected credit loss allowance for the loan portfolio, in accordance with IFRS 9; the uncertainty regarding income tax treatments, in accordance with IFRIC 23; and the estimation of
the liability for life insurance contracts under the General Measurement Model, as established in IFRS 17.
Furthermore, other estimates exist, such as: valuation of investments, liabilities for incurred but not reported claims, useful life of intangibles, impairment of goodwill, of the allowance of the expected credit loss on investments at fair value through other comprehensive income and investments at amortized cost, the valuation of derivative financial instruments and deferred income tax. The accounting criteria used for these estimates are described below.
The Group has adopted the following standards and amendments for the first time for its annual period beginning on or after January 1, 2025, as described below:
(i) Amendments to IAS 21: Lack of Exchangeability
The amendments to IAS 21 “The Effects of Changes in Foreign Exchange Rates” specify how an entity should assess whether a currency is exchangeable and how it should determine a spot exchange rate when exchangeability does not exist. The amendments also require the disclosure of information that enables users of the financial statements to understand how the lack of exchangeability affects, or is expected to affect, the entity’s financial performance, financial position, and cash flows.
Management has estimated the exchange rate for the Bolivian subsidiaries by applying the commission established by the regulator to the exchange rate. See Note 30.2(a)(ii).
b) Basis of consolidation -
Investment in subsidiaries -
The consolidated financial statements comprise the financial statements of Credicorp and its Subsidiaries for all the years presented.
In accordance with IFRS 10 “Consolidated Financial Statements”, all entities over which the Group has control are subsidiaries. Control is achieved when the Group is exposed, or has rights, to variable returns from its involvement with the investee and has the ability to affect those returns through its power over the investee. The Group controls an investee if, and only if, it has:
-Power over the investee (i.e., existing rights that give it the current ability to direct the relevant activities of the investee),
-Exposure, or rights, to variable returns from its involvement with the investee, and
-The ability to use its power over the investee to affect its returns.
Generally, there is a presumption that a majority of voting rights results in control. To support this presumption and when the Group has less than a majority of the voting rights or similar rights of an investee, the Group considers all relevant facts and circumstances in assessing whether it has power over the investee, including:
-The contractual arrangement with the other holders of voting rights over the investee.
-Rights arising from other contractual arrangements.
-The Group’s voting rights and potential voting rights.
The Group assesses whether or not it controls an investee if the facts and circumstances indicate that there are changes in any of the elements of control. Consolidation of a subsidiary begins when the Group obtains control over the subsidiary and ceases when the Group loses control of the subsidiary. The consolidated financial statements include assets, liabilities, income and expenses of Credicorp and its subsidiaries.
The profit or loss for the period and each component of other comprehensive income are attributed to the owners of the parent and to non-controlling interests, even if this results in non-controlling interests having a
negative balance. When necessary, adjustments are made to the financial statements of subsidiaries to align their accounting policies with those of the Group.
All assets and liabilities, equity, income, expenses, and cash flows relating to transactions between members of the Group are fully eliminated on consolidation. Assets held in custody or under management by the Group, such as investment funds, private pension funds (AFP Funds), and others, are not part of the Group’s consolidated financial statements (see Note 3(w)).
Transactions with non-controlling interests -
A change in the ownership interest of a subsidiary, without a loss of control, is accounted for as an equity transaction and any resulting difference between the price paid and the amount by [which] the non-controlling interests are adjusted is recognized directly in the consolidated statement of changes in equity.
The Group does not record any additional goodwill after the purchase of the non-controlling interest, nor does it recognize a gain or loss from the sale of the non-controlling interest.
Loss of control -
If the Group loses control over a subsidiary, it derecognizes the carrying amount of the related assets (including goodwill) and liabilities, non-controlling interest and other components of equity, while any resultant gain or loss is recognized in profit or loss. Any residual investment retained is recognized at fair value.
Investments in associates -
An associate is an entity over which the Group has significant influence. Significant influence is the power to participate in the financial and operating policy decisions of the entity, but without exercising control over said policies.
The Group’s investments in its associates are initially recognized at cost and subsequently accounted for using the equity method. These investments are included in “Other assets” in the consolidated statement of financial position; the results arising from the application of the equity method are included in “Net gain on securities” in the consolidated statement of income.
As of December 31, 2025 and 2024, the following entities comprise the Group (the individual or consolidated figures of their financial statements are presented in accordance with IFRS Accounting Standards and before eliminations for consolidation purposes, except for the elimination of Credicorp’s treasury shares and its related dividends):
| | | | | | | | | | | | | | | | | | | | | | | | | | | | | | | | | | | | | | | | | | | | | | | | | | | | | | | | | | | | | | | | | | | | | | | | | | |
| Entity | | Activity and country of
incorporation | | Percentage of interest
(direct and indirect) | | Assets | | Liabilities | | Equity | | Net profit (loss) |
| | | | 2025 | | 2024 | | 2025 | | 2024 | | 2025 | | 2024 | | 2025 | | 2024 | | 2025 | | 2024 | | 2023 |
| | | | % | | % | | S/(000) | | S/(000) | | S/(000) | | S/(000) | | S/(000) | | S/(000) | | S/(000) | | S/(000) | | S/(000) |
| | | | | | | | | | | | | | | | | | | | | | | | |
| Grupo Crédito S.A. and Subsidiaries (i) | | Holding, Peru | | 100.00 | | | 100.00 | | | 241,448,365 | | | 231,724,646 | | | 203,624,697 | | | 197,418,592 | | | 37,823,668 | | | 34,306,054 | | | 6,475,332 | | | 5,179,505 | | | 4,562,831 | |
| Pacífico Compañía de Seguros y Reaseguros S.A and Subsidiaries (ii) | | Insurance, Peru | | 98.86 | | | 98.86 | | | 20,619,872 | | | 17,890,138 | | | 16,309,989 | | | 14,504,765 | | | 4,309,883 | | | 3,385,373 | | | 784,502 | | | 765,767 | | | 803,384 | |
| Atlantic Security Holding Corporation and Subsidiaries (iii) | | Capital Markets,
Cayman Islands | | 100.00 | | | 100.00 | | | 5,390,195 | | | 6,014,937 | | | 4,040,240 | | | 5,026,510 | | | 1,349,955 | | | 988,427 | | | 737,562 | | | 569,689 | | | 474,780 | |
| Credicorp Capital Ltd. and Subsidiaries (iv) | | Capital Markets and
Asset management,
Bermudas | | 100.00 | | | 100.00 | | | 6,707,397 | | | 5,235,733 | | | 5,395,856 | | | 4,070,432 | | | 1,311,541 | | | 1,165,301 | | | 100,479 | | | 58,501 | | | (135,495) | |
| CCR Inc.(v) | | Special purpose Entity,
Bahamas | | 100.00 | | | 100.00 | | | 202 | | | 260 | | | 1 | | | 4 | | | 201 | | | 256 | | | (55) | | | (22) | | | (106) | |
(i)Grupo Crédito is a company whose main activities are to carry out management and administration activities of the Credicorp Group’s subsidiaries and invest in shares listed on the Peruvian Stock Exchange and unlisted shares of Peruvian companies. we present the individual or consolidated figures of their financial statements
are presented in accordance with IFRS Accounting Standards and before eliminations for consolidation purposes:
| | | | | | | | | | | | | | | | | | | | | | | | | | | | | | | | | | | | | | | | | | | | | | | | | | | | | | | | | | | | | | | | | | | | | | | | | | |
| Entity | | Activity and country of
incorporation | | Percentage of interest
(direct and indirect) | | Assets | | Liabilities | | Equity | | Net profit (loss) |
| | | | 2025 | | 2024 | | 2025 | | 2024 | | 2025 | | 2024 | | 2025 | | 2024 | | 2025 | | 2024 | | 2023 |
| | | | % | | % | | S/(000) | | S/(000) | | S/(000) | | S/(000) | | S/(000) | | S/(000) | | S/(000) | | S/(000) | | S/(000) |
| | | | | | | | | | | | | | | | | | | | | | | | |
Banco de Crédito
del Perú and Subsidiaries (a) | | Banking, Peru | | 97.74 | | | 97.74 | | | 219,933,373 | | | 211,086,260 | | | 191,487,370 | | | 184,934,666 | | | 28,446,003 | | | 26,151,594 | | | 6,500,570 | | | 5,311,804 | | | 4,583,662 | |
Inversiones
Credicorp Bolivia S.A. and Subsidiaries (b) | | Banking, Bolivia | | 99.92 | | | 99.96 | | | 10,910,443 | | | 14,028,528 | | | 10,144,528 | | | 13,106,538 | | | 765,915 | | | 921,990 | | | 85,379 | | | 92,781 | | | 84,898 | |
| Prima AFP (c) | | Private pension fund
administrator, Peru | | 100.00 | | | 100.00 | | | 684,509 | | | 657,971 | | | 231,235 | | | 182,419 | | | 453,274 | | | 475,552 | | | 146,543 | | | 132,926 | | | 149,549 | |
| Tenpo SpA and Subsidiaries (d) | | Holding, Chile | | 100.00 | | | 100.00 | | | 2,063,256 | | | 903,698 | | | 1,708,824 | | | 646,952 | | | 354,432 | | | 256,746 | | | (148,391) | | | (118,344) | | | (111,692) | |
| Yape Market (e) | | Digital platform for e‑commerce, Peru | | 100.00 | | | 100.00 | | | 149,960 | | | 119,137 | | | 69,283 | | | 60,567 | | | 80,677 | | | 58,570 | | | (7,993) | | | (35,190) | | | (8,345) | |
| Krealo Management (f) | | Management and development of digital businesses and innovation, Peru | | 99.99 | | | 99.99 | | | 89,338 | | | 54,414 | | | 51,766 | | | 7,175 | | | 37,572 | | | 47,239 | | | (72,029) | | | (55,679) | | | — | |
| Compañía Incubadora de Soluciones Móviles S.A - Culqi (g) | | Payment Processing Services, Peru | | 100.00 | | | 100.00 | | | 225,546 | | | 200,890 | | | 171,339 | | | 134,725 | | | 54,207 | | | 66,165 | | | (62,458) | | | (90,040) | | | (89,075) | |
| Other minors Subsidiaries (h) | | | | | | | | 3,054 | | | 2,715 | | | 1,105 | | | 570 | | | 1,949 | | | 2,145 | | | (836) | | | (1,194) | | | (565) | |
a) BCP was established in 1889 and its activities are regulated by the Superintendency of Banks, Insurance and Pension Funds -Perú (the authority that regulates banking, insurance and pension funds activities in Perú, hereinafter “the SBS”).
Its main Subsidiary is Mibanco, Banco de la Microempresa S.A. (hereinafter “MiBanco”), a banking entity in Perú oriented towards the micro and small business sector. As of December 31, 2025, the assets, liabilities, equity and net result of Mibanco amount to approximately S/18,372.4 million, S/15,570.4 million, S/2,802.0 million and S/455.3 million, respectively (S/16,947.3 million, S/14,279.3 million, S/2,668.0 million and S/309.1 million, respectively December 31, 2024).
b) Inversiones Credicorp Bolivia S.A. (hereinafter “ICBSA”) was established in February 2013 and its objective is to make capital investments for its own account or for the account of third parties in companies and other entities providing financial services, exercising or determining the management, administration, control and representation thereof, both nationally and abroad, for which it can invest in capital markets, insurance, asset management, pension funds and other related financial and/or stock exchange products.
Its principal Subsidiary is Banco de Crédito de Bolivia (hereinafter “BCB”), a commercial bank which operates in Bolivia. As of December 31, 2025, the assets, liabilities, equity and net result of BCB were approximately S/10,865.5 million, S/10,046.5 million, S/819.0 million and S/85.9 million, respectively (S/13,974.7 million, S/12,968.7 million, S/1,006.0 million and S/93.5 million, respectively as of December 31, 2024).
c) Prima AFP is a private pension fund administrator, and its activities are regulated by the SBS.
d) Tenpo SpA (hereinafter “Tenpo", before “Krealo SpA”) was established in Chile in January 2019; and is oriented to make capital investments outside the country. On July 1, 2019, Tenpo (Krealo SpA) acquired Tenpo Technologies SpA (before “Tenpo SpA”) and Tenpo Prepago S.A. (before “Multicaja Prepago S.A.”). This group of companies offers certain financial products and is currently undergoing the regulatory approval process before the Chilean Superintendency of Banks and Financial Institutions for the granting of a banking license and the establishment of Tenpo Bank.
e) Yape Market S.A.C. (“Yape Market”) was incorporated on July 1, 2022, and its main activity is to offering promotion, sales management, and product and service placement solutions through a digital commerce platform.
f) Krealo Management S.A. (hereinafter, “Krealo Management”) was incorporated in September 2022 and its objective is to make investments and participate in the equity of other domestic and foreign companies. Its subsidiaries are Wally POS S.A.C., Sami Shop S.A.C., and Monokera S.A.C.
g) Culqi was created in December 2013, and its principal activity is to provide digital payment processing services, which consist of collecting consumer payments through online or physical platforms.
h) Other minor subsidiaries include Inversiones 2020 S.A, and Soluciones en Procesamiento S.A.
(ii) Pacífico Seguros is an entity supervised by the SBS, whose economic activities include the underwriting and administration of general and life insurance policies, reinsurance operations, as well as real estate and financial investments. It has subsidiaries including Crediseguro Seguros Personales, Crediseguro Seguros Generales, Pacífico Asiste, and Pacífico EPS and its subsidiaries, which actively participate in the multiple insurance and health insurance businesses, respectively.
(iii)Its most important subsidiary is ASB Bank Corp. (merged with Atlantic Security Bank on August 2021, was established in September 9, 2020 in the Republic of Panama; its main activities are private and institutional banking services and trustee administration, mainly for BCP’s Peruvian customers.
(iv)Credicorp Capital Ltd. was formed in 2012, and its main subsidiaries are Credicorp Capital Holding Peru (owner of Credicorp Capital Perú S.A.A.), Credicorp Holding Colombia (owner of Credicorp Capital Colombia and Mibanco – Banco de la Microempresa de Colombia S.A.), and Credicorp Capital Holding Chile (owner of Credicorp Capital Chile), which carry out their activities in Peru, Colombia and Chile, respectively. We present below the consolidated financial statements in accordance with IFRS and before eliminations for consolidation purposes:
| | | | | | | | | | | | | | | | | | | | | | | | | | | | | | | | | | | | | | | | | | | | | | | | | | | | | | | | | | | | | | | | | | | | |
| Entity | | Percentage of interest
(direct and indirect) | | Assets | | Liabilities | | Equity | | Net profit (loss) |
| | 2025 | | 2024 | | 2025 | | 2024 | | 2025 | | 2024 | | 2025 | | 2024 | | 2025 | | 2024 | | 2023 |
| | % | | % | | S/(000) | | S/(000) | | S/(000) | | S/(000) | | S/(000) | | S/(000) | | S/(000) | | S/(000) | | S/(000) |
| | | | | | | | | | | | | | | | | | | | | | |
Credicorp Holding Colombia S.A.S. and
Subsidiaries (a) | | 100.00 | | | 100.00 | | | 5,518,459 | | | 4,204,281 | | | 4,591,242 | | | 3,404,834 | | | 927,217 | | | 799,447 | | | 88,288 | | | 27,913 | | | (163,342) | |
Credicorp Capital Holding Chile and
Subsidiaries (b) | | 100.00 | | | 100.00 | | | 841,116 | | | 717,727 | | | 673,028 | | | 548,753 | | | 168,088 | | | 168,974 | | | 1,345 | | | 9,460 | | | (10,716) | |
Credicorp Capital Holding Perú S.A. and
Subsidiaries (c) | | 100.00 | | | 100.00 | | | 293,616 | | | 278,115 | | | 124,127 | | | 111,448 | | | 169,489 | | | 166,667 | | | 21,215 | | | 21,958 | | | 4,318 | |
a) Credicorp Holding Colombia was incorporated in Colombia on March 5, 2012, and its main purpose is the administration, management and increase of its equity through the promotion of industrial and commercial activity, through investment in other companies or legal persons.
Its main subsidiaries are Credicorp Capital Colombia S.A, which was acquired in Colombia in 2012 and merged with Ultraserfinco S.A. In June 2020, this subsidiary is oriented to the activities of commission agents and securities brokers. Likewise, Mibanco Colombia (before Banco Compartir S.A.) was acquired in 2019 and merged with Edyficar S.A.S. in October 2020, this subsidiary is oriented to grant credits to
the micro and small business sector. As of December 31, 2023, Credicorp Holding Colombia has recognized an impairment of the goodwill of Mibanco Colombia for S/64.1 million (Credicorp’s equity holders), see Note 10(b).
As of December 31, 2025, and 2024, the direct and indirect interest held by Credicorp and the assets, liabilities, equity and net income were:
| | | | | | | | | | | | | | | | | | | | | | | | | | | | | | | | | | | | | | | | | | | | | | | | | | | | | | | | | | | | | | | | | | | | |
| Entity | | Percentage of interest
(direct and indirect) | | Assets | | Liabilities | | Equity | | Net profit (loss) |
| | 2025 | | 2024 | | 2025 | | 2024 | | 2025 | | 2024 | | 2025 | | 2024 | | 2025 | | 2024 | | 2023 |
| | % | | % | | S/(000) | | S/(000) | | S/(000) | | S/(000) | | S/(000) | | S/(000) | | S/(000) | | S/(000) | | S/(000) |
| | | | | | | | | | | | | | | | | | | | | | |
| Credicorp Capital Colombia S.A. | | 100.00 | | | 100.00 | | | 2,317,332 | | | 1,591,003 | | | 2,130,702 | | | 1,408,214 | | | 186,630 | | | 182,789 | | | 70,622 | | | 75,050 | | | 37,120 | |
Mibanco – Banco de la Microempresa de
Colombia S.A. | | 99.97 | | | 99.97 | | | 2,811,815 | | | 2,278,827 | | | 2,368,964 | | | 1,900,048 | | | 442,851 | | | 378,779 | | | 47,037 | | | (9,521) | | | (72,608) | |
b) Credicorp Holding Chile was incorporated in Chile on July 18, 2012, and aims to invest for long-term profitable purposes, in corporeal goods (movable and immovable property) and incorporeal, located in Chile or abroad. Its main subsidiary is Credicorp Capital Chile S.A.
c) Credicorp Capital Holding Perú S.A. was incorporated in Peru on October 30, 2014, and aims to be the Peruvian holding of investment banking. Its main subsidiary Credicorp Capital Perú S.A.A.; which has as its main activity the function of holding shares, participations and transferable securities in general, providing advisory services in corporate and financial matters, and investment in real estate.
(v)CCR Inc. was incorporated in the year 2000. Its main activity is to manage funding granted to BCP by foreign financial entities or investors. These loans matured in the course of 2022 and were guaranteed by transactions carried out by BCP.
c) Functional, presentation and foreign currency transactions –
(i) Functional and presentation currency -
Credicorp and its subsidiaries which operate in Peru consider the sol as their functional and presentation currency, since it reflects the nature of the economic events and relevant circumstances for most of the Group´s entities, given the fact their major transactions and operations, such as: loans granted, financing obtained, sale of insurance premiums, interests and similar income, interest and similar expenses, as well as a significant percentage of their purchases; are entered into and settled in soles.
(ii) Transactions and balances in foreign currency -
Foreign currency transactions are those entered into in currencies other than the functional currency of the entity. These transactions are initially recorded by Group entities at the exchange rates prevailing at the transaction dates. Monetary assets and liabilities denominated in foreign currency are adjusted at the exchange rate of the functional currency prevailing at each reporting date.
The differences arising from the exchange rate prevailing at each reporting date and the exchange rate initially used in recording transactions are recognized in the consolidated statement of income in the period in which they occur, in “Exchange differences result”, except for those that correspond to monetary items that are part of a hedging strategy of a net investment in a foreign operation, said accumulated difference is recognized within “Exchange differences on translation of foreign operations” in the consolidated statement of comprehensive income. Non-monetary assets and liabilities acquired in foreign currency are recorded at the exchange rate prevailing at the initial transaction date and are not subsequently adjusted.
(iii) Group entities with functional currency other than the presentation currency -
Given that the Group’s entities in Colombia, Chile, Cayman Islands, Bermuda, Panama, Bolivia, United States of America and Mexico have a functional currency different from the sol, the balances were translated into Soles for consolidation purposes in accordance with IAS 21, “The Effects of Changes in Foreign Exchange Rates” as follows:
-Assets and liabilities, at the closing rate prevailing at each reporting date.
-Income and expenses, at the average exchange rate for each month of the year.
All resulting exchange differences were recognized within “Exchange differences on translation of foreign operations”, including the differences in financial instruments designated as accounting hedges of said investments, in the consolidated statement of comprehensive income.
d) Recognition of income and expenses -
Banking activities -
Interest income and expenses:
Interest income is recorded using the effective interest rate (EIR) method for all financial instruments measured at amortized cost and at fair value through other comprehensive income. Interest expenses corresponding to liabilities measured at amortized cost are also recorded using the EIR.
The EIR is the rate that exactly discounts future cash flows that are estimated to be paid or received during the life of the instrument or a shorter period, if appropriate, to the gross carrying amount of the financial asset or financial liability. The EIR (and, therefore, the amortized cost of the financial asset or liability) is calculated taking into account any discount, premium and transaction costs that are an integral part of the effective interest rate of the financial instrument, but the expected credit loss is not included.
The Group calculates interest income by applying the EIR to the gross carrying amount of those financial assets that are not impaired.
When a financial asset becomes impaired and, therefore, is considered in Stage 3 (as set out in Note 3(i) impairment of financial assets), the Group calculates interest income by applying the interest rate effective at the carrying amount of the asset, net of its provision for credit loss. If the evidence that the criteria for the recognition of the financial assets in Stage 3 are no longer met, the Group recalculates interest income in gross terms.
Interest income and expenses accrued from all financial instruments that generate interest, including those related to financial instruments carried at fair value through profit or loss, are recorded under the heading “Interest and similar income” and “Interest and similar expenses” of the consolidated statement of income.
Commissions and fees:
Income from commissions (which are not an integral part of the EIR) and fees are recognized as they are earned. Commissions and fees include, among others, the commission charged for the banking service in general such as account maintenance, shipping, transfers, loan syndication fees and fees for contingent credits.
Income from commissions and fees is recognized at an amount that reflects the consideration to which the Group expects to be entitled in exchange for providing the services. Performance obligations, as well as the timing of their satisfaction, are identified and determined at the time of contract. The Group’s revenue contracts do not include multiple performance obligations.
When the Group provides a service to its clients, the consideration is invoiced and generally collected immediately after the provision of a service at a given time or at the end of the contract period for a service provided over time.
The Group has generally concluded that it is the principal in its revenue arrangements because it normally controls the services before transferring them to the client.
Medical services activities -
Revenue Recognition -
Revenue is recorded at the fair value of the consideration agreed upon, excluding taxes, and is recognized when no remaining obligations affect the customer’s acceptance of the service. Revenue corresponds to the transaction price allocated to each performance obligation and may include both fixed and variable amounts.
Medical Services:
Outpatient Services: Revenue is recognized at a specific point in time, upon completion of the medical service and issuance of the corresponding record and invoice.
Hospitalization and Emergency Services: Revenue is recognized over time as the service is rendered. Progress is measured using the cost‑plus‑margin percentage of completion method, in accordance with the agreement.
Sale of Pharmaceuticals:
Revenue is recognized at a specific point in time when control of the products is transferred, which coincides with their delivery.
Recognition of Costs and Expenses -
Costs: Recognized as medical services are rendered, medications are consumed, diagnostic tests are performed, or when the related revenue is recognized.
Expenses: Recorded when there is a decrease in future economic benefits resulting from a reduction of assets or an increase in liabilities, provided that the amounts can be measured reliably, regardless of the timing of payment.
Other income and expenses:
All other income and expenses are recorded in the period in which the performance obligation is satisfied.
e) Insurance activities -
Below is the Group’s accounting policy for its insurance activities:
Classification of insurance and reinsurance contracts:
Insurance contracts are those contracts when the Group (the insurer) has accepted a significant insurance risk from another party (the policyholder) by agreeing to compensate the policyholder if a specified uncertain future event (the insured event) adversely affects the policyholder. This definition also includes reinsurance contracts that the Group holds.
Once a contract has been classified as an insurance contract, it remains an insurance contract for the remainder of its lifetime, even if the insurance risk decreases significantly during this period, unless all rights and obligations are extinguished or expire. The life insurance contracts offered by the Group include retirement, disability, and survivorship insurance, annuity contracts, and individual life insurance contracts, including Investment Link insurance. The non-life insurance contracts issued by the Group mainly cover automobile, fire and allied lines, technical lines, and health insurance.
Accounting treatment of insurance and reinsurance contracts:
Separation of the components of insurance and reinsurance contracts -
The Group evaluates its insurance and reinsurance products to determine if they contain components that must be accounted for under another IFRS instead of IFRS 17.
After separating the various components, an entity must apply IFRS 17 to all remaining components of the (host) insurance contract.
Currently, the Group’s products do not include differentiated components that require separation.
Investment components are the amounts that an insurance contract requires an insurer to reimburse a policyholder in all circumstances, even if an insured event does not occur.
Investment components that are highly interrelated with the insurance contract of which they form part are considered non‑distinct and are not accounted for separately. However, the receipts and payments of the investment components are excluded from the income and expenses of the insurance activity.
Some reinsurance contracts issued contain profit commission arrangements. Under these agreements, there is a guaranteed minimum amount that the policyholder will always receive, whether in the form of profit commission, claims, or other contractual payment, regardless of whether the insured event occurs.
The components of the profit commission are assessed to be highly interrelated with the insurance component of reinsurance contracts so that they are considered non-distinct investment components so that separate accounting is not required. However, receipts and payments of these investment components are recognized outside of profit or loss.
Aggregation level and classification -
The grouping of contracts into units of account is performed based on product types, currency, onerousness, and year of issuance, as they share similar risks, are managed collectively, and no contract portfolio may include contracts issued more than one year apart.
The Group classifies a portfolio of insurance and reinsurance contracts into two categories based on the expected profitability at the policy or contract level at the time of recognition, using reasonable and supportable information, as follows:
-Onerous contracts: A contract is classified as onerous when, at the initial recognition date, the present value of expected outflows exceeds the present value of expected inflows.
-Non-onerous contracts: These include contracts for which, at the initial recognition date, the present value of expected outflows is less than the present value of expected inflows.
It should be noted that a contract for accounting purposes may differ from what is considered a contract for other purposes (i.e. legal or management).
The expected return of these portfolios at inception is determined based on existing actuarial valuation models that consider new and existing businesses.
Recognition of insurance and reinsurance contracts -
The Group recognizes a group of insurance contracts issued when the earliest of the following events occurs:
-The beginning of the coverage period of the group of contracts.
-The maturity date of the policyholder’s first payment within the group.
-For a group of onerous contracts, as soon as the facts and circumstances indicate that the group is onerous.
The Group recognizes reinsurance contracts held when any of the following events occurs:
-In all other cases from the beginning of the coverage period of the group of reinsurance contracts maintained.
-The date the Group recognizes an onerous group of underlying insurance contracts if the Group entered into the related reinsurance contract held in the group of reinsurance contracts held at or before that date.
Whether the reinsurance contracts held provide proportional coverage at the beginning of the coverage period of the group of reinsurance contracts held or at the initial recognition of any underlying contract, whichever is later.
Contract boundary -
The Group includes in the measurement of a group of insurance contracts all future cash flows within the limit of each contract in the group. Cash flows are within the limits of an insurance contract if they arise from substantive rights and obligations that exist during the reporting period in which the Group has a substantive obligation to provide the policyholder with insurance services insurance contract.
The substantive obligation to provide the services of the insurance contract ends when:
-The Group has the practical ability to reassess the risks of the particular policyholder and, as a result, can establish a price or level of benefits that fully reflects those risks.
-The following two criteria are met:
-The Group has the practical ability to reassess the risks of the portfolio of insurance contracts contained in the contract and, as a result, can establish a price or profit level that fully reflects the risk of that portfolio.
-The price of the premium until the date of re-evaluation of the risks does not consider the risks that relate to periods after the date of reassessment.
A liability or asset related to expected premiums or claims outside the limit of the insurance contract is not recognized. These amounts refer to future insurance contracts.
For life contracts with renewal periods, the Group assesses whether the premiums and related cash flows arising from the renewed contract are within the contract boundary.
Renewal prices are established by the Group considering all risks covered for the insured that would be considered when signing equivalent contracts on the renewal dates of the remaining service.
The Group re-evaluates each group’s contract boundary at the end of each reporting period.
Measurement at initial recognition -
General model (BBA) - Insurance contracts
The general model measures a group of insurance contracts as the total of:
-Fulfillment cash flows.
-A risk adjustment for non-financial risk.
-The contractual service margin (CSM) which represents the unearned technical profit that the Group will recognize as it provides services in the future.
Compliance cash flows comprise:
-Estimates of future cash flows considering their probability of occurrence.
-An adjustment to reflect the time value of money and the financial risks related to future cash flows.
The cash flows for each scenario are weighted according to the probability of their occurrence based on the experience of the Group’s portfolio and are discounted using current interest rate assumptions (risk-free curve + Matching Adjustment).
When estimating future cash flows, the Group includes all cash flows that are within the contract boundary, including:
-Premiums and related cash flows.
-Expected future claims and benefits:
-Payments to beneficiaries for the occurrence of insured events.
-Payments to policyholders resulting from the incorporated surrender and maturity options.
-Acquisition expenses attributable to the portfolio to which the contract belongs.
-Claim settlement expenses.
-Attributable policy maintenance expenses, including recurring commissions expected to be paid to intermediaries.
-An allocation of fixed and variable overhead expenses directly attributable to compliance with insurance contracts.
If at the time of initially estimating the fulfillment flows of a group of contracts a net outflow is obtained, these contracts become onerous contracts, and a liability will be recognized at that initial time in the statement of financial position. This amount is what we call the “loss component”.
A group of contracts that were not onerous on initial recognition may subsequently become onerous if assumptions change, even though the classification of their grouping or Unit of Account remains unchanged.
Simplified Model – initial recognition
The simplified model of the general method is the Premium Allocation Approach (PAA), which is applied by the Group for insurance and reinsurance contracts with a duration equal to or less than one year or for which the amount of the provision does not differ significantly of the general model.
If significant variability in cash flows from compliance is initially expected that would affect the measurement of the remaining coverage liability, the simplified method cannot be applied.
Under the premium allocation approach, the Group will assume that no contract is onerous unless the facts and circumstances indicate otherwise, which is why initially all contracts are grouped based on risk and how they are managed. To evaluate this possibility, a premium sufficiency test will be used that will evaluate the need to provide an additional provision and classify the Group of contracts as onerous (Onerousness Test).
For insurance contracts that apply the PAA approach, the Group initially recognizes written premiums net of commissions and deferred premiums as provision of remaining coverage (Liability for Remaining Coverage, LRC).
Post measurement – insurance contracts
The carrying amount of a group of insurance contracts after initial recognition will consist of:
(a)Liability for Remaining Coverage (LRC) comprising compliance cash flows, risk adjustment for non-financial risk and CSM of the Contract Group at the end of the reporting period.
(b)Incurred claims liability, which comprises compliance cash flows relating to the payment of reported and pending claims, incurred but not reported claims (IBNR) and claim settlement expenses. A risk adjustment for non-financial risk is also included.
The Group will recognize income or expenses for the variation in the carrying amount of the Liability for Remaining Coverage and the liability for claims incurred:
(a)Income from insurance activity: the reduction of the liability for the service provided in the period.
The CSM at the end of the reporting period represents the gain in the Insurance Contract Group that has not yet been recognized in profit or loss, because it relates to the future service to be provided.
For a group of insurance contracts without direct participation components, the carrying value of the CSM at the end of the reporting period is equal to the carrying value at the beginning of the reporting period adjusted as follows:
-The effect of new contracts added to the group. interest accrued on the carrying amount of the CSM during the reporting period, measured at the discount rates at initial recognition.
-Changes in compliance cash flows related to future service such as:
◦Adjustment for experience: it must be disaggregated to reflect the different factors that cause such adjustments in the expected future benefits of the Group:
•Adjustment in compliance flows due to claims experience is the variation in actual claims compared to expected claims. Likewise, this variation in the accident rate may lead to changes in the expected compliance flows. This variation will be recorded in a change in the CSM amount.
•Adjustment for variation in operating assumptions - A variation in the projection operating assumptions (mortality, expenses, rescues, etc.) will be recorded against the CSM for the period. This change will be cumulative with the adjustments made previously.
•Adjustment for premiums collected: Insurance premiums that relate to future service that have been received in the period require an adjustment to the contractual service margin. Likewise, an additional analysis must be carried out on the extraordinary contributions that the policyholder may make. Whether these new contributions made by the insured, different from regular premiums, should be considered new contracts or part of existing contracts. Therefore, it must be evaluated whether the new contributions are valued using the same conditions as at the beginning of the contract or if they are modified (mortality table, administration expenses, guaranteed rates, etc.).
-In the event that the conditions of the contract are not modified in the extraordinary contribution, that is, it has the same conditions as the original contribution, it is considered that the cash flows are within the limits of the contract, and therefore Both the variation in expected cash flows will be considered as a variation in experience.
-Changes in estimates of the present value of future cash inflows in the remaining coverage liability measured at discount rates.
-Differences between the investment components that are expected to become payable in the period and the actual investment component that becomes payable in the period, measured at discount rates.
-Changes in risk adjustment for non-financial risk that relates to future service.
-The effect of currency exchange differences on the CSM.
-The amount recognized as insurance income due to the transfer of insurance contract services in the period, determined by the allocation of the remaining CSM at the end of the reporting period (before any allocation) during the current coverage period and remaining.
The locked-in discount rate is the weighted average of the rates applicable at the date of initial recognition of contracts that joined a group over a 12-month period. The discount rate used for accretion of interest on the CSM is determined using the bottom-up approach at inception.
For a group of insurance contracts with direct participation components, the amount of CSM to be reported in the books will be obtained by applying a series of adjustments to the value of the CSM of the previous period:
-The effect of the new contracts added to the group.
-The entity’s participation in the change in the fair value of the underlying elements.
-Changes in compliance cash flows, such as a change in the entity’s loss experience and future expenses compared to those expected in the previous period.
-The effect of currency exchange differences on the CSM.
-The amount recognized as revenue from ordinary insurance activities due to the transfer of services in the period, determined by allocating the remaining contractual service margin at the end of the reporting period (before any allocation) over the current coverage period.
(b)Insurance activity expenses: for losses in onerous contract groups and reversals of these losses.
The Group will recognize a loss in the period’s results for the net outflow for the Group of onerous contracts, causing the Group’s liability book amount to equal the cash flows from compliance, with the Group’s contractual service margin being zero.
The loss component is released based on a systematic allocation of subsequent changes related to future service in compliance cash flows to:
(i)The loss component; and
(ii)the remaining coverage liability excluding the loss component. The loss component is also updated for subsequent changes related to future service in estimates of compliance cash flows and risk adjustment for non-financial risk.
Systematic allocation of subsequent changes to the loss component results in total amounts allocated to the loss component being zero at the end of the coverage period of a contract group.
(c)Financial expenses and income from insurance: for the time value of money and financial risk effect.
The Group disaggregates financial income or expenses for insurance contracts issued for its immediate annuity and term life portfolios between profit or loss and other compressive income.
The impact of changes in market interest rates on the value of life insurance and related reinsurance assets and liabilities is reflected in other compressive income to minimize accounting mismatches between the accounting for financial assets and insurance assets and liabilities. The Group financial assets supporting the insurance portfolios issued are predominantly measured at amortized cost or fair value with changes in other comprehensive income. Financial income or expenses from reinsurance contracts issued by the Group are not disaggregated because the related financial assets are managed on a fair value basis and are measured at fair value with changes in income.
Simplified model (premium allocation approach) -
The Group measures the carrying amount of the liability for remaining coverage at the end of each reporting period as the liability for remaining coverage at the beginning of the period:
-Plus, premiums received in the period.
-Minus insurance acquisition cash flows, with the exception of property insurance product line for which the Group chooses to expense insurance acquisition cash flows as they occur.
-Plus, any amounts relating to the amortization of the insurance acquisition cash flows recognized as an expense in the reporting period for the group.
-Minus the amount recognized as insurance revenue for the services provided in the period.
The Group estimates the liability for incurred claims as the fulfilment cash flows related to incurred claims. The fulfilment cash flows incorporate, in an unbiased way, all reasonable and supportable information available without undue cost or effort about the amount, timing and uncertainty of those future cash flows, they reflect current estimates from the perspective of the Group and include an explicit adjustment for non-financial risk (the risk adjustment). The Group does not adjust the future cash flows for the time value of money and the effect of financial risk for the measurement of liability for incurred claims that are expected to be paid within one year of being incurred.
Where, during the coverage period, facts and circumstances indicate that a group of insurance contracts is onerous, the Group recognizes a loss in profit or loss for the net outflow, resulting in the carrying amount of the liability for the group being equal to the fulfilment cash flows. A loss component is established by the Group for the liability for remaining coverage for such onerous group depicting the losses recognized.
The subsequent measurement of reinsurance contracts held follows the same principles as those for insurance contracts issued and has been adapted to reflect the specific features of reinsurance held.
Presentation -
For presentation in the consolidated statement of financial position, the Group aggregates insurance and reinsurance contract portfolios that are assets or liabilities and presents them separately in the following items:
-Reinsurance Contract Assets.
-Insurance Contract Liability.
The presentation in the statement of comprehensive income is as follows:
-Insurance service result (including insurance service income and expenses).
-Reinsurance service result (including income and expenses from reinsurance contracts).
-Net financial expenses from insurance activity, presented in interest and similar expenses, See Note 19.
Significant judgments and estimates -
The Group bases its assumptions and estimates on parameters derived from portfolio experience and these are used to prepare the financial statements. However, existing circumstances and assumptions about future developments could change due to changes in the market or circumstances beyond the Group’s control. Parameters are updated to reflect such changes in assumptions as necessary.
The Group reassesses the CSM in each period with the adjustment for the entity's experience. Parameters used for estimating future cash flows are a comparison between current and estimated rates, and the following hypotheses are evaluated: mortality, longevity, disability, expenses, lapses, and surrender rates.
For the measurement of the present value of future cash flows, it is necessary to define discount rates that consistently reflect the time value of money.
For the general model, it should be noted that in each valuation, it will be necessary to have two types of differentiated interest rates for discounting cash flows:
-Market rate or current valuation rate: the interest rate obtained from current market data and assumptions. The discount rate as of the valuation date will be equal to the risk-free rate of the corresponding currency plus the Matching Adjustment described later.
-Established initial rate or Locked-In Rate (LiR): an interest rate defined at the time of initial recognition of the insurance contract and will remain fixed until the termination of it, and will be used to:
-Measuring cash flows from fulfillment at initial valuation;
-Determining the amount of financial expenses or income from insurance included in the income statement for the period;
-Determining accrued interest on the CSM;
-Determining the portion of the financial effect on Cashflows that will be imputed to interest on liabilities;
-Measuring changes in the contractual service margin.
Insurance contract liabilities are calculated by discounting the expected future cash flows at a risk-free rate, plus an illiquidity premium when applicable. The risk-free rates are determined by reference to interest rate curves published by the SBS for contracts issued in soles and VAC soles, and by reference to U.S. Treasury bond yields for contracts issued in U.S. Dollars.
To determine the discount curve of the initial rate established on the date of initial recognition of the contract, the liquidity premium is determined using the Matching Adjustment methodology. This methodology is based on the assets themselves that cover the Group’s liabilities and is calculated as the IRR of the de-risked assets minus the IRR of the liabilities, minus the average “Cost of Downgrade” of the portfolio and an adjustment for the portfolio’s sub-investment grade investments. The Matching Adjustment is determined by product type and currency. The discount rates applied to discount future cash flows are summarized below:
| | | | | | | | | | | | | | | | | | | | | | | | | | | | | | | | | | | | | | | | | | | | | | | | | | | | | |
| 1 year | | 3 years | | 5 years |
| 2025 | | 2024 | | 2023 | | 2025 | | 2024 | | 2023 | | 2025 | | 2024 | | 2023 |
| | | | | | | | | | | | | | | | | |
| Soles | 4.68 | % | | 4.86 | % | | 5.98 | % | | 4.90 | % | | 5.41 | % | | 6.18 | % | | 5.42 | % | | 6.20 | % | | 6.62 | % |
| Soles VAC | 1.56 | % | | 1.69 | % | | 1.44 | % | | 2.10 | % | | 2.59 | % | | 3.13 | % | | 2.67 | % | | 3.18 | % | | 3.58 | % |
| Dollars | 4.99 | % | | 5.71 | % | | 6.52 | % | | 5.06 | % | | 5.82 | % | | 5.74 | % | | 5.24 | % | | 5.93 | % | | 5.57 | % |
| | | | | | | | | | | | | | | | | |
| 10 years | | 20 years | | | | | | |
| 2025 | | 2024 | | 2023 | | 2025 | | 2024 | | 2023 | | | | | | |
| | | | | | | | | | | | | | | | | |
| Soles | 6.74 | % | | 7.40 | % | | 7.12 | % | | 7.73 | % | | 7.88 | % | | 7.41 | % | | | | | | |
| Soles VAC | 3.55 | % | | 3.66 | % | | 3.91 | % | | 3.84 | % | | 3.91 | % | | 4.08 | % | | | | | | |
| Dollars | 5.69 | % | | 6.13 | % | | 5.61 | % | | 6.30 | % | | 6.41 | % | | 5.93 | % | | | | | | |
The other assumptions used in the determination of expected cash flows are:
- Mortality and morbidity rates
The assumptions are based on standard industry tables, depending on the type of contract entered into. They reflect recent historical experience and are adjusted where appropriate to reflect the Group’s own experiences. Mortality assumptions are differentiated in some products by gender of the insured, underwriting class and contract type.
An increase in expected mortality and morbidity rates would increase the expected cost of life insurance claims, which would reduce the Group’s expected future earnings.
- Longevity
Assumptions are based on industry standard Peruvian regulatory tables, adjusted where appropriate to reflect the Group’s own risk experience. For pensions, expected future longevity improvements are considered. Assumptions are differentiated by a number of factors including (but not limited to) policyholder gender, risk class and contract type. An increase in expected longevity rates would lead to an increase in the expected cost of immediate and future annuity payments, which would reduce the Group’s expected future earnings.
- Expenses
Operating expense assumptions reflect the projected costs of maintaining and servicing in-force policies and associated overhead. The current level of expenses is taken as an appropriate expense base, adjusted for expected expense inflation if applicable. An increase in the expected level of expenses would reduce the Group’s expected future earnings. Cash flows within the contract boundary include an allocation of fixed and variable overhead expenses directly attributable to the performance of the insurance contracts. Such overheads are allocated to groups of contracts using methods that are systematic and rational and are applied consistently to all costs that have similar characteristics.
- Lapse rates and surrenders
Forfeitures relate to the termination of policies due to non-payment of premiums. Surrenders relate to the voluntary termination of policies by policyholders to withdraw the surrender value of contracts. Policy termination assumptions are determined using statistical measures based on the Group’s experience and vary by product type, policy duration, distribution channel and market interest rate trends. An increase in lapse rates early in the life of the policy would tend to reduce the Group’s earnings, but subsequent increases have a broadly neutral effect.
f) Financial instruments: Initial recognition and subsequent measurement –
A financial instrument is any agreement that gives rise to a financial asset of one entity and a financial liability or equity instrument of another entity.
The Group determines the classification of its financial instruments at the time of initial recognition.
All financial instruments are initially recognized at their fair value plus the incremental costs related to the transaction that are directly attributable to the purchase or issuance of the instrument, except in the case of financial assets or liabilities carried at fair value through profit or loss.
Purchases or sales of financial assets that require delivery of the assets within a period established in accordance with regulations or conventions in the market (regular way purchases or sales) are recognized at the trade date, that is, the date on which the Group undertakes to buy or sell the asset.
As of December 31, 2025, and 2024, the Group classified financial assets into one of the categories defined by IFRS 9: financial assets at fair value through profit or loss, at fair value through other comprehensive income or at amortized cost based on:
-The business model to manage financial assets and
-The characteristics of the contractual cash flows of the financial asset
Business model -
It represents how financial assets are managed to generate cash flows and is not dependent on Management’s intention with respect to an individual instrument. Financial assets can be managed for the purpose of: i) obtaining contractual cash flows; ii) obtaining contractual cash flows and sale; or iii) others. To evaluate business models, the Group considers:
-The risks that affect the performance of the business model and, in particular, the way in which these risks are managed.
-How the performance of the business model and the financial assets held within this business model are evaluated and reported to key Group management personnel.
If cash flows after initial recognition are realized differently from the Group’s expectations, the classification of the remaining financial assets held in this business model is not modified.
When the financial asset is maintained in business models i) and ii) the application of the only principal and interest payments test is required - “SPPI”.
SPPI Test (Solely Payments of Principal and Interest) –
This test consists in the evaluation of the cash flows generated by a financial instrument to verify whether the contractual conditions of the financial asset arise, on specified dates to cash flows that are solely payments of principal and interest. To adapt to this concept the cash flows must solely include the consideration of the time value of money and the credit risk. If the contractual terms introduce risk exposure or cash flow volatility, such as the exposure to changes in the prices of capital instruments or the prices of raw materials, the financial asset is classified as at fair value through profit or loss. Hybrid contracts must be evaluated as a whole, including all the integrated characteristics. The accounting of a hybrid contract that contains an embedded derivative is carried out jointly, in other words, the entire instrument is measured at fair value through profit or loss.
(i)Financial assets at amortized cost –
A financial asset is classified as at amortized cost if the following conditions are met:
-It is held within a business model whose objective of which is to maintain the financial asset to obtain contractual cash flows, and
-The contractual conditions give rise, on specified dates, to cash flows that are solely payments of the principal and interest.
After initial recognition, financial assets in this category are measured at amortized cost, using the effective interest rate method, less any credit loss provision. The amortized cost is calculated taking into account any discount or premium incurred in the acquisition and fees that constitute an integral part of the effective interest rate. Interest income is included in the “Interest and similar income” item in the consolidated statement of income.
Financial assets at amortized cost include direct credits that are recorded when the funds are disbursed to clients, and indirect credits (contingent) that are recorded when the documents that support said credit facilities are issued. Likewise, the Group considers as refinanced or restructured those loans that change their payment schedule due to difficulties in payment by the debtor.
The impairment loss is calculated using the expected credit loss approach and is recognized in the consolidated statement of income within “Net gain on securities” for investments and in the item “Provision for credit losses on loan portfolio” for credits.
The balance of financial assets, measured at amortized cost, is presented net of the provision for credit losses in the consolidated statement of financial position.
(ii)Financial assets at fair value with changes in other comprehensive income –
The financial assets that the Group maintains in this category are: a) investments in debt instruments, and b) investments in equity instruments, for non-trading purposes, irrevocably designated as such at initial recognition.
Investments in debt instruments -
A financial asset is classified and measured at fair value through other comprehensive income when the following conditions are met:
-The financial asset is maintained within a business model whose objective is achieved by obtaining contractual cash flows and selling financial assets, and
-The contractual conditions give rise, on specified dates, to cash flows that are solely payments of principal and interest.
After initial recognition, investments in debt instruments are measured at fair value, recording unrealized gains and losses in the consolidated statement of comprehensive income, net of the corresponding income tax and non-controlling interest, until the investment is sold; in which the
accumulated gain or loss is recognized in the “Net gain on securities” item of the consolidated statement of income.
Interest is recognized in the consolidated statement of income in the item “Interest and similar income” and is reported as interest income using the effective interest rate method.
When a debt instrument is designated in a fair value hedging relationship, any change in fair value due to changes in the hedged risk is recognized in “Interest and similar income” in the consolidated statement of income.
Foreign exchange gains or losses related to the amortized cost of the debt instrument are recognized in the consolidated statement of income, and those related to differences between the amortized cost and the fair value are recognized as part of the unrealized gain or loss in the consolidated statement of comprehensive income.
The estimated fair value of investments in debt instruments is determined primarily based on quotes or, in the absence of these, on the basis of discounted cash flows using market rates consistent with the credit quality and maturity of the instruments.
An impairment loss of investments in debt instruments is calculated using the expected credit loss approach and is recognized in the consolidated statement of comprehensive income, charged to the item “Net gain on securities” in the consolidated statement of income, in this sense, it does not reduce the carrying amount of the financial asset in the consolidated statement of financial position, which is maintained at fair value. The impairment loss recognized in the consolidated statement of comprehensive income is reclassified to the consolidated statement of income when the debt instrument is derecognized.
Investments in equity instruments, not for trading, designated upon initial recognition (equity instruments designated at initial recognition) –
At initial recognition, the Group can make an irrevocable choice to classify equity instruments, which are not for trading, but held strategic purposes, as “At fair value through other comprehensive income”.
After initial recognition, the equity investments are measured at fair value, recording the unrealized gains and losses in the consolidated statement of comprehensive income, net of their corresponding income tax and non-controlling interest, until the investment is sold, whereupon the accumulated gain or loss is transferred to the item “Retained earnings” in the consolidated statement of changes in equity; in other words, they are not subsequently reclassified to the consolidated statement of income.
As a result, equity instruments classified in this category do not require a loss impairment evaluation.
Dividends are recognized when the right to collection has been established and are recorded in the “Interest and similar income” item in the consolidated statement of income.
(iii)Financial assets at fair value through profit or loss –
Financial assets must be classified and measured at fair value through profit or loss unless they are classified and measured at “Amortized cost” or “At fair value through other comprehensive income”.
The financial assets that the Group maintains in this category are: a) Investments in debt instruments, b) investments in equity instruments for trading purposes, c) financial assets designated at fair value with changes in results from the moment of their recognition. initial, and d) derivative financial instruments for trading purposes.
Debt instruments -
Such instruments are classified in this category because: a) they are held for trading purposes, or b) their cash flows are not solely payments of principal and interest.
After initial recognition, they are measured at fair value, recording the changes in the “Net gain on securities” item in the consolidated statement of income. The accrued interest is calculated using the contractual interest rate and is recorded in the “Interest and similar income” item in the consolidated statement of income.
Equity instruments -
Equity instruments are classified and measured at fair value through profit or loss, unless an irrevocable election is made, at initial recognition, to designate them at fair value through other comprehensive income.
After initial recognition, they are measured at fair value, recording the changes in the “Net gain on securities” item in the consolidated statement of income. Dividend income is recorded in the “Interest and similar income” item in the consolidated statement of income when the right to payment has been recognized.
Financial assets designated at fair value through profit or loss at initial recognition -
At the time of initial recognition, Management may irrevocably designate financial assets as measured at fair value through profit or loss if doing so eliminates or significantly reduces a measurement or recognition inconsistency that would otherwise arise from the measurement of the assets or liabilities or the recognition of their profits and losses on different bases.
After their initial recognition, they are measured at fair value, recording the changes in the consolidated statement of income.
As of December 31, 2025, and 2024, the Group classified financial liabilities at initial recognition as measured at amortized cost, except for financial liabilities at fair value through profit or loss. These liabilities include derivatives that are measured at fair value.
The interest incurred is accrued in the “Interest and similar income” item in the consolidated statement of income.
Likewise, at initial recognition, Management may irrevocably designate financial liabilities as measured at fair value through profit or loss when one of the following criteria is met:
-A measurement inconsistency that would otherwise arise when using different criteria to measure assets or liabilities is eliminated or significantly reduced; or
-They are part of a group of financial liabilities, which are managed, and their performance is evaluated on a fair value basis, in accordance with a documented investment or risk management strategy; or
-The financial liability contains one or more embedded derivatives that significantly modify the otherwise required cash flows.
(iv)Reclassification of financial assets and liabilities -
The reclassification of financial assets will take place whenever the business model for managing the financial assets changes. It is expected that this change will be very infrequent. These changes are determined by approval of the Group’s management as a result of external or internal changes, which must be significant to the Group’s operations and demonstrable to third parties. Financial liabilities are never reclassified.
When the Group changes its business model for managing financial assets, it will prospectively reclassify all affected financial assets from the date of reclassification. The Group will not restate previously recognized gains, losses, or interest (including gains or losses on impairment) recognized.
If the Group reclassifies:
-A financial asset from the amortized cost measurement category to the fair value through profit or loss category: its fair value will be measured at the reclassification date. Any gain or loss arising from differences between the previously amortized cost of the financial asset and the fair value will be recognized in profit or loss for the period.
-A financial asset from the fair value through profit or loss measurement category to the amortized cost category: its fair value at the reclassification date becomes its new gross carrying amount.
-A financial asset from the amortized cost measurement category to the fair value through other comprehensive income category: its fair value will be measured at the reclassification date. Any gain or loss arising from differences between the previously amortized cost of the financial asset and the fair value will be recognized in other comprehensive income. The effective interest rate and the measurement of expected credit losses will not be adjusted as a result of reclassification.
-A financial asset from the fair value through other comprehensive income measurement category to the amortized cost category, the financial asset will be reclassified at its fair value at the reclassification date. However, previously recognized accumulated gains or losses in other comprehensive income will be removed from equity and adjusted against the fair value of the financial asset at the reclassification date. As a result, the financial asset will be measured at the reclassification date as if it had always been measured at amortized cost. This adjustment affects other comprehensive income but not profit or loss for the period.
-A financial asset from the fair value through profit or loss measurement category to the fair value through other comprehensive income category, the financial asset will continue to be measured at fair value.
-A financial asset from the fair value through other comprehensive income measurement category to the fair value through profit or loss category, the financial asset will continue to be measured at fair value. The previously recognized accumulated gain or loss in other comprehensive income will be reclassified from equity to profit or loss for the period.
g) De-recognition of financial assets and liabilities –
Financial assets:
A financial asset (or, where applicable, a portion of a financial asset or a portion of a group of similar financial assets) is derecognized when: (i) the rights to receive cash flows from the asset have expired; or (ii) the Group has transferred its rights to receive cash flows from the asset or has assumed an obligation to pay the received cash flows in full immediately to a third party under a pass-through arrangement; and the Group has also transferred substantially all the risks and rewards of the asset, or has neither transferred nor retained substantially all the risks and rewards of the asset but has transferred control of the asset.
When contractual rights to receive cash flows from the financial asset have been transferred, or a transfer agreement has been entered into, the Group assesses whether it has retained, and to what extent, the risks and benefits inherent in ownership of the asset. When the Group has neither transferred nor retained substantially all risks and benefits inherent in ownership of the asset, nor transferred control of the asset, the Group continues to recognize the transferred asset to the extent of its continued involvement with the asset.
In that case, the Group also recognizes the related liability. The transferred financial asset and related liability are measured so as to reflect the rights and obligations that the Group has retained.
Continued involvement in the form of a guarantee over the transferred asset is measured as the lower of (i) the carrying amount of the asset, and (ii) the maximum consideration received that the Group would be required to repay.
Financial liabilities:
A financial liability is derecognized when the obligation to pay is discharged, cancelled, or expires. When an existing financial liability is exchanged for another from the same borrower under significantly different terms (fails the 10.0 percent test established in IFRS 9), or the terms are substantially modified, such exchange or modification is treated as a derecognition of the original liability and a new liability is recognized, with the difference between the carrying amount of the initial financial liability and the consideration paid recognized in the consolidated statement of comprehensive income.
h) Offsetting financial instruments -
Financial assets and liabilities are offset and the net amount is presented in the consolidated statement of financial position when there is a legally enforceable right to offset them and the Management intends to settle them on a net basis or to realize the asset and settle the liability simultaneously.
i) Impairment of financial assets -
As of December 31, 2025, and 2024, the Group applies a three-stage approach to measure the provision for credit losses, using an expected credit loss impairment model as set out in IFRS 9, for the following categories:
-Financial assets at amortized cost.
-Debt instruments classified as investments at fair value through other comprehensive income, and
-Indirect credits that are presented in accounts outside the consolidated statement of financial position.
Financial assets classified or designated at fair value through profit or loss and equity instruments designated at fair value through other comprehensive income are not subject to impairment assessment.
Financial assets migrate through three stages based on changes in credit risk from initial recognition.
Impairment model of expected credit losses -
Calculations of credit losses result from models with a series of underlying assumptions regarding the choice of variable inputs and their interdependencies. The expected credit loss impairment model reflects the present value of all cash shortfall events related to default events, either (i) over the following twelve months or (ii) over the expected life of a financial instrument depending on credit impairment from inception. The expected credit loss reflects a probability-weighted outcome considering a range of multiple outcomes based on reasonable and supported forecasts.
Provisions for credit losses will be measured at each reporting date following a three-stage expected credit loss model based on the degree of credit deterioration from inception:
-Stage 1: Financial assets whose credit risk has not increased significantly since initial recognition will recognize a reserve for losses equivalent to the credit losses expected to occur from defaults in the next 12 months. For instruments with a maturity of less than 12 months, a default probability corresponding to the remaining term to maturity is used.
-Stage 2: Financial assets that have experienced a significant increase in credit risk compared to initial recognition but are not considered impaired will recognize a loss reserve equivalent to the expected credit losses that are expected to occur during the remaining life of the asset.
-Stage 3: Financial assets with credit impairment at the reporting date will recognize a loss reserve equivalent to the expected credit losses over the entire life of the asset. Interest income will be recognized based on the carrying amount of the asset, net of the credit loss provision.
Measurement of expected loss –
The measurement of expected credit loss is primarily based on the product of the probability of default (PD), the loss given default (LGD), and the exposure at default (EAD), discounted to the reporting date and considering expected macroeconomic effects and all in accordance with the new regulations.
The details of these statistical parameters are the following:
-PD: It is an estimate of the probability of default over a specified time horizon. Default can only occur at a specific point in time during the estimated remaining life, provided the financial asset has not been derecognized previously and still remains in the portfolio.
-LGD: It is an estimate of the loss that occurs in the event of default at a given point in time. It is based on the difference between contractual cash flows owed and those the lender would expect to receive, including from the realization of any collateral. It is typically expressed as a percentage of the EAD.
-EAD: It is an estimate of exposure at a future default date, considering expected changes in exposure after the reporting date, including principal and interest repayments, either scheduled by contract or otherwise, and interest accrued for overdue payments.
The fundamental difference between credit loss considered in stage 1 and stage 2 is the PD horizon. Stage 1 estimates use a 12-month horizon, while those in stage 2 use an expected loss calculated with the remaining term of the asset and consider the effect of significant risk increase. Finally, in stage 3, the expected loss will be estimated based on the best estimate (“ELBE”), given the status of the collection process for each asset.
Changes from one stage to another –
The classification of an instrument as stage 1 or stage 2 depends on the concept of “significant increase in credit risk” on the reporting date compared with the origination date; in this sense, the definition used considers the following criteria:
-An account is classified in stage 2 if it has more than 30 days in arrears.
-If the probability of default (“PD”) at the reporting date exceeds the PD at the origination date by 50.0 percent (absolute thresholds) in all portfolios.
-If the PD at the reporting date exceeds the PD at the origination date at an individualized level for each risk level and by portfolio (relative thresholds).
Additionally, all accounts classified as defaults at the reporting date are considered stage 3. Assessments of significant risk increase from initial recognition and credit impairment are independently conducted at each reporting date. Assets can move in both directions from one stage to another. See further detail in Note 30.1(c).
Prospective Information –
The measurement of expected credit losses for each stage and the evaluation of significant increases in credit risk should consider information on past events and current conditions, as well as projections of future events and economic conditions. For the estimation of the risk parameters (PD, LGD and EAD), used in the calculation of the provision in stage 1 and 2, the significance of the macroeconomic variables (or their variations) that have the greatest influence on each portfolio was tested, which give a better prospective and systemic vision to the estimation, based on econometric techniques. These projections have a period of 3 years and, additionally, a long-term projection.
The estimate of the expected loss is a weighted estimate that considers three future macroeconomic scenarios. The base, optimistic and pessimistic scenarios are based on macroeconomic projections provided by the internal economic studies team and approved by Senior Management; these projections are made for the main countries where Credicorp operates. This same team also provides the probability of occurrence of each
scenario. It should be noted that the design of the scenarios is reviewed quarterly and may be more frequent if the environmental conditions so require.
Macroeconomic Factors –
In its models, the Group relies on a wide range of prospective information as economic inputs, such as gross domestic product (GDP) growth, unemployment rates, central bank base rates, among others. The inputs and models used to calculate expected credit losses may not always capture all market characteristics at the date of the financial statements. To reflect this, qualitative adjustments or overlays may be made using expert judgment.
Expected Lifetime –
For instruments in Stage 2 or 3, loss reserves will cover expected credit losses during the instrument’s lifetime. For most instruments, the expected lifetime is limited to the remaining term of the product, adjusted for expected prepayments. For revolving products, an analysis was conducted to determine the expected lifetime period.
Presentation of provision for credit losses in the consolidated statement of financial position –
-Financial assets measured at amortized cost: as a deduction from the gross carrying amount of financial assets;
-Debt instruments measured at fair value through other comprehensive income: no provision is recognized in the consolidated statement of financial position because the carrying amount of these assets is their fair value; however, the expected credit loss is presented in accumulated other comprehensive income;
-Indirect credits: the provision for credit loss is presented under “Other liabilities” in the consolidated statement of financial position.
Renegotiated Credits –
When a credit is modified, it is not considered past due but maintains its previous classification as impaired or unimpaired. If the borrower complies with the new agreement for the next six months, and the analysis of their repayment capacity supports a new risk rating improvement, the credit is classified as unimpaired. If after the credit is modified, the borrower defaults on the new agreement, it is considered impaired and past due. See further detail in Note 30.1(c).
j) Business Combinations –
Business combinations are accounted for using the acquisition method, as required by IFRS 3 “Business Combinations”. The acquisition cost is measured at the fair value of the consideration transferred at the acquisition date and the amount of any non-controlling interest in the acquiree. For each business combination, the Group elects whether to measure the non-controlling interest in the acquiree at fair value or at the non-controlling interest’s proportionate share of the acquiree’s identifiable net assets. Acquisition-related costs are expensed as incurred and included in “Administrative expenses” in the consolidated statement of income.
When the Group acquires a business, it assesses the financial assets and liabilities assumed for proper classification and naming in accordance with contractual terms, economic circumstances, and conditions relevant at the acquisition date. This includes the separation of implicit derivatives in contracts entered into by the acquiree.
Any contingency transferred by the acquirer must be recognized at its fair value at the acquisition date. The contingency classified as a financial instrument and within the scope of IFRS 9: "Financial Instruments" is measured at fair value with changes recognized in the consolidated statement of profit or loss. If the contingency does not fall within the scope of IFRS 9, it is measured in accordance with the applicable IFRS. A contingency classified as equity shall not be remeasured, and its subsequent settlement is accounted for within equity.
The acquisition of additional non-controlling interest is recognized directly in equity; the difference between the amount paid and the net assets acquired is recognized as an equity transaction. Therefore, the Group does not recognize any additional goodwill after acquiring the non-controlling interest, nor does it recognize a gain or loss on the sale of the non-controlling interest.
If there is a contractual obligation to acquire the shares of the non-controlling interest through a put option, the Group will initially recognize a liability at fair value through profit or loss equivalent to the fair value of the non-controlling interest against the "Reserves and others" account in equity. After initial recognition, the liability is measured at fair value, recording changes in the statement of profit or loss until the option is exercised. If the option expires without being exercised, the liability is derecognized, adjusting equity.
The equity attributable to the non-controlling interest is presented separately in the consolidated statement of financial position. Profit attributable to the non-controlling interest is presented separately in the consolidated statement of profit or loss and in the consolidated statement of comprehensive income.
If a business combination is achieved in stages, the carrying amount of the previous participation held in the acquiree is remeasured at fair value at the date of acquisition, with the resulting gains or loss recognized in profit or loss. Likewise, in accordance with IFRS 3, from the acquisition date of a company not under common control, the acquirer has a period of 12 months to make adjustments to the initial recognition of goodwill.
Combinations of Entities under Common Control
A business combination between entities or businesses under common control is outside the scope of IFRS 3, as it represents a business combination in which all entities or businesses being combined are ultimately controlled by the same party or parties, both before and after the business combination. In these transactions, the Group recognizes acquired assets under the pooling of interest method, whereby the assets and liabilities of the combined companies are reflected at their carrying values and no goodwill is recognized as a result of the combination.
The consolidated financial statements of the Group have been presented considering the aforementioned.
k) Intangible assets –
Comprise internally developed and acquired software licenses used by the Group. Acquired software licenses are measured upon initial recognition at cost and are amortized using the straight-line method over their estimated useful life.
Intangible assets resulting from business combinations are recognized in the consolidated statement of financial position at their fair values determined on the acquisition date and are amortized using the straight line method over their estimated useful life as follows:
| | | | | |
| Estimated useful life in years |
| Client relationship - Prima AFP (AFP Unión Vida) | 20.0 |
| Client relationship – Credicorp Capital Holding Chile (Inversiones IMT) | 22.0 |
| Client relationship - Ultraserfinco | 9.2 |
| Client relationship - Pacífico EPS and Medical Services | 10.0 |
| Brand - Mibanco | 25.0 |
| Brand - Joinnus | 20.0 |
| Brand - Culqi | 5.0 |
| Brand - Pacífico EPS and Medical Services | Indefinite |
| Fund manager contract - Credicorp Capital Colombia | 20.0 and 28.0 |
| Fund manager contract - Credicorp Capital Holding Chile (Inversiones IMT) | 11.0 and 24.0 |
| Fund manager contract - Ultraserfinco | 23.0 |
The period and the amortization method, for intangible assets are reviewed at the end of each period. If the expected useful life differs from previous estimates, the amortization period will be changed accordingly. If there has been a change in the expected pattern of conduct of the future economic benefits embodied in the asset, the amortization method shall be amended to reflect these changes.
Gains or losses arising from de-recognition of an intangible asset are measured as the difference between the net disposal proceeds and the carrying amount of the asset and are recognized in the consolidated statement of income when the asset is derecognized.
l) Goodwill –
Goodwill is the excess of the sum of the consideration transferred and the fair value recognized for the acquisition of the net assets acquired and liabilities assumed in a business combination. If the fair value of the net assets acquired exceeds the consideration transferred, the gain will be recognized in the consolidated statement of income.
After initial recognition, goodwill is measured at cost less accumulated impairment losses. For impairment testing purposes, goodwill acquired in a business combination is, from the acquisition date, allocated to each cash-generating unit (CGU) of the Group that is expected to benefit from the business combination, regardless of whether other assets or liabilities of the acquired entity have been allocated to these units.
If goodwill has been allocated to a cash-generating unit and part of the assets with which that unit operates is disposed of, the goodwill and the disposed assets are included in the transaction’s carrying amount when determining the loss or disposal. Under these circumstances, disposed goodwill is measured based on the relative value of the disposed assets and the portion of the retained cash-generating unit.
The impairment of goodwill is determined by evaluating the recoverable amount for each CGU (or group of CGUs) to which the goodwill relates. When the recoverable amount of the CGU is less than the carrying amount, an impairment loss is recognized. Impairment losses related to goodwill cannot be reversed in future periods.
m) Impairment of Non-Financial Assets –
The Group assesses, at each reporting date, whether there is any indication that an asset may be impaired in value. If there is any indication or when an annual impairment test of an asset is required, the Group estimates the recoverable amount of the asset. The recoverable amount of an asset is the higher of the asset or CGU’s
fair value less costs of disposal and its value in use and is determined for each asset individually, unless the asset generates cash flows that are largely independent of those of other assets or group of assets.
When the carrying amount of an asset or its CGU exceeds its recoverable amount, the asset or cash-generating unit is considered impaired and is reduced to its recoverable amount. When assessing the value in use, future cash flows are discounted to their present value using a pre-tax discount rate that reflects current market assessments of the time value of money and the specific risks of the asset. For the determination of fair value less costs of disposal, recent market transactions, if any, are taken into account. If such transactions cannot be identified, a valuation model that is appropriate is used. These calculations are verified against valuation multiples, stock quotes for subsidiaries listed on the stock exchange, and other available indicators of fair value.
For non-financial assets, excluding goodwill, an assessment is made at each reporting date of whether there are indications that previously recognized impairment losses may no longer exist or may have decreased. If such an indication exists, the Group estimates the recoverable amount. A previously recognized impairment loss is reversed only if there has been a change in the estimates used to determine the asset’s recoverable amount since the last impairment loss was recognized.
The reversal is limited so that the carrying amount of the asset does not exceed its recoverable amount, nor exceed the carrying amount that would have been determined net of depreciation, as if no impairment had been recognized in previous years. Such reversal is recorded in the consolidated statement of income.
n) Bank Acceptances –
Customer debt for acceptances corresponds to accounts payable by customers for import and export transactions, the obligations of which have been accepted by the Group. Obligations to be assumed by the Group are recorded as liabilities.
o) Financial Guarantees -
In the ordinary course of the Group’s operations, financial guarantees are granted, such as letters of credit, guarantees, bank acceptances and documentary credits for import and export. These financial guarantees are initially recognized at fair value, corresponding to the amount of the fee received for issuing them.
The nominal amounts associated with financial guarantees, letters of credit, guarantees, bankers’ acceptances and documentary credits for import and export are considered off‑balance‑sheet exposures, as they do not represent a contractual asset or liability for the Group. Consequently, they are not recognized at their nominal amount in the consolidated statement of financial position; however, they are subject to recognition and measurement in accordance with the requirements of IFRS 9, specifically for expected credit losses and/or initial fair value.
The premium received is recognized in the "Commissions and Fees" line item of the consolidated statement of income, based on its straight-line amortization over the term of the granted financial guarantee.
p) Provisions –
Provisions are recognized when the Group has a present obligation (legal or implicit) as a result of a past event, and it is probable that resources will be required to settle that obligation, and the amount can be reliably estimated.
The expense related to any provision is presented in the consolidated statement of income net of any reimbursement. If the effect of the time value of money is material, the provision is discounted using a current pre-tax rate that reflects, where appropriate, the specific risks of the liability. When discounting is used, the increase in the provision over time is recognized as a financial cost.
q) Contingencies –
Contingent liabilities are not recognized in the consolidated financial statements. These are disclosed in notes unless the likelihood of a payout is remote.
Contingent assets are not recorded in the financial statements; however, these are disclosed in the notes when an inflow of economic benefits is considered probable.
r) Income Tax –
Income tax is calculated based on the individual financial statements of each Group entity.
Deferred income tax reflects the effects of temporary differences between the carrying amounts of assets and liabilities for accounting purposes and those determined for tax purposes. Deferred assets and liabilities are measured using the tax rates expected to apply to taxable income in the years in which these differences are expected to be recovered or settled. The measurement of deferred assets and liabilities reflects the tax consequences derived from how Credicorp and its subsidiaries expect to recover or settle the value of their assets and liabilities at the date of the consolidated statement of financial position.
The carrying amount of deferred tax assets and liabilities may change, even when the amount of temporary differences has not changed, due to a change in the income tax rate. The effect of the change in deferred tax, corresponding to the rate change, will be recognized in the consolidated statement of income for the period, except for items previously recognized outside the consolidated statement of income (either in other comprehensive income or directly in equity).
Deferred tax assets and liabilities are recognized regardless of the time it is estimated that temporary differences are offset. Deferred assets are recognized when it is probable that there will be sufficient future taxable income for the temporary difference to be applied. At the date of the consolidated statement of financial position, Credicorp and its subsidiaries assess unrecognized deferred assets and the recoverability of recognized ones.
Credicorp and its subsidiaries determine their deferred tax based on the tax rate applicable to their undistributed profits, recognizing any additional tax for dividend distribution on the date the liability is recognized.
Deferred tax assets and liabilities are offset if there is a legal right to offset them and the deferred taxes are related to the same taxable entity and the same tax authority.
Uncertain Tax Treatments:
The Group continually assesses the likelihood that tax authorities will accept the tax treatments applied to its operations. In accordance with IFRIC 23 “Uncertainty over Income Tax Treatments”, this assessment involves determining whether each uncertain tax treatment should be evaluated individually or in conjunction with other related tax positions, applying the approach that most reliably reflects the expected outcome.
Additionally, the Group periodically reviews these judgments, especially when new facts, rulings, or criteria from the tax authority arise that may affect the original assessment. Any change in such judgments is recognized prospectively in the results of the period.
s) Earnings per Share –
Basic earnings per share are calculated by dividing the net income for the year attributable to Credicorp shareholders by the weighted average number of common shares outstanding during the period, excluding common shares purchased and held as treasury shares.
Diluted earnings per share are calculated by dividing the net income for the year attributable to Credicorp shareholders by the weighted average of common shares outstanding during the period, excluding common
shares purchased and held as treasury shares, plus the weighted average of common shares that would have been issued if all potential dilutive common shares had been converted into common shares.
t) Derivative financial instruments and hedge accounting –
Trading –
The Group trades derivative financial instruments to meet the needs of its clients. The Group may also take positions with the expectation of benefitting from favorable movements in prices, rates, or indices.
Part of the derivative transactions that provide effective economic hedges under the Group’s risk management positions do not qualify as hedges under the specific rules of IFRS 9 and are therefore treated as derivatives for trading purposes.
Derivative financial instruments are initially recognized in the consolidated statement of financial position at fair value and subsequently measured at fair value. Fair values are obtained based on market exchange rates and interest rates. All derivatives are considered assets when fair value is positive and liabilities when fair value is negative. Gains and losses from changes in fair value are recorded in the consolidated statement of income.
Hedging -
The Group uses derivative instruments to manage its exposure to interest rates and foreign currency. In order to manage specific risks, the Group applies hedge accounting for transactions that meet the specific criteria for it.
According to IFRS 9, to qualify as hedging transactions, all the following conditions must be met:
-The hedging relationship consists only of hedging instruments and eligible hedged items.
-At the beginning of the hedging relationship, there is a formal designation and documentation of the hedging relationship and the entity’s risk management objective and strategy to undertake the hedge. This documentation will include the identification of the hedging instrument, the hedged item, the nature of the risk being hedged, and how the entity will assess whether the hedging relationship meets the hedge effectiveness requirements.
The hedging relationship meets all of the following hedge effectiveness requirements:
-There is an economic relationship between the hedged item and the hedging instrument.
-The effect of credit risk does not dominate the value changes that come from this economic relationship.
-The hedge ratio of the hedging relationship is the same as that arising from the amount of the hedged item that the entity actually hedges and the amount of the hedging instrument that the entity actually uses to hedge that amount of the hedged item.
The accounting treatment is established according to the nature of the hedged item and the fulfillment of the hedging criteria.
(i)Cash flow hedges -
The effective portion of the cumulative gain or loss on the hedging instrument is recognized directly in other comprehensive income in the “Cash flow hedge reserves” line of the consolidated statement of changes in equity, and is reclassified to the consolidated statement of income in the same period or periods in which the hedged transaction affects results; that is, when the income or financial expenses related to the hedge are recorded, or when an anticipated transaction occurs.
The part of the gain or loss on derivatives that represents the ineffective portion is recognized immediately in the consolidated statement of income.
Amounts originally recorded in other comprehensive income and subsequently reclassified to the consolidated statement of income are recorded in the corresponding expense or income lines in which the hedged item is reported.
If the anticipated transaction or firm commitment is no longer expected to occur, the cumulative gain or loss in the cash flow hedge reserve is transferred to the consolidated statement of income. If the derivative expires or is sold, settled, or exercised without replacement or renewal, or if its designation as a hedge has been revoked, any unrealized gain or loss accumulated in the cash flow hedge reserve remains in that reserve until the anticipated transaction or firm commitment affects results. At the same time, the derivative is recognized as a tradable derivative financial instrument.
(ii)Fair value hedges -
The change in the fair value of a fair value hedge and the change in the fair value of the hedged item attributable to the hedged risk are recorded by affecting the carrying amount of the hedged item and are recognized in the consolidated statement of income.
For fair value hedges related to items recorded at amortized cost, any adjustment to the carrying amount of such items as a result of hedge discontinuation will be amortized through the consolidated statement of income over the remaining term of the hedge. Amortization at the effective interest rate may begin as soon as an adjustment occurs, but no later than when the hedged item is no longer adjusted for changes in its fair value attributable to the hedged risk.
If the hedged item is derecognized, the unamortized fair value is recognized immediately in the consolidated statement of income.
If a hedging instrument expires, is sold, settled, or exercised, or if its designation as a hedge no longer meets the criteria to be recorded as such, the hedging relationship is terminated. For fair value hedges related to items recorded at amortized cost, the difference between the fair value and the carrying amount of the hedged item at the end and the face value is amortized over the remaining term of the initial hedge, using the effective interest rate. If the hedged item is derecognized, the unamortized fair value is immediately recognized in the consolidated statement of income. At the same time, the derivative is recognized as a tradable derivative financial instrument.
(iii)Hedges of net investments in foreign operations –
Hedges of net investments in foreign operations are accounted for similarly to cash flow hedges.
Any gain or loss on the hedging instrument related to the effective portion of the hedge is recognized in other comprehensive income and accumulated in the “Translation of operations abroad” line of the consolidated statement of changes in equity. The gain or loss related to the ineffective portion is recognized immediately in the consolidated statement of income within “Other income” or “Other expenses”.
Accumulated gains and losses in the consolidated statement of changes in equity are reclassified to the consolidated statement of income when the net investment abroad is disposed of or partially sold.
(iv)Implicit derivatives -
Implicit derivatives in a principal (or host) contract are treated as separate derivatives and recorded at fair value if their economic characteristics and risks are not closely related to those of the principal contract and such principal contract is not held for trading or measured at fair value with effect on income.
The Group has investments indexed to certain liabilities from life insurance contracts, called “Investment Link”. These instruments have been classified by the Group since their initial recognition as “Financial assets designated at fair value through profit or loss”.
u) Fair value measurement -
Fair value is the price that would be received for selling an asset or that would be paid to transfer a liability in an orderly transaction between market participants at the measurement date. Fair value measurement is based on the assumption that the transaction to sell the asset or transfer the liability takes place, either:
-In the principal market for the asset or liability, or
-In the absence of a principal market, in the most advantageous market for the asset or liability.
The principal or most advantageous market must be accessible to the Group. Also, the fair value of a liability reflects its default risk.
When available, the Group measures the fair value of an instrument using the quoted price in an active market for that instrument. A market is considered active if transactions for the asset or liability occur with sufficient frequency and volume to provide pricing information on a continuous basis.
If there is no quoted price in an active market, the Group uses valuation techniques that maximize the use of relevant observable data and minimize the use of unobservable data.
The valuation technique chosen incorporates all factors that market participants would consider when setting the price of a transaction.
All assets and liabilities for which fair values are determined or disclosed in the consolidated financial statements are classified within the fair value hierarchy, described below, based on the lowest level of data used that is significant to the fair value measurement as a whole:
-Level 1: Quoted prices (unadjusted) in active markets for identical assets or liabilities.
-Level 2: Valuation techniques by which the lowest level of information that is significant to the fair value measurement is directly or indirectly observable.
-Level 3: Valuation techniques by which the lowest level of information that is significant to the fair value measurement is not observable.
The Group determines for assets and liabilities that are recognized at fair value in the consolidated financial statements on a recurring basis, whether transfers occurred between different levels within the hierarchy by reviewing the categorization at the end of each reporting period.
For fair value disclosure purposes, the Group has determined the classes of assets and liabilities based on the nature, characteristics, and risks of the asset or liability and the level of the fair value hierarchy as explained above.
Also, the fair value of financial instruments measured at amortized cost is disclosed in Note 30.11(b).
v) Segment information -
The Group reports financial and descriptive information about its reportable segments. Reportable segments are operating segments or aggregations of operating segments that meet specific criteria.
Operating segments are a component of an entity for which separate financial information is available and is evaluated periodically by the chief operating decision-maker (“CODM”) related to the allocation of resources and performance evaluation. The Group discloses the same financial information that is used internally to assess the performance of operating segments and decide how to allocate resources to segments, Note 27.
w) Fiduciary activities, fund management, and pension funds -
The Group provides custody, administration, investment management, and advisory services to third parties that result in holding or lending assets on their behalf. These assets and the results on them are excluded from the consolidated financial statements, as they are not Group assets, Note 30.12.
Commissions generated by this activity are included in the “Commissions and fees” line of the consolidated statement of income.
x) Cash and cash equivalents -
For the purposes of the consolidated statement of cash flows, cash and cash equivalents correspond to cash balances, funds deposited with central banks, “overnight” deposits, interbank funds, and deposits with maturities of three months or less from the acquisition date, excluding restricted funds, see Note 4(a).
Guarantee funds committed as part of a repurchase agreement are presented in the “Guarantee funds, repurchase agreements, and financing with securities” line of the consolidated statement of financial position, see Note 5(a).
Guarantee funds committed in trading of derivative financial instruments are presented in the “Other assets” line of the consolidated statement of financial position, see Note 12(c).
Unrealized gains and losses arising from changes in foreign currency exchange rates are not cash flows. However, the effect of exchange rate changes on cash and cash equivalents held or due in a foreign currency is reported in the statement of cash flows in order to reconcile cash and cash equivalents at the beginning and the end of the period. This amount is presented separately from cash flows from operating, investing and financing activities and includes the differences, if any, had those cash flows been reported at end of period exchange rates.
y) Repurchase and resale agreements and loans and financing with securities -
Securities sold under agreements to repurchase on a specific future date are not derecognized from the consolidated statement of financial position because the Group retains substantially all risks and benefits inherent in ownership. The cash received is recorded as an asset in the “Available funds” line, and the corresponding obligation to return it, including accrued interest, is recorded as a liability in the “Accounts payable for repurchase agreements and securities loans” line, reflecting the economic substance of the operation as a loan received by the Group. The difference between the selling price and the repurchase price is accrued during the contract term using the effective interest rate method and is recorded in the “Interest and similar expenses” line of the consolidated statement of income.
As part of this transaction, the Group delivers assets as collateral. When the counterparty receives securities and has the right to sell them or re-deliver them as collateral, the Group reclassifies these securities to the “Investments at fair value with changes in other comprehensive income under collateral” or “Investments at amortized cost under collateral” lines, as appropriate, in the consolidated statement of financial position. When the counterparty receives guarantee funds that will be restricted until the contract maturity, the Group reclassifies such cash to the “Guarantee funds, repurchase agreements, and financing with securities” line of the consolidated statement of financial position. When the counterparty receives credit portfolios as collateral, the Group maintains these credits in the “Credit portfolio, net” line in the consolidated statement of financial position, the control of which is kept in off-balance sheet accounts.
On the other hand, securities purchased under agreements to resell on a specific future date are not recognized in the consolidated statement of financial position. The cash granted is recorded as an outflow of an asset from the “Available funds” line, and the corresponding right to collect it, including accrued interest, is recorded in the “Guarantee funds, repurchase agreements, and financing with securities” line, reflecting the economic substance of the operation as a loan granted by the Group. The difference between the purchase price and the resale price is accrued during the contract term using the effective interest rate method and is recorded in the “Interest and similar income” line of the consolidated statement of income.
If securities purchased under a resale agreement are subsequently sold to third parties, the obligation to return the securities is recorded as a short sale in the “Financial liabilities at fair value with changes in income” line of the consolidated statement of financial position, and is measured at fair value, recording gains or losses in the “Net gain on securities” line of the consolidated statement of income.
Loans and financing are usually secured by securities. The transfer of securities to counterparties is only reflected in the consolidated statement of financial position if the risks and benefits inherent in ownership are also transferred.
z) International Financial Reporting Standards issued, but not yet effective -
The Group decided not to early adopt the following standards and interpretations that were issued but are not yet effective as of December 31, 2025.
-IFRS 18 - “Presentation and Disclosures in Financial Statements” –
On April 9, 2024, the IASB issued IFRS 18 “Presentation and Disclosure in Financial Statements,” which replaces IAS 1 and introduces new requirements aimed at improving the quality of information presented in the financial statements, and promoting analysis, transparency, and comparability of entities’ performance. In particular, IFRS 18 requires all income and expenses in the statement of profit or loss to be classified into five categories: operating, investing, financing, income taxes, and discontinued operations (with the first three categories being new). It also incorporates standardized subtotals to provide a more consistent structure to the statement of profit or loss. In addition, IFRS 18 introduces disclosure requirements for management-defined performance measures (MPMs) and establishes criteria for the aggregation and disaggregation of information primary financial statements and in notes. It also includes amendments to IAS 7 regarding the presentation of cash flows (e.g., the starting point of the indirect method and the classification of interest and dividends).
This new standard will come into force on January 1, 2027. Management is assessing the potential effects this could have on the Group’s financial statements.
-Amendments to IFRS 9 and IFRS 7 “Amendments to the classification and measurement of financial instruments” –
On May 30, 2024, the IASB issued amendments to IFRS 9 and IFRS 7, which include, among other aspects, clarifications on the requirements for the recognition and derecognition of financial assets and financial liabilities. The amendments also provide additional guidance on assessing the contractual cash flow characteristics of financial assets that incorporate ESG features or similar contingent characteristics, and clarify the scope of non-recourse financing arrangements and contractually linked instruments.
In addition, the amendments clarify that a financial liability is derecognized on the “settlement date” and introduce (under certain conditions) an accounting policy option that permits early derecognition of financial liabilities settled through an electronic payment system before the settlement date. Finally, the amendments introduce disclosure requirements for instruments with contingent features and additional disclosures for equity instruments classified at fair value through other comprehensive income.
The amendments are applicable for annual periods beginning on or after January 1, 2026. Management is assessing the potential effects they may have on the Group’s consolidated financial statements.
4 CASH AND DUE FROM BANKS
a) The composition of the item is presented below:
| | | | | | | | | | | |
| 2025 | | 2024 |
| S/(000) | | S/(000) |
| | | |
| Cash and clearing (b) | 5,286,242 | | | 4,892,244 | |
| Deposits with Central Reserve Bank of Peru (BCRP) (b) | 36,718,552 | | | 36,665,481 | |
| Deposits with Central Bank of Bolivia and Colombia (b) | 1,359,211 | | | 1,414,889 | |
| Deposits with foreign banks (c) | 4,529,356 | | | 3,841,338 | |
| Deposits with local banks (c) | 969,653 | | | 638,272 | |
| Interbank funds | 60,117 | | | 54,687 | |
| Accrued interest | 50,571 | | | 63,192 | |
| Total cash and cash equivalents | 48,973,702 | | | 47,570,103 | |
| Restricted funds | 70,755 | | | 85,093 | |
| Total cash | 49,044,457 | | | 47,655,196 | |
Cash and cash equivalents presented in the consolidated statement of cash flows exclude restricted funds, see Note 3(x).
b) Cash and clearing and deposits with Central Reserve Banks -
These accounts mainly include the legal cash requirements that Subsidiaries of Credicorp must be maintained able to honor their obligations with the public. The composition of these funds is as follows:
| | | | | | | | | | | |
| 2025 | | 2024 |
| S/(000) | | S/(000) |
| | | |
| Legal cash requirements | | | |
| Deposits with Central Reserve Bank of Peru (i) | 20,229,572 | | | 21,665,571 | |
| Deposits with Central Bank of Bolivia | 1,336,684 | | | 1,414,889 | |
| Deposits with Bank of the Republic of Colombia | 22,527 | | | – | |
| Cash in vaults of Bank | 4,793,787 | | | 4,420,164 | |
| Total legal cash requirements | 26,382,570 | | | 27,500,624 | |
| | | |
| Additional funds | | | |
| Overnight deposits with Central Reserve Bank of Peru (ii) | 14,756,380 | | | 14,049,388 | |
| Term deposits with Central Reserve Bank of Peru (iii) | 1,732,600 | | | 240,000 | |
| Cash in vaults of Bank and others | 492,455 | | | 472,080 | |
| Other Deposits BCRP | – | | | 710,522 | |
| Total additional funds | 16,981,435 | | | 15,471,990 | |
| Total | 43,364,005 | | | 42,972,614 | |
(i) As of December 31, 2025 cash and deposits that generate interest subject to legal cash requirements in Peru in local and foreign currency are subject to an implicit rate of 5.61 percent and 34.59 percent, respectively, on the total balance of obligations subject to legal cash requirements, as required by the BCRP (5.61 percent and 34.60 percent, respectively, as of December 31, 2024).
The reserve funds, which represent the minimum mandatory, do not earn interest; however, the mandatory reserve deposited in BCRP in excess of minimum mandatory, earns interest at a nominal rate established by BCRP.
As of December 31, 2025, the Group maintains interest rate swaps (IRS) which was designated as cash flows hedges of a portion of the additional reserve funds in U.S. Dollars at a variable interest rate, for or a notional amount of US$150.0 million, equivalent to S/504.5 million (US$150.0 million, equivalent to S/564.6 million as of December 31, 2024), see Note 12(c); through these IRS, this portion of the additional reserve funds in U.S. Dollars has been economically converted at a fixed rate.
In Management’s opinion, the Group has complied with the requirements established by current regulations related to the calculation of the legal reserve.
(ii) As of December 31, 2025, the Group maintains three overnight transactions with the BCRP: two U.S. Dollar-denominated transactions totaling US$ 4,260.0 million, equivalent to S/14,326.4 million, bearing an annual nominal interest rate of 3.57 percent; and one sol-denominated transaction for S/435.0 million, bearing an effective interest rate of 2.25 percent. All transactions mature in 5 days.
As of December 31, 2024, the Group maintains four "overnight" deposits with the BCRP, two are sol-denominated totaling S/435.0 million and two U.S. Dollar-denominated transactions totaling US$3,617.0 million, equivalent to S/13,614.4 million. To that date, the deposit in soles and deposits in U.S. Dollar accrue interest at annual rates of 3.00 percent and 4.44 percent, respectively, and have maturities at 3 days.
(iii) As of December 31, 2025, the Group maintains term deposits in soles, recording a total of S/1,732.6 million with a 5‑day maturity, ranging from 4.06 percent to 4.21 percent. As of December 31, 2024, the Group maintains term deposits with the BCRP amounting to S/240.0 million, which accrue annual interest between 4.81 percent and 4.84 percent.
c) Deposits with local and foreign banks -
Deposits with local and foreign banks mainly consist of balances in soles and U.S. Dollar; these represent cash on hand and earn interest at market rates. As of December 31, 2025, and 2024, Credicorp and its subsidiaries do not maintain significant deposits with any bank
5 CASH COLLATERAL, REVERSE REPURCHASE AGREEMENTS AND SECURITIES BORROWING AND PAYABLES FROM REPURCHASE AGREEMENTS AND SECURITIES LENDING
a) We present below the composition of cash collateral, reverse repurchase agreements, securities borrowing and financial transactions to be settled:
| | | | | | | | | | | | | | |
| 2025 | | 2024 | |
| S/(000) | | S/(000) | |
| | | | |
| Reverse repurchase agreement and security borrowings (i) | 1,400,487 | | | 670,454 | | |
Cash collateral on repurchase agreements and security lendings (ii) | 287,907 | | | 362,723 | | |
| Financial transactions to be settled (iii) | 488,806 | | | — | | |
| Total | 2,177,200 | | | 1,033,177 | | |
(i) Credicorp, through its subsidiaries, provides financing to its customers through reverse repurchase agreements and securities borrowing, in which a financial instrument serves as collateral. Details of said transactions are as follows:
| | | | | | | | | | | | | | | | | | | | | | | | | | | | | | | | | | | | | | | | | | | | | | | | | | | | | | | | | | | | | | | | | | | | | | | | | | | | | | | | |
| | | 2025 | | 2024 | |
| Currency | | Average interest rate | | Up to 3 days | | From 3 to 30 days | | More than 30 days | | Carrying amount | | Fair value of underlying assets | | Average interest rate | | Up to 3 days | | From 3 to 30 days | | More than 30 days | | Carrying amount | | Fair value of underlying assets | |
| | | % | | S/(000) | | S/(000) | | S/(000) | | S/(000) | | S/(000) | | % | | S/(000) | | S/(000) | | S/(000) | | S/(000) | | S/(000) | |
Instruments issued by the
Colombian Government(*) | Colombian pesos | | 8.27 | | | 105,484 | | | 878,326 | | | 26,166 | | | 1,009,976 | | | 997,089 | | | 8.09 | | | 174,598 | | | 274,114 | | | 154,743 | | | 603,455 | | | 594,096 | | |
| Instruments issued by the Chilean Government | Chilean
pesos | | 0.40 | | | 19,326 | | | – | | | – | | | 19,326 | | | 19,326 | | | — | | | – | | | – | | | – | | | – | | | – | | |
Other instruments | Several | | 1.80 | | | 78,985 | | | 292,200 | | | – | | | 371,185 | | | 347,484 | | | 2.64 | | | 34,065 | | | 9,562 | | | 23,372 | | | 66,999 | | | 66,993 | | |
| | | | | 203,795 | | | 1,170,526 | | | 26,166 | | | 1,400,487 | | | 1,363,899 | | | | | 208,663 | | | 283,676 | | | 178,115 | | | 670,454 | | | 661,089 | | |
(*) This mainly corresponds to Credicorp Capital Colombia, an entity that acquired sovereign financial instruments issued by the Government of Colombia, for an amount equivalent to S/817.7 million.
(ii) As of December 31, 2025, the balance mainly comprises cash guarantees in U.S. Dollar and Bolivianos. Cash guarantees were delivered to the Central Bank of Bolivia, received in Bolivianos and U.S. Dollar for the equivalent of S/275.3 million (S/343.6 million, as of December 31, 2024).
The guarantee fund accrues interest at an average annual effective rate in accordance with market rates. The liability related to this transaction is presented under the heading "Accounts payable for repurchase and lending agreements of securities" in the consolidated statement of financial position, see paragraph (c).
(iii) As of December 31, 2025, the Group reports accounts receivable arising from short sale transactions carried out with various financial counterparties. These transactions are pending settlement and are expected to be settled in the coming days.
b) Credicorp, through its subsidiaries, obtains financing through “Payables from repurchase agreements and securities lending” by selling financial instruments and committing to repurchase them at future dates, including interest at a fixed rate. The details of said transactions are as follows:
| | | | | | | | | | | | | | | | | | | | | | | | | | | | | | | | | | | | | | | | | | | | | | | | | | | | | | | | | | | | | | | | | | | | | | | | | | | | | |
| | | 2025 | | 2024 |
| Currency | | Average interest rate | | Up to 3 days | | From 3 to 30 days | | More than 30 days | | Carrying
amount | | Fair value of
underlying assets | | Average interest rate | | Up to 3 days | | From 3 to 30 days | | More than 30 days | | Carrying
amount | | Fair value of
underlying assets |
| | | % | | S/(000) | | S/(000) | | S/(000) | | S/(000) | | S/(000) | | % | | S/(000) | | S/(000) | | S/(000) | | S/(000) | | S/(000) |
| | | | | | | | | | | | | | | | | | | | | | | | | |
| Debt instruments (c) | Several | | – | | | 178,257 | | | 2,295,318 | | | 3,954,695 | | | 6,428,270 | | | 6,755,367 | | | – | | | 281,977 | | | – | | | 7,547,457 | | | 7,829,434 | | | 8,155,962 | |
Instruments issued by the
Colombian Government | Colombian Pesos | | 5.63 | | | 523,831 | | | 726,554 | | | – | | | 1,250,385 | | | 1,242,159 | | | 4.68 | | | 127,103 | | | 721,207 | | | – | | | 848,310 | | | 848,310 | |
Instruments issued by the
Chilean Government | Chilean pesos | | 0.38 | | | 116,167 | | | – | | | – | | | 116,167 | | | 116,197 | | | 0.46 | | | 83,375 | | | – | | | – | | | 83,375 | | | 83,398 | |
| Other instruments | Several | | 0.97 | | | 57,746 | | | 8,921 | | | 382,298 | | | 448,965 | | | 448,973 | | | 5.11 | | | 46,843 | | | 4,976 | | | 247,772 | | | 299,591 | | | 299,603 | |
| | | | | 876,001 | | | 3,030,793 | | | 4,336,993 | | | 8,243,787 | | | 8,562,696 | | | | | 539,298 | | | 726,183 | | | 7,795,229 | | | 9,060,710 | | | 9,387,273 | |
c) As of December 31, 2025, and 2024, the Group has repurchased agreements secured with: (i) cash, see Note 4(a) and (ii) investments, see Note 6(b). This item consists of the following:
| | | | | | | | | | | | | | | | | | | | | | | | | | | | | | | | | | | | | | | | | | | | |
| | | | 2025 | | 2024 |
| | | | | | Carrying | | | | | | Carrying | | |
| Counterparties | | Currency | | Maturity | | amount | | Collateral | | Maturity | | amount | | Collateral |
| | | | | | S/(000) | | | | | | S/(000) | | |
| | | | | | | | | | | | | | |
| BCRP | | Sol | | January 2026 / March 2026 | | 4,730,494 | | | Investments | | January 2025 / September 2025 | | 6,115,254 | | | Investments |
| Barclays Bank PLC | | U.S. Dollar | | March 2028 / December 2028 | | 508,149 | | | Investments | | − | | – | | | − |
| Natixis S.A. | | Sol | | August 2028 | | 270,000 | | | Investments | | August 2028 | | 270,000 | | | Investments |
| Banco Central de Bolivia | | Boliviano / U.S. Dollar | | March 2026 | | 236,527 | | | Cash / Investments | | March 2026 | | 343,571 | | | Cash |
| Banco Santander Perú | | Sol | | January 2026 | | 200,001 | | | Investments | | − | | – | | | − |
| Banco de la República de Colombia | | Colombian peso | | January 2026 | | 178,172 | | | Investments | | January 2025 | | 281,837 | | | Investments |
| Citigroup Global Markets Limited | | U.S. Dollar | | August 2026 | | 151,335 | | | Investments | | August 2026 | | 169,380 | | | Investments |
| Natixis S.A. | | U.S. Dollar | | August 2026 | | 84,075 | | | Investments | | August 2026 | | 94,100 | | | Investments |
| Barclays Capital I.N.C. | | Sol | | August 2028 | | 9,090 | | | Investments | | August 2028 | | 9,090 | | | Investments |
| BCRP - Reactiva Perú (*) | | Sol | | − | | – | | | Loans guaranteed by National Government | | May 2025 / December 2025 | | 459,775 | | | Loans guaranteed by National Government |
| BCRP - Reactiva Perú Especial (*) | | Sol | | − | | – | | | Loans guaranteed by National Government | | October 2025 / December 2025 | | 19,212 | | | Loans guaranteed by National Government |
| Balance before accrued interest | | | | | | 6,367,843 | | | | | | | 7,762,219 | | | |
| Accrued interest | | | | | | 60,427 | | | | | | | 67,215 | | | |
| Total | | | | | | 6,428,270 | | | | | | | 7,829,434 | | | |
(*)Relates to contract transactions whereby BCP and Mibanco sell representative credit instruments guaranteed by the Central Reserve Bank of Peru (BCRP), receive Peruvian soles, and are obligated to repurchase them at a later date. The representative credit instruments secured by the National Government guarantee may take the form of a portfolio of representative credit instruments or Participation Certificates in a trust of a loan portfolio guaranteed by the National Government (Special Reactiva). The BCRP will charge a fixed annual interest rate in Peruvian soles of 0.5 percent on the transaction and will include a twelve-month grace period with no payment of interest or principal. As of December 31, 2025, the Bank and its Subsidiaries do not maintain repurchase agreements secured by credits under the Reactiva Perú program (S/533.1 million as of December 31, 2024).
As of December 31, 2025, said operations accrue interest at fixed and variable rates between 3.9 percent and 9.3 percent and daily SOFR between 4.85 percent and 6.66 percent, (between 0.5 percent and 9.5 percent and daily SOFR between 7.02 percent and 7.24 percent, respectively, as of December 31, 2024).
6 INVESTMENTS
a) Investments at fair value through profit or loss consist of the following:
| | | | | | | | | | | | | | |
| 2025 | | 2024 | |
| S/(000) | | S/(000) | |
| | | | |
| Government bonds (i) | 1,940,978 | | | 1,685,543 | | |
| Investment funds (ii) | 1,498,168 | | | 1,401,956 | | |
| Mutual funds (iii) | 704,936 | | | 622,157 | | |
| Restricted mutual funds (iv) | 336,159 | | | 307,225 | | |
| Participation in RAL funds (v) | 125,393 | | | 432,503 | | |
| Corporate bonds (vi) | 87,644 | | | 75,601 | | |
| Shares | 84,806 | | | 71,425 | | |
| Bonds from financial organizations | 61,066 | | | 22,081 | | |
| Subordinated bonds | 35,678 | | | 24,587 | | |
| ETF (Exchange - Traded Fund) | 34,097 | | | 39,309 | | |
| Central Bank of Chile bonds | 25,478 | | | 11,355 | | |
| Others | 6,259 | | | 7,676 | | |
| Balance before accrued interest | 4,940,662 | | | 4,701,418 | | |
| Accrued interest | 16,574 | | | 13,925 | | |
| Total | 4,957,236 | | | 4,715,343 | | |
(i) As of December 31, 2025, and 2024 the balance of these instruments includes the following government treasury bonds:
| | | | | | | | | | | | | | |
| 2025 | | 2024 | |
| S/(000) | | S/(000) | |
| | | | |
| Colombian treasury bonds | 1,191,445 | | | 1,018,392 | | |
| Peruvian treasury bonds | 626,301 | | | 420,019 | | |
| Chilean treasury bonds | 123,232 | | | 87,505 | | |
United States of America treasury bonds | – | | | 73,338 | | |
Mexican treasury bonds | – | | | 43,334 | | |
Panama Government bonds | – | | | 42,955 | | |
| Total | 1,940,978 | | | 1,685,543 | | |
(ii) As of December 31, 2025, the balance corresponds mainly to investment funds in Peru, the United States of America, Colombia and other countries, which represent 62.4 percent, 21.3 percent, 11.2 percent, and 5.1 percent respectively. As of December 31, 2024, the balance corresponds mainly to investment funds in Peru, the United States of America, Colombia and other countries, which represent 59.6 percent, 27.5 percent, 9.5 percent and 3.4 percent respectively.
(iii) As of December 31, 2025, the balance corresponds to mutual funds from Bolivia, Chile, Ireland, Luxembourg and other countries, which represent 43.2 percent, 27.9 percent, 11.3 percent, 11.1 percent, and 6.5 percent of the total, respectively. As of December 31, 2024, the balance corresponds to mutual funds from Bolivia, Ireland, Luxembourg and other countries, which represent 63.3 percent, 12.5 percent, 12.5 percent and 11.7 percent of the total, respectively.
(iv) The restricted mutual funds comprise the participation quotas in the private pension funds managed by Prima AFP and are maintained in compliance with the legal regulations in Peru. Their availability is restricted and the yield received is the same as that received by the private pension funds managed.
(v) As of December 31, 2025, these funds are approximately Bs303.1 million, equivalent to S/121.1 million and US$1.3 million, equivalent to S/4.3 million. As of December 31, 2024, these funds are approximately Bs725.5 million, equivalent to S/398.1 million and US$9.1 million, equivalent to S/34.4 million; and include the investments made by the Group in the Central Bank of Bolivia as guarantee for deposits received from the public. These funds have restrictions for their use and are required from all banks in Bolivia.
(vi) As of December 31, 2025, this balance corresponds to corporate bonds from Colombia, Peru, Chile, Brazil, the United States of America and other countries, representing 40.6, percent, 21.2 percent, 9.8 percent, 8.0 percent, 5.6 percent and 14.8 percent of the total, respectively. As of December 31, 2024, the balance corresponds to corporate bonds from Peru, Chile, Colombia, Brazil and other countries, representing 30.6 percent, 23.9 percent, 15.7 percent, 11.7 percent and 18.1 percent of the total, respectively.
b) Investments at fair value through other comprehensive income consist of the following:
| | | | | | | | | | | | | | | | | | | | | | | | | | | | | | | | | | | | | | | | | | | | | | | |
| 2025 | | 2024 |
| | | Unrealized gross amount | | | | | | Unrealized gross amount | | |
| Cost | | Profits | | Losses | | Estimated fair value | | Cost | | Profits | | Losses | | Estimated fair value |
| S/(000) | | S/(000) | | S/(000) | | S/(000) | | S/(000) | | S/(000) | | S/(000) | | S/(000) |
| | | | | | | | | | | | | | | |
| Debts instruments: | | | | | | | | | | | | | | | |
| | | | | | | | | | | | | | | |
| Corporate bonds (i) | 13,253,965 | | | 350,709 | | | (384,360) | | | 13,220,314 | | | 14,481,834 | | | 159,106 | | | (535,597) | | | 14,105,343 | |
| Government bonds (ii) | 11,534,879 | | | 884,414 | | | (23,135) | | | 12,396,158 | | | 12,112,328 | | | 231,115 | | | (96,788) | | | 12,246,655 | |
Certificates of deposit BCRP (iii) | 10,883,913 | | | 1,263 | | | (1,146) | | | 10,884,030 | | | 11,431,599 | | | 4,542 | | | (384) | | | 11,435,757 | |
| Securitization instruments (iv) | 983,540 | | | 34,755 | | | (21,965) | | | 996,330 | | | 735,673 | | | 15,414 | | | (41,592) | | | 709,495 | |
| Negotiable certificates of deposit (v) | 231,724 | | | 2,408 | | | (2,862) | | | 231,270 | | | 416,236 | | | 5,247 | | | (3,676) | | | 417,807 | |
| Subordinated bonds | 189,880 | | | 5,439 | | | (2,501) | | | 192,818 | | | 171,618 | | | 2,329 | | | (5,482) | | | 168,465 | |
| Others | 461,555 | | | 3,516 | | | (2,634) | | | 462,437 | | | 367,348 | | | 1,231 | | | (2,023) | | | 366,556 | |
| 37,539,456 | | | 1,282,504 | | | (438,603) | | | 38,383,357 | | | 39,716,636 | | | 418,984 | | | (685,542) | | | 39,450,078 | |
| Equity instruments designated at the initial recognition | | | | | | | | | | | | | | | |
| | | | | | | | | | | | | | | |
| Shares issued by: | | | | | | | | | | | | | | | |
| Inversiones Centenario | 112,647 | | | – | | | (34,753) | | | 77,894 | | | 112,647 | | | – | | | (8,488) | | | 104,159 | |
| Corporación Andina de Fomento | 4,441 | | | 210 | | | – | | | 4,651 | | | 4,441 | | | 873 | | | – | | | 5,314 | |
| Holding Bursatil Chilena S.A. | 2 | | | – | | | – | | | 2 | | | 13,232 | | | 1,738 | | | – | | | 14,970 | |
| Holding Bursatil Regional S.A. | – | | | – | | | – | | | – | | | 20,599 | | | – | | | (6,023) | | | 14,576 | |
| Pagos Digitales Peruanos S.A. | 5,611 | | | – | | | (5,611) | | | – | | | 5,611 | | | – | | | (5,611) | | | – | |
| Others | 5,677 | | | 4,465 | | | (2,368) | | | 7,774 | | | 8,095 | | | 2,733 | | | (2,583) | | | 8,245 | |
| 128,378 | | | 4,675 | | | (42,732) | | | 90,321 | | | 164,625 | | | 5,344 | | | (22,705) | | | 147,264 | |
| | | | | | | | | | | | | | | |
| Balance before accrued interest | 37,667,834 | | | 1,287,179 | | | (481,335) | | | 38,473,678 | | | 39,881,261 | | | 424,328 | | | (708,247) | | | 39,597,342 | |
| Accrued interest | | | | | | | 560,371 | | | | | | | | | 545,296 | |
| Total | | | | | | | 39,034,049 | | | | | | | | | 40,142,638 | |
As of December 31, 2025, as a result of the evaluation of the loss due to impairment of investments at fair value through other comprehensive income, the Group has recorded a provision for expected credit losses of S/53.9 million (provision for credit losses of S/27.9 million as of December 31, 2024), which is presented in the item “Net gain on securities”, see Note 21, of the consolidated income statement. Likewise, Management has decided and has the ability to maintain each of these investments for a sufficient period of time to allow an early recovery of fair value, even before their recovery or maturity.
The maturities and annual market rates of investments at fair value through other comprehensive income as of 2025 and 2024, are as follows:
| | | | | | | | | | | | | | | | | | | | | | | | | | | | | | | | | | | | | | | | | | | | | | | | | | | | | | | | | | | | | | | | | | | | | | | | | | | | | | | | | | | | | | |
| Maturities | | Annual market rate of return | |
| 2025 | | 2024 | | 2025 | | 2024 | |
| | | | | S/ | | US$ | | Other currencies | | S/ | | US$ | | Other currencies | |
| | | | | Min | | Max | | Min | | Max | | Min | | Max | | Min | | Max | | Min | | Max | | Min | | Max | |
| | | | | % | | % | | % | | % | | % | | % | | % | | % | | % | | % | | % | | % | |
| | | | | | | | | | | | | | | | | | | | | | | | | | | | |
Corporate bonds | Jan-2026 / Nov-2095 | | Jan-2025 / Nov-2095 | | 2.47 | | | 10.80 | | | 2.64 | | | 11.78 | | | 2.94 | | | 7.50 | | | 3.14 | | | 16.62 | | | 3.90 | | | 44.18 | | | 2.28 | | | 7.50 | | |
| Government bonds | Jan-2026 / Jan-2062 | | Jan-2025 / Dec-2055 | | 2.09 | | | 6.57 | | | 4.33 | | | 8.90 | | | 4.19 | | | 4.19 | | | 2.83 | | | 7.08 | | | 2.97 | | | 9.95 | | | 4.19 | | | 4.19 | | |
Certificates of deposit BCRP | Jan-2026 / Jul-2027 | | Jan-2025 / Jun-2026 | | 3.96 | | | 4.21 | | | – | | | – | | | – | | | – | | | 4.24 | | | 4.93 | | | – | | | – | | | – | | | – | | |
| Securitization instruments | Nov-2026 / Jun-2050 | | Sep-2025 / Oct-2049 | | 3.67 | | | 22.73 | | | 3.76 | | | 11.42 | | | – | | | – | | | 3.99 | | | 20.86 | | | 5.17 | | | 23.94 | | | 5.80 | | | 6.00 | | |
| Negotiable certificates of deposits | Jan-2026 / Aug-2037 | | Feb-2025 / Nov-2037 | | – | | | – | | | – | | | – | | | 0.53 | | | 6.64 | | | – | | | – | | | – | | | – | | | 0.53 | | | 6.10 | | |
Subordinated bonds | May-2026 / Jun-2055 | | Apr-2025 / Jun-2055 | | 3.73 | | | 8.52 | | | 3.08 | | | 7.78 | | | – | | | – | | | 3.81 | | | 8.03 | | | 2.28 | | | 8.05 | | | – | | | – | | |
| Others | Jan-2026 / Feb-2035 | | Apr-2025 / Feb-2035 | | 2.55 | | | 4.56 | | | – | | | – | | | 0.91 | | | 9.59 | | | 2.55 | | | 3.42 | | | 7.50 | | | 7.67 | | | 0.90 | | | 4.25 | | |
Likewise, as of December 31, 2025, the Group has entered into repurchase agreements (Repos) on Government bonds, corporate bonds and BCRP certificates of deposit classified as investments at fair value with changes in other comprehensive income for an estimated market value of S/5,990.9 million (S/5,934.5 million as of December 31, 2024); whose related liability is presented in the item “Payables from repurchase agreements and securities lending” of the consolidated statement of financial position, see Note 5(c).
(i) As of December 31, 2025, the balance corresponds to corporate bonds issued by companies in the United States of America, Peru, Chile, Colombia and other countries, which represent 41.1 percent, 33.3 percent, 3.9 percent, 3.3 percent and 18.4 percent of the total, respectively. As of December 31, 2024, the balance corresponds to corporate bonds issued by companies in the United States of America, Peru, Colombia and other countries, which represent 42.2 percent, 33.2 percent, 3.6 percent and 21.0 percent of the total, respectively.
As of December 31, 2025, the Group holds interest rate swaps (IRS), which have been designated as fair value hedges of certain fixed-rate U.S. Dollar-denominated corporate bonds issued by corporate entities and classified as investments at fair value through other comprehensive income, for a notional amount of S/504.5 million (S/790.4 million as of December 31, 2024), see Note 12(c). Through these IRS, such bonds were economically converted to variable interest rates.
As of December 31, 2025, the Group holds foreign currency forwards designated as fair value hedges of certain U.S. Dollar-denominated corporate bonds classified as investments at fair value through other comprehensive income, for a notional amount of US$49.7 million equivalent to S/167.3 million (US$33.3 million equivalent to S/125.2 million as of December 31, 2024). Through these instruments, the investments were economically converted into Peruvian soles. See Note 12(c).
Likewise, during 2025, the Group held, until their maturity, cross-currency swaps (CCS) designated as cash flow hedges derivative instruments of corporate bonds classified as fair value through other comprehensive income for S/47.0 million, through which such bonds were economically converted into fixed-rate soles. See Note 12(c).
(ii) As of December 31, 2025 and December 31, 2024, the balance includes the following government treasury bonds:
| | | | | | | | | | | | | | |
| 2025 | | 2024 | |
| S/(000) | | S/(000) | |
| | | | |
| Peruvian Government bonds | 11,225,526 | | | 10,387,634 | | |
| Colombian Government bonds | 392,458 | | | 341,299 | | |
| United States of America Government bonds | 342,688 | | | 1,279,202 | | |
| Panama Government bonds | 194,799 | | | 108,069 | | |
| Mexican Government bonds | 73,441 | | | 7,089 | | |
| Chilean Government bonds | 73,059 | | | 79,282 | | |
| Brazilian Government bonds | 53,230 | | | 3,598 | | |
| Philippine Government bonds | 10,589 | | | 5,822 | | |
| Qatari Government bonds | 10,362 | | | 11,653 | | |
| Others | 20,006 | | | 23,007 | | |
| Total | 12,396,158 | | | 12,246,655 | | |
(iii) As of December 31, 2025, the Group maintains 110,274 certificates of deposits BCRP. As of December 31, 2024, it held 116,499 certificates of deposits BCRP, which are instruments issued at discount through public auction, traded on the Peruvian secondary market and payable in soles.
(iv) As of December 31, 2025 and 2024, the balance of securitization instruments includes the following:
| | | | | | | | | | | | | | |
| 2025 | | 2024 | |
| S/(000) | | S/(000) | |
| | | | |
| Inmuebles Panamericana S.A. | 151,944 | | | 149,074 | | |
| Mall Aventura S.A. | 95,594 | | | – | | |
| Colegios Peruanos S.A. | 84,583 | | | 81,291 | | |
ATN S.A. | 77,547 | | | 77,244 | | |
| Inretail Shopping Malls | 73,208 | | | – | | |
| Centro Comercial Plaza Norte S.A.C. | 65,419 | | | 25,241 | | |
| Multimercados Zonales S.A.C. | 55,708 | | | 54,374 | | |
| Aeropuertos del Perú S.A. | 46,651 | | | 14,058 | | |
| Centro Comercial Mall del Sur S.A.C. | 42,975 | | | 25,215 | | |
| Universidad Peruana Cayetano Heredia | 37,314 | | | – | | |
Costa del Sol S.A. | 35,772 | | | 35,483 | | |
| Asociación Civil San Juan Bautista | 34,310 | | | 22,327 | | |
| Inmobiliaria Terrano S.A. y Operadora Portuaria S.A. | 34,244 | | | 40,125 | | |
| Nessus Hoteles Perú S.A. | 31,635 | | | 36,629 | | |
| Concesionaria La Chira S.A. | 26,210 | | | 26,279 | | |
| Red Eléctrica del Sur S.A. y Transmisora Eléctrica del Sur S.A. | 23,027 | | | 21,748 | | |
Ferreyros S.A. | 21,846 | | | 23,784 | | |
Compañía de Turismo La Paz S.A.C. | – | | | 19,780 | | |
Other minors | 58,343 | | | 56,843 | | |
| Total | 996,330 | | | 709,495 | | |
The instruments have predominantly semiannual payments through the year 2050. The pool of underlying assets is composed mainly of receivables from revenues, service revenues, maintenance and marketing contributions, and service-related receivables, among others.
(v) As of December 31, 2025 the balance corresponds to certificates equivalent to S/231.3 million in other currencies, issued mainly by entities of the Bolivia financial system. As of December 31, 2024, the balance corresponds to certificates equivalent to S/417.8 million in other currencies, issued mainly by entities of the Bolivia financial system.
c) Amortized cost investments consist of the following:
| | | | | | | | | | | |
| 2025 |
| Carrying | | Fair |
| amount | | value |
| S/(000) | | S/(000) |
| | | |
| Peruvian Government bonds (i) | 8,049,799 | | | 7,965,134 | |
| Corporate bonds (i) | 404,338 | | | 408,397 | |
| Bonds from financial organizations (i) | 66,520 | | | 66,995 | |
| Other government bonds (i) | 57,218 | | | 57,098 | |
| Subordinated bonds (i) | 28,175 | | | 28,304 | |
| Securitization instruments | 11,812 | | | 12,182 | |
| Negotiable certificates of deposits | 3,905 | | | 3,917 | |
| Certificates of payment on work progress (CRPAO) | 2,108 | | | 2,105 | |
| 8,623,875 | | | 8,544,132 | |
| Accrued interest | 189,782 | | | 189,782 | |
| Total investments at amortized cost, net | 8,813,657 | | | 8,733,914 | |
| | | | | | | | | | | |
| 2024 |
| Carrying | | Fair |
| amount | | value |
| S/(000) | | S/(000) |
| | | |
| Peruvian Government Bonds (i) | 8,085,248 | | | 7,558,307 | |
| Corporate bonds (i) | 534,396 | | | 536,321 | |
| Bonds from financial organizations (i) | 48,090 | | | 48,307 | |
| Subordinated bonds (i) | 44,763 | | | 45,148 | |
| Other government bonds (i) | 29,074 | | | 29,185 | |
| Negotiable certificates of deposits | 23,889 | | | 23,904 | |
| Certificates of payment on work progress (CRPAO) | 8,321 | | | 8,270 | |
| 8,773,781 | | | 8,249,442 | |
| Accrued interest | 194,096 | | | 194,096 | |
| Total investments at amortized cost, net | 8,967,877 | | | 8,443,538 | |
The expected loss of investments at amortized cost as of December 31, 2025 and 2024 is S/2.1 million and S/2.9 million, respectively.
(i) As of December 31, 2025, these bonds have maturities between January 2026 and February 2042; with annual market rates between 4.13 percent and 6.55 percent annually for bonds issued in soles, between 3.88 percent and 8.87 percent for bonds issued in US Dollars, and between 4.78 percent and 9.60 percent
annually for bonds issued in other currencies. As of December 31, 2024, they have maturities between January 2025 and February 2042; with annual market rates between 4.40 percent and 7.02 percent annually for bonds issued in soles, between 4.32 percent and 15.39 percent for bonds issued in US Dollars, and between 5.30 percent and 10.40 percent annually for bonds issued in other currencies.
Likewise, Credicorp Management has determined that as of December 31, 2025, the difference between amortized cost and the fair value of these investments is temporary in nature and Credicorp has the intention and ability to hold each of these investments until its maturity.
As of December 31, 2025, the Group maintains repurchase agreement transactions related to investments measured at amortized cost, with an estimated fair value of S/323.5 million. As of December 31, 2024, such repurchase agreement transactions amounted to an estimated fair value of S/1,063.4 million. See Note 5(c).
d) In June and August 2025, the Group participated in securities exchange programs offered by the Ministry of Economy and Finance on behalf of the Peruvian Government, through which sovereign bonds amounting to S/3,438.2 million were delivered, and sovereign bonds amounting to S/3,729.7 million were received in exchange, without affecting their accounting classification. These exchanges mainly involved bonds classified at fair value through other comprehensive income, resulting in the realization of a net gain of S/99.0 million, which was recognized in the consolidated statement of income.
In June 2024, the Group participated in securities repurchase and exchange program offered by the Ministry of Economy and Finance on behalf of the Peruvian Government, through which sovereign bonds amounting to S/1,450.0 million were repurchased. Additionally, sovereign bonds were exchanged by delivering bonds amounting to S/780.8 million and receiving sovereign bonds amounting to S/795.4 million in return, without affecting their accounting classification. These exchanges mainly involved bonds classified at fair value through other comprehensive income, resulting in the realization of a net gain of S/26.0 million, which was recognized in the consolidated statement of income.
e) The table below shows the balance of investments classified by maturity, without consider accrued interest or provision for credit loss:
| | | | | | | | | | | | | | |
| 2025 | |
| At fair value through other comprehensive income | | Amortized cost | |
| S/(000) | | S/(000) | |
| | | | |
| Up to 3 months | 6,033,742 | | | 39,815 | | |
| From 3 months to 1 year | 6,815,415 | | | 270,064 | | |
| From 1 to 3 years | 3,139,798 | | | 1,413,293 | | |
| From 3 to 5 years | 2,749,017 | | | 1,017,231 | | |
| More than 5 years | 19,642,799 | | | 5,883,472 | | |
| Without maturity | 92,907 | | | – | | |
| Total | 38,473,678 | | | 8,623,875 | | |
| | | | | | | | | | | | | | |
| 2024 | |
| At fair value through other comprehensive income | | Amortized cost | |
| S/(000) | | S/(000) | |
| | | | |
| Up to 3 months | 4,631,496 | | | 161,924 | | |
| From 3 months to 1 year | 8,960,899 | | | 196,986 | | |
| From 1 to 3 years | 5,259,160 | | | 642,039 | | |
| From 3 to 5 years | 5,176,129 | | | 2,211,166 | | |
| More than 5 years | 15,422,394 | | | 5,561,666 | | |
| Without maturity | 147,264 | | | – | | |
| Total | 39,597,342 | | | 8,773,781 | | |
7 LOANS, NET
a) This item consists of the following:
| | | | | | | | | | | |
| 2025 | | 2024 |
| S/(000) | | S/(000) |
| | | |
| Direct loans - | | | |
| Loans | 122,308,754 | | | 118,396,820 | |
| Credit cards | 6,716,700 | | | 6,223,711 | |
| Leasing receivables | 5,019,366 | | | 5,260,182 | |
| Discounted notes | 4,098,691 | | | 3,391,576 | |
| Factoring receivables and confirming | 3,598,101 | | | 3,243,531 | |
| Advances and overdrafts in current account | 56,637 | | | 132,231 | |
| Refinanced loans | 2,009,723 | | | 2,241,062 | |
| Total direct loans | 143,807,972 | | | 138,889,113 | |
| | | |
| Internal overdue loans and under legal collection loans | 4,821,126 | | | 5,430,132 | |
| 148,629,098 | | | 144,319,245 | |
| Add (less) - | | | |
| Accrued interest | 1,355,856 | | | 1,413,028 | |
| Total direct loans | 149,984,954 | | | 145,732,273 | |
| Allowance for direct loan losses, Note 30.1 (c) | (7,669,950) | | | (7,994,977) | |
| Total direct loans, net | 142,315,004 | | | 137,737,296 | |
b) As of December 31, 2025, and 2024, the composition of the gross credit balance is as follows:
| | | | | | | | | | | |
| 2025 | | 2024 |
| S/(000) | | S/(000) |
| | | |
| Direct loans, Note 7(a) | 148,629,098 | | | 144,319,245 | |
| Indirect loans, Note 18(a) | 21,267,157 | | | 22,139,321 | |
| Due from customers on banker’s acceptances | 345,906 | | | 528,184 | |
| Total | 170,242,161 | | | 166,986,750 | |
The following table presents the movement of the gross balance of the credit portfolio by stage periods 2025 and 2024:
| | | | | | | | | | | | | | | | | | | | | | | | | | | | | | | | | | | | | | | | | | | | | | | | | | | | | | | | | | | | | | |
| Stage 1 | | | | | | | | | | | | | | | | | | | | |
| Loans by class | | Balance at
December 31,
2024 | | Transfer to
Stage 2 | | Transfer to
Stage 3 | | Transfer from
Stage 2 | | Transfer from
Stage 3 | | Transfers
between classes
of loans | | New loans,
liquidation and
write-offs, net | | Sale of loan
portfolio | | Exchange
differences and
others | | Balance at
December 31,
2025 |
| | S/(000) | | S/(000) | | S/(000) | | S/(000) | | S/(000) | | S/(000) | | S/(000) | | S/(000) | | S/(000) | | S/(000) |
| Commercial loans | | 89,105,601 | | | (6,357,467) | | | (469,266) | | | 3,576,054 | | | 309,924 | | | 1,023,019 | | | 5,587,697 | | | – | | | (5,550,866) | | | 87,224,696 | |
| Residential mortgage loans | | 18,956,529 | | | (2,064,585) | | | (57,011) | | | 3,393,702 | | | 32,643 | | | 7,760 | | | 2,635,093 | | | – | | | (764,478) | | | 22,139,653 | |
| Small and Micro-business loans | | 16,905,829 | | | (9,011,684) | | | (90,624) | | | 2,369,423 | | | 29,434 | | | (1,023,019) | | | 9,778,401 | | | – | | | (351,549) | | | 18,606,211 | |
| Consumer loans | | 14,392,541 | | | (5,532,737) | | | (72,133) | | | 2,625,644 | | | 116,152 | | | (7,760) | | | 6,288,017 | | | – | | | (360,304) | | | 17,449,420 | |
| Total | | 139,360,500 | | | (22,966,473) | | | (689,034) | | | 11,964,823 | | | 488,153 | | | – | | | 24,289,208 | | | – | | | (7,027,197) | | | 145,419,980 | |
| | | | | | | | | | | | | | | | | | | | | | | | | | | | | | | | | | | | | | | | | | | | | | | | | | | | | | | | | | | | | | |
| Stage 2 | | | | | | | | | | | | | | | | | | | | |
| Loans by class | | Balance at
December 31,
2024 | | Transfer to
Stage 1 | | Transfer to
Stage 3 | | Transfer from
Stage 1 | | Transfer from
Stage 3 | | Transfers
between classes
of loans | | New loans,
liquidation and
write-offs, net | | Sale of loan
portfolio | | Exchange
differences and
others | | Balance at
December 31,
2025 |
| | S/(000) | | S/(000) | | S/(000) | | S/(000) | | S/(000) | | S/(000) | | S/(000) | | S/(000) | | S/(000) | | S/(000) |
| Commercial loans | | 4,508,146 | | | (3,576,054) | | | (1,324,351) | | | 6,357,467 | | | 155,245 | | | 71,068 | | | (893,639) | | | – | | | (173,438) | | | 5,124,444 | |
| Residential mortgage loans | | 4,492,325 | | | (3,393,702) | | | (385,204) | | | 2,064,585 | | | 72,531 | | | 462 | | | (370,485) | | | – | | | (50,031) | | | 2,430,481 | |
| Small and Micro-business loans | | 4,243,585 | | | (2,369,423) | | | (1,414,877) | | | 9,011,684 | | | 92,463 | | | (71,068) | | | (5,386,341) | | | – | | | (11,365) | | | 4,094,658 | |
| Consumer loans | | 3,718,855 | | | (2,625,644) | | | (1,346,489) | | | 5,532,737 | | | 98,790 | | | (462) | | | (1,898,936) | | | – | | | (11,949) | | | 3,466,902 | |
| Total | | 16,962,911 | | | (11,964,823) | | | (4,470,921) | | | 22,966,473 | | | 419,029 | | | – | | | (8,549,401) | | | – | | | (246,783) | | | 15,116,485 | |
| | | | | | | | | | | | | | | | | | | | | | | | | | | | | | | | | | | | | | | | | | | | | | | | | | | | | | | | | | | | | | |
| Stage 3 | | | | | | | | | | | | | | | | | | | | |
| Loans by class | | Balance at
December 31,
2024 | | Transfer to
Stage 1 | | Transfer to
Stage 2 | | Transfer from
Stage 1 | | Transfer from
Stage 2 | | Transfers
between classes
of loans | | New loans,
liquidation and
write-offs, net | | Sale of loan
portfolio | | Exchange
differences and
others | | Balance at
December 31,
2025 |
| | S/(000) | | S/(000) | | S/(000) | | S/(000) | | S/(000) | | S/(000) | | S/(000) | | S/(000) | | S/(000) | | S/(000) |
| Commercial loans | | 5,873,420 | | | (309,924) | | | (155,245) | | | 469,266 | | | 1,324,351 | | | 307,257 | | | (1,954,164) | | | (8,698) | | | (202,923) | | | 5,343,340 | |
| Residential mortgage loans | | 1,643,178 | | | (32,643) | | | (72,531) | | | 57,011 | | | 385,204 | | | (96) | | | (308,771) | | | – | | | (53,902) | | | 1,617,450 | |
| Small and Micro-business loans | | 1,687,703 | | | (29,434) | | | (92,463) | | | 90,624 | | | 1,414,877 | | | (307,257) | | | (1,375,550) | | | – | | | (30,759) | | | 1,357,741 | |
| Consumer loans | | 1,459,038 | | | (116,152) | | | (98,790) | | | 72,133 | | | 1,346,489 | | | 96 | | | (1,263,868) | | | – | | | (11,781) | | | 1,387,165 | |
| Total | | 10,663,339 | | | (488,153) | | | (419,029) | | | 689,034 | | | 4,470,921 | | | – | | | (4,902,353) | | | (8,698) | | | (299,365) | | | 9,705,696 | |
| | | | | | | | | | | | | | | | | | | | | | | | | | | | | | | | | | | | | | | | | | | | |
| Consolidated 3 Stages | | | | | | | | | | | | | | |
| Loans by class | | Balance at
December 31,
2024 | | Written off
and
forgivens | | Transfers
between classes
of loans | | New loans
and
liquidation,
net | | Sale of loan
portfolio | | Exchange
differences and
others | | Balance at
December 31,
2025 |
| | S/(000) | | S/(000) | | S/(000) | | S/(000) | | S/(000) | | S/(000) | | S/(000) |
| Commercial loans | | 99,487,167 | | | (438,066) | | | 1,401,344 | | | 3,177,960 | | | (8,698) | | | (5,927,227) | | | 97,692,480 | |
| Residential mortgage loans | | 25,092,032 | | | (22,365) | | | 8,126 | | | 1,978,202 | | | – | | | (868,411) | | | 26,187,584 | |
| Small and Micro-business loans | | 22,837,117 | | | (1,265,317) | | | (1,401,344) | | | 4,281,827 | | | – | | | (393,673) | | | 24,058,610 | |
| Consumer loans | | 19,570,434 | | | (1,061,440) | | | (8,126) | | | 4,186,653 | | | – | | | (384,034) | | | 22,303,487 | |
| Total | | 166,986,750 | | | (2,787,188) | | | – | | | 13,624,642 | | | (8,698) | | | (7,573,345) | | | 170,242,161 | |
| | | | | | | | | | | | | | | | | | | | | | | | | | | | | | | | | | | | | | | | | | | | | | | | | | | | | | | | | | | | | | |
| Stage 1 | | | | | | | | | | | | | | | | | | | | |
| Loans by class | | Balance at
December 31,
2023 | | Transfer to
Stage 2 | | Transfer to
Stage 3 | | Transfer from
Stage 2 | | Transfer from
Stage 3 | | Transfers
between classes
of loans | | New loans,
liquidation and
write-offs, net | | Sale of loan
portfolio | | Exchange
differences and
others | | Balance at
December 31,
2024 |
| | S/(000) | | S/(000) | | S/(000) | | S/(000) | | S/(000) | | S/(000) | | S/(000) | | S/(000) | | S/(000) | | S/(000) |
| Commercial loans | | 83,928,787 | | | (6,375,422) | | | (321,490) | | | 5,170,908 | | | 557,795 | | | 1,471,769 | | | 4,212,548 | | | – | | | 460,706 | | | 89,105,601 | |
| Residential mortgage loans | | 19,150,069 | | | (4,867,259) | | | (78,840) | | | 2,949,592 | | | 22,355 | | | 2,186 | | | 1,727,613 | | | – | | | 50,813 | | | 18,956,529 | |
| Small and Micro-business loans | | 16,065,846 | | | (9,240,619) | | | (115,321) | | | 3,329,738 | | | 44,315 | | | (1,471,769) | | | 8,378,279 | | | – | | | (84,640) | | | 16,905,829 | |
| Consumer loans | | 15,234,060 | | | (6,349,365) | | | (130,291) | | | 2,545,058 | | | 85,014 | | | (2,186) | | | 2,982,062 | | | – | | | 28,189 | | | 14,392,541 | |
| Total | | 134,378,762 | | | (26,832,665) | | | (645,942) | | | 13,995,296 | | | 709,479 | | | – | | | 17,300,502 | | | – | | | 455,068 | | | 139,360,500 | |
| | | | | | | | | | | | | | | | | | | | | | | | | | | | | | | | | | | | | | | | | | | | | | | | | | | | | | | | | | | | | | |
| Stage 2 | | | | | | | | | | | | | | | | | | | | |
| Loans by class | | Balance at
December 31,
2023 | | Transfer to
Stage 1 | | Transfer to
Stage 3 | | Transfer from
Stage 1 | | Transfer from
Stage 3 | | Transfers
between classes
of loans | | New loans,
liquidation and
write-offs, net | | Sale of loan
portfolio | | Exchange
differences and
others | | Balance at
December 31,
2024 |
| | S/(000) | | S/(000) | | S/(000) | | S/(000) | | S/(000) | | S/(000) | | S/(000) | | S/(000) | | S/(000) | | S/(000) |
| Commercial loans | | 5,937,197 | | | (5,170,908) | | | (1,523,412) | | | 6,375,422 | | | 517,832 | | | 134,410 | | | (1,763,989) | | | – | | | 1,594 | | | 4,508,146 | |
| Residential mortgage loans | | 3,558,102 | | | (2,949,592) | | | (493,788) | | | 4,867,259 | | | 52,741 | | | – | | | (548,555) | | | – | | | 6,158 | | | 4,492,325 | |
| Small and Micro-business loans | | 4,630,314 | | | (3,329,738) | | | (1,907,961) | | | 9,240,619 | | | 118,948 | | | (134,410) | | | (4,355,869) | | | – | | | (18,318) | | | 4,243,585 | |
| Consumer loans | | 3,317,454 | | | (2,545,058) | | | (1,777,749) | | | 6,349,365 | | | 105,041 | | | – | | | (1,731,395) | | | – | | | 1,197 | | | 3,718,855 | |
| Total | | 17,443,067 | | | (13,995,296) | | | (5,702,910) | | | 26,832,665 | | | 794,562 | | | – | | | (8,399,808) | | | – | | | (9,369) | | | 16,962,911 | |
| | | | | | | | | | | | | | | | | | | | | | | | | | | | | | | | | | | | | | | | | | | | | | | | | | | | | | | | | | | | | | |
| Stage 3 | | | | | | | | | | | | | | | | | | | | |
| Loans by class | | Balance at
December 31,
2023 | | Transfer to
Stage 1 | | Transfer to
Stage 2 | | Transfer from
Stage 1 | | Transfer from
Stage 2 | | Transfers
between classes
of loans | | New loans,
liquidation and
write-offs, net | | Sale of loan
portfolio | | Exchange
differences and
others | | Balance at
December 31,
2024 |
| | S/(000) | | S/(000) | | S/(000) | | S/(000) | | S/(000) | | S/(000) | | S/(000) | | S/(000) | | S/(000) | | S/(000) |
| Commercial loans | | 7,307,176 | | | (557,795) | | | (517,832) | | | 321,490 | | | 1,523,412 | | | (265,854) | | | (1,843,891) | | | (110,550) | | | 17,264 | | | 5,873,420 | |
| Residential mortgage loans | | 1,468,748 | | | (22,355) | | | (52,741) | | | 78,840 | | | 493,788 | | | 871 | | | (284,913) | | | (44,749) | | | 5,689 | | | 1,643,178 | |
| Small and Micro-business loans | | 1,802,830 | | | (44,315) | | | (118,948) | | | 115,321 | | | 1,907,961 | | | 265,854 | | | (2,237,017) | | | (7,081) | | | 3,098 | | | 1,687,703 | |
| Consumer loans | | 1,546,687 | | | (85,014) | | | (105,041) | | | 130,291 | | | 1,777,749 | | | (871) | | | (1,799,077) | | | (11,931) | | | 6,245 | | | 1,459,038 | |
| Total | | 12,125,441 | | | (709,479) | | | (794,562) | | | 645,942 | | | 5,702,910 | | | – | | | (6,164,898) | | | (174,311) | | | 32,296 | | | 10,663,339 | |
| | | | | | | | | | | | | | | | | | | | | | | | | | | | | | | | | | | | | | | | | | | | |
| Consolidated 3 Stages | | | | | | | | | | | | | | |
| Loans by class | | Balance at
December 31,
2023 | | Written off
and forgivens | | Transfers
between classes
of loans | | New loans
and
liquidation,
net | | Sale of loan
portfolio | | Exchange
differences and
others | | Balance at
December 31,
2024 |
| | S/(000) | | S/(000) | | S/(000) | | S/(000) | | S/(000) | | S/(000) | | S/(000) |
| Commercial loans | | 97,173,160 | | | (594,478) | | | 1,340,325 | | | 1,199,146 | | | (110,550) | | | 479,564 | | | 99,487,167 | |
| Residential mortgage loans | | 24,176,919 | | | (20,162) | | | 3,057 | | | 914,307 | | | (44,749) | | | 62,660 | | | 25,092,032 | |
| Small and Micro-business loans | | 22,498,990 | | | (1,746,105) | | | (1,340,325) | | | 3,531,498 | | | (7,081) | | | (99,860) | | | 22,837,117 | |
| Consumer loans | | 20,098,201 | | | (1,526,839) | | | (3,057) | | | 978,429 | | | (11,931) | | | 35,631 | | | 19,570,434 | |
| Total | | 163,947,270 | | | (3,887,584) | | | – | | | 6,623,380 | | | (174,311) | | | 477,995 | | | 166,986,750 | |
c) As of December 31, 2025, and 2024, the allowance for loan losses for direct loans, indirect loans and due from customers on banker’s acceptances, was determined under the expected credit loss model as established in IFRS 9. The movement in the allowance for loan losses is shown below for direct loans, indirect loans and due from customers on banker’s acceptances:
| | | | | | | | | | | | | | | | | | | | | | | | | | | | | | | | | | | | | | | | | | | | | | | | | | | | | | | | | | | | | | | | | | | | |
| Stage 1 | | | | | | | | | | | | | | | | | | | | | | |
| Loans by class | | Balance at
December 31,
2024 | | Transfer to
Stage 2 | | Transfer to
Stage 3 | | Transfer
from
Stage 2 | | Transfer
from
Stage 3 | | New loans
liquidation, and
write-
offs, net | | Changes in
PD,LGD,
EAD (*) | | Transfers
between
classes of
loans | | Sale of loan
portfolio | | Exchange
differences
and others | | Balance at
December
31, 2025 |
| | S/(000) | | S/(000) | | S/(000) | | S/(000) | | S/(000) | | S/(000) | | S/(000) | | S/(000) | | S/(000) | | S/(000) | | S/(000) |
| Commercial loans | | 515,030 | | | (132,277) | | | (5,379) | | | 124,005 | | | 38,724 | | | 13,019 | | | (109,674) | | | 90,811 | | | – | | | (75,250) | | | 459,009 | |
| Residential mortgage loans | | 66,258 | | | (10,917) | | | (452) | | | 57,272 | | | 15,798 | | | 7,398 | | | (83,929) | | | 335 | | | – | | | (1,910) | | | 49,853 | |
| Small and Micro-business loans | | 384,283 | | | (360,657) | | | (4,223) | | | 113,044 | | | 18,386 | | | 522,212 | | | (103,175) | | | (90,811) | | | – | | | (6,379) | | | 472,680 | |
| Consumer loans | | 331,010 | | | (265,816) | | | (3,668) | | | 202,494 | | | 99,770 | | | 202,233 | | | (91,743) | | | (335) | | | – | | | (13,965) | | | 459,980 | |
| Total | | 1,296,581 | | | (769,667) | | | (13,722) | | | 496,815 | | | 172,678 | | | 744,862 | | | (388,521) | | | – | | | – | | | (97,504) | | | 1,441,522 | |
| | | | | | | | | | | | | | | | | | | | | | | | | | | | | | | | | | | | | | | | | | | | | | | | | | | | | | | | | | | | | | | | | | | | |
| Stage 2 | | | | | | | | | | | | | | | | | | | | | | |
| Loans by class | | Balance at
December 31,
2024 | | Transfer to
Stage 1 | | Transfer to
Stage 3 | | Transfer
from
Stage 1 | | Transfer
from
Stage 3 | | New loans
liquidation, and
write-
offs, net | | Changes in
PD,LGD,
EAD (*) | | Transfers
between
classes of
loans | | Sale of loan
portfolio | | Exchange
differences
and others | | Balance at
December
31, 2025 |
| | S/(000) | | S/(000) | | S/(000) | | S/(000) | | S/(000) | | S/(000) | | S/(000) | | S/(000) | | S/(000) | | S/(000) | | S/(000) |
| Commercial loans | | 300,858 | | | (124,005) | | | (125,576) | | | 132,277 | | | 44,967 | | | (64,594) | | | 130,491 | | | 1,874 | | | – | | | (9,913) | | | 286,379 | |
| Residential mortgage loans | | 168,222 | | | (57,272) | | | (30,834) | | | 10,917 | | | 36,974 | | | (16,599) | | | 11,113 | | | 17 | | | – | | | (6,249) | | | 116,289 | |
| Small and Micro-business loans | | 396,679 | | | (113,044) | | | (207,616) | | | 360,657 | | | 46,832 | | | (417,490) | | | 353,343 | | | (1,874) | | | – | | | (5,294) | | | 412,193 | |
| Consumer loans | | 514,247 | | | (202,494) | | | (354,315) | | | 265,816 | | | 82,508 | | | (149,272) | | | 352,354 | | | (17) | | | – | | | (9,389) | | | 499,438 | |
| Total | | 1,380,006 | | | (496,815) | | | (718,341) | | | 769,667 | | | 211,281 | | | (647,955) | | | 847,301 | | | – | | | – | | | (30,845) | | | 1,314,299 | |
| | | | | | | | | | | | | | | | | | | | | | | | | | | | | | | | | | | | | | | | | | | | | | | | | | | | | | | | | | | | | | | | | | | | |
| Stage 3 | | | | | | | | | | | | | | | | | | | | | | |
| Loans by class | | Balance at
December 31,
2024 | | Transfer to
Stage 1 | | Transfer to
Stage 2 | | Transfer
from
Stage 1 | | Transfer
from
Stage 2 | | New loans
liquidation, and
write-
offs, net | | Changes in
PD,LGD,
EAD (*) | | Transfers
between
classes of
loans | | Sale of loan
portfolio | | Exchange
differences
and others | | Balance at
December
31, 2025 |
| | S/(000) | | S/(000) | | S/(000) | | S/(000) | | S/(000) | | S/(000) | | S/(000) | | S/(000) | | S/(000) | | S/(000) | | S/(000) |
| Commercial loans | | 2,512,121 | | | (38,724) | | | (44,967) | | | 5,379 | | | 125,576 | | | (793,976) | | | 644,487 | | | 60,624 | | | (2,637) | | | (82,650) | | | 2,385,233 | |
| Residential mortgage loans | | 819,647 | | | (15,798) | | | (36,974) | | | 452 | | | 30,834 | | | (148,499) | | | 179,685 | | | (55) | | | — | | | (28,851) | | | 800,441 | |
| Small and Micro-business loans | | 1,167,319 | | | (18,386) | | | (46,832) | | | 4,223 | | | 207,616 | | | (1,377,039) | | | 1,099,546 | | | (60,624) | | | — | | | (26,083) | | | 949,740 | |
| Consumer loans | | 1,203,221 | | | (99,770) | | | (82,508) | | | 3,668 | | | 354,315 | | | (1,184,622) | | | 972,705 | | | 55 | | | — | | | (16,773) | | | 1,150,291 | |
| Total | | 5,702,308 | | | (172,678) | | | (211,281) | | | 13,722 | | | 718,341 | | | (3,504,136) | | | 2,896,423 | | | – | | | (2,637) | | | (154,357) | | | 5,285,705 | |
| | | | | | | | | | | | | | | | | | | | | | | | | | | | | | | | | | | | | | | | | | | | | | | | | | |
| Consolidated 3 Stages | | | | | Credit loss of the period | | | | | | | | |
| Loans by class | | Balance at
December
31, 2024 | | Loan
portafolio
written off
and
forgivens | | New loans
and
liquidation,
net | | Changes in
PD, LGD,
EAD (*) | | Transfers
between
classes of
loans | | Sale of loan
portfolio | | Exchange
differences
and others | | Balance at
December
31, 2025 |
| | S/(000) | | S/(000) | | S/(000) | | S/(000) | | S/(000) | | S/(000) | | S/(000) | | S/(000) |
| Commercial loans | | 3,328,009 | | | (464,330) | | | (381,221) | | | 665,304 | | | 153,309 | | | (2,637) | | | (167,813) | | | 3,130,621 | |
| Residential mortgage loans | | 1,054,127 | | | (23,807) | | | (133,893) | | | 106,869 | | | 297 | | | – | | | (37,010) | | | 966,583 | |
| Small and Micro-business loans | | 1,948,281 | | | (1,306,436) | | | 34,119 | | | 1,349,714 | | | (153,309) | | | – | | | (37,756) | | | 1,834,613 | |
| Consumer loans | | 2,048,478 | | | (1,130,907) | | | (754) | | | 1,233,316 | | | (297) | | | – | | | (40,127) | | | 2,109,709 | |
| Total | | 8,378,895 | | | (2,925,480) | | | (481,749) | | | 3,355,203 | | | – | | | (2,637) | | | (282,706) | | | 8,041,526 | |
| | | | | | | | | | | | | | | | | | | | | | | | | | | | | | | | | | | | | | | | | | | | | | | | | | | | | | | | | | | | | | | | | | | | |
| Stage 1 | | | | | | | | | | | | | | | | | | | | | | |
| Loans by class | | Balance at
December 31,
2023 | | Transfer to
Stage 2 | | Transfer to
Stage 3 | | Transfer
from
Stage 2 | | Transfer
from
Stage 3 | | New loans
liquidation, and
write-
offs, net | | Changes
in PD,
LGD,
EAD (*) | | Transfers
between
classes of
loans | | Sale of loan
portfolio | | Exchange
differences
and others | | Balance at
December
31, 2024 |
| | S/(000) | | S/(000) | | S/(000) | | S/(000) | | S/(000) | | S/(000) | | S/(000) | | S/(000) | | S/(000) | | S/(000) | | S/(000) |
| Commercial loans | | 552,132 | | | (151,847) | | | (7,753) | | | 153,552 | | | 64,165 | | | 30,593 | | | (147,692) | | | 34,272 | | | – | | | (12,392) | | | 515,030 | |
| Residential mortgage loans | | 54,102 | | | (20,949) | | | (430) | | | 34,474 | | | 12,065 | | | 9,428 | | | (22,871) | | | 197 | | | – | | | 242 | | | 66,258 | |
| Small and Micro-business loans | | 348,124 | | | (356,044) | | | (6,772) | | | 107,403 | | | 28,034 | | | 464,092 | | | (165,734) | | | (34,272) | | | – | | | (548) | | | 384,283 | |
| Consumer loans | | 285,091 | | | (245,783) | | | (5,297) | | | 142,011 | | | 74,041 | | | 51,412 | | | 29,377 | | | (197) | | | – | | | 355 | | | 331,010 | |
| Total | | 1,239,449 | | | (774,623) | | | (20,252) | | | 437,440 | | | 178,305 | | | 555,525 | | | (306,920) | | | – | | | – | | | (12,343) | | | 1,296,581 | |
| | | | | | | | | | | | | | | | | | | | | | | | | | | | | | | | | | | | | | | | | | | | | | | | | | | | | | | | | | | | | | | | | | | | |
| Stage 2 | | | | | | | | | | | | | | | | | | | | | | |
| Loans by class | | Balance at
December 31,
2023 | | Transfer to
Stage 1 | | Transfer to
Stage 3 | | Transfer
from
Stage 1 | | Transfer
from
Stage 3 | | New loans
liquidation, and
write-
offs, net | | Changes
in PD,
LGD,
EAD (*) | | Transfers
between
classes of
loans | | Sale of loan
portfolio | | Exchange
differences
and others | | Balance at
December
31, 2024 |
| | S/(000) | | S/(000) | | S/(000) | | S/(000) | | S/(000) | | S/(000) | | S/(000) | | S/(000) | | S/(000) | | S/(000) | | S/(000) |
| Commercial loans | | 399,536 | | | (153,552) | | | (205,233) | | | 151,847 | | | 55,861 | | | (114,850) | | | 143,678 | | | 24,408 | | | – | | | (837) | | | 300,858 | |
| Residential mortgage loans | | 121,258 | | | (34,474) | | | (41,104) | | | 20,949 | | | 29,958 | | | (18,325) | | | 90,309 | | | – | | | – | | | (349) | | | 168,222 | |
| Small and Micro-business loans | | 431,282 | | | (107,403) | | | (351,156) | | | 356,044 | | | 69,433 | | | (292,119) | | | 318,559 | | | (24,408) | | | – | | | (3,553) | | | 396,679 | |
| Consumer loans | | 435,150 | | | (142,011) | | | (434,526) | | | 245,783 | | | 85,974 | | | (146,722) | | | 473,117 | | | – | | | – | | | (2,518) | | | 514,247 | |
| Total | | 1,387,226 | | | (437,440) | | | (1,032,019) | | | 774,623 | | | 241,226 | | | (572,016) | | | 1,025,663 | | | – | | | – | | | (7,257) | | | 1,380,006 | |
| | | | | | | | | | | | | | | | | | | | | | | | | | | | | | | | | | | | | | | | | | | | | | | | | | | | | | | | | | | | | | | | | | | | |
| Stage 3 | | | | | | | | | | | | | | | | | | | | | | |
| Loans by class | | Balance at
December 31,
2023 | | Transfer to
Stage 1 | | Transfer to
Stage 2 | | Transfer
from
Stage 1 | | Transfer
from
Stage 2 | | New loans
liquidation, and
write-
offs, net | | Changes
in PD,
LGD,
EAD (*) | | Transfers
between
classes of
loans | | Sale of loan
portfolio | | Exchange
differences
and others | | Balance at
December
31, 2024 |
| | S/(000) | | S/(000) | | S/(000) | | S/(000) | | S/(000) | | S/(000) | | S/(000) | | S/(000) | | S/(000) | | S/(000) | | S/(000) |
| Commercial loans | | 2,631,554 | | | (64,165) | | | (55,861) | | | 7,753 | | | 205,233 | | | (881,988) | | | 837,925 | | | (89,886) | | | (83,143) | | | 4,699 | | | 2,512,121 | |
| Residential mortgage loans | | 785,261 | | | (12,065) | | | (29,958) | | | 430 | | | 41,104 | | | (155,152) | | | 213,306 | | | 227 | | | (25,181) | | | 1,675 | | | 819,647 | |
| Small and Micro-business loans | | 1,288,082 | | | (28,034) | | | (69,433) | | | 6,772 | | | 351,156 | | | (1,898,683) | | | 1,435,145 | | | 89,886 | | | (5,540) | | | (2,032) | | | 1,167,319 | |
| Consumer loans | | 1,314,373 | | | (74,041) | | | (85,974) | | | 5,297 | | | 434,526 | | | (1,656,047) | | | 1,275,984 | | | (227) | | | (8,554) | | | (2,116) | | | 1,203,221 | |
| Total | | 6,019,270 | | | (178,305) | | | (241,226) | | | 20,252 | | | 1,032,019 | | | (4,591,870) | | | 3,762,360 | | | – | | | (122,418) | | | 2,226 | | | 5,702,308 | |
| | | | | | | | | | | | | | | | | | | | | | | | | | | | | | | | | | | | | | | | | | | | | | | | | | |
| Consolidated 3 Stages | | | | | | Credit loss of the period | | | | | | | | |
| Loans by class | | Balance at
December
31, 2023 | | Loan
portafolio
written off
and
forgivens | | New loans
and
liquidation,
net | | Changes
in PD, LGD,
EAD (*) | | Transfers
between
classes of
loans | | Sale of loan
portfolio | | Exchange
differences
and others | | Balance at
December
31, 2024 |
| | S/(000) | | S/(000) | | S/(000) | | S/(000) | | S/(000) | | S/(000) | | S/(000) | | S/(000) |
| Commercial loans | | 3,583,222 | | | (614,686) | | | (351,559) | | | 833,911 | | | (31,206) | | | (83,143) | | | (8,530) | | | 3,328,009 | |
| Residential mortgage loans | | 960,621 | | | (23,023) | | | (141,026) | | | 280,744 | | | 424 | | | (25,181) | | | 1,568 | | | 1,054,127 | |
| Small and Micro-business loans | | 2,067,488 | | | (1,813,283) | | | 86,573 | | | 1,587,970 | | | 31,206 | | | (5,540) | | | (6,133) | | | 1,948,281 | |
| Consumer loans | | 2,034,614 | | | (1,619,567) | | | (131,790) | | | 1,778,478 | | | (424) | | | (8,554) | | | (4,279) | | | 2,048,478 | |
| Total | | 8,645,945 | | | (4,070,559) | | | (537,802) | | | 4,481,103 | | | – | | | (122,418) | | | (17,374) | | | 8,378,895 | |
(*) The movement includes the following effects:
(i) Calibrations to the PD, LGD and EAD models;
(ii) Updating of macroeconomic models and projections;
(iii) Increase or decrease in credit risk due to phase changes;
(iv) Increase or decrease in the risk inherent to credits that remain in the same phase.
(**)The movement in the expected credit loss allowance for the 2025 period includes provisions for direct loans of approximately S/ 7,670.0 million and provisions for indirect loans and due from customers on banker’s acceptances of S/ 371.6 million (S/ 7,994.9 million and S/ 383.9 million, respectively, as of December 31, 2024). The expected loss on indirect loans and due from customers on banker’s acceptances is included under “Other liabilities” in the consolidated statement of financial position (Note 12(a)). In management’s opinion, the expected credit loss allowance for loans recognized as of December 31, 2025 and 2024 has been determined in accordance with IFRS 9 and is sufficient to cover losses in the loan portfolio.
d) Interest rates on loans are set based on the prevailing rates in the markets in which the Group’s subsidiaries operate..
e) A portion of the loan portfolio is collateralized with guarantees received from customers, which mainly consist of mortgages, trust assignments, securities and industrial and mercantile pledges.
f) The following table presents the gross direct loan portfolio as of December 31, 2025, and 2024 by maturity based on the remaining period to the payment due date:
| | | | | | | | | | | |
| 2025 | | 2024 |
| S/(000) | | S/(000) |
| Outstanding loans - | | | |
| From 1 to 3 months | 33,318,459 | | | 31,363,434 | |
| From 3 months to 1 year | 39,713,962 | | | 37,349,571 | |
| From 1 to 3 years | 30,472,885 | | | 29,185,013 | |
| From 3 to 5 years | 14,738,099 | | | 13,319,494 | |
| From 5 to 15 years | 24,092,636 | | | 25,578,139 | |
| More than 15 years | 1,471,931 | | | 2,093,462 | |
| 143,807,972 | | | 138,889,113 | |
| | | |
| Internal overdue loans - | | | |
| Overdue up to 90 days | 747,943 | | | 1,046,337 | |
| Over 90 days | 4,073,183 | | | 4,383,795 | |
| 4,821,126 | | | 5,430,132 | |
| | | |
| Total | 148,629,098 | | | 144,319,245 | |
See credit risk analysis in Note 30.1 (c).
g) As of December 31, 2025, the Group holds foreign currency forwards, which have been designated as fair value hedges of certain U.S.Dollar loans, for a notional amount of US$13.3 million equivalent to S/44.9 million (US$36.3 million equivalent to S/136.6 million as of December 31, 2024), through which the loans were economically converted into soles. See Note 12(c).
8 INSURANCE AND REINSURANCE CONTRACTS ASSETS AND LIABILITIES
a) The detail of the assets per reinsurance contract are:
| | | | | | | | | | | | | | | | | | | | | | | | | | | | | | | | | | | |
| 2025 | | 2024 |
| Assets for
remaining
coverage (*) | | Assets for incurred claims for contracts measured by PAA
(**) | | Total | | Assets for
remaining
coverage (*) | | Assets for incurred claims for contracts measured by PAA (**) | | Total |
| | | Present value of
future cash flows | | | | | | Present value of
future cash flows | | |
| S/(000) | | S/(000) | | S/(000) | | S/(000) | | S/(000) | | S/(000) |
| Balances at the beginning of the period | (58,399) | | | 899,569 | | | 841,170 | | | (133,054) | | | 1,005,100 | | | 872,046 | |
| Directly attributable expenses incurred | – | | | 504,065 | | | 504,065 | | | – | | | 343,855 | | | 343,855 | |
| Changes related to past services | – | | | (328,799) | | | (328,799) | | | – | | | (158,503) | | | (158,503) | |
| Future service changes | (2,028) | | | – | | | (2,028) | | | (5,735) | | | – | | | (5,735) | |
| Reinsurance recoveries | (2,028) | | | 175,266 | | | 173,238 | | | (5,735) | | | 185,352 | | | 179,617 | |
| Expenses for assigning the premiums paid to the reinsurer | (632,063) | | | – | | | (632,063) | | | (674,214) | | | – | | | (674,214) | |
| Result of the reinsurance service | (634,091) | | | 175,266 | | | (458,825) | | | (679,949) | | | 185,352 | | | (494,597) | |
| Net financial expenses for reinsurance contracts | – | | | 40,528 | | | 40,528 | | | – | | | 30,377 | | | 30,377 | |
| Other changes | (48,573) | | | (46,201) | | | (94,774) | | | (13,237) | | | (18,679) | | | (31,916) | |
| Cash flow: | | | | | | | | | | | |
| Premiums paid net of commissions ceded and other directly attributable expenses paid | 747,662 | | | – | | | 747,662 | | | 767,841 | | | 12 | | | 767,853 | |
| Reinsurance recoveries | – | | | (367,201) | | | (367,201) | | | – | | | (302,593) | | | (302,593) | |
| Net cash flow | 747,662 | | | (367,201) | | | 380,461 | | | 767,841 | | | (302,581) | | | 465,260 | |
| Balances at the end of the period | 6,599 | | | 701,961 | | | 708,560 | | | (58,399) | | | 899,569 | | | 841,170 | |
(*) Includes accounts payable to reinsurers and co-insurers and excess of loss contracts.
(**) Includes accounts receivable from reinsurers and co-insurers.
b) The detail of the liability for insurance contracts are:
| | | | | | | | | | | | | | | | | | | | | | | | | | | | | | | | | | | |
| 2025 |
| Liabilities for remaining coverage | | Liabilities for incurred claims - contracts not measured by PAA | | Liabilities for incurred claims - contracts measured by PAA | | Total |
| Excluding loss component (*) | | Loss component | | Present Value of Fulfillment Cash Flows | | Risk adjustment |
| S/(000) | | S/(000) | | S/(000) | | S/(000) | | S/(000) | | S/(000) |
Balances at the beginning of the period | 9,317,066 | | | 247,799 | | | 1,288,630 | | | 2,544,942 | | | 23,848 | | | 13,422,285 | |
| Insurance income | (4,649,818) | | | 1,118 | | | – | | | – | | | – | | | (4,648,700) | |
| Claims incurred and other insurance service expenses | 56,133 | | | – | | | 842,435 | | | 2,778,176 | | | 125 | | | 3,676,869 | |
| Adjustments relating to the past to liabilities for incurred claims | – | | | – | | | (713,756) | | | (190,799) | | | (3,584) | | | (908,139) | |
| Losses and recoveries for losses in onerous contracts | – | | | 10,686 | | | – | | | – | | | – | | | 10,686 | |
| Amortization of insurance acquisition cash flows | 21,259 | | | – | | | – | | | – | | | – | | | 21,259 | |
| Insurance service expenses | 77,392 | | | 10,686 | | | 128,679 | | | 2,587,377 | | | (3,459) | | | 2,800,675 | |
| Result of the insurance service | (4,572,426) | | | 11,804 | | | 128,679 | | | 2,587,377 | | | (3,459) | | | (1,848,025) | |
| Net financial expenses for insurance contracts | 1,012,259 | | | (6,868) | | | 95,490 | | | 119,361 | | | 946 | | | 1,221,188 | |
| Total changes in the consolidated income statement | (3,560,167) | | | 4,936 | | | 224,169 | | | 2,706,738 | | | (2,513) | | | (626,837) | |
| Investment components | (1,045,427) | | | – | | | 1,045,427 | | | – | | | – | | | – | |
| Acquisition of Pacifico EPS shares | (60,734) | | | – | | | – | | | 175,615 | | | 764 | | | 115,645 | |
| Other changes | (683,280) | | | (7,212) | | | (11,223) | | | (80,224) | | | (600) | | | (782,539) | |
| Cash flow: | | | | | | | | | | | |
| Premiums received | 7,358,881 | | | – | | | – | | | – | | | – | | | 7,358,881 | |
| Claims and other service expenses paid | – | | | – | | | (1,190,631) | | | (3,038,334) | | | – | | | (4,228,965) | |
| Insurance acquisition cash flows | (994,315) | | | – | | | – | | | – | | | – | | | (994,315) | |
| Net cash flow | 6,364,566 | | | – | | | (1,190,631) | | | (3,038,334) | | | – | | | 2,135,601 | |
| Balances at the end of the period | 10,332,024 | | | 245,523 | | | 1,356,372 | | | 2,308,737 | | | 21,499 | | | 14,264,155 | |
(*) Includes accounts receivable of contracts measured under the PAA and debts to intermediaries, marketers and auxiliaries.
| | | | | | | | | | | | | | | | | | | | | | | | | | | | | | | | | | | |
| 2024 |
| Liabilities for remaining coverage | | Liabilities for incurred claims - contracts not measured by PAA | | Liabilities for incurred claims - contracts measured by PAA | | Total |
| Excluding loss component (*) | | Loss component | | Present Value of Fulfillment Cash Flows | | Risk adjustment |
| S/(000) | | S/(000) | | S/(000) | | S/(000) | | S/(000) | | S/(000) |
| Balance at the beginning of the period | 8,379,672 | | | 207,695 | | | 1,212,856 | | | 2,497,439 | | | 20,471 | | | 12,318,133 | |
| Insurance income | (3,779,710) | | | 316 | | | – | | | – | | | – | | | (3,779,394) | |
| Claims incurred and other insurance service expenses | – | | | 8,172 | | | 722,763 | | | 1,535,912 | | | – | | | 2,266,847 | |
| Adjustments relating to the past to liabilities for incurred claims | – | | | (4,365) | | | (550,740) | | | 348,829 | | | 2,277 | | | (203,999) | |
| Losses and recoveries for losses in onerous contracts | – | | | 15,801 | | | – | | | – | | | – | | | 15,801 | |
| Amortization of insurance acquisition cash flows | 7,128 | | | – | | | – | | | – | | | – | | | 7,128 | |
| Insurance service expenses | 7,128 | | | 19,608 | | | 172,023 | | | 1,884,741 | | | 2,277 | | | 2,085,777 | |
| Result of the insurance service | (3,772,582) | | | 19,924 | | | 172,023 | | | 1,884,741 | | | 2,277 | | | (1,693,617) | |
| Net financial expenses for insurance contracts | 553,835 | | | (5,376) | | | 64,928 | | | 126,019 | | | 1,044 | | | 740,450 | |
| Total changes in the consolidated income statement | (3,218,747) | | | 14,548 | | | 236,951 | | | 2,010,760 | | | 3,321 | | | (953,167) | |
| Investment components | (914,866) | | | – | | | 914,866 | | | – | | | – | | | – | |
| Other changes | (4,620) | | | 25,556 | | | 1,171 | | | 9,884 | | | 56 | | | 32,047 | |
| Cash flow: | | | | | | | | | | | – | |
| Premiums received | 5,180,689 | | | – | | | – | | | – | | | – | | | 5,180,689 | |
| Claims and other service expenses paid | – | | | – | | | (1,077,214) | | | (1,973,141) | | | – | | | (3,050,355) | |
| Insurance acquisition cash flows | (105,062) | | | – | | | – | | | – | | | – | | | (105,062) | |
| Net cash flow | 5,075,627 | | | – | | | (1,077,214) | | | (1,973,141) | | | – | | | 2,025,272 | |
| Balances at the end of the period | 9,317,066 | | | 247,799 | | | 1,288,630 | | | 2,544,942 | | | 23,848 | | | 13,422,285 | |
(*) Includes accounts receivable of contracts measured under the PAA and debts to intermediaries, marketers and auxiliaries.
c) The components of the movement are presented below:
| | | | | | | | | | | | | | | | | | | | | | | | | | | | | | | | | | | | | | | | | | | | | | | |
| 2025 | | 2024 |
| Present Value of Fulfillment Cash Flows | | Risk adjustment | | Contractual Service Margin (CSM) | | Total | | Present Value of Fulfillment Cash Flows | | Risk adjustment
| | Contractual Service Margin (CSM) | | Total
|
| S/(000) | | S/(000) | | S/(000) | | S/(000) | | S/(000) | | S/(000) | | S/(000) | | S/(000) |
Balances at the beginning of the period | 9,164,961 | | | 152,793 | | | 1,258,050 | | | 10,575,804 | | | 8,220,567 | | | 144,207 | | | 1,202,240 | | | 9,567,014 | |
| Changes in the statement of income: | | | | | | | | | | | | | | | |
| Changes in estimates that adjust the CSM | 873 | | | 11,354 | | | (12,122) | | | 105 | | | (19,665) | | | 4,441 | | | 9,535 | | | (5,689) | |
| Changes in estimates that result in losses and recoveries for contract losses onerous | (6,299) | | | 2,109 | | | (5,783) | | | (9,973) | | | (8,949) | | | (681) | | | – | | | (9,630) | |
| Initial recognition contracts | (122,940) | | | 16,992 | | | 140,510 | | | 34,562 | | | (102,195) | | | 9,628 | | | 123,461 | | | 30,894 | |
| Changes related to future services | (128,366) | | | 30,455 | | | 122,605 | | | 24,694 | | | (130,809) | | | 13,388 | | | 132,996 | | | 15,575 | |
| CSM recognized for services provided | – | | | – | | | (137,032) | | | (137,032) | | | – | | | – | | | (125,610) | | | (125,610) | |
| Changes in the risk adjustment recognized for the expired risk | – | | | (21,026) | | | – | | | (21,026) | | | – | | | (20,039) | | | – | | | (20,039) | |
| Experience adjustments | 931,751 | | | – | | | – | | | 931,751 | | | 829,682 | | | – | | | – | | | 829,682 | |
| Changes related to current services | 931,751 | | | (21,026) | | | (137,032) | | | 773,693 | | | 829,682 | | | (20,039) | | | (125,610) | | | 684,033 | |
| Adjustments to liabilities for incurred claims | (858,036) | | | 10,219 | | | – | | | (847,817) | | | (713,268) | | | 9,927 | | | – | | | (703,341) | |
| Result of the insurance service | (54,651) | | | 19,648 | | | (14,427) | | | (49,430) | | | (14,395) | | | 3,276 | | | 7,386 | | | (3,733) | |
| Net financial expenses for insurance contracts | 1,048,399 | | | 4,032 | | | 48,449 | | | 1,100,880 | | | 564,473 | | | 3,896 | | | 45,118 | | | 613,487 | |
| Total changes in the consolidated income statement | 993,748 | | | 23,680 | | | 34,022 | | | 1,051,450 | | | 550,078 | | | 7,172 | | | 52,504 | | | 609,754 | |
| Other changes | (470,998) | | | (12,040) | | | (80,955) | | | (563,993) | | | 51,293 | | | 1,414 | | | 3,306 | | | 56,013 | |
| Cash flow: | | | | | | | | | | | | | | | |
| Premiums collected | 1,886,374 | | | – | | | – | | | 1,886,374 | | | 1,500,797 | | | – | | | – | | | 1,500,797 | |
| Benefits and expenses paid | (1,190,631) | | | – | | | – | | | (1,190,631) | | | (1,077,186) | | | – | | | – | | | (1,077,186) | |
| Acquisition fees paid | (101,310) | | | – | | | – | | | (101,310) | | | (80,588) | | | – | | | – | | | (80,588) | |
| Net cash flow | 594,433 | | | – | | | – | | | 594,433 | | | 343,023 | | | – | | | – | | | 343,023 | |
| Balances at the end of the period | 10,282,144 | | | 164,433 | | | 1,211,117 | | | 11,657,694 | | | 9,164,961 | | | 152,793 | | | 1,258,050 | | | 10,575,804 | |
As of December 31, 2025, the insurance contract liabilities measured under the general model is S/10,507.1 million (as of December 31, 2024, S/9,536.8 million) and the variable fee approach (VFA) is S/1,150.6 million (as of December, 2024, S/1,039.0 million).
As of December 31, 2025, the contractual service margin of insurance contracts that existed at the transition date to which the entity has applied the fair value approach totals approximately S/645.6 million, see Note 22 (f).
9 PROPERTY, FURNITURE AND EQUIPMENT, NET
a) The composition of property, furniture and equipment and accumulated depreciation, for the years ended December 31, 2025, 2024, and 2023 is as follows:
| | | | | | | | | | | | | | | | | | | | | | | | | | | | | | | | | | | | | | | | | | | | | | | | | | | | | | | | | | | |
| Land | | Buildings and other constructions | | Installations | | Furniture and fixtures | | Computer hardware | | Vehicles and equipment | | Work in progress | | 2025 | | 2024 | | 2023 |
| S/(000) | | S/(000) | | S/(000) | | S/(000) | | S/(000) | | S/(000) | | S/(000) | | S/(000) | | S/(000) | | S/(000) |
| Cost - | | | | | | | | | | | | | | | | | | | |
| Balance as of January 1 | 294,154 | | | 1,174,807 | | | 869,849 | | | 505,767 | | | 660,837 | | | 106,043 | | | 91,017 | | | 3,702,474 | | | 3,572,286 | | | 3,463,196 | |
| Additions | 22,824 | | | 73,829 | | | 44,910 | | | 55,550 | | | 34,940 | | | 3,347 | | | 99,780 | | | 335,180 | | | 310,144 | | | 322,371 | |
Acquisition of business, Note 2(a) (*) | 318,329 | | | 297,627 | | | 4,067 | | | 23,277 | | | 7,762 | | | 58,828 | | | 21,826 | | | 731,716 | | | – | | | 455 | |
| Transfers | – | | | 3,922 | | | 26,644 | | | 14,916 | | | 17,756 | | | 2,059 | | | (65,297) | | | – | | | – | | | – | |
| Disposals and others (**) | (106,045) | | | (122,792) | | | (41,096) | | | (22,247) | | | (39,056) | | | 6,399 | | | (44,848) | | | (369,685) | | | (179,956) | | | (213,736) | |
| Balance as of December 31 | 529,262 | | | 1,427,393 | | | 904,374 | | | 577,263 | | | 682,239 | | | 176,676 | | | 102,478 | | | 4,399,685 | | | 3,702,474 | | | 3,572,286 | |
| | | | | | | | | | | | | | | | | | | |
| Accumulated depreciation - | | | | | | | | | | | | | | | | | | | |
| Balance as of January 1 | – | | | 751,306 | | | 599,278 | | | 330,257 | | | 491,962 | | | 91,062 | | | – | | | 2,263,865 | | | 2,214,761 | | | 2,182,098 | |
| Depreciation of the period | – | | | 15,243 | | | 45,512 | | | 35,849 | | | 70,806 | | | 20,394 | | | – | | | 187,804 | | | 153,531 | | | 129,108 | |
| Disposals and others (**) | – | | | (25,039) | | | (31,562) | | | (22,608) | | | (37,659) | | | (4,133) | | | – | | | (121,001) | | | (104,427) | | | (96,445) | |
| Balance as of December 31 | – | | | 741,510 | | | 613,228 | | | 343,498 | | | 525,109 | | | 107,323 | | | – | | | 2,330,668 | | | 2,263,865 | | | 2,214,761 | |
| | | | | | | | | | | | | | | | | | | |
| Net carrying amount | 529,262 | | | 685,883 | | | 291,146 | | | 233,765 | | | 157,130 | | | 69,353 | | | 102,478 | | | 2,069,017 | | | 1,438,609 | | | 1,357,525 | |
Banks, financial institutions and insurance entities operating in Peru cannot pledge their fixed assets.
During 2025, 2024 and 2023 the Group, as part of its investment in fixed assets, made disbursements mainly related to the renovation of its various branches and the purchase of computer equipment, furniture, and fixtures. The Group maintains insurance on its main assets in accordance with the policies established by Management.
The Group maintains insurance coverage over its main assets in accordance with policies established by Management.
As of December 31, 2025, additions include S/50.5 million, corresponding to the value of foreclosed properties that were transferred as property of the Group in October 2025.
Management periodically reviews the residual value of the assets, their useful life, and the depreciation method used, in order to ensure that they remain consistent with the economic benefits and expected lifespan. In the opinion of the Group’s Management, there is no evidence of impairment in the value of the fixed assets held by the Group as of December 31, 2025, December 31, 2024, and December 31, 2023.
As a result of the implementation of IFRS 17, the depreciation expense of property and equipment is allocated in the consolidated statement of income between depreciation expense and the expense attributable to insurance and reinsurance results, amounting to S/181.4 million and S/6.4 million for the year 2025; S/149.9 million and S/3.6 million, respectively, for the year 2024; and S/125.0 million and S/4.1 million, respectively, for the year 2023.
(*) The increase is due to the acquisition of Pacífico EPS and Subsidiaries in March 2025, see Note 2(a).
(**) Includes transactions related to the sale, retirement and other disposals of assets that are no longer required for the Group’s operations.
10 INTANGIBLE ASSETS AND GOODWILL, NET
a) Intangible assets –
The composition of intangible assets with limited useful life and accumulated amortization as of December 31, 2025, 2024 and 2023 was as follows:
| | | | | | | | | | | | | | | | | | | | | | | | | | | | | | | | | | | | | | | | | | | | | | | | | | | | | | | | |
| Description | | Client
relationships
(i) | | Brand
name (ii) | | Fund
manager
contract (iii) | | Relationships
with holders | | Software, Prepaid service contract and others | | Intangible
in
progress | | 2025 | | 2024 | | 2023 |
| | S/(000) | | S/(000) | | S/(000) | | S/(000) | | S/(000) | | S/(000) | | S/(000) | | S/(000) | | S/(000) |
| Cost - | | | | | | | | | | | | | | | | | | |
Balance at January 1 | | 372,009 | | | 175,321 | | | 69,541 | | | 21,100 | | | 5,179,719 | | | 608,747 | | | 6,426,437 | | | 5,861,379 | | | 5,167,235 | |
| Additions | | - | | | - | | | - | | | - | | | 556,945 | | | 427,026 | | | 983,971 | | | 801,290 | | | 828,803 | |
| Acquisition of business, Note 2(a) (*) | | 293,800 | | | 365,372 | | | - | | | - | | | 32,707 | | | 16,728 | | | 708,607 | | | - | | | 16,642 | |
| Transfers | | - | | | - | | | - | | | - | | | 277,464 | | | (277,464) | | | - | | | - | | | - | |
| Disposals and others (**) | | (22,869) | | | - | | | 999 | | | - | | | (80,607) | | | (107,919) | | | (210,396) | | | (236,232) | | | (151,301) | |
| Balance as of December 31 | | 642,940 | | | 540,693 | | | 70,540 | | | 21,100 | | | 5,966,228 | | | 667,118 | | | 7,908,619 | | | 6,426,437 | | | 5,861,379 | |
| | | | | | | | | | | | | | | | | | |
Accumulated amortization - | | | | | | | | | | | | | | | | | | |
Balance at January 1 | | 332,464 | | | 72,666 | | | 18,162 | | | 21,100 | | | 3,415,249 | | | - | | | 3,859,641 | | | 3,434,362 | | | 3,040,019 | |
Amortization of the period | | 16,152 | | | 9,235 | | | 3,656 | | | - | | | 585,729 | | | - | | | 614,772 | | | 482,894 | | | 436,584 | |
| Disposals and others (**) | | (22,618) | | | - | | | - | | | - | | | (54,712) | | | - | | | (77,330) | | | (57,615) | | | (42,241) | |
| Balance as of December 31 | | 325,998 | | | 81,901 | | | 21,818 | | | 21,100 | | | 3,946,266 | | | - | | | 4,397,083 | | | 3,859,641 | | | 3,434,362 | |
| | | | | | | | | | | | | | | | | | |
| Net carrying amount | | 316,942 | | | 458,792 | | | 48,722 | | | - | | | 2,019,962 | | | 667,118 | | | 3,511,536 | | | 2,566,796 | | | 2,427,017 | |
During 2025, 2024 and 2023, the Group, as part of its investment in intangible assets, incurred expenditures mainly related to the development, acquisition, and strengthening of these assets.
The Group maintains insurance coverage over its main assets in accordance with the policies established by Management.
Management also periodically reviews the residual value, useful life, and amortization method applied to intangible assets in order to ensure that they are consistent with the expected economic benefits and their estimated useful lives. In the opinion of the Group’s Management, there is no evidence of impairment of the value of the intangible assets held as of December 31, 2025, December 31, 2024, and December 31, 2023.
As a result of the implementation of IFRS 17, amortization expense related to intangible assets is allocated in the consolidated statement of income between the amortization line item and the attributable expense included in insurance technical results, amounting to S/564.8 million and S/50.0 million, respectively, for the year 2025; S/420.9 million and S/62.0 million, respectively, for the year 2024; and S/386.1 million and S/50.5 million, respectively, for the year 2023.
(*) The increase is due to the acquisition of Pacífico EPS and Subsidiaries in March 2025; see Note 2(a).
(**) Includes transactions related to the sale, retirement and other disposals of intangible assets that are no longer required for the Group’s operations.
(i) Client relationships -
This item consists of the following:
| | | | | | | | | | | |
| 2025 | | 2024 |
| S/(000) | | S/(000) |
| | | |
| Pacifico S.A. Entidad Prestadora de Salud | 77,642 | | | — | |
| Laboratorios ROE S.A | 63,708 | | | — | |
| Clínica San Felipe S.A. | 31,350 | | | — | |
| Centro Médico Odontológico Americano S.A.C | 21,633 | | | — | |
| Clínica Sanchez Ferrer S.A | 21,450 | | | — | |
| Oncocare S.A.C | 17,692 | | | — | |
| La esperanza del Perú S. A | 14,575 | | | — | |
| Clínica Belén | 12,283 | | | — | |
| Clínica del Sur | 11,550 | | | — | |
| Credicorp Capital Holding Chile - Inversiones IMT | 9,626 | | | 10,892 | |
| Prosemedic S.A.C | 9,167 | | | — | |
| Prima AFP – AFP Unión Vida | 8,567 | | | 20,813 | |
| Clínica el Golf | 7,517 | | | — | |
| Ultraserfinco S.A | 3,950 | | | 5,049 | |
| Tenpo Bank | 3,203 | | | — | |
| Doctor + S.A.C | 1,283 | | | — | |
| Compañía Incubadora de Soluciones Móviles S.A.- Culqi | 1,000 | | | 1,467 | |
| Tenpo SpA | 746 | | | 1,011 | |
| Joinnus | — | | | 313 | |
| 316,942 | | | 39,545 | |
(ii) Brand name -
This item consists of the following:
| | | | | | | | | | | |
| 2025 | | 2024 |
| S/(000) | | S/(000) |
| | | |
| ROE | 111,100 | | | — | |
| Mibanco | 90,612 | | | 99,437 | |
| Clinica San Felipe | 48,100 | | | — | |
| Clinica San Borja | 39,000 | | | — | |
| Sanna | 23,271 | | | — | |
| Clínica el Golf | 22,300 | | | — | |
| Doctor Más | 20,700 | | | — | |
| ACML | 20,400 | | | — | |
| Aliada | 20,100 | | | — | |
| Clinica Belén | 14,100 | | | — | |
| COA | 13,800 | | | — | |
| Clínica Sanchez Ferrer | 12,800 | | | — | |
| Clínica del Sur | 10,300 | | | — | |
| PMD | 9,400 | | | — | |
| Joinnus | 2,809 | | | 3,155 | |
| Culqi | — | | | 63 | |
| 458,792 | | | 102,655 | |
(iii) Fund management contract -
This item consists of the following:
| | | | | | | | | | | |
| 2025 | | 2024 |
| S/(000) | | S/(000) |
| | | |
| Credicorp Capital Colombia S.A. | 25,113 | | | 23,183 | |
| Credicorp Capital Holding Chile - Inversiones IMT | 21,532 | | | 26,071 | |
| Ultrasefinco S.A. | 2,077 | | | 2,125 | |
| 48,722 | | | 51,379 | |
b) Goodwill -
Goodwill acquired through business combinations has been allocated to each subsidiary or groups of them, which are also identified as a CGUs for the purposes of impairment testing.
| | | | | | | | | | | |
| 2025 | | 2024 |
| S/(000) | | S/(000) |
| Pacífico EPS and Medical Services, see Note 2 | 528,499 | | | — | |
| Mibanco - Edyficar Perú | 273,694 | | | 273,694 | |
| Prima AFP - AFP S.A | 124,641 | | | 124,641 | |
| Credicorp Capital Colombia S.A | 104,031 | | | 99,841 | |
| Banco de Crédito del Perú | 52,359 | | | 52,359 | |
| Mibanco Colombia | 46,134 | | | 44,229 | |
| Pacífico Seguros | 36,354 | | | 36,354 | |
| Atlantic Security Holding Corporation | 29,795 | | | 29,795 | |
| Monokera S.A.S. | 22,656 | | | 22,656 | |
| Tenpo SpA | 20,666 | | | 20,927 | |
| Tenpo Technologies SpA | 9,798 | | | 9,945 | |
| Joinnus S.A.C. | 4,135 | | | 7,824 | |
| Crediseguro Seguros Personales | 96 | | | 96 | |
| Net carrying amount | 1,252,858 | | | 722,361 | |
The recoverable amount of all of the CGUs has been determined based on the present value of the discounted cash flows or dividends determined principally with assumptions of revenue and expenses projection (based on efficiency ratios).
Goodwill balance of Mibanco Colombia, Credicorp Capital Colombia S.A, Tenpo SPA and Tenpo Technologies SpA. is affected by the effect of the local exchange rate currency of the country in which they operate against the exchange rate of functional currency of Credicorp Ltd. and subsidiaries.
For the year 2025, the Group performed an assessment of goodwill impairment and concluded that there was no indication of impairment. Accordingly, the Group did not recognize any goodwill impairment loss.
For the year 2024, the Group recorded an impairment in the following companies: Joinnus S.A. for S/12.0 million, Wally POS S.A.C for S/9.0 million, Sami Shop for S/4.0 million and Compañía Incubadora de Soluciones Móviles S.A. for S/2.3 million.
The following table summarizes the key assumptions used for the calculation of fair value fewer selling costs in 2025 and 2024:
| | | | | | | | | | | |
| 2025 |
| Description | Perpetual
growth
rate | | Discount rate |
| % | | % |
| Mibanco - Edyficar Perú | 5.60 | | | 10.60 | |
| Prima AFP - AFP Unión Vida | 1.60 | | | 14.50 | |
| Credicorp Capital Colombia | 3.80 | | | 14.40 | |
| Banco de Crédito del Perú | 4.60 | | | 9.60 | |
| Mibanco Colombia | 5.90 | | | 12.30 | |
| Pacífico Seguros (*) | 4.60 | | | 9.90 and 11.30 |
| Atlantic Security Holding Corporation | 3.00 | | | 11.40 | |
| Monokera S.A.S. | - | | | 30.00 | |
| Tenpo | - | | | 25.00 | |
| Joinnus S.A.C. | - | | | 25.00 | |
| | | | | | | | | | | |
| 2024 |
| Description | Perpetual
growth
rate | | Discount rate |
| % | | % |
| Mibanco - Edyficar Perú | 5.60 | | | 11.90 | |
| Prima AFP - AFP Unión Vida | 1.60 | | | 14.20 | |
| Credicorp Capital Colombia | 3.80 | | | 14.40 | |
| Banco de Crédito del Perú | 4.60 | | | 10.90 | |
| Mibanco Colombia | 6.10 | | | 13.80 | |
| Pacífico Seguros (*) | 4.60 | | | 10.70 and 12.30 |
| Atlantic Security Holding Corporation | 2.30 | | | 11.30 | |
| Monokera | – | | | 30.00 | |
| Tenpo | – | | | 25.00 | |
| Joinnus S.A.C | – | | | 25.00 | |
| Compañía Incubadora de Soluciones Móviles S.A - Culqi | – | | | 30.00 | |
| Wally POS S.A.C | - | | | 25.00 | |
| Sami Shop S.A.C | - | | | 25.00 | |
(*) As of December 31, 2025, and 2024, it corresponds to the discount rates used to determine the recoverable value of the cash flows that correspond to the general and life insurance business lines.
Five years of cash flows, depending on the business maturity, were included in the discounted cash flow model. The growth rate estimates are based on historic performance and management’s expectations of market development. A long-term growth rate to perpetuity has been determined taking into account forecasts included in industry reports.
Discount rates represent the current market assessment of the specific risks to each CGU. The discount rate is derived from the capital asset pricing model (CAPM). The cost of equity is derived from the expected return on investment by the Group’s investors, specific risk incorporated by applying individual comparable beta factors adjusted by the debt structure of each CGU and country and market specific risk premiums to each CGU. The beta factors are evaluated annually based on publicly available market data.
The key assumptions described above may change if market and economic conditions change. As of December 31, 2025 and 2024, the Group estimates that reasonably possible changes in these assumptions would not cause the recoverable amount of all CGUs to decline below their carrying amount.
11 RIGHT-OF-USE ASSETS AND LEASE LIABILITIES
a) Right-of-use
The Group has leased agreements according to the following composition:
| | | | | | | | | | | | | | | | | | | | | | | | | | | | | | | | | | | | | | | | | |
| Property,
Agencies and
offices | | Servers and
technology
platforms | | Transport
units | | Other leases | | 2025 | | 2024 | | 2023 |
| S/(000) | | S/(000) | | S/(000) | | S/(000) | | S/(000) | | S/(000) | | S/(000) |
| | | | | | | | | | | | | |
| Cost - | | | | | | | | | | | | | |
| Balance as of January 1 | 860,095 | | | 150,768 | | | 8,050 | | | 79,300 | | | 1,098,213 | | | 1,085,243 | | | 1,026,891 | |
| Additions | 206,200 | | | 92,767 | | | 401 | | | 4,953 | | | 304,321 | | | 52,441 | | | 122,841 | |
| Acquisition of Pacifico EPS shares, Note 2(a) | 128,049 | | | – | | | – | | | – | | | 128,049 | | | – | | | – | |
| Disposal and others | (60,064) | | | (145,140) | | | (72) | | | (707) | | | (205,983) | | | (39,471) | | | (64,489) | |
| Balance as of December 31 | 1,134,280 | | | 98,395 | | | 8,379 | | | 83,546 | | | 1,324,600 | | | 1,098,213 | | | 1,085,243 | |
| | | | | | | | | | | | | |
| Accumulated depreciation - | | | | | | | | | | | | | |
| Balance as of January 1 | 516,464 | | | 123,641 | | | 3,324 | | | 52,246 | | | 695,675 | | | 585,528 | | | 483,058 | |
| Depreciation of the period | 129,215 | | | 17,655 | | | 1,136 | | | 15,008 | | | 163,014 | | | 142,640 | | | 147,833 | |
| Disposal and others | (22,524) | | | (114,334) | | | 12 | | | (684) | | | (137,530) | | | (32,493) | | | (45,363) | |
| Balance as of December 31 | 623,155 | | | 26,962 | | | 4,472 | | | 66,570 | | | 721,159 | | | 695,675 | | | 585,528 | |
| | | | | | | | | | | | | |
| Net carrying amount | 511,125 | | | 71,433 | | | 3,907 | | | 16,976 | | | 603,441 | | | 402,538 | | | 499,715 | |
The Group maintains contracts, with certain renewal options and for which the Group has reasonable certainty that this option will be exercised. In these cases, the period of lease used to measure the liability and assets corresponds to an estimation of future renovations.
As of 2025, following the acquisition of Pacífico EPS and its subsidiaries, part of the depreciation for the period of right-of-use assets is included in the cost of sales of medical services in the amount of S/16.1 million.
b) Lease liabilities
Lease liabilities include the present value of fixed payments and variable lease payments. Lease payments made under renewal options with reasonable certainty of being exercised are included in the measurement of the liability.
Lease payments are discounted using the interest rate implicit in the lease, if that rate could be readily determined, or the interest rate that the lessee would have to pay to borrow the funds necessary to obtain an asset of similar value to the right-of-use asset, for a similar term, in a similar economic environment with similar terms, guarantees and conditions.
Lease liabilities are recorded at amortized cost, recognizing the interest in the caption “Interest, income and similar expenses” in the consolidated statement of income, and the installments that are paid will be subtracted. As of December 31, 2025 and 2024, financial lease liability amounts to S/612.3 million and S/404.8 million, respectively.
12 OTHER ASSETS AND OTHER LIABILITIES
a) This item consists of the following:
| | | | | | | | | | | |
| 2025 | | 2024 |
| S/(000) | | S/(000) |
| Other assets - | | | |
| Financial instruments: | | | |
| Receivables (b) | 1,577,490 | | | 1,225,171 | |
| Derivatives receivable (c) | 1,231,865 | | | 904,791 | |
| Receivables from sale of investments (d) | 787,539 | | | 824,988 | |
| Margin call and others (e) | 2,604,469 | | | 1,087,831 | |
| Operations in process (f) | 133,045 | | | 131,029 | |
| 6,334,408 | | | 4,173,810 | |
| | | |
| Non-financial instruments: | | | |
| Claim filed with the Tax Authority (l), Note 31 | 1,577,175 | | | — | |
| Investment properties, net (g) | 795,506 | | | 625,105 | |
| Deferred fees (h) | 709,384 | | | 1,026,896 | |
| Improvements in leased premises | 254,018 | | | 149,298 | |
| VAT (IGV) tax credit | 121,351 | | | 70,339 | |
| Income tax prepayments, net | 119,910 | | | 226,847 | |
| Adjudicated assets, net | 90,286 | | | 166,179 | |
| Investment in associates (i) | 65,338 | | | 763,918 | |
| Others | 78,171 | | | 31,763 | |
| 3,811,139 | | | 3,060,345 | |
| Total | 10,145,547 | | | 7,234,155 | |
| | | | | | | | | | | |
| 2025 | | 2024 |
| S/(000) | | S/(000) |
| Other liabilities - | | | |
| Financial instruments: | | | |
| Accounts payable (j) | 2,678,539 | | | 2,366,147 | |
| Salaries and other personnel expenses | 1,746,168 | | | 1,335,800 | |
| Derivatives payable (c) | 1,047,907 | | | 819,473 | |
| Accounts payable for acquisitions of investments (d) | 657,417 | | | 832,530 | |
| Allowance for indirect loan losses, Note 7(c) | 371,576 | | | 383,918 | |
| Operations in process (f) | 158,178 | | | 227,549 | |
| Dividends payable | 88,219 | | | 74,183 | |
| 6,748,004 | | | 6,039,600 | |
| Non-financial instruments: | | | |
| Taxes | 723,433 | | | 786,659 | |
| Provision for sundry risks (k) | 625,117 | | | 646,739 | |
| Others | 168,525 | | | 147,308 | |
| 1,517,075 | | | 1,580,706 | |
| Total | 8,265,079 | | | 7,620,306 | |
b) As of December 31, 2025 and 2024, the balance is mainly composed of trade receivables from third parties arising from the sale of goods and services, receivables from payment operators related to credit and debit card transactions pending settlement, indemnities, third-party claims, commissions receivable, advances to employees, rental receivables, among others.
c) The risk in derivative contracts arises from the possibility of the counterparty failing to comply with the terms and conditions agreed and that the reference rates at which the transactions took place change.
The table below shows as of December 31, 2025, and 2024 the fair value of derivative financial instruments, recorded as an asset or a liability, together with their notional amounts and maturities. The nominal amount, recorded gross, is the amount of a derivative’s underlying asset and is the basis upon which fair value of derivatives is measured.
| | | | | | | | | | | | | | | | | | | | | | | | | | | | | | | | | | | | | | | | | | | | | | | | | | | | | | | | | | | |
| | | 2025 | | 2024 | | 2025 and 2024 |
| Note | | Assets | | Liabilities | | Notional amount | | Maturity | | Assets | | Liabilities | | Notional amount | | Maturity | | Related instruments |
| | | S/(000) | | S/(000) | | S/(000) | | | | S/(000) | | S/(000) | | S/(000) | | | | |
| Derivatives held for trading (i) - | | | | | | | | | | | | | | | | | | | |
| Foreign currency forwards | | | 546,954 | | | 283,787 | | | 32,518,743 | | | January 2026 / November 2037 | | 161,495 | | | 210,947 | | | 33,716,473 | | | January 2025 / April 2027 | | – |
| Interest rate swaps | | | 444,343 | | | 396,355 | | | 53,011,798 | | | January 2026 / November 2040 | | 456,575 | | | 352,677 | | | 48,119,429 | | | January 2025 / January 2035 | | – |
| Currency swaps | | | 223,448 | | | 346,591 | | | 10,928,546 | | | January 2026 / February 2037 | | 219,648 | | | 230,848 | | | 13,625,101 | | | January 2025 / November 2034 | | – |
| Foreign exchange options | | | 5,532 | | | 4,263 | | | 842,734 | | | January 2026 / December 2026 | | 3,018 | | | 8,420 | | | 743,202 | | | January 2025/ April 2026 | | – |
| Futures | | | 97 | | | 3 | | | 38,338 | | | March 2026 | | 1,477 | | | 120 | | | 23,713 | | | March 2025 | | – |
| | | 1,220,374 | | | 1,030,999 | | | 97,340,159 | | | | | 842,213 | | | 803,012 | | | 96,227,918 | | | | | |
| Derivatives held as hedges | | | | | | | | | | | | | | | | | | | |
| Cash flow hedges - | | | | | | | | | | | | | | | | | | | |
| Cross interest rate swaps (IRS) | 4(b)(i) | | 677 | | | – | | | 504,450 | | | April 2026 / May 2026 | | – | | | 970 | | | 564,600 | | | April 2026 / May 2026 | | Cash and due from banks |
| Cross currency swaps (CCS) | 15(a)(iii) | | – | | | – | | | – | | | − | | – | | | 5,937 | | | 71,940 | | | November 2025 | | Bonds issued / Loans (**) |
| Cross currency swaps (CCS) | 15(a)(iv) | | – | | | – | | | – | | | − | | 18,993 | | | 2,359 | | | 828,080 | | | January 2025 | | Bonds issued |
| Cross currency swaps (CCS) | 14(b)(i) | | – | | | – | | | – | | | − | | – | | | 5,242 | | | 225,840 | | | May 2025 / June 2025 | | Debts to bank |
| Cross currency swaps (CCS) | 6(b)(i) | | – | | | – | | | – | | | − | | 1,802 | | | 1,852 | | | 46,970 | | | January 2025 / April 2025 | | Investments (*) |
| | | | | | | | | | | | | | | | | | | |
| Fair value hedges - | | | | | | | | | | | | | | | | | | | |
| Interest rate swaps (IRS) | 6(b)(i) | | 10,593 | | | – | | | 504,450 | | | May 2026 / February 2028 | | 33,027 | | | – | | | 790,440 | | | March 2025 / February 2028 | | Investments (*) |
| Foreign currency forwards | 6(b)(i) | | 193 | | | 14,839 | | | 167,286 | | | January 2026 / July 2026 | | 5,597 | | | 98 | | | 125,173 | | | January 2025 / February 2026 | | Investments (*) |
| Foreign currency forwards | 7(g) | | 28 | | | 2,069 | | | 44,858 | | | January 2026 / December 2026 | | 3,159 | | | 3 | | | 136,603 | | | March 2025 / December 2025 | | Loans |
| | | 11,491 | | | 16,908 | | | 1,221,044 | | | | | 62,578 | | | 16,461 | | | 2,789,646 | | | | | |
| | | 1,231,865 | | | 1,047,907 | | | 98,561,203 | | | | | 904,791 | | | 819,473 | | | 99,017,564 | | | | | |
(*) Corresponds to investments classified at the fair value through other comprehensive income under IFRS 9 as of December 31, 2025 and 2024.
(**) As of December 31, 2025, the cross-currency swap (CCS) contracts held by the Group expired. As of December 31, 2024, the Group held cross-currency swap contracts for a notional amount of ¥3,000.0 million, equivalent to $19.1 million), which were decomposed by risk variables into
two cross-currency swaps (CCS) for the purpose of being designated as cash flow hedges and re-expressing the initial exposures in the functional currency, as follows:
- JPY-PEN for ¥3,000.0 million, equivalent to S/71.9 million as of December 31, 2024, designated for cash flow hedges of bonds issued in yen.
- PEN-USD for $20.3 million equivalent to S/76.4 million as of December 31, 2024, designated for cash flow hedging of U.S. Dollar placements up to that amount.
(i) Held-for-trading derivatives are principally negotiated to satisfy customers’ needs. On the other hand, the Group may also take positions with the expectation of profiting from favorable movements in prices or rates. Also, this caption includes any derivatives which do not comply with IFRS 9 hedge accounting requirements. Fair value of derivatives held for trading classified by contractual maturity is as follows:
| | | | | | | | | | | | | | | | | | | | | | | | | | | | | | | | | | | | | | | | | | | | | | | | | | | | | | | | | | | | | | | | | | | | | | | |
| 2025 | | 2024 |
| Up to 3
months | | From 3
months
to 1 year | | From 1 to
3 years | | From 3 to 5
years | | Over 5
years | | Total | | Up to 3
months | | From 3
months
to 1 year | | From 1 to
3 years | | From 3 to 5
years | | Over 5
years | | Total |
| S/(000) | | S/(000) | | S/(000) | | S/(000) | | S/(000) | | S/(000) | | S/(000) | | S/(000) | | S/(000) | | S/(000) | | S/(000) | | S/(000) |
| Foreign currency forwards | 349,599 | | | 196,334 | | | 1,021 | | | – | | | – | | | 546,954 | | | 106,414 | | | 53,498 | | | 1,583 | | | – | | | – | | | 161,495 | |
| Interest rate swaps | 32,636 | | | 30,009 | | | 99,905 | | | 78,043 | | | 203,750 | | | 444,343 | | | 22,151 | | | 33,774 | | | 141,134 | | | 82,228 | | | 177,288 | | | 456,575 | |
| Currency swaps | 5,077 | | | 46,348 | | | 98,221 | | | 44,115 | | | 29,687 | | | 223,448 | | | 43,713 | | | 31,998 | | | 72,826 | | | 56,141 | | | 14,970 | | | 219,648 | |
| Foreign exchange options | 2,948 | | | 2,584 | | | – | | | – | | | – | | | 5,532 | | | 1,175 | | | 1,369 | | | 474 | | | – | | | – | | | 3,018 | |
| Futures | 97 | | | – | | | – | | | – | | | – | | | 97 | | | 1,477 | | | – | | | – | | | – | | | – | | | 1,477 | |
| Total assets | 390,357 | | | 275,275 | | | 199,147 | | | 122,158 | | | 233,437 | | | 1,220,374 | | | 174,930 | | | 120,639 | | | 216,017 | | | 138,369 | | | 192,258 | | | 842,213 | |
| | | | | | | | | | | | | | | | | | | | | | | | | | | | | | | | | | | | | | | | | | | | | | | | | | | | | | | | | | | | | | | | | | | | | | | |
| 2025 | | 2024 |
| Up to 3
months | | From 3
months
to 1 year | | From 1 to
3 years | | From 3 to 5
years | | Over 5
years | | Total | | Up to 3
months | | From 3
months
to 1 year | | From 1 to
3 years | | From 3 to 5
years | | Over 5
years | | Total |
| S/(000) | | S/(000) | | S/(000) | | S/(000) | | S/(000) | | S/(000) | | S/(000) | | S/(000) | | S/(000) | | S/(000) | | S/(000) | | S/(000) |
| Foreign currency forwards | 167,894 | | | 111,108 | | | 4,785 | | | – | | | – | | | 283,787 | | | 141,078 | | | 67,531 | | | 2,338 | | | – | | | – | | | 210,947 | |
| Interest rate swaps | 25,645 | | | 23,324 | | | 60,152 | | | 87,809 | | | 199,425 | | | 396,355 | | | 21,591 | | | 50,376 | | | 88,792 | | | 29,965 | | | 161,953 | | | 352,677 | |
| Currency swaps | 101,725 | | | 64,491 | | | 88,744 | | | 50,879 | | | 40,752 | | | 346,591 | | | 26,293 | | | 25,499 | | | 79,045 | | | 71,857 | | | 28,154 | | | 230,848 | |
| Foreign exchange options | 1,706 | | | 2,557 | | | – | | | – | | | – | | | 4,263 | | | 3,175 | | | 4,075 | | | 1,170 | | | – | | | – | | | 8,420 | |
| Futures | 3 | | | – | | | – | | | – | | | – | | | 3 | | | 120 | | | – | | | – | | | – | | | – | | | 120 | |
| Total liabilities | 296,973 | | | 201,480 | | | 153,681 | | | 138,688 | | | 240,177 | | | 1,030,999 | | | 192,257 | | | 147,481 | | | 171,345 | | | 101,822 | | | 190,107 | | | 803,012 | |
(ii) The Group is exposed to variability in future cash flows on assets and liabilities in foreign currency and/or those that bear interest at variable rates. The Group uses derivative financial instruments as cash flow hedges to cover these risks. A schedule indicating the periods when the current cash flow hedges are expected to occur and affect the consolidated statement of income, net of deferred income tax is presented below:
| | | | | | | | | | | | | | | | | | | | | | | | | | | | | | | | | | | | | | | | | | | | | | | | | | | | | | | | | | | |
| 2025 | | 2024 |
| Up to 1
year | | From 1 to
3 years | | From 3 to 5
years | | Over 5
years | | Total | | Up to 1
year | | From 1 to
3 years | | From 3 to 5
years | | Over 5
years | | Total |
| S/(000) | | S/(000) | | S/(000) | | S/(000) | | S/(000) | | S/(000) | | S/(000) | | S/(000) | | S/(000) | | S/(000) |
| Cash inflows (assets) | 506,116 | | | – | | | – | | | – | | | 506,116 | | | 1,202,322 | | | 568,812 | | | – | | | – | | | 1,771,134 | |
| Cash outflows (liabilities) | (506,042) | | | – | | | – | | | – | | | (506,042) | | | (1,190,257) | | | (566,730) | | | – | | | – | | | (1,756,987) | |
| Consolidated statement of income | 448 | | | – | | | – | | | – | | | 448 | | | 2,764 | | | 1,845 | | | – | | | – | | | 4,609 | |
d) As of December 31, 2025 and 2024, this balance corresponds to accounts receivable and payable for the sale and purchase of financial investments negotiated during the last days of the month, which were settled during the first days of the following month.
e) As of December 31, 2025 and 2024, this balance mainly corresponds to (i) collateral delivered in connection with derivative financial instruments transactions, which are primarily executed through central clearing counterparties such as Chicago Mercantile Exchange (CME) and London Clearing House (LCH); (ii) collateral provided for repurchase agreement transactions; and (iii) funds held at the Central Reserve Bank of Peru (BCRP) to conduct immediate interbank transfer clearing services among different banks within the Peruvian financial system.
f) Operations in process include deposits received, granted and collected loans, funds transferred and other similar types of transactions, which are made in the final days of the month and not reclassified to their final accounts in the consolidated statement of financial position until the first days of the following month. The regularization of these transactions does not affect the Group’s net income.
g) Investment properties -
The movement of investment properties is as follows:
| | | | | | | | | | | | | | | | | | | | | | | |
| 2025 | | 2024 |
| Land | | Buildings | | Total | | Total |
| S/(000) | | S/(000) | | S/(000) | | S/(000) |
| Cost | | | | | | | |
| Balance at January 1 | 371,671 | | | 336,265 | | | 707,936 | | | 639,693 | |
| Additions | 96,603 | | | 86,960 | | | 183,563 | | | 70,399 | |
| Acquisition of Pacifico EPS shares, Note 2(a) | 427 | | | 526 | | | 953 | | | — | |
| Disposals and others | (2,686) | | (3,851) | | | (6,537) | | | (2,156) |
| Ending period | 466,015 | | | 419,900 | | | 885,915 | | | 707,936 | |
| | | | | | | |
| Accumulated depreciation | | | | | | | |
| Balance at January 1 | – | | | 81,704 | | | 81,704 | | | 73,009 | |
| Depreciation for the period | – | | | 8,803 | | | 8,803 | | | 9,098 | |
| Disposals and others | – | | | (1,176) | | (1,176) | | (403) |
| Ending period | – | | | 89,331 | | | 89,331 | | | 81,704 | |
| | | | | | | |
| Impairment losses | 689 | | | 389 | | | 1,078 | | | 1,127 | |
| | | | | | | |
| Net carrying amount | 465,326 | | | 330,180 | | | 795,506 | | | 625,105 | |
Land and buildings are mainly used for office rental, which are free of all encumbrances.
As of December 31, 2025 and 2024, the market value of the properties amounts to approximately S/1,322.3 million and S/1,235.1 million, respectively; which was determined through a valuation made by an independent appraisers.
h) As of December 31, 2025, this balance relates mainly to system programming and maintenance services amounting to S/221.8 million, and to payments under the mileage‑based loyalty program that the Bank grants to its customers for the use of their cards, amounting to S/22.6 million. (As of December 31, 2024, it related mainly to payments under the mileage‑based loyalty program that the Bank grants to its customers for the use of their cards, as well as other financial products, amounting to S/363.6 million).
i) As of December 31, 2025, the decrease in the investment in associates is due to the acquisition of the remaining 50.0 percent interest in Pacifico EPS, see Note 2. As of December 31, of 2024, Credicorp’s main associate was Pacífico S.A Entidad Prestadora de Salud (Pacífico EPS), whose balance amounts to S/692.1 million.
j) As of December 31, 2025 and 2024, the balance mainly corresponds to accounts payable to suppliers for goods and services, accounts payable to merchants for customer purchases made with credit and debit cards, accounts payable to insurance policyholders, accounts payable related to insurance premiums to the Deposit Insurance Fund, among others.
k) The movement of the provision for sundry risks for the years ended December 31, 2025, 2024 and 2023 was as follows:
| | | | | | | | | | | | | | | | | |
| 2025 | | 2024 | | 2023 |
| S/(000) | | S/(000) | | S/(000) |
| | | | | |
| Balance at the beginning of the year | 646,739 | | | 642,520 | | | 624,149 | |
| Provision, see Note 25 | 149,651 | | | 315,214 | | | 95,873 | |
| Decrease, net | (171,273) | | | (310,995) | | | (77,502) | |
| Balances at the end of the year | 625,117 | | | 646,739 | | | 642,520 | |
Because of the nature of its business, the Group has various pending lawsuits, which provisions are recorded when, in Management's and its in-house legal advisors opinion, it is likely that these may result in an additional liability and such amount can be reliably estimated. Regarding lawsuits against the Group which have not been recorded as a provision, in Management’s and its in-house legal advisors opinion, they will not result in an additional liability other than those recorded previously and they will not have a material effect on the Group’s consolidated financial statements.
l) The amount corresponds to the Assessment and Penalty Resolutions issued by SUNAT to Grupo Crédito on June 27, 2025, for S/1,568.0 million, plus accrued interest from the date of issuance of the resolutions up to the settlement date amounting to S/9.2 million.
13 DEPOSITS AND OBLIGATIONS
a) This item consists of the following:
| | | | | | | | | | | |
| 2025 | | 2024 |
| S/(000) | | S/(000) |
| | | |
| Saving deposits | 67,811,945 | | | 59,757,825 | |
| Demand deposits | 57,051,970 | | | 52,590,952 | |
| Time deposits (c) | 40,362,433 | | | 44,116,438 | |
| Severance indemnity deposits | 3,192,564 | | | 2,996,020 | |
| Bank’s negotiable certificates | 981,822 | | | 1,101,347 | |
| Total | 169,400,734 | | | 160,562,582 | |
| Interest payable | 1,000,899 | | | 1,279,484 | |
| Total | 170,401,633 | | | 161,842,066 | |
The Group has established a policy to remunerate demand deposits and savings accounts according to a growing interest rate scale, based on the average balance maintained in those accounts; on the other hand, according to its policy, balances that are lower than a specified amount for each type of account do not bear interest. Also, time deposits earn interest at market rates.
Interest rates are determined by the Group considering the interest rates prevailing in the market in which each of the Group’s subsidiaries operates.
b) The amounts of non-interest-bearing and interest-bearing deposits and obligations without consider accrued interest are presented below:
| | | | | | | | | | | |
| 2025 | | 2024 |
| S/(000) | | S/(000) |
| | | |
| Non-interest-bearing - | | | |
| In Peru | 46,864,322 | | | 42,057,905 | |
| In other countries | 5,352,964 | | | 5,102,286 | |
| 52,217,286 | | | 47,160,191 | |
| | | |
| Interest-bearing - | | | |
| In Peru | 110,071,732 | | | 104,085,586 | |
| In other countries | 7,111,716 | | | 9,316,805 | |
| 117,183,448 | | | 113,402,391 | |
| Total | 169,400,734 | | | 160,562,582 | |
c) The balance of time deposits classified by maturity is as follows:
| | | | | | | | | | | |
| 2025 | | 2024 |
| S/(000) | | S/(000) |
| | | |
| Up to 3 months | 27,618,567 | | | 27,772,950 | |
| From 3 months to 1 year | 8,525,964 | | | 10,886,485 | |
| From 1 to 3 years | 1,398,094 | | | 1,754,547 | |
| From 3 to 5 years | 590,673 | | | 478,235 | |
| More than 5 years | 2,229,135 | | | 3,224,221 | |
| Total | 40,362,433 | | | 44,116,438 | |
In Management’s opinion the Group’s deposits and obligations are diversified with no significant concentration as of December 31, 2025, and 2024.
As of December 31, 2025, and 2024, the balance of deposits and obligations, guaranteed by the Peruvian “Fondo de Seguro de Depositos” (Deposit Insurance Fund) amounts to approximately S/68,559.0 million and S/59,414.0 million, respectively. At said dates, maximum amount of coverage per depositor recognized by “Fondo de Seguro de Depositos” totaled S/116,700.0 and S/121,600.0, respectively.
As of December 31, 2025 and 2024, the balance of deposits and obligations of Banco de Crédito Bolivia guaranteed by the “Fondo de Protección al Ahorrista” (FPAH, for its Spanish acronym) of Bolivia, amounts to Bs1,684.5 million (equivalent to S/673.3 million) and Bs1,385.6 million (equivalent to S/760.4 million), respectively. At said dates, maximum amount of coverage per depositor recognized by “FPAH” totaled Bs155,530.3 and Bs102,593.9 (equivalent to S/62,163.8 and S/56,300.4, respectively).
As of December 31, 2025, and 2024, the balance of deposits and obligations of Mibanco Colombia guaranteed by the “Fondo de Garantía de las Instituciones Financieras” (FOGAFIN, for its Spanish acronym) of Colombia, amounts to $62,852.3 million colombian pesos (equivalent to S/56.0 million) and $59,612.9 million colombian pesos (equivalent to S/50.9 million), respectively. At said dates, maximum amount of coverage per depositor recognized by “Fogafín” totaled $50.0 million colombian pesos (equivalent to S/44,550.0 and S/42,700.0, respectively).
14 DUE TO BANKS AND CORRESPONDENTS
a) This item consists of the following:
| | | | | | | | | | | |
| 2025 | | 2024 |
| S/(000) | | S/(000) |
| | | |
| International funds and others (b) | 6,127,837 | | | 5,821,219 | |
| COFIDE and FONCODES credit line (c) | 4,494,633 | | | 4,550,610 | |
| Inter-bank funds | 10,001 | | | 350,000 | |
| 10,632,471 | | | 10,721,829 | |
| Interest payable | 42,767 | | | 32,556 | |
| Total | 10,675,238 | | | 10,754,385 | |
b) This item consists of the following:
| | | | | | | | | | | |
| 2025 | | 2024 |
| S/(000) | | S/(000) |
| | | |
| State Bank of India | 756,675 | | | 564,600 | |
| Corporación Financiera de Desarrollo (COFIDE) | 631,987 | | | 115,760 | |
| Bank of America N.A. | 605,340 | | | 564,600 | |
| Caixabank | 605,340 | | | 590,948 | |
| Banco de la Nación | 600,000 | | | 400,000 | |
| Wells Fargo Bank N.A. | 486,290 | | | – | |
| Commerzbank AG | 335,627 | | | 376,400 | |
| Sumitomo Mitsui Banking Corporation | 302,670 | | | 752,800 | |
| Banco Interamericano de Desarrollo (BID) | 184,825 | | | – | |
| Banco BCI | 179,396 | | | – | |
| Banco Bice | 175,205 | | | 104,425 | |
| Bank of New York Mellon | 168,150 | | | 188,200 | |
| Japan International Cooperation Agency | 168,150 | | | – | |
| Bancoldex | 158,595 | | | 108,035 | |
| Standard Chartered Bank Hong Kong Ltd. | 157,388 | | | 564,600 | |
| Banco BBVA Perú | 127,743 | | | 110,000 | |
| JP Morgan Chase & Co. | 104,526 | | | 45,365 | |
| ICBC Perú Bank S.A. | 100,000 | | | 60,000 | |
| Banco Internacional | 95,967 | | | 49,947 | |
| Banco Nacional de Bolivia S.A. | 39,226 | | | 54,986 | |
| Banco Bisa S.A. | 38,655 | | | 52,133 | |
| Banco de Occidente | 35,501 | | | 34,162 | |
| Bancolombia S.A. | 34,182 | | | 25,013 | |
| Citibank N.A. | 697 | | | 376,401 | |
| Banco Security | 4 | | | 47,710 | |
| International Finance Corporation (IFC) (i) | – | | | 570,540 | |
| Others minors | 35,698 | | | 64,594 | |
| Total | 6,127,837 | | | 5,821,219 | |
As of December 31, 2025, the loans have maturities between January 2026 and April 2035 (between January 2025 and April 2035 as of December 31, 2024) and bear interest at rates in soles that fluctuate between 4.78 percent and 11.40 percent (rates in soles between 5.03 percent and 7.86 percent as of December 31, 2024), and bear the following rates in foreign currency:
| | | | | | | | | | | | | | | | | | | | | | | |
| 2025 | | 2024 |
| Min | | Max | | Min | | Max |
| % | | % | | % | | % |
| U.S. Dollar | 4.17 | | | 6.00 | | | 4.80 | | | 6.14 | |
Boliviano | 6.00 | | | 8.85 | | | 4.90 | | | 6.90 | |
| Colombian Peso | 0.45 | | | 10.68 | | | 0.45 | | | 13.95 | |
(i) As of December 31, 2024, the Group maintain cross currency swaps (CCS) that were designated as cash flow hedges of certain repo operations in US Dollars for a nominal amount of US$60.0 million, equivalent to S/225.8 million, see Note 12(c).
c) Promotional credit lines represent loans granted by Corporación Financiera de Desarrollo and Fondo de Cooperación para el Desarrollo Social (COFIDE and FONCODES for their Spanish acronyms, respectively) to promote the development of Peru, they mature between January 2026 and January 2032 and bear annual interest in soles at rates that fluctuate between 6.00 percent and 7.60 percent and interest in foreign currency at 7.75 percent as of December 31, 2025 (between January 2025 and January 2032 and with annual interest in soles at rates that fluctuate between 6.00 percent and 7.60 percent and interest in foreign currency between 7.75 percent as of December 31, 2024). These lines of credit are guaranteed with a portfolio of Fondo Mi Vivienda mortgage loans amounting S/4,494.6 million and S/4,550.6 million, as of December 31, 2025, and 2024 respectively.
d) The following table presents the maturities of due to banks and correspondents as of December 31, 2025 and 2024 based on the period remaining to maturity:
| | | | | | | | | | | |
| 2025 | | 2024 |
| S/(000) | | S/(000) |
| Up to 3 months | 3,008,544 | | | 2,137,820 | |
| From 3 months to 1 year | 1,384,347 | | | 3,320,059 | |
| From 1 to 3 years | 2,780,799 | | | 1,662,047 | |
| From 3 to 5 years | 773,823 | | | 824,015 | |
| More than 5 years | 2,684,958 | | | 2,777,888 | |
| Total | 10,632,471 | | | 10,721,829 | |
e) As of December 31, 2025, and 2024, lines of credit granted by various local and foreign financial institutions, to be used for future operating activities total S/10,622.5 million and S/10,371.8 million, respectively.
f) Certain debts to banks, correspondents and other entities include specific agreements on how the funds received should be used, the financial conditions that the Bank must maintain, as well as other administrative matters. In Management’s opinion, these specific agreements have been fulfilled by the Bank as of December 31, 2025, and 2024.
15 BONDS AND NOTES ISSUED
a) This item consists of the following:
| | | | | | | | | | | | | | | | | | | | | | | | | | | | | | | | | | | | | | | | | | | | | | | |
| | | | | 2025 | | 2024 |
| Annual
interest
rate | | Interest
payment | | Maturity | | Issued
amount | | Carrying
amount | | Maturity | | Issued
amount | | Carrying
amount |
| % | | | | | | (000) | | S/(000) | | | | (000) | | S/(000) |
| Senior notes - BCP (i) | 5.85 | | | Semi-annual | | January 2029 | | US$500,000 | | | 1,666,865 | | | January 2029 | | US$500,000 | | | 1,862,468 | |
| Senior notes - BCP (i) | 7.85 | | | Semi-annual | | January 2029 | | S/1,150,000 | | | 1,132,782 | | | January 2029 | | S/1,150,000 | | | 1,150,000 | |
| Senior notes - BCP | 5.05 | | | Semi-annual | | June 2027 | | US$30,000 | | | 100,646 | | | June 2027 | | US$30,000 | | | 112,471 | |
| Senior notes - EPS (ii) | 6.59 | | | Semi-annual | | September 2037 | | S/130,000 | | | 82,991 | | | - | | - | | | - | |
| Senior notes - BCP (iii) | 0.97 | | | Semi-annual | | - | | - | | | - | | | November 2025 | | ¥3,000,000 | | | 71,796 | |
| Senior notes - BCP (iv) | 2.70 | | | Semi-annual | | - | | - | | | - | | | January 2025 | | US$700,000 | | | 2,604,249 | |
| Senior notes - Credicorp Ltd. (v) | 2.75 | | | Semi-annual | | - | | - | | | - | | | June 2025 | | US$500,000 | | | 1,810,391 | |
| Corporate bonds - | | | | | | | | | | | | | | | |
| First program | | | | | | | | | | | | | | | |
| First issuance (Series A) - Mibanco Colombia | 9.00 | | | Quarterly | | - | | - | | | - | | | January 2025 | | $112,500 | | | 22,441 | |
| First issuance (Series Unica) - Banco de Credito de Bolivia (vi) | 6.40 | | | Semi-annual | | April 2037 | | Bs85,000 | | 33,974 | | | - | | | - | | | - | |
| | | | | | | | | 3,017,258 | | | | | | | 7,633,816 | |
| | | | | | | | | | | | | | | | | | | | | | | | | | | | | | | | | | | | | | | | | | | | | | | |
| | | | | 2025 | | 2024 |
| Annual interest
rate | | Interest
payment | | Maturity | | Issued
amount | | Carrying
amount | | Maturity | | Issued
amount | | Carrying
amount |
| % | | | | | | (000) | | S/(000) | | | | (000) | | S/(000) |
| Subordinated bonds - | | | | | | | | | | | | | | | |
| Subordinated bonds - BCP (vii) | 6.45 | | Semi-annual | | July 2035 | | US$750,000 | | 2,505,546 | | | - | | - | | | - |
| Subordinated bonds - BCP (viii) | 5.80 | | Semi-annual | | March 2035 | | US$600,000 | | 2,003,766 | | | March 2035 | | US$600,000 | | | 2,241,242 | |
| Subordinated bonds - BCP (ix) | 3.25 | | Semi-annual | | September 2031 | | US$500,000 | | 1,679,375 | | | September 2031 | | US$500,000 | | 1,872,212 | |
| Subordinated bonds - BCP (x) | 5.65 | | Semi-annual | | January 2037 | | US$500,000 | | 1,665,644 | | | - | | - | | - |
| Subordinated bonds - BCP (xi) | 3.13 | | Semi-annual | | - | | - | | - | | July 2030 | | US$850,000 | | 3,177,658 | |
| | | | | | | | | | | | | | | |
| Second program | | | | | | | | | | | | | | | |
| Second issuance (Series B) - Pacífico Seguros | 8.00 | | Semi-annual | | May 2033 | | US$60,000 | | | 201,780 | | | May 2033 | | US$60,000 | | | 225,840 | |
| Second issuance (Series A) - Pacífico Seguros | 4.41 | | Semi-annual | | December 2030 | | US$50,000 | | | 153,105 | | | December 2030 | | US$50,000 | | | 171,365 | |
| First issuance (Series B) - MiBanco | 7.22 | | Semi-annual | | - | | - | | - | | June 2027 | | S/30,000 | | | 30,000 | |
| | | | | | | | | | | | | | | |
| Third program | | | | | | | | | | | | | | | |
| Issuance IV - Banco de Crédito de Bolivia | 5.85 | | Semi-annual | | February 2033 | | Bs120,810 | | | 48,250 | | | February 2033 | | Bs120,810 | | | 63,707 | |
| Issuance III - Banco de Crédito de Bolivia | 6.00 | | Semi-annual | | August 2030 | | Bs100,000 | | | 40,032 | | | August 2030 | | Bs100,000 | | | 52,268 | |
| Issuance I - Banco de Crédito de Bolivia | 6.25 | | Semi-annual | | August 2028 | | Bs70,000 | | | 16,895 | | | August 2028 | | Bs70,000 | | | 36,146 | |
| Fourth program | | | | | | | | | | | | | | | |
| Fourth issuance (Series B) - Pacífico Seguros (xii) | 6.03 | | Semi-annual | | December 2035 | | US$45,000 | | 149,500 | | | - | | - | | - |
| First issuance (Series A) - Mibanco | 5.84 | | Semi-annual | | March 2031 | | S/155,000 | | | 146,274 | | | March 2031 | | S/155,000 | | | 146,274 |
| Fifth program | | | | | | | | | | | | | | | |
| First issuance (Serie B) - Mibanco (xiii) | 7.00 | | Semi-annual | | August 2035 | | S/127,552 | | 127,552 | | | - | | - | | - |
| First issuance (Series A) - Mibanco (xiv) | 7.56 | | Semi-annual | | March 2035 | | S/100,000 | | 100,000 | | | - | | - | | - | |
| | | | | | | | | 8,837,719 | | | | | | | 8,016,712 | |
| | | | | | | | | | | | | | | |
| Negotiable certificate of deposit - Mibanco Colombia | From 1.00 to 14.35 | | To maturity | | January 2026 / December 2028 | | $1,691,813 | | | 1,602,002 | | | January 2025 / October 2027 | | $1,343,411 | | | 1,254,245 | |
| Negotiable certificate of deposit - Mibanco | From 3.50 to 7.20 | | Annual | | January 2026 / November 2029 | | S/278,630 | | 278,630 | | | January 2025 / September 2026 | | S/314,870 | | | 118,813 | |
| | | | | | | | | 13,735,609 | | | | | | | 17,023,586 | |
| Interest payable | | | | | | | | | 289,926 | | | | | | | 244,857 | |
| Total | | | | | | | | | 14,025,535 | | | | | | | 17,268,443 | |
International issuances maintain certain operating and finance covenants, which, in Management’s opinion, the Group has complied with as of the dates of the consolidated statement of financial position.
(i) On January 11, 2024, the Bank carried out the issuance of Senior Notes under the Medium-Term Note Program for a total of US$500.0 million in U.S. Dollars, at a coupon rate of 5.85 percent, and S/1,150.0 million in soles, at a coupon rate of 7.85 percent; both issuances maturing in January 2029. Until December 11, 2028, the Bank may redeem all or part of the Senior Notes at a redemption price equal to the greater of (i) 100.0 percent of the principal amount of the Senior Notes, and (ii) the sum of the remaining cash flows discounted at a rate equal to the U.S. Treasury interest rate plus 30 basis points (for the U.S. Dollar issuance) and the interest rate of the Sovereign Bonds issued by the Government of Peru or another comparable security plus 30 basis points (for the sol issuance). The principal payment will take place on the maturity date of the Senior Notes or when the Bank executes their redemption. Beginning on December 11, 2028, the Bank may redeem all or part of the Notes at a redemption price equal to 100.0 percent of the aggregate principal amount of the Notes to be redeemed.
(ii) On September 28, 2017, Pacífico S.A. Entidad Prestadora de Salud carried out the issuance of Senior Notes for an amount of approximately S/130.0 million. These securities bear a fixed annual interest rate of 6.59 percent, with a maturity date of September 28, 2037.
(iii) As of December 31, 2024, the Bank maintained a cross-currency swap (CCS) with a notional amount of ¥3,000.0 million, equivalent to S/71.9 million, see Note 12(c), which was decomposed by risk variables into two cross-currency swaps (CCS) for the purpose of being designated as (i) a cash flow hedge of a fixed-rate yen-denominated bond, which was converted into soles through this swap, and (ii) a cash flow hedge of loan placements.
(iv) As of January 11, 2025, the bond was fully amortized. This instrument was issued in September 2019 under the Medium-Term Note Program for an amount of US$700.0 million, with a semiannual coupon rate of 2.70 percent per year, and a maturity date of January 2025.
As of December 31, 2024, the Bank maintained a cross-currency swap (CCS) with a notional amount of US$220.0 million, equivalent to S/828.1 million, see Note 12(c), which was designated as a partial cash flow hedge of a fixed-rate U.S. Dollar-denominated senior note; through this CCS, the senior note was economically converted into a fixed-rate sol-denominated instrument.
(v) As of June 17, 2025, the bond was fully amortized. This bond was issued in June 2020 under the Medium-Term Note Program for an amount of US$500.0 million, with a semiannual coupon rate of 2.75 percent per year and a maturity date of June 2025.
(vi) On June 26, 2025, Banco de Crédito de Bolivia issued a Corporate Bond under its First Program, Single Series, for Bs85.0 million at a semiannual coupon rate of 6.40 percent per year, with a maturity date of April 23, 2037. The principal will be paid at maturity or in the event of early redemption by the entity.
(vii)On April 30, 2025, the Bank issued Subordinated Notes under the Medium-Term Note Program for US$750.0 million at a semiannual coupon rate of 6.45 percent, maturing on July 30, 2035, denominated ‘6.45 percent Subordinated Fixed-to-Fixed Rate Notes Due 2035 (Callable 2030)’. Beginning on July 30, 2030, a fixed interest rate equal to the U.S. Treasury rate comparable to a 5-year maturity plus 248.6 basis points will be paid. Starting on April 30, 2030, the Bank may redeem all or part of the subordinated notes at a redemption price of 100.0 percent of the aggregate principal amount of the subordinated notes to be redeemed. Following that date, the Bank may redeem all or part of the subordinated notes at a redemption price equal to the greater of (1) 100.0 percent of the principal amount of the subordinated notes, and (2) the sum of the remaining cash flows discounted at a rate equal to the U.S. Treasury interest rate plus 40 basis points. The principal will be paid on the maturity date of the subordinated notes or when the Bank executes their redemption.
(viii)On September 10, 2024, the Bank issued Subordinated Notes under the Medium-Term Note Program for US$600.0 million at a semiannual coupon rate of 5.80 percent, maturing in March 2035, denominated ‘5.80 percent Subordinated Fixed-to-Fixed Rate Notes due 2035 (Callable 2030)’. Beginning on March 10, 2030, a fixed interest rate equal to the U.S. Treasury rate comparable to a 5-year maturity plus 224.0 basis points will be paid. Starting on March 30, 2030, the Bank may redeem all or part of the subordinated notes at a redemption price of 100.0 percent of the aggregate principal amount of the subordinated notes to be redeemed. Following that date, the Bank may redeem all or part of the
subordinated notes at a redemption price equal to the greater of (1) 100.0 percent of the principal amount of the subordinated notes, and (2) the sum of the remaining cash flows discounted at a rate equal to the U.S. Treasury interest rate plus 35 basis points. The principal will be paid on the maturity date of the subordinated notes or when the Bank executes their redemption.
(ix) On March 30, 2021, the Bank issued Subordinated Notes under the Medium-Term Note Program for US$500.0 million at a semiannual coupon rate of 3.25 percent, maturing in September 2031, denominated ‘3.25 percent Subordinated Fixed-to-Fixed Rate Notes due 2031 (Callable 2026)’. Beginning on September 30, 2026, a fixed interest rate equal to the U.S. Treasury rate comparable to a 5-year maturity plus 245 basis points will be paid. On September 30, 2026, the Bank may redeem all or part of the subordinated notes at a redemption price equal to 100.0 percent of the aggregate principal amount of the subordinated notes to be redeemed. Following that date, the Bank may redeem all or part of the subordinated notes at a redemption price equal to the greater of (1) 100.0 percent of the principal amount of the subordinated notes, and (2) the sum of the remaining cash flows discounted at a rate equal to the U.S. Treasury interest rate plus 40 basis points. The principal will be paid on the maturity date of the subordinated notes or when the Bank executes their redemption.
(x) On October 15, 2025, the Bank issued Subordinated Notes under the Medium-Term Note Program for US$500 million at a semiannual coupon rate of 5.65 percent, maturing on January 15, 2037, denominated ‘5.65 percent Subordinated Fixed-to-Fixed Rate Notes Due 2037 (Callable 2032)’. Beginning on January 15, 2032, a fixed interest rate equal to the U.S. Treasury rate comparable to a 6-year maturity plus 196.1 basis points will be paid. From October 15, 2031 to January 15, 2032, the Bank may redeem all or part of the subordinated notes at a redemption price of 100.0 percent of the aggregate principal amount of the subordinated notes to be redeemed. Thereafter, the Bank may redeem all or part of the subordinated notes at a redemption price equal to the greater of (1) 100.0 percent of the principal amount of the subordinated notes, and (2) the sum of the remaining cash flows discounted at a rate equal to the U.S. Treasury interest rate plus 30 basis points. The principal will be paid on the maturity date of the subordinated notes or when the Bank executes their redemption.
(xi) Effective July 1, 2020, the Bank issued Subordinated Notes under the Medium-Term Note Program for US$850.0 million at a semiannual coupon rate of 3.13 percent, maturing in July 2030, denominated 3.13 percent Subordinated Fixed-to-Fixed Rate Notes due 2030 (Callable 2025)’. For this issuance, the Bank chose to exercise the early redemption option in accordance with the terms of these notes.
(xii)On December 19, 2025, Pacífico S.A. Entidad Prestadora de Salud issued Senior Notes for approximately US$45.0 million. These securities bear a fixed annual interest rate of 6.03 percent, with a maturity date of December 19, 2035.
(xiii)On August 20, 2025, Mibanco S.A. carried out the issuance under the Fifth Subordinated Bond Program, Series B, for S/127.6 million, at a semiannual coupon rate of 7.00 percent per year, with a maturity date of August 20, 2035. Payment will be made at maturity or in the event of early redemption by Mibanco S.A.
(xiv)On March 28, 2025, Mibanco S.A. carried out the issuance under the Fifth Subordinated Bond Program, Series A, for S/100.0 million, at a fixed annual interest rate of 7.56 percent, with a maturity date of March 28, 2035. The principal will be paid at maturity or in the event of early redemption by Mibanco S.A.
b) The table below shows the bonds and notes issued, classified by maturity, without accrued interests:
| | | | | | | | | | | |
| 2025 | | 2024 |
| S/(000) | | S/(000) |
| | | |
| Up to 3 months | 109,837 | | | 2,709,847 | |
| From 3 months to 1 year | 1,372,282 | | | 2,718,199 | |
| From 1 to 3 years | 486,248 | | | 582,747 | |
| From 3 to 5 years | 2,854,442 | | | 3,062,227 | |
| More than 5 years | 8,912,800 | | | 7,950,566 | |
| Total | 13,735,609 | | | 17,023,586 | |
16 EQUITY
a) Capital stock -
As of December 31, 2025, 2024 and 2023 a total of 94,382,317 shares have been issued at US$5 per share.
b) Treasury stock -
We present below the stocks of Credicorp Ltd., that the entities of the Group maintain as of December 31, 2025, 2024 and 2023:
| | | | | | | | | | | | | | | | | |
| Number of shares |
| As of December 31, 2025 | Treasury | | Shared-based
payment (*) | | Total |
| | | | | |
| Atlantic Security Holding Corporation | 14,620,846 | | – | | 14,620,846 |
| Atlantic Security International Financial Services | – | | 225,456 | | 225,456 |
| BCP | – | | 78,670 | | 78,670 |
| Grupo Crédito | – | | 34,664 | | 34,664 |
| Pacífico Seguros | – | | 15,113 | | 15,113 |
| Mibanco | – | | 10,079 | | 10,079 |
| ASB Bank Corp. | – | | 7,828 | | 7,828 |
| Credicorp Capital Servicios Financieros | – | | 7,803 | | 7,803 |
| Prima AFP | – | | 2,539 | | 2,539 |
| Other subsidiaries | – | | 12,731 | | 12,731 |
| 14,620,846 | | 394,883 | | 15,015,729 |
| | | | | | | | | | | | | | | | | |
| Number of shares |
| As of December 31, 2024 | Treasury | | Shared-based
payment (*) | | Total |
| | | | | |
| Atlantic Security Holding Corporation | 14,620,846 | | – | | 14,620,846 |
| Atlantic Security International Financial Services | – | | 125,843 | | 125,843 |
| BCP | – | | 94,686 | | 94,686 |
| Grupo Crédito | – | | 38,050 | | 38,050 |
| Pacífico Seguros | – | | 17,756 | | 17,756 |
| Mibanco | – | | 12,720 | | 12,720 |
| Credicorp Capital Servicios Financieros | – | | 10,440 | | 10,440 |
| ASB Bank Corp | – | | 10,310 | | 10,310 |
| Prima AFP | – | | 3,174 | | 3,174 |
| Other subsidiaries | – | | 12,812 | | 12,812 |
| 14,620,846 | | 325,791 | | 14,946,637 |
| | | | | | | | | | | | | | | | | |
| Number of shares |
| As of December 31, 2023 | Treasury | | Shared-based
payment (*) | | Total |
| | | | | |
| Atlantic Security Holding Corporation | 14,620,846 | | – | | 14,620,846 |
| BCP | – | | 109,185 | | 109,185 |
| Atlantic Security International Financial Services | – | | 39,309 | | 39,309 |
| Grupo Crédito | – | | 36,698 | | 36,698 |
| Pacífico Seguros | – | | 19,912 | | 19,912 |
| Mibanco | – | | 14,128 | | 14,128 |
| Credicorp Capital Servicios Financieros | – | | 13,267 | | 13,267 |
| ASB Bank Corp | – | | 12,041 | | 12,041 |
| Prima AFP | – | | 3,920 | | 3,920 |
| Other subsidiaries | – | | 16,790 | | 16,790 |
| 14,620,846 | | 265,250 | | 14,886,096 |
(*) This mainly relates to treasury shares acquired by the Group in order to cover the obligations of the share‑based compensation and retention program. Such shares include those granted to employees and senior management which, as of the reporting date, have not yet vested in accordance with the terms and conditions of the program.
During 2025, 2024 and 2023, the Group purchased 175,400, 174,161 and 163,067 shares of Credicorp Ltd., respectively, for a total of US$32.6 million (equivalent to S/119.3 million), US$29.3 million (equivalent to S/110.9 million) and US$22.5 million (equivalent to S/85.6 million), respectively.
The purchase of shares during 2025, measured at their respective market value at the acquisition date and amounting to S/119.3 million, comprise S/2.5 million corresponding to the shares at nominal value and S/116.8 million corresponding to the excess paid over the nominal value of the acquired shares. The purchase of shares during 2024, measured at their respective market value at the acquisition date and amounting to S/110.9 million, comprise S/2.4 million corresponding to the shares at nominal value and S/108.5 million corresponding to the excess paid over the nominal value of the acquired shares.
c) Reserves and other reserves -
Certain Group’s subsidiaries are required to keep a reserve that equals a percentage of paid-in capital (20.0, 30.0 or 50.0 percent, depending on its activities and the country in which production takes place); this reserve must be constituted with annual transfers of not less than 10.0 percent of net profits. As of December 31, 2025, 2024 and 2023, the balance of this reserve amounts approximately to S/9,810.2 million, S/9,175.8 million and S/8,621.7 million, respectively.
At the Board meetings held on February 27, 2025, April 27, 2024 and April 27, 2023, the decision was made to transfer from “Retained earnings” to “Reserves” S/5,637.7 million, S/1,778.8 million and S/2,593.6 million, respectively.
“Other reserves” include unrealized gains (losses) on fair value of investments through other comprehensive income and on cash flow hedges derivative instruments, net of deferred income tax and non-controlling interest. Movement was as follows:
| | | | | | | | | | | | | | | | | | | | | | | | | | | | | | | | | | | |
| Other reserves: |
| Instruments that
will not be
reclassifed to
profit or loss | | Instruments that will be reclassified to consolidated statement of income |
| Equity
instruments at
fair value | | Debt
instruments at
fair value | | Reserve for
cash flow
hedges | | Insurance
reserves | | Foreign
currency
translation
reserve | | Total |
| S/(000) | | S/(000) | | S/(000) | | S/(000) | | S/(000) | | S/(000) |
| | | | | | | | | | | |
| Balance as of January 1, 2023 | 170,408 | | | (1,655,559) | | | 788 | | | 1,133,536 | | | 74,655 | | | (276,172) | |
| Increase in net unrealized gains on investments | (12,247) | | | 1,241,632 | | | – | | | – | | | – | | | 1,229,385 | |
| Transfer to results of the net realized loss of investments | – | | | 7,789 | | | – | | | – | | | – | | | 7,789 | |
| Transfer of credit loss of investments to profit or loss | – | | | 8,716 | | | - | | | - | | | - | | | 8,716 | |
| Change in net unrealized gain on cash flow hedges derivatives | – | | | – | | | 18,359 | | | - | | | - | | | 18,359 | |
| Transfer of net realized gain on cash flow hedges derivatives to profit or loss | – | | | – | | | (30,550) | | | – | | | – | | | (30,550) | |
| Other reserves | – | | | – | | | – | | | (754,192) | | | – | | | (754,192) | |
| Foreign exchange translation | – | | | – | | | – | | | – | | | 73,498 | | | 73,498 | |
Net movement in hedges of net investments in foreign businesses | – | | | – | | | – | | | – | | | 18,950 | | | 18,950 | |
| Balance as of December 31, 2023 | 158,161 | | | (397,422) | | | (11,403) | | | 379,344 | | | 167,103 | | | 295,783 | |
| Increase in net unrealized gains on investments | 24,116 | | | 136,783 | | | – | | | – | | | – | | | 160,899 | |
| Transfer to results of the net realized loss of investments | – | | | 36,712 | | | – | | | – | | | – | | | 36,712 | |
| Transfer of credit loss of investments to profit or loss | – | | | 32,776 | | | – | | | – | | | – | | | 32,776 | |
| Change in net unrealized gain on cash flow hedges derivatives | – | | | – | | | 27,186 | | | – | | | – | | | 27,186 | |
| Transfer of net realized gain on cash flow hedges derivatives to profit or loss | – | | | – | | | (17,416) | | | – | | | – | | | (17,416) | |
| Other reserves | – | | | – | | | – | | | (69,383) | | | – | | | (69,383) | |
| Foreign exchange translation | – | | | – | | | – | | | – | | | (114,143) | | | (114,143) | |
Net movement in hedges of net investments in foreign businesses | (137,787) | | | – | | | – | | | – | | | – | | | (137,787) | |
| Balance as of December 31, 2024 | 44,490 | | | (191,151) | | | (1,633) | | | 309,961 | | | 52,960 | | | 214,627 | |
| Increase in net unrealized gains on investments | (20,927) | | | 1,322,876 | | | – | | | – | | | – | | | 1,301,949 | |
| Transfer to results of the net realized gain of investments | – | | | (142,245) | | | – | | | – | | | – | | | (142,245) | |
| Transfer of credit loss of investments to profit or loss | – | | | 84,830 | | | – | | | – | | | – | | | 84,830 | |
| Change in net unrealized gain on cash flow hedges derivatives | – | | | – | | | (10,490) | | | – | | | – | | | (10,490) | |
| Transfer of net realized gain on cash flow hedges derivatives to profit or loss | – | | | – | | | 12,350 | | | – | | | – | | | 12,350 | |
| Net movement in hedges of net investments in foreign businesses | 8,336 | | | – | | | – | | | – | | | – | | | 8,336 | |
| Other reserves | – | | | – | | | – | | | (518,071) | | | – | | | (518,071) | |
| Foreign exchange translation | – | | | – | | | – | | | – | | | (406,519) | | | (406,519) | |
| Balance as of December 31, 2025 | 31,899 | | | 1,074,310 | | | 227 | | | (208,110) | | | (353,559) | | | 544,767 | |
d) Components of other comprehensive income -
The movement of the item is as follows:
| | | | | | | | | | | | | | | | | |
| 2025 | | 2024 | | 2023 |
| S/(000) | | S/(000) | | S/(000) |
| To be reclassified to the consolidated statement of income in later periods | | | | | |
| Debt instruments at fair value through ither comprehensive income (FVOCI) - | | | | | |
| Net unrealized gain | 1,322,876 | | | 136,783 | | | 1,241,632 | |
| Transfer to results of net realized gain (loss) | (142,245) | | | 36,712 | | | 7,789 | |
| Transfer of credit loss to profit or loss | 84,830 | | | 32,776 | | | 8,716 | |
| Sub total | 1,265,461 | | | 206,271 | | | 1,258,137 | |
| Non-controlling interest | 18,419 | | | 4,612 | | | 18,317 | |
| Income tax | (24,152) | | | (5,118) | | | 58,489 | |
| 1,259,728 | | | 205,765 | | | 1,334,943 | |
| | | | | |
| Cash flow hedge reserves: | | | | | |
| Net (loss) gain on cash flow hedges | (10,490) | | | 27,186 | | | 18,359 | |
| Transfer of net realized gains (losses) on cash flow hedges derivatives to profit or loss | 12,350 | | | (17,416) | | | (30,550) | |
| Sub total | 1,860 | | | 9,770 | | | (12,191) | |
| Non-controlling interest | 29 | | | 125 | | | (148) | |
| Income tax | 1,575 | | | 4,030 | | | (5,104) | |
| 3,464 | | | 13,925 | | | (17,443) | |
| | | | | |
| Other reserves: | | | | | |
| Insurance reserves | (518,071) | | | (69,383) | | | (754,192) | |
| Non-controlling interest | (5,921) | | | (793) | | | (8,619) | |
| (523,992) | | | (70,176) | | | (762,811) | |
| | | | | |
| Foreign exchange translation: | | | | | |
| Foreign currency translation differences arising from the translation of foreign operations | (406,519) | | | (114,143) | | | 73,498 | |
| Net movement in hedges of net investments in foreign businesses | – | | | — | | | 18,950 | |
| Sub total | (406,519) | | | (114,143) | | | 92,448 | |
| Non-controlling interest | (436) | | | 1 | | | (34) | |
| (406,955) | | | (114,142) | | | 92,414 | |
| | | | | | | | | | | | | | | | | |
| 2025 | | 2024 | | 2023 |
| S/(000) | | S/(000) | | S/(000) |
| Not to be reclassified to the consolidated statement of income in later periods: | | | | | |
| | | | | |
| Equity instruments at fair value with changes in other comprehensive income - | | | | | |
| Net unrealized gains | (20,927) | | | 24,116 | | | (12,247) | |
| Transfer of the fair value reserve of equity instruments designated at FVOCI for sale | 8,336 | | | (137,787) | | | – | |
| Non-controlling interest | (4) | | | 7 | | | 127 | |
| Sub total | (12,595) | | | (113,664) | | | (12,120) | |
| Income tax | 2,332 | | | (8,439) | | | 3,791 | |
| (10,263) | | | (122,103) | | | (8,329) | |
| Attributable to: | | | | | |
Credicorp’s equity holders | 330,140 | | | (81,156) | | | 571,955 | |
| Non-controlling interest | 12,087 | | | 3,952 | | | 9,643 | |
| 342,227 | | | (77,204) | | | 581,598 | |
e) Dividend distribution –
The chart below shows the distribution of dividends agreed by the Board of Directors:
| | | | | | | | | | | | | | | | | |
| 2025 | | 2024 | | 2023 |
| | | | | |
| Date of Meeting - Board of Directors | 24.04.2025 | | 25.04.2024 | | 27.04.2023 |
| Dividends distribution, net of treasury shares effect (in thousands of soles) | 3,181,454 | | | 2,788,657 | | | 1,994,037 | |
| Payment of dividends per share (in soles) | 40.0 | | | 35.0 | | | 25.0 | |
| Date of dividends payout | 13.06.2025 | | 14.06.2024 | | 09.06.2023 |
| Exchange rate published by the SBS | 3.6327 | | | 3.7685 | | | 3.6901 | |
| Dividends payout (equivalent in thousands of US$) | 875,782 | | | 739,991 | | | 540,375 | |
At the Board of Directors’ meeting held on August 29, 2024, the distribution of an additional dividend was approved, net of the effect of treasury shares held in treasury stock, for approximately S/875.9 million, charged to reserves. Such dividend was paid on October 18, 2024.
In accordance with the legal regulations in force in Peru, there are no restrictions on the remittance of dividends abroad or on the repatriation of foreign investment. As of December 31, 2025, 2024 and 2023 dividends paid by Peruvian subsidiaries to Credicorp are subject to a 5.0 percent withholding tax.
f) Regulatory capital -
In accordance with the regulations issued by the SBS related to the “Regulation for the Consolidated Supervision of Financial and Mixed Conglomerates”, the regulatory capital required at the Credicorp and its subsidiaries level is determined based on the specific requirements applicable to each subsidiary, including capital requirements for additional risks, and in accordance with the requirements established by the respective regulators in the countries in which they operate. As of December 31, 2025, and 2024, the required regulatory capital amounted to approximately S/32,346.5 million and S/29,123.5 million, respectively.
The consolidated regulatory capital of Credicorp and its subsidiaries determined in accordance with the provisions of this regulation, amounted to S/43,813.2 million and S/40,009.5 million as of December 31,
2025 and 2024, respectively, exceeding the minimum regulatory capital required by the SBS by S/11,466.7 million and S/10,885.9 million, respectively.
17 TAX SITUATION
a)As of January 1, 2025, the Corporate Income Tax Act 2023, enacted by the Government of Bermuda in connection with the Pillar Two rules, entered into force. This legislation introduces a corporate income tax at a rate of 15.0 percent applicable to entities that are part of multinational groups with consolidated revenues equal to or exceeding EUR 750 million. Credicorp Ltd. and its subsidiaries domiciled in Bermuda fall within the scope of this regulation. As of December 31, 2025, Management has assessed the impact of this tax and concluded that it is not material to the consolidated financial statements.
Credicorp’s Peruvian subsidiaries are subject to the Peruvian tax regime.
The Peruvian corporate income tax rate as of December 31, 2025, 2024 and 2023 was 29.5 percent of taxable income after calculating workers’ participation, which is determined using a rate of 5.0 percent.
The corporate income tax rate in Bolivia is 25.0 percent as of December 31, 2025, 2024 and 2023. Bolivian financial entities are subject to an additional rate to the extent that the ROE exceeds 6.0 percent; in that case, they must consider an additional rate of 25.0 percent, which would bring the rate to 50.0 percent.
In the case of Chile, the tax legislation changed in 2020, establishing two new regimes currently in force: the general regime and the Pro-Pyme regime, the latter applicable to smaller companies. Credicorp Capital Holding Chile, as well as all its subsidiaries, are taxed under the general regime, whose corporate income tax rate for domiciled legal entities remains at 27.0 percent as of December 31, 2025, 2024 and 2023.
Individuals or legal entities not domiciled in Chile will be subject to an additional tax at rates between 4.0 percent and 35.0 percent, depending on the nature of the income.
In Colombia, the income tax rate has been set at 35.0 percent for the years 2023, 2024 and 2025.
For financial entities with a taxable base exceeding 120,000 taxable units (as of December 31, 2025, 2024 and 2023 equivalent to a total of S/5.3 million, S/5.1 million and S/4.4 million, respectively), the income tax rate is 40.0 percent.
Additionally, in the event of receiving occasional profits, listed and established by the National Government in the Tax Statute and which are not subject to income tax, for the year 2025 a differential rate of 15.0 percent must be applied on the net profit and the associated expenses, respectively.
Dividends and participations are subject to a 20.0 percent rate as withholding at source on income, which will be transferable and imputable to the resident individual or investor residing abroad.
The reconciliation of the statutory income tax rate to the effective tax rate for the Group is as follows:
| | | | | | | | | | | | | | | | | | | | | | | | | | | | | | | | | | | |
| 2025 | | 2024 | | 2023 |
| In millions
of soles | | % | | In millions
of soles | | % | | In millions
of soles | | % |
| | | | | | | | | | | |
| Theoretical tax and income tax rate in Perú | (2,914.2) | | | (29.50) | | | (2,307.3) | | | (29.50) | | | (2,040.9) | | | (29.50) | |
| Decrease (Increase) in the statutory tax rate due to: | | | | | | | | | | | |
(i) Decrease (Increase) due to the profit of subsidiaries not domiciled in Perú | (15.7) | | | (0.16) | | | (77.2) | | | (0.99) | | | 52.8 | | | 0.77 | |
| (ii) Provision tax on dividends | (215.9) | | | (2.17) | | | (146.7) | | | (1.88) | | | (235.7) | | | (3.44) | |
| (iii) Non-taxable income, net | 280.8 | | | 2.82 | | | 329.9 | | | 4.22 | | | 335.3 | | | 4.59 | |
| Income tax and effective income tax rate | (2,865.0) | | | (29.01) | | | (2,201.3) | | | (28.15) | | | (1,888.5) | | | (27.58) | |
b)Income tax expense for the years ended December 31, 2025, 2024 and 2023 comprises:
| | | | | | | | | | | | | | | | | |
| 2025 | | 2024 | | 2023 |
| S/(000) | | S/(000) | | S/(000) |
| Current - | | | | | |
| In Peru | 2,661,742 | | | 1,966,524 | | | 1,669,370 | |
| In other countries | 328,881 | | | 289,694 | | | 295,169 | |
| 2,990,623 | | | 2,256,218 | | | 1,964,539 | |
| | | | | |
| Deferred - | | | | | |
| In Peru | (66,431) | | | (23,182) | | | (28,734) | |
| In other countries | (59,293) | | | (31,761) | | | (47,354) | |
| (125,724) | | | (54,943) | | | (76,088) | |
| Total | 2,864,899 | | | 2,201,275 | | | 1,888,451 | |
c)The following table presents a summary of the Group’s deferred income tax:
| | | | | | | | | | | | | | | | | | | | | | | |
| Consolidated statement of financial position | | Consolidated statement of income |
| 2025 | | 2024 | | 2025 | | 2024 |
| S/(000) | | S/(000) | | S/(000) | | S/(000) |
| Deferred income tax asset, net | | | | | | | |
| Deferred asset | | | | | | | |
| Allowance for loan losses for loan portfolio | 951,617 | | | 949,040 | | | 1,947 | | | (73,960) | |
| Carry forward tax losses | 245,210 | | | 198,248 | | | 46,962 | | | 130,243 | |
| Provision for profit sharing | 128,198 | | | 94,344 | | | 19,892 | | | 23,436 | |
| Provision for sundry expenses and risks | 114,559 | | | 60,148 | | | 45,514 | | | 45 | |
| Unrealized losses due to valuation of investments at fair value through other comprehensive income | 54,359 | | | 21,143 | | | — | | | — | |
| Provision for pending vacations | 50,382 | | | 37,107 | | | 10,573 | | | 4,687 | |
| Provision for stock awards | 17,300 | | | 13,872 | | | 3,130 | | | 52 | |
| Depreciation of improvements for leased premises | 13,911 | | | 15,219 | | | (1,412) | | | (5,217) | |
| Others | 153,974 | | | 58,099 | | | 82,835 | | | (112,193) | |
| | | | | | | |
| Deferred liability | | | | | | | |
| Intangibles, net | (75,009) | | | (101,945) | | | 27,347 | | | 74,326 | |
Adjustment for difference in exchange of Superintendencia Nacional de Aduanas y de Administración Tributaria (SUNAT) and SBS | (69,997) | | | (76,059) | | | 6,062 | | | (31,043) | |
| Buildings depreciation | (63,004) | | | (50,556) | | | (8,794) | | | 13,283 | |
| Deferred acquisitions costs - DAC | (18,574) | | | (17,362) | | | (1,212) | | | (1,292) | |
Unrealized gain due to valuation of investments at fair value through other comprehensive income | (11,575) | | | 853 | | | — | | | — | |
| Others | (99,715) | | | (31,285) | | | (45,163) | | | 20,860 | |
| Total | 1,391,636 | | | 1,170,866 | | | 187,681 | | | 43,227 | |
| | | | | | | | | | | | | | | | | | | | | | | |
| Consolidated statement of financial position | | Consolidated statement of income |
| 2025 | | 2024 | | 2025 | | 2024 |
| S/(000) | | S/(000) | | S/(000) | | S/(000) |
| Deferred income tax liability, net | | | | | | | |
| Deferred asset | | | | | | | |
| Provision for sundry expenses and risks | 16,048 | | | 23,034 | | | (17,423) | | | 10,639 | |
| Deferred income due to commission | 3,322 | | | 4,645 | | | (1,323) | | | (629) | |
| Provision for profit sharing | 1,462 | | | 14,850 | | | (14,920) | | | (3,047) | |
| Carry forward tax losses | — | | | 19,757 | | | (19,757) | | | — | |
| Unrealized losses due to valuation of investments at fair value through other comprehensive income | (2,281) | | | 28,165 | | | — | | | — | |
| Others | (6,467) | | | (39,448) | | | 46,966 | | | (34,374) | |
| | | | | | | |
| Deferred liability | | | | | | | |
| Revaluation of long‑lived assets in a business combination | (262,667) | | | — | | | — | | | — | |
| Intangibles, net | (56,211) | | | (16,953) | | | 16,144 | | | 19,616 | |
| Unrealized gain due to valuation of investments at fair value through other comprehensive income | (17,305) | | | (13,846) | | | — | | | — | |
| Deferred acquisitions costs - DAC | (9,446) | | | (8,277) | | | (1,169) | | | (91) | |
| Gain generated in the reorganization of Pacífico EPS | — | | | (39,515) | | | 39,515 | | | — | |
| Others | (43,394) | | | (31,437) | | | (109,990) | | | 19,602 | |
| Total | (376,939) | | | (59,025) | | | (61,957) | | | 11,716 | |
d) Reconciliation of net deferred tax assets and liabilities:
| | | | | | | | | | | | | | | | | | | | | | | |
| Deferred asset, net | | Deferred liability, net |
| 2025 | | 2024 | | 2025 | | 2024 |
| S/(000) | | S/(000) | | S/(000) | | S/(000) |
| Balance as of January 1 | 1,170,866 | | | 1,182,195 | | | (59,025) | | | (107,517) | |
| Income tax (expense)/income for the year recognized in profit or loss | 187,681 | | | 43,227 | | | (61,957) | | | 11,716 | |
| Income tax (expense)/income for the year recognized in other comprehensive income (OCI) | 18,065 | | | (22,719) | | | 2,180 | | | 32,246 | |
| Deferred income tax arising from EPS and subsidiaries, Note 2(a) | — | | | — | | | (2,375) | | | — | |
| Deferred taxes acquired in a business combination, Note 2(a) | — | | | — | | | (262,667) | | | — | |
| Foreign exchange effect and others | 15,024 | | | (31,837) | | | 6,905 | | | 4,530 | |
| Balance as of December 31 | 1,391,636 | | | 1,170,866 | | | (376,939) | | | (59,025) | |
The Group has recorded a deferred asset corresponding to accumulated tax losses, such losses relate to subsidiaries that have a history of tax loss carryforwards and will be offset against future taxable profits. This benefit cannot be offset against future taxable profits of other Group companies.
e) The Tax Authority in Peru is the National Superintendency of Customs and Tax Administration (Superintendencia Nacional de Aduanas y de Administración Tributaria – SUNAT). The Peruvian Tax Authority is entitled to review and, if necessary, request amendments to the annual tax returns of the subsidiaries established in Peru within four years after the year of their filing. However, this statute of limitations may be suspended in accordance with the criteria set forth in Peruvian tax legislation. The annual tax returns of the subsidiaries that are still open to review by the Peruvian Tax Authority are as follows:
| | | | | |
| Banco de Crédito del Perú S.A. (*) | 2021 - 2024 |
| Mibanco, Banco de la Microempresa S.A. (**) | 2023 - 2024 |
| Pacífico Compañía de Seguros y Reaseguros (***) | 2021 - 2024 |
| Credicorp Capital Servicios Financieros | 2022 - 2024 |
| Credicorp Capital Perú (****) | 2022 - 2024 |
| Grupo Crédito | 2021 - 2024 |
It is worth noting that the Tax Authority is currently auditing the Company’s income tax returns, with the following exceptions and updates:
(*) In December 2025, the Tax Authority notified the commencement of the audit of the Corporate Income Tax for fiscal year 2021.
(**) As of December 2, 2025, Mibanco was notified by the Tax Authority of the commencement of a tax audit related to Corporate Income Tax for fiscal year 2023. The audit procedure is currently ongoing.
(***) As of December 31, 2025, the Tax Authority is reviewing the income tax return for the 2021 fiscal year.
(****) The Tax Authority has reviewed the income tax return of Credicorp Capital Perú for the 2021 fiscal year.
The tax authorities of Bolivia and Colombia are empowered to review and, if applicable, issue new income tax assessments for Credicorp’s subsidiaries located in these countries. Local regulations also establish the timeframe within which such reviews may be conducted after the filing of the income tax returns. Additionally, in the case of Colombia, a six-year statute of limitations applies to taxpayers required to comply with Transfer Pricing regulations or to those that report tax losses. The annual income tax returns pending review by the foreign tax authorities are as follows:
| | | | | |
| Banco de Crédito de Bolivia | 2017 - 2024 |
Credicorp Capital Colombia (*) | 2020 - 2024 |
| Mibanco Colombia | 2020 - 2024 |
| Credicorp Capital Fiduciaria (*) | 2020 - 2024 |
(*) The Tax Authority has reviewed the income tax return for the fiscal year 2022 of the following entities: Credicorp Capital Colombia and Credicorp Capital Fiduciaria.
Since tax regulations are subject to interpretation by the different Tax Authorities where Credicorp’s subsidiaries are located, it is not possible to determine at the present date whether any significant additional liabilities may arise from any eventual tax examinations of the Credicorp’s subsidiaries. Any resulting unpaid taxes, tax penalties or interest that may arise will be recognized as expenses in the year in which they are determined. However, Management of Credicorp and its Subsidiaries and their legal counsel consider that any additional tax assessments would not have a significant impact on the consolidated financial statements as of December 31, 2025 and 2024.
f) International Tax Reform—Pillar Two Model Rules – Amendments to IAS 12
The amendments to IAS 12 have been introduced in response to the OECD’s BEPS Pillar Two rules and include:
(i)A mandatory temporary exception to the recognition and disclosure of deferred taxes arising from the jurisdictional implementation of the Pillar Two model rules; and
(ii)Disclosure requirements for affected entities to help users of the financial statements better understand an entity’s exposure to Pillar Two income taxes arising from that legislation, particularly before its effective date.
g) From 2026, the tax authority will provide taxpayers with a rating of their tax profile, determined in accordance with the rules in force. This rating will not have a direct impact on the assessment of taxes.
18 CONTINGENT RISKS AND COMMITMENTS
a)This item consists of the following:
| | | | | | | | | | | |
| 2025 | | 2024 |
| S/(000) | | S/(000) |
| | | |
| Contingent credits – indirect loans (b) | | | |
Guarantees and standby letters | 18,815,322 | | | 19,557,938 | |
| Import and export letters of credit | 2,451,835 | | | 2,581,383 | |
| Sub-total, Note 7(b) | 21,267,157 | | | 22,139,321 | |
| | | |
| Responsibilities under credit line agreements (c) | 80,250,985 | | | 85,269,774 | |
| Total | 101,518,142 | | | 107,409,095 | |
Reference values of transactions with derivative financial instruments are recorded in off-balance sheet accounts in the committed currency, as shown in Note 12(c).
b)In the normal course of their business, the Group’s banking Subsidiaries are party to transactions with off-balance sheet risk. These transactions expose them to credit risk in addition to the amounts recognized in the consolidated statement of financial position.
Credit risk for contingent credits is defined as the possibility of sustaining a loss because one of the parties to a financial instrument fails to comply with the terms of the contract. The risk of credit losses is represented by the contractual amounts specified in the related contracts. The Group applies the same credit policies in making contingent commitments and other obligations as it does for on-balance sheet instruments (Note 7(a)), including the requirement to obtain collateral when it is deemed necessary.
Collateral held varies, but may include deposits in financial institutions, securities or other assets. Many of the contingent transactions reach maturity without any performance being required; therefore, the total committed amounts do not necessarily represent future cash requirements.
c)Lines of credit include consumer loans and other consumer loan facilities (credit card receivables) granted to customers and are cancelable upon related notice to the customer.
19 INTEREST, SIMILAR INCOME AND SIMILAR EXPENSES
This item consists of the following:
| | | | | | | | | | | | | | | | | |
| 2025 | | 2024 | | 2023 |
| S/(000) | | S/(000) | | S/(000) |
| Interest and similar income | | | | | |
| Interest on loans | 15,743,509 | | | 15,654,391 | | | 15,044,864 | |
Interest on investments at fair value through other comprehensive income | 2,058,897 | | | 2,136,099 | | | 1,984,408 | |
| Interest on due from banks | 1,369,573 | | | 1,405,854 | | | 1,133,211 | |
| Interest on investments at amortized cost | 441,899 | | | 469,224 | | | 456,543 | |
Dividends received | 87,275 | | | 49,469 | | | 46,080 | |
| Interest on investments at fair value through profit or loss | 46,288 | | | 54,999 | | | 48,376 | |
| Other interest and similar income | 182,728 | | | 99,220 | | | 85,013 | |
| Total | 19,930,169 | | | 19,869,256 | | | 18,798,495 | |
| | | | | |
| Interest and similar expense | | | | | |
Interest on deposits and obligations | (2,303,616) | | | (2,850,474) | | | (3,141,307) | |
| Interest on due to banks and correspondents | (1,029,593) | | | (1,081,126) | | | (1,158,665) | |
| Interest on bonds and notes issued | (710,390) | | | (799,223) | | | (634,299) | |
Financial expenses of insurance activities | (560,081) | | | (507,356) | | | (466,814) | |
| Deposit insurance fund | (283,706) | | | (256,583) | | | (237,441) | |
| Interest on lease liabilities | (37,169) | | | (22,828) | | | (25,574) | |
| Other interest and similar expense | (289,135) | | | (236,535) | | | (196,423) | |
| Total | (5,213,690) | | | (5,754,125) | | | (5,860,523) | |
20 COMMISSIONS AND FEES
This item consists of the following:
| | | | | | | | | | | | | | | | | |
| 2025 | | 2024 | | 2023 |
| S/(000) | | S/(000) | | S/(000) |
| | | | | |
| Performance obligations at a point in time: | | | | | |
| Maintenance of accounts and card services | 1,627,260 | | | 1,808,445 | | | 1,524,298 | |
| Commissions for banking services | 654,871 | | | 542,592 | | | 443,040 | |
| Commissions for transfers | 229,567 | | | 90,721 | | | 291,692 | |
Collection services | 185,302 | | | 143,674 | | | 119,563 | |
| Operational commissions | 80,212 | | | 45,955 | | | 41,082 | |
Commissions for intermediation in virtual platforms | 72,594 | | | 35,686 | | | 41,376 | |
| Commissions for loans | 60,183 | | | 41,866 | | | 32,253 | |
Commissions for consulting and technical studies | 54,306 | | | 84,494 | | | 61,390 | |
| Commissions for brokerages, stockbrokers and stock markets | 41,531 | | | 67,329 | | | 43,861 | |
Others | 117,725 | | | 93,929 | | | 158,988 | |
| 3,123,551 | | | 2,954,691 | | | 2,757,543 | |
| | | | | |
| Performance obligations over time: | | | | | |
Commissions for funds and equity management | 725,220 | | | 742,250 | | | 700,663 | |
Commissions for contingent operations | 298,989 | | | 298,570 | | | 300,720 | |
Commissions for custody of securities | 51,959 | | | 56,592 | | | 45,533 | |
| 1,076,168 | | | 1,097,412 | | | 1,046,916 | |
| | | | | |
| Total | 4,199,719 | | | 4,052,103 | | | 3,804,459 | |
21 NET GAIN ON SECURITIES
This item consists of the following:
| | | | | | | | | | | | | | | | | |
| 2025 | | 2024 | | 2023 |
| S/(000) | | S/(000) | | S/(000) |
| | | | | |
Net gain on financial assets at fair value through profit or loss | 261,572 | | | 212,907 | | | 370,049 | |
Net gain (loss) on investments at fair value through other comprehensive income (*) | 155,453 | | | 43,101 | | | (61,255) | |
Net gain in associates | 41,404 | | | 135,183 | | | 117,089 | |
| Impairment of investments at fair value through other comprehensive income, Note 6(b) | (53,918) | | | (27,947) | | | (4,321) | |
| Others | (3,825) | | | (949) | | | 3,582 | |
| Total | 400,686 | | | 362,295 | | | 425,144 | |
(*) As of December 31, 2025, the amount includes the effect of the securities exchange transaction with the Ministry of Economy and Finance (MEF) amounting to S/99.0 million, see Note 6(d), and an approximately S/56.0 million net realized gain on other securities.
22 INSURANCE AND REINSURANCE RESULT
a)This item consists of the following:
| | | | | | | | | | | | | | | | | |
| 2025 | | 2024 | | 2023 |
| S/(000) | | S/(000) | | S/(000) |
Contracts measured under BBA* and VFA (b) | 224,077 | | | 204,578 | | | 226,125 | |
| Contracts measured under PAA | 4,424,623 | | | 3,574,816 | | | 3,629,283 | |
| Income from the Insurance Service | 4,648,700 | | | 3,779,394 | | | 3,855,408 | |
| | | | | |
| Expenses for incurred claims and other expenses net of change of past services | (2,768,730) | | | (2,062,848) | | | (2,232,672) | |
| | | | | |
| Losses in onerous contracts and reversal of losses | (10,686) | | | (15,801) | | | (17,181) | |
| Others | (21,259) | | | (7,128) | | | (3,134) | |
| Insurance service expenses | (2,800,675) | | | (2,085,777) | | | (2,252,987) | |
| | | | | |
| Insurance service result | 1,848,025 | | | 1,693,617 | | | 1,602,421 | |
| | | | | | | | | | | | | | | | | |
| 2025 | | 2024 | | 2023 |
| S/(000) | | S/(000) | | S/(000) |
| Income from reinsurance recoveries | 173,238 | | | 179,617 | | | 448,491 | |
| Expenses for assigning the premiums paid to the reinsurer | (632,063) | | | (674,214) | | | (839,812) | |
| Reinsurance result | (458,825) | | | (494,597) | | | (391,321) | |
b)The result of contracts measured under BBA and VFA is detailed below:
| | | | | | | | | | | | | | | | | |
| 2025 | | 2024 | | 2023 |
| S/(000) | | S/(000) | | S/(000) |
| Amounts related to changes in liabilities for the remaining coverage: | | | | | |
| CSM recognized for services provided | 137,032 | | | 125,610 | | | 128,639 | |
| Change in risk adjustment for non-financial risk | 10,619 | | | 9,907 | | | 12,357 | |
| Expenses for insurance services and expected claims occurred | 55,167 | | | 61,933 | | | 81,995 | |
| Cash recovery for the purchase of insurance | 21,259 | | | 7,128 | | | 3,134 | |
| Contracts measured under BBA and VFA | 224,077 | | | 204,578 | | | 226,125 | |
(*)Building Block Approach (BBA)
c)The impact of the new business for onerous and non-onerous contracts is detailed below:
| | | | | | | | | | | | | | | | | |
| 2025 |
| Onerous
contracts | | Non-onerous
contracts | | Total |
| S/(000) | | S/(000) | | S/(000) |
| Estimates of the present value of future outflows: | | | | | |
| Insurance Acquisition Cash Flows | 22,097 | | | 165,559 | | | 187,656 | |
| Claims and other directly attributable expenses | 623,686 | | | 1,065,161 | | | 1,688,847 | |
| Estimates of the present value of future inflows | (620,171) | | | (1,379,272) | | | (1,999,443) | |
| Risk adjustment for non-financial risk | 8,950 | | | 8,042 | | | 16,992 | |
| CSM | – | | | 140,510 | | | 140,510 | |
| Impact on provisions for contracts recognized in the period | 34,562 | | | – | | | 34,562 | |
| | | | | | | | | | | | | | | | | |
| 2024 |
| Onerous contracts | | Non-onerous contracts | | Total |
| S/(000) | | S/(000) | | S/(000) |
| Estimates of the present value of future outflows: | | | | | |
| Insurance Acquisition Cash Flows | 27,948 | | | 128,252 | | | 156,200 | |
| Claims and other directly attributable expenses | 445,384 | | | 886,382 | | | 1,331,766 | |
| Estimates of the present value of future inflows | (446,274) | | | (1,143,887) | | | (1,590,161) | |
| Risk adjustment for non-financial risk | 4,078 | | | 5,550 | | | 9,628 | |
| CSM | – | | | 123,703 | | | 123,703 | |
| Impact on provisions for contracts recognized in the period | 31,136 | | | – | | | 31,136 | |
| | | | | | | | | | | | | | | | | |
| 2023 |
| Onerous contracts | | Non-onerous contracts | | Total |
| S/(000) | | S/(000) | | S/(000) |
| Estimates of the present value of future outflows: | | | | | |
| Insurance Acquisition Cash Flows | 21,123 | | | 85,120 | | | 106,243 | |
| Claims and other directly attributable expenses | 135,905 | | | 658,515 | | | 794,420 | |
| Estimates of the present value of future inflows | (138,467) | | | (856,323) | | | (994,790) | |
| Risk adjustment for non-financial risk | 1,913 | | | 6,225 | | | 8,138 | |
| CSM | – | | | 106,463 | | | 106,463 | |
| Impact on provisions for contracts recognized in the period | 20,474 | | | – | | | 20,474 | |
d)Below we present the estimate of the release of CSM over the years considering reversals of the loss component:
| | | | | | | | | | | | | | | | | |
| 2025 | | 2024 | | 2023 |
| S/(000) | | S/(000) | | S/(000) |
| One year | 155,267 | | | 122,859 | | | 113,378 | |
| Two years | 180,190 | | | 125,636 | | | 115,736 | |
| Three years | 155,916 | | | 126,066 | | | 116,736 | |
| Four years | 136,100 | | | 124,387 | | | 117,284 | |
| Five years | 130,544 | | | 120,257 | | | 114,531 | |
| From 6 to 10 years | 545,517 | | | 517,669 | | | 494,953 | |
| Older than 10 years | 1,102,076 | | | 1,074,187 | | | 1,011,435 | |
| Total | 2,405,610 | | | 2,211,061 | | | 2,084,053 | |
e)The composition of underlying assets related to contracts with direct participation features is detailed below:
| | | | | | | | | | | | | | | | | |
| 2025 | | 2024 | | 2023 |
| S/(000) | | S/(000) | | S/(000) |
| IL Controlled | 22,293 | | | 76,946 | | | 91,502 | |
| IL Controlled Soles | 8,605 | | | 3,992 | | | 1,433 | |
| IL Balanced | 184,094 | | | 193,410 | | | 186,879 | |
| IL Balanced II | 98,059 | | | 93,044 | | | 79,671 | |
| IL Global Balanced | 27,995 | | | 13,648 | | | 1,073 | |
| IL Capitalized | 408,993 | | | 425,552 | | | 382,326 | |
| IL Capitalized II | 150,542 | | | 122,413 | | | 87,527 | |
| IL Global Growth | 101,286 | | | 18,636 | | | 804 | |
| IL Controlled II | 14,617 | | | – | | | – | |
| IL Sustainable Capitalization | – | | | – | | | 259 | |
f)The impact on the current period of the transition approaches adopted to establishing CSMs for insurance contracts portfolios is disclosed in the table below:
| | | | | | | | | | | | | | | | | |
| 2025 | | 2024 | | 2023 |
| S/(000) | | S/(000) | | S/(000) |
| CSM at the beginning of the period | 794,935 | | | 887,586 | | | 992,526 | |
Changes in estimates adjusting the CSM | (28,094) | | | (33,955) | | | (11,445) | |
| Changes related to future service | (28,094) | | | (33,955) | | | (11,445) | |
CSM recognized in consolidated statement of income for services rendered | (84,888) | | | (91,995) | | | (102,878) | |
Interest expense on insurance contracts issued (interest on CSM) | 20,469 | | | 23,975 | | | 28,279 | |
| Changes related to the current service | (64,419) | | | (68,020) | | | (74,599) | |
Other changes | (56,872) | | | 9,324 | | | (18,896) | |
| CSM at the end of the period | 645,550 | | | 794,935 | | | 887,586 | |
23 SALARIES AND EMPLOYEES BENEFITS
This item consists of the following:
| | | | | | | | | | | | | | | | | |
| 2025 | | 2024 | | 2023 |
| S/(000) | | S/(000) | | S/(000) |
| | | | | |
| Salaries | 3,029,130 | | | 2,624,359 | | | 2,430,121 | |
Vacations, medical assistance and others | 529,185 | | | 446,715 | | | 433,441 | |
| Workers profit sharing | 445,756 | | | 335,164 | | | 286,895 | |
| Bonuses | 407,832 | | | 342,380 | | | 320,084 | |
| Additional participation | 382,943 | | | 349,829 | | | 276,177 | |
| Social security | 264,787 | | | 275,083 | | | 254,770 | |
| Severance compensation benefit | 226,801 | | | 198,058 | | | 180,637 | |
| Share-based payment plans | 149,037 | | | 104,848 | | | 83,328 | |
| Total | 5,435,471 | | | 4,676,436 | | | 4,265,453 | |
24 ADMINISTRATIVE EXPENSES
This item consists of the following:
| | | | | | | | | | | | | | | | | |
| 2025 | | 2024 | | 2023 |
| S/(000) | | S/(000) | | S/(000) |
| | | | | |
| Information technology and system expenses | 1,385,862 | | | 1,251,424 | | | 1,080,001 | |
| Publicity and others | 514,431 | | | 770,965 | | | 720,718 | |
| Consulting and professional fees | 448,927 | | | 407,508 | | | 336,715 | |
| Taxes and contributions | 354,353 | | | 382,711 | | | 264,326 | |
| Transport and communications | 250,470 | | | 244,255 | | | 226,860 | |
| Repair and maintenance | 170,417 | | | 154,533 | | | 157,127 | |
| Short term, low-value and variable lease expenses | 143,855 | | | 124,781 | | | 108,357 | |
| Outsourcing | 112,962 | | | 107,274 | | | 144,534 | |
| Comissions by agents | 108,710 | | | 118,156 | | | 115,120 | |
| Subscriptions and quotes | 78,402 | | | 74,002 | | | 61,945 | |
| Security and protection | 69,679 | | | 65,970 | | | 64,432 | |
| Sundry supplies | 69,582 | | | 91,769 | | | 118,510 | |
| Electricity and water | 48,150 | | | 52,260 | | | 56,359 | |
| Insurance | 44,046 | | | 55,150 | | | 56,324 | |
| Electronic processing | 33,579 | | | 29,466 | | | 39,764 | |
| Cleaning | 27,254 | | | 25,549 | | | 22,677 | |
| Others | 230,105 | | | 228,002 | | | 229,434 | |
| Total | 4,090,784 | | | 4,183,775 | | | 3,803,203 | |
25 OTHER INCOME AND EXPENSES
This item consists of the following:
| | | | | | | | | | | | | | | | | |
| 2025 | | 2024 | | 2023 |
| S/(000) | | S/(000) | | S/(000) |
| Other income | | | | | |
| Gain on remeasurement of previously held equity interest in Pacifico EPS, Note 2(a) | 235,490 | | | — | | | — | |
| Reversal of provision | 188,456 | | | 154,610 | | | 58,703 | |
Rental income | 61,449 | | | 53,077 | | | 46,836 | |
Net income from the sale of property, furniture and equipment | 37,636 | | | 68,037 | | | 1,654 | |
Net result from sale of loan portfolio | 1,778 | | | 21,295 | | | 83,515 | |
| Net income from the sale of investment property | 1,057 | | | 21,771 | | | — | |
Others | 58,782 | | | 195,989 | | | 249,945 | |
| Total other income | 584,648 | | | 514,779 | | | 440,653 | |
| | | | | | | | | | | | | | | | | |
| 2025 | | 2024 | | 2023 |
| S/(000) | | S/(000) | | S/(000) |
| Other expenses | | | | | |
| Provision for sundry risks | 149,651 | | | 315,214 | | | 95,873 | |
| Losses due to operational risk | 90,940 | | | 67,030 | | | 66,302 | |
| Derecognition of intangibles due to withdrawals and dismissed projects | 79,335 | | | 131,142 | | | 96,978 | |
| Expenses on improvements in building for rent | 39,882 | | | 26,060 | | | 17,445 | |
| Provision for other accounts receivable | 26,046 | | | 12,261 | | | 11,975 | |
| Donations | 22,687 | | | 23,518 | | | 23,354 | |
| Association in participation | 7,356 | | | 28,269 | | | 53,097 | |
Others | 152,489 | | | 169,775 | | | 169,577 | |
| Total other expenses | 568,386 | | | 773,269 | | | 534,601 | |
26 EARNING PER SHARE
The net earnings per ordinary share were determined based on the net income attributable to equity holders of the Group as follows:
| | | | | | | | | | | | | | | | | |
| 2025 | | 2024 | | 2023 |
| | | | | |
| Net income attributable to equity holders of Credicorp (in thousands of soles) | 6,925,377 | | | 5,501,254 | | | 4,865,540 | |
| | | | | |
| Number of stock | | | | | |
| Ordinary stock, Note 16(a) | 94,382,317 | | 94,382,317 | | 94,382,317 |
| Less – opening balance of treasury stock | (14,946,637) | | (14,886,096) | | (14,849,223) |
| Acquisition of treasury stock, net | (58,224) | | (46,444) | | (55,283) |
| Weighted average number of ordinary shares for basic earnings | 79,377,456 | | 79,449,777 | | 79,477,811 |
| Plus - dilution effect - stock awards | 154,030 | | 169,307 | | 177,709 |
| Weighted average number of ordinary shares adjusted for the effect of dilution | 79,531,486 | | 79,619,084 | | 79,655,520 |
| | | | | |
| Basic earnings per share (in soles) | 87.25 | | | 69.24 | | | 61.22 | |
| Diluted earnings per share (in soles) | 87.08 | | | 69.09 | | | 61.08 | |
27 OPERATING SEGMENTS
Credicorp Board of Directors organized the Group’s subsidiaries according to the types of financial services provided and the sectors on which they are focused; with the objective of optimizing the management thereof. Next, we present the Group´s business lines:
a)Universal Banking -
Includes the operations related to the granting of various credits and financial instruments to individuals and legal entities, from the segments of wholesale and retail banking, such as the obtaining of funds from the public through deposits and current accounts, obtaining of funding by means of initial public offerings and direct indebtedness with other financial institutions. This business line incorporates the results and balances of the Banco de Crédito del Perú (BCP) and Banco de Crédito de Bolivia (BCB).
b)Insurance, Medical Services and Pensions -
-Insurance: includes, mainly, the issue of insurance policies to cover losses in commercial property, transport, marine vessels, automobiles, life, health and pensions, operations carried out through Pacífico Compañía de Seguros y Reaseguros S.A.
-Medical Services: includes the provision of medical and health services by Pacifico EPS and clinics.
-Pensions: provides Management Service of private pension funds to the affiliates, operation carried out from Prima AFP.
c)Microfinance -
Includes the management of loans, credits, deposits and checking accounts of the small and microenterprises, which are carried out through Mibanco, Banco de la Microempresa S.A. and MiBanco - Banco de la Microempresa de Colombia S.A.
d)Investment Management and Advisory -
Comprising brokerage service and investment management services offered to a broad and diverse client, which includes corporations, institutional investors, governments and foundations; also, comprising the structuring and placement of issues in the primary market, as well as the execution and negotiation of transactions in the secondary market. Additionally, it structures securitization processes for corporate customers and manages mutual funds.
All these services are provided through Credicorp Capital Ltd. and subsidiaries and ASB Bank Corp.
Management of these business lines is designed to:
-Promote the joint action of our businesses in order to take advantage of the synergies which result from the diversification of our portfolio.
-Strengthening our leadership in the financial sector through our growth in new businesses, and the establishment of an investment banking platform available not only to the corporate world, but also to the retail segment, especially to the Small and Medium Enterprise (SME) and Consumer sectors.
-Improve the ongoing search to adapt our business models, processes and procedures into line with best practices worldwide.
The operating results of the Group’s new business lines are monitored separately by the Board of Directors and Senior Management on a monthly basis, in order to make decisions regarding the allocation of resources and the evaluation of the performance of each one of the segments. The Chief Operating Decision Maker (CODM) of Credicorp is the Chief Executive Officer (CEO). The performance of the segments is evaluated
based on net profit and is measured consistently with the net profit presented in the consolidated statement of income.
Financial information by segment is prepared subject to the necessary and on a uniform basis, with coherent grouping according to the type of activity and customer.
None of the income derives from transactions carried out with a single customer or counterparty which is equal to or greater than 10.0 percent or more of the total income of the Group as of December 31, 2025, 2024 and 2023.
(i)The following table presents information recorded in the results and for certain items of the assets corresponding to the Group’s reportable segments (in millions of soles) as of December 31, 2025, 2024 and 2023:
| | | | | | | | | | | | | | | | | | | | | | | | | | | | | | | | | | | | | | | | | | | | | | | | | | | | | | | | | | | | | | | | | | | | |
| | Income (*) | | | | | | | | | | | | | | | | | | |
| 2025 | | External | | From other
segments
(**) | | Net interest,
similar
income and
expenses | | Other
income, net
(***) | | Provision
for credit
losses on
loan
portfolio | | Depreciation and
amortization and
right in use | | Income tax | | Net profit
(loss) | | Additions of
fixed asset,
intangibles
and
goodwill | | Total
assets | | Total
liabilities |
| Universal Banking | | | | | | | | | | | | | | | | | | | | | | |
| Banco de Crédito del Perú | | 19,528 | | | 723 | | | 11,137 | | | 5,240 | | | (1,927) | | | (621) | | | (2,158) | | | 6,042 | | | 859 | | | 202,206 | | | 176,582 | |
| Banco de Crédito de Bolivia | | 683 | | | 22 | | | 215 | | | 186 | | | (24) | | | (22) | | | (34) | | | 86 | | | 26 | | | 10,062 | | | 10,034 | |
| | 20,211 | | | 745 | | | 11,352 | | | 5,426 | | | (1,951) | | | (643) | | | (2,192) | | | 6,128 | | | 885 | | | 212,268 | | | 186,616 | |
| Insurance, Medical Services and Pension funds | | | | | | | | | | | | | | | | | | | | | | |
| Pacífico Seguros and subsidiaries | | 2,374 | | | 1,235 | | | 298 | | | 1,456 | | | – | | | (41) | | | (150) | | | 854 | | | 731 | | | 20,625 | | | 16,496 | |
| Prima AFP | | 407 | | | 4 | | | 1 | | | 403 | | | – | | | (29) | | | (60) | | | 147 | | | 15 | | | 682 | | | 231 | |
| | 2,781 | | | 1,239 | | | 299 | | | 1,859 | | | – | | | (70) | | | (210) | | | 1,001 | | | 746 | | | 21,307 | | | 16,727 | |
| Microfinance | | | | | | | | | | | | | | | | | | | | | | |
| MiBanco | | 3,301 | | | 150 | | | 2,480 | | | 138 | | | (749) | | | (93) | | | (158) | | | 453 | | | 120 | | | 18,355 | | | 15,568 | |
| MiBanco Colombia | | 670 | | | 1 | | | 430 | | | 56 | | | (93) | | | (20) | | | (31) | | | 47 | | | 13 | | | 2,858 | | | 2,369 | |
| | 3,971 | | | 151 | | | 2,910 | | | 194 | | | (842) | | | (113) | | | (189) | | | 500 | | | 133 | | | 21,213 | | | 17,937 | |
| | | | | | | | | | | | | | | | | | | | | | |
| Investment Management and Advisory | | 1,405 | | | 538 | | | 54 | | | 1,010 | | | – | | | (42) | | | (54) | | | 225 | | | 30 | | | 8,226 | | | 6,682 | |
| Other segments | | 455 | | | 216 | | | 101 | | | 304 | | | (80) | | | (25) | | | (216) | | | (766) | | | 54 | | | 6,446 | | | 2,410 | |
| Eliminations | | (268) | | | – | | | – | | | (168) | | | – | | | – | | | (4) | | | (5) | | | – | | | (2,097) | | | (2,106) | |
| Total consolidated | | 28,555 | | | 2,889 | | | 14,716 | | | 8,625 | | | (2,873) | | | (893) | | | (2,865) | | | 7,083 | | | 1,848 | | | 267,363 | | | 228,266 | |
(*)Corresponds to total interest and similar income, other income, the result of the insurance and reinsurance service and medical services results.
(**)Corresponds to income derived from transactions with other segments, which were eliminated in the consolidated statement of income.
(***)Corresponds to other income (include income and expenses for commissions) result of the insurance and reinsurance service and medical services results..
| | | | | | | | | | | | | | | | | | | | | | | | | | | | | | | | | | | | | | | | | | | | | | | | | | | | | | | | | | | | | | | | | |
| Income (*) | | | | | | | | | | | | | | | | | | |
| 2024 | External | | From other
segments
(**) | | Net interest,
similar
income and
expenses | | Other
income, net
(***) | | Provision
for credit
losses on
loan
portfolio | | Depreciation and
amortization
and
right in use | | Income tax | | Net profit
(loss) | | Additions of
fixed asset,
intangibles
and
goodwill | | Total assets | | Total
liabilities |
| Universal Banking | | | | | | | | | | | | | | | | | | | | | |
| Banco de Crédito del Perú | 19,176 | | | 647 | | | 10,815 | | | 4,831 | | | (2,831) | | | (492) | | | (1,767) | | | 5,003 | | | 722 | | | 194,921 | | | 171,451 | |
| Banco de Crédito de Bolivia | 924 | | | 25 | | | 353 | | | 164 | | | (84) | | | (30) | | | (73) | | | 4 | | | 84 | | | 12,996 | | | 12,954 | |
| 20,100 | | | 672 | | | 11,168 | | | 4,995 | | | (2,915) | | | (522) | | | (1,840) | | | 5,007 | | | 806 | | | 207,917 | | | 184,405 | |
| Insurance and Pension funds | | | | | | | | | | | | | | | | | | | | | |
| Pacífico Seguros and subsidiaries | 1,769 | | | 541 | | | 299 | | | 935 | | | – | | | (2) | | | (44) | | | 770 | | | 122 | | | 17,777 | | | 14,355 | |
| Prima AFP | 385 | | | 6 | | | 2 | | | 379 | | | – | | | (27) | | | (55) | | | 133 | | | 12 | | | 658 | | | 182 | |
| 2,154 | | | 547 | | | 301 | | | 1,314 | | | – | | | (29) | | | (99) | | | 903 | | | 134 | | | 18,435 | | | 14,537 | |
| Microfinance | | | | | | | | | | | | | | | | | | | | | |
| MiBanco | 3,195 | | | 146 | | | 2,243 | | | 125 | | | (851) | | | (93) | | | (85) | | | 308 | | | 85 | | | 16,979 | | | 14,279 | |
| MiBanco Colombia | 574 | | | 1 | | | 326 | | | 60 | | | (118) | | | (19) | | | (1) | | | (10) | | | 10 | | | 2,323 | | | 1,900 | |
| 3,769 | | | 147 | | | 2,569 | | | 185 | | | (969) | | | (112) | | | (86) | | | 298 | | | 95 | | | 19,302 | | | 16,179 | |
| | | | | | | | | | | | | | | | | | | | | |
Investment Management and Advisory | 1,317 | | | 527 | | | 36 | | | 945 | | | (30) | | | (43) | | | (69) | | | 196 | | | 36 | | | 8,466 | | | 6,907 | |
| Other segments | 388 | | | 132 | | | 41 | | | 264 | | | (29) | | | (7) | | | (83) | | | (779) | | | 40 | | | 6,341 | | | 3,286 | |
| Eliminations | (256) | | | – | | | – | | | (100) | | | – | | | – | | | (24) | | | (2) | | | – | | | (4,372) | | | (4,202) | |
| Total consolidated | 27,472 | | | 2,025 | | | 14,115 | | | 7,603 | | | (3,943) | | | (713) | | | (2,201) | | | 5,623 | | | 1,111 | | | 256,089 | | | 221,112 | |
(*)Corresponds to total interest and similar income, other income, the result of the insurance and reinsurance service.
(**)Corresponds to income derived from transactions with other segments, which were eliminated in the consolidated statement of income.
(***)Corresponds to other income (include income and expenses for commissions) result of the insurance and reinsurance service.
| | | | | | | | | | | | | | | | | | | | | | | | | | | | | | | | | | | | | | | | | | | | | | | | | | | | | | | | | | | | | | | | | |
| Income (*) | | | | | | | | | | | | | | | | | | |
| 2023 | External | | From other
segments
(**) | | Net interest,
similar
income and
expenses | | Other
income, net
(***) | | Provision
for credit
losses on
loan
portfolio | | Depreciation and
amortization
and
right in use | | Income tax | | Net profit
(loss) | | Additions of
fixed asset,
intangibles
and
goodwill | | Total assets | | Total
liabilities |
| Universal Banking | | | | | | | | | | | | | | | | | | | | | |
| Banco de Crédito del Perú | 17,802 | | | 686 | | | 9,818 | | | 4,315 | | | (2,846) | | | (460) | | | (1,498) | | | 4,379 | | | 894 | | | 178,053 | | | 155,908 | |
| Banco de Crédito de Bolivia | 820 | | | 19 | | | 332 | | | 110 | | | (50) | | | (28) | | | (62) | | | 3 | | | 16 | | | 12,631 | | | 12,593 | |
| 18,622 | | | 705 | | | 10,150 | | | 4,425 | | | (2,896) | | | (488) | | | (1,560) | | | 4,382 | | | 910 | | | 190,684 | | | 168,501 | |
| Insurance and Pension funds | | | | | | | | | | | | | | | | | | | | | |
| Pacífico Seguros and subsidiaries | 1,730 | | | 528 | | | 285 | | | 952 | | | – | | | (4) | | | (40) | | | 819 | | | 79 | | | 16,586 | | | 13,435 | |
| Prima AFP | 386 | | | 7 | | | 4 | | | 379 | | | – | | | (25) | | | (57) | | | 150 | | | 17 | | | 741 | | | 240 | |
| 2,116 | | | 535 | | | 289 | | | 1,331 | | | – | | | (29) | | | (97) | | | 969 | | | 96 | | | 17,327 | | | 13,675 | |
| Microfinance | | | | | | | | | | | | | | | | | | | | | |
| MiBanco | 3,236 | | | 187 | | | 2,165 | | | 155 | | | (923) | | | (87) | | | (47) | | | 202 | | | 129 | | | 16,931 | | | 13,902 | |
| MiBanco Colombia | 489 | | | 1 | | | 255 | | | 45 | | | (125) | | | (15) | | | 26 | | | (145) | | | 44 | | | 2,164 | | | 1,892 | |
| 3,725 | | | 188 | | | 2,420 | | | 200 | | | (1,048) | | | (102) | | | (21) | | | 57 | | | 173 | | | 19,095 | | | 15,794 | |
| | | | | | | | | | | | | | | | | | | | | |
| Investment Management and Advisory | 1,210 | | | 518 | | | 82 | | | 809 | | | – | | | (50) | | | (31) | | | 161 | | | 16 | | | 10,104 | | | 8,394 | |
| Other segments | 278 | | | 105 | | | (3) | | | 216 | | | (13) | | | 10 | | | (179) | | | (609) | | | 19 | | | 4,947 | | | 2,670 | |
| Eliminations | (286) | | | – | | | – | | | (114) | | | – | | | – | | | – | | | – | | | – | | | (3,317) | | | (3,301) | |
| Total consolidated | 25,665 | | | 2,051 | | | 12,938 | | | 6,867 | | | (3,957) | | | (659) | | | (1,888) | | | 4,960 | | | 1,214 | | | 238,840 | | | 205,733 | |
(*)Corresponds to total interest and similar income, other income, the result of the insurance and reinsurance service.
(**)Corresponds to income derived from transactions with other segments, which were eliminated in the consolidated statement of income.
(***)Corresponds to other income (include income and expenses for commissions) result of the insurance and reinsurance service.
(ii)The following table presents (in millions of soles) the distribution of the total revenue, operating revenue and non-current assets of the Group; all assigned based on the location of the clients and assets, respectively, as of December 31, 2025, 2024 and 2023:
| | | | | | | | | | | | | | | | | | | | | | | | | | | | | | | | | | | | | | | | | | | | | | | | | | | | | | | | | | | | | | | | | | | | | | | |
| 2025 | | 2024 | | 2023 |
| Total
income (*) | | Operating
income (**) | | Total non
current
assets (***) | | Total
liabilities | | Total
income (*) | | Operating
income (**) | | Total non
current
assets (***) | | Total
liabilities | | Total
income (*) | | Operating
income (**) | | Total non
current
assets (***) | | Total
liabilities |
| Peru | 29,685 | | | 13,936 | | | 6,686 | | | 207,828 | | | 24,573 | | | 13,358 | | | 4,459 | | | 196,497 | | | 22,588 | | | 11,922 | | | 4,648 | | | 180,268 | |
| Bermuda | 125 | | | 17 | | | 38 | | | 277 | | | (767) | | | (636) | | | 5 | | | 1,917 | | | 150 | | | (45) | | | – | | | 2,086 | |
| Colombia | 1,360 | | | 361 | | | 405 | | | 4,593 | | | 1,265 | | | 240 | | | 339 | | | 3,402 | | | 854 | | | 199 | | | 193 | | | 4,060 | |
| Bolivia | 735 | | | 211 | | | 152 | | | 10,176 | | | 1,065 | | | 346 | | | 201 | | | 13,121 | | | 1,028 | | | 328 | | | 122 | | | 12,784 | |
| Panama | 404 | | | 131 | | | 18 | | | 3,963 | | | 356 | | | 129 | | | 29 | | | 4,758 | | | 384 | | | 174 | | | 31 | | | 5,580 | |
| Chile | 234 | | | 77 | | | 102 | | | 2,382 | | | 208 | | | 16 | | | 88 | | | 1,132 | | | 129 | | | 2 | | | 75 | | | 778 | |
| United States of America | 42 | | | – | | | 7 | | | 20 | | | 38 | | | – | | | 9 | | | 17 | | | 29 | | | – | | | 14 | | | 19 | |
| Cayman Islands | 532 | | | 574 | | | 30 | | | 76 | | | 734 | | | 662 | | | – | | | 268 | | | 503 | | | 358 | | | – | | | 154 | |
| Others (****) | (4,562) | | | (591) | | | (1) | | | (1,049) | | | – | | | – | | | – | | | – | | | – | | | – | | | – | | | 4 | |
| Total consolidated | 28,555 | | | 14,716 | | | 7,437 | | | 228,266 | | | 27,472 | | | 14,115 | | | 5,130 | | | 221,112 | | | 25,665 | | | 12,938 | | | 5,083 | | | 205,733 | |
(*)As of December 31, 2025, it includes the total of interest and similar income, other income, insurance and reinsurance results, and medical services results. As of December 31, 2024 and 2023,
it includes the total of interest and similar income, other income, and insurance and reinsurance results.
(**)Operating income includes the income from interest and similar expenses from banking.
(****)Non-current assets consist of property, furniture and equipment, intangible assets and goodwill and right-for-use assets, net.
(****)Includes other countries such as Mexico, adjustments and eliminations.
28 TRANSACTIONS WITH RELATED PARTIES
a) The Group’s consolidated financial statements as of December 31, 2025 and 2024 include transactions with related parties, the Board of Directors, the Group’s key executives (defined as the Management of Credicorp) and the companies which are controlled by these individuals through their majority shareholding or their role as Chairman or CEO.
b) The following table presents the main transactions and balances with related parties and individuals as of December 31, 2025 and 2024:
| | | | | | | | | | | |
| 2025 | | 2024 |
| S/(000) | | S/(000) |
| Statement of financial position - | | | |
| Direct loans | 1,855,712 | | | 2,472,179 | |
| Investments (i) | 874,937 | | | 611,271 | |
| Deposits (ii) | (659,231) | | | (1,839,980) | |
| Derivatives at fair value | 354,610 | | | 280,624 | |
(i) As of December 31, 2025, the balance includes mainly S/206.3 million of corporate bonds of Alicorp S.A.A., S/151.7 million of corporate bonds issued by Pluz Energía Perú S.A.A., S/150.8 million of corporate bonds issued by Corporacion Primax and S/95.3 million of corporate bonds of Cementos Pacasmayo S.A.
As of December 31, 2024, the balance includes mainly S/155.7 million of corporate bonds of Alicorp S.A.A., S/93.9 million of corporate bonds issued by Cementos Pacasmayo S.A., and S/104.2 million of shares of Inversiones Centenario.
(ii) Corresponds to deposits of legal entities and individuals.
| | | | | | | | | | | |
| 2025 | | 2024 |
| S/(000) | | S/(000) |
| Statement of income | | | |
| Interest income related to loans | 7,715 | | | 55,485 | |
| Interest expenses related to deposits | (5,122) | | | (37,308) | |
| Other income | 19,644 | | | 22,735 | |
| | | |
Contingent risks and commitments | | | |
| Indirect loans | 518,493 | | | 746,992 | |
c) As of December 31, 2025, direct loans to related companies are secured by collateral, had maturities between January 2026 and July 2032, accrue interest at an annual soles average interest rate of 10.08 percent and at an annual foreign currency average interest rate of 8.23 percent (As of December 31, 2024, maturities where between January 2025 and December 2030, and the annual soles average interest rate was 10.78 percent and the annual foreign currency average interest rate was 9.56 percent). Also, as of December 31, 2025, the Group maintains S/87.4 million allowance for loan losses for related parties (As of December 31, 2024 maintains S/58.1 million).
d) At December 31, 2025 and 2024, directors, officers and employees of the Group have been involved, directly and indirectly, in credit transactions with certain subsidiaries of the Group, as permitted by Peruvian Banking and Insurance Law Nº26702, which regulates and limits certain transactions with employees, directors and officers of a bank or an insurance company. At December 31, 2025 and 2024, direct loans to employees, directors, key management and family members amounted to S/1,463.2 million and S/1,389.6 million, respectively; they are repaid monthly.
e) The Group’s key executives’ compensation (including the related income taxes assumed by the Group) as of December 31, 2025 and 2024 was as follows:
| | | | | | | | | | | |
| 2025 | | 2024 |
| S/(000) | | S/(000) |
| | | |
| Director’s compensation | 11,221 | | | 8,628 | |
| Senior Management Compensation: | | | |
| Remuneration | 66,485 | | | 62,258 | |
| Expense for long-term incentive programs (Stock awards): | 40,811 | | | 36,839 | |
| Total | 118,517 | | | 107,725 | |
Between February and March of each year, the Group grants its own shares to certain key executives under two long-term incentive programs: the “Value Generation Plan” and the “Retention Plan.” Under the Retention Plan, the shares granted vest over the next three years (33.3 percent of the total shares granted each year). Under the Value Generation Plan, the shares are delivered after three years, subject to the achievement of specific performance metrics.
The shares are presented on a gross basis and include the corresponding income taxes in accordance with the tax legislation applicable in each country.
f) As of December 31, 2025 and 2024 the Group holds interests in various funds managed by certain of the Group’s subsidiaries. The details of the funds are presented below:
| | | | | | | | | | | |
| 2025 | | 2024 |
| S/(000) | | S/(000) |
| At fair value through profit or loss: | | | |
| Mutual funds, investment funds and hedge funds | | | |
U.S. Dollars | 623,810 | | | 451,522 | |
| Soles | 597,816 | | | 397,614 | |
| Bolivianos | 288,850 | | | 280,188 | |
| Colombian pesos | 170,306 | | | 133,821 | |
| Chilean pesos | 17,643 | | | 15,409 | |
| Total | 1,698,425 | | | 1,278,554 | |
| Restricted mutual funds, Note 6(a)(iv) | 336,159 | | | 307,225 | |
29 FINANCIAL INSTRUMENTS CLASSIFICATION
The table below shows the carrying amounts of the financial assets and liabilities captions in the consolidated statement of financial position, by categories as defined under IFRS 9 as of December 31, 2025 and 2024:
| | | | | | | | | | | | | | | | | | | | | | | | | | | | | | | | | | | | | | | | | | | | | | | | | | | | | | | | | | | | | | | | | | | | | | | |
| 2025 | | 2024 |
| Financial assets and
liabilities at fair
value through profit or loss | | Financial assets at fair value
through other comprehensive
income | | | | | | Financial assets and
liabilities at fair
value through profit or loss | | Financial assets at fair value
through other comprehensive
income | | | | |
| Investments
and
derivates | | Investments
designated at
inception | | Investments and derivates | | Investments
designated
at inception | | Financial
assets and
liabilities
measured at
amortized
cost | | Total | | Investments
and derivates | | Investments
designated at
inception | | Investments and derivates | | Investments
designated
at inception | | Financial
assets and
liabilities
measured at
amortized
cost | | Total |
| S/(000) | | S/(000) | | S/(000) | | S/(000) | | S/(000) | | S/(000) | | S/(000) | | S/(000) | | S/(000) | | S/(000) | | S/(000) | | S/(000) |
| Assets | | | | | | | | | | | | | | | | | | | | | | | |
| | | | | | | | | | | | | | | | | | | | | | | |
| Cash and due from banks | – | | | – | | | – | | | – | | | 49,044,457 | | | 49,044,457 | | | – | | | – | | | – | | | – | | | 47,655,196 | | | 47,655,196 | |
Cash collateral, reverse repurchase agreements and securities borrowings | – | | | – | | | – | | | – | | | 2,177,200 | | | 2,177,200 | | | – | | | – | | | – | | | – | | | 1,033,177 | | | 1,033,177 | |
| Investments at fair value through profit or loss | 4,957,236 | | | – | | | – | | | – | | | – | | | 4,957,236 | | | 4,715,343 | | | – | | | – | | | – | | | – | | | 4,715,343 | |
Investments at fair value through other comprehensive income, Note 6(b) | – | | | – | | | 38,943,728 | | | 90,321 | | | – | | | 39,034,049 | | | – | | | – | | | 39,995,374 | | | 147,264 | | | – | | | 40,142,638 | |
| Amortized cost investments | – | | | – | | | – | | | – | | | 8,813,657 | | | 8,813,657 | | | – | | | – | | | – | | | – | | | 8,967,877 | | | 8,967,877 | |
| Loans, net | – | | | – | | | – | | | – | | | 142,315,004 | | | 142,315,004 | | | – | | | – | | | – | | | – | | | 137,737,296 | | | 137,737,296 | |
Financial assets designated at fair value through profit or loss | – | | | 992,429 | | | – | | | – | | | – | | | 992,429 | | | – | | | 932,734 | | | – | | | – | | | – | | | 932,734 | |
| Due from customers on banker’s acceptances | – | | | – | | | – | | | – | | | 345,906 | | | 345,906 | | | – | | | – | | | – | | | – | | | 528,184 | | | 528,184 | |
| Other assets, Note 12(a) | 1,231,188 | | | – | | | 677 | | | – | | | 5,102,543 | | | 6,334,408 | | | 904,791 | | | – | | | – | | | – | | | 3,269,019 | | | 4,173,810 | |
| 6,188,424 | | | 992,429 | | | 38,944,405 | | | 90,321 | | | 207,798,767 | | | 254,014,346 | | | 5,620,134 | | | 932,734 | | | 39,995,374 | | | 147,264 | | | 199,190,749 | | | 245,886,255 | |
| | | | | | | | | | | | | | | | | | | | | | | |
| Liabilities | | | | | | | | | | | | | | | | | | | | | | | |
| | | | | | | | | | | | | | | | | | | | | | | |
| Deposits and obligations | – | | | – | | | – | | | – | | | 170,401,633 | | | 170,401,633 | | | – | | | – | | | – | | | – | | | 161,842,066 | | | 161,842,066 | |
Payables from repurchase agreements and securities lending | – | | | – | | | – | | | – | | | 8,243,787 | | | 8,243,787 | | | – | | | – | | | – | | | – | | | 9,060,710 | | | 9,060,710 | |
| Due to banks and correspondents | – | | | – | | | – | | | – | | | 10,675,238 | | | 10,675,238 | | | – | | | – | | | – | | | – | | | 10,754,385 | | | 10,754,385 | |
| Due from customers on banker’s acceptances | – | | | – | | | – | | | – | | | 345,906 | | | 345,906 | | | – | | | – | | | – | | | – | | | 528,184 | | | 528,184 | |
| Lease liabilities | – | | | – | | | – | | | – | | | 612,259 | | | 612,259 | | | – | | | – | | | – | | | – | | | 404,817 | | | 404,817 | |
Financial liabilities at fair value through profit or loss | 1,055,893 | | | – | | | – | | | – | | | – | | | 1,055,893 | | | 151,485 | | | – | | | – | | | – | | | – | | | 151,485 | |
| Bonds and notes issued | – | | | – | | | – | | | – | | | 14,025,535 | | | 14,025,535 | | | – | | | – | | | – | | | – | | | 17,268,443 | | | 17,268,443 | |
| Other liabilities, Note 12(a) | 1,047,907 | | | – | | | – | | | – | | | 5,700,097 | | | 6,748,004 | | | 819,473 | | | – | | | – | | | – | | | 5,220,127 | | | 6,039,600 | |
| 2,103,800 | | | – | | | – | | | – | | | 210,004,455 | | | 212,108,255 | | | 970,958 | | | – | | | – | | | – | | | 205,078,732 | | | 206,049,690 | |
30 FINANCIAL AND NON-FINANCIAL RISK MANAGEMENT
The Group’s activities involve principally the use of financial instruments, including derivatives. It also accepts deposits from customers at both fixed and floating rates, for different periods, and invests these funds in high-quality assets. Additionally, it places these deposits at fixed and variable rates with legal entities and individuals, considering the finance costs and expected profitability.
The Group also trades in financial instruments where it takes positions in traded and over-the-counter instruments, derivatives included, to take advantage of short-term market movements on securities, bonds, currencies and interest rates.
Given the Group’s activities, it has established a risk appetite framework, which is a cornerstone of its risk management. The risk management processes involve continuous identification, measurement, treatment and monitoring. The Group is exposed, principally, to operating risk, credit risk, liquidity risk, market risk, cybersecurity risk, model risk, strategic risk and insurance technical risk. Finally, it reports on a consolidated basis the risks to which the Group is exposed.
a) Risk management structure -
The Board of Directors of the Group and of each subsidiary are ultimately responsible for identifying and controlling risks; however, there are separate independent instances in the major subsidiaries responsible for managing and monitoring risks, as further explained below:
(i) Group’s Board of Directors -
Credicorp Board of Directors –
The Credicorp Board of Directors is responsible for the overall approach to risk management of Credicorp Ltd., including the approval of its appetite for risk.
It also oversees compliance with the approved risk appetite and the level of risk exposure, as well as the relevant improvements in the integral risk management of Grupo Crédito and Subsidiaries of Credicorp (Group).
Grupo Crédito’s Board of Directors –
Grupo Crédito’s Board of Directors is responsible for the general approach to risk management of the Group’s subsidiaries and the approval of the risk appetite levels that it is willing to assume. Furthermore, it approves the guidelines and policies for Integral Risk Management, promotes an organizational culture that emphasizes the importance of risk management, oversees the internal control system and ensures the adequate performance of the Group’s regulatory compliance function.
Group Company Boards -
The Board of each company of the Group is responsible for aligning the risk management established by the Board of Grupo Crédito with the context of each one of them. For that, it establishes a framework for risk appetite, policies and guidelines.
(ii) Credicorp Risk Committee -
Represents the Credicorp Board of Directors, proposes the levels of risk appetite for Credicorp Ltd. Also, it is aware of the level of compliance of the risk appetite and the level of exposure assumed by Grupo Crédito and Credicorp subsidiaries and the relevant improvements in integral management of risks of said entities.
The Committee will be made up of no less than three directors of Credicorp, at least one of which must be independent. Additionally, the Board of Directors may incorporate as a member one or more directors of Credicorp subsidiaries. Likewise, the coordinator of the Committee will be the Credicorp Risk
Manager, with the Internal Audit Manager as an observer member (without voice or vote). Finally, the following officials will attend the sessions as guests, according to the agenda of topics to be discussed and at the invitation of the coordinator: General Manager, Finance Manager, Manager of the Risk Management Division of BCP, and all those people whose criteria assist with the development of the session.
(iii) Grupo Crédito Risk Committee -
Represents the Board of Grupo Crédito in risk management decision-making. Furthermore, proposes to Grupo Crédito’s Board of Directors the levels of risk appetite. This Committee defines the strategies used for the adequate management of the different types of risks and the supervision of risk appetite. In addition to it, they establish principles, policies, and general limits to the Group.
The Risk Committee is presided by no less than three Board members of Grupo Crédito, at least one of which must be independent. Additionally, the Board of Directors may incorporate as a member one or more directors of the Group. Likewise, the coordinator of the Committee will be the Grupo Crédito Risk Manager, with the Internal Audit Manager as an observer member (without voice or vote). Finally, the following officials will attend the sessions as guests, according to the agenda of topics to be discussed and at the invitation of the coordinator: General Manager, Finance Manager, Manager of the Risk Management Division of BCP, and all those people whose criteria assist with the development of the session.
In addition to effectively managing all the risks, the Grupo Crédito Risk Committee is supported by the following committees which report periodically on all relevant changes or issues relating to the risks being managed, except for the Model Risk functions, since Grupo Crédito Risk Committee assumes them directly:
Corporate credit Risk Committees (retail and wholesale) -
The Corporate Credit Risk Committees (Retail and Wholesale) are responsible for reviewing the level of tolerance of the credit risk appetite, exposure limits, and the actions to implement corrective measures in the event of deviations. In addition, they propose credit risk management rules and policies within the governance framework and organizational structure for the comprehensive management of credit risk. They also propose for approval to the Risk Committee any changes to the functions described above, as well as significant findings.
Corporate Committee for Market, Structural, Trading and Liquidity Risk -
The committee for Market, Structural, Trading and Liquidity Risks is in charge of analyzing and proposing corporate objectives, guidelines and policies for the Management of Market and Liquidity Risks of the Group and the Group’s companies. As well as monitoring the indicators and liquidity appetite and the implementation of corrective measures if deviations exist. Additionally, it is responsible for approving the integration into management of a corporate model implemented in the Group.
Corporate Operational Risk Methodology Committee -
The Corporate Operational Risk Methodology Committee has the primary responsibilities of sharing methodologies for Operational Risk and Business Continuity, as well as sharing best practices regarding the main challenges faced by the Group’s companies.
(iv) Central Risk Management of Credicorp -
The Central Risk Management of Credicorp informs the Credicorp Risk Committee of the level of compliance of the risk appetite and the level of exposure assumed by Grupo Crédito and Credicorp subsidiaries. Likewise, it reports the relevant improvements in the integral risk management of Grupo Crédito and Credicorp subsidiaries. In addition, it proposes to the Credicorp Risk Committee the risk appetite levels for Credicorp Ltd.
(v) Central Risk Management of Grupo Crédito -
The Central Risk Management is responsible for the implementation of policies, procedures, methodologies, and the actions to be taken to identify, measure, monitor, mitigate, report and control the different types of risks to which the Group is exposed. In addition, it is responsible for participating in the design and definition of the strategic plans of the business units to ensure that they are aligned within the risk parameters approved by the Grupo Crédito Board of Directors. Likewise, it disseminates the importance of adequate risk management, specifying in each of the units, the role that corresponds to them in the timely identification and definition of the corresponding actions.
The units of the Central Risk Management that manage risk at the corporate level are the following:
Credit Division -
The Credit Division proposes credit policies and evaluation criteria and credit risk management that the Group assumes with segment customers wholesaler. Evaluate and authorize loan proposals until their autonomy and propose their approval to the higher instances for those that exceed it. These guidelines are established on the basis of the policies set by the Grupo Crédito Board, respecting the laws and regulations in force. In addition, it assesses the evolution of the risk of wholesale clients and identifies problematic situations, taking actions to mitigate or resolve them.
Risk Management Division -
The Risk Management Division is responsible for ensuring that risk management directives and policies comply with the established by the Board of Directors. In addition, it is responsible for supervising the process of risk management and for coordinating with the companies of Credicorp involved in the whole process, promoting homogeneous risk management and aligning with the best practices. It also has the task of informing the Board of Directors regarding: global exposure and by type of risk, as well as the specific exposure of each Group company.
Retail Banking Risk Division -
The Retail Banking Risk Division is responsible for managing the risk profile of the Individuals and Small Businesses portfolio and for developing credit policies that are aligned with the guidelines and risk levels established by the Board of Directors of Grupo Crédito.
Likewise, it participates in the definition of products and campaigns aligned to these policies, as well as in the design, optimization and integration of credit evaluation tools and income estimation for credit management.
Likewise, there is an active and recurring participation of the BCP Retail Banking Risk Division in the Credit Risk and Collections Committee of Mibanco and in the BCB Retail Banking Risk Committee to ensure alignment of best practices in terms of policies and guidelines credit ratings, risk segmentation and credit risk models.
Corporate Non-Financial Risk Management -
Corporate Non-Financial Risk Management is responsible for defining a non-financial risk strategy aligned with the objectives and risk appetite established at the corporate level. This strategy aims to enhance the management process, generate synergies, optimize resources and achieve superior results among the units responsible for managing non-financial risks at the corporate level. Furthermore, to achieve the objectives outlined in the non-financial risk strategy, the Division is tasked with promoting a risk culture, developing talent, defining indicators, and generating and monitoring strategic projects and initiatives.
Credicorp’s Pricing Center of Excellence
The main objective of the Group’s Pricing Center of Excellence (CoE) is to efficiently scale the Pricing practice in the Group’s business lines, identifying opportunities and deploying initiatives that allow the development of the Pricing practice.
Risk Transformation Office
The Risk Transformation Office is responsible for turning risk management into a competitive advantage, enhancing the following capabilities: i) origination, ii) portfolio monitoring, iii) life cycle of credit models, iv) cybersecurity, and v) human talent.
(vi) Internal Audit Division and Corporate Ethics and Compliance Division -
The Internal Audit Division is responsible for continuously monitoring the effectiveness and efficiency of the Group’s risk management, control and governance processes, verifying compliance with regulations, policies, objectives and guidelines set by the Board of Directors, providing agile and timely assurance, advice and analysis based on risks and data On the other hand, it evaluates sufficiency and integration level of Group’s database and information systems. Finally, it ensures that independence is maintained between the functions of the risk management and business units, for each of the Group’s companies.
The Corporate Compliance and Ethics Division reports to the Board and is responsible for providing corporate policies to ensure that Group companies adequately comply with regulations that specified them, and the guidelines established in Credicorp’s Code of Ethics.
(vii) Audit Committee -
The Audit Committee, composed of three independent directors, oversees the Group’s financial reporting process and financial information system, with the purpose of ensuring that: (i) Management establishes and maintains an adequate system of internal control, particularly internal controls over financial reporting. (ii) Appropriate procedures are in place to enable the objective and periodic evaluation of the Group’s internal control system. (iii) The external auditors review the accounting and financial policies applied in the preparation of the Group’s consolidated financial statements. In addition, the Audit Committee facilitates effective communication among the external auditors, the Group’s senior management, BCP’s Internal Audit Division, responsible for conducting Credicorp’s internal audit activities and Credicorp’s Board of Directors.
b) Risk measurement and reporting systems -
The risk is measured according to models and methodologies developed for the management of each type of risk. Risk reports allow monitoring, at both aggregated and detailed levels, the different types of risks of each company which is exposed. The system provides the facility to meet the appetite review needs by risk requested by the committees and areas described above; as well as comply with regulatory requirements.
c) Risk mitigation -
Depending on the type of risk, mitigating instruments are used to reduce its exposure, such as guarantees, derivatives, controls and insurance, among others. Furthermore, it has policies linked to risk appetite and established procedures for each type of risk.
The Group actively uses guarantees to reduce its credit risks.
d) Risk appetite -
Based on corporate risk management, Grupo Crédito’s Board of Directors annually approves the risk appetite framework to define the maximum level of risk that the organization is willing to take as seeks its strategic
and financial objectives, maintaining a corporate vision in individual decisions of each entity. This Risk Appetite framework is based on “core” and specific metrics:
Core metrics are intended to preserve the organization’s strategic pillars, defined as solvency, liquidity, profit and growth, income stability and balance sheet structure.
Specific metrics objectives are intended to monitor on a qualitative and quantitative basis the various risks to which the Group is exposed, as well as defining a tolerance threshold of each of those risks, so the risk profile set by the Board is preserved and any risk focus is anticipated on a more granular basis. These metrics are related to credit risk, market risk and cybersecurity risk.
Risk appetite is measured based on the following guidelines:
-Risk appetite statement: Establishes explicit general principles and the qualitative declarations which complement the risk strategy.
-Metrics scorecards: These are used to define the levels of risk exposure in the different strategic pillars.
-Limits: Allows control over the risk-taking process within the tolerance threshold established by the Board. They also provide accountability for the risk-taking process and define guidelines regarding the target risk profile.
-Government scheme: Seeks to guarantee compliance of the framework through different roles and responsibilities assigned to the units involved.
The appetite is integrated into the processes of strategic and capital guidelines, as well as in the definition of the annual budget, facilitating the strategic decision making of the organization.
e) Risk concentration -
Concentrations arise when a reduced and representative number of all of the counterparties of the Group are engaged in similar business activities, or activities in the same geographic region, or have similar economic and political conditions among others.
In order to avoid excessive concentrations of risk, the policies and procedures include specific guidelines and limits to guarantee a diversified portfolio.
30.1 Credit risk -
a) The Group takes on exposure to credit risk, which is the probability of suffering losses caused by debtors or counterparties failing to comply with payment obligations related to on- or off-balance-sheet exposures.
Credit risk is the most important risk for the Group’s business; therefore, Management carefully manages its exposure to credit risk. Credit exposures arise principally from lending activities that lead to direct loans; they also result from investment activities. There is also credit risk in off-balance sheet financial instruments, such as contingent credits (indirect loans and due from customers on banker’s acceptances), which expose Credicorp to risks similar to direct loans. Likewise, credit risk arises from derivative financial instruments that present positive fair values. Finally, all exposure to credit risk (direct or indirect) is mitigated by the control processes and policies.
As part of managing this type of risk, provisions for impairment of its portfolio are assigned as of the date of the consolidated statement of financial position.
Credit risk levels are defined based on risk exposure limits, which are frequently monitored. Said limits are established in relation to one borrower or group of borrowers, geographical and industry segments. Furthermore, the risk limits by product, industry sector and by geographical segment are approved by the Risk Committee of Credicorp.
Exposure to credit risk is managed through regular analysis of the ability of debtors and potential debtors to meet interest and principal repayment obligations and by changing the credit limits when it is appropriate. Other specific control measures are outlined below:
(i) Collateral -
The Group employs a range of policies and practices to mitigate credit risk. The most traditional of these is collateralization which is common practice. The Group implements guidelines on the acceptability of specific classes of collateral or credit risk mitigation. The main types of collateral obtained are as follows:
-For loans and advances, collateral includes, among others, mortgages on residential properties; liens on business assets such as plants, inventory and accounts receivable; and liens on financial instruments such as debt securities and equity securities.
-Long-term loans and financing to corporate entities are generally guaranteed. Loans to small and micro business generally have no collateral. In order to minimize credit loss, the Group will seek additional collateral from the counterparty as soon as impairment indicators arise.
-For repurchase agreements and securities lending, collateral consists of fixed income instruments, cash and loans.
Collateral held as security for financial assets other than loans is determined by the nature of the instrument. Debt securities, treasury and other eligible bills are generally unsecured, except for assets backed securities and similar instruments, which are secured by portfolios of financial instruments.
Management monitors the market value of collateral, requests additional collateral in accordance with the underlying agreement, and monitors the market value of collateral obtained during its review of the adequacy of the allowance for impairment losses. As part of the Group's policies, the recovered assets are sold in seniority order. The proceeds of the sale are used to reduce or amortize the outstanding debt. In general, the Group doesn't use recovered assets for its operational purposes.
(ii) Derivatives -
The amount subject to credit risk is limited to the current and potential fair value of instruments that are favorable to the Group (fair value is positive). In the case of derivatives this is only a small fraction of the contract, or notional values used to express the volume of instruments outstanding. This credit risk exposure is managed as a portion of the total credit limits with customers, together with potential exposures from market movements. The credit risk of the derivative portfolio is reduced if the instrument is cleared through a clearing house.
(iii) Credit-related commitments -
The primary purpose of these instruments is to ensure that funds are available to a customer as required. Guarantees and letters of credit have the same credit risk as direct loans. Documentary and commercial letters of credit which are written undertakings by the Group on behalf of a customer authorizing a third party to draw drafts on the Group up to a stipulated amount under specific terms and conditions are collateralized by the underlying shipments of goods to which they relate and therefore have less risk than a direct loan. The Group has no mandatory commitments to extend credit.
b) The maximum exposure to credit risk as of December 31, 2025 and 2024, before the effect of mitigation through any collateral, is the carrying amount of each class of financial assets indicated in Notes 30.11(a), 30.11(b) and the contingent credits detailed in Note 18(a).
c) Credit risk management for loans -
Credit risk management is mainly based on the rating and scoring internal models of each company of the Group. In Credicorp, quantitative and qualitative analysis are made for each client, regarding their financial
position, credit behavior in the financial system and the market in which they operate or are located. This analysis is carried out continuously to characterize the risk profile of each operation and client with a loan position in the Group.
Within the Group, loans are internally classified as past due based on three criteria: the number of days past due based on the contractually agreed due date, the subsidiary and the type of loan. The detail is shown below:
-Banco de Crédito del Perú, Mibanco Perú and Solución Empresa Administradora Hipotecaria internally classify a loan as past due:
-For corporate, large and medium companies, when it has more than 15 days in arrears.
-For small and microbusiness when it has more than 30 days in arrears.
-For overdrafts when it has more than 30 days in arrears.
-For consumer, mortgage and leasing operations, installments are internally classified as past due when they are between 30 and 90 days in arrears; after 90 days, the pending loan balance is considered past due.
-Mibanco Colombia internally classifies a loan as past due:
-For commercial loans when it has more than 90 days in arrears.
-For microbusiness loans when it has more than 60 days in arrears.
-For consumer loans when it has more than 60 days in arrears.
-For mortgage loans when it has more than 30 days in arrears.
-ASB Bank Corp. internally classifies a loan as past due when it has 1 or more days in arrears.
-Banco de Crédito de Bolivia internally classifies a loan as past due when it has 30 or more days in arrears.
Estimate of the expected credit loss -
The measurement of the expected credit loss is based on the product of the following risk parameters: (i) probability of default (PD), (ii) loss given default (LGD), and (iii) exposure at default (EAD); discounted at the reporting date, using the effective interest rate. The definition of the parameters is presented below:
-Probability of default (PD): is a credit rating measure that is given internally to a client with the objective of estimating its probability of default within a specific time horizon. The process of obtaining the PD is carried out considering three main components: (i) the risk observed at the portfolio level, (ii) the macroeconomic perspectives of the main countries where Credicorp operates and (iii) the individual risk of each loan, which it is measured through rating and scoring tools.
The Group considers that a financial instrument is in default if it meets the following conditions, according to the type of asset:
-Consumer products, credit card and SME: if the client, at some certain point, presents arrears equal to or greater than 60 days and/or has operations that are refinanced, restructured, in pre-judicial, judicial proceedings or written off.
-Mortgage products: if the client, at some certain point, presents arrears equal to or greater than 120 days and/or has operations that are refinanced, restructured, in pre-judicial, judicial proceedings or written off.
-Commercial banking products: if the client, at some certain point, is in the Collections portfolio, or has a risk classification of Deficient, Doubtful or Loss, or has operations that are refinanced, in pre-judicial, judicial proceedings or written off. Also, a client can be considered as default if it shows signs of significant qualitative impairment. It should be noted that, for commercial clients with the highest loan position that are classified in default, the Risk Management performs an individual review to determine the expected credit loss in each case, which considers the knowledge of the specific situation of the client, the coverage of real guarantees, and the financial information available of the company.
-Investments: if the instrument has a default rating according to external rating agencies such as Fitch, Standard & Poors or Moody's, or if it has an indicator of arrears equal to or greater than 90 days. In addition, an issuer can be considered as default if it shows signs of significant qualitative impairment or if it is in default according to the Commercial banking definition. When an issuer is classified as default, all its instruments are also classified as default, that is, in stage 3.
-Loss given default (LGD): this is a measurement which estimates the severity of the loss that would be incurred at the time of the default. It has two approaches in the estimate of the severity of the loss, according to the stage of the client:
-LGD workout: is the real loss of clients who reached the default stage. To calculate this parameter, the recoveries and costs of each of the operations are included (includes open and closed recovery processes).
-LGD ELBE (expected loss best estimate): this is the loss of the contracts in a default situation based on the time in default of the operation (the longer the time in default, the higher the level of loss of the operation).
-Exposure at Default (EAD): this is a measurement which estimates the exposure at the time of the client’s default, considering changes in future exposure, for example, in the case of prepayments and/or greater utilization of unused credit lines.
The estimate of the risk parameters considers information regarding the actual conditions, as well as the projections of future macroeconomic events and conditions in three scenarios (base, optimistic and pessimistic), which are weighted to obtain the expected credit loss.
The fundamental difference between the expected credit loss of a loan classified in Stage 1 or Stage 2 lies in the time horizon of the probability of default (PD). Stage 1 estimates use a PD with a maximum horizon of 12 months, whereas Stage 2 estimates use a PD measured over the remaining lifetime of the instrument. Stage 3 estimates are performed based on an ELBE LGD.
For those portfolios that are not material and/or do not have specific credit scoring models, the option was to extrapolate the expected credit loss ratio of portfolios with comparable characteristics.
In line with the internal model governance framework, the main parameters used in the measurement of credit risk (including PD and LGD) were continuously monitored throughout 2025. The models are calibrated when performance monitoring reveals material deviations from their expected behavior, thereby ensuring an adequate and consistent estimation of credit risk.
Prospective information -
The measurement of the expected credit loss for each stage and the evaluation of significant increase in credit risk consider information on previous events and current conditions, as well as reasonable projections based on future events and macroeconomic conditions.
For the estimate of the risk parameters (PD, LGD and EAD), used in the calculation of the expected credit loss in stages 1 and 2, the significance of the macroeconomic variables (or their variations) that have the greatest influence on each portfolio was tested which provide a better prospective and systemic vision to the estimate, based on econometric techniques. Each macroeconomic scenario used in the estimate of the
expected credit loss considers projections of relevant macroeconomic variables, such as the gross domestic product (GDP), terms of trade, inflation rate, among others, for a period of 3 years and a long-term projection.
Expected credit loss represents a weighted estimate that considers three forward-looking macroeconomic scenarios (base, optimistic and pessimistic). These scenarios, as well as the probability of occurrence of each one, are projections provided by the internal Economic Studies team and are approved by Senior Management; these projections are made for the main countries where Credicorp operates. The design of the scenarios is reviewed quarterly. All scenarios and their respective probabilities apply to portfolios subject to expected credit loss.
Changes from one stage to another -
The classification of an instrument as stage 1 or stage 2 depends on the concept of "significant increase in credit risk" at the reporting date compared to the origin date. This classification is updated monthly. As the IFRS 9 states, this classification depends on the following criteria:
-An account is classified in stage 2 if it has more than 30 days in arrears.
-Additionally, significant credit risk increase thresholds were established based on absolute and relative thresholds that depend on the risk level in which the instrument was originated. The thresholds differ for each of the portfolios considered.
Additionally, all those accounts classified as default at the reporting date, according to the definition used by the Group, are considered as stage 3.
Evaluations of significant increase in credit risk from initial recognition and credit impairment are carried out independently on each reporting date.
Wholesale Banking assets can be moved in both directions from one stage to another; in this sense, a financial asset that migrated to stage 2 will return to stage 1 if its credit risk did not increase significantly from its initial recognition until a subsequent reporting period. Likewise, an asset that is in stage 3 will return to stage 2 if the asset is no longer considered to be impaired (according to our definition of default) for a certain number of subsequent reporting periods.
On the other hand, Retail Banking assets that migrated to stage 2 will return to stage 1 if their credit risk has not increased significantly since their initial recognition during a certain number of subsequent reporting periods (cure period). In the case of assets allocated in stage 3, these will not return to stage 2 except for refinanced loans, which will return to stage 2 if good payment behavior is demonstrated during a certain number of subsequent reporting periods.
Expected life -
For the instruments in stage 2 or 3, the allowance for loan losses will cover the expected credit loss during the expected time of the remaining lifetime of the instrument. For most instruments, the expected life is limited to the remaining contractual life, adjusted by expected prepayments. In the case of revolving products, a statistical analysis was carried out to determine what would be the expected life period.
The following is a summary of the direct loans (without interest) classified into three important groups and their respective allowance for loan losses for each type of loan. It is important to note that impaired loans are loans in default that are in stage 3. Additionally, it should be noted that, in accordance with IFRS 7, the total balance of the loan is considered overdue when the debtor has failed to make a payment at its contractual maturity.
(i) Loans neither past due nor impaired, which comprise those direct loans which currently do not have characteristics of delinquency and which are not in default.
(ii) Past due but not impaired loans, which comprise all of the direct loans of customers who are not in default but have failed to make a payment at its contractual maturity, according to IFRS 7.
(iii) Impaired loans, those direct loans considered to be in stage 3 or default, as detailed in Note 30.1(c).
| | | | | | | | | | | | | | | | | | | | | | | | | | | | | | | | | | | | | | | | | | | | | | | | | | |
| | 2025 | | 2024 |
| Commercial loans | | Stage 1 | | Stage 2 | | Stage 3 | | Total | | Stage 1 | | Stage 2 | | Stage 3 | | Total |
| | S/(000) | | S/(000) | | S/(000) | | S/(000) | | S/(000) | | S/(000) | | S/(000) | | S/(000) |
| Neither past due nor impaired | | 66,660,719 | | | 4,215,063 | | | – | | | 70,875,782 | | | 67,303,201 | | | 3,509,158 | | | – | | | 70,812,359 | |
| Past due but not impaired | | 414,188 | | | 335,073 | | | – | | | 749,261 | | | 612,574 | | | 468,459 | | | – | | | 1,081,033 | |
| Impaired | | – | | | – | | | 4,519,803 | | | 4,519,803 | | | – | | | – | | | 5,028,223 | | | 5,028,223 | |
| Gross | | 67,074,907 | | | 4,550,136 | | | 4,519,803 | | | 76,144,846 | | | 67,915,775 | | | 3,977,617 | | | 5,028,223 | | | 76,921,615 | |
| Less: Allowance for loan losses | | 436,438 | | | 277,425 | | | 2,045,256 | | | 2,759,119 | | | 493,130 | | | 291,963 | | | 2,159,115 | | | 2,944,208 | |
| Total, net | | 66,638,469 | | | 4,272,711 | | | 2,474,547 | | | 73,385,727 | | | 67,422,645 | | | 3,685,654 | | | 2,869,108 | | | 73,977,407 | |
| | | | | | | | | | | | | | | | | | | | | | | | | | | | | | | | | | | | | | | | | | | | | | | | | | |
| Residential mortgage loans | | Stage 1 | | Stage 2 | | Stage 3 | | Total | | Stage 1 | | Stage 2 | | Stage 3 | | Total |
| | S/(000) | | S/(000) | | S/(000) | | S/(000) | | S/(000) | | S/(000) | | S/(000) | | S/(000) |
| Neither past due nor impaired | | 21,569,665 | | | 1,844,208 | | | – | | | 23,413,873 | | | 18,451,482 | | | 3,819,271 | | | – | | | 22,270,753 | |
| Past due but not impaired | | 569,988 | | | 586,274 | | | – | | | 1,156,262 | | | 505,016 | | | 672,405 | | | – | | | 1,177,421 | |
| Impaired | | – | | | – | | | 1,617,451 | | | 1,617,451 | | | – | | | – | | | 1,643,883 | | | 1,643,883 | |
| Gross | | 22,139,653 | | | 2,430,482 | | | 1,617,451 | | | 26,187,586 | | | 18,956,498 | | | 4,491,676 | | | 1,643,883 | | | 25,092,057 | |
| Less: Allowance for loan losses | | 49,855 | | | 116,289 | | | 800,442 | | | 966,586 | | | 66,260 | | | 168,188 | | | 819,671 | | | 1,054,119 | |
| Total, net | | 22,089,798 | | | 2,314,193 | | | 817,009 | | | 25,221,000 | | | 18,890,238 | | | 4,323,488 | | | 824,212 | | | 24,037,938 | |
| | | | | | | | | | | | | | | | | | | | | | | | | | | | | | | | | | | | | | | | | | | | | | | | | | |
| Small and Micro business loans | | Stage 1 | | Stage 2 | | Stage 3 | | Total | | Stage 1 | | Stage 2 | | Stage 3 | | Total |
| | S/(000) | | S/(000) | | S/(000) | | S/(000) | | S/(000) | | S/(000) | | S/(000) | | S/(000) |
| Neither past due nor impaired | | 18,382,809 | | | 3,627,093 | | | – | | | 22,009,902 | | | 16,589,516 | | | 3,670,678 | | | – | | | 20,260,194 | |
| Past due but not impaired | | 194,879 | | | 467,420 | | | – | | | 662,299 | | | 257,476 | | | 573,634 | | | – | | | 831,110 | |
| Impaired | | – | | | – | | | 1,357,696 | | | 1,357,696 | | | – | | | – | | | 1,686,829 | | | 1,686,829 | |
| Gross | | 18,577,688 | | | 4,094,513 | | | 1,357,696 | | | 24,029,897 | | | 16,846,992 | | | 4,244,312 | | | 1,686,829 | | | 22,778,133 | |
| Less: Allowance for loan losses | | 472,604 | | | 412,193 | | | 949,739 | | | 1,834,536 | | | 384,145 | | | 396,678 | | | 1,167,311 | | | 1,948,134 | |
| Total, net | | 18,105,084 | | | 3,682,320 | | | 407,957 | | | 22,195,361 | | | 16,462,847 | | | 3,847,634 | | | 519,518 | | | 20,829,999 | |
| | | | | | | | | | | | | | | | | | | | | | | | | | | | | | | | | | | | | | | | | | | | | | | | | | |
| Consumer loans | | Stage 1 | | Stage 2 | | Stage 3 | | Total | | Stage 1 | | Stage 2 | | Stage 3 | | Total |
| | S/(000) | | S/(000) | | S/(000) | | S/(000) | | S/(000) | | S/(000) | | S/(000) | | S/(000) |
| Neither past due nor impaired | | 17,253,968 | | | 3,122,322 | | | – | | | 20,376,290 | | | 14,188,847 | | | 3,335,516 | | | – | | | 17,524,363 | |
| Past due but not impaired | | 158,736 | | | 344,579 | | | – | | | 503,315 | | | 160,755 | | | 383,227 | | | – | | | 543,982 | |
| Impaired | | – | | | – | | | 1,387,164 | | | 1,387,164 | | | – | | | – | | | 1,459,095 | | | 1,459,095 | |
| Gross | | 17,412,704 | | | 3,466,901 | | | 1,387,164 | | | 22,266,769 | | | 14,349,602 | | | 3,718,743 | | | 1,459,095 | | | 19,527,440 | |
| Less: Allowance for loan losses | | 459,980 | | | 499,439 | | | 1,150,290 | | | 2,109,709 | | | 331,011 | | | 514,255 | | | 1,203,250 | | | 2,048,516 | |
| Total, net | | 16,952,724 | | | 2,967,462 | | | 236,874 | | | 20,157,060 | | | 14,018,591 | | | 3,204,488 | | | 255,845 | | | 17,478,924 | |
| | | | | | | | | | | | | | | | | | | | | | | | | | | | | | | | | | | | | | | | | | | | | | | | | | |
| Consolidated of loans | | Stage 1 | | Stage 2 | | Stage 3 | | Total | | Stage 1 | | Stage 2 | | Stage 3 | | Total |
| | S/(000) | | S/(000) | | S/(000) | | S/(000) | | S/(000) | | S/(000) | | S/(000) | | S/(000) |
| Total gross direct credits, Note 7(a) | | 125,204,952 | | | 14,542,032 | | | 8,882,114 | | | 148,629,098 | | | 118,068,867 | | | 16,432,348 | | | 9,818,030 | | | 144,319,245 | |
| Total allowance for loan losses, Note 7(a) | | 1,418,877 | | | 1,305,346 | | | 4,945,727 | | | 7,669,950 | | | 1,274,546 | | | 1,371,084 | | | 5,349,347 | | | 7,994,977 | |
| Total net direct loans | | 123,786,075 | | | 13,236,686 | | | 3,936,387 | | | 140,959,148 | | | 116,794,321 | | | 15,061,264 | | | 4,468,683 | | | 136,324,268 | |
At Credicorp, we separate renegotiated loans into two groups, focusing on operations that have suffered a significant increase in credit risk since their disbursement, which has generated modifications to the original loan agreement. Both groups are defined below:
-Refinanced loans: are those loans that have undergone modifications in the initial loan agreement (term and interest rate), according to the accounting definition.
-Renegotiated loans: are those loans for which, due to the pandemic during 2020 and 2021 and/or the Peruvian context of intense rain and social unrest during 2023, the SBS and other local regulators of the countries where Credicorp operates have established that certain benefits be granted, and that Credicorp has also voluntarily granted to its clients (grace periods, debt consolidation, etc.), which were not in the initial credit agreements.
Below is the amount of gross portfolio balance and allowance for loan losses for Credicorp's renegotiated loans. The presentation is made for each of the two groups defined above and by opening the balances by stage. It should be noted that for the construction of the tables, the information of the three subsidiaries that concentrate more than 95.0 percent of the balance of renegotiated loans (BCP, Mibanco and BCB) has been considered.
As of December 31, 2025, and 2024, renegotiated loans, refinanced loans and their expected loss are composed as follows:
| | | | | | | | | | | | | | | | | | | | | | | |
| 2025 | | 2024 |
| Refinanced loans | | Allowance for loan losses | | Refinanced loans | | Allowance for loan losses |
| S/(000) | | S/(000) | | S/(000) | | S/(000) |
| | | | | | | |
| Stage 1 | 108,144 | | | 7,708 | | | 89,847 | | | 5,961 | |
| Stage 2 | 82,595 | | | 10,046 | | | 60,494 | | | 9,968 | |
| Stage 3 | 1,737,423 | | | 865,367 | | | 2,059,690 | | | 971,741 | |
| Total | 1,928,162 | | | 883,121 | | | 2,210,031 | | | 987,670 | |
| | | | | | | | | | | | | | | | | | | | | | | |
| 2025 | | 2024 |
| Renegotiated loans | | Allowance for loan losses | | Renegotiated loans | | Allowance for loan losses |
| S/(000) | | S/(000) | | S/(000) | | S/(000) |
| | | | | | | |
| Stage 1 | 1,869,447 | | | 8,836 | | | 3,090,297 | | | 23,513 | |
| Stage 2 | 284,866 | | | 25,041 | | | 579,176 | | | 55,208 | |
| Stage 3 | 531,370 | | | 308,266 | | | 711,770 | | | 417,017 | |
| Total | 2,685,683 | | | 342,143 | | | 4,381,243 | | | 495,738 | |
The detail of the gross amount of impaired direct loans by type of loan, together with the fair value of the related collateral and the amounts of its allowance for loan losses, are as follows:
| | | | | | | | | | | | | | | | | | | | | | | | | | | | | | | | | | | | | | | | | | | | | | | | | | | | | | | | | | | |
| 2025 | | 2024 |
| Commercial loans | | Residential
mortgage loans | | Microbusiness
loans | | Consumer loans | | Total | | Commercial loans | | Residential
mortgage loans | | Microbusiness
loans | | Consumer loans | | Total |
| S/(000) | | S/(000) | | S/(000) | | S/(000) | | S/(000) | | S/(000) | | S/(000) | | S/(000) | | S/(000) | | S/(000) |
| | | | | | | | | | | | | | | | | | | |
| Impaired loans | 4,519,803 | | | 1,617,451 | | | 1,357,696 | | | 1,387,164 | | | 8,882,114 | | | 5,028,223 | | | 1,643,883 | | | 1,686,829 | | | 1,459,095 | | | 9,818,030 | |
| Fair value of collateral | 3,602,914 | | | 1,377,151 | | | 249,294 | | | 450,104 | | | 5,679,463 | | | 3,979,625 | | | 1,401,503 | | | 388,752 | | | 439,736 | | | 6,209,616 | |
| Allowance for loan losses | 2,045,256 | | | 800,442 | | | 949,739 | | | 1,150,290 | | | 4,945,727 | | | 2,159,115 | | | 819,671 | | | 1,167,311 | | | 1,203,250 | | | 5,349,347 | |
In addition, the breakdown of direct loans classified by maturity is shown below, according to the following criteria:
(i)Current loans, which comprise those direct loans which do not currently have characteristics of delinquency, nor are they in default or stage 3, according to the rules of IFRS 9.
(ii)Current but impaired loans, which comprise those direct loans which do not currently have characteristics of delinquency, but are in default or stage 3, according to IFRS 9.
(iii)Loans with payment delay of one day or more but that are not past due according to our internal guidelines, which comprise those direct loans of customers who have failed to make a payment at its contractual maturity, that is, with at least one day past due, however, the days of delinquency are insufficient to be considered as past due under the Group’s internal criteria.
(iv)Past due loans under internal criteria.
The total of the following reflects all overdue loans according to IFRS 7: (i) loans with payment delays of one day or more but that are not considered overdue under internal criteria and (ii) overdue loans under internal criteria.
| | | | | | | | | | | | | | | | | | | | | | | | | | | | | | | | | | | | | | | | | | | | | | | | | | | | | | | | | | | | | | | | | | | | | | | |
| 2025 | | 2024 |
| Current loans | | Current but impaired loans | | Loans with delays in payments of one day or more but not considered internal overdue loans | | Internal overdue loans | | Total | | Total past due under IFRS 7 | | Current loans | | Current but impaired loans | | Loans with delays in payments of one day or more but not considered internal overdue loans | | Internal overdue loans | | Total | | Total past due under IFRS 7 |
| S/(000) | | S/(000) | | S/(000) | | S/(000) | | S/(000) | | S/(000) | | S/(000) | | S/(000) | | S/(000) | | S/(000) | | S/(000) | | S/(000) |
| Neither past due nor impaired | 136,675,847 | | | – | | | – | | | - | | | 136,675,847 | | | - | | | 130,867,669 | | | – | | | – | | | - | | | 130,867,669 | | | - | |
| Past due but not impaired | – | | | – | | | 2,774,121 | | | 297,016 | | | 3,071,137 | | | 3,071,137 | | | - | | | – | | | 3,189,089 | | | 444,457 | | | 3,633,546 | | | 3,633,546 | |
| Impaired debt | – | | | 3,531,294 | | | 826,710 | | | 4,524,110 | | | 8,882,114 | | | 5,350,820 | | | – | | | 3,802,650 | | | 1,029,703 | | | 4,985,677 | | | 9,818,030 | | | 6,015,380 | |
| Total | 136,675,847 | | | 3,531,294 | | | 3,600,831 | | | 4,821,126 | | | 148,629,098 | | | 8,421,957 | | | 130,867,669 | | | 3,802,650 | | | 4,218,792 | | | 5,430,134 | | | 144,319,245 | | | 9,648,926 | |
The classification of direct loans by type of loan and type of maturity is shown below:
| | | | | | | | | | | | | | | | | | | | | | | | | | | | | | | | | | | | | | | | | | | | | | | | | | | | | | | | | | | |
| 2025 | | 2024 |
| Current loans | | Current but impaired loans | | Loans with delays in payments of one day or more but not considered internal overdue loans | | Internal overdue loans | | Total | | Current loans | | Current but impaired loans | | Loans with delays in payments of one day or more but not considered internal overdue loans | | Internal overdue loans | | Total |
| S/(000) | | S/(000) | | S/(000) | | S/(000) | | S/(000) | | S/(000) | | S/(000) | | S/(000) | | S/(000) | | S/(000) |
| Commercial loans | 70,875,782 | | | 2,061,610 | | | 922,937 | | | 2,284,517 | | | 76,144,846 | | | 70,812,359 | | | 2,256,618 | | | 1,220,408 | | | 2,632,230 | | | 76,921,615 | |
| Residential mortgage loans | 23,413,873 | | | 583,148 | | | 1,411,644 | | | 778,921 | | | 26,187,586 | | | 22,270,753 | | | 573,359 | | | 1,456,906 | | | 791,039 | | | 25,092,057 | |
| Microbusiness loans | 22,009,902 | | | 302,528 | | | 618,804 | | | 1,098,663 | | | 24,029,897 | | | 20,260,194 | | | 328,229 | | | 779,402 | | | 1,410,308 | | | 22,778,133 | |
| Consumer loans | 20,376,290 | | | 584,008 | | | 647,446 | | | 659,025 | | | 22,266,769 | | | 17,524,363 | | | 644,444 | | | 762,076 | | | 596,557 | | | 19,527,440 | |
| Total | 136,675,847 | | | 3,531,294 | | | 3,600,831 | | | 4,821,126 | | | 148,629,098 | | | 130,867,669 | | | 3,802,650 | | | 4,218,792 | | | 5,430,134 | | | 144,319,245 | |
Macroeconomic scenario -
The expected credit loss is a weighted estimate of three macroeconomic scenarios: base, optimistic and pessimistic, which are calculated with macroeconomic projections provided by the Economic Studies team and approved by Senior Management. The local and international information flows available during the analysis period are used to feed the projections, which reflect the fact that Peru is a small and open economy. In this context, approximately 60.0 percent of the volatility in economic growth is driven by external factors including terms of trade, the growth of Peru's trading partners and external interest rates. Information is collected on each of these factors to build each scenario for the next three years.
The variables mentioned above, along with local variables (fiscal and monetary variables), are incorporated into the economic models.
The first is a stochastic dynamic general equilibrium model, which is built with expectations. The second is constructed with the main identities of the national accounts in accordance with the financial programming methodology designed by the IMF (International Monetary Fund) and the methodologies used by a battery of econometric models.
Through this process, projections of GDP growth, inflation, exchange rate and other macroeconomic variables are obtained for the years 2025, 2026 and 2027. We expect GDP to grow around 3.3 percent in 2026, which is mainly explained by the following factors:
-Highly favorable external conditions driven by record-high terms of trade and lower global interest rates.
-Positive momentum associated with the maturing economic cycle.
-Low inflation supporting real wage recovery.
-An acceleration in credit origination aligned with higher aggregate demand and improved financial health of economic agents.
-Economic expectations remaining in optimistic territory and continuing to improve.
In addition, a usual degree of uncertainty arising from the political environment inherent to the electoral cycle is recognized.
Probabilities of 50 percent, 25 percent and 25 percent were considered for the base, optimistic, and pessimistic scenarios, respectively. The probabilities assigned to each scenario and the projections are validated through a fan chart analysis, which uses the likelihood function to identify and analyze:
-The central tendency of the projections.
-The dispersion expected around this value
-Values above or below the central value that are more or less likely.
The following table presents a comparison between the carrying amount of the allowance for credit losses of the direct loan portfolio, indirect loans, and bankers’ acceptances granted to customers, and its estimate under the three scenarios: base, optimistic, and pessimistic.
| | | | | | | | | | | |
| 2025 | | 2024 |
| S/(000) | | S/(000) |
| | | |
| Carrying amount | 8,041,526 | | | 8,378,895 | |
| | | |
| Scenarios: | | | |
| Optimistic | 7,960,895 | | | 8,283,450 | |
Base | 8,031,548 | | | 8,369,849 | |
| Pessimistic | 8,142,114 | | | 8,492,433 | |
d) Credit risk management on reverse repurchase agreements and securities borrowing -
Most of these operations are performed by Credicorp Capital. The Group has implemented credit limits for each counterparty and most of transactions are collateralized with investment grade financial instruments and financial instruments issued by governments.
e) Credit risk management on investments -
The Group assesses the identified credit risk of each investment by disclosing the risk rating assigned by recognized local and international credit rating agencies. The credit rating assignment processes carried out in Peru differ from the credit rating assignment processes applied at the international level.
In the event that any subsidiary uses a risk-rating prepared by any other risk rating agency, said risk-ratings are standardized with those provided by the above-mentioned institutions for consolidation purposes.
The following table shows the risk analysis of the investments provided by the institutions referred to above:
| | | | | | | | | | | | | | | | | | | | | | | |
| 2025 | | 2024 |
| S/(000) | | % | | S/(000) | | % |
Instruments issued in Peru: | | | | | | | |
BBB- to BBB+ | 25,036,590 | | | 47.5 | | | 23,952,251 | | | 44.5 | |
| BB- to BB+ | 865,912 | | | 1.6 | | | 910,170 | | | 1.7 | |
| Lower and equal to +B | — | | | – | | | 33,402 | | | 0.1 | |
| Unrated: | | | | | | | |
| BCRP certificates of deposit | 10,884,030 | | | 20.6 | | | 11,435,757 | | | 21.2 | |
| Listed and unlisted securities | 139,019 | | | 0.3 | | | 158,620 | | | 0.3 | |
| Restricted mutual funds | 336,159 | | | 0.6 | | | 307,225 | | | 0.6 | |
| Investment funds | 934,923 | | | 1.8 | | | 835,689 | | | 1.6 | |
| Mutual funds | 43,143 | | | 0.1 | | | 66,156 | | | 0.1 | |
| Other instruments | 221,336 | | | 0.4 | | | 276,372 | | | 0.5 | |
| Subtotal | 38,461,112 | | | 72.9 | | | 37,975,642 | | | 70.6 | |
| | | | | | | | | | | | | | | | | | | | | | | |
| 2025 | | 2024 |
| S/(000) | | % | | S/(000) | | % |
| Instruments issued abroad: | | | | | | | |
| AAA | 348,800 | | | 0.7 | | | 442,467 | | | 0.8 | |
| AA- to AA+ | 1,396,825 | | | 2.5 | | | 2,562,695 | | | 4.7 | |
| A- to A+ | 2,888,578 | | | 5.5 | | | 2,720,507 | | | 5.1 | |
| BBB- to BBB+ | 4,220,090 | | | 8.0 | | | 4,904,951 | | | 9.1 | |
| BB- to BB+ | 3,070,701 | | | 5.8 | | | 2,608,610 | | | 4.8 | |
| Lower and equal to +B | 81,332 | | | 0.2 | | | 60,822 | | | 0.1 | |
| Unrated: | | | | | | | |
| Listed and unlisted securities | 21,356 | | | — | | | 42,033 | | | 0.1 | |
| Mutual funds | 661,793 | | | 1.3 | | | 556,001 | | | 1.0 | |
Participations of RAL funds | 125,393 | | | 0.2 | | | 432,503 | | | 0.8 | |
| Investment funds | 563,245 | | | 1.1 | | | 566,267 | | | 1.1 | |
| Other instruments | 965,717 | | | 1.8 | | | 953,360 | | | 1.8 | |
| Subtotal | 14,343,830 | | | 27.1 | | | 15,850,216 | | | 29.4 | |
| Total | 52,804,942 | | | 100.0 | | | 53,825,858 | | | 100.0 | |
f) Concentration of financial instruments exposed to credit risk -
As of December 31, 2025 and 2024, financial instruments with exposure to credit risk were distributed considering the following economic sectors:
| | | | | | | | | | | | | | | | | | | | | | | | | | | | | | | | | | | | | | | | | | | | | | | | | | | | | | | | | | | |
| 2025 | | 2024 |
| At fair value through profit for loss | | | | | | | | At fair value through profit for loss | | | | | | |
| Held for trading, hedging and others (*) | | Designated at inception | | Financial assets at amortized cost | | At fair value through other comprehensive income investments and hedging (**) | | Total | | Held for trading, hedging and others (*) | | Designated at inception | | Financial assets at amortized cost | | At fair value through other comprehensive income investments and hedging (**) | | Total |
| S/(000) | | S/(000) | | S/(000) | | S/(000) | | S/(000) | | S/(000) | | S/(000) | | S/(000) | | S/(000) | | S/(000) |
| | | | | | | | | | | | | | | | | | | |
| Central Reserve Bank of Peru | 34 | | | – | | | 38,956,544 | | | 10,884,030 | | | 49,840,608 | | | 44,599 | | | – | | | 36,640,462 | | | 11,435,757 | | | 48,120,818 | |
| Financial services | 2,792,539 | | | 766,516 | | | 17,182,430 | | | 3,929,527 | | | 24,671,012 | | | 2,181,025 | | | 633,527 | | | 18,345,088 | | | 4,196,687 | | | 25,356,327 | |
| Commerce | 61,109 | | | 1,029 | | | 29,358,035 | | | 1,308,456 | | | 30,728,629 | | | 4,441 | | | 1,130 | | | 26,546,422 | | | 1,263,109 | | | 27,815,102 | |
| Government and public administration | 2,122,871 | | | 221,174 | | | 8,416,242 | | | 13,758,649 | | | 24,518,936 | | | 2,153,564 | | | 42,978 | | | 8,451,218 | | | 13,471,446 | | | 24,119,206 | |
| Mortgage loans | – | | | – | | | 25,336,172 | | | – | | | 25,336,172 | | | – | | | – | | | 24,165,038 | | | – | | | 24,165,038 | |
| Manufacturing | 41,417 | | | 1,041 | | | 20,102,547 | | | 1,891,011 | | | 22,036,016 | | | 157,215 | | | 81 | | | 21,260,811 | | | 1,918,004 | | | 23,336,111 | |
| Consumer loans | – | | | – | | | 19,877,075 | | | – | | | 19,877,075 | | | – | | | – | | | 18,494,305 | | | – | | | 18,494,305 | |
| Communications, storage and transportation | 2,878 | | | – | | | 10,407,568 | | | 823,140 | | | 11,233,586 | | | 25,331 | | | 254,562 | | | 9,928,424 | | | 991,194 | | | 11,199,511 | |
| Electricity, gas and water | 54,641 | | | 1,025 | | | 5,760,870 | | | 2,006,255 | | | 7,822,791 | | | 109,673 | | | 87 | | | 5,917,891 | | | 2,245,021 | | | 8,272,672 | |
| Real estate and leasing | 299,455 | | | – | | | 3,539,887 | | | 56,927 | | | 3,896,269 | | | 163,867 | | | – | | | 4,872,017 | | | 2,408 | | | 5,038,292 | |
| Mining | 5,560 | | | – | | | 4,812,472 | | | 378,801 | | | 5,196,833 | | | 5,563 | | | – | | | 3,670,102 | | | 226,845 | | | 3,902,510 | |
| Agriculture | 36 | | | – | | | 4,619,970 | | | 4,251 | | | 4,624,257 | | | 3,995 | | | – | | | 4,610,164 | | | 8,034 | | | 4,622,193 | |
| Construction | 9,091 | | | – | | | 2,513,582 | | | 360,966 | | | 2,883,639 | | | 3,901 | | | – | | | 2,924,805 | | | 390,071 | | | 3,318,777 | |
| Hotels and restaurants | – | | | – | | | 2,314,739 | | | – | | | 2,314,739 | | | – | | | – | | | 2,570,704 | | | – | | | 2,570,704 | |
| Education, health and others | 229,839 | | | 1,542 | | | 1,435,961 | | | 655,588 | | | 2,322,930 | | | 390,150 | | | 10 | | | 1,736,113 | | | 844,135 | | | 2,970,408 | |
| Fishing | 134 | | | – | | | 827,182 | | | – | | | 827,316 | | | 4 | | | – | | | 669,274 | | | – | | | 669,278 | |
| Insurance | – | | | – | | | 124,299 | | | – | | | 124,299 | | | 3,252 | | | – | | | 133,086 | | | – | | | 136,338 | |
| Community services and others | 568,820 | | | 102 | | | 12,213,192 | | | 2,977,125 | | | 15,759,239 | | | 373,554 | | | 359 | | | 8,254,825 | | | 3,149,927 | | | 11,778,665 | |
| Total | 6,188,424 | | | 992,429 | | | 207,798,767 | | | 39,034,726 | | | 254,014,346 | | | 5,620,134 | | | 932,734 | | | 199,190,749 | | | 40,142,638 | | | 245,886,255 | |
(*)It includes non-trading investments that did not pass SPPI test.
(**)OCI: Other comprehensive income.
As of December 31, 2025 and 2024 financial instruments with exposure to credit risk were distributed by the following geographical areas:
| | | | | | | | | | | | | | | | | | | | | | | | | | | | | | | | | | | | | | | | | | | | | | | | | | | | | | | | | | | |
| 2025 | | 2024 |
| At fair value through profit for loss | | | | | | | | At fair value through profit for loss | | | | | | |
| Held for trading, hedging and others (*) | | Designated at inception | | Financial assets at amortized cost | | At fair value through other comprehensive income investments and hedging (**) | | Total | | Held for trading, hedging and others (*) | | Designated at inception | | Financial assets at amortized cost | | At fair value through other comprehensive income investments and hedging(**) | | Total |
| S/(000) | | S/(000) | | S/(000) | | S/(000) | | S/(000) | | S/(000) | | S/(000) | | S/(000) | | S/(000) | | S/(000) |
| | | | | | | | | | | | | | | | | | | |
| America: | | | | | | | | | | | | | | | | | | | |
| Peru | 2,144,033 | | | 7,499 | | | 183,414,012 | | | 28,117,088 | | | 213,682,632 | | | 1,893,544 | | | 3,593 | | | 175,089,699 | | | 27,879,813 | | | 204,866,649 | |
| United States of America | 707,411 | | | 616,657 | | | 3,242,867 | | | 5,975,716 | | | 10,542,651 | | | 757,151 | | | 845,577 | | | 3,228,496 | | | 7,360,645 | | | 12,191,869 | |
| Colombia | 1,501,100 | | | – | | | 4,597,771 | | | 855,529 | | | 6,954,400 | | | 1,218,708 | | | – | | | 3,560,497 | | | 793,612 | | | 5,572,817 | |
| Bolivia | 437,460 | | | – | | | 9,358,834 | | | 666,129 | | | 10,462,423 | | | 835,594 | | | – | | | 11,850,504 | | | 801,894 | | | 13,487,992 | |
| Chile | 483,541 | | | – | | | 2,821,134 | | | 596,693 | | | 3,901,368 | | | 300,827 | | | – | | | 2,224,616 | | | 626,907 | | | 3,152,350 | |
| Brazil | 8,847 | | | – | | | 1,460,091 | | | 299,662 | | | 1,768,600 | | | 9,037 | | | – | | | 1,632,544 | | | 268,174 | | | 1,909,755 | |
| Panama | 5,435 | | | – | | | 338,265 | | | 307,071 | | | 650,771 | | | 43,748 | | | – | | | 359,932 | | | 229,945 | | | 633,625 | |
| Mexico | 7,383 | | | – | | | 90,081 | | | 444,547 | | | 542,011 | | | 55,729 | | | – | | | 183,334 | | | 467,970 | | | 707,033 | |
| Canada | 61,944 | | | – | | | 14,582 | | | 179,503 | | | 256,029 | | | 5,608 | | | – | | | 108,618 | | | 149,235 | | | 263,461 | |
| Europe: | | | | | | | | | | | | | | | | | | | |
| United Kingdom | 434,045 | | | – | | | 58,512 | | | 246,791 | | | 739,348 | | | 191,072 | | | – | | | 10,498 | | | 249,702 | | | 451,272 | |
| Spain | 97,652 | | | – | | | 786,809 | | | 277,573 | | | 1,162,034 | | | 13,561 | | | – | | | 6,755 | | | 228,626 | | | 248,942 | |
| France | 75,950 | | | – | | | 28,279 | | | 125,625 | | | 229,854 | | | 113,112 | | | – | | | 17,305 | | | 120,194 | | | 250,611 | |
| Switzerland | 10 | | | – | | | 163 | | | 23,772 | | | 23,945 | | | – | | | – | | | 1,616 | | | 47,974 | | | 49,590 | |
| Luxembourg | 79,281 | | | – | | | 336,275 | | | 5,316 | | | 420,872 | | | 77,777 | | | – | | | 7,474 | | | 2,961 | | | 88,212 | |
| Netherlands | – | | | – | | | 2,436 | | | 13,501 | | | 15,937 | | | – | | | – | | | 728 | | | 35,014 | | | 35,742 | |
| Others in Europe | 117,991 | | | – | | | 53,363 | | | 80,250 | | | 251,604 | | | 79,762 | | | – | | | 190,632 | | | 75,014 | | | 345,408 | |
| Others | 26,341 | | | 368,273 | | | 1,195,293 | | | 819,960 | | | 2,409,867 | | | 24,904 | | | 83,564 | | | 717,501 | | | 804,958 | | | 1,630,927 | |
| Total | 6,188,424 | | | 992,429 | | | 207,798,767 | | | 39,034,726 | | | 254,014,346 | | | 5,620,134 | | | 932,734 | | | 199,190,749 | | | 40,142,638 | | | 245,886,255 | |
(*)It includes non-trading investments that did not pass SPPI test.
(**)OCI: Other comprehensive income.
g) Offsetting financial assets and liabilities -
The Group has financial assets and liabilities that:
-Are offset in the Group’s consolidated statement of financial position; or
-Are subject to an enforceable master netting agreement or similar agreement covering similar financial instruments, regardless of whether they are offset in the consolidated statement of financial position.
Similar arrangements include derivative netting agreements, master repurchase agreements and master securities lending agreements. Similar financial instruments include derivatives, accounts receivable from reverse repurchase agreements and securities financing transactions, and payables from repurchase agreements and securities lending transactions. Financial instruments such as loans and deposits are not disclosed in the following tables, as they are not offset in the consolidated statement of financial position.
The offsetting framework contract issued by the International Swaps and Derivatives Association Inc. (“ISDA”) and similar master offsetting arrangements do not meet the criteria for offsetting in the statement of financial position, because said agreements were created in order for both parties to have an enforceable offsetting right in cases of default, insolvency or bankruptcy of the Group or the counterparties or following other predetermined events. In addition, the Group and its counterparties do not intend to settle said instruments on a net basis or to realize the assets and settle the liabilities simultaneously.
The Group receives and gives collateral in the form of cash and trading securities in respect of the following transactions:
-Derivatives,
-Accounts receivable from reverse repurchase agreements and securities borrowing;
-Payables from repurchase agreements and securities lending
Such collateral adheres to standard industry terms including, when appropriate, an ISDA Credit Support Annex. This means that securities received/given as collateral can be pledged or sold during the term of the transaction must be returned on maturity of the transaction. The terms also give each party the right to terminate the related transactions upon the counterparty’s failure to return the respective collateral.
Financial assets subject to offsetting, enforceable master offsetting agreements and similar agreements:
| | | | | | | | | | | | | | | | | | | | | | | | | | | | | | | | |
| | 2025 |
| | | | Net of financial assets presented in the consolidated statements of financial position | | Related amounts not offset in the consolidated statement of financial position | | |
| Details | | Gross amounts recognized financial assets | | Financial instruments | | Cash collateral received | | Net amount |
| | S/(000) | | S/(000) | | S/(000) | | S/(000) | | S/(000) |
| Receivables from derivatives | | 1,231,865 | | | 1,231,865 | | | (499,494) | | | (438,073) | | | 294,298 | |
| Cash collateral, reverse repurchase agreements and securities borrowing | | 2,177,200 | | | 2,177,200 | | | (350,854) | | | (12,635) | | | 1,813,711 | |
| Investments at fair value through other comprehensive income and amortized cost pledged as collateral | | 6,314,420 | | | 6,314,420 | | | (5,302,304) | | | – | | | 1,012,116 | |
| Total | | 9,723,485 | | | 9,723,485 | | | (6,152,652) | | | (450,708) | | | 3,120,125 | |
| | | | | | | | | | | | | | | | | | | | | | | | | | | | | | | | |
| | 2024 |
| | | | Net of financial assets presented in the consolidated statements of financial position | | Related amounts not offset in the consolidated statement of financial position | | |
| Details | | Gross amounts recognized financial assets | | Financial instruments | | Cash collateral received | | Net amount |
| | S/(000) | | S/(000) | | S/(000) | | S/(000) | | S/(000) |
| Receivables from derivatives | | 904,791 | | | 904,791 | | | (310,932) | | | (37,615) | | | 556,244 | |
| Cash collateral, reverse repurchase agreements and securities borrowing | | 1,033,177 | | | 1,033,177 | | | – | | | (19,151) | | | 1,014,026 | |
| Investments at fair value through other comprehensive income and amortized cost pledged as collateral | | 6,997,811 | | | 6,997,811 | | | (6,159,186) | | | – | | | 838,625 | |
| Total | | 8,935,779 | | | 8,935,779 | | | (6,470,118) | | | (56,766) | | | 2,408,895 | |
Financial liabilities subject to offsetting, enforceable offsetting master agreements and similar agreements:
| | | | | | | | | | | | | | | | | | | | | | | | | | | | | | | | |
| | 2025 |
| | | | Net amounts of financial liabilities presented in the consolidated statement of financial position | | Related amounts not offset in the consolidated statement of financial position | | |
| Details | | Gross amounts of recognized financial liabilities | | Financial instruments | | Cash collateral pledged | | Net amount |
| | S/(000) | | S/(000) | | S/(000) | | S/(000) | | S/(000) |
| Payables on derivatives | | 1,047,907 | | | 1,047,907 | | | (499,494) | | | (275,272) | | | 273,141 | |
| Payables on repurchase agreements and securities lending | | 8,243,787 | | | 8,243,787 | | | (5,302,304) | | | (6,293) | | | 2,935,190 | |
| Total | | 9,291,694 | | | 9,291,694 | | | (5,801,798) | | | (281,565) | | | 3,208,331 | |
| | | | | | | | | | | | | | | | | | | | | | | | | | | | | | | | |
| | 2024 |
| | | | Net amounts of financial liabilities presented in the consolidated statement of financial position | | Related amounts not offset in the consolidated statement of financial position | | |
| Details | | Gross amounts of recognized financial liabilities | | Financial instruments | | Cash collateral pledged | | Net amount |
| | S/(000) | | S/(000) | | S/(000) | | S/(000) | | S/(000) |
| Payables on derivatives | | 819,473 | | | 819,473 | | | (310,932) | | | (1,115,338) | | | (606,797) | |
| Payables on repurchase agreements and securities lending | | 9,060,710 | | | 9,060,710 | | | (6,692,254) | | | (362,723) | | | 2,005,733 | |
| Total | | 9,880,183 | | | 9,880,183 | | | (7,003,186) | | | (1,478,061) | | | 1,398,936 | |
The gross amounts of financial assets and liabilities disclosed in the above tables have been measured in the consolidated statement of financial position on the following basis:
-Derivative assets and liabilities are measured at fair value.
-Accounts receivable from resale agreements and securities financing and accounts payable from repurchase agreements and securities lending are measured at amortized cost.
The difference between the balance recognized in the consolidated statement of financial position and the amounts presented in the preceding tables for derivatives (presented under Other assets, Note 12(c), receivables from resale agreements and securities financing, and payables from repurchase agreements and securities lending at fair value through profit or loss, relates to financial instruments that are outside the scope of offsetting disclosures.
30.2 Market risk -
The Group has exposure to market risk, which is the risk that the fair value or future cash flows of a financial instrument will fluctuate because of changes in market prices. Market risks arise from open positions in interest rates, currency, commodities, and equity products; all of which are exposed to general and specific market movements and changes in the level of volatility of prices such as interest rates, credit spreads, foreign exchange
rates and equity prices. Due to the order of the Group’s current activities, commodity price risk has not been approved, so this type of instrument is not agreed.
The Group separates exposures to market risk in two groups: (i) those that arise from value fluctuation of trading portfolios recognized at fair value through profit or loss due to movements of market rates or prices (Trading Book) and (ii) those that arise from changes in the structural positions of non-trading portfolios due to movements of the interest rates, prices and foreign exchange ratios (Banking Book) and that are recorded at amortized cost and at fair value with changes in other comprehensive income, this is due to movements in interest rates, prices and currency exchange rates.
The risks that trading portfolios face are managed through Value at Risk (VaR) historical simulation techniques; while non-trading portfolios (Banking Book) are monitored using rate sensitivity metrics, which are a part of Asset and Liability Management (ALM).
a)Trading Book –
The trading book is characterized for having liquid positions in stocks, bonds, foreign currencies, and derivatives, arising from market-making transactions where the Group acts as principal with the clients or with the market. This portfolio includes investments and derivatives classified by Management as held for trading.
(i)Value at Risk (VaR) –
The Group applies the VaR approach to its trading portfolio to estimate the market risk of the main positions held and the maximum losses that are expected, based upon a number of assumptions for various changes in market conditions and considering the risk appetite of the subsidiary.
Daily calculation of VaR is a statistically based estimate of the maximum potential loss on the current portfolio from adverse market movements.
VaR expresses the “maximum” amount the Group might lose, but only to a certain level of confidence (99.0 percent). There is therefore a specified statistical probability (1.0 percent) that actual loss could be greater than the VaR estimate. The VaR model assumes a certain “holding period” until positions can be closed (1 - 10 days).
The time horizon used to calculate VaR is one day; however, the one-day VAR is amplified to a 10 days time frame and calculated multiplying the one-day VaR by the square root of 10. This adjustment will be accurate only if the changes in the portfolio in the following days have a normal distribution independent and identically distributed; because of that, the result is multiplied by a non-normality adjustment factor. The limits and consumptions of the VaR are established on the basis of the risk appetite and the trading strategies of each subsidiary.
The evaluation of the movements of the trading portfolio has been based on annual historical information and 72 market risk factors, which are detailed following: 21 market curves, 31 stock prices, 17 mutual fund values and 2 series of volatility. The Group directly applies these historical changes in rates to each position in its current portfolio (method known as historical simulation).
The Group Management considers that the market risk factors, incorporated in their VaR model, are adequate to measure the market risk to which its trading portfolio is exposed.
The use of this approach does not prevent losses outside of these limits in the event of more significant market movements. Losses exceeding the VaR figure may occur, on average under normal market conditions, not more than once every hundred days. VaR limits have been established to control and keep track of all the risks taken. These risks arise from the size of the positions and/or the volatility of the risk factors embedded in each financial instrument. Regular reports are prepared for the Treasury Risk Committee and ALM, the Risk Management Committee and Senior Management.
VaR results are used to generate economic capital estimates by market risk, which are periodically monitored and are part of the overall risk appetite of each subsidiary. Furthermore, at Group level, there is also a limit to the risk appetite of the trading portfolio, which is monitored and informed to the Treasury Risks and ALM Corporate Committee.
In VaR calculation, the effects of the exchange rate are not included because said effects are measured in the net monetary position, see Note 30.2(b)(ii).
The VaR of the Group remained stable as of December 31, 2025. During the period, the VaR remained within the limits of the appetite for risk established by the Risk Management of each subsidiary.
As of December 31, 2025 and 2024, the Group’s VaR by risk type is as follows:
| | | | | | | | | | | |
| 2025 | | 2024 |
| S/(000) | | S/(000) |
| | | |
| Interest rate risk | 27,569 | | | 29,138 | |
| Price risk | 1,631 | | | 933 | |
| Volatility risk | 286 | | | 462 | |
| Diversification effect | (611) | | | (1,685) | |
| Consolidated VaR by type of risk | 28,875 | | | 28,848 | |
On the other hand, those instruments that are accounted for at fair value through profit or loss and that are not intended for trading are included in the rate and price sensitivity analysis in the following section. See table of earnings sensitivity at risk, net economic value and price sensitivity.
b)Banking Book –
The non-trading portfolios or, belonging to the banking book (“banking book”), are exposed to different risks, since they are sensitive to movements in market rates, which may result in a negative impact on the value of the assets. with respect to its liabilities, and therefore, in its net worth.
(i)Interest rate risk –
The Banking Book-related interest rate risk arises from eventual changes in interest rates that may adversely affect the expected gains (risk gains) or market value of financial assets and liabilities reported on the balance sheet (net economic value). The Group assumes the exposure to the interest rate risk that may affect their fair value as well as the cash flow risk of future assets and liabilities.
The Risk Committee sets the guidelines regarding the level of unmatched repricing of interest rates that can be tolerated, which is periodically monitored through ALCO.
Corporate policies include guidelines for the management of the Group’s exposure to the interest rate risk. These guidelines are implemented considering the features of each segment of business in which the Group entities operate.
In this regard, Group companies that are exposed to the interest rate risk are those that have yields based on interest, such as credits, investments and technical reserves. Interest rate risk management in Banco de Crédito del Perú, Banco de Crédito de Bolivia, Mibanco - Banco de la Microempresa, Mibanco - Banco de la Microempresa de Colombia, ASB Bank Corp and Pacífico Seguros, is carried out by performing a repricing gap analysis, sensitivity analysis of the financial margin (GER) and sensitivity analysis of the net economic value (VEN). These calculations consider different rate shocks, which are generated through different scenario simulations and consider periods of high volatility.
Analysis of repricing gap -
The repricing gap analysis is intended to measure the risk exposure of interest rate for repricing periods, in which both balance and out of balance assets and liabilities are grouped. This allows identifying those sections in which the rate variations would have a potential impact.
The table below summarizes the Group’s exposure to interest rate risks. It includes the Group’s financial instruments at carrying amounts, categorized by the earlier of contractual re-pricing or maturity dates, what occurs first:
| | | | | | | | | | | | | | | | | | | | | | | | | | | | | | | | | | | | | | | | | |
| 2025 |
| Up to 1 month | | 1 to 3 months | | 3 to 12 months | | 1 to 5 years | | More than 5 years | | Non-interest bearing | | Total |
| S/(000) | | S/(000) | | S/(000) | | S/(000) | | S/(000) | | S/(000) | | S/(000) |
| Assets | | | | | | | | | | | | | |
| Cash and cash collateral, reverse repurchase agreements and securities borrowing | 37,746,584 | | | 759,032 | | | 1,095,107 | | | 2,167,637 | | | 2,882,800 | | | 6,570,497 | | | 51,221,657 | |
| Investments (*) | 2,206,670 | | | 4,454,362 | | | 7,626,855 | | | 8,288,755 | | | 25,180,743 | | | 90,321 | | | 47,847,706 | |
| Loans, net | 21,146,870 | | | 18,801,001 | | | 44,294,644 | | | 45,817,210 | | | 13,917,135 | | | (1,661,856) | | | 142,315,004 | |
| Financial assets designated at fair value through profit or loss | – | | | – | | | – | | | – | | | – | | | 992,429 | | | 992,429 | |
| Reinsurance and insurance contract assets | 708,560 | | | – | | | – | | | – | | | – | | | – | | | 708,560 | |
| Other assets (**) | 544,074 | | | 133,545 | | | 1,332 | | | – | | | 72,840 | | | 4,708,147 | | | 5,459,938 | |
| Total assets | 62,352,758 | | | 24,147,940 | | | 53,017,938 | | | 56,273,602 | | | 42,053,518 | | | 10,699,538 | | | 248,545,294 | |
| | | | | | | | | | | | | |
| Liabilities | | | | | | | | | | | | | |
| Deposits and obligations | 26,910,364 | | | 22,259,382 | | | 28,940,310 | | | 52,514,477 | | | 39,448,884 | | | 328,216 | | | 170,401,633 | |
| Payables from repurchase agreements and securities lending and due to banks and correspondents | 6,438,412 | | | 5,628,624 | | | 1,145,888 | | | 2,654,255 | | | 2,894,222 | | | 157,624 | | | 18,919,025 | |
| Insurance and reinsurance contract liability | 136,545 | | | 210,611 | | | 599,093 | | | 2,460,841 | | | 7,610,781 | | | 3,246,284 | | | 14,264,155 | |
| Financial liabilities at fair value through profit or loss | – | | | – | | | – | | | – | | | – | | | 1,055,893 | | | 1,055,893 | |
| Bonds and notes issued | 226,853 | | | 423,133 | | | 2,866,745 | | | 7,532,602 | | | 2,707,559 | | | 268,643 | | | 14,025,535 | |
| Other liabilities (**) | 1,219,594 | | | 25,236 | | | 10,043 | | | 12 | | | 129,525 | | | 4,678,502 | | | 6,062,912 | |
| Equity | – | | | – | | | – | | | – | | | – | | | 39,096,109 | | | 39,096,109 | |
| Total liabilities and equity | 34,931,768 | | | 28,546,986 | | | 33,562,079 | | | 65,162,187 | | | 52,790,971 | | | 48,831,271 | | | 263,825,262 | |
| | | | | | | | | | | | | |
| Off-balance-sheet accounts | | | | | | | | | | | | | |
| Derivative financial assets | – | | | 353,115 | | | 823,935 | | | – | | | – | | | – | | | 1,177,050 | |
| Derivative financial liabilities | 504,450 | | | – | | | 184,965 | | | 502,585 | | | – | | | – | | | 1,192,000 | |
| (504,450) | | | 353,115 | | | 638,970 | | | (502,585) | | | – | | | – | | | (14,950) | |
| Marginal gap | 26,916,540 | | | (4,045,931) | | | 20,094,829 | | | (9,391,170) | | | (10,737,453) | | | (38,131,733) | | | (15,294,918) | |
| Accumulated gap | 26,916,540 | | | 22,870,609 | | | 42,965,438 | | | 33,574,268 | | | 22,836,815 | | | (15,294,918) | | | – | |
(*)Investments for trading purposes are not considered (investments at fair value through profit or loss and trading derivatives), because these instruments are part of the trading book and the Value at Risk methodology is used to measure market risks.
(**)Other assets and Other liabilities include only financial instruments, excluding accounts receivable and accounts payable, respectively, arising from trading derivatives.
| | | | | | | | | | | | | | | | | | | | | | | | | | | | | | | | | | | | | | | | | |
| 2024 |
| Up to 1 month | | 1 to 3 months | | 3 to 12 months | | 1 to 5 years | | More than 5 years | | Non-interest bearing | | Total |
| S/(000) | | S/(000) | | S/(000) | | S/(000) | | S/(000) | | S/(000) | | S/(000) |
| Assets | | | | | | | | | | | | | |
| Cash and cash collateral, reverse repurchase agreements and securities borrowing | 35,573,543 | | | 1,085,329 | | | 1,609,783 | | | 2,012,826 | | | 2,342,288 | | | 6,064,604 | | | 48,688,373 | |
| Investments (*) | 1,548,776 | | | 3,604,634 | | | 10,192,970 | | | 12,690,421 | | | 20,926,450 | | | 147,264 | | | 49,110,515 | |
| Loans, net | 19,023,450 | | | 17,337,262 | | | 40,333,482 | | | 46,077,476 | | | 16,239,454 | | | (1,273,828) | | | 137,737,296 | |
| Financial assets designated at fair value through profit or loss | – | | | – | | | – | | | – | | | – | | | 932,734 | | | 932,734 | |
| Reinsurance and insurance contract assets | 841,170 | | | – | | | – | | | – | | | – | | | – | | | 841,170 | |
| Other assets (**) | 110,454 | | | – | | | – | | | – | | | 74,073 | | | 3,675,254 | | | 3,859,781 | |
| Total assets | 57,097,393 | | | 22,027,225 | | | 52,136,235 | | | 60,780,723 | | | 39,582,265 | | | 9,546,028 | | | 241,169,869 | |
| | | | | | | | | | | | | |
| Liabilities | | | | | | | | | | | | | |
| Deposits and obligations | 30,965,685 | | | 20,248,915 | | | 35,585,502 | | | 47,713,442 | | | 26,875,898 | | | 452,624 | | | 161,842,066 | |
| Payables from repurchase agreements and securities lending and due to banks and correspondents | 3,371,128 | | | 6,893,979 | | | 4,410,854 | | | 1,749,262 | | | 3,074,502 | | | 315,370 | | | 19,815,095 | |
| Insurance and reinsurance contract liability | 121,965 | | | 189,997 | | | 582,662 | | | 2,149,411 | | | 7,271,617 | | | 3,106,633 | | | 13,422,285 | |
| Financial liabilities at fair value through profit or loss | – | | | – | | | – | | | – | | | – | | | 151,485 | | | 151,485 | |
| Bonds and notes issued | 2,913,005 | | | 2,108,291 | | | 3,977,975 | | | 5,284,838 | | | 2,787,909 | | | 196,425 | | | 17,268,443 | |
| Other liabilities (**) | 442,572 | | | – | | | – | | | 4 | | | 101,587 | | | 5,220,609 | | | 5,764,772 | |
| Equity | – | | | – | | | – | | | – | | | – | | | 34,977,234 | | | 34,977,234 | |
| Total liabilities and equity | 37,814,355 | | | 29,441,182 | | | 44,556,993 | | | 56,896,957 | | | 40,111,513 | | | 44,420,380 | | | 253,241,380 | |
| | | | | | | | | | | | | |
| Off-balance-sheet accounts | | | | | | | | | | | | | |
| Derivative financial assets | 865,949 | | | 508,140 | | | 592,591 | | | 564,599 | | | – | | | – | | | 2,531,279 | |
| Derivative financial liabilities | 1,382,049 | | | 112,920 | | | 354,289 | | | 658,699 | | | – | | | – | | | 2,507,957 | |
| (516,100) | | | 395,220 | | | 238,302 | | | (94,100) | | | – | | | – | | | 23,322 | |
| Marginal gap | 18,766,938 | | | (7,018,737) | | | 7,817,544 | | | 3,789,666 | | | (529,248) | | | (34,874,352) | | | (12,048,189) | |
| Accumulated gap | 18,766,938 | | | 11,748,201 | | | 19,565,745 | | | 23,355,411 | | | 22,826,163 | | | (12,048,189) | | | – | |
(*)Investments for trading purposes are not considered (investments at fair value through profit or loss and trading derivatives), because these instruments are part of the trading book and the Value at Risk methodology is used to measure market risks.
(**)Other assets and Other liabilities include only financial instruments, excluding accounts receivable and accounts payable, respectively, arising from trading derivatives.
Sensitivity to changes in interest rates -
The sensitivity analysis of a reasonable possible change in interest rates on the banking book comprises an assessment of the sensitivity of the financial margins that seeks to measure the potential changes in the interest accruals over a period of time and the expected movement of the interest rate curves, as well as the sensitivity of the net economic value, which is a long-term metric measured as the difference arising between the Net Economic Value of assets and liabilities before and after a variation in interest rates.
The sensitivity of the financial margin is the effect of the assumed changes in interest rates on the net financial interest income before income tax and non-controlling interest for one year, based on non-trading financial assets and financial liabilities held as of December 31, 2025 and 2024, including the effect of derivative instruments.
The sensitivity of the Net Economic Value is calculated by reassessing the financial assets and liabilities sensitive to rates, except for the trading instruments, including the effect of any associated hedge, and derivative instruments designated as a cash flow hedge. Regarding rate risk management, no distinction is made by accounting category for the investments that are considered in these calculations.
The results of the sensitivity analysis regarding changes in interest rates at December 31, 2025 and 2024 are presented below:
| | | | | | | | | | | | | | | | | | | | | | | | | | | | | |
| 2025 |
| Currency | | Changes in basis points | | Sensitivity of net profit | | Sensitivity of net economic value |
| | | | | S/(000) | | S/(000) |
| Soles | | +/- | 50 | | +/- | 51,429 | | | -/+ | 297,149 | |
| Soles | | +/- | 75 | | +/- | 77,143 | | | -/+ | 445,724 | |
| Soles | | +/- | 100 | | +/- | 102,857 | | | -/+ | 594,298 | |
| Soles | | +/- | 150 | | +/- | 154,286 | | | -/+ | 891,447 | |
| U.S. Dollar | | +/- | 50 | | +/- | 173,047 | | | +/- | 338,248 | |
| U.S. Dollar | | +/- | 75 | | +/- | 259,571 | | | +/- | 507,372 | |
| U.S. Dollar | | +/- | 100 | | +/- | 346,095 | | | +/- | 676,496 | |
| U.S. Dollar | | +/- | 150 | | +/- | 519,142 | | | +/- | 1,014,745 | |
| | | | | | | | | | | | | | | | | | | | | | | | | | | | | |
| 2024 |
| Currency | | Changes in basis points | | Sensitivity of net profit | | Sensitivity of net economic value |
| | | | | S/(000) | | S/(000) |
| Soles | | +/- | 50 | | +/- | 30,754 | | | -/+ | 425,783 | |
| Soles | | +/- | 75 | | +/- | 46,132 | | | -/+ | 638,675 | |
| Soles | | +/- | 100 | | +/- | 61,509 | | | -/+ | 851,567 | |
| Soles | | +/- | 150 | | +/- | 92,263 | | | -/+ | 1,277,350 | |
| U.S. Dollar | | +/- | 50 | | +/- | 134,532 | | | +/- | 191,211 | |
| U.S. Dollar | | +/- | 75 | | +/- | 201,798 | | | +/- | 286,816 | |
| U.S. Dollar | | +/- | 100 | | +/- | 269,064 | | | +/- | 382,421 | |
| U.S. Dollar | | +/- | 150 | | +/- | 403,595 | | | +/- | 573,632 | |
The interest rate sensitivities set out in the table above are only illustrative and are based on simplified scenarios. The figures represent the effect of the pro-forma movements in the net interest income based on the projected yield curve scenarios and the Group’s current interest rate risk profile. This effect, however, does not incorporate actions that would be taken by Management to mitigate the impact of this interest rate risk.
The Group seeks proactively to change the interest rate risk profile to minimize losses and optimize net revenues. The projections above also assume that the interest rate of all maturities moves by the same amount and, therefore, do not reflect the potential impact on net interest income of some rates changing while others remain unchanged.
As of December 31, 2025 and 2024, investments in equity securities and funds that are non-trading, recorded at fair value through other comprehensive income and at fair value through profit or loss, respectively, are not considered as comprising investment securities for interest rate sensitivity calculation purposes; however, a 10.0, 25.0 and 30.0 percent of changes in market prices is conducted to these price-sensitivity securities.
The market price sensitivity tests as of December 31, 2025 and 2024 are presented below:
| | | | | | | | | | | | | | | | | | | | |
| Equity securities |
Measured at fair value through other comprehensive income | | Change in market prices | | 2025 | | 2024 |
| | % | | S/(000) | | S/(000) |
| | | | | | |
| Equity securities | | +/-10 | | | 9,032 | | | 14,726 | |
| Equity securities | | +/-25 | | | 22,581 | | | 36,816 | |
| Equity securities | | +/-30 | | | 27,097 | | | 44,179 | |
| | | | | | | | | | | | | | | | | | | | |
| Funds |
Measured at fair value through profit or loss | | Change in market prices | | 2025 | | 2024 |
| | % | | S/(000) | | S/(000) |
| | | | | | |
| Participation in mutual funds | | +/-10 | | | 70,494 | | | 62,216 | |
| Participation in mutual funds | | +/-25 | | | 176,234 | | | 155,539 | |
| Participation in mutual funds | | +/-30 | | | 211,481 | | | 186,647 | |
| Restricted mutual funds | | +/-10 | | | 33,616 | | | 31,820 | |
| Restricted mutual funds | | +/-25 | | | 84,040 | | | 79,549 | |
| Restricted mutual funds | | +/-30 | | | 100,848 | | | 95,459 | |
| Participation in RAL funds | | +/-10 | | | 12,539 | | | 43,250 | |
| Participation in RAL funds | | +/-25 | | | 31,348 | | | 108,126 | |
| Participation in RAL funds | | +/-30 | | | 37,618 | | | 129,751 | |
| Investment funds | | +/-10 | | | 149,817 | | | 140,196 | |
| Investment funds | | +/-25 | | | 374,542 | | | 350,489 | |
| Investment funds | | +/-30 | | | 449,451 | | | 420,587 | |
| Exchange Trade Funds | | +/-10 | | | 3,410 | | | 3,931 | |
| Exchange Trade Funds | | +/-25 | | | 8,524 | | | 9,827 | |
| Exchange Trade Funds | | +/-30 | | | 10,229 | | | 11,793 | |
(ii)Foreign currency exchange risk –
The Group is exposed to fluctuations in foreign currency exchange rates, which impact net open monetary positions and equity positions in a different currency than the group's functional currency.
The group's monetary position is made up of the net open position of monetary assets, monetary liabilities and off-balance sheet items expressed in foreign currency for which the entity itself assumes the risk; as well as the equity position generated by the investment in the group's subsidiaries whose functional currency is different from soles. In the first case, any appreciation/depreciation of the foreign currency would affect the consolidated income statement, on the contrary, in the case of the equity position, any appreciation/depreciation of the foreign currency will be recognized in the consolidated statement of comprehensive income.
The Group manages foreign currency exchange risk, which affects the consolidated statement of income, by monitoring and controlling currency positions exposed to movements in exchange rates. The market risk units of each subsidiary establish limits for said positions, which are approved by their own committees, and monitor and follow up the limits considering their foreign exchange trading positions, their most structural foreign exchange positions, as well as their sensitivities. Additionally, there is a monetary position limit at the Credicorp level, which is monitored and reported to the Group's Risk Committee.
On the other hand, the Group manages foreign currency exchange risk whose fluctuation is recognized in other comprehensive income, monitoring and controlling equity positions and their sensitivities, which are reported to the Group's Risk Committee.
Net foreign exchange gains/losses recognized in the consolidated statement of income are disclosed in the following items:
-Net gain on foreign exchange transactions.
-Net gain on derivatives held for trading.
-Net exchange difference result.
As of December 31, 2025, the foreign currency in which the Group has the greatest exposure is the U.S. Dollar. The free market-exchange rate for purchase and sale transactions of each U.S. Dollar as of December 31, 2025 was S/3.363 (S/3.764 as of December 31, 2024).
Foreign currency transactions are made at market exchange rates of the countries where Credicorp’s Subsidiaries are established. As of December 31, 2025 and 2024, the net open monetary position with effect on results and the equity position of the Group was as follows:
| | | | | | | | | | | | | | | | | | | | | | | | | | | | | | | | | | | |
| 2025 | | | | 2024 | | |
| U.S. Dollar | | Other currencies | | Total | | U.S. Dollar | | Other currencies | | Total |
| S/(000) | | S/(000) | | S/(000) | | S/(000) | | S/(000) | | S/(000) |
| | | | | | | | | | | |
| Total monetary assets | 92,302,409 | | | 403,672 | | | 92,706,081 | | | 93,696,321 | | | 435,107 | | | 94,131,428 | |
| Total monetary liabilities | (82,319,334) | | | (78,107) | | | (82,397,441) | | | (86,859,546) | | | (104,858) | | | (86,964,404) | |
| 9,983,075 | | | 325,565 | | | 10,308,640 | | | 6,836,775 | | | 330,249 | | | 7,167,024 | |
| | | | | | | | | | | |
Currency derivatives | (9,163,066) | | | 174,608 | | | (8,988,458) | | | (6,142,485) | | | 144,889 | | | (5,997,596) | |
| | | | | | | | | | | |
Net monetary position with effect on consolidated statement of income | 820,009 | | | 500,173 | | | 1,320,182 | | | 694,290 | | | 475,138 | | | 1,169,428 | |
| | | | | | | | | | | |
Net monetary position with effect on equity | 1,157,602 | | | 2,355,753 | | | 3,513,355 | | | 754,769 | | | 2,291,428 | | | 3,046,197 | |
| | | | | | | | | | | |
| Net monetary position | 1,977,611 | | | 2,855,926 | | | 4,833,537 | | | 1,449,059 | | | 2,766,566 | | | 4,215,625 | |
As of December 31, 2025, the monetary position with effect on equity in other currencies consists mainly of the equity of subsidiaries in Bolivianos for S/799.2 million, in Colombian pesos for S/1,031.4 million, in Chilean pesos for S/522.5 million, among other minor amounts. As of December 31, 2024, the monetary position with effect on equity was in Bolivianos S/962.7 million, in Colombian pesos S/901.3 million, in Chilean pesos S/425.7 million, among other minor items.
Starting in March 2025, Management has decided to use, for the conversion of its investments in companies incorporated in Bolivia, the exchange rate applied by financial institutions, as published on March 14, 2025 in Circular No. 857/2025 issued by the Financial System Supervisory Authority of Bolivia (ASFI), as this determines the value at which Bolivian financial institutions can buy/sell U.S. Dollars. This update has resulted in a decrease in the Group’s consolidated statement of financial position of S/2,315.2 million in assets, S/2,193.8 million in liabilities, and S/121.5 million in equity as of December 31, 2025.
The following tables show the sensitivity analysis of the main currencies to which the Group is exposed, and which affect the consolidated statement of income and other comprehensive income as of December 31, 2025 and 2024.
The analysis determines the effect of a reasonably possible variation of the exchange rate against Sol for each of the currencies independently, considering all other variables constant. A negative amount shows a potential net reduction in the consolidated income statement and other comprehensive income, while a positive amount reflects a potential increase.
The sensitivity analysis of the foreign currency position with an effect on the consolidated income statement as of December 31, 2025 and December 31, 2024 is shown below, with the U.S. Dollar as the main currency of exposure:
| | | | | | | | | | | | | | | | | |
| Currency rate sensitivity | Change in currency rates | | 2025 | | 2024 |
| % | | S/(000) | | S/(000) |
| Depreciation - | | | | | |
| Soles in relation to U.S. Dollar | 5 | | 39,048 | | | 33,061 | |
| Soles in relation to U.S. Dollar | 10 | | 74,546 | | | 63,117 | |
| | | | | |
| Appreciation - | | | | | |
| Soles in relation to U.S. Dollar | 5 | | (43,158) | | | (36,542) | |
| Soles in relation to U.S. Dollar | 10 | | (91,112) | | | (77,143) | |
The following is a sensitivity analysis of the foreign exchange position with effect on the consolidated statement of comprehensive income, with the U.S. Dollar, Boliviano, Colombian peso and Chilean peso as the main currencies of exposure. This analysis is shown as of December 31, 2025 and 2024:
| | | | | | | | | | | | | | | | | |
| Currency rate sensitivity | Change in currency rates | | 2025 | | 2024 |
| % | | S/(000) | | S/(000) |
| Depreciation - | | | | | |
| Soles in relation to U.S. Dollar | 5 | | 55,124 | | | 35,941 | |
| Soles in relation to U.S. Dollar | 10 | | 105,237 | | | 68,615 | |
| | | | | |
| Appreciation - | | | | | |
| Soles in relation to U.S. Dollar | 5 | | (60,926) | | | (39,725) | |
| Soles in relation to U.S. Dollar | 10 | | (128,622) | | | (83,863) | |
| | | | | | | | | | | | | | | | | |
| Currency rate sensitivity | Change in currency rates | | 2025 | | 2024 |
| % | | S/(000) | | S/(000) |
| Depreciation - | | | | | |
Soles in relation to Boliviano | 5 | | 38,056 | | | 45,842 | |
Soles in relation to Boliviano | 10 | | 72,652 | | | 87,516 | |
| | | | | |
| Appreciation - | | | | | |
Soles in relation to Boliviano | 5 | | (42,062) | | | (50,667) | |
Soles in relation to Boliviano | 10 | | (88,797) | | | (106,964) | |
| | | | | | | | | | | | | | | | | |
| Currency rate sensitivity | Change in currency rates | | 2025 | | 2024 |
| % | | S/(000) | | S/(000) |
| Depreciation - | | | | | |
| Soles in relation to Colombian Peso | 5 | | 49,115 | | | 42,919 | |
| Soles in relation to Colombian Peso | 10 | | 93,765 | | | 81,936 | |
| | | | | |
| Appreciation - | | | | | |
| Soles in relation to Colombian Peso | 5 | | (54,285) | | | (47,437) | |
| Soles in relation to Colombian Peso | 10 | | (114,602) | | | (100,144) | |
| | | | | | | | | | | | | | | | | |
| Currency rate sensitivity | Change in currency rates | | 2025 | | 2024 |
| % | | S/(000) | | S/(000) |
| Depreciation - | | | | | |
| Soles in relation to Chilean Peso | 5 | | 24,882 | | | 20,272 | |
| Soles in relation to Chilean Peso | 10 | | 47,501 | | | 38,702 | |
| | | | | |
| Appreciation - | | | | | |
| Soles in relation to Chilean Peso | 5 | | (27,501) | | | (22,406) | |
| Soles in relation to Chilean Peso | 10 | | (58,057) | | | (47,302) | |
30.3 Liquidity risk
Liquidity risk is the risk that the Group is unable to meet its short-term payment obligations associated with its financial liabilities when they fall due and to replace funds when they are withdrawn. In this sense, the company that is facing a liquidity crisis would be failing to comply with the obligations to pay depositors and with commitments to lend or satisfy other operational cash needs.
The Group is exposed to daily cash requirements, interbank deposits, current accounts, time deposits, use of loans, guarantees and other requirements. The Management of the Group's subsidiaries establishes limits for the minimum funds amount available to cover such cash withdrawals and on the minimum level of inter-bank and other borrowing facilities that should be in place to cover withdrawals at unexpected levels of demand. Sources of liquidity are regularly reviewed by the corresponding risk teams to maintain a wide diversification by currency, geography, type of funding, provider, producer and term.
The procedure to control the mismatching of the maturities and interest rates of assets and liabilities is fundamental to the management of the Group. It is unusual for banks to be completely matched, as transacted business is often based on uncertain terms and of different types. An unmatched position potentially enhances profitability, but also increases liquidity risk, which generates exposure to potential losses.
Maturities of assets and liabilities and the ability to replace them, at an acceptable cost are important factors in assessing the liquidity of the Group.
A mismatch, in maturity of long-term illiquid assets against short-term liabilities, exposes the consolidated statement of financial position to risks related both to rollover and to interest rates. If liquid assets do not cover maturing debts, an consolidated statement of financial position is vulnerable to a rollover risk. Furthermore, a sharp increase in interest rates can dramatically increase the cost of rolling over short-term liabilities, leading to a rapid increase in debt cost. The contractual-maturity gap report is useful in showing liquidity characteristics.
Corporate policies have been implemented for liquidity risk management by the Group. These policies are consistent with the particular characteristics of each operating segment in which each of the Group companies operate. Risk Management heads set up limits and autonomy models to determine the adequate liquidity indicators to be managed.
Commercial banking and Microfinance:
Liquidity risk exposure in Banco de Crédito del Perú, Banco de Crédito de Bolivia, Mibanco – Banco de la Microempresa and Mibanco - Banco de la Microempresa de Colombia is based on indicators such as the Internal Liquidity Coverage Ratio (RCLI, the Spanish acronym) which measures the amount of liquid assets available to meet cash outflows needs within a given stress scenario for a period of 30 days and the Internal Ratio of Stable Net Funding (RFNEI, the Spanish acronym), which is intended to guarantee that long-term assets are financed at least with a minimum number of stable liabilities within a prolonged liquidity crisis scenario and works as a minimum compliance mechanism that supplements the RCLI. The core limits of these indicators are 100.0 percent, and any excess are presented in the Credicorp Treasury Risk Committee, Credicorp Risk Committee and the Assets Liabilities Committee (ALCO) of the respective subsidiary.
Insurances and Pensions:
Insurances: Liquidity risk management in Pacífico Seguros follows a particular approach given the nature of the business. For annually renewable businesses, mainly general insurance, the emphasis of liquidity is focused on the quick availability of resources in the event of a systemic event (e.g. earthquake); for this purpose, there are minimum investment indicators in place relating to local cash/time deposits and foreign fixed-income instruments of high quality and liquidity.
On the long-term business side (life insurance), given the nature of the products offered and the contractual relationship with customers (the liquidity risk is not material); the emphasis is on maintaining sufficient flow of assets and matching their maturities with maturities of liabilities; for this purpose there are indicators that measure the asset/liability sufficiency and adequacy as well as calculations or economic capital subject to interest rate risk, this last under the methodology of Credicorp
Pensions: Liquidity risk management in AFP Prima is carried out in a differentiated manner between the fund administrator and the funds being managed. Liquidity management regarding the fund administrator is focused on hedge meeting periodic operating expense needs, which are supported with the collection of commissions. The fund administering entity does not record unexpected outflows of liquidity.
Investment banking:
Liquidity risk in Credicorp Capital Ltd principally affects the security brokerage. In managing this risk, limits of use of liquidity have been established as well as mismatching by dealing desk; follow-up on liquidity is performed on a daily basis for a short-term horizon covering the coming settlements. If short-term unmatched maturities are identified, repos are used. On the other hand, structural liquidity risk of Credicorp Capital is not significant given the low levels of debt, which is monitored regularly using financial planning tools.
In the case of ASB Bank Corp., the risk liquidity management performs through indicators such as Internal Liquidity Coverage Ratio (RCLI, the Spanish acronym) and the Internal Ratio of Stable Net Funding (RFNEI, the Spanish acronym) with the core limits of 100.0 percent and any excess is presented in the Credicorp Treasury Risk Committee, Credicorp Risk Committee and the Assets Liabilities Committee (ALCO) of the respective subsidiary.
Companies perform a liquidity risk management using the liquidity Gap or contractual maturity Gap.
The following table presents the cash outflows to be paid and cash inflows from financial assets to be collected by the Group, classified by remaining contractual maturities (including future interest payments), as of the date of the consolidated statement of financial position. The amounts disclosed in the table represent undiscounted contractual cash flows; therefore, they do not correspond to the balances presented in the statement of financial position, which represent values as of the end of the reporting period. Below, we present the detailed breakdown:
| | | | | | | | | | | | | | | | | | | | | | | | | | | | | | | | | | | | | | | | | | | | | | | | | | | | | | | | | | | | | | | | | | | | | | | |
| 2025 | | 2024 |
| Up to a month | | From 1 to 3 months | | From 3 to 12 months | | From 1 to 5 years | | Over 5 Year | | Total | | Up to a month | | From 1 to 3 months | | From 3 to 12 months | | From 1 to 5 years | | Over 5 Year | | Total |
| S/(000) | | S/(000) | | S/(000) | | S/(000) | | S/(000) | | S/(000) | | S/(000) | | S/(000) | | S/(000) | | S/(000) | | S/(000) | | S/(000) |
| | | | | | | | | | | | | | | | | | | | | | | |
| Financial assets | 56,775,341 | | | 27,123,607 | | | 64,960,715 | | | 84,472,301 | | | 57,839,707 | | | 291,171,671 | | | 48,594,583 | | | 26,281,483 | | | 65,297,685 | | | 87,773,303 | | | 54,682,216 | | | 282,629,270 | |
| | | | | | | | | | | | | | | | | | | | | | | |
| Financial liabilities by type - | | | | | | | | | | | | | | | | | | | | | | | |
| Deposits and obligations | 27,960,099 | | | 22,565,903 | | | 32,327,179 | | | 49,272,562 | | | 38,920,715 | | | 171,046,458 | | | 30,985,483 | | | 20,512,659 | | | 40,067,393 | | | 45,138,302 | | | 26,735,551 | | | 163,439,388 | |
| Payables from reverse purchase agreements and security lendings and due to banks and correspondents | 5,316,312 | | | 3,911,664 | | | 2,468,798 | | | 4,853,520 | | | 3,765,726 | | | 20,316,020 | | | 3,697,052 | | | 5,382,691 | | | 4,441,442 | | | 4,079,266 | | | 3,918,189 | | | 21,518,640 | |
| | | | | | | | | | | | | | | | | | | | | | | |
| Financial liabilities designated at fair value through profit or loss | 1,055,893 | | | – | | | – | | | – | | | – | | | 1,055,893 | | | 151,485 | | | – | | | – | | | – | | | – | | | 151,485 | |
| Bonds and notes issued | 453,752 | | | 521,224 | | | 3,251,896 | | | 9,223,703 | | | 3,436,539 | | | 16,887,114 | | | 3,185,435 | | | 2,213,666 | | | 4,260,484 | | | 6,629,122 | | | 3,062,721 | | | 19,351,428 | |
| Lease liabilities | 245,001 | | | 25,443 | | | 77,893 | | | 299,620 | | | 80,465 | | | 728,422 | | | 31,147 | | | 33,499 | | | 93,536 | | | 229,166 | | | 104,285 | | | 491,633 | |
| Other liabilities | 4,937,226 | | | 696,978 | | | 115,089 | | | 22,892 | | | 1,321,725 | | | 7,093,910 | | | 4,086,668 | | | 297,762 | | | 234,627 | | | 27,317 | | | 1,921,410 | | | 6,567,784 | |
| Total liabilities | 39,968,283 | | | 27,721,212 | | | 38,240,855 | | | 63,672,297 | | | 47,525,170 | | | 217,127,817 | | | 42,137,270 | | | 28,440,277 | | | 49,097,482 | | | 56,103,173 | | | 35,742,156 | | | 211,520,358 | |
| | | | | | | | | | | | | | | | | | | | | | | |
| Derivative financial liabilities - | | | | | | | | | | | | | | | | | | | | | | | |
| Contractual amounts receivable (inflows) | 720,741 | | | 480,314 | | | 1,080,425 | | | 1,560,389 | | | 183,588 | | | 4,025,457 | | | 1,960,811 | | | 3,420,416 | | | 4,858,373 | | | 1,013,090 | | | 20,320 | | | 11,273,010 | |
| Contractual amounts payable (outflows) | 718,192 | | | 492,021 | | | 1,103,870 | | | 1,588,286 | | | 195,688 | | | 4,098,057 | | | 1,955,324 | | | 3,416,357 | | | 4,877,328 | | | 1,034,592 | | | 21,027 | | | 11,304,628 | |
| Total liabilities | 2,549 | | | (11,707) | | | (23,445) | | | (27,897) | | | (12,100) | | | (72,600) | | | 5,487 | | | 4,059 | | | (18,955) | | | (21,502) | | | (707) | | | (31,618) | |
30.4 Non-financial risk -
A non-financial risk (NFR) is broadly defined by exclusion, encompassing any risk other than financial market, credit and liquidity risks. NFR may have substantial negative strategic, commercial, economic and/or reputational implications. They include operational risks as defined by Basel's seven types of operational risk events, as well as other significant risks such as technology, cyber, conduct, model, compliance, strategic and third-party risks.
The management of non-financial risks has become increasingly challenging due to the added complexity of rapid technological advancements, extensive process automation, greater reliance on systems rather than people, and transformational processes. These changes in the way financial institutions operate have led to new risk exposures, including attacks affecting the Group's services, data theft and online fraud.
30.5 Operational risk -
Operational risk is the possibility of incurring losses due to inadequate processes, human error, information technology failures, third party relationships or external events. These risks can result in financial losses and have
legal or regulatory compliance consequences, but they exclude strategic or reputational risk (except for companies under Colombian regulations, where reputational risk is included in operational risk).
Operational risks are categorized into internal fraud, external fraud, labor relations and job security, customer relations, business products and practices, damage to material assets, business and systems interruption, and failures in process, execution, delivery and management.
One of the Group’s pillars is to cultivate an efficient risk culture. To achieve this, it records operational risks and their respective process controls. The risk map allows for the monitoring, prioritization and proposed treatment of these risks according to established governance. Additionally, the Group actively manages cybersecurity and fraud prevention, aligning with best international practices.
The business continuity management system enables the establishment, implementation, operation, monitoring, review, maintenance, and improvement of business continuity based on best practices and regulatory requirements. The Group implements recovery strategies for resources that support critical products and services, which are periodically tested to measure the effectiveness of these strategies.
In managing operational risk, cybersecurity, fraud prevention and business continuity, corporate guidelines are utilized, methodologies and best practices are shared among the Group's companies.
We also have recovery mechanisms for the materialization of operational risks, primarily through insurance policies contracted for all Credicorp Group companies in the international market. These policies cover losses due to fraud events, professional liability, cyber risks, and directors' liability. Additionally, we have insurance policies individually contracted by Credicorp companies in the local market that cover losses due to material damage to physical assets and civil liability.
30.6 Cybersecurity -
Credicorp directs its efforts towards cost-efficient strategies to minimize the exposure to cybersecurity risk. To this end, it implements different levels of controls adapted to the different areas and potentially vulnerable companies. In addition, it maintains a significant investment program that ensures the availability of technologies and processes necessary to protect the Group's operations and assets.
Within the framework of cybersecurity governance, the Group has a Credicorp CISO and a corporate team dedicated to implementing and ensuring compliance with the cybersecurity strategy across all companies. A corporate strategy and plan has been established that includes implementation priorities and improvements, adapted to each company’s specific context. These lines of work comprise the Cybersecurity Strategy, which is constantly reviewed considering the global scenario, risk profile, standards, frameworks and regulations, with the aim of ensuring business continuity, resilience and data privacy. In addition, a robust cybersecurity framework is adopted that allows adjusting cybersecurity controls for each Group company, managing and remediating vulnerabilities in an early and timely manner.
The Group also has an awareness and continuous training program for its employees, fostering a culture of cybersecurity awareness in all companies. In addition, cybersecurity indicators are used to ensure alignment between operations and the Group's business strategy.
Group companies have third-party governance policies in place, which establish the security requirements to be met by service providers, compliance with which is mandatory.
Finally, asset information security management is carried out through a systematic process, documented and known throughout the organization, following best practices and regulatory requirements. Guidelines based on policies and procedures are designed and developed to guarantee the availability, confidentiality and integrity of the information.
30.7 Corporate Security, Investigations and Cybercrime Management -
As part of the management of non-financial risks, the Corporate Security, Investigations and Cybercrime Area is responsible for detecting and responding to incidents involving fraud, cybercrime and physical security.
These efforts led out by specialized teams in investigations, cybercrime, electronic security, disaster management, and strategic intelligence activities, including social conflicts. Likewise, new capabilities have been incorporated into our infrastructure’s video surveillance system, which not only ensures compliance with new standards and regulations but also facilitates the integration of next-generation video intelligence functions. These include intelligent cameras supported by algorithms, analytics, and artificial intelligence, thus optimizing risk management with the expanded reach provided by current technology.
Finally, we contribute to the security of the Financial System are made through collaborative efforts carried out at both the local and regional levels. At the local level, these efforts are channeled through participation in the Association of Banks of Peru (ASBANC, by its acronym in Spanish), while at the Latin American level, they are conducted through the Committee of Security Experts of the Latin American Federation of Banks (FELABAN, by its acronym in Spanish).
30.8 Model Risk -
The Group uses models for different purposes such as credit admission, capital calculation, behavior, provisions, market risk, liquidity, among others.
Model risk is defined as the probability of loss resulting from decisions (credit, market, among others) based on the use of poorly designed and/or poorly implemented models. The sources that generate this risk are mainly: deficiencies in data, errors in the model (from design to implementation), use of the model.
The management of model risk is proportional to the importance of each model. In this sense, a concept of “tiering” (measurement system that orders the models depending to the importance according to the impact on the business) is defined as the main attribute to synthesize the level of importance or relevance of a model, from which is determined the intensity of the model risk management processes to be followed.
Model risk management is structured around a set of processes known as the life cycle of the model. The definition of phases of the life cycle of the model in the Group is detailed below: Identification, Planning, Development, Internal Validation, Approval, Implementation and use, and Monitoring and control.
30.9 Risk of the insurance activity -
The main risk faced by the Group in insurance contracts is that the actual cost of claims and payments, or the timing thereof, differ from expectations. This is influenced by the frequency of claims, the severity of claims, the actual benefits paid and the subsequent development of claims over the long term. The Group's objective is therefore to ensure that sufficient reserves are available to cover these liabilities.
Risk exposure is mitigated by diversification through a large portfolio of insurance contracts and by having different lines of business. Risks are also mitigated by careful selection and implementation of strategic underwriting guidelines, as well as the use of reinsurance agreements. Reinsurance underwriting is diversified in such a way that the Group is not dependent on any particular reinsurer; likewise, the Group's operations are not dependent on any particular reinsurance contract.
Life insurance contracts -
The main risks that the Group is exposed to are mortality, morbidity, longevity, investment yield and flow, losses arising from policies due to the expense incurred being different than expected, and the policyholder decision; all of which, do not vary significantly in relation to the location of the risk insured by the Group, type of risk insured or industry.
The Group’s underwriting strategy is designed to ensure that risks are well diversified in terms of type of risk and level of insured benefits. This is achieved through diversification across insurable risks, the use of medical screening in order to ensure that pricing takes account of current health conditions and family medical history, regular review of actual claims experience and product pricing, as well as detailed claims handling procedures. Underwriting limits are in place to enforce appropriate risk selection criteria. For example, the Group has the right not to renew individual policies, it can impose deductibles and it has the right to reject the payment of fraudulent claims.
For contracts when death or disability is the insured risk, the significant factors that could increase the overall frequency of claims are epidemics, widespread changes in lifestyle and natural disasters, resulting in more claims than expected.
For retirement, survival and disability annuities contracts, the most significant factor is continuing improvement in medical science and social conditions that increase longevity.
Non-life insurance contracts (general insurance and healthcare) -
The Group mainly issues the following types of non-life general insurance contracts: automobile, technical branches, business and healthcare insurances. Healthcare contracts provide medical expense cover to policyholders. Risks under non-life insurance policies usually cover 12 months.
For general insurance contracts the most significant risks arise from climate changes, natural disasters and other type of damages. For healthcare contracts the most significant risks arise from lifestyle changes, epidemics and medical science and technology improvements. The above risk exposures are mitigated by diversification across a large portfolio of insurance contracts and by having different lines of business. The sensitivity of risk is improved by careful selection and implementation of underwriting strategies of insurance contracts, which are designed to ensure that risks are diversified in terms of type of risks and level of insured benefits. This is achieved, in various cases, through diversification across industry sectors and geographic location.
Furthermore, strict claim review policies to assess all new and ongoing claims and in process of settlement, regular detailed review of claims handling procedures and frequent investigation of possible fraudulent claims are all policies and procedures put in place to reduce the Group’s risk exposure. Insurance contracts also entitle the Group to pursue third parties for payment of some or all costs. Also, the Group actively manages and promptly pursues claims, in order to reduce its exposure to unpredictable future developments that can negatively impact the Group.
The Group has also limited its exposure by imposing maximum claim amounts on certain contracts as well as the use of reinsurance arrangements in order to limit its exposure to catastrophic events.
Claims development table:
The following table presents the estimates of accumulated incurred claims measured under the PAA, mainly as of December 31, 2025:
| | | | | | | | | | | | | | | | | | | | | | | | | | | | | | | | | | | | | | | | | | | | | | | | | | | | | | | | | | | | | | | | | |
| 2016 | | 2017 | | 2018 | | 2019 | | 2020 | | 2021 | | 2022 | | 2023 | | 2024 | | 2025 | | Total |
| S/(000) | | S/(000) | | S/(000) | | S/(000) | | S/(000) | | S/(000) | | S/(000) | | S/(000) | | S/(000) | | S/(000) | | S/(000) |
| Gross estimates of the undiscounted amount of the claims: | | | | | | | | | | | | | | | | | | | | | |
| At the end of the claim year | 1,923,936 | | | 1,620,489 | | | 1,179,383 | | | 1,426,645 | | | 1,597,362 | | | 2,162,977 | | | 1,397,741 | | | 1,680,689 | | | 1,399,261 | | | 1,490,574 | | | 15,879,057 | |
| 1 year later | 1,390 | | | 3,450 | | | 3,561 | | | 2,321 | | | 9,853 | | | 44,296 | | | 70,983 | | | 104,804 | | | 254,237 | | | 199,398 | | | 694,293 | |
| 2 years later | 1,447 | | | 83 | | | 2,196 | | | 2,788 | | | 2,045 | | | 8,055 | | | 30,262 | | | 72,363 | | | 101,636 | | | 98,789 | | | 319,664 | |
| 3 years later | 2,162 | | | 27 | | | 78 | | | 2,462 | | | 2,424 | | | 2,109 | | | 9,012 | | | 27,570 | | | 72,489 | | | 32,038 | | | 150,371 | |
| 4 years later | 232 | | | 622 | | | 41 | | | 130 | | | 1,513 | | | 3,386 | | | 2,211 | | | 9,711 | | | 23,323 | | | 17,705 | | | 58,874 | |
| 5 years later | – | | | 179 | | | 600 | | | 51 | | | 102 | | | 1,671 | | | 4,586 | | | 1,821 | | | 27,137 | | | 15,608 | | | 51,755 | |
| 6 years later | – | | | – | | | 158 | | | 968 | | | 20 | | | 27 | | | 2,639 | | | 3,139 | | | 2,454 | | | 11,794 | | | 21,199 | |
| 7 years later | – | | | – | | | – | | | 169 | | | 770 | | | 27 | | | 89 | | | 3,089 | | | 2,923 | | | 8,417 | | | 15,484 | |
| 8 years later | – | | | – | | | – | | | – | | | 216 | | | 350 | | | 13 | | | 15 | | | 2,711 | | | 11,742 | | | 15,047 | |
| 9 years later | – | | | – | | | – | | | – | | | – | | | 466 | | | 1,501 | | | 480 | | | 737 | | | 525 | | | 3,709 | |
| Accumulated gross claims and other directly attributable expenses paid for the year of occurrence | 1,929,167 | | | 1,624,850 | | | 1,186,017 | | | 1,435,534 | | | 1,614,305 | | | 2,223,364 | | | 1,519,037 | | | 1,903,681 | | | 1,886,908 | | | 1,886,590 | | | 17,209,453 | |
| Liabilities / Gross Obligations accumulated by claims | 12,904 | | | 6,087 | | | 12,615 | | | 11,535 | | | 38,043 | | | 148,659 | | | 233,355 | | | 346,916 | | | 576,782 | | | 1,058,432 | | | 2,445,328 | |
| Discount event | (1,570) | | | (756) | | | (1,377) | | | (1,164) | | | (3,273) | | | (8,802) | | | (18,875) | | | (25,155) | | | (37,617) | | | (50,549) | | | (149,138) | |
| Effect of Risk Adjustment for non-financial risk | – | | | – | | | – | | | – | | | – | | | – | | | – | | | – | | | 3,540 | | | 17,589 | | | 21,129 | |
| Gross LIC of the Temporary Regime and Definitive Regime | – | | | – | | | – | | | – | | | – | | | – | | | – | | | – | | | – | | | – | | | 32,599 | |
| Gross provision for incurred claims | 11,334 | | | 5,331 | | | 11,238 | | | 10,371 | | | 34,770 | | | 139,857 | | | 214,480 | | | 321,761 | | | 542,705 | | | 1,025,472 | | | 2,349,918 | |
As of December 31, 2025, liabilities for incurred claims amounting to S/3,686.0 million also include liabilities related to the pension and SCTR businesses of approximately S/1,223.0 million, as well as other minor liabilities amounting to S/113.0 million, the uncertainty regarding the amount and timing of payments of which is typically resolved within a period of less than one year.
The following table presents the estimates of accumulated incurred claims measured under the PAA, mainly as of December 31, 2024:
| | | | | | | | | | | | | | | | | | | | | | | | | | | | | | | | | | | | | | | | | | | | | | | | | | | | | | | | | | | | | | | | | |
| 2015 | | 2016 | | 2017 | | 2018 | | 2019 | | 2020 | | 2021 | | 2022 | | 2023 | | 2024 | | Total |
| S/(000) | | S/(000) | | S/(000) | | S/(000) | | S/(000) | | S/(000) | | S/(000) | | S/(000) | | S/(000) | | S/(000) | | S/(000) |
| Gross estimates of the undiscounted amount of the claims: | | | | | | | | | | | | | | | | | | | | | |
| At the end of the claim year | 1,637,838 | | | 1,047,428 | | | 1,602,775 | | | 1,152,556 | | | 1,426,087 | | | 1,548,529 | | | 2,106,530 | | | 1,379,742 | | | 1,564,601 | | | 1,491,978 | | | 14,958,064 | |
| 1 year later | 2,458 | | | 1,999 | | | 2,917 | | | 5,830 | | | 15,447 | | | 21,123 | | | 107,965 | | | 167,943 | | | 172,015 | | | 670,047 | | | 1,167,744 | |
| 2 years later | 2,052 | | | 164 | | | 1,889 | | | 3,469 | | | 4,180 | | | 11,051 | | | 39,861 | | | 127,303 | | | 85,383 | | | 217,606 | | | 492,958 | |
| 3 years later | 3,390 | | | 82 | | | 92 | | | 2,122 | | | 2,880 | | | 3,500 | | | 11,137 | | | 31,737 | | | 59,927 | | | 94,077 | | | 208,944 | |
| 4 years later | – | | | 1,533 | | | 46 | | | 90 | | | 2,389 | | | 4,431 | | | 4,203 | | | 9,776 | | | 22,453 | | | 67,570 | | | 112,491 | |
| 5 years later | – | | | – | | | 843 | | | 75 | | | 144 | | | 3,446 | | | 6,419 | | | 4,076 | | | 9,912 | | | 17,756 | | | 42,671 | |
| 6 years later | – | | | – | | | – | | | 811 | | | 81 | | | 111 | | | 5,158 | | | 4,783 | | | 4,248 | | | 38,738 | | | 53,930 | |
| 7 years later | – | | | – | | | – | | | – | | | 1,419 | | | 30 | | | 30 | | | 2,316 | | | 3,339 | | | 5,486 | | | 12,620 | |
| 8 years later | – | | | – | | | – | | | – | | | – | | | 1,028 | | | 46 | | | 92 | | | 2,328 | | | 3,322 | | | 6,816 | |
| 9 years later | – | | | – | | | – | | | – | | | – | | | – | | | 297 | | | 854 | | | 244 | | | 2,557 | | | 3,952 | |
| Accumulated gross claims and other directly attributable expenses paid for the year of occurrence | 1,645,738 | | | 1,051,206 | | | 1,608,562 | | | 1,164,953 | | | 1,452,627 | | | 1,593,249 | | | 2,281,646 | | | 1,728,622 | | | 1,924,450 | | | 2,609,137 | | | 17,060,190 | |
| Liabilities / Gross Obligations accumulated by claims | 8,317 | | | 6,919 | | | 7,909 | | | 18,380 | | | 30,226 | | | 56,998 | | | 222,417 | | | 466,484 | | | 454,110 | | | 1,698,314 | | | 2,970,074 | |
| Discount event | (1,614) | | | (1,021) | | | (1,015) | | | (1,900) | | | (2,849) | | | (4,729) | | | (15,369) | | | (34,248) | | | (34,104) | | | (93,068) | | | (189,917) | |
| Effect of Risk Adjustment for non-financial risk | – | | | – | | | – | | | – | | | – | | | – | | | – | | | – | | | – | | | 28,729 | | | 28,729 | |
| Gross LIC of the Temporary Regime and Definitive Regime | – | | | – | | | – | | | – | | | – | | | – | | | – | | | – | | | – | | | – | | | 39,082 | |
| Gross provision for incurred claims | 6,703 | | | 5,898 | | | 6,894 | | | 16,480 | | | 27,377 | | | 52,269 | | | 207,048 | | | 432,236 | | | 420,006 | | | 1,633,975 | | | 2,847,968 | |
As of December 31, 2024, liabilities for incurred claims amounting to S/3,857.0 million also include liabilities related to the pension and SCTR businesses of approximately S/1,001.0 million, as well as other minor liabilities amounting to S/8.0 million, the uncertainty regarding the amount and timing of payments of which is typically resolved within a period of less than one year.
30.10 Capital management -
The Group maintains an actively managed capital base to cover risks inherent in its business. The adequacy of the Group’s capital is monitored using, among other measures, the rules and ratios established by the SBS, the supervising authority of its major subsidiaries and for consolidation purposes. Furthermore, capital management responds to market expectations in relation to the solvency of the Group and to support the growth of the businesses considered in the strategic planning. In this way, the capital maintained by the Group enables it to assume unexpected losses in normal conditions and conditions of severe stress.
The Group’s objectives when managing capital are: (i) to comply with the capital requirements set by the regulators of the markets where the entities within the Group operate; (ii) to safeguard the Group’s ability to continue as a going concern so that it can continue to provide returns for shareholders and benefits for other stakeholders; and (iii) to maintain a strong capital base to support the development of its business, in line with the limits and tolerances established in the declaration of Risk Appetite.
As of December 31, 2025, and 2024, the regulatory capital for the subsidiaries amounted to approximately S/43,813.2 million and S/40,009.5 million, respectively. The regulatory capital has been determined in accordance with SBS regulations in force as of said dates. Under the SBS regulations, the Group’s regulatory capital exceeds by approximately S/11,466.7 million the minimum regulatory capital required as of December 31, 2025 (approximately S/10,885.9 million as of December 31, 2024).
30.11 Fair values –
a) Financial instruments recorded at fair value and fair value hierarchy –
The following table analyses financial instruments measured at fair value at the reporting date, by the level in the fair value hierarchy into which the fair value measurement is categorized. The amounts are based on the values recognized in the consolidated statement of financial position:
| | | | | | | | | | | | | | | | | | | | | | | | | | | | | | | | | | | | | | | | | | | | | | | | | | |
| | 2025 | | 2024 |
| | Level 1 | | Level 2 | | Level 3 | | Total | | Level 1 | | Level 2 | | Level 3 | | Total |
| | S/(000) | | S/(000) | | S/(000) | | S/(000) | | S/(000) | | S/(000) | | S/(000) | | S/(000) |
| Financial assets | | | | | | | | | | | | | | | | |
| Derivative financial instruments: | | | | | | | | | | | | | | | | |
| Foreign currency forwards | | – | | | 547,175 | | | – | | | 547,175 | | | – | | | 161,495 | | | – | | | 161,495 | |
| Interest rate swaps | | – | | | 455,613 | | | – | | | 455,613 | | | – | | | 489,602 | | | – | | | 489,602 | |
| Currency swaps | | – | | | 223,448 | | | – | | | 223,448 | | | – | | | 219,648 | | | – | | | 219,648 | |
| Foreign exchange options | | – | | | 5,532 | | | – | | | 5,532 | | | – | | | 3,018 | | | – | | | 3,018 | |
| Cross currency swaps | | – | | | – | | | – | | | – | | | – | | | 29,551 | | | – | | | 29,551 | |
| Futures | | – | | | 97 | | | – | | | 97 | | | – | | | 1,477 | | | – | | | 1,477 | |
| | – | | | 1,231,865 | | | – | | | 1,231,865 | | | – | | | 904,791 | | | – | | | 904,791 | |
| | | | | | | | | | | | | | | | |
| Investments at fair value through profit of loss | | 2,499,724 | | | 681,939 | | | 1,775,573 | | | 4,957,236 | | | 2,512,497 | | | 625,116 | | | 1,577,730 | | | 4,715,343 | |
| Financial assets at fair value through profit of loss | | 985,836 | | | 6,593 | | | – | | | 992,429 | | | 930,627 | | | 2,107 | | | – | | | 932,734 | |
| | | | | | | | | | | | | | | | |
| Investments at fair value through other comprehensive income: | | | | | | | | | | | | | | | | |
| Debt Instruments | | | | | | | | | | | | | | | | |
| Corporate bonds | | 4,512,131 | | | 8,841,584 | | | 90,084 | | | 13,443,799 | | | 7,094,584 | | | 7,292,412 | | | – | | | 14,386,996 | |
| Government bonds | | 10,079,754 | | | 2,808,308 | | | – | | | 12,888,062 | | | 11,565,309 | | | 902,942 | | | – | | | 12,468,251 | |
| Certificates of deposit BCRP | | 390,875 | | | 10,493,155 | | | – | | | 10,884,030 | | | – | | | 11,435,757 | | | – | | | 11,435,757 | |
| Securitization instruments | | – | | | 1,003,639 | | | – | | | 1,003,639 | | | – | | | 714,738 | | | – | | | 714,738 | |
| Subordinated bonds | | 100,258 | | | 95,177 | | | – | | | 195,435 | | | 42,493 | | | 127,455 | | | – | | | 169,948 | |
| Negotiable certificates of deposit | | – | | | 246,569 | | | – | | | 246,569 | | | – | | | 438,988 | | | – | | | 438,988 | |
| Other instruments | | 10,876 | | | 168,577 | | | 102,741 | | | 282,194 | | | – | | | 282,104 | | | 98,592 | | | 380,696 | |
| Equity instruments | | 2 | | | 77,894 | | | 12,425 | | | 90,321 | | | 15,307 | | | 118,735 | | | 13,222 | | | 147,264 | |
| | 15,093,896 | | | 23,734,903 | | | 205,250 | | | 39,034,049 | | | 18,717,693 | | | 21,313,131 | | | 111,814 | | | 40,142,638 | |
| | | | | | | | | | | | | | | | |
| Total financial assets | | 18,579,456 | | | 25,655,300 | | | 1,980,823 | | | 46,215,579 | | | 22,160,817 | | | 22,845,145 | | | 1,689,544 | | | 46,695,506 | |
| | | | | | | | | | | | | | | | |
| Financial liabilities | | | | | | | | | | | | | | | | |
| Derivatives financial instruments: | | | | | | | | | | | | | | | | |
| Interest rate swaps | | – | | | 396,355 | | | – | | | 396,355 | | | – | | | 353,647 | | | – | | | 353,647 | |
| Currency swaps | | – | | | 346,591 | | | – | | | 346,591 | | | – | | | 230,848 | | | – | | | 230,848 | |
| Foreign currency forwards | | – | | | 300,695 | | | – | | | 300,695 | | | – | | | 210,947 | | | – | | | 210,947 | |
| Cross currency swaps | | – | | | – | | | – | | | – | | | – | | | 15,491 | | | – | | | 15,491 | |
| Foreign exchange options | | – | | | 4,263 | | | – | | | 4,263 | | | – | | | 8,420 | | | – | | | 8,420 | |
| Futures | | – | | | 3 | | | – | | | 3 | | | – | | | 120 | | | – | | | 120 | |
| | – | | | 1,047,907 | | | – | | | 1,047,907 | | | – | | | 819,473 | | | – | | | 819,473 | |
| Financial liabilities at fair value through profit or loss | | – | | | 1,055,893 | | | – | | | 1,055,893 | | | – | | | 151,485 | | | – | | | 151,485 | |
| | | | | | | | | | | | | | | | |
| Total financial liabilities | | – | | | 2,103,800 | | | – | | | 2,103,800 | | | – | | | 970,958 | | | – | | | 970,958 | |
Financial instruments classified within Level 1 are those measured based on quoted prices obtained in an active market. A financial instrument is considered to be quoted in an active market if prices are readily and regularly available from a centralized trading mechanism, dealer, broker, industry group, pricing service, or regulatory agency, and such prices are regularly derived from arm’s-length market transactions.
Financial instruments classified within Level 2 are measured based on market inputs. This category includes instruments valued using: market prices of similar instruments, whether from active or inactive markets, and other valuation techniques (models) in which all significant inputs are directly or indirectly observable in the market.
Below, we present a description of how the fair value of the Group’s main financial instruments is determined when valuation techniques with observable market inputs are used, incorporating Credicorp’s estimates regarding the assumptions that market participants would use to value these instruments:
Valuation of derivative financial instruments –
Derivatives valued using standard models fed with observable market data (such as interest rate curves, forwards, credit spreads, and implied volatilities) are classified within Level 2.
Interest rate and foreign exchange swaps, as well as foreign exchange forward contracts, are valued using valuation techniques based on observable market inputs. The valuation techniques most frequently used include forward and swap valuation models through present value calculations. These models incorporate various inputs, including counterparties’ credit quality, spot exchange rates, forward rates, and interest rate curves. Options are valued using recognized and generally accepted market models.
A credit valuation adjustment (“CVA”) is applied to the exposure of over-the-counter (OTC) derivatives to consider counterparty default risk when measuring the fair value of derivatives. CVA represents the market cost of protection required to hedge counterparty credit risk in this type of derivatives portfolio. CVA is calculated by multiplying the probability of default (PD), loss given default (LGD), and expected exposure (EE) at the time of default.
A debit valuation adjustment (“DVA”) is applied to incorporate Credicorp’s own credit risk into the fair value of its derivatives (i.e., the risk that the Group may fail to meet its contractual obligations), using the same calculation methodology as for CVA.
As of December 31, 2025, the balance of derivative financial instruments receivable and payable amounts to S/1,231.9 million and S/1,047.9 million, respectively (see Note 12(c)), resulting in a DVA and CVA adjustment of approximately S/3.0 million and S/4.8 million respectively. The net effect of both adjustments has been recognized in the consolidated statement of income as a loss of approximately S/0.9 million.
As of December 31, 2024, the balance of derivative financial instruments receivable and payable amounts to S/904.8 million and S/819.5 million, respectively (see Note 12(c)), resulting in a DVA and CVA adjustment of approximately S/3.0 million and S/5.7 million, respectively. The net effect of both adjustments has been recognized in the consolidated statement of income as a loss of approximately S/1.2 million.
-Valuation of debt instruments classified as “fair value through other comprehensive income” and included in Level 1
Financial instruments classified in Level 1 of the fair value hierarchy are measured using quoted (unadjusted) prices in active markets that are directly observable and accessible to the entity at the measurement date.
In these cases, fair value is determined directly from executable market prices derived from frequent and representative transactions carried out under arm’s length conditions, without the need to apply adjustments or use valuation models.
Within this category are sovereign bonds with frequent daily trading, Central Bank Certificates of Deposit issued on the same day, or cases where there is sufficient evidence of observable market transactions.
-Valuation of debt securities classified in the category “at fair value through other comprehensive income” and included in level 2
Instruments are classified within this level when fair value is determined using a valuation model that incorporates observable market inputs, such as sovereign yield curves, benchmark interest rates, credit spreads, or prices of comparable liquid instruments. This criterion applies to instruments whose valuation is based on publicly available and representative information, without requiring significant subjective adjustments.
For example, Central Bank of Peru (BCRP) Certificates of Deposit classified as Level 2, corporate bonds, finance lease bonds, and government treasury bonds are valued by calculating their Net Present Value (NPV) through the discounting of their cash flows, using the relevant zero-coupon yield curves to discount the flows in the respective currency and considering observable market transactions.
Other debt instruments are valued using valuation techniques based on assumptions supported by observable prices from current market transactions, with prices obtained from pricing providers. However, when prices are not determined in an active market, fair value is based on broker quotations and on assets valued using models in which most assumptions are observable in the market.
-Valuation of financial instruments included in level 3
They are measured using valuation techniques (internal models) based on assumptions that are not supported by observable transaction prices in the market for the same instrument, nor by available market data.
In this regard, no significant differences were observed between the estimated fair values and their respective carrying amounts.
b) Financial instruments not measured at fair value -
We present below the disclosure of the comparison between the carrying amounts and fair values of the financial instruments, which are not measured at fair value, presented in the consolidated statement of financial position by level of the fair value hierarchy:
| | | | | | | | | | | | | | | | | | | | | | | | | | | | | | | | | | | | | | | | | | | | | | | | | | | | | | | | | | | |
| 2025 | | 2024 |
| Level 1 | | Level 2 | | Level 3 | | Fair value | | Carrying amount | | Level 1 | | Level 2 | | Level 3 | | Fair value | | Carrying amount |
| S/(000) | | S/(000) | | S/(000) | | S/(000) | | S/(000) | | S/(000) | | S/(000) | | S/(000) | | S/(000) | | S/(000) |
| Assets | | | | | | | | | | | | | | | | | | | |
| Cash and due from banks | – | | | 49,044,457 | | | – | | | 49,044,457 | | | 49,044,457 | | | – | | | 47,655,196 | | | – | | | 47,655,196 | | | 47,655,196 | |
| Cash collateral, reverse repurchase agreements and securities borrowing | – | | | 2,177,200 | | | – | | | 2,177,200 | | | 2,177,200 | | | – | | | 1,033,177 | | | – | | | 1,033,177 | | | 1,033,177 | |
| Investments at amortized cost | 8,292,014 | | | 441,900 | | | – | | | 8,733,914 | | | 8,813,657 | | | 8,146,745 | | | 296,793 | | | – | | | 8,443,538 | | | 8,967,877 | |
| Loans, net | – | | | 142,315,004 | | | – | | | 142,315,004 | | | 142,315,004 | | | – | | | 137,737,296 | | | – | | | 137,737,296 | | | 137,737,296 | |
| Due from customers on banker’s acceptances | – | | | 345,906 | | | – | | | 345,906 | | | 345,906 | | | – | | | 528,184 | | | – | | | 528,184 | | | 528,184 | |
Other assets (*) | – | | | 5,102,543 | | | – | | | 5,102,543 | | | 5,102,543 | | | – | | | 3,269,019 | | | – | | | 3,269,019 | | | 3,269,019 | |
| Total | 8,292,014 | | | 199,427,010 | | | – | | | 207,719,024 | | | 207,798,767 | | | 8,146,745 | | | 190,519,665 | | | – | | | 198,666,410 | | | 199,190,749 | |
| | | | | | | | | | | | | | | | | | | |
| Liabilities | | | | | | | | | | | | | | | | | | | |
| Deposits and obligations | – | | | 170,401,633 | | | – | | | 170,401,633 | | | 170,401,633 | | | – | | | 161,842,066 | | | – | | | 161,842,066 | | | 161,842,066 | |
| Payables on repurchase agreements and securities lending | – | | | 8,243,787 | | | – | | | 8,243,787 | | | 8,243,787 | | | – | | | 9,060,710 | | | – | | | 9,060,710 | | | 9,060,710 | |
| Due to Banks and correspondents and other entities | – | | | 10,651,649 | | | – | | | 10,651,649 | | | 10,675,238 | | | – | | | 10,820,211 | | | – | | | 10,820,211 | | | 10,754,385 | |
Due from customers on banker’s acceptances | – | | | 345,906 | | | – | | | 345,906 | | | 345,906 | | | – | | | 528,184 | | | – | | | 528,184 | | | 528,184 | |
| Lease liabilities | – | | | 612,259 | | | – | | | 612,259 | | | 612,259 | | | – | | | 404,817 | | | – | | | 404,817 | | | 404,817 | |
| Bond and notes issued | – | | | 14,346,976 | | | – | | | 14,346,976 | | | 14,025,535 | | | – | | | 17,230,157 | | | – | | | 17,230,157 | | | 17,268,443 | |
Other liabilities (**) | – | | | 5,700,097 | | | – | | | 5,700,097 | | | 5,700,097 | | | – | | | 5,220,127 | | | – | | | 5,220,127 | | | 5,220,127 | |
| Total | – | | | 210,302,307 | | | – | | | 210,302,307 | | | 210,004,455 | | | – | | | 205,106,272 | | | – | | | 205,106,272 | | | 205,078,732 | |
(*) Corresponds to receivables, margin call, receivables from sale of investments and operations in process.
(**) Corresponds to accounts payable, salaries and other personnel expenses, accounts payable for acquisitions of investments, operations in process, allowance for indirect loan losses and dividends payable
The methodologies and assumptions used by the Group to determine fair values depend on the terms and risk characteristics of the various financial instruments and include the following:
(i) Long-term fixed-rate and variable-rate loans are evaluated by the Group based on parameters such as interest rates, specific country risk factors, and individual creditworthiness of the customer and the risk characteristics of the financed project. Based on this evaluation, allowances are considered for the incurred losses of these loans. As of December 31, 2025, and 2024, the carrying amounts of loans, net of allowances, were not materially different from their calculated fair values.
(ii) Assets for which fair values approximate their carrying value - For financial assets and financial liabilities that are liquid or have a short-term maturity (less than three months) it is assumed that the carrying amounts approximate to their fair values. This assumption is also applicable to time deposits, savings accounts without a specific maturity and variable rate financial instruments.
(iii) Fixed rate financial instruments - The fair value of fixed rate financial assets and liabilities carried at amortized cost are estimated by comparing market interest rates when they were first recognized with current market rates offered for similar financial instruments. The estimated fair value of fixed interest-bearing deposits is based on discounted cash flows using prevailing market interest rates for financial instruments with similar credit risk and maturity. For quoted debt issued the fair values are calculated based on quoted market prices. When quoted market prices are not available, a discounted cash flow model is used based on a current interest rate yield curve appropriate for the remaining term to maturity.
30.12 Fiduciary activities, management of funds and pension funds -
The Group provides custody, trustee, investment management and advisory services to third parties; therefore, the Group makes allocations and purchase and sale decisions in relation to a wide range of financial instruments. Assets that are held in a fiduciary capacity are not included in these consolidated financial statements. These services give rise to the risk that the Group will be accused of mismanagement or under-performance.
As of December 31, 2025, and 2024, the value of the net assets under administration off the balance sheet (in millions of soles) is as follows:
| | | | | | | | | | | |
| 2025 | | 2024 |
| Investment funds and mutual funds | 66,353 | | | 64,430 | |
Equity managed | 51,368 | | | 39,372 | |
| Pension funds | 33,538 | | | 32,437 | |
| Bank trusts | 5,155 | | | 6,120 | |
| Total | 156,414 | | | 142,359 | |
31 COMMITMENTS AND CONTINGENCIES
i) Government Investigations -
In 2019, the former chairman and the current vice chairman of the Board of Directors of Credicorp, in their respective capacities as Chairman of the Board and as a Director of BCP, were summoned as witnesses by Peruvian prosecutors, along with 26 other Peruvian business executives, to testify in connection with a judicial investigation that was being carried out regarding contributions made to the electoral campaign of a political party in the 2011 Peruvian presidential elections. The former chairman informed prosecutors that in 2010 and 2011 Credicorp made donations totaling US$3.65 million to the Fuerza 2011 campaign (in total amounts of US$1.7 million in 2010 and US$1.95 million in 2011). These contributions were made in coordination with the General Manager of Credicorp at that time. While the amount of these contributions exceeded the limits then permitted under Peruvian electoral law, the law in place at that time provided no sanction for contributors, and instead only for the recipient of the campaign contribution.
The former chairman also informed prosecutors that in 2016, three subsidiaries of Credicorp (BCP, Mibanco and Grupo Pacífico) made donations totaling S/711,000 (approximately US$200,000) to the “Peruanos Por el Kambio” campaign. These contributions were made in accordance with Peruvian electoral law and Credicorp’s own political contributions guidelines, which were adopted in 2015.
The Peruvian Superintendencia del Mercado de Valores (“SMV”, for its Spanish acronym) initiated sanctioning proceedings against Credicorp for failing to timely disclose to the market the political campaign contributions made in 2011 and 2016. The SMV also initiated sanctioning proceedings against three subsidiaries of Credicorp (BCP, Mibanco and Grupo Pacífico) for failing to timely disclose to the market the political campaign contributions made in connection with the 2016 presidential elections. The SMV notified Credicorp, BCP, Mibanco and Grupo Pacífico of first‑instance resolutions in connection with these proceedings. Such resolutions imposed pecuniary sanctions (fines) on Credicorp and its three subsidiaries. Credicorp, BCP, Mibanco and Grupo Pacífico appealed the resolutions. As the appeals were not resolved within the timeframe established by law, Credicorp and each of the three subsidiaries filed contentious‑administrative lawsuits against the SMV’s resolutions due to negative administrative silence. Notwithstanding the foregoing, Credicorp and its three subsidiaries paid the fines imposed by the SMV in compliance with Peruvian law. In the Judiciary, first‑instance court rulings declared the aforementioned lawsuits unfounded. Credicorp and its three subsidiaries appealed such rulings, and therefore the first‑instance decisions are currently under review at the second‑instance level. In the case of Credicorp, a second‑instance ruling issued in January 2026 confirmed the first‑instance decision, against which Credicorp has filed a cassation appeal. Accordingly, as of the date of these financial statements, all four cases remain pending a final resolution by the Judiciary.
Credicorp is of the opinion that the contributions made and the sanctioning processes related to the SMV do not represent a significant risk of material liability for the Group. Furthermore, these processes may not have a
negative effect on the Group’s business or financial situation, given that the fines imposed by the SMV have already been paid.
ii) Claim regarding alleged withholding on stock exchange transactions -
In June 2025, Grupo Crédito received notifications from the Superintendencia Nacional de Aduanas y de Administración Tributaria (SUNAT) consisting of Tax Assessment and Penalty Resolutions for a total amount of S/1,568.0 million. The resolutions relate to an alleged failure to withhold Income Tax applicable to non-domiciled taxpayers in connection with purchases of shares of Banco de Crédito del Perú carried out through the Lima Stock Exchange during 2018 and 2019, in which Grupo Crédito acted as the acquirer and Credicorp Ltd. as the transferor. SUNAT maintains that Grupo Crédito was required to act as a withholding agent; however, in the opinion of Management and its external legal advisors, such withholding obligation was not applicable, as the transactions in question were exempt from Income Tax in accordance with the regulations in force at the time the transactions were executed.
On August 13, 2025, the amounts included in the Tax Assessment and Penalty Resolutions issued by SUNAT to Grupo Crédito on June 27, 2025, were settled, and the corresponding amounts have been recognized as an asset under the caption “Claim filed with the Tax Authority” within the line item “Other assets” in accordance with IFRS Accounting Standards, the amount is classified as an asset relating to an uncertain tax position.
Grupo Crédito has formally challenged the aforementioned Tax Assessment and Penalty Resolutions by filing an Administrative Claim with SUNAT, and the administrative proceeding is currently pending resolution by the tax authority. If necessary, the Company will continue to defend its position at subsequent administrative and judicial levels, including the Tax Court and the judiciary.
Grupo Crédito S.A. has obtained independent legal opinions that support its tax position and confirm that the Company’s actions were in compliance with the tax, civil and financial legislation applicable and in force at the time the transactions were carried out. Both Management and external advisors concur that there are robust grounds and a high probability of obtaining a favorable outcome. Accordingly, consistent with IFRS Accounting Standards, the amount has been recognized as an asset, as it is more likely than not that the Group’s tax position will be sustained.
32 SUBSEQUENT EVENTS
Dividend distribution -
On April 23, 2026, the Board of Directors of Credicorp Ltd. approved the distribution of a cash dividend of S/4,719.1 million equivalent to S/50.00 per share, to be distributed on June 12, 2026.