Pay vs Performance Disclosure - USD ($)
|
7 Months Ended |
12 Months Ended |
Dec. 31, 2025 |
May 25, 2025 |
May 26, 2024 |
May 28, 2023 |
May 29, 2022 |
| Pay vs Performance Disclosure |
|
|
|
|
|
| Pay vs Performance Disclosure, Table |
| | | | | | | | | | | | | | | | | | | | | | | | | | | | | | | | | | | | | | | | Fiscal Year | SCT Total
for PEO 1 | CAP to PEO 1 | SCT Total
for PEO 2 | CAP to PEO 2 | SCT Total
for PEO 3 | CAP to PEO 3 | Average SCT Total
for non-PEO NEOs | Average CAP to non-PEO NEO’s | TSR | Peer Group TSR | Net (Loss) Income ($M) | Adjusted EBITDA
($M) | | (a) | (b) | (c) | (d) | (e) | (f) | (g) | (h) | (i) | (j) | (j) | (j) | (k) | | 2025T | N/A | N/A | N/A | N/A | $ | 545,635 | | $ | 2,421,135 | | $ | 395,244 | | $ | 908,228 | | $ | 68.34 | | $ | 118.23 | | $ | (17.96) | | $ | 13.1 | | | 2025 | N/A | N/A | N/A | N/A | $ | 1,115,305 | | $ | 831,113 | | $ | 3,052,396 | | $ | 3,948,495 | | $ | 56.14 | | $ | 110.35 | | $ | (38.7) | | $ | 19.5 | | | 2024 | N/A | N/A | $ | 2,491,413 | | $ | 1,688,561 | | $10,247,057 | $11,523,932 | $ | 1,293,936 | | $ | 950,826 | | $ | 46.95 | | $ | 92.82 | | $ | 12.0 | | $ | 26.2 | | | 2023 | $ | 1,341,438 | | $ | 640,585 | | $1,764,213 | $1,395,472 | N/A | N/A | $ | 927,096 | | $ | 777,243 | | $ | 66.33 | | $ | 79.24 | | $ | (99.6) | | $ | 7.8 | | | 2022 | $ | 956,810 | | $ | 711,502 | | N/A | N/A | N/A | N/A | $ | 687,606 | | $ | 451,471 | | $ | 82.46 | | $ | 81.62 | | $ | (116.7) | | $ | 17.8 | |
|
|
|
|
|
| Company Selected Measure Name |
Adjusted EBITDA
|
|
|
|
|
| Peer Group Issuers, Footnote |
The Peer Group TSR set forth in this table utilizes the Nasdaq Industrial Index.
|
|
|
|
|
| Adjustment To PEO Compensation, Footnote |
The dollar amounts reported in column (c), (e), (g) and (i) represent the amount of “compensation actually paid” (otherwise known as CAP), as computed in accordance with SEC rules. CAP does not necessarily represent cash and/or equity value transferred to the applicable NEO without restriction, but rather is a value calculated under applicable SEC rules. We do not have a defined benefit plan so no adjustment for pension benefits is included in the table below. Similarly, no adjustment is made for dividends as dividends are factored into the fair value of the award. The following table details these adjustments from the Total column of the SCT to calculate CAP for PEO 3 and for the non-PEO NEOs for the 2025 transition period: | | | | | | | | | | | | | | | | | | | | | | | | | | | | Fiscal Year | | SCT
(a) | Grant Date Value of New Awards
(b) | Year End
Value of New Awards
(i) | Change in Value of Prior Awards
(ii) | Change in Value of
Vested Awards
(iii) | Prior Year End Value of
Failed to Vest Awards
(iv) | CAP
| | 2025T | PEO3 | $ | 545,635 | | $ | — | | $ | — | | $ | 1,407,500 | | $ | 468,000.00 | | $ | — | | $ | 2,421,135 | | | NEOs | $ | 395,244 | | $ | — | | $ | — | | $ | 342,706 | | $ | 170,278.00 | | $ | — | | $ | 908,228 | |
(a)The dollar amounts reported in the SCT for the applicable year, plus: (b)The grant date fair value of equity awards represents the total of the amounts reported in the “Stock Awards” column in the SCT for the applicable year plus: The recalculated value of equity awards for each applicable year including: (i)Fair Value at Fiscal Year-End of Outstanding and Unvested Option Awards and Stock Awards Granted in Fiscal Year; (ii)Change in Fair Value of Outstanding and Unvested Option Awards and Stock Awards Granted in Prior Fiscal Years; (iii)Change in Fair Value as of Vesting Date of Option Awards and Stock Awards Granted in the Current Year and Prior Fiscal Years For Which Applicable Vesting Conditions Were Satisfied During Fiscal Year; (iv)Fair Value as of Prior Fiscal Year-End of Option Awards and Stock Awards Granted in Prior Fiscal Years That Failed to Meet Applicable Vesting Conditions During Fiscal Year.
|
|
|
|
|
| Non-PEO NEO Average Total Compensation Amount |
$ 395,244
|
$ 3,052,396
|
$ 1,293,936
|
$ 927,096
|
$ 687,606
|
| Non-PEO NEO Average Compensation Actually Paid Amount |
$ 908,228
|
3,948,495
|
950,826
|
777,243
|
451,471
|
| Adjustment to Non-PEO NEO Compensation Footnote |
The dollar amounts reported in column (c), (e), (g) and (i) represent the amount of “compensation actually paid” (otherwise known as CAP), as computed in accordance with SEC rules. CAP does not necessarily represent cash and/or equity value transferred to the applicable NEO without restriction, but rather is a value calculated under applicable SEC rules. We do not have a defined benefit plan so no adjustment for pension benefits is included in the table below. Similarly, no adjustment is made for dividends as dividends are factored into the fair value of the award. The following table details these adjustments from the Total column of the SCT to calculate CAP for PEO 3 and for the non-PEO NEOs for the 2025 transition period: | | | | | | | | | | | | | | | | | | | | | | | | | | | | Fiscal Year | | SCT
(a) | Grant Date Value of New Awards
(b) | Year End
Value of New Awards
(i) | Change in Value of Prior Awards
(ii) | Change in Value of
Vested Awards
(iii) | Prior Year End Value of
Failed to Vest Awards
(iv) | CAP
| | 2025T | PEO3 | $ | 545,635 | | $ | — | | $ | — | | $ | 1,407,500 | | $ | 468,000.00 | | $ | — | | $ | 2,421,135 | | | NEOs | $ | 395,244 | | $ | — | | $ | — | | $ | 342,706 | | $ | 170,278.00 | | $ | — | | $ | 908,228 | |
(a)The dollar amounts reported in the SCT for the applicable year, plus: (b)The grant date fair value of equity awards represents the total of the amounts reported in the “Stock Awards” column in the SCT for the applicable year plus: The recalculated value of equity awards for each applicable year including: (i)Fair Value at Fiscal Year-End of Outstanding and Unvested Option Awards and Stock Awards Granted in Fiscal Year; (ii)Change in Fair Value of Outstanding and Unvested Option Awards and Stock Awards Granted in Prior Fiscal Years; (iii)Change in Fair Value as of Vesting Date of Option Awards and Stock Awards Granted in the Current Year and Prior Fiscal Years For Which Applicable Vesting Conditions Were Satisfied During Fiscal Year; (iv)Fair Value as of Prior Fiscal Year-End of Option Awards and Stock Awards Granted in Prior Fiscal Years That Failed to Meet Applicable Vesting Conditions During Fiscal Year.
|
|
|
|
|
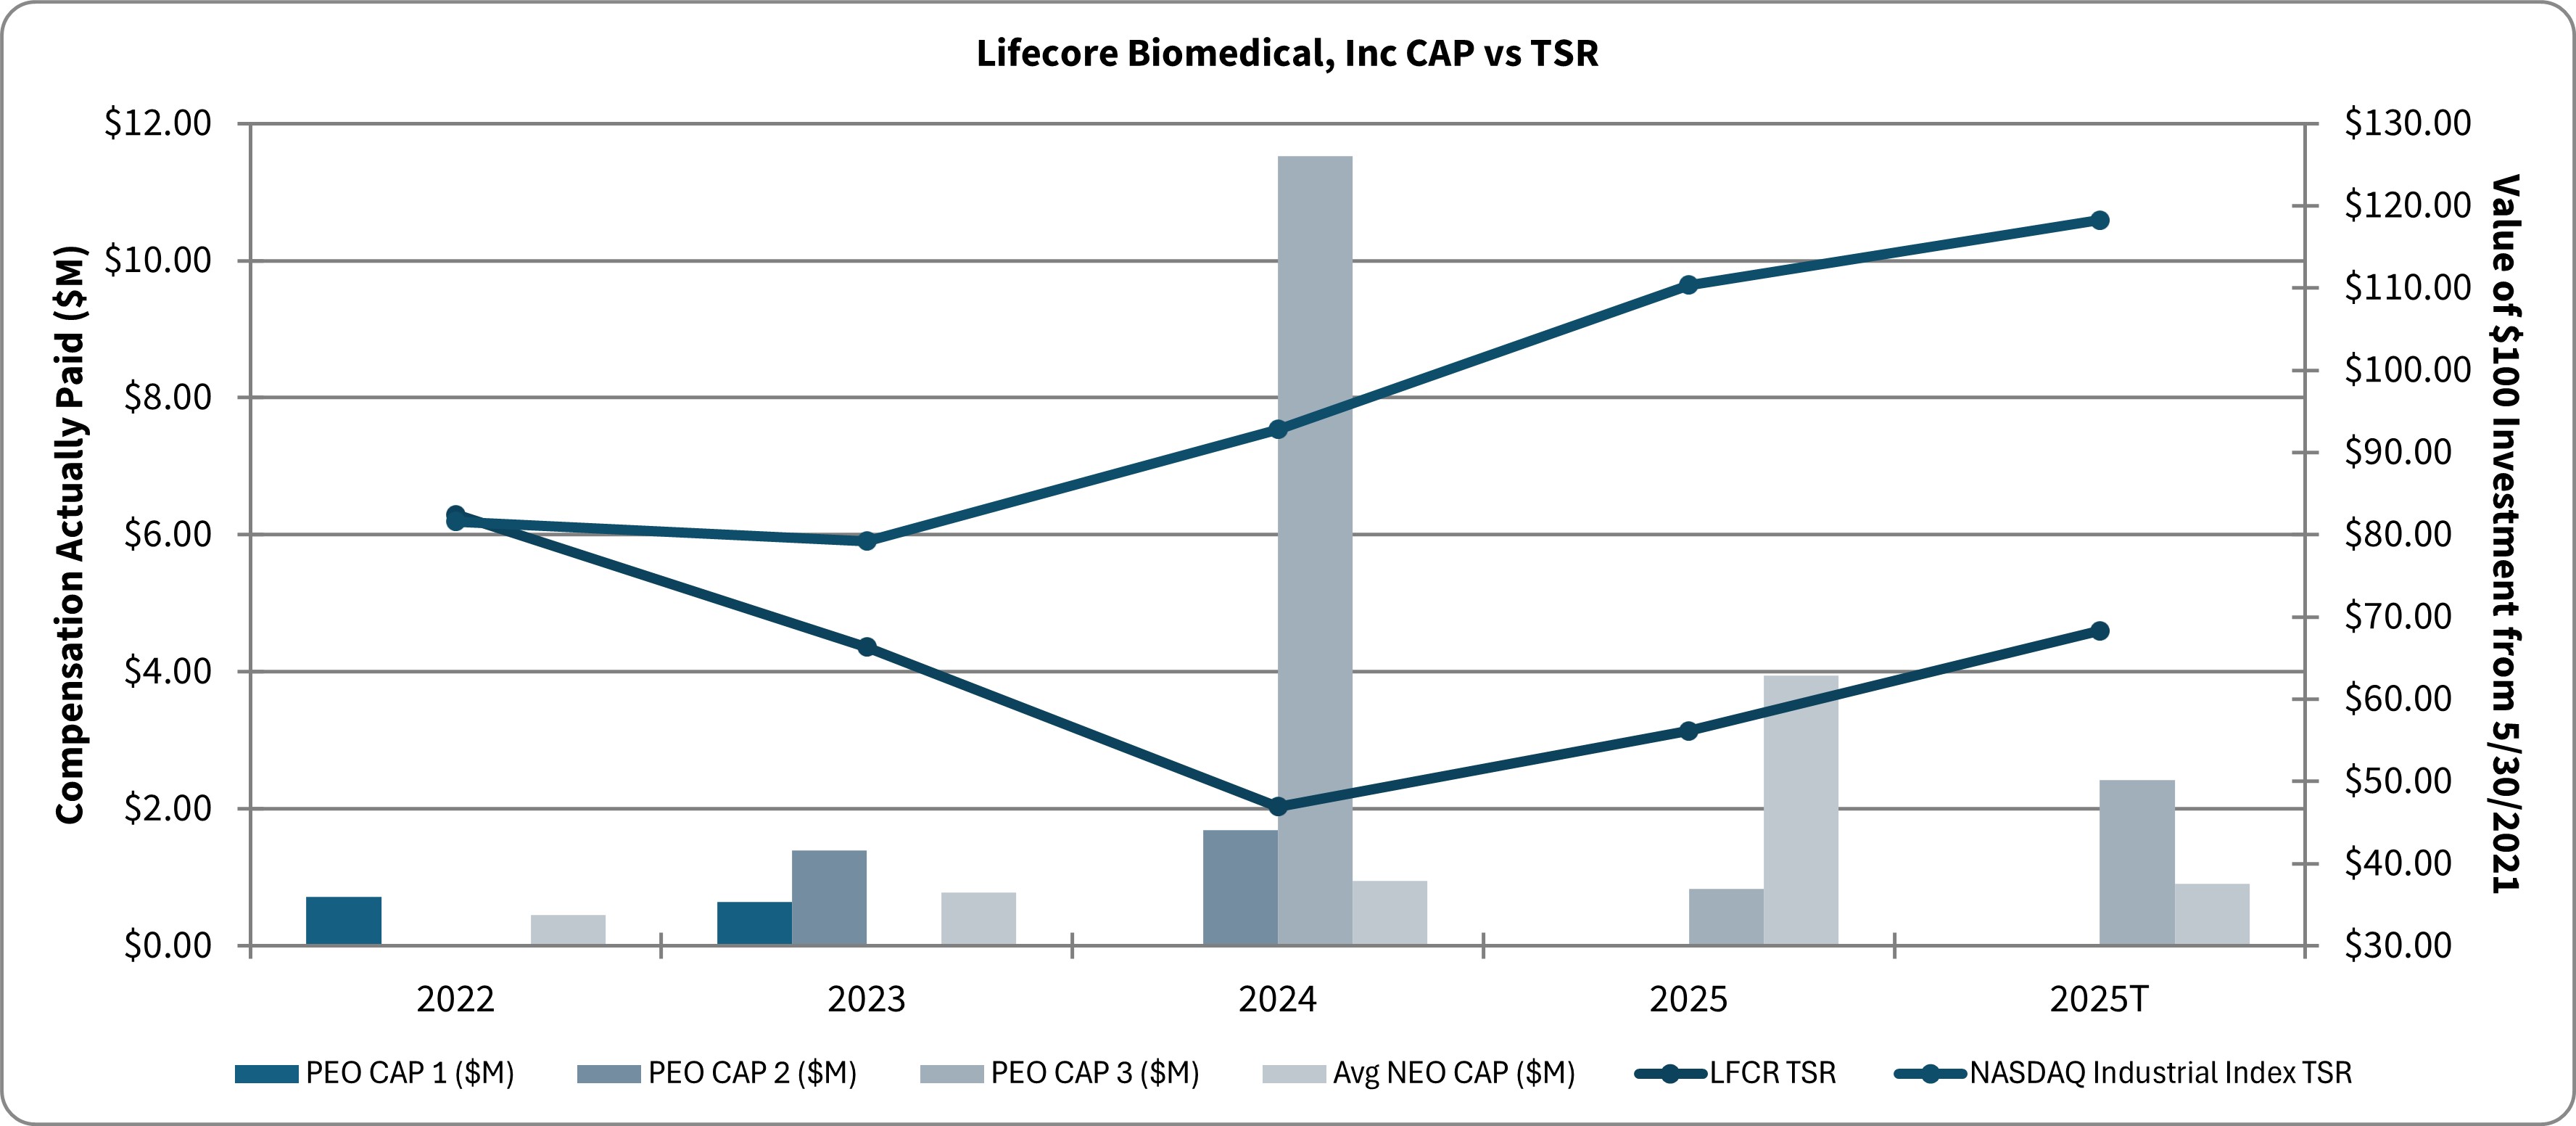
| Compensation Actually Paid vs. Total Shareholder Return |
TSR amounts reported in the graph assume an initial fixed investment of $100, and that all dividends, if any, were reinvested.
|
|
|
|
|
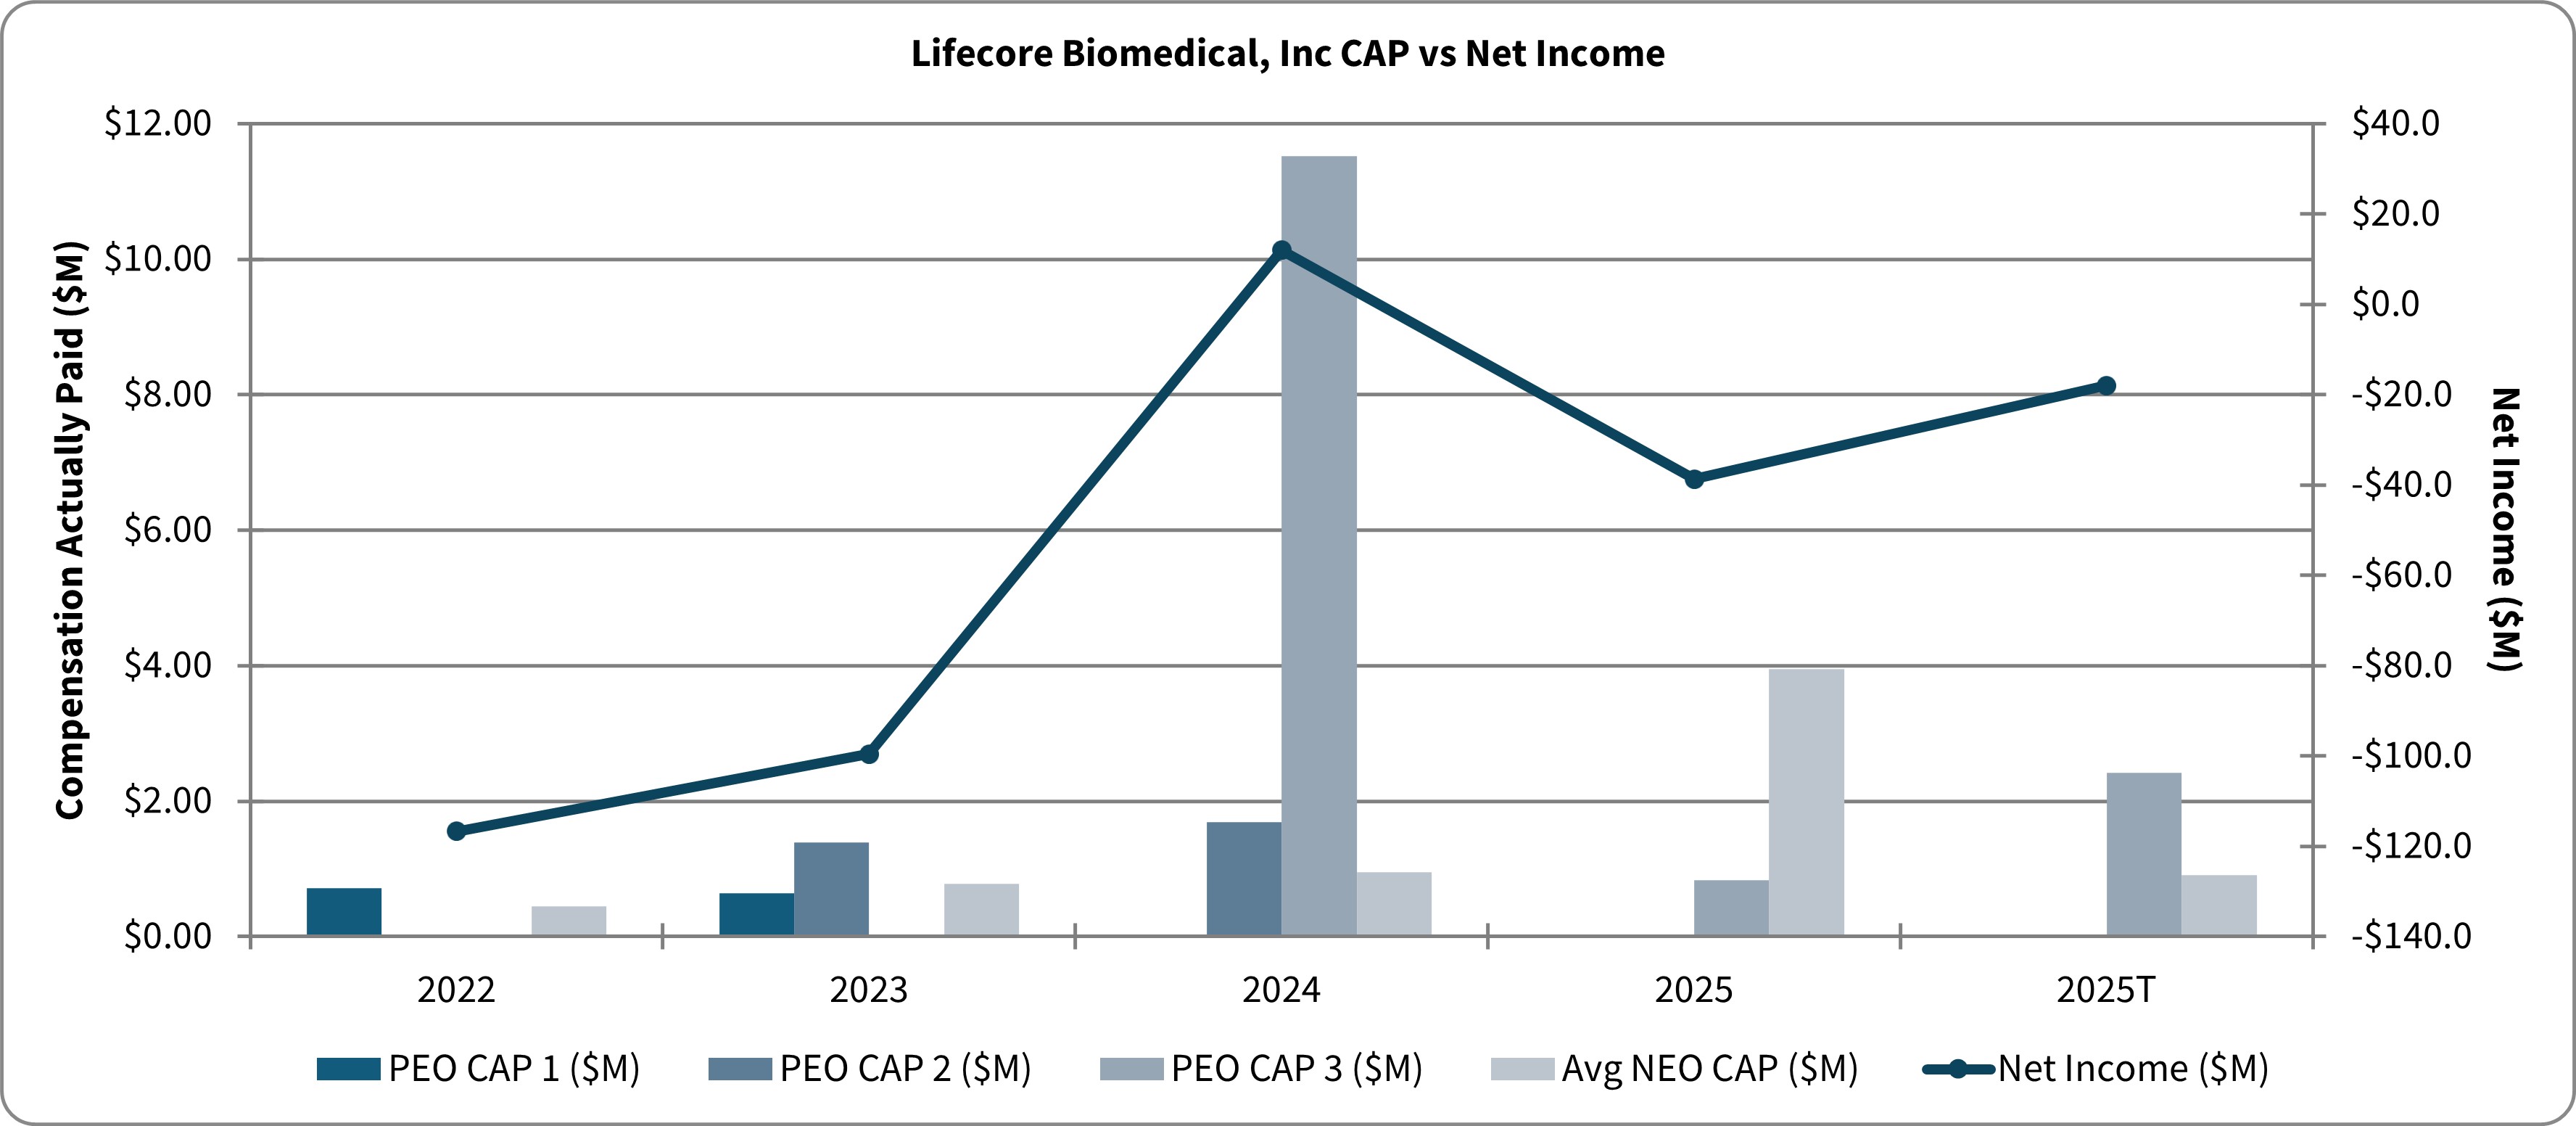
| Compensation Actually Paid vs. Net Income |
|
|
|
|
|
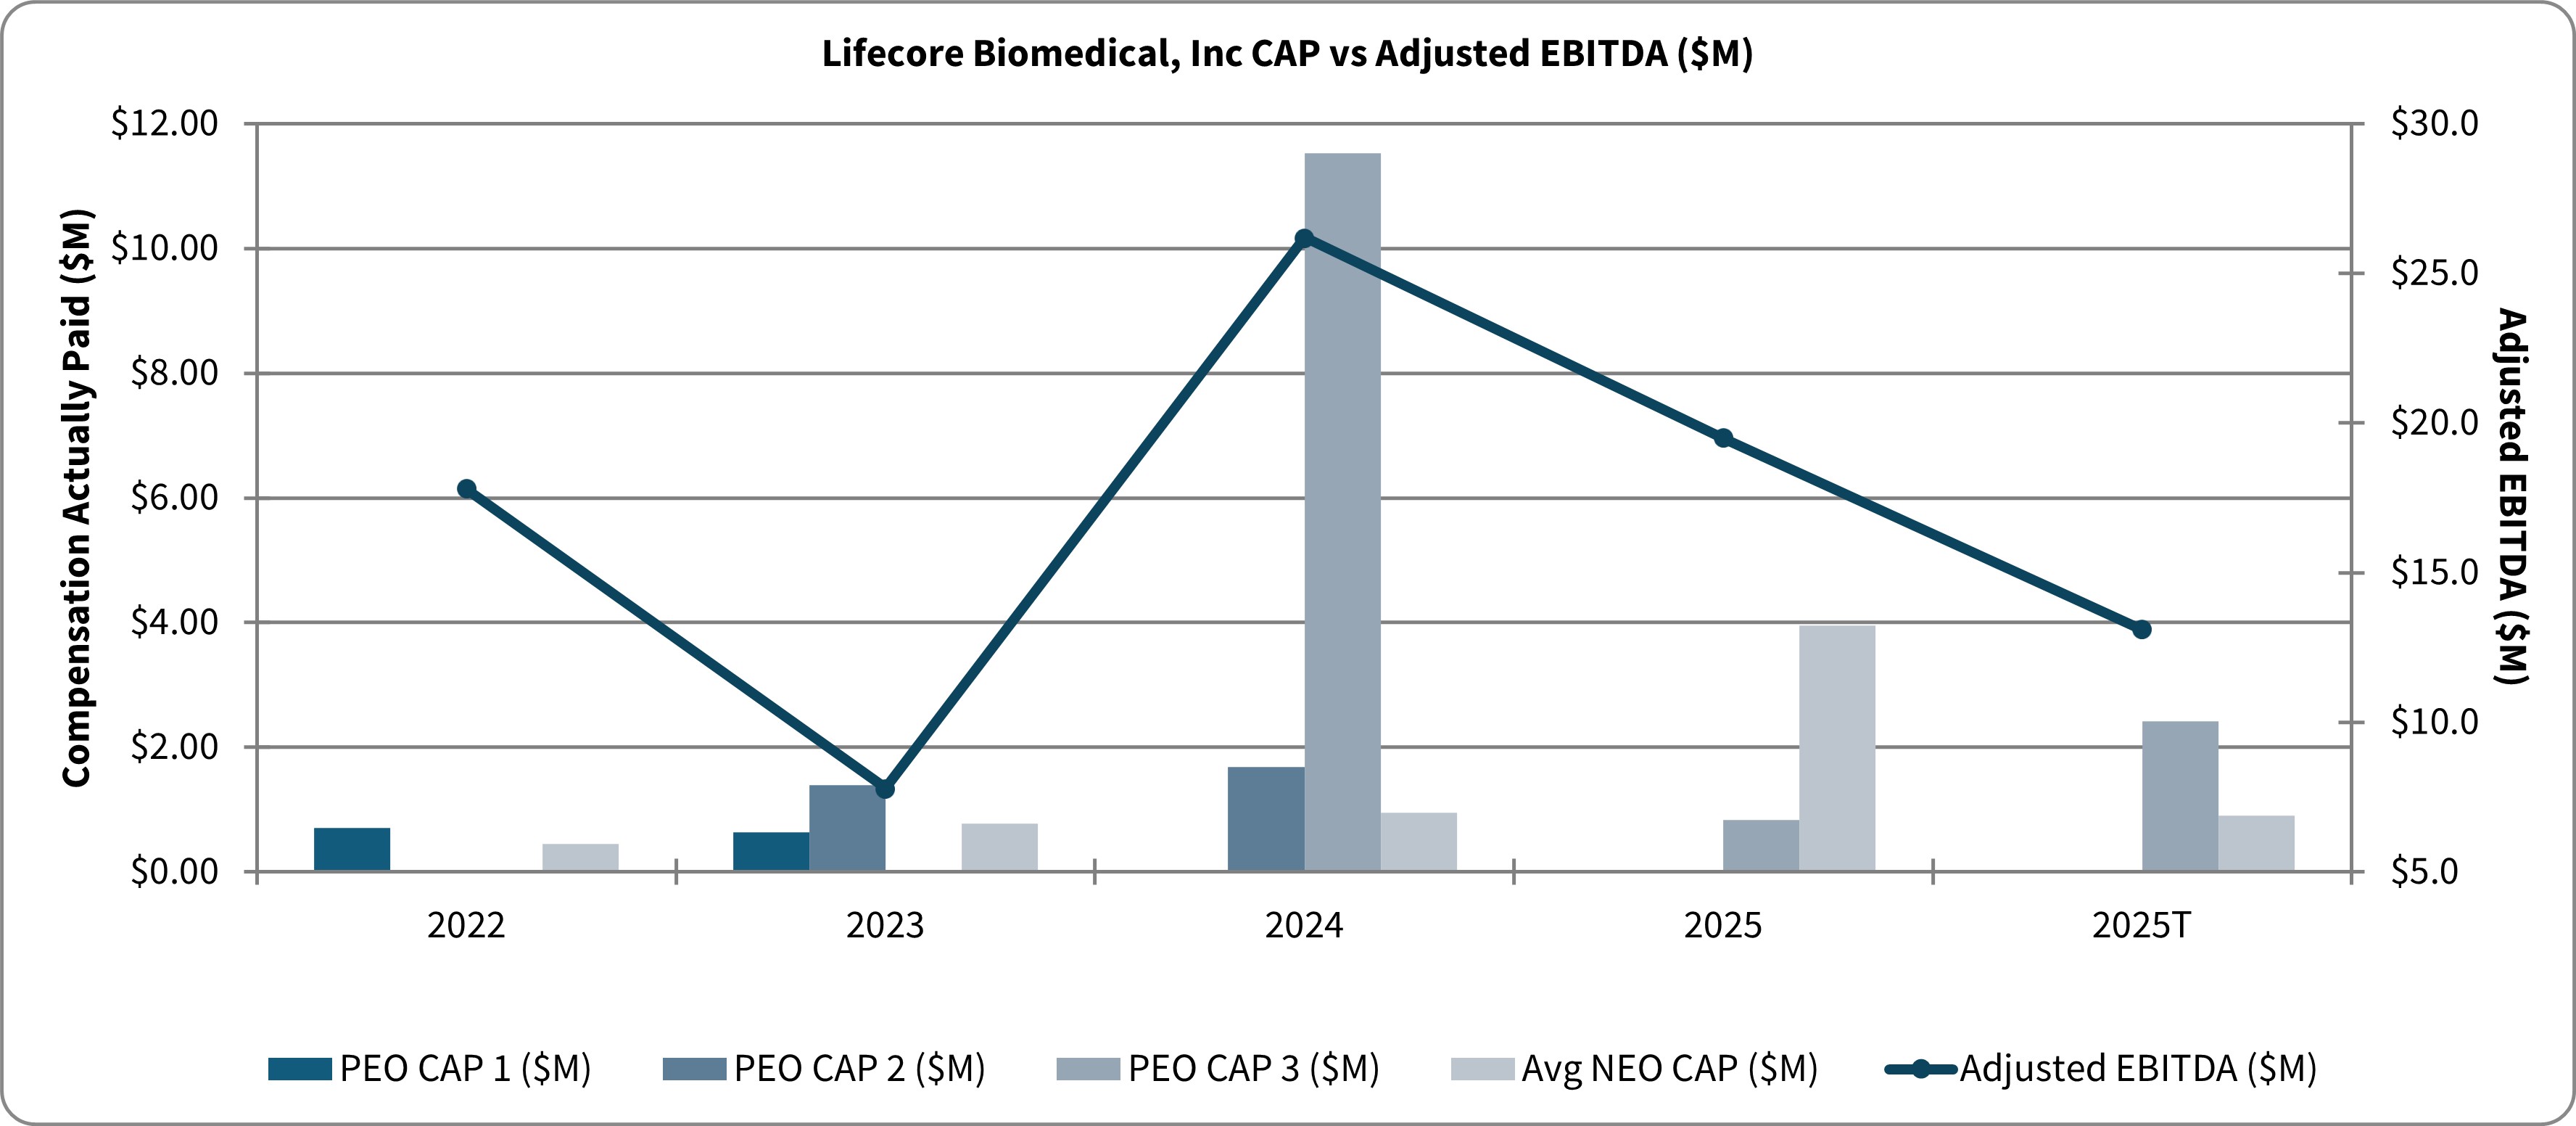
| Compensation Actually Paid vs. Company Selected Measure |
(1)FY2024 includes long-term equity awards valued at $10.7 million including a RSU grant on the first day of employment with vesting over the first five anniversaries of the grant date and a PSU award that will vest and be settled based on achievement of ten escalating stock price goals within five years.
|
|
|
|
|
| Tabular List, Table |
As required by Item 402(v), below are the most important metrics linking CAP to performance for the 2025 transition period: a.Adjusted EBITDA b.Revenue c.Stock Price
|
|
|
|
|
| Total Shareholder Return Amount |
$ 68.34
|
56.14
|
46.95
|
66.33
|
82.46
|
| Peer Group Total Shareholder Return Amount |
118.23
|
110.35
|
92.82
|
79.24
|
81.62
|
| Net Income (Loss) |
$ (17,960,000)
|
$ (38,700,000)
|
$ 12,000,000.0
|
$ (99,600,000)
|
$ (116,700,000)
|
| Company Selected Measure Amount |
13,100,000
|
19,500,000
|
26,200,000
|
7,800,000
|
17,800,000
|
| PEO Name |
Paul Josephs
|
Paul Josephs
|
James G. Hall
|
James G. Hall
|
Albert David Bolles
|
| Additional 402(v) Disclosure |
The dollar amounts reported in column (b) and (d) and (f) are the aggregate amounts of total compensation reported for PEO 1 (Bolles) PEO 2 (Hall) and PEO 3 (Josephs) respectively, for each corresponding year in the “Total” column of the Summary Compensation Table (SCT). Refer to “Executive Compensation – Executive Compensation Tables – Summary Compensation Table.”The dollar amounts reported in column (f) represent the average of the amounts reported for the Company’s named executive officers (NEOs) as a group in the “Total” column of the SCT in each applicable year. The names of each of the NEOs included for purposes of calculating the average amounts in each applicable year are as follows: | | | | | | | | | | 2025T | Ryan D. Lake and Thomas D. Salus | | 2025 | Ryan D. Lake, Thomas D. Salus and John D. Morberg | | 2024 | John D. Morberg | | 2023 | John D. Morberg | | 2022 | John D. Morberg, James G. Hall, and Timothy Burgess |
|
|
|
|
|
| Measure:: 1 |
|
|
|
|
|
| Pay vs Performance Disclosure |
|
|
|
|
|
| Name |
Adjusted EBITDA
|
|
|
|
|
| Measure:: 2 |
|
|
|
|
|
| Pay vs Performance Disclosure |
|
|
|
|
|
| Name |
Revenue
|
|
|
|
|
| Measure:: 3 |
|
|
|
|
|
| Pay vs Performance Disclosure |
|
|
|
|
|
| Name |
Stock Price
|
|
|
|
|
| Paul Josephs [Member] |
|
|
|
|
|
| Pay vs Performance Disclosure |
|
|
|
|
|
| PEO Total Compensation Amount |
$ 545,635
|
$ 1,115,305
|
$ 10,247,057
|
|
|
| PEO Actually Paid Compensation Amount |
2,421,135
|
$ 831,113
|
11,523,932
|
|
|
| James G. Hall [Member] |
|
|
|
|
|
| Pay vs Performance Disclosure |
|
|
|
|
|
| PEO Total Compensation Amount |
|
|
2,491,413
|
$ 1,764,213
|
|
| PEO Actually Paid Compensation Amount |
|
|
$ 1,688,561
|
1,395,472
|
|
| Albert Bolles [Member] |
|
|
|
|
|
| Pay vs Performance Disclosure |
|
|
|
|
|
| PEO Total Compensation Amount |
|
|
|
1,341,438
|
$ 956,810
|
| PEO Actually Paid Compensation Amount |
|
|
|
$ 640,585
|
$ 711,502
|
| PEO | Paul Josephs [Member] | Aggregate Grant Date Fair Value of Equity Award Amounts Reported in Summary Compensation Table |
|
|
|
|
|
| Pay vs Performance Disclosure |
|
|
|
|
|
| Adjustment to Compensation, Amount |
0
|
|
|
|
|
| PEO | Paul Josephs [Member] | Year-end Fair Value of Equity Awards Granted in Covered Year that are Outstanding and Unvested |
|
|
|
|
|
| Pay vs Performance Disclosure |
|
|
|
|
|
| Adjustment to Compensation, Amount |
0
|
|
|
|
|
| PEO | Paul Josephs [Member] | Year-over-Year Change in Fair Value of Equity Awards Granted in Prior Years That are Outstanding and Unvested |
|
|
|
|
|
| Pay vs Performance Disclosure |
|
|
|
|
|
| Adjustment to Compensation, Amount |
1,407,500
|
|
|
|
|
| PEO | Paul Josephs [Member] | Change in Fair Value as of Vesting Date of Prior Year Equity Awards Vested in Covered Year |
|
|
|
|
|
| Pay vs Performance Disclosure |
|
|
|
|
|
| Adjustment to Compensation, Amount |
468,000
|
|
|
|
|
| PEO | Paul Josephs [Member] | Prior Year End Fair Value of Equity Awards Granted in Any Prior Year that Fail to Meet Applicable Vesting Conditions During Covered Year |
|
|
|
|
|
| Pay vs Performance Disclosure |
|
|
|
|
|
| Adjustment to Compensation, Amount |
0
|
|
|
|
|
| Non-PEO NEO | Aggregate Grant Date Fair Value of Equity Award Amounts Reported in Summary Compensation Table |
|
|
|
|
|
| Pay vs Performance Disclosure |
|
|
|
|
|
| Adjustment to Compensation, Amount |
0
|
|
|
|
|
| Non-PEO NEO | Year-end Fair Value of Equity Awards Granted in Covered Year that are Outstanding and Unvested |
|
|
|
|
|
| Pay vs Performance Disclosure |
|
|
|
|
|
| Adjustment to Compensation, Amount |
0
|
|
|
|
|
| Non-PEO NEO | Year-over-Year Change in Fair Value of Equity Awards Granted in Prior Years That are Outstanding and Unvested |
|
|
|
|
|
| Pay vs Performance Disclosure |
|
|
|
|
|
| Adjustment to Compensation, Amount |
342,706
|
|
|
|
|
| Non-PEO NEO | Change in Fair Value as of Vesting Date of Prior Year Equity Awards Vested in Covered Year |
|
|
|
|
|
| Pay vs Performance Disclosure |
|
|
|
|
|
| Adjustment to Compensation, Amount |
170,278
|
|
|
|
|
| Non-PEO NEO | Prior Year End Fair Value of Equity Awards Granted in Any Prior Year that Fail to Meet Applicable Vesting Conditions During Covered Year |
|
|
|
|
|
| Pay vs Performance Disclosure |
|
|
|
|
|
| Adjustment to Compensation, Amount |
$ 0
|
|
|
|
|