false
0001005942
N-1A
0001005942
tsr:C000002283Member
2025-03-01
2026-02-28
0001005942
tsr:C000002283Member
oef:WithoutSalesLoadMember
2025-03-01
2026-02-28
0001005942
tsr:bench202411144434_6540Member
2025-03-01
2026-02-28
0001005942
tsr:benchmarkBMPT.29X-20A_6540Member
2025-03-01
2026-02-28
0001005942
tsr:C000002283Member
2026-02-28
0001005942
tsr:C000002283Member
tsr:bench202409043996_6540Member
2026-02-28
0001005942
tsr:C000002283Member
tsr:bench202409043997_6540Member
2026-02-28
0001005942
tsr:C000002283Member
tsr:bench202409043992_6540Member
2026-02-28
0001005942
tsr:C000002283Member
tsr:bench202409043994_6540Member
2026-02-28
0001005942
tsr:C000002283Member
tsr:bench202409044001_6540Member
2026-02-28
0001005942
tsr:C000002283Member
tsr:bench202409043993_6540Member
2026-02-28
0001005942
tsr:C000002283Member
tsr:bench202409043995_6540Member
2026-02-28
0001005942
tsr:C000002283Member
tsr:bench202409043999_6540Member
2026-02-28
0001005942
tsr:C000002283Member
tsr:bench202409043998_6540Member
2026-02-28
0001005942
tsr:C000002283Member
tsr:bench202409044002_6540Member
2026-02-28
0001005942
tsr:C000002283Member
tsr:bench202409044000_6540Member
2026-02-28
0001005942
tsr:C000002283Member
tsr:bench202409044003_6540Member
2026-02-28
0001005942
tsr:C000002283Member
oef:WithoutSalesLoadMember
2021-03-01
2026-02-28
0001005942
tsr:C000002283Member
2021-03-01
2026-02-28
0001005942
tsr:bench202411144434_6540Member
2021-03-01
2026-02-28
0001005942
tsr:benchmarkBMPT.29X-20A_6540Member
2021-03-01
2026-02-28
0001005942
tsr:C000002283Member
oef:WithoutSalesLoadMember
2016-03-01
2026-02-28
0001005942
tsr:C000002283Member
2016-03-01
2026-02-28
0001005942
tsr:bench202411144434_6540Member
2016-03-01
2026-02-28
0001005942
tsr:benchmarkBMPT.29X-20A_6540Member
2016-03-01
2026-02-28
0001005942
tsr:C000002283Member
2016-02-29
2016-02-29
0001005942
tsr:bench202411144434_6540Member
2016-02-29
2016-02-29
0001005942
tsr:benchmarkBMPT.29X-20A_6540Member
2016-02-29
2016-02-29
0001005942
tsr:C000002283Member
2017-02-28
2017-02-28
0001005942
tsr:bench202411144434_6540Member
2017-02-28
2017-02-28
0001005942
tsr:benchmarkBMPT.29X-20A_6540Member
2017-02-28
2017-02-28
0001005942
tsr:C000002283Member
2018-02-28
2018-02-28
0001005942
tsr:bench202411144434_6540Member
2018-02-28
2018-02-28
0001005942
tsr:benchmarkBMPT.29X-20A_6540Member
2018-02-28
2018-02-28
0001005942
tsr:C000002283Member
2019-02-28
2019-02-28
0001005942
tsr:bench202411144434_6540Member
2019-02-28
2019-02-28
0001005942
tsr:benchmarkBMPT.29X-20A_6540Member
2019-02-28
2019-02-28
0001005942
tsr:C000002283Member
2020-02-29
2020-02-29
0001005942
tsr:bench202411144434_6540Member
2020-02-29
2020-02-29
0001005942
tsr:benchmarkBMPT.29X-20A_6540Member
2020-02-29
2020-02-29
0001005942
tsr:C000002283Member
2021-02-28
2021-02-28
0001005942
tsr:bench202411144434_6540Member
2021-02-28
2021-02-28
0001005942
tsr:benchmarkBMPT.29X-20A_6540Member
2021-02-28
2021-02-28
0001005942
tsr:C000002283Member
2022-02-28
2022-02-28
0001005942
tsr:bench202411144434_6540Member
2022-02-28
2022-02-28
0001005942
tsr:benchmarkBMPT.29X-20A_6540Member
2022-02-28
2022-02-28
0001005942
tsr:C000002283Member
2023-02-28
2023-02-28
0001005942
tsr:bench202411144434_6540Member
2023-02-28
2023-02-28
0001005942
tsr:benchmarkBMPT.29X-20A_6540Member
2023-02-28
2023-02-28
0001005942
tsr:C000002283Member
2024-02-29
2024-02-29
0001005942
tsr:bench202411144434_6540Member
2024-02-29
2024-02-29
0001005942
tsr:benchmarkBMPT.29X-20A_6540Member
2024-02-29
2024-02-29
0001005942
tsr:C000002283Member
2025-02-28
2025-02-28
0001005942
tsr:bench202411144434_6540Member
2025-02-28
2025-02-28
0001005942
tsr:benchmarkBMPT.29X-20A_6540Member
2025-02-28
2025-02-28
0001005942
2025-03-01
2026-02-28
tsr:Years
iso4217:USD
xbrli:pure
xbrli:shares
iso4217:USD
xbrli:shares
0001005942
tsr:C000002279Member
2025-03-01
2026-02-28
0001005942
tsr:C000002279Member
oef:WithoutSalesLoadMember
2025-03-01
2026-02-28
0001005942
tsr:bench202411144434_6541Member
2025-03-01
2026-02-28
0001005942
tsr:benchmarkBMPT.29X-20A_6541Member
2025-03-01
2026-02-28
0001005942
tsr:C000002279Member
2026-02-28
0001005942
tsr:C000002279Member
tsr:bench202409043996_6541Member
2026-02-28
0001005942
tsr:C000002279Member
tsr:bench202409043997_6541Member
2026-02-28
0001005942
tsr:C000002279Member
tsr:bench202409043992_6541Member
2026-02-28
0001005942
tsr:C000002279Member
tsr:bench202409043994_6541Member
2026-02-28
0001005942
tsr:C000002279Member
tsr:bench202409044001_6541Member
2026-02-28
0001005942
tsr:C000002279Member
tsr:bench202409043993_6541Member
2026-02-28
0001005942
tsr:C000002279Member
tsr:bench202409043995_6541Member
2026-02-28
0001005942
tsr:C000002279Member
tsr:bench202409043999_6541Member
2026-02-28
0001005942
tsr:C000002279Member
tsr:bench202409043998_6541Member
2026-02-28
0001005942
tsr:C000002279Member
tsr:bench202409044002_6541Member
2026-02-28
0001005942
tsr:C000002279Member
tsr:bench202409044000_6541Member
2026-02-28
0001005942
tsr:C000002279Member
tsr:bench202409044003_6541Member
2026-02-28
0001005942
tsr:C000002279Member
oef:WithoutSalesLoadMember
2021-03-01
2026-02-28
0001005942
tsr:C000002279Member
2021-03-01
2026-02-28
0001005942
tsr:bench202411144434_6541Member
2021-03-01
2026-02-28
0001005942
tsr:benchmarkBMPT.29X-20A_6541Member
2021-03-01
2026-02-28
0001005942
tsr:C000002279Member
oef:WithoutSalesLoadMember
2016-02-29
2026-02-28
0001005942
tsr:C000002279Member
2016-02-29
2026-02-28
0001005942
tsr:bench202411144434_6541Member
2016-02-29
2026-02-28
0001005942
tsr:benchmarkBMPT.29X-20A_6541Member
2016-02-29
2026-02-28
0001005942
tsr:C000002279Member
2016-02-29
2016-02-29
0001005942
tsr:bench202411144434_6541Member
2016-02-29
2016-02-29
0001005942
tsr:benchmarkBMPT.29X-20A_6541Member
2016-02-29
2016-02-29
0001005942
tsr:C000002279Member
2017-02-28
2017-02-28
0001005942
tsr:bench202411144434_6541Member
2017-02-28
2017-02-28
0001005942
tsr:benchmarkBMPT.29X-20A_6541Member
2017-02-28
2017-02-28
0001005942
tsr:C000002279Member
2018-02-28
2018-02-28
0001005942
tsr:bench202411144434_6541Member
2018-02-28
2018-02-28
0001005942
tsr:benchmarkBMPT.29X-20A_6541Member
2018-02-28
2018-02-28
0001005942
tsr:C000002279Member
2019-02-28
2019-02-28
0001005942
tsr:bench202411144434_6541Member
2019-02-28
2019-02-28
0001005942
tsr:benchmarkBMPT.29X-20A_6541Member
2019-02-28
2019-02-28
0001005942
tsr:C000002279Member
2020-02-29
2020-02-29
0001005942
tsr:bench202411144434_6541Member
2020-02-29
2020-02-29
0001005942
tsr:benchmarkBMPT.29X-20A_6541Member
2020-02-29
2020-02-29
0001005942
tsr:C000002279Member
2021-02-28
2021-02-28
0001005942
tsr:bench202411144434_6541Member
2021-02-28
2021-02-28
0001005942
tsr:benchmarkBMPT.29X-20A_6541Member
2021-02-28
2021-02-28
0001005942
tsr:C000002279Member
2022-02-28
2022-02-28
0001005942
tsr:bench202411144434_6541Member
2022-02-28
2022-02-28
0001005942
tsr:benchmarkBMPT.29X-20A_6541Member
2022-02-28
2022-02-28
0001005942
tsr:C000002279Member
2023-02-28
2023-02-28
0001005942
tsr:bench202411144434_6541Member
2023-02-28
2023-02-28
0001005942
tsr:benchmarkBMPT.29X-20A_6541Member
2023-02-28
2023-02-28
0001005942
tsr:C000002279Member
2024-02-29
2024-02-29
0001005942
tsr:bench202411144434_6541Member
2024-02-29
2024-02-29
0001005942
tsr:benchmarkBMPT.29X-20A_6541Member
2024-02-29
2024-02-29
0001005942
tsr:C000002279Member
2025-02-28
2025-02-28
0001005942
tsr:bench202411144434_6541Member
2025-02-28
2025-02-28
0001005942
tsr:benchmarkBMPT.29X-20A_6541Member
2025-02-28
2025-02-28
0001005942
tsr:C000002281Member
2025-03-01
2026-02-28
0001005942
tsr:bench202411144434_6542Member
2025-03-01
2026-02-28
0001005942
tsr:benchmarkBMPT.29X-20A_6542Member
2025-03-01
2026-02-28
0001005942
tsr:C000002281Member
2026-02-28
0001005942
tsr:C000002281Member
tsr:bench202409043996_6542Member
2026-02-28
0001005942
tsr:C000002281Member
tsr:bench202409043997_6542Member
2026-02-28
0001005942
tsr:C000002281Member
tsr:bench202409043992_6542Member
2026-02-28
0001005942
tsr:C000002281Member
tsr:bench202409043994_6542Member
2026-02-28
0001005942
tsr:C000002281Member
tsr:bench202409044001_6542Member
2026-02-28
0001005942
tsr:C000002281Member
tsr:bench202409043993_6542Member
2026-02-28
0001005942
tsr:C000002281Member
tsr:bench202409043995_6542Member
2026-02-28
0001005942
tsr:C000002281Member
tsr:bench202409043999_6542Member
2026-02-28
0001005942
tsr:C000002281Member
tsr:bench202409043998_6542Member
2026-02-28
0001005942
tsr:C000002281Member
tsr:bench202409044002_6542Member
2026-02-28
0001005942
tsr:C000002281Member
tsr:bench202409044000_6542Member
2026-02-28
0001005942
tsr:C000002281Member
tsr:bench202409044003_6542Member
2026-02-28
0001005942
tsr:C000002281Member
2021-03-01
2026-02-28
0001005942
tsr:bench202411144434_6542Member
2021-03-01
2026-02-28
0001005942
tsr:benchmarkBMPT.29X-20A_6542Member
2021-03-01
2026-02-28
0001005942
tsr:C000002281Member
2016-03-01
2026-02-28
0001005942
tsr:bench202411144434_6542Member
2016-03-01
2026-02-28
0001005942
tsr:benchmarkBMPT.29X-20A_6542Member
2016-03-01
2026-02-28
0001005942
tsr:C000002281Member
2016-02-29
2016-02-29
0001005942
tsr:bench202411144434_6542Member
2016-02-29
2016-02-29
0001005942
tsr:benchmarkBMPT.29X-20A_6542Member
2016-02-29
2016-02-29
0001005942
tsr:C000002281Member
2017-02-28
2017-02-28
0001005942
tsr:bench202411144434_6542Member
2017-02-28
2017-02-28
0001005942
tsr:benchmarkBMPT.29X-20A_6542Member
2017-02-28
2017-02-28
0001005942
tsr:C000002281Member
2018-02-28
2018-02-28
0001005942
tsr:bench202411144434_6542Member
2018-02-28
2018-02-28
0001005942
tsr:benchmarkBMPT.29X-20A_6542Member
2018-02-28
2018-02-28
0001005942
tsr:C000002281Member
2019-02-28
2019-02-28
0001005942
tsr:bench202411144434_6542Member
2019-02-28
2019-02-28
0001005942
tsr:benchmarkBMPT.29X-20A_6542Member
2019-02-28
2019-02-28
0001005942
tsr:C000002281Member
2020-02-29
2020-02-29
0001005942
tsr:bench202411144434_6542Member
2020-02-29
2020-02-29
0001005942
tsr:benchmarkBMPT.29X-20A_6542Member
2020-02-29
2020-02-29
0001005942
tsr:C000002281Member
2021-02-28
2021-02-28
0001005942
tsr:bench202411144434_6542Member
2021-02-28
2021-02-28
0001005942
tsr:benchmarkBMPT.29X-20A_6542Member
2021-02-28
2021-02-28
0001005942
tsr:C000002281Member
2022-02-28
2022-02-28
0001005942
tsr:bench202411144434_6542Member
2022-02-28
2022-02-28
0001005942
tsr:benchmarkBMPT.29X-20A_6542Member
2022-02-28
2022-02-28
0001005942
tsr:C000002281Member
2023-02-28
2023-02-28
0001005942
tsr:bench202411144434_6542Member
2023-02-28
2023-02-28
0001005942
tsr:benchmarkBMPT.29X-20A_6542Member
2023-02-28
2023-02-28
0001005942
tsr:C000002281Member
2024-02-29
2024-02-29
0001005942
tsr:bench202411144434_6542Member
2024-02-29
2024-02-29
0001005942
tsr:benchmarkBMPT.29X-20A_6542Member
2024-02-29
2024-02-29
0001005942
tsr:C000002281Member
2025-02-28
2025-02-28
0001005942
tsr:bench202411144434_6542Member
2025-02-28
2025-02-28
0001005942
tsr:benchmarkBMPT.29X-20A_6542Member
2025-02-28
2025-02-28
0001005942
tsr:C000203062Member
2025-03-01
2026-02-28
0001005942
tsr:bench202411144434_6543Member
2025-03-01
2026-02-28
0001005942
tsr:benchmarkBMPT.29X-20A_6543Member
2025-03-01
2026-02-28
0001005942
tsr:C000203062Member
2026-02-28
0001005942
tsr:C000203062Member
tsr:bench202409043996_6543Member
2026-02-28
0001005942
tsr:C000203062Member
tsr:bench202409043997_6543Member
2026-02-28
0001005942
tsr:C000203062Member
tsr:bench202409043992_6543Member
2026-02-28
0001005942
tsr:C000203062Member
tsr:bench202409043994_6543Member
2026-02-28
0001005942
tsr:C000203062Member
tsr:bench202409044001_6543Member
2026-02-28
0001005942
tsr:C000203062Member
tsr:bench202409043993_6543Member
2026-02-28
0001005942
tsr:C000203062Member
tsr:bench202409043995_6543Member
2026-02-28
0001005942
tsr:C000203062Member
tsr:bench202409043999_6543Member
2026-02-28
0001005942
tsr:C000203062Member
tsr:bench202409043998_6543Member
2026-02-28
0001005942
tsr:C000203062Member
tsr:bench202409044002_6543Member
2026-02-28
0001005942
tsr:C000203062Member
tsr:bench202409044000_6543Member
2026-02-28
0001005942
tsr:C000203062Member
tsr:bench202409044003_6543Member
2026-02-28
0001005942
tsr:C000203062Member
2021-03-01
2026-02-28
0001005942
tsr:bench202411144434_6543Member
2021-03-01
2026-02-28
0001005942
tsr:benchmarkBMPT.29X-20A_6543Member
2021-03-01
2026-02-28
0001005942
tsr:C000203062Member
2016-03-01
2026-02-28
0001005942
tsr:bench202411144434_6543Member
2016-03-01
2026-02-28
0001005942
tsr:benchmarkBMPT.29X-20A_6543Member
2016-03-01
2026-02-28
0001005942
tsr:C000203062Member
2016-02-29
2016-02-29
0001005942
tsr:bench202411144434_6543Member
2016-02-29
2016-02-29
0001005942
tsr:benchmarkBMPT.29X-20A_6543Member
2016-02-29
2016-02-29
0001005942
tsr:C000203062Member
2017-02-28
2017-02-28
0001005942
tsr:bench202411144434_6543Member
2017-02-28
2017-02-28
0001005942
tsr:benchmarkBMPT.29X-20A_6543Member
2017-02-28
2017-02-28
0001005942
tsr:C000203062Member
2018-02-28
2018-02-28
0001005942
tsr:bench202411144434_6543Member
2018-02-28
2018-02-28
0001005942
tsr:benchmarkBMPT.29X-20A_6543Member
2018-02-28
2018-02-28
0001005942
tsr:C000203062Member
2019-02-28
2019-02-28
0001005942
tsr:bench202411144434_6543Member
2019-02-28
2019-02-28
0001005942
tsr:benchmarkBMPT.29X-20A_6543Member
2019-02-28
2019-02-28
0001005942
tsr:C000203062Member
2020-02-29
2020-02-29
0001005942
tsr:bench202411144434_6543Member
2020-02-29
2020-02-29
0001005942
tsr:benchmarkBMPT.29X-20A_6543Member
2020-02-29
2020-02-29
0001005942
tsr:C000203062Member
2021-02-28
2021-02-28
0001005942
tsr:bench202411144434_6543Member
2021-02-28
2021-02-28
0001005942
tsr:benchmarkBMPT.29X-20A_6543Member
2021-02-28
2021-02-28
0001005942
tsr:C000203062Member
2022-02-28
2022-02-28
0001005942
tsr:bench202411144434_6543Member
2022-02-28
2022-02-28
0001005942
tsr:benchmarkBMPT.29X-20A_6543Member
2022-02-28
2022-02-28
0001005942
tsr:C000203062Member
2023-02-28
2023-02-28
0001005942
tsr:bench202411144434_6543Member
2023-02-28
2023-02-28
0001005942
tsr:benchmarkBMPT.29X-20A_6543Member
2023-02-28
2023-02-28
0001005942
tsr:C000203062Member
2024-02-29
2024-02-29
0001005942
tsr:bench202411144434_6543Member
2024-02-29
2024-02-29
0001005942
tsr:benchmarkBMPT.29X-20A_6543Member
2024-02-29
2024-02-29
0001005942
tsr:C000203062Member
2025-02-28
2025-02-28
0001005942
tsr:bench202411144434_6543Member
2025-02-28
2025-02-28
0001005942
tsr:benchmarkBMPT.29X-20A_6543Member
2025-02-28
2025-02-28
0001005942
tsr:C000002282Member
2025-03-01
2026-02-28
0001005942
tsr:bench202411144434_6544Member
2025-03-01
2026-02-28
0001005942
tsr:benchmarkBMPT.29X-20A_6544Member
2025-03-01
2026-02-28
0001005942
tsr:C000002282Member
2026-02-28
0001005942
tsr:C000002282Member
tsr:bench202409043996_6544Member
2026-02-28
0001005942
tsr:C000002282Member
tsr:bench202409043997_6544Member
2026-02-28
0001005942
tsr:C000002282Member
tsr:bench202409043992_6544Member
2026-02-28
0001005942
tsr:C000002282Member
tsr:bench202409043994_6544Member
2026-02-28
0001005942
tsr:C000002282Member
tsr:bench202409044001_6544Member
2026-02-28
0001005942
tsr:C000002282Member
tsr:bench202409043993_6544Member
2026-02-28
0001005942
tsr:C000002282Member
tsr:bench202409043995_6544Member
2026-02-28
0001005942
tsr:C000002282Member
tsr:bench202409043999_6544Member
2026-02-28
0001005942
tsr:C000002282Member
tsr:bench202409043998_6544Member
2026-02-28
0001005942
tsr:C000002282Member
tsr:bench202409044002_6544Member
2026-02-28
0001005942
tsr:C000002282Member
tsr:bench202409044000_6544Member
2026-02-28
0001005942
tsr:C000002282Member
tsr:bench202409044003_6544Member
2026-02-28
0001005942
tsr:C000002282Member
2021-03-01
2026-02-28
0001005942
tsr:bench202411144434_6544Member
2021-03-01
2026-02-28
0001005942
tsr:benchmarkBMPT.29X-20A_6544Member
2021-03-01
2026-02-28
0001005942
tsr:C000002282Member
2016-03-01
2026-02-28
0001005942
tsr:bench202411144434_6544Member
2016-03-01
2026-02-28
0001005942
tsr:benchmarkBMPT.29X-20A_6544Member
2016-03-01
2026-02-28
0001005942
tsr:C000002282Member
2016-02-29
2016-02-29
0001005942
tsr:bench202411144434_6544Member
2016-02-29
2016-02-29
0001005942
tsr:benchmarkBMPT.29X-20A_6544Member
2016-02-29
2016-02-29
0001005942
tsr:C000002282Member
2017-02-28
2017-02-28
0001005942
tsr:bench202411144434_6544Member
2017-02-28
2017-02-28
0001005942
tsr:benchmarkBMPT.29X-20A_6544Member
2017-02-28
2017-02-28
0001005942
tsr:C000002282Member
2018-02-28
2018-02-28
0001005942
tsr:bench202411144434_6544Member
2018-02-28
2018-02-28
0001005942
tsr:benchmarkBMPT.29X-20A_6544Member
2018-02-28
2018-02-28
0001005942
tsr:C000002282Member
2019-02-28
2019-02-28
0001005942
tsr:bench202411144434_6544Member
2019-02-28
2019-02-28
0001005942
tsr:benchmarkBMPT.29X-20A_6544Member
2019-02-28
2019-02-28
0001005942
tsr:C000002282Member
2020-02-29
2020-02-29
0001005942
tsr:bench202411144434_6544Member
2020-02-29
2020-02-29
0001005942
tsr:benchmarkBMPT.29X-20A_6544Member
2020-02-29
2020-02-29
0001005942
tsr:C000002282Member
2021-02-28
2021-02-28
0001005942
tsr:bench202411144434_6544Member
2021-02-28
2021-02-28
0001005942
tsr:benchmarkBMPT.29X-20A_6544Member
2021-02-28
2021-02-28
0001005942
tsr:C000002282Member
2022-02-28
2022-02-28
0001005942
tsr:bench202411144434_6544Member
2022-02-28
2022-02-28
0001005942
tsr:benchmarkBMPT.29X-20A_6544Member
2022-02-28
2022-02-28
0001005942
tsr:C000002282Member
2023-02-28
2023-02-28
0001005942
tsr:bench202411144434_6544Member
2023-02-28
2023-02-28
0001005942
tsr:benchmarkBMPT.29X-20A_6544Member
2023-02-28
2023-02-28
0001005942
tsr:C000002282Member
2024-02-29
2024-02-29
0001005942
tsr:bench202411144434_6544Member
2024-02-29
2024-02-29
0001005942
tsr:benchmarkBMPT.29X-20A_6544Member
2024-02-29
2024-02-29
0001005942
tsr:C000002282Member
2025-02-28
2025-02-28
0001005942
tsr:bench202411144434_6544Member
2025-02-28
2025-02-28
0001005942
tsr:benchmarkBMPT.29X-20A_6544Member
2025-02-28
2025-02-28
UNITED STATES
SECURITIES AND EXCHANGE COMMISSION
Washington, D.C. 20549
FORM N-CSR
CERTIFIED SHAREHOLDER REPORT OF REGISTERED
MANAGEMENT INVESTMENT COMPANIES
Investment Company Act file number 811-07513
Putnam
Funds Trust
(Exact name of registrant as specified in charter)
100 Federal Street, Boston, Massachusetts 02110
(Address of principal executive offices) (Zip code)
Stephen Tate, Vice President
100 Federal Street,
Boston, Massachusetts 02110
Copy to:
Bryan Chegwidden, Esq.
Ropes & Gray LLP
1211 Avenue of the Americas
New York, NY 10036
James E. Thomas, Esq.
Ropes & Gray LLP
800 Boylston Street
Boston, Massachusetts 02199
(Name and address of agent for service)
Registrant’s telephone number, including area
code: (617) 292-1000
Date of fiscal year end: February 28
Date of reporting period: February
28, 2026
| ITEM 1. |
|
REPORT TO STOCKHOLDERS. |
(a) The Report to Shareholders is filed
herewith
|
|
|
|
Putnam
Floating Rate Income Fund |
|
|
Class
A [PFLRX]
|
|
Annual
Shareholder Report | February
28, 2026 |
|
|
This
annual
shareholder report
contains important information about Putnam
Floating Rate Income Fund for the period March
1, 2025, to February 28, 2026.
You
can find additional information about the Fund at https://www.franklintempleton.com/regulatory-fund-documents.
You can also request this information
by contacting us at (800)
225-1581.
|
|
|
|
Class
Name |
Costs
of a $10,000 investment
|
Costs
paid as a percentage of a $10,000
investment |
|
Class
A |
$99
|
%
|
HOW
DID THE FUND PERFORM LAST YEAR AND WHAT AFFECTED ITS PERFORMANCE?
For the twelve months ended February
28, 2026, Class A shares of
Putnam Floating Rate Income Fund returned 2.91%.
The Fund compares its performance
to the Morningstar LSTA U.S. Leveraged Loan Index, which returned 3.93% for the same period.
|
|
|
Top
contributors to performance: |
|
↑
|
Security
selection within the consumer products sector and overweight positioning and security selection within retail |
|
↑
|
Overweight
exposure to Viasat, a broadband and communications products and services provider |
|
|
|
Top
detractors from performance: |
|
↓
|
Overweight
positioning and security selection within the chemicals sector |
|
↓
|
Overweight
exposure to Vibrantz Technology, a specialty chemicals company |
Use of derivatives and the
impact on performance:
The Fund utilized credit default
swap contracts to manage credit exposure, which contributed to performance during the period.
| Putnam
Floating Rate Income Fund |
PAGE
1 |
38963-ATSA-0426 |
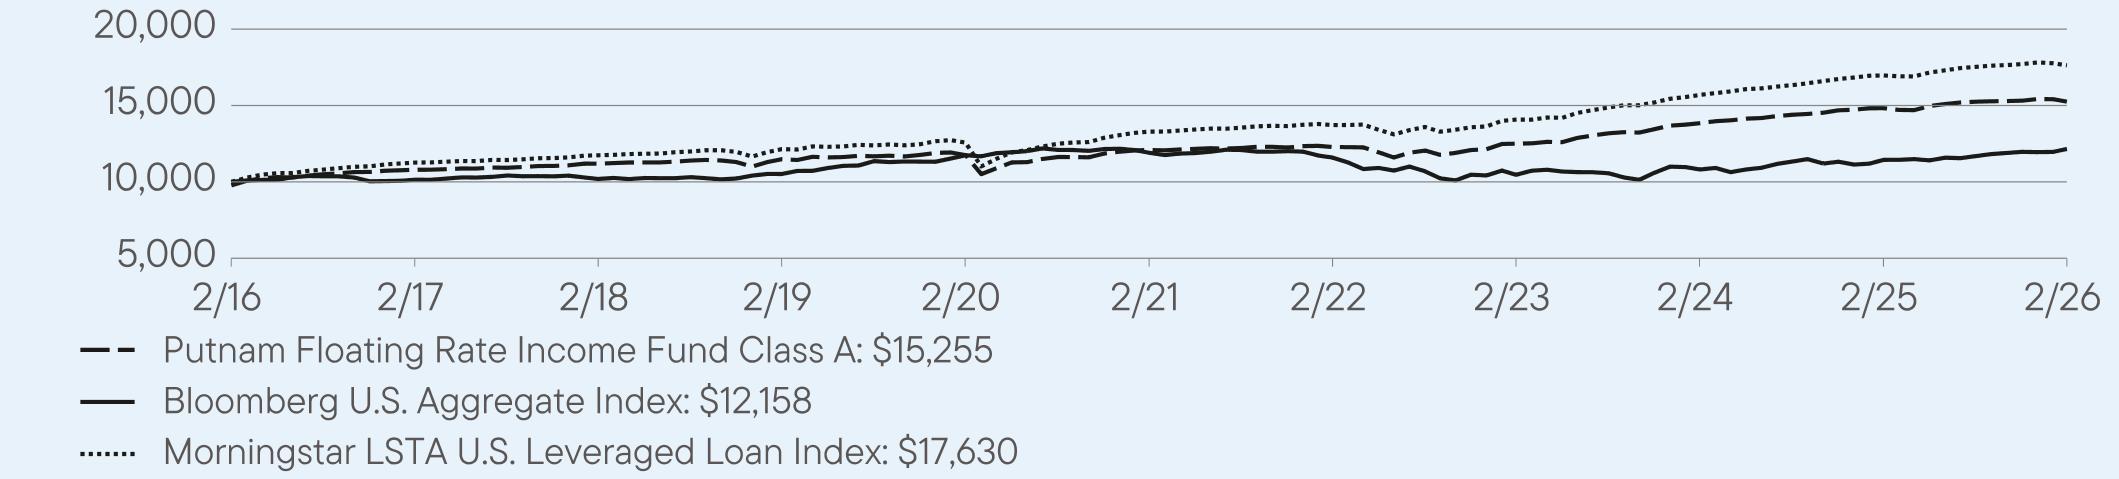
HOW
DID THE FUND PERFORM OVER THE LAST 10 YEARS?
The
Fund’s past performance is not necessarily an indication of how the Fund will perform in the future. The
graph and table do not reflect
the deduction of taxes that a shareholder would pay on Fund distributions or redemption of Fund shares.
VALUE
OF A $10,000
INVESTMENT ($9,775
AFTER MAXIMUM APPLICABLE SALES CHARGE) –
Class
A 2/29/2016 —
2/28/2026
AVERAGE
ANNUAL TOTAL RETURNS (%) Period
Ended February 28, 2026
|
|
|
|
|
|
1
Year |
5
Year |
10
Year |
|
Class
A |
2.91
|
4.79
|
4.56
|
|
Class
A (with sales charge) |
3.96
|
5.87
|
5.65
|
|
Bloomberg
U.S. Aggregate Index |
6.26
|
0.42
|
1.97
|
|
Morningstar
LSTA U.S. Leveraged Loan Index |
3.93
|
5.82
|
5.84
|
Fund
performance figures may reflect fee waivers and/or expense reimbursements, without which the performance would have been lower.
Performance
for periods prior to December 1, 2018, has been restated to reflect the current maximum sales charge, which is higher than the
maximum sales charge prior to that date.
For current month-end performance,
please call Franklin Templeton at (800)
225-1581 or visit
https://www.franklintempleton.com/investments/options/mutual-funds.
Important data provider notices
and terms available at www.franklintempletondatasources.com.
KEY
FUND STATISTICS (as
of February 28, 2026)
|
|
|
Total
Net Assets |
$292,993,716
|
|
Total
Number of Portfolio Holdings (excludes derivatives, except purchased options, if any) |
232
|
|
Total
Management Fee Paid |
$1,808,460
|
|
Portfolio
Turnover Rate |
34%
|
| Putnam
Floating Rate Income Fund |
PAGE
2 |
38963-ATSA-0426 |
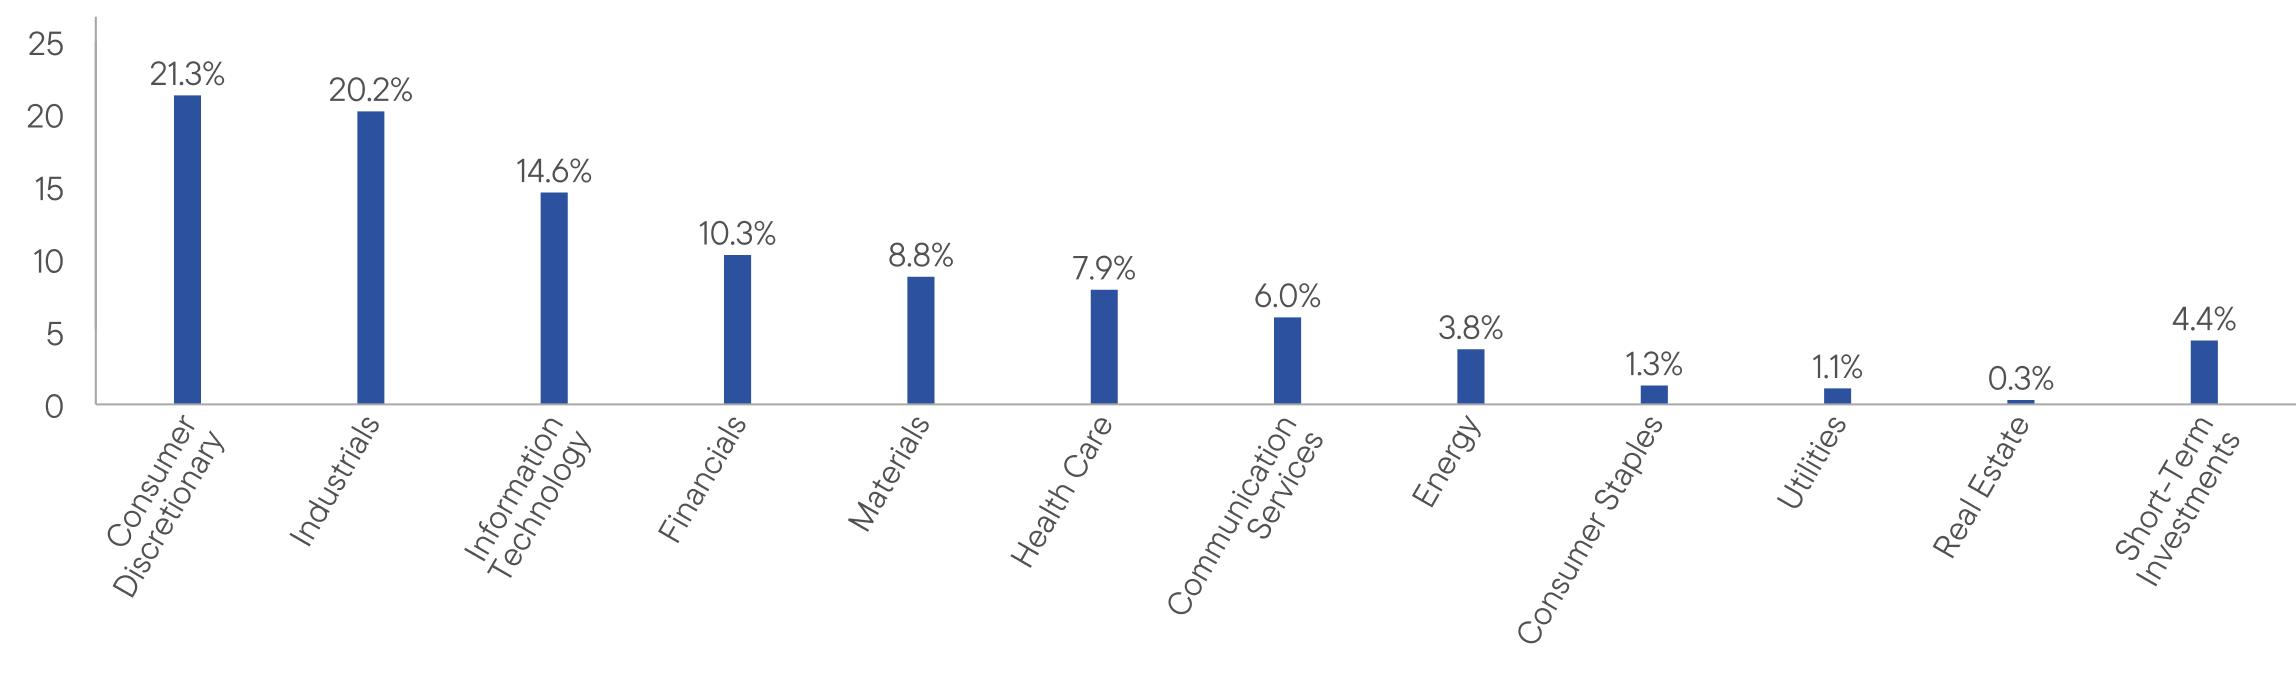
Portfolio Composition*
(% of Total Investments)
| * |
Does
not include derivatives, except purchased options, if any. |
|
|
|
|
WHERE
CAN I FIND ADDITIONAL INFORMATION ABOUT THE FUND? |
|
Additional
information is available on https://www.franklintempleton.com/regulatory-fund-documents,
including its: |
|
•
prospectus • proxy voting information • financial information • holdings • tax information |
HOUSEHOLDING
You
will receive the Fund’s shareholder reports every six months. In addition, you will receive an annual updated summary prospectus
(detail prospectus available
upon request). To reduce Fund expenses, we try to identify related shareholders in a household and send only
one copy of the shareholder reports and summary prospectus. This process, called “householding,” will continue indefinitely
unless you instruct us otherwise.
If you prefer not to have these documents householded, please call us at (800)
225-1581. At any time, you
may view current prospectuses/summary prospectuses and shareholder reports on our website. If you choose, you may receive these
documents through electronic delivery.
| Putnam
Floating Rate Income Fund |
PAGE
3 |
38963-ATSA-0426 |
9775107921119311484117491208712284125021384514823152551000010142101931051611744119071159210465108131144112158100001126611741121441256513290137191407815696169681763021.320.214.610.38.87.96.03.81.31.10.34.4
|
|
|
|
Putnam
Floating Rate Income Fund |
|
|
Class
C [PFICX]
|
|
Annual
Shareholder Report | February
28, 2026 |
|
|
This
annual
shareholder report
contains important information about Putnam
Floating Rate Income Fund for the period March
1, 2025, to February 28, 2026.
You
can find additional information about the Fund at https://www.franklintempleton.com/regulatory-fund-documents.
You can also request this information
by contacting us at (800)
225-1581.
|
|
|
|
Class
Name |
Costs
of a $10,000 investment
|
Costs
paid as a percentage of a $10,000
investment |
|
Class
C |
$175
|
%
|
HOW
DID THE FUND PERFORM LAST YEAR AND WHAT AFFECTED ITS PERFORMANCE?
For the twelve months ended February
28, 2026, Class C shares of
Putnam Floating Rate Income Fund returned 2.15%.
The Fund compares its performance
to the Morningstar LSTA U.S. Leveraged Loan Index, which returned 3.93% for the same period.
|
|
|
Top
contributors to performance: |
|
↑
|
Security
selection within the consumer products sector and overweight positioning and security selection within retail |
|
↑
|
Overweight
exposure to Viasat, a broadband and communications products and services provider |
|
|
|
Top
detractors from performance: |
|
↓
|
Overweight
positioning and security selection within the chemicals sector |
|
↓
|
Overweight
exposure to Vibrantz Technology, a specialty chemicals company |
Use of derivatives and the
impact on performance:
The Fund utilized credit default
swap contracts to manage credit exposure, which contributed to performance during the period.
| Putnam
Floating Rate Income Fund |
PAGE
1 |
38963-ATSC-0426 |
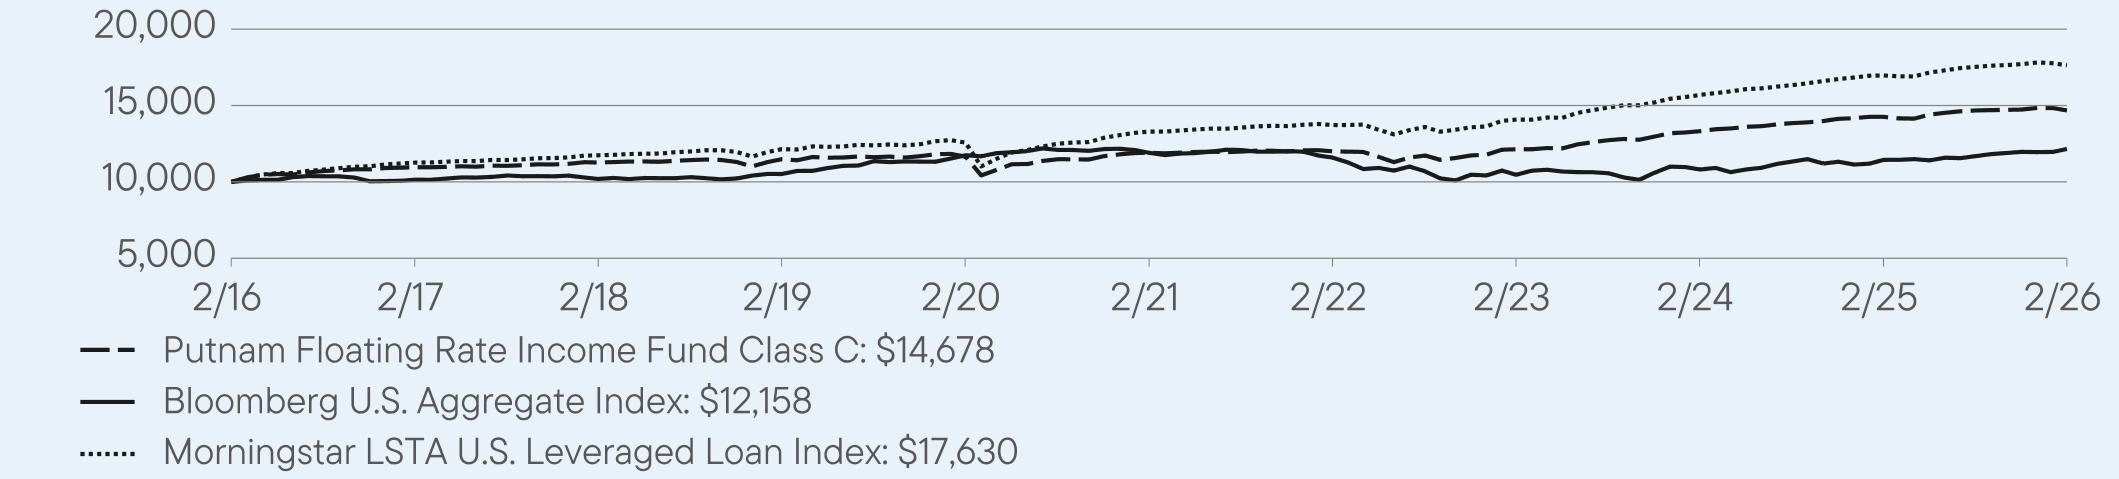
HOW
DID THE FUND PERFORM OVER THE LAST 10 YEARS?
The
Fund’s past performance is not necessarily an indication of how the Fund will perform in the future. The
graph and table do not reflect
the deduction of taxes that a shareholder would pay on Fund distributions or redemption of Fund shares.
VALUE
OF A $10,000
INVESTMENT – Class
C 2/29/2016 —
2/28/2026
AVERAGE
ANNUAL TOTAL RETURNS (%) Period
Ended February 28, 2026
|
|
|
|
|
|
1
Year |
5
Year |
10
Year |
|
Class
C |
2.15
|
3.98
|
3.93
|
|
Class
C (with sales charge) |
3.98
|
5.86
|
5.65
|
|
Bloomberg
U.S. Aggregate Index |
6.26
|
0.42
|
1.97
|
|
Morningstar
LSTA U.S. Leveraged Loan Index |
3.93
|
5.82
|
5.84
|
Fund
performance figures may reflect fee waivers and/or expense reimbursements, without which the performance would have been lower.
Class
C share performance reflects conversion to class A shares after eight years.
For current month-end performance,
please call Franklin Templeton at (800)
225-1581 or visit
https://www.franklintempleton.com/investments/options/mutual-funds.
Important data provider notices
and terms available at www.franklintempletondatasources.com.
KEY
FUND STATISTICS (as
of February 28, 2026)
|
|
|
Total
Net Assets |
$292,993,716
|
|
Total
Number of Portfolio Holdings (excludes derivatives, except purchased options, if any) |
232
|
|
Total
Management Fee Paid |
$1,808,460
|
|
Portfolio
Turnover Rate |
34%
|
| Putnam
Floating Rate Income Fund |
PAGE
2 |
38963-ATSC-0426 |
Portfolio Composition*
(% of Total Investments)
| * |
Does
not include derivatives, except purchased options, if any. |
|
|
|
|
WHERE
CAN I FIND ADDITIONAL INFORMATION ABOUT THE FUND? |
|
Additional
information is available on https://www.franklintempleton.com/regulatory-fund-documents,
including its: |
|
•
prospectus • proxy voting information • financial information • holdings • tax information |
HOUSEHOLDING
You
will receive the Fund’s shareholder reports every six months. In addition, you will receive an annual updated summary prospectus
(detail prospectus available
upon request). To reduce Fund expenses, we try to identify related shareholders in a household and send only
one copy of the shareholder reports and summary prospectus. This process, called “householding,” will continue indefinitely
unless you instruct us otherwise.
If you prefer not to have these documents householded, please call us at (800)
225-1581. At any time, you
may view current prospectuses/summary prospectuses and shareholder reports on our website. If you choose, you may receive these
documents through electronic delivery.
| Putnam
Floating Rate Income Fund |
PAGE
3 |
38963-ATSC-0426 |
10000109581126711487116501190911998121351332114262146781000010142101931051611744119071159210465108131144112158100001126611741121441256513290137191407815696169681763021.320.214.610.38.87.96.03.81.31.10.34.4
|
|
|
|
Putnam
Floating Rate Income Fund |
|
|
Class
R [PFLLX]
|
|
Annual
Shareholder Report | February
28, 2026 |
|
|
This
annual
shareholder report
contains important information about Putnam
Floating Rate Income Fund for the period March
1, 2025, to February 28, 2026.
You
can find additional information about the Fund at https://www.franklintempleton.com/regulatory-fund-documents.
You can also request this information
by contacting us at (800)
225-1581.
|
|
|
|
Class
Name |
Costs
of a $10,000 investment
|
Costs
paid as a percentage of a $10,000
investment |
|
Class
R |
$125
|
%
|
HOW
DID THE FUND PERFORM LAST YEAR AND WHAT AFFECTED ITS PERFORMANCE?
For the twelve months ended February
28, 2026, Class R shares of
Putnam Floating Rate Income Fund returned 2.66%.
The Fund compares its performance
to the Morningstar LSTA U.S. Leveraged Loan Index, which returned 3.93% for the same period.
|
|
|
Top
contributors to performance: |
|
↑
|
Security
selection within the consumer products sector and overweight positioning and security selection within retail |
|
↑
|
Overweight
exposure to Viasat, a broadband and communications products and services provider |
|
|
|
Top
detractors from performance: |
|
↓
|
Overweight
positioning and security selection within the chemicals sector |
|
↓
|
Overweight
exposure to Vibrantz Technology, a specialty chemicals company |
Use of derivatives and the
impact on performance:
The Fund utilized credit default
swap contracts to manage credit exposure, which contributed to performance during the period.
| Putnam
Floating Rate Income Fund |
PAGE
1 |
38963-ATSR-0426 |
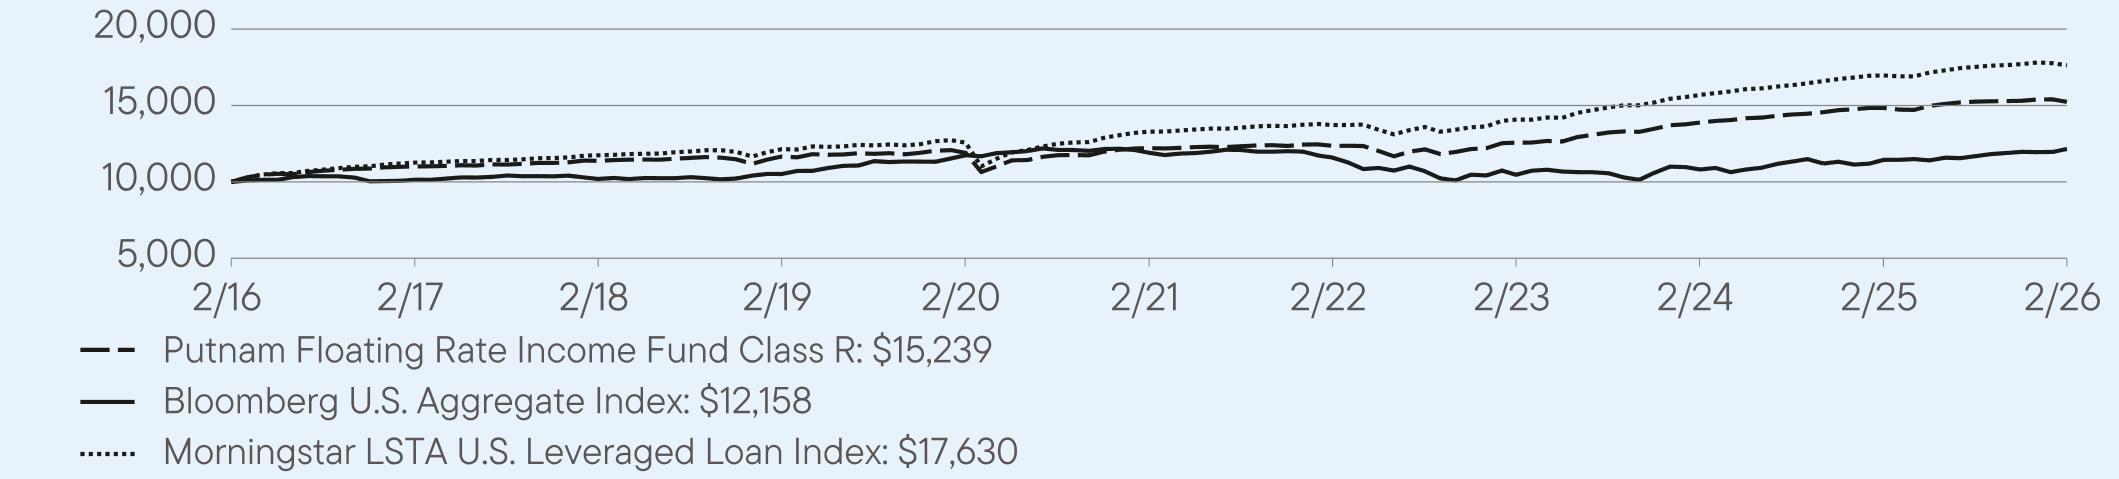
HOW
DID THE FUND PERFORM OVER THE LAST 10 YEARS?
The
Fund’s past performance is not necessarily an indication of how the Fund will perform in the future. The
graph and table do not reflect
the deduction of taxes that a shareholder would pay on Fund distributions or redemption of Fund shares.
VALUE
OF A $10,000
INVESTMENT – Class
R 2/29/2016 —
2/28/2026
AVERAGE
ANNUAL TOTAL RETURNS (%) Period
Ended February 28, 2026
|
|
|
|
|
|
1
Year |
5
Year |
10
Year |
|
Class
R |
2.66
|
4.53
|
4.30
|
|
Bloomberg
U.S. Aggregate Index |
6.26
|
0.42
|
1.97
|
|
Morningstar
LSTA U.S. Leveraged Loan Index |
3.93
|
5.82
|
5.84
|
Fund
performance figures may reflect fee waivers and/or expense reimbursements, without which the performance would have been lower.
For current month-end performance,
please call Franklin Templeton at (800)
225-1581 or visit
https://www.franklintempleton.com/investments/options/mutual-funds.
Important data provider notices
and terms available at www.franklintempletondatasources.com.
KEY
FUND STATISTICS (as
of February 28, 2026)
|
|
|
Total
Net Assets |
$292,993,716
|
|
Total
Number of Portfolio Holdings (excludes derivatives, except purchased options, if any) |
232
|
|
Total
Management Fee Paid |
$1,808,460
|
|
Portfolio
Turnover Rate |
34%
|
Portfolio Composition*
(% of Total Investments)
| * |
Does
not include derivatives, except purchased options, if any. |
| Putnam
Floating Rate Income Fund |
PAGE
2 |
38963-ATSR-0426 |
|
|
|
|
WHERE
CAN I FIND ADDITIONAL INFORMATION ABOUT THE FUND? |
|
Additional
information is available on https://www.franklintempleton.com/regulatory-fund-documents,
including its: |
|
•
prospectus • proxy voting information • financial information • holdings • tax information |
HOUSEHOLDING
You
will receive the Fund’s shareholder reports every six months. In addition, you will receive an annual updated summary prospectus
(detail prospectus available
upon request). To reduce Fund expenses, we try to identify related shareholders in a household and send only
one copy of the shareholder reports and summary prospectus. This process, called “householding,” will continue indefinitely
unless you instruct us otherwise.
If you prefer not to have these documents householded, please call us at (800)
225-1581. At any time, you
may view current prospectuses/summary prospectuses and shareholder reports on our website. If you choose, you may receive these
documents through electronic delivery.
| Putnam
Floating Rate Income Fund |
PAGE
3 |
38963-ATSR-0426 |
10000110131138011661119001221112364125681388214844152391000010142101931051611744119071159210465108131144112158100001126611741121441256513290137191407815696169681763021.320.214.610.38.87.96.03.81.31.10.34.4
|
|
|
|
Putnam
Floating Rate Income Fund |
|
|
Class
R6 [PFRZX]
|
|
Annual
Shareholder Report | February
28, 2026 |
|
|
This
annual
shareholder report
contains important information about Putnam
Floating Rate Income Fund for the period March
1, 2025, to February 28, 2026.
You
can find additional information about the Fund at https://www.franklintempleton.com/regulatory-fund-documents.
You can also request this information
by contacting us at (800)
225-1581.
|
|
|
|
Class
Name |
Costs
of a $10,000 investment
|
Costs
paid as a percentage of a $10,000
investment |
|
Class
R6 |
$68
|
%
|
HOW
DID THE FUND PERFORM LAST YEAR AND WHAT AFFECTED ITS PERFORMANCE?
For the twelve months ended February
28, 2026, Class R6 shares of
Putnam Floating Rate Income Fund returned 3.10%.
The Fund compares its performance
to the Morningstar LSTA U.S. Leveraged Loan Index, which returned 3.93% for the same period.
|
|
|
Top
contributors to performance: |
|
↑
|
Security
selection within the consumer products sector and overweight positioning and security selection within retail |
|
↑
|
Overweight
exposure to Viasat, a broadband and communications products and services provider |
|
|
|
Top
detractors from performance: |
|
↓
|
Overweight
positioning and security selection within the chemicals sector |
|
↓
|
Overweight
exposure to Vibrantz Technology, a specialty chemicals company |
Use of derivatives and the
impact on performance:
The Fund utilized credit default
swap contracts to manage credit exposure, which contributed to performance during the period.
| Putnam
Floating Rate Income Fund |
PAGE
1 |
38963-ATSR6-0426 |
HOW
DID THE FUND PERFORM OVER THE LAST 10 YEARS?
The
Fund’s past performance is not necessarily an indication of how the Fund will perform in the future. The
graph and table do not reflect
the deduction of taxes that a shareholder would pay on Fund distributions or redemption of Fund shares.
VALUE
OF A $10,000
INVESTMENT – Class
R6 2/29/2016 —
2/28/2026
AVERAGE
ANNUAL TOTAL RETURNS (%) Period
Ended February 28, 2026
|
|
|
|
|
|
1
Year |
5
Year |
10
Year |
|
Class
R6 |
3.10
|
5.10
|
4.87
|
|
Bloomberg
U.S. Aggregate Index |
6.26
|
0.42
|
1.97
|
|
Morningstar
LSTA U.S. Leveraged Loan Index |
3.93
|
5.82
|
5.84
|
Fund
performance figures may reflect fee waivers and/or expense reimbursements, without which the performance would have been lower.
The
Fund began offering Class R6 shares on 5/22/2018. Returns for periods before 5/22/2018 are based on the Fund’s Class Y performance,
which has not been adjusted for the lower operating expenses; had it been adjusted, performance would have been higher.
For periods after the share class offering, performance for the specific share class is used, reflecting the applicable expenses and
maximum sales charges.
For current month-end performance,
please call Franklin Templeton at (800)
225-1581 or visit
https://www.franklintempleton.com/investments/options/mutual-funds.
Important data provider notices
and terms available at www.franklintempletondatasources.com.
KEY
FUND STATISTICS (as
of February 28, 2026)
|
|
|
Total
Net Assets |
$292,993,716
|
|
Total
Number of Portfolio Holdings (excludes derivatives, except purchased options, if any) |
232
|
|
Total
Management Fee Paid |
$1,808,460
|
|
Portfolio
Turnover Rate |
34%
|
| Putnam
Floating Rate Income Fund |
PAGE
2 |
38963-ATSR6-0426 |
Portfolio Composition*
(% of Total Investments)
| * |
Does
not include derivatives, except purchased options, if any. |
|
|
|
|
WHERE
CAN I FIND ADDITIONAL INFORMATION ABOUT THE FUND? |
|
Additional
information is available on https://www.franklintempleton.com/regulatory-fund-documents,
including its: |
|
•
prospectus • proxy voting information • financial information • holdings • tax information |
HOUSEHOLDING
You
will receive the Fund’s shareholder reports every six months. In addition, you will receive an annual updated summary prospectus
(detail prospectus available
upon request). To reduce Fund expenses, we try to identify related shareholders in a household and send only
one copy of the shareholder reports and summary prospectus. This process, called “householding,” will continue indefinitely
unless you instruct us otherwise.
If you prefer not to have these documents householded, please call us at (800)
225-1581. At any time, you
may view current prospectuses/summary prospectuses and shareholder reports on our website. If you choose, you may receive these
documents through electronic delivery.
| Putnam
Floating Rate Income Fund |
PAGE
3 |
38963-ATSR6-0426 |
10000110671150711839121541254712777130631451315607160911000010142101931051611744119071159210465108131144112158100001126611741121441256513290137191407815696169681763021.320.214.610.38.87.96.03.81.31.10.34.4
|
|
|
|
Putnam
Floating Rate Income Fund |
|
|
Class
Y [PFRYX]
|
|
Annual
Shareholder Report | February
28, 2026 |
|
|
This
annual
shareholder report
contains important information about Putnam
Floating Rate Income Fund for the period March
1, 2025, to February 28, 2026.
You
can find additional information about the Fund at https://www.franklintempleton.com/regulatory-fund-documents.
You can also request this information
by contacting us at (800)
225-1581.
|
|
|
|
Class
Name |
Costs
of a $10,000 investment
|
Costs
paid as a percentage of a $10,000
investment |
|
Class
Y |
$74
|
%
|
HOW
DID THE FUND PERFORM LAST YEAR AND WHAT AFFECTED ITS PERFORMANCE?
For the twelve months ended February
28, 2026, Class Y shares of
Putnam Floating Rate Income Fund returned 3.04%.
The Fund compares its performance
to the Morningstar LSTA U.S. Leveraged Loan Index, which returned 3.93% for the same period.
|
|
|
Top
contributors to performance: |
|
↑
|
Security
selection within the consumer products sector and overweight positioning and security selection within retail |
|
↑
|
Overweight
exposure to Viasat, a broadband and communications products and services provider |
|
|
|
Top
detractors from performance: |
|
↓
|
Overweight
positioning and security selection within the chemicals sector |
|
↓
|
Overweight
exposure to Vibrantz Technology, a specialty chemicals company |
Use of derivatives and the
impact on performance:
The Fund utilized credit default
swap contracts to manage credit exposure, which contributed to performance during the period.
| Putnam
Floating Rate Income Fund |
PAGE
1 |
38963-ATSY-0426 |
HOW
DID THE FUND PERFORM OVER THE LAST 10 YEARS?
The
Fund’s past performance is not necessarily an indication of how the Fund will perform in the future. The
graph and table do not reflect
the deduction of taxes that a shareholder would pay on Fund distributions or redemption of Fund shares.
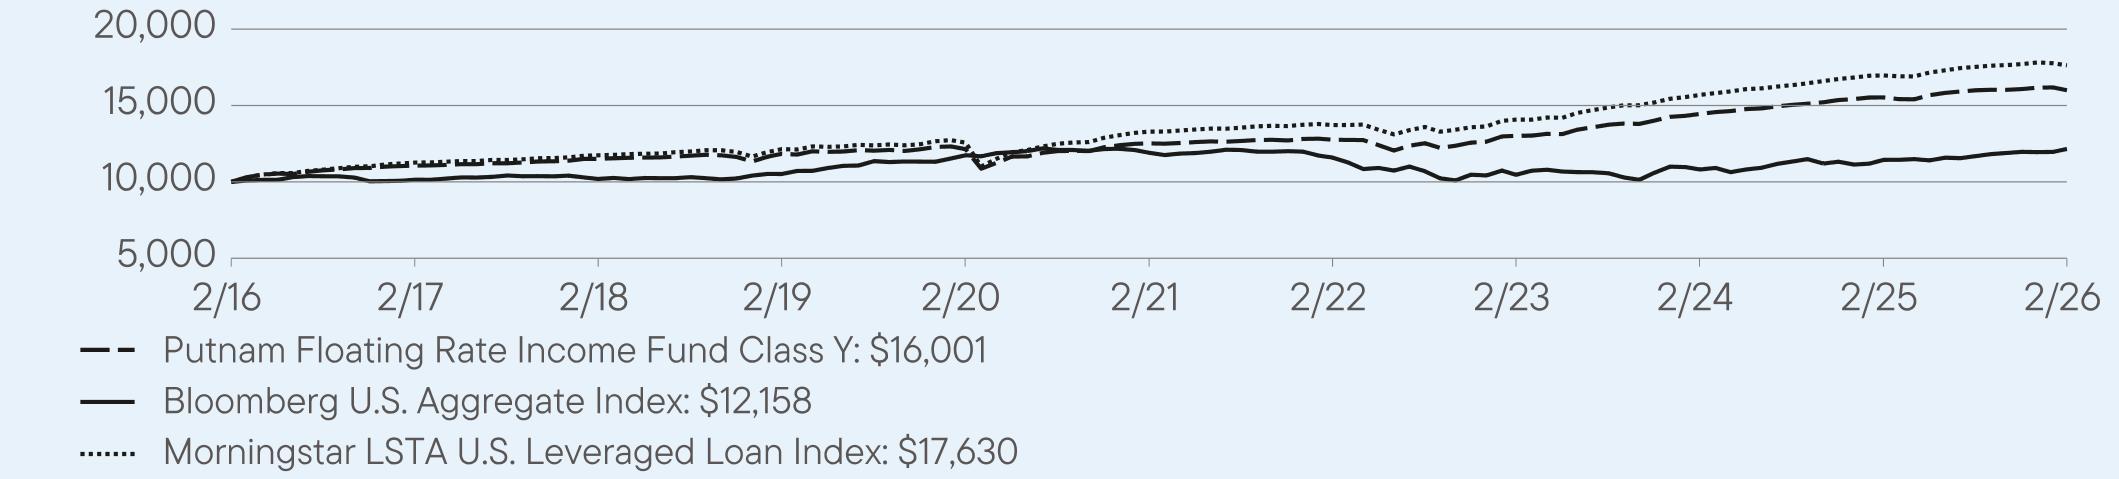
VALUE
OF A $10,000
INVESTMENT – Class
Y 2/29/2016 —
2/28/2026
AVERAGE
ANNUAL TOTAL RETURNS (%) Period
Ended February 28, 2026
|
|
|
|
|
|
1
Year |
5
Year |
10
Year |
|
Class
Y |
3.04
|
5.03
|
4.81
|
|
Bloomberg
U.S. Aggregate Index |
6.26
|
0.42
|
1.97
|
|
Morningstar
LSTA U.S. Leveraged Loan Index |
3.93
|
5.82
|
5.84
|
Fund
performance figures may reflect fee waivers and/or expense reimbursements, without which the performance would have been lower.
For current month-end performance,
please call Franklin Templeton at (800)
225-1581 or visit
https://www.franklintempleton.com/investments/options/mutual-funds.
Important data provider notices
and terms available at www.franklintempletondatasources.com.
KEY
FUND STATISTICS (as
of February 28, 2026)
|
|
|
Total
Net Assets |
$292,993,716
|
|
Total
Number of Portfolio Holdings (excludes derivatives, except purchased options, if any) |
232
|
|
Total
Management Fee Paid |
$1,808,460
|
|
Portfolio
Turnover Rate |
34%
|
Portfolio Composition*
(% of Total Investments)
| * |
Does
not include derivatives, except purchased options, if any. |
| Putnam
Floating Rate Income Fund |
PAGE
2 |
38963-ATSY-0426 |
|
|
|
|
WHERE
CAN I FIND ADDITIONAL INFORMATION ABOUT THE FUND? |
|
Additional
information is available on https://www.franklintempleton.com/regulatory-fund-documents,
including its: |
|
•
prospectus • proxy voting information • financial information • holdings • tax information |
HOUSEHOLDING
You
will receive the Fund’s shareholder reports every six months. In addition, you will receive an annual updated summary prospectus
(detail prospectus available
upon request). To reduce Fund expenses, we try to identify related shareholders in a household and send only
one copy of the shareholder reports and summary prospectus. This process, called “householding,” will continue indefinitely
unless you instruct us otherwise.
If you prefer not to have these documents householded, please call us at (800)
225-1581. At any time, you
may view current prospectuses/summary prospectuses and shareholder reports on our website. If you choose, you may receive these
documents through electronic delivery.
| Putnam
Floating Rate Income Fund |
PAGE
3 |
38963-ATSY-0426 |
10000110671150711836121401252112757130171445015529160011000010142101931051611744119071159210465108131144112158100001126611741121441256513290137191407815696169681763021.320.214.610.38.87.96.03.81.31.10.34.4
(b) Not applicable
(a) The Registrant has adopted a code of ethics that applies to
its principal executive officers and principal financial officer.
(c) N/A
(d) N/A
(f) Pursuant to Item 19(a) (1), the Registrant is attaching as
an exhibit a copy of its code of ethics that applies to its principal executive officers and principal financial officer.
| ITEM 3. |
|
AUDIT COMMITTEE FINANCIAL EXPERT. |
The Board of Trustees of the Registrant has determined that Warren
Lowell and Manoj P. Singh possess the technical attributes identified in Item 3 to Form N-CSR to qualify as “audit committee financial
experts,” and has designated Warren Lowell and Manoj P. Singh as the Audit Committee’s financial experts. Warren Lowell and
Manoj P. Singh are “independent” Trustees pursuant to paragraph (a)(2) of Item 3 to Form N-CSR.
Under applicable securities laws, a person determined to be an
audit committee financial expert will not be deemed an “expert” for any purpose, including without limitation for the purposes
of Section 11 of the Securities Act of 1933, as a result of being designated or identified as an audit committee financial expert. The
designation or identification of a person as an audit committee financial expert does not impose on such person any duties, obligations,
or liabilities greater than the duties, obligations, and liabilities imposed on such person as a member of the audit committee and board
of directors in the absence of such designation or identification. The designation or identification of a person as an audit committee
financial expert does not affect the duties, obligations, or liability of any other member of the audit committee or board of directors.
|
ITEM 4. |
PRINCIPAL ACCOUNTANT FEES AND SERVICES. |
(a) Audit Fees.
The aggregate fees billed in the last two fiscal years ending February 28, 2025 and February 28, 2026 (the “Reporting Periods”)
for professional services rendered by the Registrant’s principal accountant (the “Auditor”) for the audit of the Registrant’s
annual financial statements, or services that are normally provided by the Auditor in connection with the statutory and regulatory filings
or engagements for the Reporting Periods, were $84,586 in February 28, 2025 and $85,170 in February 28, 2026.
(b) Audit-Related Fees.
The aggregate fees billed in the Reporting Periods for assurance and related services by the Auditor that are reasonably related to the
performance of the Registrant’s financial statements were $0 in February 28, 2025 and $0 in February 28, 2026.
(c) Tax
Fees. The aggregate fees billed in the Reporting Periods for professional services rendered by the Auditor for tax compliance,
tax advice and tax planning (“Tax Services”) were $9,614 in February 28, 2025 and $16,024 in February 28, 2026. These services
consisted of (i) review or preparation of U.S. federal, state, local and excise tax returns; (ii) U.S. federal, state and local tax planning,
advice and assistance regarding statutory, regulatory or administrative developments, and (iii) tax advice regarding tax qualification
matters and/or treatment of various financial instruments held or proposed to be acquired or held.
There were no fees billed for tax services by the Registrant’s
investment adviser and any entity controlling, controlled by, or under common control with the investment adviser that provides ongoing
services to the Registrant (“Service Affiliates”) during the Reporting Periods that required pre-approval by the Audit Committee.
(d) All Other Fees.
The aggregate fees billed in the Reporting Periods for products and services provided by the Auditor to the Registrant, other than the
services reported in paragraphs (a) through (c) of this item, were $0 in February 28, 2025
and $0 in February 28, 2026.
There were no other non-audit services rendered by the Auditor
to the Service Affiliates requiring pre-approval by the Audit Committee in the Reporting Periods.
(e) Audit Committee’s pre–approval policies and procedures
described in paragraph (c) (7) of Rule 2-01 of Regulation S-X.
Pre-Approval Policies of the Audit, Compliance and Risk Committee.
The Audit, Compliance and Risk Committee of the Putnam funds has determined that, as a matter of policy, all work performed for the funds
by the funds’ independent auditors will be pre-approved by the Committee itself and thus will generally not be subject to pre-approval
procedures.
The Audit, Compliance and Risk Committee also has adopted a policy
to pre-approve the engagement by the fund’s investment manager and certain of its affiliates of the fund’s independent auditors,
even in circumstances where pre-approval is not required by applicable law. Any such requests by the fund’s investment manager or
certain of its affiliates are typically submitted in writing to the Committee and explain, among other things, the nature of the proposed
engagement, the estimated fees, and why this work should be performed by that particular audit firm as opposed to another one. In reviewing
such requests, the Committee considers, among other things, whether the provision of such services by the audit firm are compatible with
the independence of the audit firm.
(2) None of the services described in paragraphs (b) through (d)
of this Item were performed in reliance on paragraph (c)(7)(i)(C) of Rule 2-01 of Regulation S-X.
(f) Not applicable.
(g) Non-audit fees billed by the Auditor for services rendered
to the Registrant and the Service Affiliates during the reporting period were $518,325 in February 28, 2025 and $1,557,011 in February
28, 2026.
(h) Yes. The Registrant’s Audit Committee has considered
whether the provision of non-audit services that were rendered to Service Affiliates, which were not pre-approved (not requiring pre-approval),
is compatible with maintaining the Auditor’s independence. All services provided by the Auditor to the Registrant or to the Service
Affiliates, which were required to be pre-approved, were pre-approved as required.
(i) Not applicable.
(j) Not applicable
| ITEM 5. |
|
AUDIT COMMITTEE OF LISTED REGISTRANTS. |
Not applicable.
| ITEM 6. |
|
SCHEDULE OF INVESTMENTS. |
|
(a) |
Please see schedule of investments contained in the Financial Statements and Financial Highlights included under Item 7 of this Form N-CSR. |
|
ITEM 7. |
FINANCIAL STATEMENTS AND FINANCIAL HIGHLIGHTS FOR OPEN-END MANAGEMENT INVESTMENT COMPANIES. |
Putnam
Floating
Rate
Income
Fund
Financial
Statements
and
Other
Important
Information
Annual
|
February
28,
2026
If
you
need
assistance
accessing
this
content,
please
reach
out
to
your
sales
representative
or
send
an
email
to
accessibility@franklintempleton.com
.
Financial
Statements
and
Other
Important
Information—Annual
Financial
Highlights
and
Schedule
of
Investments
2
Financial
Statements
20
Notes
to
Financial
Statements
24
Report
of
Independent
Registered
Public
Accounting
Firm
35
Tax
Information
36
Changes
In
and
Disagreements
with
Accountants
37
Results
of
Meeting(s)
of
Shareholders
37
Remuneration
Paid
to
Directors,
Officers
and
Others
37
Board
Approval
of
Management
and
Subadvisory
Agreements
37
Financial
Highlights
Putnam
Floating
Rate
Income
Fund
Annual
Report
The
accompanying
notes
are
an
integral
part
of
these
financial
statements.
a
Year
Ended
February
28,
2026
2025
2024
a
2023
2022
Class
A
Per
share
operating
performance
(for
a
share
outstanding
throughout
the
year)
Net
asset
value,
beginning
of
year
...................
$7.96
$7.98
$7.89
$8.18
$8.27
Income
from
investment
operations
b
:
Net
investment
income
c
.........................
0.53
0.59
0.65
0.41
0.22
Net
realized
and
unrealized
gains
(losses)
...........
(0.31)
(0.04)
0.16
(0.28)
(0.09)
Total
from
investment
operations
....................
0.22
0.55
0.81
0.13
0.13
Less
distributions
from:
Net
investment
income
..........................
(0.53)
(0.57)
(0.69)
(0.42)
(0.22)
Tax
return
of
capital
............................
—
—
(0.03)
—
—
Total
distributions
...............................
(0.53)
(0.57)
(0.72)
(0.42)
(0.22)
Net
asset
value,
end
of
year
.......................
$7.65
$7.96
$7.98
$7.89
$8.18
Total
return
d
...................................
2.91%
7.20%
10.74%
1.78%
1.63%
Ratios
to
average
net
assets
Expenses
before
waiver
and
payments
by
affiliates
and
expense
reduction
...............................
0.99%
1.00%
1.04%
1.03%
1.00%
Expenses
net
of
waiver
and
payments
by
affiliates
and
expense
reduction
...............................
0.98%
1.00%
e
1.04%
e
1.03%
e
1.00%
e
Net
investment
income
...........................
6.68%
7.43%
8.20%
5.14%
2.70%
Supplemental
data
Net
assets
,
end
of
year
(000’s)
.....................
$187,584
$238,102
$227,247
$205,018
$268,621
Portfolio
turnover
rate
............................
34%
37%
31%
26%
42%
a
For
the
year
ended
February
29.
b
The
amount
shown
for
a
share
outstanding
throughout
the
period
may
not
correlate
with
the
Statement
of
Operations
for
the
period
due
to
the
timing
of
sales
and
repurchases
of
the
Fund’s
shares
in
relation
to
income
earned
and/or
fluctuating
fair
value
of
the
investments
of
the
Fund.
c
Based
on
average
daily
shares
outstanding.
d
Total
return
does
not
reflect
sales
commissions
or
contingent
deferred
sales
charges,
if
applicable.
e
Benefit
of
expense
reduction
rounds
to
less
than
0.01%.
Putnam
Funds
Trust
Financial
Highlights
Putnam
Floating
Rate
Income
Fund
(continued)
The
accompanying
notes
are
an
integral
part
of
these
financial
statements.
Annual
Report
c
a
Year
Ended
February
28,
2026
2025
2024
a
2023
2022
Class
C
Per
share
operating
performance
(for
a
share
outstanding
throughout
the
year)
Net
asset
value,
beginning
of
year
...................
$7.95
$7.97
$7.89
$8.17
$8.27
Income
from
investment
operations
b
:
Net
investment
income
c
.........................
0.47
0.54
0.59
0.35
0.16
Net
realized
and
unrealized
gains
(losses)
...........
(0.30)
(0.05)
0.15
(0.27)
(0.10)
Total
from
investment
operations
....................
0.17
0.49
0.74
0.08
0.06
Less
distributions
from:
Net
investment
income
..........................
(0.47)
(0.51)
(0.63)
(0.36)
(0.16)
Tax
return
of
capital
............................
—
—
(0.03)
—
—
Total
distributions
...............................
(0.47)
(0.51)
(0.66)
(0.36)
(0.16)
Net
asset
value,
end
of
year
.......................
$7.65
$7.95
$7.97
$7.89
$8.17
Total
return
d
...................................
2.15%
6.39%
9.77%
1.14%
0.74%
Ratios
to
average
net
assets
Expenses
before
waiver
and
payments
by
affiliates
and
expense
reduction
...............................
1.74%
1.75%
1.79%
1.78%
1.75%
Expenses
net
of
waiver
and
payments
by
affiliates
and
expense
reduction
...............................
1.73%
1.75%
e
1.79%
e
1.78%
e
1.75%
e
Net
investment
income
...........................
5.93%
6.71%
7.45%
4.45%
1.94%
Supplemental
data
Net
assets
,
end
of
year
(000’s)
.....................
$14,773
$17,634
$20,659
$21,993
$24,485
Portfolio
turnover
rate
............................
34%
37%
31%
26%
42%
a
For
the
year
ended
February
29.
b
The
amount
shown
for
a
share
outstanding
throughout
the
period
may
not
correlate
with
the
Statement
of
Operations
for
the
period
due
to
the
timing
of
sales
and
repurchases
of
the
Fund’s
shares
in
relation
to
income
earned
and/or
fluctuating
fair
value
of
the
investments
of
the
Fund.
c
Based
on
average
daily
shares
outstanding.
d
Total
return
does
not
reflect
sales
commissions
or
contingent
deferred
sales
charges,
if
applicable.
e
Benefit
of
expense
reduction
rounds
to
less
than
0.01%.
Putnam
Funds
Trust
Financial
Highlights
Putnam
Floating
Rate
Income
Fund
(continued)
Annual
Report
The
accompanying
notes
are
an
integral
part
of
these
financial
statements.
a
Year
Ended
February
28,
2026
2025
2024
a
2023
2022
Class
R
Per
share
operating
performance
(for
a
share
outstanding
throughout
the
year)
Net
asset
value,
beginning
of
year
...................
$7.96
$7.98
$7.89
$8.17
$8.27
Income
from
investment
operations
b
:
Net
investment
income
c
.........................
0.51
0.57
0.63
0.39
0.20
Net
realized
and
unrealized
gains
(losses)
...........
(0.31)
(0.04)
0.16
(0.27)
(0.10)
Total
from
investment
operations
....................
0.20
0.53
0.79
0.12
0.10
Less
distributions
from:
Net
investment
income
..........................
(0.51)
(0.55)
(0.67)
(0.40)
(0.20)
Tax
return
of
capital
............................
—
—
(0.03)
—
—
Total
distributions
...............................
(0.51)
(0.55)
(0.70)
(0.40)
(0.20)
Net
asset
value,
end
of
year
.......................
$7.65
$7.96
$7.98
$7.89
$8.17
Total
return
....................................
2.66%
6.93%
10.46%
1.65%
1.25%
Ratios
to
average
net
assets
Expenses
before
waiver
and
payments
by
affiliates
and
expense
reduction
...............................
1.24%
1.25%
1.29%
1.28%
1.25%
Expenses
net
of
waiver
and
payments
by
affiliates
and
expense
reduction
...............................
1.23%
1.25%
d
1.29%
d
1.28%
d
1.25%
d
Net
investment
income
...........................
6.44%
7.17%
7.95%
4.95%
2.44%
Supplemental
data
Net
assets
,
end
of
year
(000’s)
.....................
$321
$491
$495
$436
$554
Portfolio
turnover
rate
............................
34%
37%
31%
26%
42%
a
For
the
year
ended
February
29.
b
The
amount
shown
for
a
share
outstanding
throughout
the
period
may
not
correlate
with
the
Statement
of
Operations
for
the
period
due
to
the
timing
of
sales
and
repurchases
of
the
Fund’s
shares
in
relation
to
income
earned
and/or
fluctuating
fair
value
of
the
investments
of
the
Fund.
c
Based
on
average
daily
shares
outstanding.
d
Benefit
of
expense
reduction
rounds
to
less
than
0.01%.
Putnam
Funds
Trust
Financial
Highlights
Putnam
Floating
Rate
Income
Fund
(continued)
The
accompanying
notes
are
an
integral
part
of
these
financial
statements.
Annual
Report
a
Year
Ended
February
28,
2026
2025
2024
a
2023
2022
Class
R6
Per
share
operating
performance
(for
a
share
outstanding
throughout
the
year)
Net
asset
value,
beginning
of
year
...................
$7.97
$7.99
$7.90
$8.18
$8.28
Income
from
investment
operations
b
:
Net
investment
income
c
.........................
0.55
0.62
0.67
0.43
0.25
Net
realized
and
unrealized
gains
(losses)
...........
(0.31)
(0.04)
0.16
(0.26)
(0.10)
Total
from
investment
operations
....................
0.24
0.58
0.83
0.17
0.15
Less
distributions
from:
Net
investment
income
..........................
(0.55)
(0.60)
(0.71)
(0.45)
(0.25)
Tax
return
of
capital
............................
—
—
(0.03)
—
—
Total
distributions
...............................
(0.55)
(0.60)
(0.74)
(0.45)
(0.25)
Net
asset
value,
end
of
year
.......................
$7.66
$7.97
$7.99
$7.90
$8.18
Total
return
....................................
3.10%
7.54%
11.10%
2.23%
1.83%
Ratios
to
average
net
assets
Expenses
before
waiver
and
payments
by
affiliates
and
expense
reduction
...............................
0.68%
0.69%
0.72%
0.70%
0.68%
Expenses
net
of
waiver
and
payments
by
affiliates
and
expense
reduction
...............................
0.67%
0.69%
d
0.72%
d
0.70%
d
0.68%
d
Net
investment
income
...........................
6.99%
7.82%
8.51%
5.49%
3.02%
Supplemental
data
Net
assets
,
end
of
year
(000’s)
.....................
$3,549
$3,447
$6,825
$6,110
$7,021
Portfolio
turnover
rate
............................
34%
37%
31%
26%
42%
a
For
the
year
ended
February
29.
b
The
amount
shown
for
a
share
outstanding
throughout
the
period
may
not
correlate
with
the
Statement
of
Operations
for
the
period
due
to
the
timing
of
sales
and
repurchases
of
the
Fund’s
shares
in
relation
to
income
earned
and/or
fluctuating
fair
value
of
the
investments
of
the
Fund.
c
Based
on
average
daily
shares
outstanding.
d
Benefit
of
expense
reduction
rounds
to
less
than
0.01%.
Putnam
Funds
Trust
Financial
Highlights
Putnam
Floating
Rate
Income
Fund
(continued)
Annual
Report
The
accompanying
notes
are
an
integral
part
of
these
financial
statements.
a
Year
Ended
February
28,
2026
2025
2024
a
2023
2022
Class
Y
Per
share
operating
performance
(for
a
share
outstanding
throughout
the
year)
Net
asset
value,
beginning
of
year
...................
$7.97
$7.99
$7.90
$8.19
$8.28
Income
from
investment
operations
b
:
Net
investment
income
c
.........................
0.55
0.61
0.67
0.42
0.25
Net
realized
and
unrealized
gains
(losses)
...........
(0.31)
(0.03)
0.15
(0.27)
(0.10)
Total
from
investment
operations
....................
0.24
0.58
0.82
0.15
0.15
Less
distributions
from:
Net
investment
income
..........................
(0.55)
(0.60)
(0.70)
(0.44)
(0.24)
Tax
return
of
capital
............................
—
—
(0.03)
—
—
Total
distributions
...............................
(0.55)
(0.60)
(0.73)
(0.44)
(0.24)
Net
asset
value,
end
of
year
.......................
$7.66
$7.97
$7.99
$7.90
$8.19
Total
return
....................................
3.04%
7.47%
11.01%
2.04%
1.88%
Ratios
to
average
net
assets
Expenses
before
waiver
and
payments
by
affiliates
and
expense
reduction
...............................
0.74%
0.75%
0.79%
0.78%
0.75%
Expenses
net
of
waiver
and
payments
by
affiliates
and
expense
reduction
...............................
0.73%
0.75%
d
0.79%
d
0.78%
d
0.75%
d
Net
investment
income
...........................
6.93%
7.68%
8.44%
5.32%
2.97%
Supplemental
data
Net
assets
,
end
of
year
(000’s)
.....................
$86,768
$121,804
$111,051
$136,348
$193,541
Portfolio
turnover
rate
............................
34%
37%
31%
26%
42%
a
For
the
year
ended
February
29.
b
The
amount
shown
for
a
share
outstanding
throughout
the
period
may
not
correlate
with
the
Statement
of
Operations
for
the
period
due
to
the
timing
of
sales
and
repurchases
of
the
Fund’s
shares
in
relation
to
income
earned
and/or
fluctuating
fair
value
of
the
investments
of
the
Fund.
c
Based
on
average
daily
shares
outstanding.
d
Benefit
of
expense
reduction
rounds
to
less
than
0.01%.
Schedule
of
Investments,
February
28,
2026
Putnam
Floating
Rate
Income
Fund
The
accompanying
notes
are
an
integral
part
of
these
financial
statements.
Annual
Report
a
a
Country
Shares
a
Value
a
a
a
a
a
a
Common
Stocks
0.1%
Containers
&
Packaging
0.1%
Klockner
Pentaplast
of
America,
Inc.
.....................
Luxembourg
145,132
$
249,858
Total
Common
Stocks
(Cost
$235,168)
.......................................
249,858
Principal
Amount
*
Corporate
Bonds
7.9%
Building
Products
0.7%
a
Smyrna
Ready
Mix
Concrete
LLC
,
Senior
Secured
Note
,
144A,
8.875
%
,
11/15/31
..................................
United
States
2,000,000
2,126,018
Capital
Markets
0.5%
a
Jane
Street
Group
/
JSG
Finance,
Inc.
,
Senior
Secured
Note
,
144A,
6.125
%
,
11/01/32
.............................
United
States
1,500,000
1,510,104
Consumer
Finance
0.3%
a
Encore
Capital
Group,
Inc.
,
Senior
Secured
Note
,
144A,
9.25
%
,
4/01/29
.........................................
United
States
900,000
943,104
Entertainment
0.3%
a
Banijay
Entertainment
SAS
,
Senior
Secured
Note
,
144A,
8.125
%
,
5/01/29
.........................................
France
900,000
932,324
Financial
Services
0.3%
a
Jefferson
Capital
Holdings
LLC
,
Senior
Note
,
144A,
9.5
%
,
2/15/29
United
States
900,000
950,804
Ground
Transportation
0.2%
a
Beacon
Mobility
Corp.
,
Senior
Secured
Note
,
144A,
7.25
%
,
8/01/30
.........................................
United
States
500,000
524,070
Hotels,
Restaurants
&
Leisure
0.3%
a
Great
Canadian
Gaming
Corp.
/
Raptor
LLC
,
Senior
Secured
Note
,
144A,
8.75
%
,
11/15/29
.........................
Canada
980,000
996,835
Household
Durables
0.4%
a
Newell
Brands,
Inc.
,
Senior
Note
,
144A,
8.5
%
,
6/01/28
.......
United
States
1,000,000
1,053,142
Insurance
0.4%
a
Acrisure
LLC
/
Acrisure
Finance,
Inc.
,
Senior
Secured
Note
,
144A,
7.5
%
,
11/06/30
....................................
United
States
1,000,000
1,018,256
Media
1.0%
a
Sinclair
Television
Group,
Inc.
,
Senior
Secured
Note
,
144A,
8.125
%
,
2/15/33
...................................
United
States
1,215,000
1,266,030
a
Univision
Communications,
Inc.
,
Senior
Secured
Note
,
144A,
7.375
%
,
6/30/30
...................................
United
States
1,500,000
1,501,266
2,767,296
Metals
&
Mining
0.2%
a
Novelis
Corp.
,
Senior
Note
,
144A,
6.875
%
,
1/30/30
..........
United
States
587,000
606,264
Mortgage
Real
Estate
Investment
Trusts
(REITs)
0.7%
a
Starwood
Property
Trust,
Inc.
,
Senior
Note
,
144A,
6.5
%
,
7/01/30
United
States
2,000,000
2,081,230
Oil,
Gas
&
Consumable
Fuels
1.1%
a
Crescent
Energy
Finance
LLC
,
Senior
Note
,
144A,
8.375
%
,
1/15/34
.........................................
United
States
2,000,000
2,068,650
a
Venture
Global
LNG,
Inc.
,
Senior
Secured
Note
,
144A,
8.125
%
,
6/01/28
.........................................
United
States
1,000,000
1,026,615
3,095,265
Putnam
Funds
Trust
Schedule
of
Investments
Putnam
Floating
Rate
Income
Fund
(continued)
Annual
Report
The
accompanying
notes
are
an
integral
part
of
these
financial
statements.
a
a
Country
Principal
Amount
*
a
Value
a
a
a
a
a
Corporate
Bonds
(continued)
Passenger
Airlines
0.7%
a
OneSky
Flight
LLC
,
Senior
Note
,
144A,
8.875
%
,
12/15/29
.....
United
States
2,000,000
$
2,130,028
Software
0.4%
a
Central
Parent,
Inc.
/
CDK
Global,
Inc.
,
Senior
Secured
Note
,
144A,
7.25
%
,
6/15/29
...............................
United
States
2,000,000
1,265,582
Trading
Companies
&
Distributors
0.4%
a
EquipmentShare.com,
Inc.
,
Secured
Note
,
144A,
9
%
,
5/15/28
..
United
States
1,180,000
1,237,434
Total
Corporate
Bonds
(Cost
$23,223,900)
....................................
23,237,756
b
Senior
Floating
Rate
Interests
88.0%
c
Aerospace
&
Defense
1.7%
Bleriot
US
Bidco,
Inc.,
First
Lien,
2023
CME
Term
Loan,
6.172%,
(3-month
SOFR
+
2.5%),
10/31/30
.....................
United
States
487,590
488,373
Goat
Holdco
LLC,
First
Lien,
CME
Term
Loan,
B,
6.173%,
(1-month
SOFR
+
2.5%),
1/27/32
......................
United
States
1,338,289
1,336,195
TransDigm,
Inc.,
First
Lien,
CME
Term
Loan,
J,
6.173%,
(1-month
SOFR
+
2.5%),
2/28/31
.............................
United
States
2,281,185
2,283,751
Vertex
Aerospace
Services
Corp.,
First
Lien,
2024
CME
Term
Loan,
5.923%,
(1-month
SOFR
+
2.25%),
12/06/30
........
United
States
495,000
496,176
4,604,495
a
a
a
a
a
a
Air
Freight
&
Logistics
0.6%
c
Rand
Parent
LLC,
First
Lien,
CME
Term
Loan,
B,
6.672%,
(3-month
SOFR
+
3%),
3/18/30
.......................
United
States
1,785,643
1,788,884
c
Automobile
Components
2.5%
Allison
Transmission,
Inc.,
First
Lien,
2026
CME
Term
Loan,
5.41%,
(1-month
SOFR
+
1.75%),
1/03/33
...............
United
States
936,455
942,472
Clarios
Global
LP,
First
Lien,
2024
Dollar
CME
Term
Loan,
6.173%,
(1-month
SOFR
+
2.5%),
5/06/30
...............
United
States
2,547,000
2,544,618
DexKo
Global,
Inc.,
First
Lien,
2023
Incremental
CME
Term
Loan,
7.917%,
(3-month
SOFR
+
4.25%),
10/04/28
.............
United
States
2,104,886
2,109,169
DexKo
Global,
Inc.,
First
Lien,
Closing
Date
Dollar
CME
Term
Loan,
7.678%,
(3-month
SOFR
+
3.75%),
10/04/28
........
United
States
974,684
972,032
d
First
Brands
Group
LLC,
First
Lien,
USD
Debtor-In-Possession
New
Money
CME
Term
Loan,
PIK,
13.671%,
(1-month
SOFR
+
10%),
6/29/26
....................................
United
States
127,340
25,017
d
First
Brands
Group
LLC,
Second
Lien,
2021
CME
Term
Loan,
PIK,
10.5%,
(1-month
SOFR
+
10.5%),
3/30/28
...........
United
States
2,149,743
3,289
LCI
Industries,
First
Lien,
2025
CME
Term
Loan,
B,
5.923%,
(1-month
SOFR
+
2.25%),
3/25/32
.....................
United
States
992,513
998,716
7,595,313
a
a
a
a
a
a
Automobiles
0.9%
c
American
Trailer
World
Corp.,
First
Lien,
CME
Term
Loan,
B,
7.523%,
(1-month
SOFR
+
3.75%),
3/03/28
..............
United
States
3,110,850
2,752,620
c
Beverages
0.0%
†
Naked
Juice
LLC,
First
Lien,
2nd
Out
CME
Term
Loan,
7.022%,
(3-month
SOFR
+
3.25%),
1/24/29
.....................
United
States
69,475
43,009
d
Naked
Juice
LLC,
First
Lien,
3rd
Out
CME
Term
Loan,
PIK,
4.772%,
(3-month
SOFR
+
1%),
1/24/30
................
United
States
289,994
62,671
105,680
a
a
a
a
a
a
Putnam
Funds
Trust
Schedule
of
Investments
Putnam
Floating
Rate
Income
Fund
(continued)
The
accompanying
notes
are
an
integral
part
of
these
financial
statements.
Annual
Report
a
a
Country
Principal
Amount
*
a
Value
a
a
a
a
a
b
Senior
Floating
Rate
Interests
(continued)
Biotechnology
0.1%
c
Genmab
A/S,
First
Lien,
Initial
CME
Term
Loan,
B,
6.733%,
(3-month
SOFR
+
3%),
12/13/32
......................
Denmark
371,803
$
373,777
Broadline
Retail
0.4%
c
Peer
Holding
III
BV,
First
Lien,
CME
Term
Loan,
B5B,
6.172%,
(3-month
SOFR
+
2.5%),
7/01/31
......................
Netherlands
1,237,500
1,238,273
c
Building
Products
4.0%
Chariot
Buyer
LLC,
First
Lien,
Amendment
No.
5
Incremental
CME
Term
Loan,
6.423%,
(1-month
SOFR
+
2.75%),
9/08/32
.
United
States
2,880,525
2,874,793
Cornerstone
Building
Brands,
Inc.,
First
Lien,
New
CME
Term
Loan,
B,
7.01%,
(1-month
SOFR
+
3.25%),
4/12/28
........
United
States
1,311,591
970,111
Janus
International
Group
LLC,
First
Lien,
8th
Amendment
CME
Term
Loan,
5.664%,
(3-month
SOFR
+
2%),
8/05/30
.......
United
States
1,763,200
1,760,449
Quikrete
Holdings,
Inc.,
First
Lien,
CME
Term
Loan,
B1,
5.923%,
(1-month
SOFR
+
2.25%),
4/14/31
.....................
United
States
1,474,476
1,475,309
e
Quikrete
Holdings,
Inc.,
First
Lien,
CME
Term
Loan,
B3,
5.923%,
(1-month
SOFR
+
2.25%),
2/10/32
.....................
United
States
750,000
750,469
Smyrna
Ready
Mix
Concrete
LLC,
First
Lien,
2025
CME
Term
Loan,
6.673%,
(1-month
SOFR
+
3%),
3/30/29
............
United
States
279,616
280,665
TAMKO
Building
Products
LLC,
First
Lien,
2024
CME
Term
Loan,
6.425%,
(1-month
SOFR
+
2.75%;
3-month
SOFR
+
2.75%;
6-month
SOFR
+
2.75%),
9/20/30
.....................
United
States
1,975,424
1,978,713
Watlow
Electric
Manufacturing
Co.,
First
Lien,
Initial
CME
Term
Loan,
6.667%,
(3-month
SOFR
+
3%),
3/02/28
............
United
States
1,303,360
1,308,248
11,398,757
a
a
a
a
a
a
c
Capital
Markets
3.0%
Aretec
Group,
Inc.,
First
Lien,
CME
Term
Loan,
B4,
6.673%,
(1-month
SOFR
+
3%),
8/09/30
.......................
United
States
2,201,018
2,132,544
Celestial-Saturn
Parent,
Inc.,
Second
Lien,
Initial
CME
Term
Loan,
10.287%,
(1-month
SOFR
+
6.5%),
6/04/29
..............
United
States
2,500,000
2,279,162
Dragon
Buyer,
Inc.,
First
Lien,
CME
Term
Loan,
6.422%,
(3-month
SOFR
+
2.75%),
9/30/31
............................
United
States
1,494,340
1,322,491
Jane
Street
Group
LLC,
First
Lien,
Extended
CME
Term
Loan,
5.822%,
(3-month
SOFR
+
2%),
12/15/31
................
United
States
1,074,386
1,043,497
Nexus
Buyer
LLC,
First
Lien,
Initial
CME
Term
Loan,
7.173%,
(1-month
SOFR
+
3.5%),
7/31/31
......................
United
States
1,989,975
1,876,178
8,653,872
a
a
a
a
a
a
c
Chemicals
5.2%
A-AP
Buyer,
Inc.,
First
Lien,
Initial
CME
Term
Loan,
6.417%,
(3-month
SOFR
+
2.75%),
9/09/31
.....................
United
States
990,000
990,000
ARC
Falcon
I,
Inc.,
First
Lien,
Initial
CME
Term
Loan,
7.273%,
(1-month
SOFR
+
3.5%),
10/02/28
.....................
United
States
1,964,241
1,962,336
Geon
Performance
Solutions
LLC,
First
Lien,
Initial
CME
Term
Loan,
8.184%,
(3-month
SOFR
+
4.25%),
8/18/28
.........
United
States
958,791
840,442
Hexion
Holdings
Corp.,
Second
Lien,
Initial
CME
Term
Loan,
11.211%,
(1-month
SOFR
+
7.438%),
3/15/30
............
United
States
1,375,882
1,300,209
Indicor
LLC,
First
Lien,
Dollar
CME
Term
Loan,
E,
6.173%,
(1-month
SOFR
+
2.5%),
11/22/29
.....................
United
States
975,224
975,088
Minerals
Technologies,
Inc.,
First
Lien,
CME
Term
Loan,
B,
5.673%,
(1-month
SOFR
+
2%),
11/26/31
................
United
States
1,099,890
1,102,640
Nouryon
Finance
BV,
First
Lien,
November
2024
Dollar
CME
Term
Loan,
B1,
7.036%,
(3-month
SOFR
+
3.25%),
4/03/28
..
Netherlands
1,417,722
1,419,941
Nouryon
Finance
BV,
First
Lien,
November
2024
Dollar
CME
Term
Loan,
B2,
6.917%,
(3-month
SOFR
+
3.25%),
4/03/28
..
Netherlands
735,089
731,645
Putnam
Funds
Trust
Schedule
of
Investments
Putnam
Floating
Rate
Income
Fund
(continued)
Annual
Report
The
accompanying
notes
are
an
integral
part
of
these
financial
statements.
a
a
Country
Principal
Amount
*
a
Value
a
a
a
a
a
b
Senior
Floating
Rate
Interests
(continued)
c
Chemicals
(continued)
Olympus
Water
US
Holding
Corp.,
First
Lien,
6
Dollar
CME
Term
Loan,
B6,
6.672%,
(3-month
SOFR
+
3%),
6/23/31
.........
United
States
2,244,886
$
2,205,892
Solstice
Advanced
Materials,
Inc.,
First
Lien,
CME
Term
Loan,
B,
5.417%,
(3-month
SOFR
+
1.75%),
10/29/32
.............
United
States
1,080,432
1,085,499
Tronox
Finance
LLC,
First
Lien,
2024-B2
CME
Term
Loan,
5.922%,
(3-month
SOFR
+
2.25%),
4/04/29
..............
United
States
1,962,669
1,601,420
WR
Grace
Holdings
LLC,
First
Lien,
CME
Term
Loan,
B1,
6.672%,
(3-month
SOFR
+
3%),
8/19/32
................
United
States
744,310
744,618
14,959,730
a
a
a
a
a
a
c
Commercial
Services
&
Supplies
4.5%
Allied
Universal
Holdco
LLC,
First
Lien,
Amendment
No.
7
Replacement
USD
CME
Term
Loan,
6.923%,
(1-month
SOFR
+
3.25%),
8/20/32
...................................
United
States
1,003,415
1,005,071
Cimpress
USA,
Inc.,
First
Lien,
2024-2
Refinancing
CME
Term
Loan,
B1,
6.173%,
(1-month
SOFR
+
2.5%),
5/17/28
.......
Ireland
304,606
305,367
Enviri
Corp.,
First
Lien,
CME
Term
Loan,
B3,
6.037%,
(1-month
SOFR
+
2.25%),
6/09/28
............................
United
States
1,910,000
1,908,806
Garda
World
Security
Corp.,
First
Lien,
Fifteenth
Additional
CME
Term
Loan,
6.422%,
(3-month
SOFR
+
2.75%),
2/01/29
.....
Canada
1,057,504
1,057,176
HNI
Corp.,
First
Lien,
Initial
CME
Term
Loan,
B,
5.665%,
(1-month
SOFR
+
2%),
12/10/32
..............................
United
States
500,000
503,855
e
Latham
Pool
Products,
Inc.,
First
Lien,
Initial
CME
Term
Loan,
7.573%,
(3-month
SOFR
+
3.75%),
2/23/29
..............
United
States
2,485,913
2,481,774
Madison
IAQ
LLC,
First
Lien,
Initial
CME
Term
Loan,
6.128%,
(6-month
SOFR
+
2.5%),
6/21/28
......................
United
States
1,250,901
1,253,484
MillerKnoll,
Inc.,
First
Lien,
2026
CME
Term
Loan,
B,
5.673%,
(1-month
SOFR
+
2%),
8/09/32
.......................
United
States
897,750
897,889
Neptune
Bidco
US,
Inc.,
First
Lien,
2026
Dollar
CME
Term
Loan,
B,
8.76%,
(3-month
SOFR
+
5%),
1/28/33
...............
United
States
2,000,000
1,891,500
OPENLANE,
Inc.,
First
Lien,
2025
Incremental
CME
Term
Loan,
6.14%,
(3-month
SOFR
+
2.5%),
10/01/32
...............
United
States
1,200,000
1,201,506
Prometric
Holdings,
Inc.,
First
Lien,
Initial
CME
Term
Loan,
7.422%,
(1-month
SOFR
+
3.75%),
6/25/32
..............
United
States
623,438
623,437
13,129,865
a
a
a
a
a
a
c
Communications
Equipment
0.5%
Viasat,
Inc.,
First
Lien,
Initial
CME
Term
Loan,
8.287%,
(1-month
SOFR
+
4.5%),
3/02/29
.............................
United
States
967,419
969,963
Viavi
Solutions,
Inc.,
First
Lien,
CME
Term
Loan,
6.171%,
(3-month
SOFR
+
2.5%),
10/18/32
.....................
United
States
432,526
434,868
1,404,831
a
a
a
a
a
a
c
Construction
&
Engineering
1.4%
Brand
Industrial
Services,
Inc.,
First
Lien,
CME
Term
Loan,
C,
8.164%,
(3-month
SOFR
+
4.5%),
8/01/30
...............
United
States
1,369,948
1,177,299
Chromalloy
Corp.,
First
Lien,
CME
Term
Loan,
6.911%,
(3-month
SOFR
+
3.25%),
3/27/31
............................
United
States
738,750
741,354
Construction
Partners,
Inc.,
First
Lien,
Closing
Date
CME
Term
Loan,
6.173%,
(1-month
SOFR
+
2.5%),
11/03/31
.........
United
States
285,090
286,827
Kodiak
Building
Partners,
Inc.,
First
Lien,
CME
Term
Loan,
B,
7.423%,
(1-month
SOFR
+
3.75%),
12/04/31
.............
United
States
1,822,764
1,825,197
4,030,677
a
a
a
a
a
a
Putnam
Funds
Trust
Schedule
of
Investments
Putnam
Floating
Rate
Income
Fund
(continued)
The
accompanying
notes
are
an
integral
part
of
these
financial
statements.
Annual
Report
a
a
Country
Principal
Amount
*
a
Value
a
a
a
a
a
b
Senior
Floating
Rate
Interests
(continued)
Consumer
Finance
0.7%
c
Neon
Maple
US
Debt
Mergersub,
Inc.,
First
Lien,
CME
Term
Loan,
B1,
6.173%,
(1-month
SOFR
+
2.5%),
11/17/31
......
United
States
1,985,025
$
1,939,737
c
Containers
&
Packaging
1.9%
Clydesdale
Acquisition
Holdings,
Inc.,
First
Lien,
2025
Incremental
Closing
Date
CME
Term
Loan,
B,
6.923%,
(1-month
SOFR
+
3.25%),
4/01/32
...................................
United
States
1,564,038
1,550,353
Kleopatra
Finco
SARL,
First
Lien,
Exit
CME
Term
Loan,
10.667%,
(3-month
SOFR
+
7%),
1/30/31
.......................
Luxembourg
1,562,261
1,405,379
Mauser
Packaging
Solutions
Holding
Co.,
First
Lien,
2025
CME
Term
Loan,
7.164%,
(3-month
SOFR
+
3.5%),
4/15/30
......
United
States
1,446,898
1,426,323
Plastipak
Packaging,
Inc.,
First
Lien,
CME
Term
Loan,
B,
6.173%,
(1-month
SOFR
+
2.5%),
9/24/32
......................
United
States
399,000
399,094
Pregis
TopCo
LLC,
First
Lien,
Tenth
Amendment
CME
Term
Loan,
7.673%,
(1-month
SOFR
+
4%),
2/01/29
................
United
States
940,394
943,995
5,725,144
a
a
a
a
a
a
c
Distributors
2.0%
Core
&
Main
LP,
First
Lien,
CME
Term
Loan,
D,
5.69%,
(3-month
SOFR
+
2%),
7/27/28
...............................
United
States
1,232,192
1,236,812
Gloves
Buyer,
Inc.,
First
Lien,
Initial
CME
Term
Loan,
7.673%,
(1-month
SOFR
+
4%),
5/21/32
.......................
United
States
1,995,000
1,991,259
Verde
Purchaser
LLC,
First
Lien,
Second
Refinancing
CME
Term
Loan,
7.672%,
(3-month
SOFR
+
4%),
11/30/30
...........
United
States
1,730,075
1,719,375
Windsor
Holdings
III
LLC,
First
Lien,
2025
Refinancing
CME
Term
Loan,
B,
6.423%,
(1-month
SOFR
+
2.75%),
8/01/30
.......
United
States
977,674
977,826
5,925,272
a
a
a
a
a
a
c
Diversified
Consumer
Services
1.4%
Anticimex
Global
AB,
First
Lien,
CME
Term
Loan,
B8,
6.56%,
(1-
day
SOFR
+
2.9%),
11/17/31
.........................
Sweden
378,807
379,953
Ascend
Learning
LLC,
First
Lien,
Initial
CME
Term
Loan,
6.672%,
(1-month
SOFR
+
3%),
12/11/28
......................
United
States
1,947,166
1,858,940
HomeServe
USA
Corp.,
First
Lien,
Amendment
No.
1
Refinancing
CME
Term
Loan,
5.667%,
(1-month
SOFR
+
2%),
10/21/30
..
United
Kingdom
982,500
981,886
Lernen
Bidco
Ltd.,
First
Lien,
CME
Term
Loan,
B3,
7.41%,
(1-day
SOFR
+
3.5%),
10/27/31
............................
United
Kingdom
229,617
229,903
Mavis
Tire
Express
Services
Topco
Corp.,
First
Lien,
2025
Incremental
CME
Term
Loan,
6.673%,
(1-month
SOFR
+
3%),
5/04/28
.........................................
United
States
878,319
877,590
4,328,272
a
a
a
a
a
a
c
Electric
Utilities
0.0%
†
Invenergy
Thermal
Operating
I
LLC,
First
Lien,
CME
Term
Loan,
B,
6.41%,
(3-month
SOFR
+
2.75%),
5/17/32
.............
United
States
81,620
82,576
Invenergy
Thermal
Operating
I
LLC,
First
Lien,
CME
Term
Loan,
C,
6.41%,
(3-month
SOFR
+
2.75%),
5/17/32
.............
United
States
5,150
5,211
87,787
a
a
a
a
a
a
c
Electronic
Equipment,
Instruments
&
Components
0.4%
Ingram
Micro,
Inc.,
First
Lien,
CME
Term
Loan,
B2,
5.917%,
(1-month
SOFR
+
2.25%),
9/22/31
.....................
United
States
600,397
603,027
MX
Holdings
US,
Inc.,
First
Lien,
Senior
USD
CME
Term
Loan,
B,
5.673%,
(1-month
SOFR
+
2%),
3/17/32
................
United
States
180,464
181,085
Putnam
Funds
Trust
Schedule
of
Investments
Putnam
Floating
Rate
Income
Fund
(continued)
Annual
Report
The
accompanying
notes
are
an
integral
part
of
these
financial
statements.
a
a
Country
Principal
Amount
*
a
Value
a
a
a
a
a
b
Senior
Floating
Rate
Interests
(continued)
c
Electronic
Equipment,
Instruments
&
Components
(continued)
Project
Aurora
US
Finco,
Inc.,
First
Lien,
CME
Term
Loan,
B2,
6.49%,
(3-month
SOFR
+
2.75%),
12/06/32
..............
United
States
356,083
$
357,198
1,141,310
a
a
a
a
a
a
c
Entertainment
1.1%
Playtika
Holding
Corp.,
First
Lien,
CME
Term
Loan,
B1,
6.537%,
(1-month
SOFR
+
2.75%),
3/13/28
.....................
United
States
497,389
463,815
TKO
Worldwide
Holdings
LLC,
First
Lien,
CME
Term
Loan,
B5,
5.664%,
(3-month
SOFR
+
2%),
11/21/31
................
United
States
2,738,533
2,744,242
3,208,057
a
a
a
a
a
a
c
Financial
Services
2.4%
Colossus
Acquireco
LLC,
First
Lien,
Initial
CME
Term
Loan,
5.41%,
(1-day
SOFR
+
1.75%),
7/30/32
.................
United
States
1,496,250
1,494,118
Corpay
Technologies
Operating
Co.
LLC,
First
Lien,
CME
Term
Loan,
B6,
5.423%,
(1-month
SOFR
+
1.75%),
11/05/32
.....
United
States
1,063,830
1,062,506
Greystone
Select
Financial
LLC,
First
Lien,
Initial
CME
Term
Loan,
8.931%,
(3-month
SOFR
+
5%),
6/16/28
............
United
States
1,412,308
1,384,062
Red
Planet
Borrower
LLC,
First
Lien,
Initial
CME
Term
Loan,
7.673%,
(1-month
SOFR
+
4%),
9/08/32
................
United
States
1,295,011
1,258,997
Speed
Midco
3
SARL,
First
Lien,
USD
CME
Term
Loan,
B,
6.288%,
(6-month
SOFR
+
2.5%),
10/01/32
..............
Luxembourg
877,193
877,741
e
WEX,
Inc.,
First
Lien,
CME
Term
Loan,
B3,
5.423%,
(1-month
SOFR
+
1.75%),
3/05/32
............................
United
States
750,000
745,500
6,822,924
a
a
a
a
a
a
Food
Products
0.1%
c
Saratoga
Food
Specialties
LLC,
First
Lien,
Additional
CME
Term
Loan,
7,
6.983%,
(3-month
SOFR
+
3.25%),
3/12/29
.......
United
States
330,833
333,384
c
Ground
Transportation
1.4%
Genesee
&
Wyoming,
Inc.,
First
Lien,
Initial
CME
Term
Loan,
5.422%,
(3-month
SOFR
+
1.75%),
4/10/31
..............
United
States
622,125
621,948
Kenan
Advantage
Group,
Inc.
(The),
First
Lien,
U.S.
CME
Term
Loan,
B4,
6.923%,
(1-month
SOFR
+
3.25%),
1/25/29
......
United
States
2,984,848
2,950,896
d
LaserShip,
Inc.,
First
Lien,
CME
Term
Loan,
B1,
PIK,
5.434%,
(3-month
SOFR
+
1.5%),
8/10/29
......................
United
States
510,793
389,109
d
LaserShip,
Inc.,
First
Lien,
CME
Term
Loan,
D,
PIK,
5.434%,
(3-month
SOFR
+
1.5%),
8/10/29
......................
United
States
369,885
105,725
Savage
Enterprises
LLC,
First
Lien,
Amendment
No.
7
CME
Term
Loan,
6.168%,
(1-month
SOFR
+
2.5%),
8/05/32
..........
United
States
423,957
423,891
4,491,569
a
a
a
a
a
a
c
Health
Care
Equipment
&
Supplies
1.8%
Bausch
+
Lomb
Corp.,
First
Lien,
2025-2
Refinancing
CME
Term
Loan,
7.423%,
(1-month
SOFR
+
3.75%),
1/15/31
.........
United
States
3,110,271
3,117,269
e
Hologic,
Inc.,
First
Lien,
CME
Term
Loan,
B,
5.755%,
(12-month
SOFR
+
2.25%),
1/14/33
............................
United
States
2,000,000
1,978,750
5,096,019
a
a
a
a
a
a
c
Health
Care
Providers
&
Services
4.0%
Charlotte
Buyer,
Inc.,
First
Lien,
Second
Refinancing
CME
Term
Loan,
7.91%,
(1-month
SOFR
+
4.25%),
2/11/28
..........
United
States
980,063
941,384
Concentra
Health
Services,
Inc.,
First
Lien,
CME
Term
Loan,
B1,
5.673%,
(1-month
SOFR
+
2%),
7/28/31
................
United
States
990,019
996,206
Putnam
Funds
Trust
Schedule
of
Investments
Putnam
Floating
Rate
Income
Fund
(continued)
The
accompanying
notes
are
an
integral
part
of
these
financial
statements.
Annual
Report
a
a
Country
Principal
Amount
*
a
Value
a
a
a
a
a
b
Senior
Floating
Rate
Interests
(continued)
c
Health
Care
Providers
&
Services
(continued)
Covetrus,
Inc.,
First
Lien,
Initial
CME
Term
Loan,
8.66%,
(3-month
SOFR
+
5%),
10/15/29
..............................
United
States
970,050
$
926,704
Dermatology
Intermediate
Holdings
III,
Inc.,
First
Lien,
Initial
CME
Term
Loan,
7.917%,
(3-month
SOFR
+
4.25%),
3/26/29
.....
United
States
1,492,268
1,399,001
Global
Medical
Response,
Inc.,
First
Lien,
Initial
CME
Term
Loan,
7.17%,
(3-month
SOFR
+
3.5%),
10/01/32
...............
United
States
931,677
932,930
LifePoint
Health,
Inc.,
First
Lien,
CME
Term
Loan,
B1,
7.422%,
(3-month
SOFR
+
3.75%),
5/19/31
.....................
United
States
1,482,994
1,486,027
PAREXEL
International
Corp.,
First
Lien,
Seventh
Amendment
CME
Term
Loan,
6.423%,
(1-month
SOFR
+
2.75%),
12/12/31
United
States
1,291,052
1,277,742
Phoenix
Guarantor,
Inc.,
First
Lien,
CME
Term
Loan,
B5,
6.173%,
(1-month
SOFR
+
2.5%),
2/21/31
......................
United
States
1,965,125
1,965,263
Surgery
Center
Holdings,
Inc.,
First
Lien,
2025
Refinancing
CME
Term
Loan,
6.173%,
(1-month
SOFR
+
2.5%),
12/19/30
.....
United
States
1,965,125
1,970,038
11,895,295
a
a
a
a
a
a
Health
Care
Technology
0.7%
c
AthenaHealth
Group,
Inc.,
First
Lien,
Initial
CME
Term
Loan,
6.423%,
(1-month
SOFR
+
2.75%),
2/15/29
..............
United
States
2,207,283
2,155,776
c
Hotels,
Restaurants
&
Leisure
3.5%
Caesars
Entertainment,
Inc.,
First
Lien,
2023
Incremental
CME
Term
Loan,
B,
5.922%,
(1-month
SOFR
+
2.25%),
2/06/30
...
United
States
1,625,000
1,617,899
Fertitta
Entertainment
LLC,
First
Lien,
Initial
CME
Term
Loan,
B,
6.923%,
(1-month
SOFR
+
3.25%),
1/29/29
..............
United
States
925,684
922,301
Flutter
Financing
BV,
First
Lien,
2024
Refinancing
CME
Term
Loan,
B,
5.422%,
(3-month
SOFR
+
1.75%),
12/02/30
......
Ireland
394,962
389,696
Flynn
Restaurant
Group
LP,
First
Lien,
2025
CME
Term
Loan,
7.423%,
(1-month
SOFR
+
3.75%),
1/28/32
..............
United
States
1,704,075
1,678,164
Golden
State
Foods
LLC,
First
Lien,
Initial
CME
Term
Loan,
7.171%,
(3-month
SOFR
+
3.5%),
12/04/31
..............
United
States
557,924
559,067
Great
Canadian
Gaming
Corp.,
First
Lien,
CME
Term
Loan,
B,
8.445%,
(3-month
SOFR
+
4.75%),
11/01/29
.............
Canada
611,658
599,810
IRB
Holding
Corp.,
First
Lien,
2025
Replacement
CME
Term
Loan,
B,
6.173%,
(1-month
SOFR
+
2.5%),
12/16/30
.......
United
States
952,601
950,420
Light
&
Wonder
International,
Inc.,
First
Lien,
CME
Term
Loan,
B3,
5.677%,
(1-month
SOFR
+
2%),
4/16/29
.............
United
States
2,425,639
2,430,188
SeaWorld
Parks
&
Entertainment,
Inc.,
First
Lien,
CME
Term
Loan,
B3,
5.673%,
(1-month
SOFR
+
2%),
12/04/31
........
United
States
982,550
980,094
10,127,639
a
a
a
a
a
a
Household
Durables
0.9%
c
Hunter
Douglas,
Inc.,
First
Lien,
CME
Term
Loan,
B1,
6.672%,
(3-month
SOFR
+
3%),
1/16/32
.......................
Netherlands
2,639,057
2,642,633
c
Household
Products
0.7%
Energizer
Holdings,
Inc.,
First
Lien,
Initial
CME
Term
Loan,
5.677%,
(1-month
SOFR
+
2%),
3/19/32
................
United
States
267,028
267,363
Lavender
Dutch
BorrowerCo
BV,
First
Lien,
USD
CME
Term
Loan,
B,
6.935%,
(3-month
SOFR
+
3.25%),
12/02/32
......
Netherlands
1,702,127
1,704,255
1,971,618
a
a
a
a
a
a
c
Independent
Power
and
Renewable
Electricity
Producers
0.9%
Calpine
Construction
Finance
Co.
LP,
First
Lien,
2025
Refinancing
CME
Term
Loan,
5.423%,
(1-month
SOFR
+
1.75%),
7/31/30
...................................
United
States
2,014,258
2,019,293
Putnam
Funds
Trust
Schedule
of
Investments
Putnam
Floating
Rate
Income
Fund
(continued)
Annual
Report
The
accompanying
notes
are
an
integral
part
of
these
financial
statements.
a
a
Country
Principal
Amount
*
a
Value
a
a
a
a
a
b
Senior
Floating
Rate
Interests
(continued)
c
Independent
Power
and
Renewable
Electricity
Producers
(continued)
Talen
Energy
Supply
LLC,
First
Lien,
2024-1
Incremental
CME
Term
Loan,
B,
6.153%,
(3-month
SOFR
+
2.5%),
12/11/31
...
United
States
355,157
$
356,622
Talen
Energy
Supply
LLC,
First
Lien,
Initial
CME
Term
Loan,
B,
6.153%,
(3-month
SOFR
+
2.5%),
5/17/30
...............
United
States
296,605
297,876
2,673,791
a
a
a
a
a
a
c
Insurance
2.0%
Acrisure
LLC,
First
Lien,
CME
Term
Loan,
B6,
6.673%,
(1-month
SOFR
+
3%),
11/06/30
..............................
United
States
1,481,287
1,438,700
Alliant
Holdings
Intermediate
LLC,
First
Lien,
Initial
CME
Term
Loan,
6.173%,
(1-month
SOFR
+
2.5%),
9/19/31
..........
United
States
2,709,523
2,654,194
Jones
DesLauriers
Insurance
Management,
Inc.,
First
Lien,
2026-
1
CME
Term
Loan,
6.664%,
(3-month
SOFR
+
3%),
2/02/33
..
Canada
1,714,286
1,652,143
OneDigital
Borrower
LLC,
First
Lien,
2025
Refinancing
CME
Term
Loan,
6.673%,
(1-month
SOFR
+
3%),
7/02/31
............
United
States
134,695
130,192
5,875,229
a
a
a
a
a
a
c
IT
Services
2.6%
Ahead
DB
Holdings
LLC,
First
Lien,
CME
Term
Loan,
B3,
6.172%,
(3-month
SOFR
+
2.5%),
2/03/31
......................
United
States
1,188,721
1,160,025
Fortress
Intermediate
3,
Inc.,
First
Lien,
CME
Term
Loan,
B,
6.668%,
(1-month
SOFR
+
3%),
6/27/31
................
United
States
569,261
555,029
Genuine
Financial
Holdings
LLC,
First
Lien,
2025
Replacement
CME
Term
Loan,
6.923%,
(1-month
SOFR
+
3.25%),
9/27/30
.
United
States
1,477,519
1,248,503
Go
Daddy
Operating
Co.
LLC,
First
Lien,
CME
Term
Loan,
B7,
5.423%,
(1-month
SOFR
+
1.75%),
5/30/31
..............
United
States
750,000
725,520
MH
Sub
I
LLC
(Micro
Holding
Corp.),
First
Lien,
CME
Term
Loan,
7.923%,
(1-month
SOFR
+
4.25%),
5/03/28
..............
United
States
1,630,442
1,336,285
MH
Sub
I
LLC,
First
Lien,
2024
December
New
CME
Term
Loan,
7.923%,
(1-month
SOFR
+
4.25%),
12/31/31
.............
United
States
1,103,595
758,722
Tempo
Acquisition
LLC,
First
Lien,
Seventh
Incremental
CME
Term
Loan,
5.423%,
(1-month
SOFR
+
1.75%),
8/31/28
.....
United
States
1,086,468
763,244
Tenable,
Inc.,
First
Lien,
Initial
CME
Term
Loan,
6.537%,
(1-month
SOFR
+
2.75%),
7/07/28
............................
United
States
480,000
478,951
7,026,279
a
a
a
a
a
a
c
Leisure
Products
2.1%
Callaway
Golf
Co.,
First
Lien,
Initial
CME
Term
Loan,
6.423%,
(1-month
SOFR
+
2.75%),
3/18/30
.....................
United
States
109,384
110,022
Fender
Musical
Instruments
Corp.,
First
Lien,
Initial
CME
Term
Loan,
7.773%,
(1-month
SOFR
+
4%),
12/01/28
...........
United
States
1,857,909
1,698,249
GBT
US
III
LLC,
First
Lien,
CME
Term
Loan,
B2,
5.668%,
(3-month
SOFR
+
2%),
7/25/31
.......................
United
States
990,000
949,162
Horizon
US
Finco
LP,
First
Lien,
CME
Term
Loan,
B,
8.777%,
(6-month
SOFR
+
4.5%),
10/31/31
.....................
United
States
1,778,807
1,743,231
Motion
Finco
SARL,
First
Lien,
CME
Term
Loan,
B3,
7.172%,
(3-month
SOFR
+
3.5%),
11/13/29
.....................
United
Kingdom
1,965,261
1,671,455
6,172,119
a
a
a
a
a
a
c
Machinery
1.1%
CPM
Holdings,
Inc.,
First
Lien,
Initial
CME
Term
Loan,
8.171%,
(1-month
SOFR
+
4.5%),
9/28/28
......................
United
States
1,332,947
1,311,700
Pro
Mach
Group,
Inc.,
First
Lien,
Amendment
No.
6
CME
Term
Loan,
6.423%,
(1-month
SOFR
+
2.75%),
10/15/32
........
United
States
972,858
973,529
Putnam
Funds
Trust
Schedule
of
Investments
Putnam
Floating
Rate
Income
Fund
(continued)
The
accompanying
notes
are
an
integral
part
of
these
financial
statements.
Annual
Report
a
a
Country
Principal
Amount
*
a
Value
a
a
a
a
a
b
Senior
Floating
Rate
Interests
(continued)
c
Machinery
(continued)
Terex
Corp.,
First
Lien,
2025
Refinancing
CME
Term
Loan,
5.423%,
(1-month
SOFR
+
1.75%),
10/08/31
.............
United
States
916,165
$
918,456
3,203,685
a
a
a
a
a
a
c
Media
2.6%
Advantage
Sales
&
Marketing,
Inc.,
First
Lien,
CME
Term
Loan,
B1,
8.163%,
(3-month
SOFR
+
4.25%),
10/28/27
..........
United
States
574,812
475,728
Cengage
Learning,
Inc.,
First
Lien,
2026
Refinancing
CME
Term
Loan,
6.671%,
(1-month
SOFR
+
3%;
3-month
SOFR
+
3%),
3/24/31
.........................................
United
States
1,674,585
1,638,808
Clear
Channel
Outdoor
Holdings,
Inc.,
First
Lien,
2024
Refinancing
CME
Term
Loan,
7.787%,
(1-month
SOFR
+
4%),
8/23/28
.........................................
United
States
722,888
726,954
Cogeco
Financing
2
LP,
First
Lien,
CME
Term
Loan,
B,
6.287%,
(1-month
SOFR
+
2.5%),
9/01/28
......................
United
States
1,711,841
1,607,701
DIRECTV
Financing
LLC,
First
Lien,
2024
Refinancing
CME
Term
Loan,
B,
9.178%,
(3-month
SOFR
+
5.25%),
8/02/29
.......
United
States
710,887
712,664
Outfront
Media
Capital
LLC,
First
Lien,
CME
Term
Loan,
5.676%,
(1-month
SOFR
+
2%),
9/24/32
.......................
United
States
1,200,000
1,204,200
Virgin
Media
Bristol
LLC,
First
Lien,
CME
Term
Loan,
Y,
7.052%,
(6-month
SOFR
+
3.175%),
3/31/31
....................
United
States
1,000,000
937,225
7,303,280
a
a
a
a
a
a
c
Metals
&
Mining
0.9%
AMG
Critical
Materials
NV,
First
Lien,
Initial
CME
Term
Loan,
7.287%,
(1-month
SOFR
+
3.5%),
11/30/28
..............
Netherlands
491,049
491,152
Arsenal
AIC
Parent
LLC,
First
Lien,
2025
Refinancing
CME
Term
Loan,
B,
6.423%,
(1-month
SOFR
+
2.75%),
8/19/30
.......
United
States
574,310
575,746
TMS
International
Corp.,
First
Lien,
New
CME
Term
Loan,
B7,
7.168%,
(1-month
SOFR
+
3.5%;
3-month
SOFR
+
3.5%),
3/04/30
.........................................
United
States
1,462,827
1,465,116
2,532,014
a
a
a
a
a
a
Mortgage
Real
Estate
Investment
Trusts
(REITs)
0.2%
c
Apollo
Commercial
Real
Estate
Finance,
Inc.,
First
Lien,
Initial
CME
Term
Loan,
6.917%,
(1-month
SOFR
+
3.25%),
6/13/30
.
United
States
436,805
437,829
c
Oil,
Gas
&
Consumable
Fuels
2.7%
BCP
Renaissance
Parent
LLC,
First
Lien,
Initial
CME
Term
Loan,
B6,
5.922%,
(3-month
SOFR
+
2.25%),
10/31/31
..........
United
States
1,526,831
1,525,114
Buckeye
Partners
LP,
First
Lien,
2025
CME
Term
Loan,
B7,
5.423%,
(1-month
SOFR
+
1.75%),
11/22/32
.............
United
States
995,816
999,963
CQP
Holdco
LP,
First
Lien,
CME
Term
Loan,
B,
5.423%,
(1-month
SOFR
+
1.75%),
12/31/32
...........................
United
States
1,722,243
1,719,100
GIP
Pilot
Acquisition
Partners
LP,
First
Lien,
Initial
CME
Term
Loan,
5.646%,
(3-month
SOFR
+
2%),
10/04/30
...........
United
States
1,217,735
1,221,388
Hilcorp
Energy
I
LP,
First
Lien,
Initial
CME
Term
Loan,
5.417%,
(1-month
SOFR
+
1.75%),
2/06/30
.....................
United
States
680,571
681,422
Oryx
Midstream
Services
Permian
Basin
LLC,
First
Lien,
Initial
CME
Term
Loan,
5.924%,
(1-month
SOFR
+
2.25%),
10/05/28
United
States
1,892,810
1,896,596
8,043,583
a
a
a
a
a
a
Paper
&
Forest
Products
0.6%
c
Magnera
Corp.,
First
Lien,
CME
Term
Loan,
7.923%,
(3-month
SOFR
+
4.25%),
11/04/31
...........................
United
States
1,798,917
1,803,037
Putnam
Funds
Trust
Schedule
of
Investments
Putnam
Floating
Rate
Income
Fund
(continued)
Annual
Report
The
accompanying
notes
are
an
integral
part
of
these
financial
statements.
a
a
Country
Principal
Amount
*
a
Value
a
a
a
a
a
b
Senior
Floating
Rate
Interests
(continued)
c
Passenger
Airlines
2.0%
AAdvantage
Loyalty
IP
Ltd.,
First
Lien,
CME
Term
Loan,
5.918%,
(3-month
SOFR
+
2.25%),
4/20/28
.....................
United
States
1,480,562
$
1,480,562
American
Airlines,
Inc.,
First
Lien,
Initial
CME
Term
Loan,
6.258%,
(6-month
SOFR
+
2.25%),
6/04/29
.....................
United
States
2,884,141
2,884,155
WestJet
Loyalty
LP,
First
Lien,
Initial
CME
Term
Loan,
6.422%,
(3-month
SOFR
+
2.75%),
2/14/31
.....................
Canada
1,375,500
1,375,624
5,740,341
a
a
a
a
a
a
Personal
Care
Products
0.5%
c
OPAL
US
LLC,
First
Lien,
CME
Term
Loan,
B4,
6.686%,
(3-month
SOFR
+
3%),
4/28/32
...............................
United
States
1,496,250
1,496,437
c
Pharmaceuticals
1.3%
Grifols
Worldwide
Operations
USA,
Inc.,
First
Lien,
CME
Term
Loan,
B,
5.773%,
(1-month
SOFR
+
2%),
11/15/27
.........
Spain
1,414,912
1,414,912
Jazz
Financing
Lux
SARL,
First
Lien,
Dollar
CME
Term
Loan,
B2,
5.923%,
(1-month
SOFR
+
2.25%),
5/05/28
..............
United
States
2,546
2,558
Organon
&
Co.,
First
Lien,
2024
Refinancing
Dollar
CME
Term
Loan,
5.923%,
(1-month
SOFR
+
2.25%),
5/19/31
.........
United
States
1,065,304
1,032,684
Perrigo
Investments
LLC,
First
Lien,
2024
Refinancing
CME
Term
Loan,
B,
5.673%,
(1-month
SOFR
+
2%),
4/20/29
..........
United
States
692,701
693,858
Southern
Veterinary
Partners
LLC,
First
Lien,
2025
New
CME
Term
Loan,
6.176%,
(1-month
SOFR
+
2.5%),
12/04/31
.....
United
States
686,211
685,611
3,829,623
a
a
a
a
a
a
c
Professional
Services
1.0%
Creative
Artists
Agency
LLC,
First
Lien,
CME
Term
Loan,
6.173%,
(1-month
SOFR
+
2.5%),
10/01/31
.....................
United
States
497,500
496,721
Grant
Thornton
Advisors
LLC,
First
Lien,
2025
Incremental
CME
Term
Loan,
6.423%,
(1-month
SOFR
+
2.75%),
6/02/31
.....
United
States
1,975,100
1,841,070
Ingenovis
Health,
Inc.,
First
Lien,
Initial
CME
Term
Loan,
8.184%,
(3-month
SOFR
+
4.25%),
3/06/28
.....................
United
States
992,186
285,050
Soliant
Lower
Intermediate
LLC,
First
Lien,
Initial
CME
Term
Loan,
7.376%,
(6-month
SOFR
+
3.75%),
7/18/31
.........
United
States
479,370
354,734
2,977,575
a
a
a
a
a
a
c
Real
Estate
Management
&
Development
0.3%
Cushman
&
Wakefield
US
Borrower
LLC,
First
Lien,
2025-2
CME
Term
Loan,
6.423%,
(1-month
SOFR
+
2.75%),
1/31/30
.....
United
States
339,000
340,271
Greystar
Real
Estate
Partners
LLC,
First
Lien,
CME
Term
Loan,
B3,
6.173%,
(3-month
SOFR
+
2.5%),
8/21/30
............
United
States
492,525
493,756
834,027
a
a
a
a
a
a
c
Semiconductors
&
Semiconductor
Equipment
1.6%
Altar
Bidco,
Inc.,
Second
Lien,
Initial
CME
Term
Loan,
9.108%,
(12-month
SOFR
+
5.6%),
2/01/30
.....................
United
States
2,872,500
2,723,130
MKS
Instruments,
Inc.,
First
Lien,
2026-1
Dollar
CME
Term
Loan,
B,
5.421%,
(1-month
SOFR
+
1.75%),
2/04/33
............
United
States
37,533
37,702
Qnity
Electronics,
Inc.,
First
Lien,
Initial
CME
Term
Loan,
5.698%,
(6-month
SOFR
+
2%),
10/29/32
......................
United
States
2,000,000
2,010,000
4,770,832
a
a
a
a
a
a
c
Software
9.2%
Adeia,
Inc.,
First
Lien,
Initial
CME
Term
Loan,
B6,
6.173%,
(1-month
SOFR
+
2.5%),
6/08/28
......................
United
States
1,053,649
1,052,332
Putnam
Funds
Trust
Schedule
of
Investments
Putnam
Floating
Rate
Income
Fund
(continued)
The
accompanying
notes
are
an
integral
part
of
these
financial
statements.
Annual
Report
a
a
Country
Principal
Amount
*
a
Value
a
a
a
a
a
b
Senior
Floating
Rate
Interests
(continued)
c
Software
(continued)
Boxer
Parent
Co.,
Inc.,
Second
Lien,
Initial
CME
Term
Loan,
9.417%,
(3-month
SOFR
+
5.75%),
7/30/32
..............
United
States
2,000,000
$
1,693,330
Central
Parent
LLC,
First
Lien,
2024
Refinancing
CME
Term
Loan,
6.922%,
(3-month
SOFR
+
3.25%),
7/06/29
.........
United
States
1,967,594
1,249,422
Cloud
Software
Group,
Inc.,
First
Lien,
Incremental
CME
Term
Loan,
B,
6.922%,
(3-month
SOFR
+
3.25%),
3/21/31
.......
United
States
965,274
899,636
Cloud
Software
Group,
Inc.,
First
Lien,
Initial
Dollar
CME
Term
Loan,
B,
6.922%,
(3-month
SOFR
+
3.25%),
8/16/32
.......
United
States
1,183,428
1,101,771
Cloudera,
Inc.,
Second
Lien,
Initial
CME
Term
Loan,
9.773%,
(1-month
SOFR
+
6%),
10/10/29
......................
United
States
2,000,000
1,569,980
ConnectWise
LLC,
First
Lien,
Initial
CME
Term
Loan,
7.434%,
(3-month
SOFR
+
3.5%),
9/29/28
......................
United
States
1,332,960
1,205,663
Gen
Digital,
Inc.,
First
Lien,
Second
Amendment
Incremental
CME
Term
Loan,
B,
5.423%,
(1-month
SOFR
+
1.75%),
4/16/32
United
States
1,293,500
1,260,361
Genesys
Cloud
Services,
Inc.,
First
Lien,
2025
Dollar
CME
Term
Loan,
6.173%,
(1-month
SOFR
+
2.5%),
1/30/32
..........
United
States
2,358,304
2,177,894
IGT
Holding
IV
AB,
First
Lien,
CME
Term
Loan,
B8,
6.672%,
(3-month
SOFR
+
3%),
9/02/31
.......................
Sweden
2,928,000
2,858,460
McAfee
Corp.,
First
Lien,
CME
Term
Loan,
B1,
6.673%,
(1-month
SOFR
+
3%),
3/01/29
...............................
United
States
2,963,275
2,598,155
Open
Text
Corp.,
First
Lien,
CME
Term
Loan,
5.423%,
(1-month
SOFR
+
1.75%),
1/31/30
............................
Canada
750,000
731,250
Proofpoint,
Inc.,
First
Lien,
2024
Refinancing
CME
Term
Loan,
6.672%,
(3-month
SOFR
+
3%),
8/31/28
................
United
States
1,940,189
1,862,883
Rocket
Software,
Inc.,
First
Lien,
CME
Term
Loan,
7.423%,
(1-month
SOFR
+
3.75%),
11/28/28
....................
United
States
2,516,165
2,347,381
Skopima
Consilio
Parent
LLC,
First
Lien,
Amendment
No.
5
CME
Term
Loan,
7.423%,
(1-month
SOFR
+
3.75%),
5/12/28
.....
United
States
982,566
785,193
UKG,
Inc.,
First
Lien,
Initial
CME
Term
Loan,
6.167%,
(3-month
SOFR
+
2.5%),
2/10/31
.............................
United
States
2,595,852
2,464,113
Vision
Solutions,
Inc.,
First
Lien,
New
CME
Term
Loan,
B,
7.667%,
(3-month
SOFR
+
4%),
4/24/28
................
United
States
1,808,611
1,549,763
27,407,587
a
a
a
a
a
a
c
Specialty
Retail
5.6%
AIP
RD
Buyer
Corp.,
First
Lien,
CME
Term
Loan,
7.172%,
(1-month
SOFR
+
3.5%),
12/23/30
.....................
United
States
491,300
490,317
Evergreen
Acqco
1
LP,
First
Lien,
Initial
CME
Term
Loan,
6.701%,
(3-month
SOFR
+
3%),
9/17/32
.......................
United
States
1,617,035
1,622,088
Great
Outdoors
Group
LLC,
First
Lien,
CME
Term
Loan,
B,
6.923%,
(1-month
SOFR
+
3.25%),
1/23/32
..............
United
States
2,860,353
2,860,797
Johnstone
Supply
LLC,
First
Lien,
CME
Term
Loan,
B,
5.921%,
(1-month
SOFR
+
2.25%),
6/09/31
.....................
United
States
987,494
985,089
e
Petco
Health
&
Wellness
Co.,
Inc.,
First
Lien,
2026
CME
Term
Loan,
8.037%,
(1-month
SOFR
+
4.25%),
2/03/31
.........
United
States
1,000,000
963,750
PetSmart
LLC,
First
Lien,
Initial
CME
Term
Loan,
7.677%,
(1-month
SOFR
+
4%),
8/18/32
.......................
United
States
1,548,339
1,541,883
RealTruck
Group,
Inc.,
First
Lien,
Second
Amendment
Incremental
CME
Term
Loan,
8.934%,
(3-month
SOFR
+
5%),
1/31/28
.........................................
United
States
1,989,873
1,500,365
Restoration
Hardware,
Inc.,
First
Lien,
2022
Incremental
CME
Term
Loan,
7.023%,
(1-month
SOFR
+
3.25%),
10/20/28
....
United
States
2,969,348
2,961,658
Upbound
Group,
Inc.,
First
Lien,
2025
CME
Term
Loan,
6.418%,
(3-month
SOFR
+
2.75%),
8/19/32
.....................
United
States
1,246,875
1,246,875
Putnam
Funds
Trust
Schedule
of
Investments
Putnam
Floating
Rate
Income
Fund
(continued)
Annual
Report
The
accompanying
notes
are
an
integral
part
of
these
financial
statements.
a
a
Country
Principal
Amount
*
a
Value
a
a
a
a
a
b
Senior
Floating
Rate
Interests
(continued)
c
Specialty
Retail
(continued)
White
Cap
Supply
Holdings
LLC,
First
Lien,
CME
Term
Loan,
C,
6.923%,
(1-month
SOFR
+
3.25%),
10/19/29
.............
United
States
2,292,013
$
2,270,525
16,443,347
a
a
a
a
a
a
c
Textiles,
Apparel
&
Luxury
Goods
1.0%
Beach
Acquisition
Bidco
LLC,
First
Lien,
CME
Term
Loan,
B1,
6.922%,
(3-month
SOFR
+
3.25%),
9/13/32
..............
United
States
101,095
101,569
Canada
Goose,
Inc.,
First
Lien,
2025
Refinancing
CME
Term
Loan,
7.164%,
(3-month
SOFR
+
3.5%),
8/23/32
..........
Canada
745,402
745,946
Flash
Charm,
Inc.,
First
Lien,
CME
Term
Loan,
B2,
7.16%,
(3-month
SOFR
+
3.5%),
3/02/28
......................
United
States
1,969,906
1,585,774
Samsonite
Group
SA,
First
Lien,
Initial
CME
Term
Loan,
B,
5.423%,
(1-month
SOFR
+
1.75%),
11/08/32
.............
United
States
970,543
975,396
3,408,685
a
a
a
a
a
a
c
Trading
Companies
&
Distributors
0.7%
DXP
Enterprises,
Inc.,
First
Lien,
Initial
CME
Term
Loan,
6.922%,
(1-month
SOFR
+
3.25%),
10/11/30
....................
United
States
1,466,475
1,476,740
QXO
Building
Products,
Inc.,
First
Lien,
CME
Term
Loan,
B,
5.673%,
(1-month
SOFR
+
2%),
4/30/32
................
United
States
469,274
469,885
1,946,625
a
a
a
a
a
a
Water
Utilities
0.2%
c
Deep
Blue
Operating
I
LLC,
First
Lien,
Initial
CME
Term
Loan,
6.421%,
(1-month
SOFR
+
2.75%),
10/01/32
.............
United
States
497,216
500,015
c
Wireless
Telecommunication
Services
1.1%
Connect
Finco
SARL,
First
Lien,
Amendment
No.
4
CME
Term
Loan,
8.173%,
(1-month
SOFR
+
4.5%),
9/13/29
..........
United
Kingdom
1,853,933
1,855,092
Crown
Subsea
Communications
Holding,
Inc.,
First
Lien,
2026
CME
Term
Loan,
6.673%,
(1-month
SOFR
+
3%),
1/30/31
...
United
States
1,485,000
1,490,339
3,345,431
a
a
a
a
a
a
Total
Senior
Floating
Rate
Interests
(Cost
$268,609,381)
.......................
257,700,581
Total
Long
Term
Investments
(Cost
$292,068,449)
.............................
281,188,195
a
Short
Term
Investments
4.4%
a
a
Country
Shares
a
Value
a
a
a
a
a
a
Management
Investment
Companies
4.4%
f,g
Putnam
Short
Term
Investment
Fund,
Class
P,
3.852%
.......
United
States
12,863,117
12,863,117
Total
Management
Investment
Companies
(Cost
$12,863,117)
..................
12,863,117
Total
Short
Term
Investments
(Cost
$12,863,117
)
..............................
12,863,117
a
Total
Investments
(Cost
$304,931,566)
100.4%
................................
$294,051,312
Other
Assets,
less
Liabilities
(0.4)%
.........................................
(1,057,596)
Net
Assets
100.0%
.........................................................
$292,993,716
a
a
a
Putnam
Funds
Trust
Schedule
of
Investments
Putnam
Floating
Rate
Income
Fund
(continued)
The
accompanying
notes
are
an
integral
part
of
these
financial
statements.
Annual
Report
At
February
28,
2026,
the
Fund
had
the
following credit
default
swap
contracts outstanding.
See
Note
1
(
c
).
*
The
principal
amount
is
stated
in
U.S.
dollars
unless
otherwise
indicated.
†
Rounds
to
less
than
0.1%
of
net
assets.
a
Security
was
purchased
pursuant
to
Rule
144A
or
Regulation
S
under
the
Securities
Act
of
1933.
144A
securities
may
be
sold
in
transactions
exempt
from
registration
only
to
qualified
institutional
buyers
or
in
a
public
offering
registered
under
the
Securities
Act
of
1933.
Regulation
S
securities
cannot
be
sold
in
the
United
States
without
either
an
effective
registration
statement
filed
pursuant
to
the
Securities
Act
of
1933,
or
pursuant
to
an
exemption
from
registration.
At
February
28,
2026,
the
aggregate
value
of
these
securities
was
$23,237,756,
representing
7.9%
of
net
assets.
b
See
Note
1(d)
regarding
senior
floating
rate
interests.
c
The
coupon
rate
shown
represents
the
rate
inclusive
of
any
caps
or
floors,
if
applicable,
in
effect
at
period
end.
d
Income
may
be
received
in
additional
securities
and/or
cash.
e
A
portion
or
all
of
the
security
purchased
on
a
delayed
delivery
basis.
See
Note
1(b).
f
See
Note
3(g)
regarding
investments
in
affiliated
management
investment
companies.
g
The
rate
shown
is
the
annualized
seven-day
effective
yield
at
period
end.
Credit
Default
Swap
Contracts
Description
Periodic
Payment
Rate
Received
(Paid)
Payment
Frequency
Maturity
Date
Notional
Amount
a
Value
Upfront
Payments
(Receipts)
Unrealized
Appreciation
(Depreciation)
Rating
b
Centrally
Cleared
Swap
Contracts
Contracts
to
Sell
Protection
c,d
Traded
Index
CDX.NA.HY.45
.
5.00%
Quarterly
12/20/30
14,375,000
$
1,100,857
$
1,147,804
$
(46,947)
Non-
Investment
Grade
Total
Centrally
Cleared
Swap
Contracts
.....................................
$1,100,857
$1,147,804
$(46,947)
Total
Credit
Default
Swap
Contracts
....................................
$1,100,857
$
1,147,804
$(46,947)
a
In
U.S.
dollars
unless
otherwise
indicated.
For
contracts
to
sell
protection,
the
notional
amount
is
equal
to
the
maximum
potential
amount
of
the
future
payments
and
no
recourse
provisions
have
been
entered
into
in
association
with
the
contracts.
b
Based
on
Standard
and
Poor's
(S&P)
Rating
for
single
name
swaps
and
internal
ratings
for
index
swaps.
Internal
ratings
based
on
mapping
into
equivalent
ratings
from
external
vendors.
c
Performance
triggers
for
settlement
of
contract
include
default,
bankruptcy
or
restructuring
for
single
name
swaps,
and
failure
to
pay
or
bankruptcy
of
the
underlying
securities
for
traded
index
swaps.
d
The
fund
enters
contracts
to
sell
protection
to
create
a
long
credit
position.
See
Note
8
regarding
other
derivative
information.
See
A
bbreviations
on
page
34
.
Putnam
Funds
Trust
Financial
Statements
Statement
of
Assets
and
Liabilities
February
28,
2026
Annual
Report
The
accompanying
notes
are
an
integral
part
of
these
financial
statements.
Putnam
Floating
Rate
Income
Fund
Assets:
Investments
in
securities:
Cost
-
Unaffiliated
issuers
...................................................................
$292,068,449
Cost
-
Non-controlled
affiliates
(Note
3
g
)
........................................................
12,863,117
Value
-
Unaffiliated
issuers
..................................................................
$281,188,195
Value
-
Non-controlled
affiliates
(Note
3
g
)
.......................................................
12,863,117
Cash
....................................................................................
502,832
Receivables:
Investment
securities
sold
...................................................................
4,385,400
Capital
shares
sold
........................................................................
1,328,447
Dividends
and
interest
.....................................................................
2,053,480
Deposits
with
brokers
for:
Centrally
cleared
swap
contracts
............................................................
1,047,577
Prepaid
expenses
..........................................................................
72,989
Total
assets
..........................................................................
303,442,037
Liabilities:
Payables:
Investment
securities
purchased
..............................................................
9,222,500
Capital
shares
redeemed
...................................................................
647,759
Management
fees
.........................................................................
122,695
Administrative
fees
........................................................................
988
Distribution
fees
..........................................................................
48,125
Transfer
agent
fees
........................................................................
79,814
Trustees'
fees
and
expenses
.................................................................
74,140
Distributions
to
shareholders
.................................................................
55,761
Variation
margin
on
centrally
cleared
swap
contracts
...............................................
66,339
Accrued
expenses
and
other
liabilities
...........................................................
130,200
Total
liabilities
.........................................................................
10,448,321
Net
assets,
at
value
.................................................................
$292,993,716
Net
assets
consist
of:
Paid-in
capital
.............................................................................
$391,530,313
Total
distributable
earnings
(losses)
.............................................................
(98,536,597)
Net
assets,
at
value
.................................................................
$292,993,716
Putnam
Funds
Trust
Financial
Statements
Statement
of
Assets
and
Liabilities
(continued)
February
28,
2026
The
accompanying
notes
are
an
integral
part
of
these
financial
statements.
Annual
Report
Putnam
Floating
Rate
Income
Fund
Class
A:
Net
assets,
at
value
.......................................................................
$187,583,965
Shares
outstanding
........................................................................
24,504,880
Net
asset
value
per
share
a
,b
..................................................................
$7.65
Maximum
offering
price
per
share
(net
asset
value
per
share
÷
97
.75
%
)
b
................................
$7.83
Class
C:
Net
assets,
at
value
.......................................................................
$14,772,989
Shares
outstanding
........................................................................
1,931,635
Net
asset
value
and
maximum
offering
price
per
share
a
,b
............................................
$7.65
Class
R:
Net
assets,
at
value
.......................................................................
$320,653
Shares
outstanding
........................................................................
41,889
Net
asset
value
and
maximum
offering
price
per
share
b
.............................................
$7.65
Class
R6:
Net
assets,
at
value
.......................................................................
$3,548,507
Shares
outstanding
........................................................................
463,156
Net
asset
value
and
maximum
offering
price
per
share
b
.............................................
$7.66
Class
Y:
Net
assets,
at
value
.......................................................................
$86,767,602
Shares
outstanding
........................................................................
11,323,957
Net
asset
value
and
maximum
offering
price
per
share
b
.............................................
$7.66
a
Redemption
price
is
equal
to
net
asset
value
less
contingent
deferred
sales
charges,
if
applicable.
b
Net
asset
value
per
share
may
not
recalculate
due
to
rounding.
Putnam
Funds
Trust
Financial
Statements
Statement
of
Operations
for
the
year
ended
February
28,
2026
Annual
Report
The
accompanying
notes
are
an
integral
part
of
these
financial
statements.
Putnam
Floating
Rate
Income
Fund
Investment
income:
Dividends:
Non-controlled
affiliates
(Note
3
g
)
.............................................................
$812,222
Interest:
Unaffiliated
issuers
........................................................................
24,799,683
Total
investment
income
...................................................................
25,611,905
Expenses:
Management
fees
(Note
3
a
)
...................................................................
1,808,460
Administrative
fees
(Note
3
b
)
..................................................................
5,819
Distribution
fees:
(Note
3c
)
Class
A
................................................................................
530,698
Class
C
................................................................................
161,598
Class
R
................................................................................
1,719
Transfer
agent
fees:
(Note
3e
)
Class
A
................................................................................
235,300
Class
C
................................................................................
17,907
Class
R
................................................................................
381
Class
R6
...............................................................................
1,718
Class
Y
................................................................................
113,215
Custodian
fees
(Note
4
)
......................................................................
6,295
Reports
to
shareholders
fees
..................................................................
44,977
Registration
and
filing
fees
....................................................................
95,617
Professional
fees
...........................................................................
127,972
Trustees'
fees
and
expenses
(Note
3
f
)
...........................................................
13,422
Interest
expense
...........................................................................
748
Other
....................................................................................
11,644
Total
expenses
.........................................................................
3,177,490
Expense
reductions
(Note
4
)
...............................................................
(53,177)
Net
expenses
.........................................................................
3,124,313
Net
investment
income
................................................................
22,487,592
Realized
and
unrealized
gains
(losses):
Net
realized
gain
(loss)
from:
Investments:
Unaffiliated
issuers
......................................................................
(5,285,895)
Swap
contracts
...........................................................................
811,841
Net
realized
gain
(loss)
..................................................................
(4,474,054)
Net
change
in
unrealized
appreciation
(depreciation)
on:
Investments:
Unaffiliated
issuers
......................................................................
(8,131,216)
Swap
contracts
...........................................................................
(240,651)
Net
change
in
unrealized
appreciation
(depreciation)
............................................
(8,371,867)
Net
realized
and
unrealized
gain
(loss)
............................................................
(12,845,921)
Net
increase
(decrease)
in
net
assets
resulting
from
operations
..........................................
$9,641,671
Putnam
Funds
Trust
Financial
Statements
Statements
of
Changes
in
Net
Assets
The
accompanying
notes
are
an
integral
part
of
these
financial
statements.
Annual
Report
Putnam
Floating
Rate
Income
Fund
Year
Ended
February
28,
2026
Year
Ended
February
28,
2025
Increase
(decrease)
in
net
assets:
Operations:
Net
investment
income
.................................................
$22,487,592
$28,213,390
Net
realized
gain
(loss)
.................................................
(4,474,054)
(1,455,534)
Net
change
in
unrealized
appreciation
(depreciation)
...........................
(8,371,867)
(509,025)
Net
increase
(decrease)
in
net
assets
resulting
from
operations
................
9,641,671
26,248,831
Distributions
to
shareholders:
Class
A
.............................................................
(14,235,099)
(16,907,734)
Class
B
.............................................................
—
(13,357)
Class
C
.............................................................
(963,215)
(1,259,062)
Class
R
.............................................................
(22,141)
(35,749)
Class
R6
............................................................
(239,751)
(499,565)
Class
Y
.............................................................
(7,093,229)
(8,523,758)
Total
distributions
to
shareholders
..........................................
(22,553,435)
(27,239,225)
Capital
share
transactions:
(Note
2
)
Class
A
.............................................................
(42,375,293)
11,475,330
Class
B
.............................................................
—
(415,251)
Class
C
.............................................................
(2,243,599)
(2,981,398)
Class
R
.............................................................
(155,107)
(2,297)
Class
R6
............................................................
240,208
(3,372,976)
Class
Y
.............................................................
(31,039,269)
11,072,239
Total
capital
share
transactions
............................................
(75,573,060)
15,775,647
Net
increase
(decrease)
in
net
assets
...................................
(88,484,824)
14,785,253
Net
assets:
Beginning
of
year
.......................................................
381,478,540
366,693,287
End
of
year
...........................................................
$292,993,716
$381,478,540
Notes
to
Financial
Statements
Putnam
Floating
Rate
Income
Fund
1.
Organization
and
Significant
Accounting
Policies
Putnam
Funds
Trust (Trust)
is
registered
under
the
Investment
Company
Act
of
1940
(1940
Act)
as
an
open-end
management
investment
company,
consisting
of fourteen
separate
funds.
The
Trust
follows
the
accounting
and
reporting
guidance
in
Financial
Accounting
Standards
Board
(FASB)
Accounting
Standards
Codification
Topic
946,
Financial
Services
–
Investment
Companies
(ASC
946)
and applies
the
specialized
accounting
and
reporting
guidance
in
U.S.
Generally
Accepted
Accounting
Principles
(U.S.
GAAP),
including,
but
not
limited
to,
ASC
946.
Putnam
Floating
Rate
Income
Fund
(Fund)
is
included
in
this
report.
The
Fund
offers five
classes
of
shares:
Class
A,
Class
C,
Class
R,
Class
R6
and
Class
Y. Class
C
shares
automatically
convert
to
Class
A
shares
on
a
monthly
basis,
after
they
have
been
held
for
8
years.
Each
class
of
shares
may
differ
by
its
initial
sales
load,
contingent
deferred
sales
charges,
voting
rights
on
matters
affecting
a
single
class,
its
exchange
privilege
and
fees
due
to
differing
arrangements
for
distribution
and
transfer
agent
fees.
Effective
September
5,
2024,
all
Class
B
shares
were
converted
to
Class
A.
The
following
summarizes
the
Fund
's
significant
accounting
policies.
a.
Financial
Instrument
Valuation
The
Fund's
investments
in
financial
instruments
are
carried
at
fair
value
daily.
Fair
value
is
the
price
that
would
be
received
to
sell
an
asset
or
paid
to
transfer
a
liability
in
an
orderly
transaction
between
market
participants
on
the
measurement
date.
The
Fund
calculates
the
net
asset
value
(NAV)
per
share
each business
day as
of
4
p.m.
Eastern
time
or
the
regularly
scheduled
close
of
the
New
York
Stock
Exchange
(NYSE),
whichever
is
earlier.
Under
compliance
policies
and
procedures
approved
by
the Trust's
Board
of
Trustees
(the
Board),
the
Board
has
designated
the
Fund’s
investment
manager
as
the
valuation
designee
and
has
responsibility
for
oversight
of
valuation.
The
investment
manager
is
assisted
by
the
Fund’s
administrator
in
performing
this
responsibility,
including
leading
the
cross-
functional
Valuation
Committee
(VC).
The
Fund
may
utilize
independent
pricing
services,
quotations
from
securities
and
financial
instrument
dealers,
and
other
market
sources
to
determine
fair
value.
Debt
securities
generally
trade
in
the over-the-counter
(OTC)
market
rather
than
on
a
securities
exchange.
The
Fund's
pricing
services
use
multiple
valuation
techniques
to
determine
fair
value.
In
instances
where
sufficient
market
activity
exists,
the
pricing
services
may
utilize
a
market-based
approach
through
which
quotes
from
market
makers
are
used
to
determine
fair
value.
In
instances
where
sufficient
market
activity
may
not
exist
or
is
limited,
the
pricing
services
also
utilize
proprietary
valuation
models
which
may
consider
market
characteristics
such
as
benchmark
yield
curves,
credit
spreads,
estimated
default
rates,
anticipated
market
interest
rate
volatility,
coupon
rates,
anticipated
timing
of
principal
repayments,
underlying
collateral,
and
other
unique
security
features
in
order
to
estimate
the
relevant
cash
flows,
which
are
then
discounted
to
calculate
the
fair
value.
Investments
in open-end mutual
funds
are
valued
at
the
closing
NAV.
Certain
derivative
financial
instruments
are
centrally
cleared
or
trade
in
the
OTC
market.
The
Fund's
pricing
services
use
various
techniques
including
industry
standard
option
pricing
models
and
proprietary
discounted
cash
flow
models
to
determine
the
fair
value
of
those
instruments.
The
Fund's
net
benefit
or
obligation
under
the
derivative
contract,
as
measured
by
the
fair
value
of
the
contract,
is
included
in
net
assets.
The
Fund
has
procedures
to
determine
the
fair
value
of
financial
instruments
for
which
market
prices
are
not
reliable
or
readily
available.
Under
these
procedures,
the Fund
primarily
employs
a
market-based
approach
which
may
use
related
or
comparable
assets
or
liabilities,
recent
transactions,
market
multiples,
and
other
relevant
information
for
the
investment
to
determine
the
fair
value
of
the
investment.
An
income-based
valuation
approach
may
also
be
used
in
which
the
anticipated
future
cash
flows
of
the
investment
are
discounted
to
calculate
fair
value.
Discounts
may
also
be
applied
due
to
the
nature
or
duration
of
any
restrictions
on
the
disposition
of
the
investments.
Due
to
the
inherent
uncertainty
of
valuations
of
such
investments,
the
fair
values
may
differ
significantly
from
the
values
that
would
have
been
used
had
an
active
market
existed.
Putnam
Funds
Trust
Notes
to
Financial
Statements
Putnam
Floating
Rate
Income
Fund
(continued)
b.
Securities
Purchased
on
a
When-Issued,
Forward
Commitment or
Delayed
Delivery
Basis
The
Fund
may
purchase
securities
on
a when-issued,
forward
commitment
or
delayed
delivery basis,
with
payment
and
delivery
scheduled
for
a
future
date.
These
transactions
are
subject
to
market
fluctuations
and
are
subject
to
the
risk
that
the
value
at
delivery
may
be
more
or
less
than
the
trade
date
purchase
price.
Although
the
Fund
will
generally
purchase
these
securities
with
the
intention
of
holding
the
securities, it
may
sell
the
securities
before
the
settlement
date.
c.
Derivative
Financial
Instruments
The
Fund invested
in
derivative
financial
instruments
in
order
to
manage
risk
or
gain
exposure
to
various
other
investments
or
markets.
Derivatives
are
financial
contracts
based
on
an
underlying
or
notional
amount,
require
no
initial
investment
or
an
initial
net
investment
that
is
smaller
than
would
normally
be
required
to
have
a
similar
response
to
changes
in
market
factors,
and
require
or
permit
net
settlement.
Derivatives
contain
various
risks
including
the
potential
inability
of
the
counterparty
to
fulfill
their
obligations
under
the
terms
of
the
contract,
the
potential
for
an
illiquid
secondary
market,
and/or
the
potential
for
market
movements
which
expose
the
Fund
to
gains
or
losses
in
excess
of
the
amounts
shown
in
the
Statement
of
Assets
and
Liabilities.
Realized
gain
and
loss
and
unrealized
appreciation
and
depreciation
on
these
contracts
for
the
period
are
included
in
the
Statement
of
Operations.
Collateral
requirements
differ
by
type
of
derivative.
Collateral
or
initial
margin
requirements
are
set
by
the
broker
or
exchange
clearing
house
for
exchange
traded
and
centrally
cleared
derivatives.
Initial
margin
deposited
is
held
at
the
exchange
or
at
the
broker
and
can
be
in
the
form
of
cash
and/or
securities.
The
Fund
entered
into
credit
default
swap
contracts
primarily
to
manage
and/or
gain
exposure
to
credit
risk.
A
credit
default
swap
is
an
agreement
between
the
Fund
and
a
counterparty
whereby
the
buyer
of
the
contract
receives
credit
protection
and
the
seller
of
the
contract
guarantees
the
credit
worthiness
of
a
referenced
debt
obligation.
These
agreements
may
be
privately
negotiated
in
the
over-the-
counter
market
(OTC
credit
default
swaps)
or
may
be
executed
in
a
multilateral
trade
facility
platform,
such
as
a
registered
exchange
(centrally
cleared
credit
default
swaps).
The
underlying
referenced
debt
obligation
may
be
a
single
issuer
of
corporate
or
sovereign
debt,
a
credit
index,
a
basket
of
issuers
or
indices,
or
a
tranche
of
a
credit
index
or
basket
of
issuers
or
indices.
In
the
event
of
a
default
of
the
underlying
referenced
debt
obligation,
the
buyer
is
entitled
to
receive
the
notional
amount
of
the
credit
default
swap
contract
from
the
seller
in
exchange
for
the
referenced
debt
obligation,
a
net
settlement
amount
equal
to
the
notional
amount
of
the
credit
default
swap
less
the
recovery
value
of
the
referenced
debt
obligation,
or
other
agreed
upon
amount.
For
centrally
cleared
credit
default
swaps,
required
initial
margins
are
pledged
by
the
Fund,
and
the
daily
change
in
fair
value
is
accounted
for
as
a
variation
margin
payable
or
receivable
in
the
Statement
of
Assets
and
Liabilities.
Over
the
term
of
the
contract,
the
buyer
pays
the
seller
a
periodic
stream
of
payments,
provided
that
no
event
of
default
has
occurred.
Such
periodic
payments
are
accrued
daily
as
an
unrealized
appreciation or
depreciation
until
the
payments
are
made,
at
which
time
they
are
realized.
Upfront
payments
and
receipts
are
reflected
in
the Statement
of
Assets
and
Liabilities
and
represent
compensating
factors
between
stated
terms
of
the
credit
default
swap
agreement
and
prevailing
market
conditions
(credit
spreads
and
other
relevant
factors).
These
upfront
payments
and
receipts
are
amortized
over
the
term
of
the
contract
as
a
realized
gain
or
loss
in
the Statement
of
Operations.
Credit
default
swap
contracts
outstanding
at
period
end,
if
any,
are
listed
in
the
Fund's
Schedule
of
Investments.
See
Note
8
regarding
other
derivative
information.
d.
Senior
Floating
Rate
Interests
The
Fund
invests
in
senior
secured
corporate
loans
that
pay
interest
at
rates
which
are
periodically
reset
by
reference
to
a
base
lending
rate
plus
a
spread.
These
base
lending
rates
are
generally
the
prime
rate
offered
by
a
designated
U.S.
bank
or
the
Secured
Overnight
Financing
Rate
(SOFR).
Senior
secured
corporate
loans
often
require
prepayment
of
principal
from
excess
cash
flows
or
at
the
discretion
of
the
borrower.
As
a
result,
actual
maturity
may
be
substantially
less
than
the
stated
maturity.
Senior
secured
corporate
loans
in
which
the Fund
invests
are
generally
readily
marketable,
but
may
be
subject
to
certain
restrictions
on
resale.
1.
Organization
and
Significant
Accounting
Policies
(continued)
Putnam
Funds
Trust
Notes
to
Financial
Statements
Putnam
Floating
Rate
Income
Fund
(continued)
e.
Income
Taxes
It
is the Fund's
policy
to
qualify
as
a
regulated
investment
company
under
the
Internal
Revenue
Code. The Fund
intends
to
distribute
to
shareholders
substantially
all
of
its
taxable
income
and
net
realized
gains
to
relieve
it
from
federal
income
and
excise
taxes.
As
a
result,
no
provision
for
U.S.
federal
income
taxes
is
required.
The Fund
may
recognize
an
income
tax
liability
related
to
its
uncertain
tax
positions
under
U.S.
GAAP
when
the
uncertain
tax
position
has
a
less
than
50%
probability
that
it
will
be
sustained
upon
examination
by
the
tax
authorities
based
on
its
technical
merits.
As
of
February
28,
2026, the Fund
has
determined
that
no
tax
liability
is
required
in
its
financial
statements
related
to
uncertain
tax
positions
for
any
open
tax
years
(or
expected
to
be
taken
in
future
tax
years).
The
Fund’s
federal
and
state
income
and
federal
excise
tax
returns
for
the
prior
three
fiscal
years
are
subject
to
examination
by
the
Internal
Revenue
Service
and
state
departments
of
revenue.
f.
Security
Transactions,
Investment
Income,
Expenses
and
Distributions
Security
transactions
are
accounted
for
on
trade
date.
Realized
gains
and
losses
on
security
transactions
are
determined
on
a
specific
identification
basis.
Interest
income
(including
interest
income
from
payment-in-kind
securities,
if
any)
and
estimated
expenses
are
accrued
daily.
Amortization
of
premium
and
accretion
of
discount
on
debt
securities
are
included
in
interest
income.
Paydown
gains
and
losses
are
recorded
as
an
adjustment
to
interest
income. The
Fund
may
receive
other
income
from
investments
in
senior
secured
corporate
loans
or
unfunded
commitments,
including
amendment
fees,
consent
fees
or
commitment
fees.
These
fees
are
recorded
as
income
when
received
by
the
Fund.
Dividends from
net
investment
income
are
normally
declared
daily;
these
dividends
may
be
reinvested
or
paid
monthly
to
shareholders.
Distributions
from realized
capital
gains
and
other
distributions,
if
any,
are
recorded
on
the
ex-dividend
date.
Distributable
earnings
are
determined
according
to
income
tax
regulations
(tax
basis)
and
may
differ
from
earnings
recorded
in
accordance
with
U.S.
GAAP.
These
differences
may
be
permanent
or
temporary.
Permanent
differences
are
reclassified
among
capital
accounts
to
reflect
their
tax
character.
These
reclassifications
have
no
impact
on
net
assets
or
the
results
of
operations.
Temporary
differences
are
not
reclassified,
as
they
may
reverse
in
subsequent
periods.
Common
expenses
incurred
by
the
Trust
are
allocated
among
the
Funds
based
on
the
ratio
of
net
assets
of
each
Fund
to
the
combined
net
assets
of
the
Trust
or
based
on
the
ratio
of
number
of
shareholders
of
each
Fund
to
the
combined
number
of
shareholders
of
the
Trust.
Fund
specific
expenses
are
charged
directly
to
the
Fund
that
incurred
the
expense.
Realized
and
unrealized
gains
and
losses
and
net
investment
income,
excluding
class
specific
expenses,
are
allocated
daily
to
each
class
of
shares
based
upon
the
relative
proportion
of
net
assets
of
each
class.
Differences
in
per
share
distributions
by
class
are
generally
due
to
differences
in
class
specific
expenses.
g.
Accounting
Estimates
The
preparation
of
financial
statements
in
accordance
with
U.S.
GAAP
requires
management
to
make
estimates
and
assumptions
that
affect
the
reported
amounts
of
assets
and
liabilities
at
the
date
of
the
financial
statements
and
the
amounts
of
income
and
expenses
during
the
reporting
period.
Actual
results
could
differ
from
those
estimates.
h.
Guarantees
and
Indemnifications
Under
the Trust's
organizational
documents,
its
officers
and trustees
are
indemnified
by
the Trust against
certain
liabilities
arising
out
of
the
performance
of
their
duties
to
the
Trust.
Additionally,
in
the
normal
course
of
business,
the Trust,
on
behalf
of
the
Fund, enters
into
contracts
with
service
providers
that
contain
general
indemnification
clauses.
The Trust's
maximum
exposure
under
these
arrangements
is
unknown
as
this
would
involve
future
claims
that
may
be
made
against
the Trust
that
have
not
yet
occurred.
Currently,
the Trust
expects
the
risk
of
loss
to
be
remote.
1.
Organization
and
Significant
Accounting
Policies
(continued)
Putnam
Funds
Trust
Notes
to
Financial
Statements
Putnam
Floating
Rate
Income
Fund
(continued)
2.
Shares
of
Beneficial
Interest
At
February
28,
2026,
there
were
an
unlimited
number
of
shares
authorized
(without
par
value).
Transactions
in
the
Fund's
shares
were
as
follows:
Year
Ended
February
28,
2026
Year
Ended
February
28,
2025
Shares
Amount
Shares
Amount
Class
A
Shares:
Shares
sold
a
...................................
4,001,443
$31,462,295
8,476,381
$67,697,560
Shares
issued
in
reinvestment
of
distributions
..........
1,665,235
13,078,938
1,974,309
15,759,509
Shares
redeemed
...............................
(11,066,895)
(86,916,526)
(9,018,346)
(71,981,739)
Net
increase
(decrease)
..........................
(5,400,217)
$(42,375,293)
1,432,344
$11,475,330
Class
B
Shares:
*
Shares
issued
in
reinvestment
of
distributions
..........
—
$—
1,645
$13,122
Shares
redeemed
...............................
—
—
(53,783)
(428,373)
Net
increase
(decrease)
..........................
—
$—
(52,138)
$(415,251)
Class
C
Shares:
Shares
sold
...................................
333,699
$2,626,001
374,803
$2,991,699
Shares
issued
in
reinvestment
of
distributions
..........
113,272
888,633
145,213
1,158,623
Shares
redeemed
a
..............................
(732,014)
(5,758,233)
(894,151)
(7,131,720)
Net
increase
(decrease)
..........................
(285,043)
$(2,243,599)
(374,135)
$(2,981,398)
Class
R
Shares:
Shares
sold
...................................
5,387
$42,150
24,123
$192,463
Shares
issued
in
reinvestment
of
distributions
..........
2,799
21,983
4,440
35,428
Shares
redeemed
...............................
(28,033)
(219,240)
(28,832)
(230,188)
Net
increase
(decrease)
..........................
(19,847)
$(155,107)
(269)
$(2,297)
Class
R6
Shares:
Shares
sold
...................................
84,249
$662,736
148,047
$1,184,285
Shares
issued
in
reinvestment
of
distributions
..........
28,680
225,368
60,808
485,760
Shares
redeemed
...............................
(82,476)
(647,896)
(630,863)
(5,043,021)
Net
increase
(decrease)
..........................
30,453
$240,208
(422,008)
$(3,372,976)
Class
Y
Shares:
Shares
sold
...................................
2,313,269
$18,203,979
6,141,661
$49,102,349
Shares
issued
in
reinvestment
of
distributions
..........
855,612
6,725,836
978,246
7,815,960
Shares
redeemed
...............................
(7,128,151)
(55,969,084)
(5,736,689)
(45,846,070)
Net
increase
(decrease)
..........................
(3,959,270)
$(31,039,269)
1,383,218
$11,072,239
*
Effective
September
5,
2024,
the
Fund
has
terminated
its
Class
B
shares.
a
May
include
a
portion
of
Class
C
shares
that
were
automatically
converted
to
Class
A.
Putnam
Funds
Trust
Notes
to
Financial
Statements
Putnam
Floating
Rate
Income
Fund
(continued)
3.
Transactions
with
Affiliates
Franklin
Resources,
Inc.
is
the
holding
company
for
various
subsidiaries
that
together
are
referred
to
as
Franklin
Templeton.
Certain
officers
and
trustees
of
the Fund are
also
officers
and/or
trustees of
the
following
subsidiaries:
a.
Management
Fees
The
Fund
pays Advisers
a
management
fee
(based
on
the
Fund’s
average
net
assets
and
computed
and
paid
monthly)
at
annual
rates
that
may
vary
based
on
the
average
of
the
aggregate
net
assets
of
all
open-end
mutual
funds
sponsored
by
Putnam
Management
(including
open-end
funds
managed
by
affiliates
of
Putnam
Management
that
have
been
deemed
to
be
sponsored
by
Putnam
Management
for
this
purpose)
(excluding
net
assets
of
such
funds
that
are
invested
in,
or
that
are
invested
in
by,
other
such
funds
to
the
extent
necessary
to
avoid
“double
counting”
of
those
assets).
Such
annual
rates
may
vary
as
follows:
For
the
year
ended
February
28,
2026,
the
gross
effective
investment
management
fee
rate
was 0.541%
of
the
Fund’s
average daily
net
assets.
Advisers
retained
Putnam
Management
as
subadvisor
for
the
Fund.
Pursuant
to
the
agreement,
Putnam
Management
provides
certain
advisory
and
related
services
to
the
Fund.
Advisers
pays
a
monthly
fee
to
Putnam
Management
based
on
the
costs
of
Putnam
Management
in
providing
these
services
to
the
Fund,
which
may
include
a
mark-up
not
to
exceed
15%
over
such
costs.
Under
a
subadvisory
agreement,
FTIML
provides
subadvisory
services
to
the
Fund.
The
subadvisory
fee
is
paid by Advisers
based
on
the
average
net
assets
managed
by
FTIML,
and
is
not
an
additional
expense
of
the
Fund.
b.
Administrative
Fees
Under
an
agreement
with
Advisers,
FT
Services
provides
administrative
services
to
the
Fund.
The
fee
is
paid
by Advisers
based
on
the Fund's
average
daily
net
assets,
and
is
not
an
additional
expense
of
the
Fund.
Subsidiary
Affiliation
Franklin
Advisers,
Inc.
(Advisers)
Investment
manager
Putnam
Investment
Management,
LLC
(Putnam
Management)
Subadvisor
Franklin
Templeton
Investment
Management
Limited
(FTIML)
Subadvisor
Franklin
Templeton
Services,
LLC
(FT
Services)
Administrative
manager
Franklin
Distributors,
LLC
(Distributors)
Principal
underwriter
Putnam
Investor
Services,
Inc.
(PSERV)
Transfer
agent
Annualized
Fee
Rate
Net
Assets
0.720%
of
the
first
$5
billion,
0.670%
of
the
next
$5
billion,
0.620%
of
the
next
$10
billion,
0.570%
of
the
next
$10
billion,
0.520%
of
the
next
$50
billion,
0.500%
of
the
next
$50
billion,
0.490%
of
the
next
$100
billion
and
0.485%
of
any
excess
thereafter.
Putnam
Funds
Trust
Notes
to
Financial
Statements
Putnam
Floating
Rate
Income
Fund
(continued)
The
Fund
reimburses
Advisers
an
allocated
amount
for
the
compensation
and
related
expenses
of
certain
officers
of
the
Fund
and
their
staff
who
provide
administrative
services
to
the
Fund.
The
aggregate
amount
of
all
such
reimbursements
is
determined
annually
by
the
Trustees.
c.
Distribution
Fees
The
Fund
has
adopted
distribution
plans
(the
Plans)
with
respect
to
the
following
share
classes
pursuant
to
Rule
12b–1
under
the
1940
Act.
The
purpose
of
the
Plans
is
to
compensate
Distributors
for
services
provided
and
expenses
incurred
in
distributing
shares
of
the
Fund.
The
Plans
provide
payments
by
the
Fund
to
Distributors
at
an
annual
rate
of
up
to
the
following
amounts
(Maximum
%)
of
the
average
net
assets
attributable
to
each
class.
The
Trustees
have
approved
payment
by
the
Fund
at
the
following
annual
rate
(Approved
%)
of
the
average
net
assets
attributable
to
each
class.
d.
Sales
Charges/Underwriting
Agreements
Front-end
sales
charges
and
contingent
deferred
sales
charges
(CDSC)
do
not
represent
expenses
of
the
Fund.
These
charges
are
deducted
from
the
proceeds
of
sales
of
fund
shares
prior
to
investment
or
from
redemption
proceeds
prior
to
remittance,
as
applicable.
Distributors
has
advised
the
Fund
of
the
following
commission
transactions
related
to
the
sales
and
redemptions
of
the
Fund's
shares
for
the
year:
e.
Transfer
Agent
Fees
PSERV,
an
affiliate
of
Advisers,
provides
investor
servicing
agent
functions
to
the
Fund.
PSERV
received
fees
for
investor
servicing
for
Class
A,
Class
C,
Class
R
and
Class
Y shares
that
included
(1)
a
per
account
fee
for
each
direct
and
underlying
non-defined
contribution
account
(retail
account)
of
the
Fund;
(2)
a
specified
rate
of
the
Fund’s
assets
attributable
to
defined
contribution
plan
accounts;
and
(3)
a
specified
rate
based
on
the
average
net
assets
in
retail
accounts.
PSERV
has
agreed
that
the
aggregate
investor
servicing
fees
for
each
Fund’s
retail
and
defined
contribution
accounts
for
these
share
classes
will
not
exceed
an
annual
rate
of
0.25%
of
the
Fund’s
average
assets
attributable
to
such
accounts.
Class R6
shares
paid
a
monthly
fee
based
on
the
average
net
assets
of
Class R6
shares
at
an
annual
rate
of
0.05%.
f.
Trustee
Fees
The
Fund
has
adopted
a
Trustee
Fee
Deferral
Plan
(the
Deferral
Plan)
which
allows
the
Trustees to
defer
the
receipt
of
all
or
a
portion
of
Trustees'
fees
payable
from
July
1,
1995
through
December
31,
2023.
The
deferred
fees
remain
invested
in
certain
Putnam
funds
until
distribution
in
accordance
with
the
Deferral
Plan.
The
Fund
has
adopted
an
unfunded
noncontributory
defined
benefit
pension
plan
(the
Pension
Plan)
covering
all
Trustees
of
the
Fund
who
have
served
as
a
Trustee
for
at
least
five
years
and
were
first
elected
prior
to
2004.
Benefits
under
the
Pension
Plan
are
equal
to
50%
of
the
Trustee's
average
annual
attendance
and
retainer
fees
for
the
three
years
ended
December
31,
2005.
The
retirement
benefit
is
payable
during
a
Trustee's
lifetime,
beginning
the
year
following
retirement,
for
the
number
of
Maximum
%
Approved
%
Class
A
...................................................................
0.35%
0.25%
Class
C
...................................................................
1.00%
1.00%
Class
R
...................................................................
1.00%
0.50%
Sales
charges
retained
net
of
commissions
paid
to
unaffiliated
brokers/dealers
..............................
$15,097
CDSC
retained
..............................................................................
$6,998
3.
Transactions
with
Affiliates
(continued)
b.
Administrative
Fees
(continued)
Putnam
Funds
Trust
Notes
to
Financial
Statements
Putnam
Floating
Rate
Income
Fund
(continued)
years
of
service
through
December
31,
2006.
Pension
expense
for
the
Fund
is
included
in
the
Trustees' fees
and
expenses
in
the
Statement
of
Operations.
Accrued
pension
liability
is
included
in
Payable
for
Trustees' fees
and
expenses
in
the
Statement
of
Assets
and
Liabilities.
The
Trustees
have
terminated
the
Pension
Plan
with
respect
to
any
Trustee
first
elected
after
2003.
g.
Investments
in
Affiliated
Management
Investment
Companies
The
Fund
invests
in
one
or
more
affiliated
management
investment
companies.
As
defined
in
the
1940
Act,
an
investment
is
deemed
to
be
a
“Controlled
Affiliate”
of
a
fund
when
a
fund
owns,
either
directly
or
indirectly,
25%
or
more
of
the
affiliated
fund’s
outstanding
shares
or
has
the
power
to
exercise
control
over
management
or
policies
of
such
fund.
The
Fund
does
not
invest
for
purposes
of
exercising
a
controlling
influence
over
the
management
or
policies.
Management
fees
paid
by
the
Fund
are
waived
on
assets
invested
in
the
affiliated
management
investment
companies,
as
noted
in
the
Statement
of
Operations,
in
an
amount
not
to
exceed
the
management
and
administrative
fees,
if
applicable, paid
directly
or
indirectly
by
each
affiliate.
During
the
year
ended
February
28,
2026,
the
Fund
held
investments
in
affiliated
management
investment
companies
as
follows:
h.
Waiver
and
Expense
Reimbursements
Advisers has
contractually
agreed,
through
June
30,
2026,
to
waive
fees
and/or
reimburse
the
Fund’s
expenses
to
the
extent
necessary
to
limit
the
cumulative
expenses
of
the
Fund,
exclusive
of
brokerage,
interest,
taxes,
investment-related
expenses,
extraordinary
expenses,
acquired
fund
fees
and
expenses
and
payments
under
the
Fund’s
investor
servicing
contract,
investment
management
contract
and
distribution
plans,
on
a
fiscal
year-to-date
basis
to
an
annual
rate
of
0.20%
of
the
Fund’s
average
net
assets
over
such
fiscal
year-to-date
period.
4.
Expense
Offset
Arrangement
The
Fund
has
entered
into
arrangements
with
PSERV
and
its
custodian
whereby
credits
realized
as
a
result
of
uninvested
cash
balances
are
used
to
reduce
a
portion
of
the
Fund's
transfer
agent
and
custodian
fees,
respectively.
During
the
year
ended
February
28,
2026,
the
fees
were
reduced
as
noted
in
the
Statement
of
Operations.
Effective
May
19,
2025,
earned
credits
on
custodian
fees,
if
any,
are
recognized
as
income.
aa
Value
at
Beginning
of
Year
Purchases
Sales
Realized
Gain
(Loss)
Net
Change
in
Unrealized
Appreciation
(Depreciation)
Value
at
End
of
Year
Number
of
Shares
Held
at
End
of
Year
Investment
Income
a
a
a
a
a
a
a
a
Putnam
Floating
Rate
Income
Fund
Non-Controlled
Affiliates
Dividends
Putnam
Short
Term
Investment
Fund,
Class
P,
3.852%
......
$34,157,610
$142,072,889
$(163,367,382)
$—
$—
$12,863,117
12,863,117
$812,222
Total
Affiliated
Securities
...
$34,157,610
$142,072,889
$(163,367,382)
$—
$—
$12,863,117
$812,222
3.
Transactions
with
Affiliates
(continued)
f.
Trustee
Fees
(continued)
Putnam
Funds
Trust
Notes
to
Financial
Statements
Putnam
Floating
Rate
Income
Fund
(continued)
5.
Income
Taxes
For
tax
purposes,
capital
losses
may
be
carried
over
to
offset
future
capital
gains.
At
February
28,
2026,
the
capital
loss
carryforwards
were
as
follows:
The
tax
character
of
distributions
paid
during
the
years
ended
February
28,
2026
and
2025,
was
as
follows:
At
February
28,
2026,
the
cost
of
investments,
net
unrealized
appreciation
(depreciation)
and
undistributed
ordinary
income for
income
tax
purposes
were
as
follows:
Differences
between
income
and/or
capital
gains
as
determined
on
a
book
basis
and
a
tax
basis
are
primarily
due
to
differing
treatment
of
derivative
financial
instruments.
6.
Investment
Transactions
Purchases
and
sales
of
investments (excluding
short
term
securities) for
the
year
ended
February
28,
2026,
aggregated
$107,132,435 and
$166,349,709,
respectively.
7.
Credit
Risk
At
February
28,
2026,
the
Fund
had
90.7%
of
its
portfolio
invested
in
high
yield
securities,
senior
secured
floating
rate
loans,
or
other
securities
rated
below
investment
grade
as
determined
by
Nationally
Recognized
Statistical
Credit
Ratings
Organizations
and/or
internally,
by
investment
management
and
unrated
securities.
These
securities
may
be
more
sensitive
to
economic
conditions
causing
greater
price
volatility
and
are
potentially
subject
to
a
greater
risk
of
loss
due
to
default
than
higher
rated
securities.
Capital
loss
carryforwards
not
subject
to
expiration:
Short
term
................................................................................
$
11,686,059
Long
term
................................................................................
77,397,825
Total
capital
loss
carryforwards
...............................................................
$89,083,884
2026
2025
Distributions
paid
from:
Ordinary
income
..........................................................
$22,553,435
$27,239,225
Cost
of
investments
..........................................................................
$305,855,942
Unrealized
appreciation
........................................................................
$1,658,968
Unrealized
depreciation
........................................................................
(12,362,741)
Net
unrealized
appreciation
(depreciation)
..........................................................
$(10,703,773)
Distributable
earnings:
Undistributed
ordinary
income
...................................................................
$1,306,823
Putnam
Funds
Trust
Notes
to
Financial
Statements
Putnam
Floating
Rate
Income
Fund
(continued)
8.
Other
Derivative
Information
At
February
28,
2026,
investments
in
derivative
contracts
are
reflected
in
the Statement of
Assets
and
Liabilities
as
follows:
For
the
year
ended
February
28,
2026,
the
effect
of
derivative
contracts
in
the Statement
of
Operations
was
as
follows:
For
the
year
ended
February
28,
2026,
the
average
month
end
notional
amount
of
swap
contracts
represented
$14,375,000.
See
Note
1(c) regarding
derivative
financial
instruments.
9.
Credit
Facility
The
Fund,
together
with
other
U.S.
registered
and
foreign
investment
funds
(collectively,
Borrowers),
managed
by
Franklin
Templeton,
are
borrowers
in
a
joint
syndicated
senior
unsecured
credit
facility
totaling
$2.995
billion
(Global
Credit
Facility)
which
matures
on
January
29,
2027.
This
Global
Credit
Facility
provides
a
source
of
funds
to
the
Borrowers
for
temporary
and
emergency
purposes,
including
the
ability
to
meet
future
unanticipated
or
unusually
large
redemption
requests.
Under
the
terms
of
the
Global
Credit
Facility,
the
Fund
may,
in
addition
to
interest
charged
on
any
borrowings
made
by
the
Fund
and
other
costs
incurred
by
the
Fund,
pay
its
share
of
fees
and
expenses
incurred
in
connection
with
the
implementation
and
maintenance
of
the
Global
Credit
Facility,
based
upon
its
relative
share
of
the
aggregate
net
assets
of
all
of
the
Borrowers,
including
an
annual
commitment
fee
of
0.15%
based
upon
the
unused
portion
of
the
Global
Credit
Facility.
These
fees
are
reflected
in
other
expenses
in
the
Statement
of
Operations.
During
the
year
ended
February
28,
2026,
the Fund
did
not
use
the
Global
Credit
Facility.
Asset
Derivatives
Liability
Derivatives
Derivative
Contracts
Not
Accounted
for
as
Hedging
Instruments
Statement
of
Assets
and
Liabilities
Location
Fair
Value
Statement
of
Assets
and
Liabilities
Location
Fair
Value
Putnam
Floating
Rate
Income
Fund
Credit
contracts
............
Variation
margin
on
centrally
cleared
swap
contracts
$
—
Variation
margin
on
centrally
cleared
swap
contracts
$
46,947
a
Total
....................
$—
$46,947
a
This
amount
reflects
the
cumulative
appreciation
(depreciation)
of
centrally
cleared
swap
contracts
as
reported
in
the
Schedule
of
Investments.
Only
the
variation
margin
receivable/payable
at
year
end
is
separately
reported
within
the
Statement
of
Assets
and
Liabilities.
Prior
variation
margin
movements
were
recorded
to
cash
upon
receipt
or
payment.
Derivative
Contracts
Not
Accounted
for
as
Hedging
Instruments
Statement
of
Operations
Location
Net
Realized
Gain
(Loss)
for
the
Year
Statement
of
Operations
Location
Net
Change
in
Unrealized
Appreciation
(Depreciation)
for
the
Year
Putnam
Floating
Rate
Income
Fund
Net
realized
gain
(loss)
from:
Net
change
in
unrealized
appreciation
(depreciation)
on:
Credit
contracts
...............
Swap
contracts
$811,841
Swap
contracts
$(240,651)
Total
.......................
$811,841
$(240,651)
Putnam
Funds
Trust
Notes
to
Financial
Statements
Putnam
Floating
Rate
Income
Fund
(continued)
10.
Fair
Value
Measurements
The
Fund
follows
a
fair
value
hierarchy
that
distinguishes
between
market
data
obtained
from
independent
sources
(observable
inputs)
and
the Fund's
own
market
assumptions
(unobservable
inputs).
These
inputs
are
used
in
determining
the
value
of
the
Fund's financial
instruments
and
are
summarized
in
the
following
fair
value
hierarchy:
Level
1
–
quoted
prices
in
active
markets
for
identical
financial
instruments
Level
2
–
other
significant
observable
inputs
(including
quoted
prices
for
similar
financial
instruments,
interest
rates,
prepayment
speed,
credit
risk,
etc.)
Level
3
–
significant
unobservable
inputs
(including
the
Fund's
own
assumptions
in
determining
the
fair
value
of
financial
instruments)
The
input
levels
are
not
necessarily
an
indication
of
the
risk
or
liquidity
associated
with
financial
instruments
at
that
level.
A
summary
of
inputs
used
as
of
February
28,
2026,
in
valuing
the
Fund's assets
and
liabilities carried
at
fair
value,
is
as
follows:
11.
Operating
Segments
The Fund operates
as
a
single
operating
segment,
which
is
an
investment
portfolio.
The
portfolio
managers
assigned
to
the
Fund
within
the
Fund’s
investment
manager serve
as
the
Chief
Operating
Decision
Maker
(“CODM”)
and
are
responsible
for
evaluating
the
Fund's
operating
results
and
allocating
resources
in
accordance
with
the
Fund’s
investment
strategy.
Internal
reporting
provided
to
the
CODM
aligns
with
the
accounting
policies
and
measurement
principles
used
in
the financial
statements.
For
information
regarding
segment
assets,
segment
profit
or
loss,
and
significant
expenses,
refer
to
the Statement
of
Assets
and
Liabilities
and
the Statement
of
Operations,
along
with
the
related
notes
to
the financial
statements.
The Schedule
of
Investments
provides
details
of
the Fund's investments
that
generate
returns
such
as
interest,
dividends,
and
realized
and
unrealized
gains
or
losses.
Performance
metrics,
including
portfolio
turnover
and
expense
ratios,
are
disclosed
in
the Financial
Highlights.
12.
Subsequent
Events
The
Fund
has
evaluated
subsequent
events
through
the
issuance
of
the
financial
statements
and
determined
that
no
events
have
occurred
that
require
disclosure.
Level
1
Level
2
Level
3
Total
Putnam
Floating
Rate
Income
Fund
Assets:
Investments
in
Securities:
a
Common
Stocks
.........................
$
249,858
$
—
$
—
$
249,858
Corporate
Bonds
........................
—
23,237,756
—
23,237,756
Senior
Floating
Rate
Interests
...............
—
257,700,581
—
257,700,581
Short
Term
Investments
...................
12,863,117
—
—
12,863,117
Total
Investments
in
Securities
...........
$13,112,975
$280,938,337
$—
$294,051,312
Liabilities:
Other
Financial
Instruments:
Swap
Contracts
.........................
$—
$46,947
$—
$46,947
Total
Other
Financial
Instruments
.........
$—
$46,947
$—
$46,947
a
For
detailed
categories,
see
the
accompanying
Schedule
of
Investments.
Putnam
Funds
Trust
Notes
to
Financial
Statements
Putnam
Floating
Rate
Income
Fund
(continued)
Abbreviations
Currency
USD
United
States
Dollar
Index
CDX.NA.HY.
Series
number
CDX
North
America
High
Yield
Index
Selected
Portfolio
CME
Chicago
Mercantile
Exchange
PIK
Payment-In-Kind
REIT
Real
Estate
Investment
Trust
SOFR
Secured
Overnight
Financing
Rate
Report
of
Independent
Registered
Public
Accounting
Firm
To
the
Board
of
Trustees
of
Putnam
Funds
Trust
and
Shareholders
of
Putnam
Floating
Rate
Income
Fund:
Opinion
on
the
Financial
Statements
We
have
audited
the
accompanying
statement
of
assets
and
liabilities,
including
the
schedule
of
investments,
of
Putnam
Floating
Rate
Income
Fund
(one
of
the
funds
constituting
Putnam
Funds
Trust,
referred
to
hereafter
as
the
“Fund”)
as
of
February
28,
2026,
the
related
statement
of
operations
for
the
year
ended
February
28,
2026,
the
statements
of
changes
in
net
assets
for
each
of
the
two
years
in
the
period
ended
February
28,
2026,
including
the
related
notes,
and
the
financial
highlights
for
each
of
the
five
years
in
the
period
ended
February
28,
2026
(collectively
referred
to
as
the
“financial
statements”).
In
our
opinion,
the
financial
statements
present
fairly,
in
all
material
respects,
the
financial
position
of
the
Fund
as
of
February
28,
2026,
the
results
of
its
operations
for
the
year
then
ended,
the
changes
in
its
net
assets
for
each
of
the
two
years
in
the
period
ended
February
28,
2026
and
the
financial
highlights
for
each
of
the
five
years
in
the
period
ended
February
28,
2026
in
conformity
with
accounting
principles
generally
accepted
in
the
United
States
of
America.
Basis
for
Opinion
These
financial
statements
are
the
responsibility
of
the
Fund’s
management.
Our
responsibility
is
to
express
an
opinion
on
the
Fund’s
financial
statements
based
on
our
audits.
We
are
a
public
accounting
firm
registered
with
the
Public
Company
Accounting
Oversight
Board
(United
States)
(PCAOB)
and
are
required
to
be
independent
with
respect
to
the
Fund
in
accordance
with
the
U.S.
federal
securities
laws
and
the
applicable
rules
and
regulations
of
the
Securities
and
Exchange
Commission
and
the
PCAOB.
We
conducted
our
audits
of
these
financial
statements
in
accordance
with
the
standards
of
the
PCAOB.
Those
standards
require
that
we
plan
and
perform
the
audit
to
obtain
reasonable
assurance
about
whether
the
financial
statements
are
free
of
material
misstatement,
whether
due
to
error
or
fraud.
Our
audits
included
performing
procedures
to
assess
the
risks
of
material
misstatement
of
the
financial
statements,
whether
due
to
error
or
fraud,
and
performing
procedures
that
respond
to
those
risks.
Such
procedures
included
examining,
on
a
test
basis,
evidence
regarding
the
amounts
and
disclosures
in
the
financial
statements.
Our
audits
also
included
evaluating
the
accounting
principles
used
and
significant
estimates
made
by
management,
as
well
as
evaluating
the
overall
presentation
of
the
financial
statements.
Our
procedures
included
confirmation
of
securities
owned
as
of
February
28,
2026
by
correspondence
with
the
custodian,
transfer
agent,
agent
banks
and
brokers;
when
replies
were
not
received
from
brokers
or
agent
banks,
we
performed
other
auditing
procedures.
We
believe
that
our
audits
provide
a
reasonable
basis
for
our
opinion.
/s/
PricewaterhouseCoopers
LLP
Boston,
Massachusetts
April
17,
2026
We
have
served
as
the
auditor
of
one
or
more
investment
companies
in
the
Putnam
Funds
family
of
funds
since
at
least
1957.
We
have
not
been
able
to
determine
the
specific
year
we
began
serving
as
auditor.
Tax
Information
(unaudited)
Putnam
Floating
Rate
Income
Fund
By
mid-February,
tax
information
related
to
a
shareholder's
proportionate
share
of
distributions
paid
during
the
preceding
calendar
year
will
be
received,
if
applicable.
Please
also
refer
to
www.franklintempleton.com
for
per
share
tax
information
related
to
any
distributions
paid
during
the
preceding
calendar
year.
Shareholders
are
advised
to
consult
with
their
tax
advisors
for
further
information
on
the
treatment
of
these
amounts
on
their
tax
returns.
The
following
tax
information
for
the
Fund
is
required
to
be
furnished
to
shareholders
with
respect
to
income
earned
and
distributions
paid
during
its
fiscal
year.
The
Fund
hereby
reports
the
following
amount,
or
if
subsequently
determined
to
be
different,
the
maximum
allowable
amount,
for
the
fiscal
year
ended
February
28,
2026:
Pursuant
to:
Amount
Reported
Section
163(j)
Interest
Earned
§163(j)
$22,730,956
Changes
In
and
Disagreements
with
Accountants
For
the
period
covered
by
this
report
Not
applicable.
Results
of
Meeting(s)
of
Shareholders
For
the
period
covered
by
this
report
Not
applicable.
Remuneration
Paid
to
Directors,
Officers
and
Others
For
the
period
covered
by
this
report
Refer
to
the
financial
statements
included
herein.
Remuneration
to
officers
is
paid
by
the
Fund’s
investment
manager
according
to
the
terms
of
the
agreement.
Board
Approval
of
Management
and
Subadvisory
Agreements
For
the
period
covered
by
this
report
Not
applicable.
©
2026
Franklin
Templeton.
All
rights
reserved.
|
ITEM 8. |
CHANGES IN AND DISAGREEMENTS WITH ACCOUNTANTS FOR OPEN-END MANAGEMENT INVESTMENT COMPANIES. |
The information is disclosed as part of the Financial Statements
included in Item 7 of this Form N-CSR.
|
ITEM 9. |
PROXY DISCLOSURES FOR OPEN-END MANAGEMENT INVESTMENT COMPANIES. |
The information is disclosed as part of the Financial Statements
included in Item 7 of this Form N-CSR.
|
ITEM 10. |
REMUNERATION PAID TO DIRECTORS, OFFICERS, AND OTHERS OF OPEN-END MANAGEMENT INVESTMENT COMPANIES. |
The information is disclosed as part of the Financial Statements
included in Item 7 of this Form N-CSR.
|
ITEM 11. |
STATEMENT REGARDING BASIS FOR APPROVAL OF INVESTMENT ADVISORY CONTRACT. |
The information is disclosed as part of the Financial Statements
included in Item 7 of this Form N-CSR, as applicable.
|
ITEM 12. |
DISCLOSURE OF PROXY VOTING POLICIES AND PROCEDURES FOR CLOSED-END MANAGEMENT INVESTMENT COMPANIES. |
Not applicable.
|
ITEM 13. |
PORTFOLIO MANAGERS OF CLOSED-END MANAGEMENT INVESTMENT COMPANIES. |
Not applicable.
|
ITEM 14. |
PURCHASES OF SECURITIES BY CLOSED-END MANAGEMENT INVESTMENT COMPANY AND AFFILIATED PURCHASERS. |
Not applicable.
|
ITEM 15. |
SUBMISSION OF MATTERS TO A VOTE OF SECURITY HOLDERS. |
There have been no changes to the procedures by which shareholders
may recommend nominees to the Registrant’s Board of Trustees that would require disclosure herein.
|
ITEM 16. |
CONTROLS AND PROCEDURES. |
|
(a) |
The Registrant’s principal executive officer and principal financial officer have concluded that the Registrant’s disclosure
controls and procedures (as defined in Rule 30a-3(c) under the Investment Company Act of 1940, as amended (the “1940 Act”))
are effective as of a date within 90 days of the filing date of this report that includes the disclosure required by this paragraph, based
on their evaluation of the disclosure controls and procedures required by Rule 30a-3(b) under the 1940 Act and 15d-15(b) under the Securities
Exchange Act of 1934. |
|
(b) |
During the period covered by this report, the Registrant transitioned to a new third-party service provider who performs certain accounting
and administrative services for the Registrant that are subject to Franklin Templeton’s oversight. |
|
ITEM 17. |
DISCLOSURE OF SECURITIES LENDING ACTIVITIES FOR CLOSED-END MANAGEMENT INVESTMENT COMPANIES. |
Not applicable.
|
ITEM 18. |
RECOVERY OF ERRONEOUSLY AWARDED COMPENSATION. |
(a)
(1) Code of Ethics attached hereto.
Exhibit 99.CODE ETH
(a)
(3) Certifications pursuant to section 302 of the Sarbanes-Oxley Act of 2002 attached hereto.
Exhibit 99.CERT
(b)
Certifications pursuant to Section 906 of the Sarbanes-Oxley Act of 2002 attached hereto.
Exhibit 99.906CERT
SIGNATURES
Pursuant to the requirements of the Securities Exchange
Act of 1934 and the Investment Company Act of 1940, the registrant has duly caused this Report to be signed on its behalf by the undersigned,
there unto duly authorized.
Putnam Funds Trust
| By: |
/s/
Jonathan S. Horwitz |
|
| |
Jonathan S. Horwitz |
|
| |
Principal Executive Officer |
|
Pursuant to the requirements of the Securities Exchange
Act of 1934 and the Investment Company Act of 1940, this report has been signed below by the following persons on behalf of the registrant
and in the capacities and on the dates indicated.
| By: |
/s/
Jonathan S. Horwitz |
|
| |
Jonathan S. Horwitz |
|
| |
Principal Executive Officer |
|
| Date: |
April 29, 2026 |
|
| |
|
|
| By: |
/s/
Jeffrey White |
|
| |
Jeffrey White |
|
| |
Principal Financial Officer |
|
| |
|
|
| Date: |
April 29, 2026 |
|