Pay Versus Performance
As required by Section 953(a) of the Dodd-Frank Wall Street Reform and Consumer Protection Act, and Item 402(v) of Regulation S-K, we are providing the following information about the relationship between compensation actually paid (“Compensation Actually Paid”) to our Principal Executive Officer(s) (the “PEO”) and the other named executive officers (the “Non-PEO NEOs”) and certain financial performance metrics of the Company using a methodology that has been prescribed by the SEC.
The following tables set forth pay versus performance information:
| Year | Summary | Compensation | Summary | Compensation | Average | Average | Value of | Net | |||||||||
| 2025 | 901,900 | 785,638 |
|
| 403,416 | 417,340 | 58.21 | (4,437,000 | ) | ||||||||
| 2024 | 564,938 | 530,459 | 795,842 | 1,967,685 | 699,059 | 832,659 | 83.08 | (8,910,538 | ) | ||||||||
| 2023 | 397,195 | 406,197 |
|
| 437,454 | 648,377 | 139.80 | (9,570,000 | ) | ||||||||
____________
(1) NEOs included in the above compensation columns reflect the following:
| Year | PEO | Non-PEO NEOs | ||
| 2025 | Patrick Mercer | Fuad Ahmad (former), Romeo Dizon and Bassem BouHabib | ||
| 2024 | David I. Bruce (former) (“PEO-1”) and | Fuad Ahmad and Bassem BouHabib | ||
| 2023 | David I. Bruce | Patrick Mercer and Fuad Ahmad |
(2) 2025 Compensation Actually Paid to our PEO and the average Compensation Actually Paid to our Non-PEO NEOs reflect the following adjustments from total compensation reported in the Summary Compensation Table (“SCT”):
| PEO | Average | |
| Total Reported in 2025 SCT | 901,900 | 403,416 |
| Less, value of equity awards reported in SCT |
|
|
| Plus, year-end value of equity awards granted in fiscal year that are unvested and outstanding at fiscal year-end | 118,090 | 83,385 |
| Plus, change in fair value of equity awards granted in a prior year that are outstanding and unvested at fiscal year-end | (275,460) | (62,845) |
| Plus, fair value of equity awards granted in fiscal year and that vested in fiscal year |
|
|
| Plus, change in fair value of equity awards granted in a prior year that vested in fiscal year | 41,108 | (6,616) |
| Less, fair value as of immediately prior year-end of equity awards granted in a prior year that failed to vest in fiscal year |
|
|
| Total adjustments | (116,262) | 13,924 |
| Compensation Actually Paid for fiscal year 2025 | 785,638 | 417,340 |
2024 Compensation Actually Paid to our PEOs and the average Compensation Actually Paid to our Non-PEO NEOs reflect the following adjustments from total compensation reported in the Summary Compensation Table:
| PEO-1 | PEO-2 | Average | |
| Total Reported in 2024 SCT | 564,938 | 795,842 | 699,059 |
| Less, value of equity awards reported in SCT |
|
|
|
| Plus, year-end value of equity awards granted in fiscal year that are unvested and outstanding at fiscal year-end |
| 534,400 | 66,800 |
| Plus, change in fair value of equity awards granted in a prior year that are outstanding and unvested at fiscal year-end |
| 596,789 | 66,800 |
| Plus, fair value of equity awards granted in fiscal year and that vested in fiscal year |
|
|
|
| Plus, change in fair value of equity awards granted in a prior year that vested in fiscal year | (34,479) | 40,654 |
|
| Less, fair value as of immediately prior year-end of equity awards granted in a prior year that failed to vest in fiscal year |
|
|
|
| Total adjustments | (34,479) | 1,171,843 | 133,600 |
| Compensation Actually Paid for fiscal year 2024 | 530,459 | 1,967,685 | 832,659 |
2023 Compensation Actually Paid to our PEO and the average Compensation Actually Paid to our Non-PEO NEOs reflect the following adjustments from total compensation reported in the Summary Compensation Table:
| PEO | Average | |
| Total Reported in 2023 SCT | 397,195 | 437,454 |
| Less, value of equity awards reported in SCT |
| 76,073 |
| Plus, year-end value of equity awards granted in fiscal year that are unvested and outstanding at fiscal year-end |
| 107,059 |
| Plus, change in fair value of equity awards granted in a prior year that are outstanding and unvested at fiscal year-end | 69,910 | 19,273 |
| Plus, fair value of equity awards granted in fiscal year and that vested in fiscal year |
|
|
| Plus, change in fair value of equity awards granted in a prior year that vested in fiscal year | (60,908) | 8,519 |
| Less, fair value as of immediately prior year-end of equity awards granted in a prior year that failed to vest in fiscal year |
|
|
| Total adjustments | 9,002 | 210,923 |
| Compensation Actually Paid for fiscal year 2023 | 406,197 | 648,377 |
(3) Fair value or change in fair value, as applicable, of equity awards in the “Compensation Actually Paid” columns was determined by reference to (a) for RSU awards, the closing price of a share of our Common Stock on applicable year-end date(s) or, in the case of vesting dates, the closing price of a share of our Common Stock on the applicable vesting date (or if there was no closing price on such day, the last trading day immediately prior to the applicable vesting date), and (b) for stock options, a Black-Scholes value as of the applicable year-end or vesting date(s), determined based on the same methodology as used to determine grant date fair value but using the closing price of a share of our Common Stock on the applicable revaluation date as the current market price and with an expected life set equal to the remaining life of the award in the case of underwater stock options and, in the case of in-the-money options, an expected life equal to the original ratio of expected life relative to the seven year contractual life multiplied by the remaining life as of the applicable revaluation date, and in all cases based on volatility and risk free rates determined as of the revaluation date based on the expected life period and based on an expected dividend rate of 0%.
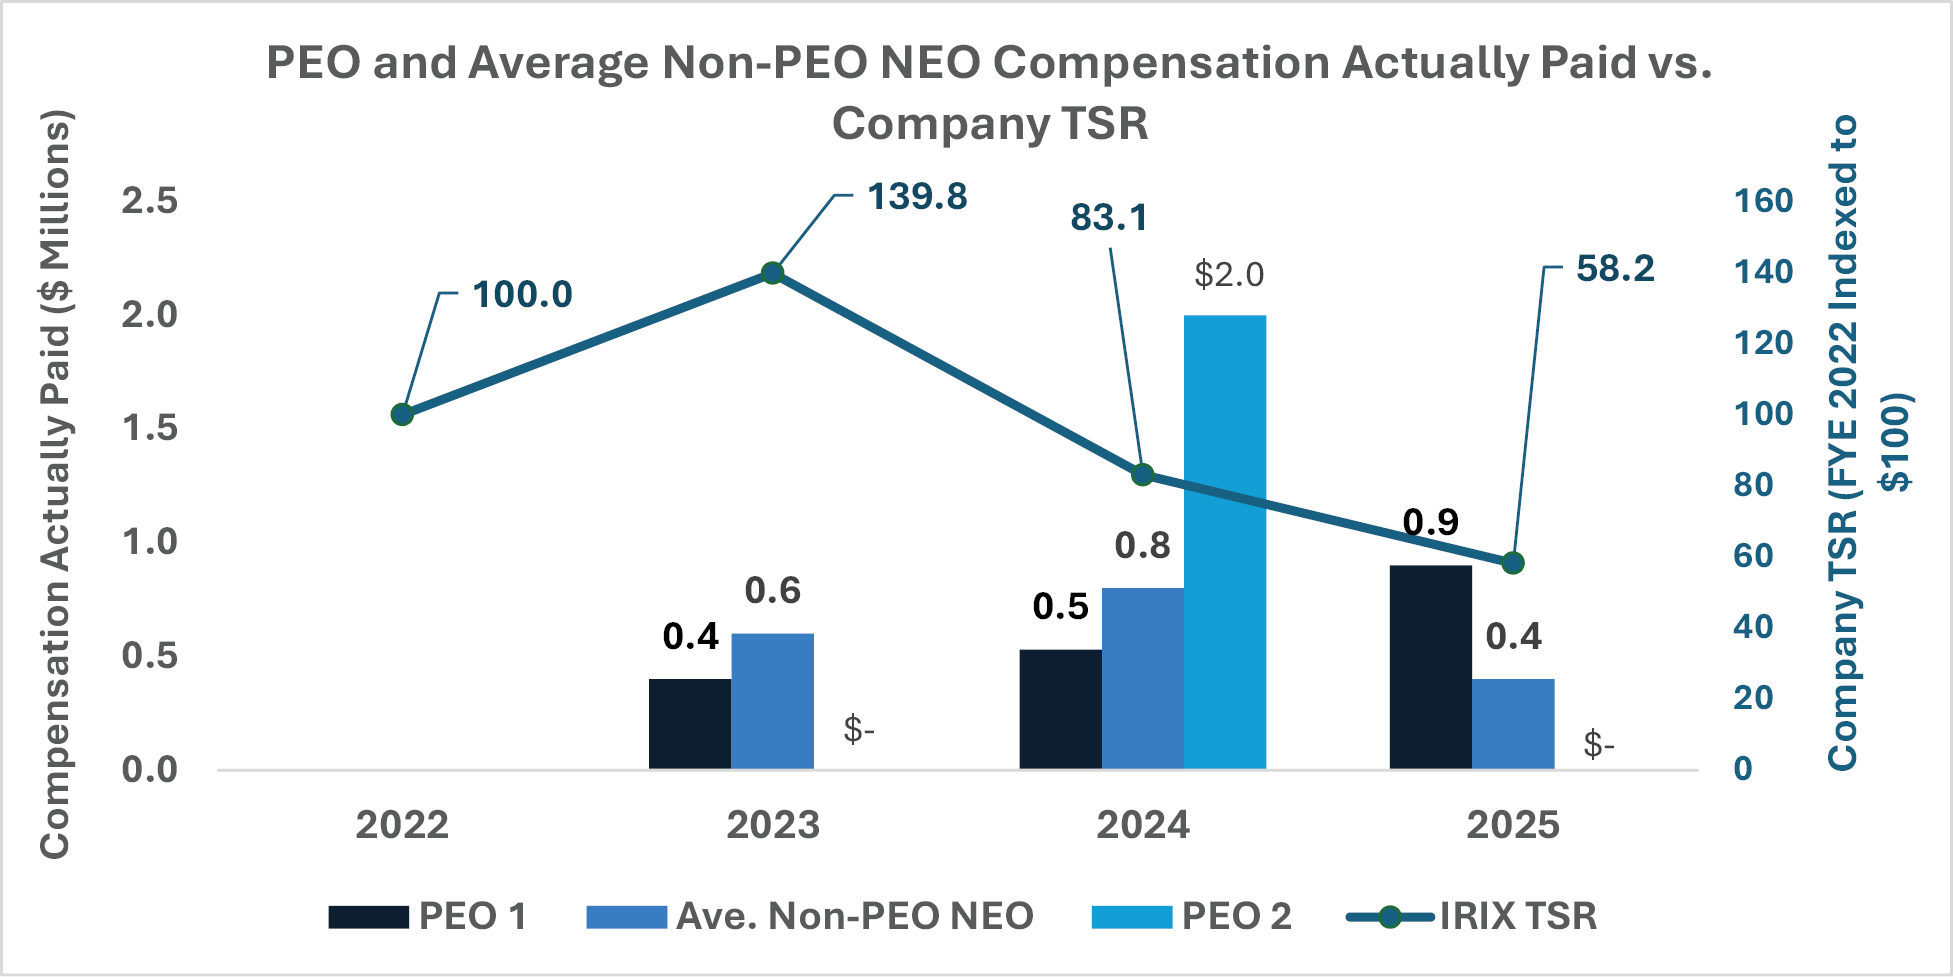
(4) Total Shareholder Return (“TSR”) illustrates the value, as of the last day of each period indicated, of $100 invested in the Common Stock of IRIDEX on December 30, 2022, the last trading day in fiscal year 2022.
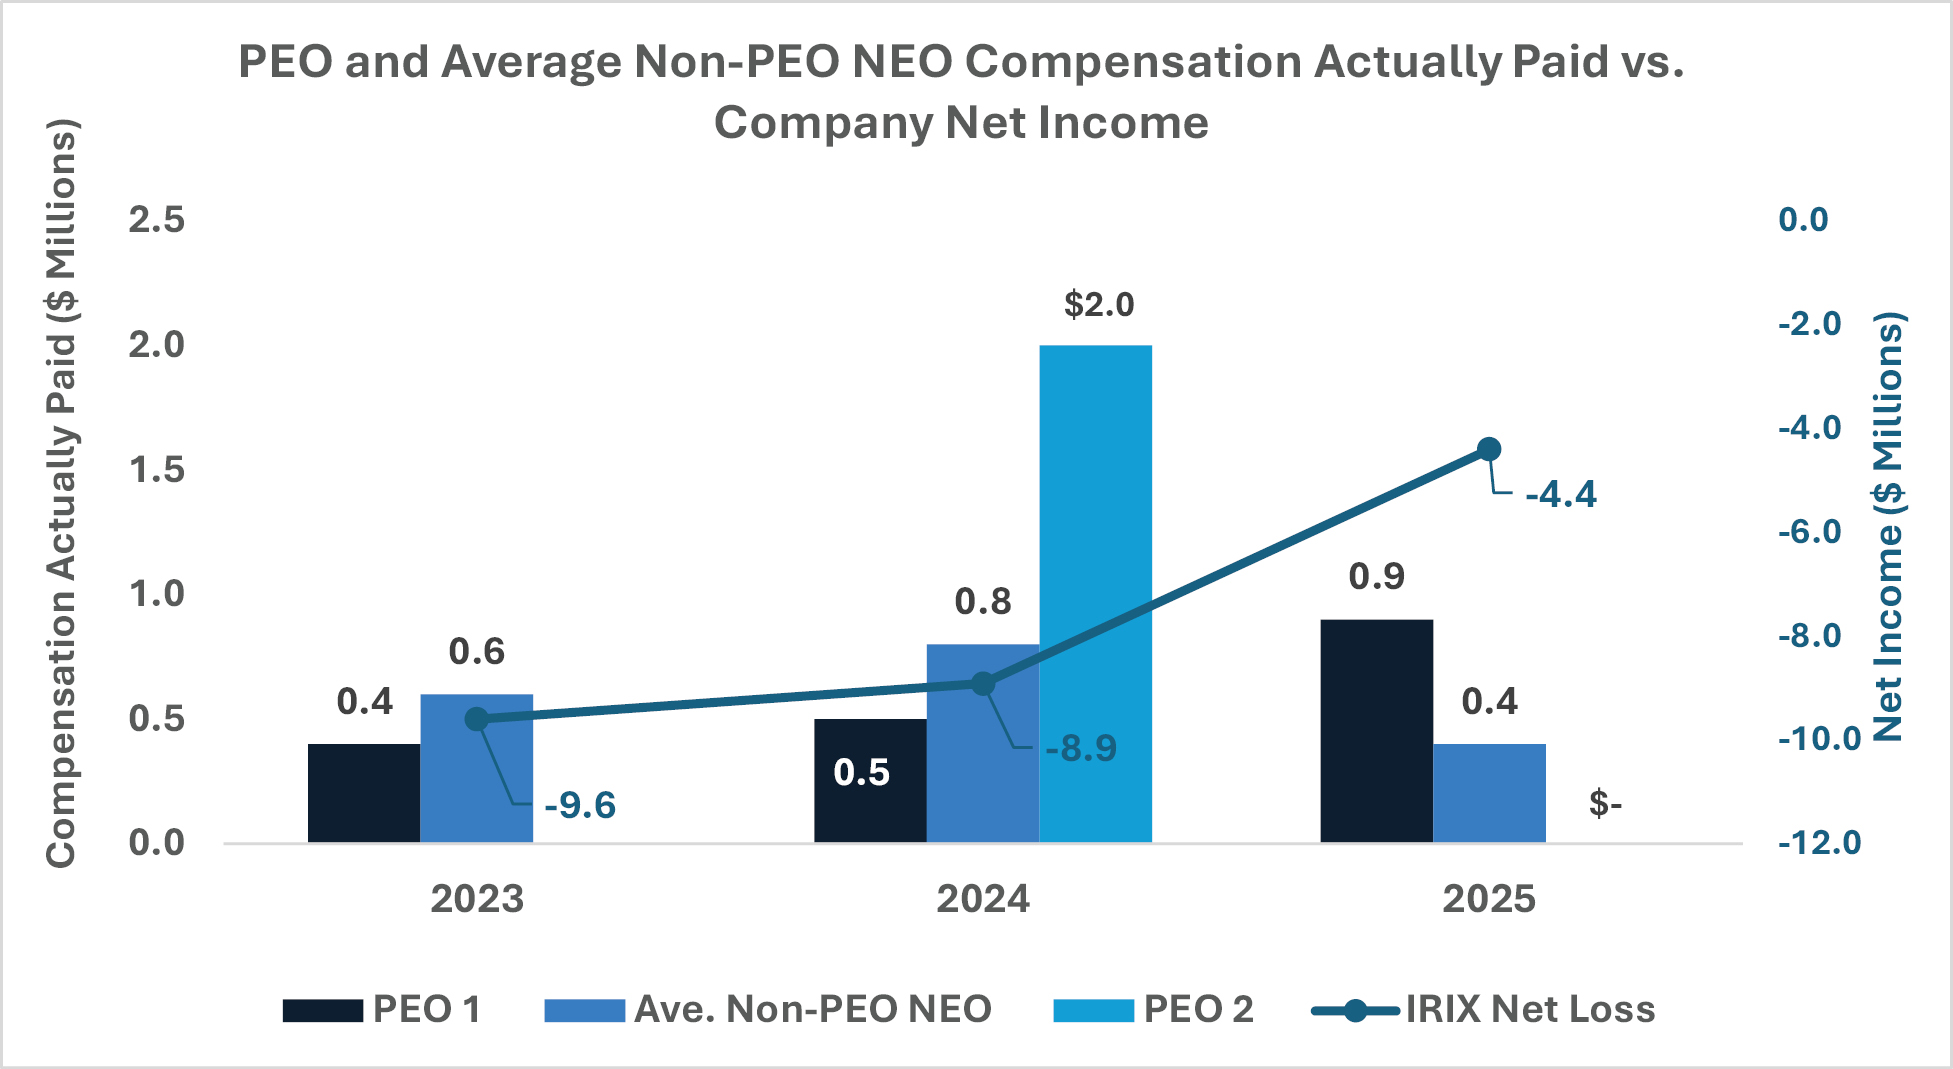
(5) The dollar amounts reported are the Company’s net income/loss reflected in the Company’s audited financial statements.
(1) NEOs included in the above compensation columns reflect the following:
| Year | PEO | Non-PEO NEOs | ||
| 2025 | Patrick Mercer | Fuad Ahmad (former), Romeo Dizon and Bassem BouHabib | ||
| 2024 | David I. Bruce (former) (“PEO-1”) and | Fuad Ahmad and Bassem BouHabib | ||
| 2023 | David I. Bruce | Patrick Mercer and Fuad Ahmad |
(2) 2025 Compensation Actually Paid to our PEO and the average Compensation Actually Paid to our Non-PEO NEOs reflect the following adjustments from total compensation reported in the Summary Compensation Table (“SCT”):
| PEO | Average | |
| Total Reported in 2025 SCT | 901,900 | 403,416 |
| Less, value of equity awards reported in SCT |
|
|
| Plus, year-end value of equity awards granted in fiscal year that are unvested and outstanding at fiscal year-end | 118,090 | 83,385 |
| Plus, change in fair value of equity awards granted in a prior year that are outstanding and unvested at fiscal year-end | (275,460) | (62,845) |
| Plus, fair value of equity awards granted in fiscal year and that vested in fiscal year |
|
|
| Plus, change in fair value of equity awards granted in a prior year that vested in fiscal year | 41,108 | (6,616) |
| Less, fair value as of immediately prior year-end of equity awards granted in a prior year that failed to vest in fiscal year |
|
|
| Total adjustments | (116,262) | 13,924 |
| Compensation Actually Paid for fiscal year 2025 | 785,638 | 417,340 |
Relationship Between Compensation Actually Paid and TSR
The following graph shows the relationship between (i) the Compensation Actually Paid to each of our PEOs, which were David Bruce (“PEO-1” in fiscal years 2023 and 2024) and Patrick Mercer (“PEO-2” in fiscal year 2024 and “PEO-1” in fiscal year 2025), (ii) the average Compensation Actually Paid to our Non-PEO NEOs, and (iii) the Company’s TSR over the three most recently completed fiscal years.
Relationship Between Compensation Actually Paid and Net Income/Loss
The following graph shows the relationship between (i) the Compensation Actually Paid to each of our PEOs, as applicable, (ii) the average Compensation Actually Paid to our Non-PEO NEOs, and (iii) the Company’s Net Loss, during the three most recently completed fiscal years.
| [1] | Fair value or change in fair value, as applicable, of equity awards in the “Compensation Actually Paid” columns was determined by reference to (a) for RSU awards, the closing price of a share of our Common Stock on applicable year-end date(s) or, in the case of vesting dates, the closing price of a share of our Common Stock on the applicable vesting date (or if there was no closing price on such day, the last trading day immediately prior to the applicable vesting date), and (b) for stock options, a Black-Scholes value as of the applicable year-end or vesting date(s), determined based on the same methodology as used to determine grant date fair value but using the closing price of a share of our Common Stock on the applicable revaluation date as the current market price and with an expected life set equal to the remaining life of the award in the case of underwater stock options and, in the case of in-the-money options, an expected life equal to the original ratio of expected life relative to the seven year contractual life multiplied by the remaining life as of the applicable revaluation date, and in all cases based on volatility and risk free rates determined as of the revaluation date based on the expected life period and based on an expected dividend rate of 0%. |
| [2] | Total Shareholder Return (“TSR”) illustrates the value, as of the last day of each period indicated, of $100 invested in the Common Stock of IRIDEX on December 30, 2022, the last trading day in fiscal year 2022. |
| [3] | The dollar amounts reported are the Company’s net income/loss reflected in the Company’s audited financial statements. |