Pay vs Performance Disclosure - USD ($)
Dec. 31, 2023
Jul. 22, 2023
Dec. 31, 2025
Dec. 31, 2024
Dec. 31, 2023
Pay Versus Performance Table
| Year | Summary Compensation Table Total for PEO ($)(1) | Compensation Actually Paid to PEO ($)(1)(3) | Average Summary Compensation Table Total for Non-PEO Named Executive Officers ($)(2) | Average Compensation Actually Paid to Non-PEO Named Executive Officers ($)(2)(3) | Value of Initial Fixed $100 Investment Based on Total Shareholder Return ($)(4) | Net Income (Loss) ($)(millions) | ||||||||||||||||||||||||||||||||
| 2025 | 1,840,192 | 1,565,812 | 938,509 | 935,873 | 24.17 | (64.0) | ||||||||||||||||||||||||||||||||
| 2024 | 2,747,808 | 2,439,038 | 1,006,236 | 859,435 | 26.42 | (39.7) | ||||||||||||||||||||||||||||||||
| 2023 | 918,922 | 975,500 | 1,634,013 | 1,491,858 | 65.78 | (38.9) | ||||||||||||||||||||||||||||||||
| Adjustments to Determine Compensation “Actually Paid” for PEO | 2025 | 2024 | 2023 | ||||||||
| Deduction for Amounts Reported under the “Stock Awards” Column in the SCT | $(1,000,000) | $(1,500,000) | $(260,000) | ||||||||
| Deduction for Amounts Reported under the “Option Awards” Columns in the SCT | (334,192) | (741,808) | — | ||||||||
| Increase for Fair Value of Awards Granted during year that Remain Unvested as of Year end | 1,109,186 | 1,068,623 | — | ||||||||
Increase for Fair Value of Awards Granted during year that Vested during year | — | 864,415 | 154,402 | ||||||||
| Increase/deduction for Change in Fair Value from Prior Year-end to current Year-end of Awards Granted Prior to year that were Outstanding and Unvested as of Year-end | — | — | — | ||||||||
| Increase/deduction for Change in Fair Value from Prior Year-end to Vesting Date of Awards Granted Prior to year that Vested during year | (49,374) | — | 162,175 | ||||||||
| Deduction of Fair Value of Awards Granted Prior to year that were Forfeited during year | — | — | — | ||||||||
| Increase based upon Incremental Fair Value of Awards Modified during year | — | — | — | ||||||||
| Increase based on Dividends or Other Earnings Paid during year prior to Vesting Date of Award | — | — | — | ||||||||
| Total Adjustments | $(274,380) | $(308,770) | $56,577 | ||||||||
| Adjustments to Determine Compensation “Actually Paid” for Non-PEO NEOs | 2025 | 2024 | 2023 | ||||||||
| Deduction for Amounts Reported under the “Stock Awards” Column in the SCT | $(99,176) | $(220,003) | $(253,334) | ||||||||
| Deduction for Amounts Reported under the “Option Awards” Columns in the SCT | — | — | — | ||||||||
| Increase for Fair Value of Awards Granted during year that Remain Unvested as of Year end | 58,516 | 176,862 | 53,874 | ||||||||
| Increase for Fair Value of Awards Granted during year that Vest during year | — | — | 50,341 | ||||||||
| Increase/deduction for Change in Fair Value from Prior Year-end to current Year-end of Awards Granted Prior to year that were Outstanding and Unvested as of Year-end | (11,251) | (60,573) | (22,762) | ||||||||
| Increase/deduction for Change in Fair Value from Prior Year-end to Vesting Date of Awards Granted Prior to year that Vested during year | 49,275 | (43,087) | 52,687 | ||||||||
| Deduction of Fair Value of Awards Granted Prior to year that were Forfeited during year | — | — | — | ||||||||
| Increase based upon Incremental Fair Value of Awards Modified during year | — | — | (22,961) | ||||||||
| Increase based on Dividends or Other Earnings Paid during year prior to Vesting Date of Award | — | — | — | ||||||||
| Total Adjustments | $(2,636) | $(146,801) | $(142,155) | ||||||||
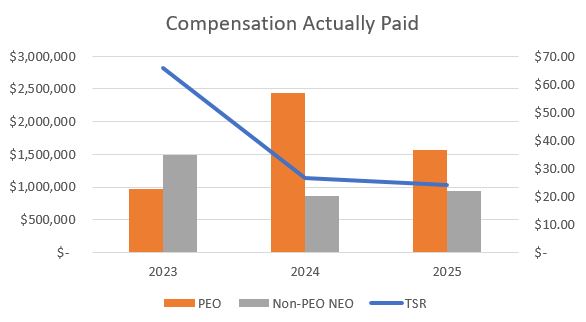
Description of Relationship Between PEO and Non-PEO NEOs Compensation Actually Paid and Company Total Shareholder Return (“TSR”)
The following chart sets forth the relationship between Compensation Actually Paid to our PEO, the average of Compensation Actually Paid to our Non-PEO NEO, and the Company’s TSR (as adjusted for the reverse stock split in 2024) over the fiscal three year period from 2023 through 2025.
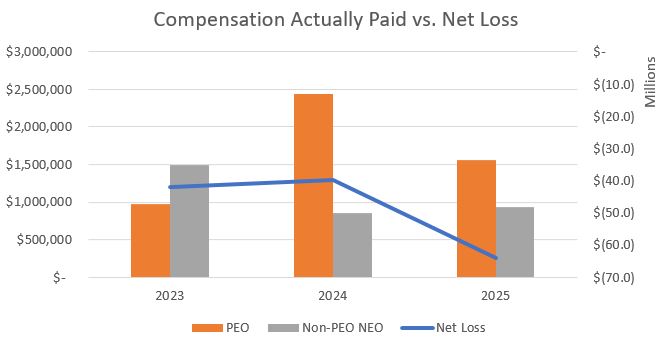
Description of Relationship Between PEO and Non-PEO NEO Compensation Actually Paid and Net Loss
The following chart sets forth the relationship between Compensation Actually Paid to our PEO, the average of Compensation Actually Paid to our Non-PEO NEO, and the Company’s Net Loss over the fiscal two year period from 2023 through 2025.
The following tables and related disclosures provide information for the years indicated about (i) the “total compensation” of our Principal Executive Officer (“PEO”), and our other named executive officers (the “Non-PEO NEOs”), (ii) the “compensation actually paid” to our PEO and Non-PEO NEOs, as calculated pursuant to the SEC’s pay-versus-performance rules, (iii) certain financial performance measures, and (iv) the relationship of the “compensation actually paid” to those financial performance measures.
This disclosure has been prepared in accordance with Item 402(v) of Regulation S-K under the Securities Exchange Act of 1934, as amended, and does not necessarily reflect value actually realized by the executives or how our compensation committee evaluates decisions in light of company or individual performance.
Total Shareholder Return illustrates the value, as of the last day of the indicated fiscal year, of an investment of $100 in our Common Stock on December 31, 2022.