Pay vs Performance Disclosure - USD ($)
Jan. 26, 2024
Dec. 31, 2024
Dec. 31, 2025
Dec. 31, 2024
Dec. 31, 2023
Dec. 31, 2022
Dec. 31, 2021
PAY VERSUS PERFORMANCE
In accordance with Item 402(v) of Regulation S-K, the Company is required to disclose pay versus performance by comparing compensation amounts previously reported for the last five calendar years to the SEC’s definition of “Compensation Actually Paid” for such years. Also as required by the SEC, this section compares Compensation Actually Paid to various measures used to gauge performance at SIGA. Compensation Actually Paid is a required disclosure item, the amount of which is calculated in accordance with SEC rules. Such measure was not incorporated into the philosophy and strategy of compensation-setting set forth in the “Compensation Discussion and Analysis” of this proxy statement.
Pay Versus Performance Table | ||||||||||||||||||||||||
Year | Summary Compensation Table Total for PEO1 | Compensation Actually Paid to PEO2 | Average Summary Compensation Table Total for Non-PEO Named Executive Officers3 | Average Compensation Actually Paid to Non-PEOs Named Executive Officers4, | Value of initial fixed $100 investment based on: | Net Income | ||||||||||||||||||
Total Shareholder Return | Peer Group Total Shareholder Return5 | Product Sales and Supportive Services Revenues6 | ||||||||||||||||||||||
2025 | $3,244,492 | $3,741,280 | $1,555,209 | $1,636,663 | $116 | $120 | $23,279,143 | $88,048,145 | ||||||||||||||||
2024 | $4,588,317 | $5,640,511 | $1,412,611 | $1,351,882 | $104 | $91 | $59,214,216 | $133,330,181 | ||||||||||||||||
2023 | $1,825,856 | $1,825,856 | $1,399,930 | $1,373,478 | $88 | $92 | $68,068,826 | $130,668,209 | ||||||||||||||||
2022 | $1,738,912 | $1,738,912 | $993,871 | $993,871 | $107 | $89 | $33,904,806 | $86,661,583 | ||||||||||||||||
2021 | $1,688,264 | $1,688,264 | $1,285,045 | $1,269,045 | $103 | $99 | $69,450,766 | $126,802,536 | ||||||||||||||||
(1) | Amount included here is the amount in the “Total” column from the Summary Compensation Table (“SCT”) for the principal executive officer (“PEO”) for the applicable year. For 2021-2023, our PEO was Dr. Phillip L. Gomez. For 2024, our PEO was Dr. Gomez until his retirement effective January 26, 2024 and Dr. Nguyen for the remainder of the fiscal year. For 2025, our PEO was Dr. Nguyen. |
(2) | In accordance with the requirements of Item 402(v) of Regulation S-K, the following adjustments were made to Compensation Actually Paid to PEO: |
Year | Reported Summary Compensation Table for PEO | Reported Value of Equity Awards | Total Equity Award Adjustments(a) | Compensation “Actually Paid” to PEO | ||||||||
2025 | $3,244,492 | $(1,853,992) | $2,350,780 | $3,741,280 | ||||||||
2024 | $4,588,317 | $(2,715,848) | $3,768,042 | $5,640,511 | ||||||||
2023 | $1,825,856 | — | — | $1,825,856 | ||||||||
2022 | $1,738,912 | — | — | $1,738,912 | ||||||||
2021 | $1,688,264 | — | — | $1,688,264 | ||||||||
a) | The amounts added or deducted in calculating the total equity award adjustments are as follows: |
Year | Year-End Fair Value of Equity Awards Granted During Applicable Year | Fair Value of Equity Awards Granted and Vested in the Applicable Year | Change in Fair Value as of Year-End of Any Prior Year Awards that Remain Unvested as of Year-End | Change in Fair Value as of the Vesting Date of Any Prior Year Awards that Vested During Applicable Year | Total Equity Value Reflected in Compensation Actually Paid | ||||||||||
2025 | $2,282,621 | — | $49,711 | $18,448 | $2,350,780 | ||||||||||
2024 | $3,362,329 | $405,713 | — | — | $3,768,042 | ||||||||||
2023 | — | — | — | — | — | ||||||||||
2022 | — | — | — | — | — | ||||||||||
2021 | — | — | — | — | — | ||||||||||
(3) | Amount included here is the average of the amounts in the “Total” column from the SCT for the applicable year for each of the other non-PEO NEOs. For 2025, our non-PEO NEOs were Mr. Luckshire, Dr. Hruby and Mr. Miller. For 2024, our non-PEO NEOs were Mr. Luckshire, Dr. Hruby, Mr. Miller and Dr. Jay K. Varma (former Chief Medical Officer). For 2023, our non-PEO NEOs were: Mr. Luckshire, Dr. Hruby and Dr. Varma. For 2022 and 2021, our non-PEO NEOs were Mr. Luckshire, Dr. Hruby and Ms. Robin E. Abrams (former General Counsel and Chief Administrative Officer). The 2022 amount was impacted by the resignation of Ms. Abrams, effective April 18, 2022. The 2023 amount includes compensation paid to Dr. Varma, pro-rated based on his commencement date with the Company. |
(4) | In accordance with the requirements of Item 402(v) of Regulation S-K, the following adjustments were made to Average Total Compensation for the NEOs as a group for each year to determine the compensations “actually paid”. |
Year | Reported Summary Compensation Table for Non-PEO NEOs | Average Reported Value of Equity Awards | Total Average Equity Award Adjustments(a) | Average Compensation “Actually Paid” to Non-PEO NEOs | ||||||||
2025 | $1,555,209 | $(332,130) | $413,584 | $1,636,663 | ||||||||
2024 | $1,412,611 | $(304,473) | $243,744 | $1,351,882 | ||||||||
2023 | $1,399,930 | $(283,333) | $256,881 | $1,373,478 | ||||||||
2022 | $993,871 | — | — | $993,871 | ||||||||
2021 | $1,285,045 | — | $(16,000) | $1,269,045 | ||||||||
a) | The amounts added or deducted in calculating the total average equity award adjustments are as follows: |
Year | Year-End Fair Value of Equity Awards Granted During Applicable Year | Change in Fair Value as of Year- End of Any Prior Year Awards that Remain Unvested as of Year-End | Change in Fair Value as of the Vesting Date of Any Prior Year Awards that Vested During Applicable Year | Total Equity Value Reflected in Compensation Actually Paid | ||||||||
2025 | $395,553 | $(4,736) | $22,767 | $413,584 | ||||||||
2024 | $199,336 | $7,715 | $36,693 | $243,744 | ||||||||
2023 | $256,881 | — | — | $256,881 | ||||||||
2022 | — | — | — | — | ||||||||
2021 | — | — | $(16,000) | $(16,000) | ||||||||
(5) | The peer group, for purposes of this analysis, is the Nasdaq Biotechnology Index. The company’s stock performance relative to the Nasdaq Biotechnology Index is disclosed in the Company’s Form 10-K. |
(6) | Product Sales and Supportive Services Revenues is a financial measure that is consistent with U.S. GAAP that is considered by the Company as part of its executive compensation program. The Compensation Committee reviews a variety of performance goals and metrics for the purpose of awarding compensation to executive officers that are consistent with the Company’s overall compensation philosophy and the long-term interests of its stockholders. Among these, the Compensation Committee has identified Product Sales and Supportive Services Revenues as the most important financial performance measure (that is not otherwise required to be disclosed in the table above) used by the Company to link compensation actually paid to its NEOs for the year ended December 31, 2025 to the Company’s performance. |
(1) | Amount included here is the amount in the “Total” column from the Summary Compensation Table (“SCT”) for the principal executive officer (“PEO”) for the applicable year. For 2021-2023, our PEO was Dr. Phillip L. Gomez. For 2024, our PEO was Dr. Gomez until his retirement effective January 26, 2024 and Dr. Nguyen for the remainder of the fiscal year. For 2025, our PEO was Dr. Nguyen. |
(3) | Amount included here is the average of the amounts in the “Total” column from the SCT for the applicable year for each of the other non-PEO NEOs. For 2025, our non-PEO NEOs were Mr. Luckshire, Dr. Hruby and Mr. Miller. For 2024, our non-PEO NEOs were Mr. Luckshire, Dr. Hruby, Mr. Miller and Dr. Jay K. Varma (former Chief Medical Officer). For 2023, our non-PEO NEOs were: Mr. Luckshire, Dr. Hruby and Dr. Varma. For 2022 and 2021, our non-PEO NEOs were Mr. Luckshire, Dr. Hruby and Ms. Robin E. Abrams (former General Counsel and Chief Administrative Officer). The 2022 amount was impacted by the resignation of Ms. Abrams, effective April 18, 2022. The 2023 amount includes compensation paid to Dr. Varma, pro-rated based on his commencement date with the Company. |
(5) | The peer group, for purposes of this analysis, is the Nasdaq Biotechnology Index. The company’s stock performance relative to the Nasdaq Biotechnology Index is disclosed in the Company’s Form 10-K. |
(2) | In accordance with the requirements of Item 402(v) of Regulation S-K, the following adjustments were made to Compensation Actually Paid to PEO: |
Year | Reported Summary Compensation Table for PEO | Reported Value of Equity Awards | Total Equity Award Adjustments(a) | Compensation “Actually Paid” to PEO | ||||||||
2025 | $3,244,492 | $(1,853,992) | $2,350,780 | $3,741,280 | ||||||||
2024 | $4,588,317 | $(2,715,848) | $3,768,042 | $5,640,511 | ||||||||
2023 | $1,825,856 | — | — | $1,825,856 | ||||||||
2022 | $1,738,912 | — | — | $1,738,912 | ||||||||
2021 | $1,688,264 | — | — | $1,688,264 | ||||||||
a) | The amounts added or deducted in calculating the total equity award adjustments are as follows: |
Year | Year-End Fair Value of Equity Awards Granted During Applicable Year | Fair Value of Equity Awards Granted and Vested in the Applicable Year | Change in Fair Value as of Year-End of Any Prior Year Awards that Remain Unvested as of Year-End | Change in Fair Value as of the Vesting Date of Any Prior Year Awards that Vested During Applicable Year | Total Equity Value Reflected in Compensation Actually Paid | ||||||||||
2025 | $2,282,621 | — | $49,711 | $18,448 | $2,350,780 | ||||||||||
2024 | $3,362,329 | $405,713 | — | — | $3,768,042 | ||||||||||
2023 | — | — | — | — | — | ||||||||||
2022 | — | — | — | — | — | ||||||||||
2021 | — | — | — | — | — | ||||||||||
(4) | In accordance with the requirements of Item 402(v) of Regulation S-K, the following adjustments were made to Average Total Compensation for the NEOs as a group for each year to determine the compensations “actually paid”. |
Year | Reported Summary Compensation Table for Non-PEO NEOs | Average Reported Value of Equity Awards | Total Average Equity Award Adjustments(a) | Average Compensation “Actually Paid” to Non-PEO NEOs | ||||||||
2025 | $1,555,209 | $(332,130) | $413,584 | $1,636,663 | ||||||||
2024 | $1,412,611 | $(304,473) | $243,744 | $1,351,882 | ||||||||
2023 | $1,399,930 | $(283,333) | $256,881 | $1,373,478 | ||||||||
2022 | $993,871 | — | — | $993,871 | ||||||||
2021 | $1,285,045 | — | $(16,000) | $1,269,045 | ||||||||
a) | The amounts added or deducted in calculating the total average equity award adjustments are as follows: |
Year | Year-End Fair Value of Equity Awards Granted During Applicable Year | Change in Fair Value as of Year- End of Any Prior Year Awards that Remain Unvested as of Year-End | Change in Fair Value as of the Vesting Date of Any Prior Year Awards that Vested During Applicable Year | Total Equity Value Reflected in Compensation Actually Paid | ||||||||
2025 | $395,553 | $(4,736) | $22,767 | $413,584 | ||||||||
2024 | $199,336 | $7,715 | $36,693 | $243,744 | ||||||||
2023 | $256,881 | — | — | $256,881 | ||||||||
2022 | — | — | — | — | ||||||||
2021 | — | — | $(16,000) | $(16,000) | ||||||||
The relationship between (1) compensation actually paid to the PEO and the average of compensation actually paid to NEOs other than the PEO and (2) cumulative total shareholder return on the Common Stock and cumulative total shareholder return on the stock of NASDAQ Biotech Composite Index for the last five completed fiscal years is shown in Figure 1.
Figure 1: Compensation Actually Paid versus Total Shareholder Return (“TSR”)
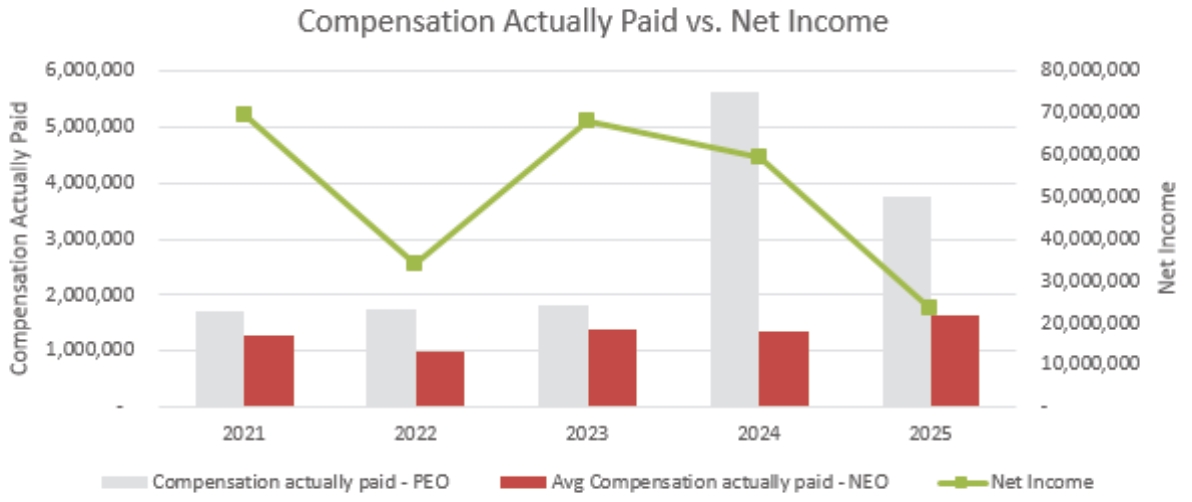
The relationship between (1) compensation actually paid to the PEO and the average of compensation actually paid to NEOs other than the PEO and (2) net income of the Company for the last five completed fiscal years is shown in Figure 2.
Figure 2: Compensation Actually Paid versus Net Income
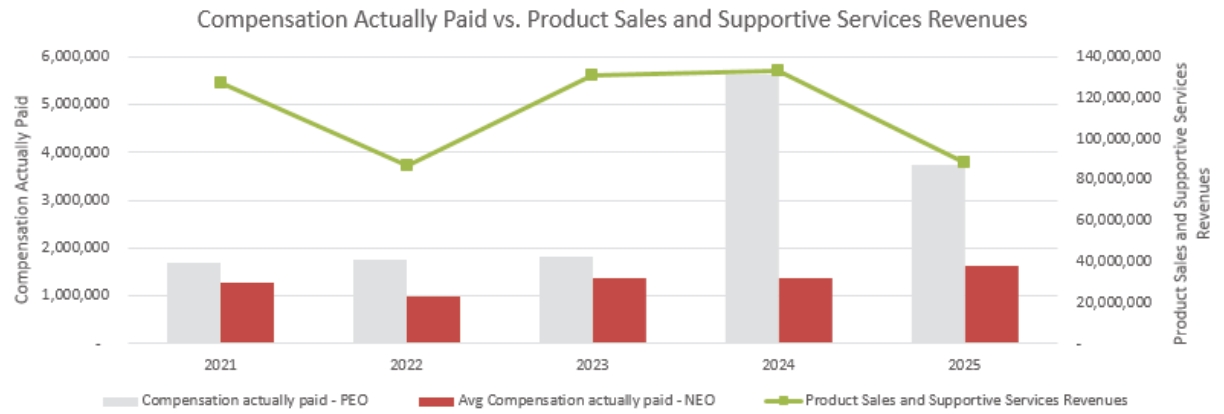
The relationship between (1) compensation actually paid to the PEO and the average of compensation actually paid to NEOs other than the PEO and (2) product sales and supportive services revenues of the Company for the last five completed fiscal years is shown in Figure 3.
Figure 3: Compensation Actually Paid versus Product Sales and Supportive Services Revenues
The relationship between (1) compensation actually paid to the PEO and the average of compensation actually paid to NEOs other than the PEO and (2) cumulative total shareholder return on the Common Stock and cumulative total shareholder return on the stock of NASDAQ Biotech Composite Index for the last five completed fiscal years is shown in Figure 1.
Figure 1: Compensation Actually Paid versus Total Shareholder Return (“TSR”)
List of Performance Measures
The Company utilizes other important financial measures to consider for compensation actually paid to its NEOs performance as set forth in the table below.
Total Product Sales and Supportive Services Revenues |
Operating Income (Pre-Tax) |
Total Revenues |
International Sales Revenue |
Net Income |
Diluted Earnings per Share |
Relative TSR |
a) | The amounts added or deducted in calculating the total equity award adjustments are as follows: |
Year | Year-End Fair Value of Equity Awards Granted During Applicable Year | Fair Value of Equity Awards Granted and Vested in the Applicable Year | Change in Fair Value as of Year-End of Any Prior Year Awards that Remain Unvested as of Year-End | Change in Fair Value as of the Vesting Date of Any Prior Year Awards that Vested During Applicable Year | Total Equity Value Reflected in Compensation Actually Paid | ||||||||||
2025 | $2,282,621 | — | $49,711 | $18,448 | $2,350,780 | ||||||||||
2024 | $3,362,329 | $405,713 | — | — | $3,768,042 | ||||||||||
2023 | — | — | — | — | — | ||||||||||
2022 | — | — | — | — | — | ||||||||||
2021 | — | — | — | — | — | ||||||||||
a) | The amounts added or deducted in calculating the total average equity award adjustments are as follows: |
Year | Year-End Fair Value of Equity Awards Granted During Applicable Year | Change in Fair Value as of Year- End of Any Prior Year Awards that Remain Unvested as of Year-End | Change in Fair Value as of the Vesting Date of Any Prior Year Awards that Vested During Applicable Year | Total Equity Value Reflected in Compensation Actually Paid | ||||||||
2025 | $395,553 | $(4,736) | $22,767 | $413,584 | ||||||||
2024 | $199,336 | $7,715 | $36,693 | $243,744 | ||||||||
2023 | $256,881 | — | — | $256,881 | ||||||||
2022 | — | — | — | — | ||||||||
2021 | — | — | $(16,000) | $(16,000) | ||||||||