
| REIT | Real estate investment trust | ||||
| U.S. | United States | ||||
| ABR | Contractual minimum annualized base rent | ||||
| ASC | Accounting Standards Codification | ||||
| NAREIT | National Association of Real Estate Investment Trusts (an industry trade group) | ||||
| CPI | Consumer price index | ||||
| EUR | Euro | ||||
| EURIBOR | Euro Interbank Offered Rate | ||||
| TIBOR | Tokyo Interbank Offered Rate | ||||
| CORRA | Canadian Overnight Repo Rate Average | ||||
| SONIA | Sterling Overnight Index Average | ||||
| Table of Contents | |||||
| Overview | |||||
| Financial Results | |||||
| Balance Sheets and Capitalization | |||||
| Real Estate | |||||
| Investment Activity | |||||
| Appendix | |||||
| Summary Metrics | |||||
| Financial Results | |||||||||||||||||||||||
| Revenues, including reimbursable costs – consolidated ($000s) | $ | 454,509 | |||||||||||||||||||||
| Net income attributable to W. P. Carey ($000s) | 176,302 | ||||||||||||||||||||||
| Net income attributable to W. P. Carey per diluted share | 0.80 | ||||||||||||||||||||||
Normalized pro rata cash NOI ($000s) (a) (b) | 388,177 | ||||||||||||||||||||||
Adjusted EBITDA ($000s) (a) (b) | 379,568 | ||||||||||||||||||||||
AFFO attributable to W. P. Carey ($000s) (a) (b) | 288,657 | ||||||||||||||||||||||
AFFO attributable to W. P. Carey per diluted share (a) (b) | 1.30 | ||||||||||||||||||||||
| Dividends declared per share – current quarter | 0.930 | ||||||||||||||||||||||
| Dividends declared per share – current quarter annualized | 3.720 | ||||||||||||||||||||||
| Dividend yield – annualized, based on quarter end share price of $67.96 | 5.5 | % | |||||||||||||||||||||
Dividend payout ratio – for the three months ended March 31, 2026 (c) | 71.5 | % | |||||||||||||||||||||
| Balance Sheet and Capitalization | |||||||||||||||||||||||
| Equity market capitalization – based on quarter end share price of $67.96 ($000s) | $ | 15,137,299 | |||||||||||||||||||||
Net debt ($000s) (d) | 8,690,382 | ||||||||||||||||||||||
| Enterprise value ($000s) | 23,827,681 | ||||||||||||||||||||||
| Total consolidated debt ($000s) | 8,753,749 | ||||||||||||||||||||||
Gross assets ($000s) (e) | 20,290,644 | ||||||||||||||||||||||
Liquidity ($000s) (f) | 2,839,374 | ||||||||||||||||||||||
Net debt to enterprise value (b) | 36.5 | % | |||||||||||||||||||||
Net debt to adjusted EBITDA (annualized) (a) (b) | 5.7x | ||||||||||||||||||||||
Net debt to adjusted EBITDA (annualized) – inclusive of unsettled forward equity (a) (b) (g) | 5.3x | ||||||||||||||||||||||
| Total consolidated debt to gross assets | 43.1 | % | |||||||||||||||||||||
| Total consolidated secured debt to gross assets | 0.5 | % | |||||||||||||||||||||
Weighted-average interest rate – for the three months ended March 31, 2026 (b) | 3.1 | % | |||||||||||||||||||||
Weighted-average interest rate – as of March 31, 2026 (b) | 3.2 | % | |||||||||||||||||||||
Weighted-average debt maturity (years) (b) | 4.8 | ||||||||||||||||||||||
| Moody's Investors Service – issuer rating | Baa1 (stable) | ||||||||||||||||||||||
| Standard & Poor's Ratings Services – issuer rating | BBB+ (stable) | ||||||||||||||||||||||
| Real Estate Portfolio (Pro Rata) | |||||||||||||||||||||||
ABR – total portfolio ($000s) (h) | $ | 1,583,792 | |||||||||||||||||||||
| Number of net-leased properties | 1,703 | ||||||||||||||||||||||
Number of operating properties (i) | 5 | ||||||||||||||||||||||
Number of tenants – net-leased properties | 374 | ||||||||||||||||||||||
| ABR from top ten tenants as a % of total ABR – net-leased properties | 18.3 | % | |||||||||||||||||||||
ABR from investment grade tenants as a % of total ABR – net-leased properties (j) | 21.6 | % | |||||||||||||||||||||
Contractual same-store growth (k) | 2.4 | % | |||||||||||||||||||||
| Net-leased properties – square footage (millions) | 185.3 | ||||||||||||||||||||||
| Occupancy – net-leased properties | 98.1 | % | |||||||||||||||||||||
| Weighted-average lease term (years) | 12.1 | ||||||||||||||||||||||
| Investment volume – current quarter ($000s) | $ | 585,348 | |||||||||||||||||||||
| Dispositions – current quarter ($000s) | 162,566 | ||||||||||||||||||||||
| Maximum commitment for capital investments and commitments expected to be completed during 2026 ($000s) | 178,835 | ||||||||||||||||||||||
 | Investing for the Long Run® | 1 | |||||||
| Investing for the Long Run® | 2 | |||||||
| Components of Net Asset Value | |||||
Normalized Pro Rata Cash NOI (a) (b) | Three Months Ended Mar. 31, 2026 | ||||||||||||||||
| Net lease properties | $ | 385,913 | |||||||||||||||
Operating properties (c) | 2,264 | ||||||||||||||||
Total normalized pro rata cash NOI (a) (b) | $ | 388,177 | |||||||||||||||
| Balance Sheet – Selected Information (Consolidated Unless Otherwise Stated) | As of Mar. 31, 2026 | ||||||||||||||||
| Assets | |||||||||||||||||
Book value of real estate excluded from normalized pro rata cash NOI (d) | $ | 209,840 | |||||||||||||||
| Cash and cash equivalents | 239,266 | ||||||||||||||||
Las Vegas retail complex construction loan (e) | 245,884 | ||||||||||||||||
| Other secured loans receivable, net | 38,278 | ||||||||||||||||
| Other assets, net: | |||||||||||||||||
| Straight-line rent adjustments | $ | 486,925 | |||||||||||||||
Investment in shares of Lineage (a cold storage REIT) (f) | 157,195 | ||||||||||||||||
| Taxes receivable | 92,590 | ||||||||||||||||
| Deferred charges | 76,507 | ||||||||||||||||
| Non-rent tenant and other receivables | 50,050 | ||||||||||||||||
| Restricted cash, including escrow | 48,441 | ||||||||||||||||
| Office lease right-of-use assets, net | 46,788 | ||||||||||||||||
| Deferred income taxes | 31,272 | ||||||||||||||||
| Prepaid expenses | 19,723 | ||||||||||||||||
| Securities and derivatives | 11,504 | ||||||||||||||||
| Leasehold improvements, furniture and fixtures | 10,506 | ||||||||||||||||
Rent receivables (g) | 2,095 | ||||||||||||||||
| Due from affiliates | 590 | ||||||||||||||||
| Other | 19,091 | ||||||||||||||||
| Total other assets, net | $ | 1,053,277 | |||||||||||||||
| Liabilities | |||||||||||||||||
Total pro rata debt outstanding (b) (h) | $ | 8,929,648 | |||||||||||||||
| Dividends payable | 211,084 | ||||||||||||||||
| Deferred income taxes | 151,742 | ||||||||||||||||
| Accounts payable, accrued expenses and other liabilities: | |||||||||||||||||
| Accounts payable and accrued expenses | $ | 171,559 | |||||||||||||||
| Prepaid and deferred rents | 171,060 | ||||||||||||||||
| Operating lease liabilities | 135,397 | ||||||||||||||||
| Tenant security deposits | 56,317 | ||||||||||||||||
| Accrued taxes payable | 40,615 | ||||||||||||||||
| Securities and derivatives | 8,365 | ||||||||||||||||
| Other | 41,111 | ||||||||||||||||
| Total accounts payable, accrued expenses and other liabilities | $ | 624,424 | |||||||||||||||
| Investing for the Long Run® | 3 | |||||||
| Investing for the Long Run® | 4 | |||||||

| Investing for the Long Run® | 5 | |||||||
| Consolidated Statements of Income – Last Five Quarters | |||||
| Three Months Ended | |||||||||||||||||||||||||||||
| Mar. 31, 2026 | Dec. 31, 2025 | Sep. 30, 2025 | Jun. 30, 2025 | Mar. 31, 2025 | |||||||||||||||||||||||||
| Revenues | |||||||||||||||||||||||||||||
| Real Estate: | |||||||||||||||||||||||||||||
| Lease revenues | $ | 402,831 | $ | 389,154 | $ | 372,087 | $ | 364,195 | $ | 353,768 | |||||||||||||||||||
| Income from finance leases and loans receivable | 27,686 | 26,716 | 26,498 | 20,276 | 17,458 | ||||||||||||||||||||||||
| Operating property revenues | 12,050 | 18,379 | 26,771 | 34,287 | 33,094 | ||||||||||||||||||||||||
| Other lease-related income | 10,452 | 8,137 | 3,660 | 9,643 | 3,121 | ||||||||||||||||||||||||
| 453,019 | 442,386 | 429,016 | 428,401 | 407,441 | |||||||||||||||||||||||||
| Investment Management: | |||||||||||||||||||||||||||||
| Other advisory income and reimbursements | 1,000 | 1,076 | 1,069 | 1,072 | 1,067 | ||||||||||||||||||||||||
| Asset management revenue | 490 | 1,085 | 1,218 | 1,304 | 1,350 | ||||||||||||||||||||||||
| 1,490 | 2,161 | 2,287 | 2,376 | 2,417 | |||||||||||||||||||||||||
| 454,509 | 444,547 | 431,303 | 430,777 | 409,858 | |||||||||||||||||||||||||
| Operating Expenses | |||||||||||||||||||||||||||||
| Depreciation and amortization | 136,183 | 145,339 | 125,586 | 120,595 | 129,607 | ||||||||||||||||||||||||
| Impairment charges — real estate | 40,008 | 39,690 | 19,474 | 4,349 | 6,854 | ||||||||||||||||||||||||
| General and administrative | 27,348 | 25,899 | 23,656 | 24,150 | 26,967 | ||||||||||||||||||||||||
| Reimbursable tenant costs | 19,692 | 19,371 | 14,562 | 17,718 | 17,092 | ||||||||||||||||||||||||
| Property expenses, excluding reimbursable tenant costs | 14,552 | 13,859 | 14,637 | 13,623 | 11,706 | ||||||||||||||||||||||||
| Operating property expenses | 8,694 | 11,863 | 15,049 | 16,721 | 16,544 | ||||||||||||||||||||||||
| Stock-based compensation expense | 7,441 | 8,650 | 11,153 | 10,943 | 9,148 | ||||||||||||||||||||||||
| Merger and other expenses | 1,180 | 478 | 1,021 | 192 | 556 | ||||||||||||||||||||||||
| 255,098 | 265,149 | 225,138 | 208,291 | 218,474 | |||||||||||||||||||||||||
| Other Income and Expenses | |||||||||||||||||||||||||||||
| Interest expense | (78,460) | (75,431) | (75,226) | (71,795) | (68,804) | ||||||||||||||||||||||||
| Gain on sale of real estate, net | 54,141 | 52,791 | 44,401 | 52,824 | 43,777 | ||||||||||||||||||||||||
Other gains and (losses) (a) | 6,791 | (10,131) | (31,011) | (148,768) | (42,197) | ||||||||||||||||||||||||
Non-operating income (b) | 4,704 | 2,516 | 3,030 | 3,495 | 7,910 | ||||||||||||||||||||||||
| Earnings from equity method investments | 4,543 | 4,109 | 2,361 | 6,161 | 5,378 | ||||||||||||||||||||||||
| (8,281) | (26,146) | (56,445) | (158,083) | (53,936) | |||||||||||||||||||||||||
| Income before income taxes | 191,130 | 153,252 | 149,720 | 64,403 | 137,448 | ||||||||||||||||||||||||
| (Provision for) benefit from income taxes | (14,634) | 1,310 | (8,495) | (13,091) | (11,632) | ||||||||||||||||||||||||
| Net Income | 176,496 | 154,562 | 141,225 | 51,312 | 125,816 | ||||||||||||||||||||||||
Net (income) loss attributable to noncontrolling interests (c) | (194) | (6,243) | (229) | (92) | 8 | ||||||||||||||||||||||||
| Net Income Attributable to W. P. Carey | $ | 176,302 | $ | 148,319 | $ | 140,996 | $ | 51,220 | $ | 125,824 | |||||||||||||||||||
| Basic Earnings Per Share | $ | 0.80 | $ | 0.67 | $ | 0.64 | $ | 0.23 | $ | 0.57 | |||||||||||||||||||
| Diluted Earnings Per Share | $ | 0.80 | $ | 0.67 | $ | 0.64 | $ | 0.23 | $ | 0.57 | |||||||||||||||||||
| Weighted-Average Shares Outstanding | |||||||||||||||||||||||||||||
| Basic | 220,620,496 | 220,469,827 | 220,562,909 | 220,569,259 | 220,401,156 | ||||||||||||||||||||||||
| Diluted | 221,618,296 | 221,169,776 | 221,087,833 | 220,874,935 | 220,720,310 | ||||||||||||||||||||||||
| Dividends Declared Per Share | $ | 0.930 | $ | 0.920 | $ | 0.910 | $ | 0.900 | $ | 0.890 | |||||||||||||||||||
| Investing for the Long Run® | 6 | |||||||
| FFO and AFFO, Consolidated – Last Five Quarters | |||||
| Three Months Ended | |||||||||||||||||||||||||||||
| Mar. 31, 2026 | Dec. 31, 2025 | Sep. 30, 2025 | Jun. 30, 2025 | Mar. 31, 2025 | |||||||||||||||||||||||||
| Net income attributable to W. P. Carey | $ | 176,302 | $ | 148,319 | $ | 140,996 | $ | 51,220 | $ | 125,824 | |||||||||||||||||||
| Adjustments: | |||||||||||||||||||||||||||||
| Depreciation and amortization of real property | 135,480 | 144,641 | 124,906 | 119,930 | 128,937 | ||||||||||||||||||||||||
| Gain on sale of real estate, net | (54,141) | (52,791) | (44,401) | (52,824) | (43,777) | ||||||||||||||||||||||||
| Impairment charges — real estate | 40,008 | 39,690 | 19,474 | 4,349 | 6,854 | ||||||||||||||||||||||||
Proportionate share of adjustments to earnings from equity method investments (a) | 2,263 | 2,255 | 2,271 | 2,231 | 1,643 | ||||||||||||||||||||||||
Proportionate share of adjustments for noncontrolling interests (b) (c) | (25) | 5,958 | (82) | (82) | (78) | ||||||||||||||||||||||||
| Total adjustments | 123,585 | 139,753 | 102,168 | 73,604 | 93,579 | ||||||||||||||||||||||||
FFO (as defined by NAREIT) Attributable to W. P. Carey (d) | 299,887 | 288,072 | 243,164 | 124,824 | 219,403 | ||||||||||||||||||||||||
| Adjustments: | |||||||||||||||||||||||||||||
| Straight-line and other leasing and financing adjustments | (24,178) | (20,758) | (20,424) | (15,374) | (19,033) | ||||||||||||||||||||||||
| Stock-based compensation | 7,441 | 8,650 | 11,153 | 10,943 | 9,148 | ||||||||||||||||||||||||
Other (gains) and losses (e) | (6,791) | 10,131 | 31,011 | 148,768 | 42,197 | ||||||||||||||||||||||||
| Amortization of deferred financing costs | 5,139 | 4,888 | 4,874 | 4,628 | 4,782 | ||||||||||||||||||||||||
| Tax expense (benefit) — deferred and other | 2,727 | (11,708) | (1,215) | 2,820 | (782) | ||||||||||||||||||||||||
Above- and below-market rent intangible lease amortization, net | 2,498 | 941 | 4,363 | 5,061 | 1,123 | ||||||||||||||||||||||||
| Merger and other expenses | 1,180 | 478 | 1,021 | 192 | 556 | ||||||||||||||||||||||||
| Other amortization and non-cash items | 593 | 589 | 587 | 579 | 560 | ||||||||||||||||||||||||
Proportionate share of adjustments to earnings from equity method investments (a) | 213 | (43) | 2,194 | 309 | (86) | ||||||||||||||||||||||||
Proportionate share of adjustments for noncontrolling interests (b) | (52) | (116) | (99) | (80) | (48) | ||||||||||||||||||||||||
| Total adjustments | (11,230) | (6,948) | 33,465 | 157,846 | 38,417 | ||||||||||||||||||||||||
AFFO Attributable to W. P. Carey (d) | $ | 288,657 | $ | 281,124 | $ | 276,629 | $ | 282,670 | $ | 257,820 | |||||||||||||||||||
| Summary | |||||||||||||||||||||||||||||
FFO (as defined by NAREIT) attributable to W. P. Carey (d) | $ | 299,887 | $ | 288,072 | $ | 243,164 | $ | 124,824 | $ | 219,403 | |||||||||||||||||||
FFO (as defined by NAREIT) attributable to W. P. Carey per diluted share (d) | $ | 1.35 | $ | 1.30 | $ | 1.10 | $ | 0.57 | $ | 0.99 | |||||||||||||||||||
AFFO attributable to W. P. Carey (d) | $ | 288,657 | $ | 281,124 | $ | 276,629 | $ | 282,670 | $ | 257,820 | |||||||||||||||||||
AFFO attributable to W. P. Carey per diluted share (d) | $ | 1.30 | $ | 1.27 | $ | 1.25 | $ | 1.28 | $ | 1.17 | |||||||||||||||||||
| Diluted weighted-average shares outstanding | 221,618,296 | 221,169,776 | 221,087,833 | 220,874,935 | 220,720,310 | ||||||||||||||||||||||||
| Investing for the Long Run® | 7 | |||||||
| Elements of Pro Rata Statement of Income and AFFO Adjustments | |||||
Equity Method Investments (a) | Noncontrolling Interests (b) | AFFO Adjustments | ||||||||||||||||||
| Revenues | ||||||||||||||||||||
| Real Estate: | ||||||||||||||||||||
Lease revenues | $ | 6,555 | $ | (89) | $ | (20,890) | (c) | |||||||||||||
| Income from finance leases and loans receivable | 93 | (75) | (828) | |||||||||||||||||
| Operating property revenues | — | — | ||||||||||||||||||
| Other lease-related income | 1 | — | — | |||||||||||||||||
Investment Management: | ||||||||||||||||||||
| Other advisory income and reimbursements | — | — | — | |||||||||||||||||
| Asset management revenue | — | — | — | |||||||||||||||||
| Operating Expenses | ||||||||||||||||||||
| Depreciation and amortization | 2,036 | (25) | (137,593) | (d) | ||||||||||||||||
| Impairment charges — real estate | — | — | (40,008) | (e) | ||||||||||||||||
| General and administrative | 2 | — | — | |||||||||||||||||
| Reimbursable tenant costs | 575 | (29) | — | |||||||||||||||||
Property expenses, excluding reimbursable tenant costs | 645 | (8) | (485) | (e) | ||||||||||||||||
| Operating property expenses | — | — | (31) | (e) | ||||||||||||||||
Stock-based compensation expense | — | — | (7,441) | (e) | ||||||||||||||||
| Merger and other expenses | — | — | (1,180) | |||||||||||||||||
| Other Income and Expenses | ||||||||||||||||||||
| Interest expense | (783) | — | 5,167 | (f) | ||||||||||||||||
| Gain on sale of real estate, net | — | — | (54,141) | |||||||||||||||||
| Other gains and (losses) | — | 58 | (6,849) | (g) | ||||||||||||||||
| Non-operating income | 98 | — | — | |||||||||||||||||
| Earnings from equity method investments | (2,608) | — | 327 | (h) | ||||||||||||||||
| Provision for income taxes | (98) | (5) | 2,831 | (i) | ||||||||||||||||
| Net income attributable to noncontrolling interests | — | 49 | — | |||||||||||||||||
| Investing for the Long Run® | 8 | |||||||
| Capital Expenditures | |||||
Turnover Costs (a) | |||||
| Tenant improvements | $ | 3,689 | |||
| Leasing costs | 2,216 | ||||
| Total Tenant Improvements and Leasing Costs | 5,905 | ||||
| Property improvements — net-lease properties | 1,130 | ||||
| Property improvements — operating properties | — | ||||
| Total Turnover Costs | $ | 7,035 | |||
| Maintenance Capital Expenditures | |||||
| Net-lease properties | $ | 2,607 | |||
| Operating properties | 269 | ||||
| Total Maintenance Capital Expenditures | $ | 2,876 | |||
| Investing for the Long Run® | 9 | |||||||
| Investing for the Long Run® | 10 | |||||||
| Consolidated Balance Sheets | |||||
| March 31, 2026 | December 31, 2025 | ||||||||||
| Assets | |||||||||||
| Investments in real estate: | |||||||||||
| Land, buildings and improvements — net lease and other | $ | 14,624,466 | $ | 14,451,306 | |||||||
| Land, buildings and improvements — operating properties | 228,074 | 286,079 | |||||||||
| Net investments in finance leases and loans receivable | 1,199,048 | 1,171,886 | |||||||||
In-place lease intangible assets and other | 2,467,240 | 2,466,199 | |||||||||
Above-market rent intangible assets | 658,128 | 668,707 | |||||||||
| Investments in real estate | 19,176,956 | 19,044,177 | |||||||||
Accumulated depreciation and amortization (a) | (3,573,321) | (3,578,330) | |||||||||
| Assets held for sale, net | 10,536 | 3,327 | |||||||||
| Net investments in real estate | 15,614,171 | 15,469,174 | |||||||||
| Equity method investments | 309,337 | 310,178 | |||||||||
| Cash and cash equivalents | 239,266 | 155,329 | |||||||||
| Other assets, net | 1,053,277 | 1,068,480 | |||||||||
| Goodwill | 983,970 | 987,071 | |||||||||
| Total assets | $ | 18,200,021 | $ | 17,990,232 | |||||||
| Liabilities and Equity | |||||||||||
| Debt: | |||||||||||
| Senior unsecured notes, net | $ | 7,415,872 | $ | 6,950,261 | |||||||
| Unsecured term loans, net | 1,174,835 | 1,196,366 | |||||||||
| Unsecured revolving credit facility | 61,968 | 435,417 | |||||||||
| Non-recourse mortgages, net | 101,074 | 140,646 | |||||||||
| Debt, net | 8,753,749 | 8,722,690 | |||||||||
| Accounts payable, accrued expenses and other liabilities | 624,424 | 670,038 | |||||||||
Below-market rent and other intangible liabilities, net | 98,329 | 104,055 | |||||||||
| Deferred income taxes | 151,742 | 151,820 | |||||||||
| Dividends payable | 211,084 | 207,487 | |||||||||
| Total liabilities | 9,839,328 | 9,856,090 | |||||||||
Preferred stock, $0.001 par value, 50,000,000 shares authorized; none issued | — | — | |||||||||
Common stock, $0.001 par value, 450,000,000 shares authorized; 222,738,368 and 219,145,876 shares, respectively, issued and outstanding | 223 | 219 | |||||||||
| Additional paid-in capital | 12,059,559 | 11,830,737 | |||||||||
| Distributions in excess of accumulated earnings | (3,574,363) | (3,539,592) | |||||||||
| Deferred compensation obligation | 100,549 | 80,239 | |||||||||
| Accumulated other comprehensive loss | (241,286) | (253,346) | |||||||||
| Total stockholders' equity | 8,344,682 | 8,118,257 | |||||||||
| Noncontrolling interests | 16,011 | 15,885 | |||||||||
| Total equity | 8,360,693 | 8,134,142 | |||||||||
| Total liabilities and equity | $ | 18,200,021 | $ | 17,990,232 | |||||||
| Investing for the Long Run® | 11 | |||||||
| Capitalization | |||||
| Description | Shares | Share Price | Market Value | |||||||||||||||||||||||
| Equity | ||||||||||||||||||||||||||
| Common equity | 222,738,368 | $ | 67.96 | $ | 15,137,299 | |||||||||||||||||||||
| Preferred equity | — | |||||||||||||||||||||||||
| Total Equity Market Capitalization | 15,137,299 | |||||||||||||||||||||||||
Outstanding Balance (a) | ||||||||||||||||||||||||||
| Pro Rata Debt | ||||||||||||||||||||||||||
| Non-recourse mortgages | 193,075 | |||||||||||||||||||||||||
| Unsecured term loans (due February 14, 2028) | 606,780 | |||||||||||||||||||||||||
| Unsecured term loan (due April 24, 2029) | 574,900 | |||||||||||||||||||||||||
| Unsecured revolving credit facility (due February 14, 2029) | 61,968 | |||||||||||||||||||||||||
| Senior unsecured notes: | ||||||||||||||||||||||||||
| Due October 1, 2026 (USD) | 350,000 | |||||||||||||||||||||||||
| Due April 15, 2027 (EUR) | 574,900 | |||||||||||||||||||||||||
| Due April 15, 2028 (EUR) | 574,900 | |||||||||||||||||||||||||
| Due July 15, 2029 (USD) | 325,000 | |||||||||||||||||||||||||
| Due September 28, 2029 (EUR) | 172,470 | |||||||||||||||||||||||||
| Due June 1, 2030 (EUR) | 603,645 | |||||||||||||||||||||||||
| Due July 15, 2030 (USD) | 400,000 | |||||||||||||||||||||||||
| Due February 1, 2031 (USD) | 500,000 | |||||||||||||||||||||||||
| Due October 2, 2031 (EUR) | 574,900 | |||||||||||||||||||||||||
| Due February 1, 2032 (USD) | 350,000 | |||||||||||||||||||||||||
| Due July 23, 2032 (EUR) | 747,370 | |||||||||||||||||||||||||
| Due September 28, 2032 (EUR) | 229,960 | |||||||||||||||||||||||||
| Due April 1, 2033 (USD) | 425,000 | |||||||||||||||||||||||||
| Due June 30, 2034 (USD) | 400,000 | |||||||||||||||||||||||||
| Due November 19, 2034 (EUR) | 689,880 | |||||||||||||||||||||||||
| Due May 10, 2035 (EUR) | 574,900 | |||||||||||||||||||||||||
| Total Pro Rata Debt | 8,929,648 | |||||||||||||||||||||||||
| Total Capitalization | $ | 24,066,947 | ||||||||||||||||||||||||
| Investing for the Long Run® | 12 | |||||||
| Debt Overview | |||||
| USD-Denominated | EUR-Denominated | Other Currencies (a) | Total | |||||||||||||||||||||||||||||||||||||||||||||||||||||||||||||||||
| Outstanding Balance | ||||||||||||||||||||||||||||||||||||||||||||||||||||||||||||||||||||
| Out-standing Balance (in USD) | Weigh-ted Avg. Interest Rate | Out-standing Balance (in USD) | Weigh-ted Avg. Interest Rate | Out-standing Balance (in USD) | Weigh-ted Avg. Interest Rate | Amount (in USD) | % of Total | Weigh-ted Avg. Interest Rate | Weigh-ted Avg. Maturity (Years) | |||||||||||||||||||||||||||||||||||||||||||||||||||||||||||
Non-Recourse Debt (b) (c) | ||||||||||||||||||||||||||||||||||||||||||||||||||||||||||||||||||||
Fixed (d) | $ | 70,221 | 4.5 | % | $ | 68,507 | 5.2 | % | $ | 20,285 | 4.6 | % | $ | 159,013 | 1.8 | % | 4.8 | % | 1.8 | |||||||||||||||||||||||||||||||||||||||||||||||||
| Floating | — | — | % | 34,062 | 3.8 | % | — | — | % | 34,062 | 0.4 | % | 3.8 | % | 0.1 | |||||||||||||||||||||||||||||||||||||||||||||||||||||
Total Pro Rata Non-Recourse Debt | 70,221 | 4.5 | % | 102,569 | 4.7 | % | 20,285 | 4.6 | % | 193,075 | 2.2 | % | 4.6 | % | 1.5 | |||||||||||||||||||||||||||||||||||||||||||||||||||||
Recourse Debt (b) (c) | ||||||||||||||||||||||||||||||||||||||||||||||||||||||||||||||||||||
| Fixed – Senior unsecured notes: | ||||||||||||||||||||||||||||||||||||||||||||||||||||||||||||||||||||
| Due October 1, 2026 | 350,000 | 4.3 | % | — | — | % | — | — | % | 350,000 | 3.9 | % | 4.3 | % | 0.5 | |||||||||||||||||||||||||||||||||||||||||||||||||||||
| Due April 15, 2027 | — | — | % | 574,900 | 2.1 | % | — | — | % | 574,900 | 6.4 | % | 2.1 | % | 1.0 | |||||||||||||||||||||||||||||||||||||||||||||||||||||
| Due April 15, 2028 | — | — | % | 574,900 | 1.4 | % | — | — | % | 574,900 | 6.4 | % | 1.4 | % | 2.0 | |||||||||||||||||||||||||||||||||||||||||||||||||||||
| Due July 15, 2029 | 325,000 | 3.9 | % | — | — | % | — | — | % | 325,000 | 3.6 | % | 3.9 | % | 3.3 | |||||||||||||||||||||||||||||||||||||||||||||||||||||
| Due September 28, 2029 | — | — | % | 172,470 | 3.4 | % | — | — | % | 172,470 | 1.9 | % | 3.4 | % | 3.5 | |||||||||||||||||||||||||||||||||||||||||||||||||||||
| Due June 1, 2030 | — | — | % | 603,645 | 1.0 | % | — | — | % | 603,645 | 6.8 | % | 1.0 | % | 4.2 | |||||||||||||||||||||||||||||||||||||||||||||||||||||
| Due July 15, 2030 | 400,000 | 4.7 | % | — | — | % | — | — | % | 400,000 | 4.5 | % | 4.7 | % | 4.3 | |||||||||||||||||||||||||||||||||||||||||||||||||||||
| Due February 1, 2031 | 500,000 | 2.4 | % | — | — | % | — | — | % | 500,000 | 5.6 | % | 2.4 | % | 4.8 | |||||||||||||||||||||||||||||||||||||||||||||||||||||
| Due October 2, 2031 | — | — | % | 574,900 | 3.3 | % | — | — | % | 574,900 | 6.4 | % | 3.3 | % | 5.5 | |||||||||||||||||||||||||||||||||||||||||||||||||||||
| Due February 1, 2032 | 350,000 | 2.5 | % | — | — | % | — | — | % | 350,000 | 3.9 | % | 2.5 | % | 5.8 | |||||||||||||||||||||||||||||||||||||||||||||||||||||
| Due July 23, 2032 | — | — | % | 747,370 | 4.3 | % | — | — | % | 747,370 | 8.4 | % | 4.3 | % | 6.3 | |||||||||||||||||||||||||||||||||||||||||||||||||||||
| Due September 28, 2032 | — | — | % | 229,960 | 3.7 | % | — | — | % | 229,960 | 2.7 | % | 3.7 | % | 6.5 | |||||||||||||||||||||||||||||||||||||||||||||||||||||
| Due April 1, 2033 | 425,000 | 2.3 | % | — | — | % | — | — | % | 425,000 | 4.8 | % | 2.3 | % | 7.0 | |||||||||||||||||||||||||||||||||||||||||||||||||||||
| Due June 30, 2034 | 400,000 | 5.4 | % | — | — | % | — | — | % | 400,000 | 4.5 | % | 5.4 | % | 8.3 | |||||||||||||||||||||||||||||||||||||||||||||||||||||
| Due November 19, 2034 | — | — | % | 689,880 | 3.7 | % | — | — | % | 689,880 | 7.7 | % | 3.7 | % | 8.6 | |||||||||||||||||||||||||||||||||||||||||||||||||||||
| Due May 10, 2035 | — | — | % | 574,900 | 3.8 | % | — | — | % | 574,900 | 6.4 | % | 3.8 | % | 9.1 | |||||||||||||||||||||||||||||||||||||||||||||||||||||
| Total Senior Unsecured Notes | 2,750,000 | 3.6 | % | 4,742,925 | 2.9 | % | — | — | % | 7,492,925 | 83.9 | % | 3.1 | % | 5.2 | |||||||||||||||||||||||||||||||||||||||||||||||||||||
| Swapped to Fixed: | ||||||||||||||||||||||||||||||||||||||||||||||||||||||||||||||||||||
Unsecured term loan (due April 24, 2029) (e) | — | — | % | 574,900 | 2.8 | % | — | — | % | 574,900 | 6.4 | % | 2.8 | % | 3.1 | |||||||||||||||||||||||||||||||||||||||||||||||||||||
Unsecured term loan (due February 14, 2028) (e) | — | — | % | — | — | % | 357,521 | 4.7 | % | 357,521 | 4.0 | % | 4.7 | % | 1.9 | |||||||||||||||||||||||||||||||||||||||||||||||||||||
| Floating: | ||||||||||||||||||||||||||||||||||||||||||||||||||||||||||||||||||||
Unsecured revolving credit facility (due February 14, 2029) (f) | — | — | % | 5,749 | 2.6 | % | 56,219 | 3.4 | % | 61,968 | 0.7 | % | 3.4 | % | 2.9 | |||||||||||||||||||||||||||||||||||||||||||||||||||||
Unsecured term loan (due February 14, 2028) (g) | — | — | % | — | — | % | 249,259 | 3.1 | % | 249,259 | 2.8 | % | 3.1 | % | 1.9 | |||||||||||||||||||||||||||||||||||||||||||||||||||||
| Total Recourse Debt | 2,750,000 | 3.6 | % | 5,323,574 | 2.9 | % | 662,999 | 4.0 | % | 8,736,573 | 97.8 | % | 3.2 | % | 4.8 | |||||||||||||||||||||||||||||||||||||||||||||||||||||
Total Pro Rata Debt Outstanding | $ | 2,820,221 | 3.6 | % | $ | 5,426,143 | 2.9 | % | $ | 683,284 | 4.0 | % | $ | 8,929,648 | 100.0 | % | 3.2 | % | 4.8 | |||||||||||||||||||||||||||||||||||||||||||||||||
| Investing for the Long Run® | 13 | |||||||
| Debt Maturity | |||||
| Real Estate | Debt | |||||||||||||||||||||||||||||||||||||
Number of Properties (a) | Weighted-Average Interest Rate | Total Outstanding Balance (b) (c) | % of Total Outstanding Balance | |||||||||||||||||||||||||||||||||||
| Year of Maturity | ABR (a) | Balloon | ||||||||||||||||||||||||||||||||||||
| Non-Recourse Debt | ||||||||||||||||||||||||||||||||||||||
| Remaining 2026 | 20 | $ | 18,879 | 4.3 | % | $ | 68,123 | $ | 68,986 | 0.8 | % | |||||||||||||||||||||||||||
| 2027 | 3 | 1,272 | 4.2 | % | 28,411 | 28,655 | 0.4 | % | ||||||||||||||||||||||||||||||
| 2028 | 5 | 13,927 | 5.0 | % | 72,975 | 78,429 | 0.9 | % | ||||||||||||||||||||||||||||||
| 2029 | 3 | 1,464 | 4.0 | % | 10,911 | 11,712 | 0.1 | % | ||||||||||||||||||||||||||||||
| 2031 | 1 | 1,158 | 6.0 | % | — | 2,009 | — | % | ||||||||||||||||||||||||||||||
| 2033 | 1 | 1,504 | 5.6 | % | 1,648 | 3,284 | — | % | ||||||||||||||||||||||||||||||
Total Pro Rata Non-Recourse Debt | 33 | $ | 38,204 | 4.6 | % | $ | 182,068 | 193,075 | 2.2 | % | ||||||||||||||||||||||||||||
| Recourse Debt | ||||||||||||||||||||||||||||||||||||||
| Fixed – Senior unsecured notes: | ||||||||||||||||||||||||||||||||||||||
| Due October 1, 2026 (USD) | 4.3 | % | 350,000 | 3.9 | % | |||||||||||||||||||||||||||||||||
| Due April 15, 2027 (EUR) | 2.1 | % | 574,900 | 6.4 | % | |||||||||||||||||||||||||||||||||
| Due April 15, 2028 (EUR) | 1.4 | % | 574,900 | 6.4 | % | |||||||||||||||||||||||||||||||||
| Due July 15, 2029 (USD) | 3.9 | % | 325,000 | 3.6 | % | |||||||||||||||||||||||||||||||||
| Due September 28, 2029 (EUR) | 3.4 | % | 172,470 | 1.9 | % | |||||||||||||||||||||||||||||||||
| Due June 1, 2030 (EUR) | 1.0 | % | 603,645 | 6.8 | % | |||||||||||||||||||||||||||||||||
| Due July 15, 2030 (USD) | 4.7 | % | 400,000 | 4.5 | % | |||||||||||||||||||||||||||||||||
| Due February 1, 2031 (USD) | 2.4 | % | 500,000 | 5.6 | % | |||||||||||||||||||||||||||||||||
| Due October 2, 2031 (EUR) | 3.3 | % | 574,900 | 6.4 | % | |||||||||||||||||||||||||||||||||
| Due February 1, 2032 (USD) | 2.5 | % | 350,000 | 3.9 | % | |||||||||||||||||||||||||||||||||
| Due July 23, 2032 (EUR) | 4.3 | % | 747,370 | 8.4 | % | |||||||||||||||||||||||||||||||||
| Due September 28, 2032 (EUR) | 3.7 | % | 229,960 | 2.7 | % | |||||||||||||||||||||||||||||||||
| Due April 1, 2033 (USD) | 2.3 | % | 425,000 | 4.8 | % | |||||||||||||||||||||||||||||||||
| Due June 30, 2034 (USD) | 5.4 | % | 400,000 | 4.5 | % | |||||||||||||||||||||||||||||||||
| Due November 19, 2034 (EUR) | 3.7 | % | 689,880 | 7.7 | % | |||||||||||||||||||||||||||||||||
| Due May 10, 2035 (EUR) | 3.8 | % | 574,900 | 6.4 | % | |||||||||||||||||||||||||||||||||
| Total Senior Unsecured Notes | 3.1 | % | 7,492,925 | 83.9 | % | |||||||||||||||||||||||||||||||||
| Swapped to Fixed: | ||||||||||||||||||||||||||||||||||||||
Unsecured term loan (due April 24, 2029) (d) | 2.8 | % | 574,900 | 6.4 | % | |||||||||||||||||||||||||||||||||
Unsecured term loan (due February 14, 2028) (d) | 4.7 | % | 357,521 | 4.0 | % | |||||||||||||||||||||||||||||||||
| Floating: | ||||||||||||||||||||||||||||||||||||||
Unsecured revolving credit facility (due February 14, 2029) (e) | 3.4 | % | 61,968 | 0.7 | % | |||||||||||||||||||||||||||||||||
Unsecured term loan (due February 14, 2028) (f) | 3.1 | % | 249,259 | 2.8 | % | |||||||||||||||||||||||||||||||||
| Total Recourse Debt | 3.2 | % | 8,736,573 | 97.8 | % | |||||||||||||||||||||||||||||||||
| Total Pro Rata Debt Outstanding | 3.2 | % | $ | 8,929,648 | 100.0 | % | ||||||||||||||||||||||||||||||||
| Investing for the Long Run® | 14 | |||||||
| Senior Unsecured Notes | |||||
| Issuer | Senior Unsecured Notes | |||||||||||||||||||
| Ratings Agency | Rating | Outlook | Rating | |||||||||||||||||
| Moody's | Baa1 | Stable | Baa1 | |||||||||||||||||
| Standard & Poor’s | BBB+ | Stable | BBB+ | |||||||||||||||||
| Covenant | Metric | Required | As of Mar. 31, 2026 | |||||||||||||||||
| Limitation on the incurrence of debt | "Total Debt" / "Total Assets" | ≤ 60% | 41.1% | |||||||||||||||||
| Limitation on the incurrence of secured debt | "Secured Debt" / "Total Assets" | ≤ 40% | 0.5% | |||||||||||||||||
Limitation on the incurrence of debt based on consolidated EBITDA to annual debt service charge | "Consolidated EBITDA" / "Annual Debt Service Charge" | ≥ 1.5x | 4.7x | |||||||||||||||||
| Maintenance of unencumbered asset value | "Unencumbered Assets" / "Total Unsecured Debt" | ≥ 150% | 236.9% | |||||||||||||||||
| Investing for the Long Run® | 15 | |||||||
| Investing for the Long Run® | 16 | |||||||
| Investment Activity – Investment Volume | |||||
| Property Type(s) | Closing Date / Asset Completion Date | Gross Investment Amount | Investment Type | Lease Term (Years) (a) | Gross Square Footage | |||||||||||||||||||||||||||||||||||||||
| Tenant | Property Location(s) | |||||||||||||||||||||||||||||||||||||||||||
| 1Q26 | ||||||||||||||||||||||||||||||||||||||||||||
Hedin Mobility Group (b) | Amsterdam, The Netherlands | Retail | Jan-26 | $ | 17,636 | Build-to-Suit | 22 | 62,810 | ||||||||||||||||||||||||||||||||||||
| Dollar General | Las Vegas, NM | Retail | Jan-26 | 2,195 | Acquisition | 15 | 10,542 | |||||||||||||||||||||||||||||||||||||
| IMS Companies | Arlington Heights, IL | Industrial | Jan-26 | 9,432 | Acquisition | 4 | 126,948 | |||||||||||||||||||||||||||||||||||||
Raben Group (8 properties) (b) | Various, Poland | Warehouse | Jan-26; Feb-26 | 201,789 | Sale-leaseback | 15 | 1,857,837 | |||||||||||||||||||||||||||||||||||||
| EOS Fitness | Surprise, AZ | Retail | Jan-26 | 11,646 | Build-to-Suit | 20 | 40,057 | |||||||||||||||||||||||||||||||||||||
| HB Chemical | Solon, OH | Warehouse | Jan-26 | 43,387 | Acquisition | 11 | 412,171 | |||||||||||||||||||||||||||||||||||||
| Janus International | Surprise, AZ | Industrial | Feb-26 | 20,732 | Build-to-Suit | 20 | 131,753 | |||||||||||||||||||||||||||||||||||||
W.C. Bradley Co. (3 properties) (c) | Peebles, OH (2 properties) and Hope, AR (1 property) | Industrial | Feb-26 | 22,345 | Sale-leaseback | 15 | 422,802 | |||||||||||||||||||||||||||||||||||||
Go Auto (14 properties) (b) | Various, Canada | Retail | Mar-26 | 211,883 | Sale-leaseback | 25 | 596,176 | |||||||||||||||||||||||||||||||||||||
Barnes Molding Solutions (b) | Bahlingen am Kaiserstuhl, Germany | Industrial | Mar-26 | 23,621 | Sale-leaseback | 20 | 217,011 | |||||||||||||||||||||||||||||||||||||
Scania (b) | Oskarshamn, Sweden | Warehouse | Mar-26 | 18,188 | Build-to-Suit | 15 | 204,645 | |||||||||||||||||||||||||||||||||||||
| Year-to-Date Total | 582,854 | 19 | 4,082,752 | |||||||||||||||||||||||||||||||||||||||||
| Property Type | Loan Origination | Loan Maturity Date | Funding | Outstanding | Maximum Commitment | |||||||||||||||||||||||||||||||||||||||||||||
| Description | Property Location | Current Quarter | Year to Date | |||||||||||||||||||||||||||||||||||||||||||||||
Construction Loan (d) | ||||||||||||||||||||||||||||||||||||||||||||||||||
SW Corner of Las Vegas & Harmon (e) (f) | Las Vegas, NV | Retail | Jun-21 | 2026 | $ | — | $ | — | $ | 245,884 | $ | 256,887 | ||||||||||||||||||||||||||||||||||||||
SE Corner of Las Vegas & Harmon (f) | Las Vegas, NV | Retail | Nov-24 | 2026 | 2,254 | 2,254 | 20,621 | 23,449 | ||||||||||||||||||||||||||||||||||||||||||
SE Corner of Las Vegas & Elvis Presley (f) | Las Vegas, NV | Retail | Nov-24 | 2026 | 240 | 240 | 17,657 | 25,000 | ||||||||||||||||||||||||||||||||||||||||||
| Total | 2,494 | 2,494 | 284,162 | 305,336 | ||||||||||||||||||||||||||||||||||||||||||||||
| Year-to-Date Total Investment Volume | $ | 585,348 | ||||||||||||||||||||||||||||||||||||||||||||||||
| Investing for the Long Run® | 17 | |||||||
Investment Activity – Capital Investments and Commitments (a) | |||||
| Primary Transaction Type | Property Type | Expected Completion / Closing Date | Additional Gross Square Footage | Lease Term (Years) (b) | Funded During Three Months Ended Mar. 31, 2026 (c) | Total Funded Through Mar. 31, 2026 | Maximum Commitment / Gross Investment Amount | |||||||||||||||||||||||||||||||||||||||||||||||||||||||
| Tenant | Location | Remaining | Total | |||||||||||||||||||||||||||||||||||||||||||||||||||||||||||
NewEra Nobis (d) | Overland Park, KS | Expansion | Specialty (Healthcare) | Q2 2026 | 7,275 | 20 | $ | 1,753 | $ | 4,167 | $ | 5,749 | $ | 10,000 | ||||||||||||||||||||||||||||||||||||||||||||||||
Nord Anglia (d) | Houston, TX | Expansion | Education | Q2 2026 | 13,150 | 20 | 857 | 869 | 7,619 | 8,500 | ||||||||||||||||||||||||||||||||||||||||||||||||||||
| Rocky Vista University | Billings, MT | Build-to-Suit | Education (Medical School) | Q3 2026 | 57,000 | 25 | 4,777 | 16,721 | 8,279 | 25,000 | ||||||||||||||||||||||||||||||||||||||||||||||||||||
TI Automotive (d) (e) | Brampton, Canada | Build-to-Suit | Industrial | Q3 2026 | 120,222 | 20 | 2,623 | 7,450 | 10,913 | 18,517 | ||||||||||||||||||||||||||||||||||||||||||||||||||||
AEG Presents (f) | Austin, TX | Build-to-Suit | Specialty (Entertainment) | Q4 2026 | 56,403 | 30 | 5,179 | 13,361 | 34,195 | 47,556 | ||||||||||||||||||||||||||||||||||||||||||||||||||||
Novus Foods (d) | Delphos, OH | Build-to-Suit & Expansion | Industrial | Q4 2026 | 139,250 | 25 | 1,409 | 3,325 | 34,604 | 38,000 | ||||||||||||||||||||||||||||||||||||||||||||||||||||
| Untenanted | Atlanta, GA | Redevelopment | Warehouse | Q4 2026 | 99,000 | N/A | 166 | 313 | 11,366 | 11,679 | ||||||||||||||||||||||||||||||||||||||||||||||||||||
| Various | Various, US | Solar Projects | Various | Various | N/A | N/A | 641 | 4,872 | 14,711 | 19,583 | ||||||||||||||||||||||||||||||||||||||||||||||||||||
| Expected Completion Date 2026 Total | 492,300 | 25 | 17,405 | 51,078 | 127,436 | 178,835 | ||||||||||||||||||||||||||||||||||||||||||||||||||||||||
AEG Presents (f) | Portland, OR | Build-to-Suit | Specialty (Entertainment) | Q1 2027 | 57,825 | 30 | 4,851 | 18,381 | 42,332 | 60,713 | ||||||||||||||||||||||||||||||||||||||||||||||||||||
| Untenanted | Atlanta, GA | Redevelopment | Warehouse | Q1 2027 | 432,800 | N/A | 293 | 1,253 | 39,519 | 40,772 | ||||||||||||||||||||||||||||||||||||||||||||||||||||
| Expected Completion Date 2027 Total | 490,625 | 30 | 5,144 | 19,634 | 81,851 | 101,485 | ||||||||||||||||||||||||||||||||||||||||||||||||||||||||
| Capital Investments and Commitments Total | 982,925 | 26 | $ | 22,549 | $ | 70,712 | $ | 209,287 | $ | 280,320 | ||||||||||||||||||||||||||||||||||||||||||||||||||||
| Investing for the Long Run® | 18 | |||||||
| Investment Activity – Dispositions | |||||
| Tenant | Property Location(s) | Gross Sale Price | Closing Date | Property Type(s) | Gross Square Footage | |||||||||||||||||||||||||||
| 1Q26 | ||||||||||||||||||||||||||||||||
Vacant (formerly Hellweg) (a) | Chemnitz, Germany | $ | 3,278 | Jan-26 | Retail | 82,699 | ||||||||||||||||||||||||||
Hellweg (2 properties) (a) | Dortmund-Kley and Bonn-Beuel, Germany | 6,488 | Jan-26; Mar-26 | Retail | 140,330 | |||||||||||||||||||||||||||
| AutoZone | St. Louis, MO | 391 | Jan-26 | Retail | 5,400 | |||||||||||||||||||||||||||
| Vacant | Opelika, AL | 52,697 | Feb-26 | Warehouse | 702,623 | |||||||||||||||||||||||||||
| TI Automotive | Gallatin, TN | 7,500 | Feb-26 | Industrial | 95,920 | |||||||||||||||||||||||||||
| Self-Storage Operating Properties (11 properties) | Various, United States | 75,160 | Mar-26 | Self-Storage (Operating) | 738,942 | |||||||||||||||||||||||||||
| Vacant | Oceanside, CA | 11,452 | Mar-26 | Warehouse | 58,977 | |||||||||||||||||||||||||||
Vacant (formerly Hellweg) (a) | Duisburg, Germany | 5,600 | Mar-26 | Retail | 85,993 | |||||||||||||||||||||||||||
| Year-to-Date Total Dispositions | $ | 162,566 | 1,910,884 | |||||||||||||||||||||||||||||
| Investing for the Long Run® | 19 | |||||||
| Joint Ventures | |||||
| Joint Venture or JV (Principal Tenant) | JV Partnership | Consolidated | Pro Rata (a) | |||||||||||||||||||||||||||||||||||
| Asset Type | WPC % | Debt Outstanding | ABR | Debt Outstanding | ABR | |||||||||||||||||||||||||||||||||
Unconsolidated Joint Venture (Equity Method Investment) (b) | ||||||||||||||||||||||||||||||||||||||
Las Vegas Retail Complex (c) | Net lease | 47.50% | $ | 245,884 | $ | 22,697 | $ | 116,795 | $ | 10,781 | ||||||||||||||||||||||||||||
| Harmon Retail Corner | Common equity interest | 15.00% | 143,000 | — | 21,450 | — | ||||||||||||||||||||||||||||||||
Kesko Senukai (d) | Net lease | 70.00% | 97,320 | 18,197 | 68,124 | 12,738 | ||||||||||||||||||||||||||||||||
| Total Unconsolidated Joint Ventures | 486,204 | 40,894 | 206,369 | 23,519 | ||||||||||||||||||||||||||||||||||
Consolidated Joint Ventures (e) | ||||||||||||||||||||||||||||||||||||||
Fentonir (d) | Net lease | 94.90% | — | 2,885 | — | 2,738 | ||||||||||||||||||||||||||||||||
| McCoy Rockford | Net lease | 90.00% | — | 991 | — | 892 | ||||||||||||||||||||||||||||||||
| Iowa Board of Regents | Net lease | 90.00% | — | 707 | — | 636 | ||||||||||||||||||||||||||||||||
| Total Consolidated Joint Ventures | — | 4,583 | — | 4,266 | ||||||||||||||||||||||||||||||||||
Total Unconsolidated and Consolidated Joint Ventures | $ | 486,204 | $ | 45,477 | $ | 206,369 | $ | 27,785 | ||||||||||||||||||||||||||||||
| Investing for the Long Run® | 20 | |||||||
| Top 25 Tenants | |||||
| Tenant | Description | Number of Properties | ABR | ABR % | Weighted-Average Lease Term (Years) | |||||||||||||||||||||||||||
| Extra Space Storage | Net lease self-storage properties in the U.S. leased to publicly traded self-storage REIT | 43 | $ | 42,578 | 2.7 | % | 23.4 | |||||||||||||||||||||||||
Apotex (a) | Pharmaceutical R&D and manufacturing properties in the Greater Toronto Area leased to generic drug manufacturer | 11 | 33,448 | 2.1 | % | 17.0 | ||||||||||||||||||||||||||
| Life Time Fitness | Health and fitness facilities in the U.S. leased to premium athletic club operator | 12 | 32,450 | 2.0 | % | 7.6 | ||||||||||||||||||||||||||
Metro Italia (b) | Business-to-business retail stores in Italy leased to cash and carry wholesaler | 18 | 28,833 | 1.8 | % | 5.1 | ||||||||||||||||||||||||||
Fortenova (b) | Grocery stores and one warehouse in Croatia leased to European food retailer | 19 | 28,622 | 1.8 | % | 8.1 | ||||||||||||||||||||||||||
OBI (b) | Retail properties in Poland leased to German DIY retailer | 26 | 27,286 | 1.7 | % | 7.9 | ||||||||||||||||||||||||||
Fedrigoni (b) | Industrial and warehouse facilities in Germany, Italy and Spain leased to global manufacturer of premium packaging and labels | 16 | 24,970 | 1.6 | % | 17.7 | ||||||||||||||||||||||||||
TI Automotive (a) (c) | Automotive parts manufacturing properties in the U.S., Canada and Mexico leased to OEM supplier | 20 | 24,675 | 1.6 | % | 18.9 | ||||||||||||||||||||||||||
Eroski (b) | Grocery stores and warehouses in Spain leased to Spanish food retailer | 63 | 24,045 | 1.5 | % | 10.0 | ||||||||||||||||||||||||||
| Nord Anglia | K-12 private schools in Orlando, Miami and Houston leased to international day and boarding school operator | 3 | 23,599 | 1.5 | % | 18.5 | ||||||||||||||||||||||||||
| Top 10 Total | 231 | 290,506 | 18.3 | % | 13.7 | |||||||||||||||||||||||||||
| Berry Global | Manufacturing facilities in the U.S. leased to international producer and supplier of packaging solutions | 8 | 21,187 | 1.3 | % | 12.5 | ||||||||||||||||||||||||||
Quikrete (b) | Industrial facilities in the U.S. and Canada leased to concrete and building products manufacturer | 27 | 20,643 | 1.3 | % | 17.2 | ||||||||||||||||||||||||||
Kesko Senukai (b) | Distribution facilities and retail properties in Lithuania, Estonia and Latvia leased to European DIY retailer | 20 | 20,033 | 1.3 | % | 5.9 | ||||||||||||||||||||||||||
| Advance Auto Parts | Distribution facilities in the U.S. leased to automotive aftermarket parts provider | 28 | 19,929 | 1.3 | % | 6.8 | ||||||||||||||||||||||||||
Pendragon (b) | Auto dealerships in the United Kingdom leased to automotive retailer | 46 | 18,718 | 1.2 | % | 12.6 | ||||||||||||||||||||||||||
| Maker’s Pride | Production, packaging and distribution facilities in the U.S. leased to North American contract food manufacturer | 18 | 17,636 | 1.1 | % | 16.3 | ||||||||||||||||||||||||||
| Dollar General | Retail properties in the U.S. leased to discount retailer | 127 | 17,363 | 1.1 | % | 13.3 | ||||||||||||||||||||||||||
Hellweg (b) (d) | Retail properties in Germany leased to German DIY retailer | 17 | 15,980 | 1.0 | % | 14.1 | ||||||||||||||||||||||||||
Danske Fragtmaend (b) | Distribution facilities in Denmark leased to Danish freight company | 15 | 15,097 | 1.0 | % | 10.9 | ||||||||||||||||||||||||||
Jumbo (b) | Logistics and cold storage warehouse facilities in the Netherlands leased to European supermarket chain | 4 | 14,873 | 0.9 | % | 7.3 | ||||||||||||||||||||||||||
| Top 20 Total | 541 | 471,965 | 29.8 | % | 13.0 | |||||||||||||||||||||||||||
Intergamma (b) | Retail properties in the Netherlands leased to European DIY retailer | 36 | 14,635 | 0.9 | % | 7.3 | ||||||||||||||||||||||||||
Go Auto (b) | Auto dealerships primarily in Vancouver with additional locations in Calgary and Edmonton leased to automotive retailer | 14 | 14,107 | 0.9 | % | 25.0 | ||||||||||||||||||||||||||
| Do It Best | Distribution facilities and manufacturing facility in the U.S. leased to global hardware wholesaler | 6 | 13,878 | 0.9 | % | 5.8 | ||||||||||||||||||||||||||
Raben Group (b) | Distribution facilities in Poland leased to European logistics company | 8 | 12,911 | 0.8 | % | 14.9 | ||||||||||||||||||||||||||
| Premium Brands | Food processing facility in Tennessee leased to global specialty food manufacturer | 1 | 12,616 | 0.8 | % | 24.3 | ||||||||||||||||||||||||||
Top 25 Total (e) | 606 | $ | 540,112 | 34.1 | % | 13.3 | ||||||||||||||||||||||||||
| Investing for the Long Run® | 21 | |||||||
| Diversification by Property Type | |||||
| Total Net-Lease Portfolio | ||||||||||||||||||||||||||
| Property Type | ABR | ABR % | Square Footage (a) | Square Footage % | ||||||||||||||||||||||
| U.S. | ||||||||||||||||||||||||||
| Industrial | $ | 399,308 | 25.2 | % | 57,945 | 31.3 | % | |||||||||||||||||||
| Warehouse | 230,580 | 14.5 | % | 41,772 | 22.5 | % | ||||||||||||||||||||
Retail (b) | 136,911 | 8.7 | % | 6,428 | 3.5 | % | ||||||||||||||||||||
Other (c) | 186,018 | 11.8 | % | 9,451 | 5.1 | % | ||||||||||||||||||||
| U.S. Total | 952,817 | 60.2 | % | 115,596 | 62.4 | % | ||||||||||||||||||||
| International | ||||||||||||||||||||||||||
| Industrial | 200,877 | 12.7 | % | 25,937 | 14.0 | % | ||||||||||||||||||||
| Warehouse | 172,458 | 10.9 | % | 25,244 | 13.6 | % | ||||||||||||||||||||
Retail (b) | 222,238 | 14.0 | % | 16,744 | 9.0 | % | ||||||||||||||||||||
Other (c) | 35,402 | 2.2 | % | 1,812 | 1.0 | % | ||||||||||||||||||||
| International Total | 630,975 | 39.8 | % | 69,737 | 37.6 | % | ||||||||||||||||||||
| Total | ||||||||||||||||||||||||||
| Industrial | 600,185 | 37.9 | % | 83,882 | 45.3 | % | ||||||||||||||||||||
| Warehouse | 403,038 | 25.4 | % | 67,016 | 36.1 | % | ||||||||||||||||||||
Retail (b) | 359,149 | 22.7 | % | 23,172 | 12.5 | % | ||||||||||||||||||||
Other (c) | 221,420 | 14.0 | % | 11,263 | 6.1 | % | ||||||||||||||||||||
Total (d) | $ | 1,583,792 | 100.0 | % | 185,333 | 100.0 | % | |||||||||||||||||||
| Investing for the Long Run® | 22 | |||||||
| Diversification by Tenant Industry | |||||
| Total Net-Lease Portfolio | ||||||||||||||||||||||||||
Industry Type (a) | ABR | ABR % | Square Footage | Square Footage % | ||||||||||||||||||||||
| Packaged Foods & Meats | $ | 149,854 | 9.5 | % | 18,625 | 10.0 | % | |||||||||||||||||||
| Food Retail | 141,049 | 8.9 | % | 10,266 | 5.5 | % | ||||||||||||||||||||
| Automotive Retail | 95,023 | 6.0 | % | 7,723 | 4.2 | % | ||||||||||||||||||||
| Home Improvement Retail | 94,344 | 6.0 | % | 11,796 | 6.4 | % | ||||||||||||||||||||
| Auto Parts & Equipment | 80,983 | 5.1 | % | 12,052 | 6.5 | % | ||||||||||||||||||||
| Air Freight & Logistics | 64,429 | 4.1 | % | 9,579 | 5.2 | % | ||||||||||||||||||||
| Education Services | 60,594 | 3.8 | % | 2,747 | 1.5 | % | ||||||||||||||||||||
| Pharmaceuticals | 48,238 | 3.0 | % | 3,075 | 1.7 | % | ||||||||||||||||||||
| Leisure Facilities | 44,209 | 2.8 | % | 1,982 | 1.1 | % | ||||||||||||||||||||
| Industrial Machinery | 43,638 | 2.8 | % | 5,933 | 3.2 | % | ||||||||||||||||||||
| Self-Storage REITs | 42,578 | 2.7 | % | 3,170 | 1.7 | % | ||||||||||||||||||||
| Trading Companies & Distributors | 40,929 | 2.6 | % | 9,076 | 4.9 | % | ||||||||||||||||||||
| Metal, Glass & Plastic Containers | 39,843 | 2.5 | % | 5,318 | 2.9 | % | ||||||||||||||||||||
| Building Products | 33,630 | 2.1 | % | 6,850 | 3.7 | % | ||||||||||||||||||||
| Paper Products | 30,855 | 2.0 | % | 5,540 | 3.0 | % | ||||||||||||||||||||
| Other Specialty Retail | 27,662 | 1.7 | % | 3,127 | 1.7 | % | ||||||||||||||||||||
| Specialty Chemicals | 24,437 | 1.5 | % | 4,303 | 2.3 | % | ||||||||||||||||||||
| Diversified Support Services | 23,976 | 1.5 | % | 1,992 | 1.1 | % | ||||||||||||||||||||
| Construction Materials | 23,629 | 1.5 | % | 3,781 | 2.0 | % | ||||||||||||||||||||
| Construction Machinery | 21,025 | 1.3 | % | 2,733 | 1.5 | % | ||||||||||||||||||||
| Food Distributors | 20,712 | 1.3 | % | 1,552 | 0.8 | % | ||||||||||||||||||||
| Consumer Staples Merchandise Retail | 19,562 | 1.2 | % | 1,635 | 0.9 | % | ||||||||||||||||||||
| Commodity Chemicals | 17,050 | 1.1 | % | 2,517 | 1.3 | % | ||||||||||||||||||||
| Diversified Metals | 16,752 | 1.1 | % | 3,417 | 1.8 | % | ||||||||||||||||||||
| Hotels & Resorts | 16,313 | 1.0 | % | 1,073 | 0.6 | % | ||||||||||||||||||||
Other (61 industries, each <1% ABR) (b) | 362,478 | 22.9 | % | 45,471 | 24.5 | % | ||||||||||||||||||||
Total (c) | $ | 1,583,792 | 100.0 | % | 185,333 | 100.0 | % | |||||||||||||||||||
| Investing for the Long Run® | 23 | |||||||
| Diversification by Geography | |||||
| Total Net-Lease Portfolio | ||||||||||||||||||||||||||
| Region | ABR | ABR % | Square Footage (a) | Square Footage % | ||||||||||||||||||||||
| U.S. | ||||||||||||||||||||||||||
| Midwest | ||||||||||||||||||||||||||
| Illinois | $ | 67,369 | 4.3 | % | 9,582 | 5.2 | % | |||||||||||||||||||
| Ohio | 49,112 | 3.1 | % | 8,655 | 4.7 | % | ||||||||||||||||||||
| Indiana | 43,756 | 2.8 | % | 6,251 | 3.4 | % | ||||||||||||||||||||
| Michigan | 28,083 | 1.8 | % | 4,487 | 2.4 | % | ||||||||||||||||||||
| Wisconsin | 21,812 | 1.4 | % | 3,410 | 1.8 | % | ||||||||||||||||||||
Other (b) | 58,987 | 3.7 | % | 7,136 | 3.8 | % | ||||||||||||||||||||
| Total Midwest | 269,119 | 17.1 | % | 39,521 | 21.3 | % | ||||||||||||||||||||
| South | ||||||||||||||||||||||||||
| Texas | 94,235 | 6.0 | % | 11,702 | 6.3 | % | ||||||||||||||||||||
| Florida | 44,655 | 2.8 | % | 3,633 | 2.0 | % | ||||||||||||||||||||
| Tennessee | 38,694 | 2.4 | % | 4,476 | 2.4 | % | ||||||||||||||||||||
| Georgia | 25,286 | 1.6 | % | 3,503 | 1.9 | % | ||||||||||||||||||||
| Alabama | 23,662 | 1.5 | % | 2,905 | 1.6 | % | ||||||||||||||||||||
Other (b) | 31,177 | 2.0 | % | 3,497 | 1.9 | % | ||||||||||||||||||||
| Total South | 257,709 | 16.3 | % | 29,716 | 16.1 | % | ||||||||||||||||||||
| East | ||||||||||||||||||||||||||
| North Carolina | 41,885 | 2.6 | % | 8,851 | 4.8 | % | ||||||||||||||||||||
| Kentucky | 30,026 | 1.9 | % | 4,485 | 2.4 | % | ||||||||||||||||||||
| Pennsylvania | 29,250 | 1.8 | % | 3,385 | 1.8 | % | ||||||||||||||||||||
| Massachusetts | 28,719 | 1.8 | % | 1,344 | 0.7 | % | ||||||||||||||||||||
| New Jersey | 26,684 | 1.7 | % | 1,118 | 0.6 | % | ||||||||||||||||||||
| New York | 23,569 | 1.5 | % | 2,287 | 1.2 | % | ||||||||||||||||||||
| South Carolina | 19,646 | 1.2 | % | 4,413 | 2.4 | % | ||||||||||||||||||||
Other (b) | 37,657 | 2.4 | % | 5,359 | 2.9 | % | ||||||||||||||||||||
| Total East | 237,436 | 14.9 | % | 31,242 | 16.8 | % | ||||||||||||||||||||
| West | ||||||||||||||||||||||||||
| California | 76,957 | 4.9 | % | 5,316 | 2.9 | % | ||||||||||||||||||||
| Arizona | 25,111 | 1.6 | % | 2,544 | 1.4 | % | ||||||||||||||||||||
| Nevada | 17,910 | 1.1 | % | 485 | 0.3 | % | ||||||||||||||||||||
Other (b) | 68,575 | 4.3 | % | 6,772 | 3.6 | % | ||||||||||||||||||||
| Total West | 188,553 | 11.9 | % | 15,117 | 8.2 | % | ||||||||||||||||||||
| U.S. Total | 952,817 | 60.2 | % | 115,596 | 62.4 | % | ||||||||||||||||||||
| International | ||||||||||||||||||||||||||
| Poland | 78,720 | 5.0 | % | 10,306 | 5.6 | % | ||||||||||||||||||||
| Italy | 75,328 | 4.8 | % | 9,941 | 5.4 | % | ||||||||||||||||||||
Canada (c) | 73,625 | 4.6 | % | 6,333 | 3.4 | % | ||||||||||||||||||||
| The Netherlands | 68,548 | 4.3 | % | 6,847 | 3.7 | % | ||||||||||||||||||||
| United Kingdom | 62,027 | 3.9 | % | 4,848 | 2.6 | % | ||||||||||||||||||||
| Germany | 48,959 | 3.1 | % | 5,196 | 2.8 | % | ||||||||||||||||||||
| Spain | 42,095 | 2.7 | % | 4,251 | 2.3 | % | ||||||||||||||||||||
| Croatia | 29,546 | 1.9 | % | 2,063 | 1.1 | % | ||||||||||||||||||||
| France | 27,943 | 1.8 | % | 2,149 | 1.2 | % | ||||||||||||||||||||
Mexico (d) | 27,686 | 1.7 | % | 4,328 | 2.3 | % | ||||||||||||||||||||
| Denmark | 27,601 | 1.7 | % | 3,002 | 1.6 | % | ||||||||||||||||||||
Other (e) | 68,897 | 4.3 | % | 10,473 | 5.6 | % | ||||||||||||||||||||
| International Total | 630,975 | 39.8 | % | 69,737 | 37.6 | % | ||||||||||||||||||||
Total (f) | $ | 1,583,792 | 100.0 | % | 185,333 | 100.0 | % | |||||||||||||||||||
| Investing for the Long Run® | 24 | |||||||
| Contractual Rent Increases | |||||
| Total Net-Lease Portfolio | ||||||||||||||||||||||||||
| Rent Adjustment Measure | ABR | ABR % | Square Footage | Square Footage % | ||||||||||||||||||||||
| Uncapped CPI | $ | 474,860 | 30.0 | % | 45,371 | 24.5 | % | |||||||||||||||||||
| Capped CPI | 294,389 | 18.6 | % | 40,430 | 21.8 | % | ||||||||||||||||||||
| CPI-linked | 769,249 | 48.6 | % | 85,801 | 46.3 | % | ||||||||||||||||||||
| Fixed | 760,879 | 48.0 | % | 92,262 | 49.8 | % | ||||||||||||||||||||
Other (a) | 48,222 | 3.1 | % | 3,455 | 1.9 | % | ||||||||||||||||||||
| None | 5,442 | 0.3 | % | 251 | 0.1 | % | ||||||||||||||||||||
| Vacant | — | — | % | 3,564 | 1.9 | % | ||||||||||||||||||||
Total (b) | $ | 1,583,792 | 100.0 | % | 185,333 | 100.0 | % | |||||||||||||||||||
| Investing for the Long Run® | 25 | |||||||
| Same-Store Analysis | |||||
| ABR | |||||||||||||||||||||||
| As of | |||||||||||||||||||||||
| Mar. 31, 2026 | Mar. 31, 2025 | Increase | % Increase | ||||||||||||||||||||
| Property Type | |||||||||||||||||||||||
| Industrial | $ | 479,350 | $ | 467,425 | $ | 11,925 | 2.6 | % | |||||||||||||||
| Warehouse | 336,060 | 328,040 | 8,020 | 2.4 | % | ||||||||||||||||||
Retail (a) | 302,401 | 296,089 | 6,312 | 2.1 | % | ||||||||||||||||||
Other (b) | 187,820 | 183,269 | 4,551 | 2.5 | % | ||||||||||||||||||
| Total | $ | 1,305,631 | $ | 1,274,823 | $ | 30,808 | 2.4 | % | |||||||||||||||
| Rent Adjustment Measure | |||||||||||||||||||||||
| Uncapped CPI | $ | 394,007 | $ | 385,316 | $ | 8,691 | 2.3 | % | |||||||||||||||
| Capped CPI | 247,256 | 240,637 | 6,619 | 2.8 | % | ||||||||||||||||||
| CPI-linked | 641,263 | 625,953 | 15,310 | 2.4 | % | ||||||||||||||||||
| Fixed | 615,802 | 601,467 | 14,335 | 2.4 | % | ||||||||||||||||||
Other (c) | 43,124 | 41,961 | 1,163 | 2.8 | % | ||||||||||||||||||
| None | 5,442 | 5,442 | — | — | % | ||||||||||||||||||
| Total | $ | 1,305,631 | $ | 1,274,823 | $ | 30,808 | 2.4 | % | |||||||||||||||
| Geography | |||||||||||||||||||||||
| U.S. | $ | 784,663 | $ | 766,060 | $ | 18,603 | 2.4 | % | |||||||||||||||
| Europe | 437,034 | 427,115 | 9,919 | 2.3 | % | ||||||||||||||||||
Other International (d) | 83,934 | 81,648 | 2,286 | 2.8 | % | ||||||||||||||||||
| Total | $ | 1,305,631 | $ | 1,274,823 | $ | 30,808 | 2.4 | % | |||||||||||||||
| Same-Store Portfolio Summary | |||||||||||||||||||||||
| Number of properties | 1,392 | ||||||||||||||||||||||
| Square footage (in thousands) | 153,558 | ||||||||||||||||||||||
| Investing for the Long Run® | 26 | |||||||
| Same-Store Pro Rata Rental Income | |||||||||||||||||||||||
| Three Months Ended | |||||||||||||||||||||||
| Mar. 31, 2026 | Mar. 31, 2025 | Increase | % Increase | ||||||||||||||||||||
| Property Type | |||||||||||||||||||||||
| Industrial | $ | 119,956 | $ | 116,994 | $ | 2,962 | 2.5 | % | |||||||||||||||
| Warehouse | 88,667 | 89,362 | (695) | (0.8) | % | ||||||||||||||||||
Retail (a) | 74,526 | 75,407 | (881) | (1.2) | % | ||||||||||||||||||
Other (b) | 47,532 | 45,795 | 1,737 | 3.8 | % | ||||||||||||||||||
| Total | $ | 330,681 | $ | 327,558 | $ | 3,123 | 1.0 | % | |||||||||||||||
| Rent Adjustment Measure | |||||||||||||||||||||||
| Uncapped CPI | $ | 105,460 | $ | 105,344 | $ | 116 | 0.1 | % | |||||||||||||||
| Capped CPI | 65,170 | 66,288 | (1,118) | (1.7) | % | ||||||||||||||||||
| CPI-linked | 170,630 | 171,632 | (1,002) | (0.6) | % | ||||||||||||||||||
| Fixed | 148,212 | 144,439 | 3,773 | 2.6 | % | ||||||||||||||||||
Other (c) | 10,803 | 10,392 | 411 | 4.0 | % | ||||||||||||||||||
| None | 1,036 | 1,095 | (59) | (5.4) | % | ||||||||||||||||||
| Total | $ | 330,681 | $ | 327,558 | $ | 3,123 | 1.0 | % | |||||||||||||||
| Geography | |||||||||||||||||||||||
| U.S. | $ | 193,900 | $ | 190,350 | $ | 3,550 | 1.9 | % | |||||||||||||||
| Europe | 115,068 | 116,219 | (1,151) | (1.0) | % | ||||||||||||||||||
Other International (d) | 21,713 | 20,989 | 724 | 3.4 | % | ||||||||||||||||||
| Total | $ | 330,681 | $ | 327,558 | $ | 3,123 | 1.0 | % | |||||||||||||||
| Same-Store Portfolio Summary | |||||||||||||||||||||||
| Number of properties | 1,425 | ||||||||||||||||||||||
| Square footage (in thousands) | 161,742 | ||||||||||||||||||||||
| Investing for the Long Run® | 27 | |||||||
| Three Months Ended | |||||||||||
| Mar. 31, 2026 | Mar. 31, 2025 | ||||||||||
| Consolidated Lease Revenues | |||||||||||
| Total lease revenues – as reported | $ | 402,831 | $ | 353,768 | |||||||
| Income from finance leases and loans receivable | 27,686 | 17,458 | |||||||||
| Less: Reimbursable tenant costs – as reported | (19,692) | (17,092) | |||||||||
| Less: Income from secured loans receivable | (678) | (607) | |||||||||
| 410,147 | 353,527 | ||||||||||
| Adjustments for Pro Rata Ownership of Real Estate Joint Ventures: | |||||||||||
| Add: Pro rata share of adjustments from equity method investments | 5,979 | 4,236 | |||||||||
| Less: Pro rata share of adjustments for noncontrolling interests | (135) | (188) | |||||||||
| 5,844 | 4,048 | ||||||||||
| Adjustments for Pro Rata Non-Cash Items: | |||||||||||
| Less: Straight-line and other leasing and financing adjustments | (24,178) | (19,033) | |||||||||
| Add: Above- and below-market rent intangible lease amortization | 2,498 | 1,123 | |||||||||
| Less: Adjustments for pro rata ownership | (44) | (50) | |||||||||
| (21,724) | (17,960) | ||||||||||
Adjustment to normalize for (i) properties not continuously owned since January 1, 2025 and (ii) constant currency presentation for prior year quarter (e) | (63,586) | (12,057) | |||||||||
| Same-Store Pro Rata Rental Income | $ | 330,681 | $ | 327,558 | |||||||
| Investing for the Long Run® | 28 | |||||||
| Leasing Activity | |||||
Lease Renewals and Extensions (a) | Property and Tenant Improvements (c) | Leasing Commissions | ||||||||||||||||||||||||||||||||||||||||||||||||
| ABR | ||||||||||||||||||||||||||||||||||||||||||||||||||
| Property Type | Square Feet | Number of Leases | Prior Lease | New Lease (b) | Rent Recapture | Incremental Lease Term | ||||||||||||||||||||||||||||||||||||||||||||
| Industrial | — | — | $ | — | $ | — | — | % | $ | — | $ | — | N/A | |||||||||||||||||||||||||||||||||||||
| Warehouse | 741,190 | 3 | 4,039 | 4,729 | 117.1 | % | 173 | 114 | 4.7 years | |||||||||||||||||||||||||||||||||||||||||
| Retail | 1,618,089 | 17 | 18,649 | 18,649 | 100.0 | % | — | — | 5.2 years | |||||||||||||||||||||||||||||||||||||||||
| Other | 20,236 | 1 | 203 | 203 | 100.0 | % | — | — | 5.0 years | |||||||||||||||||||||||||||||||||||||||||
| Total / Weighted Average | 2,379,515 | 21 | $ | 22,891 | $ | 23,581 | 103.0 | % | $ | 173 | $ | 114 | 5.1 years | |||||||||||||||||||||||||||||||||||||
| Q1 Summary | ||||||||||||||||||||||||||||||||||||||||||||||||||
Prior Lease ABR (% of Total Portfolio) | 1.4 | % | ||||||||||||||||||||||||||||||||||||||||||||||||
| New Leases | Property and Tenant Improvements (c) | Leasing Commissions | ||||||||||||||||||||||||||||||||||||
| ABR | ||||||||||||||||||||||||||||||||||||||
| Property Type | Square Feet | Number of Leases | New Lease (b) | New Lease Term | ||||||||||||||||||||||||||||||||||
| Industrial | — | — | $ | — | $ | — | $ | — | N/A | |||||||||||||||||||||||||||||
| Warehouse | 397,504 | 3 | 3,618 | 703 | 312 | 2.6 years | ||||||||||||||||||||||||||||||||
| Retail | — | — | — | — | — | N/A | ||||||||||||||||||||||||||||||||
| Other | — | — | — | — | — | N/A | ||||||||||||||||||||||||||||||||
Total / Weighted Average (d) | 397,504 | 3 | $ | 3,618 | $ | 703 | $ | 312 | 2.6 years | |||||||||||||||||||||||||||||
| Investing for the Long Run® | 29 | |||||||
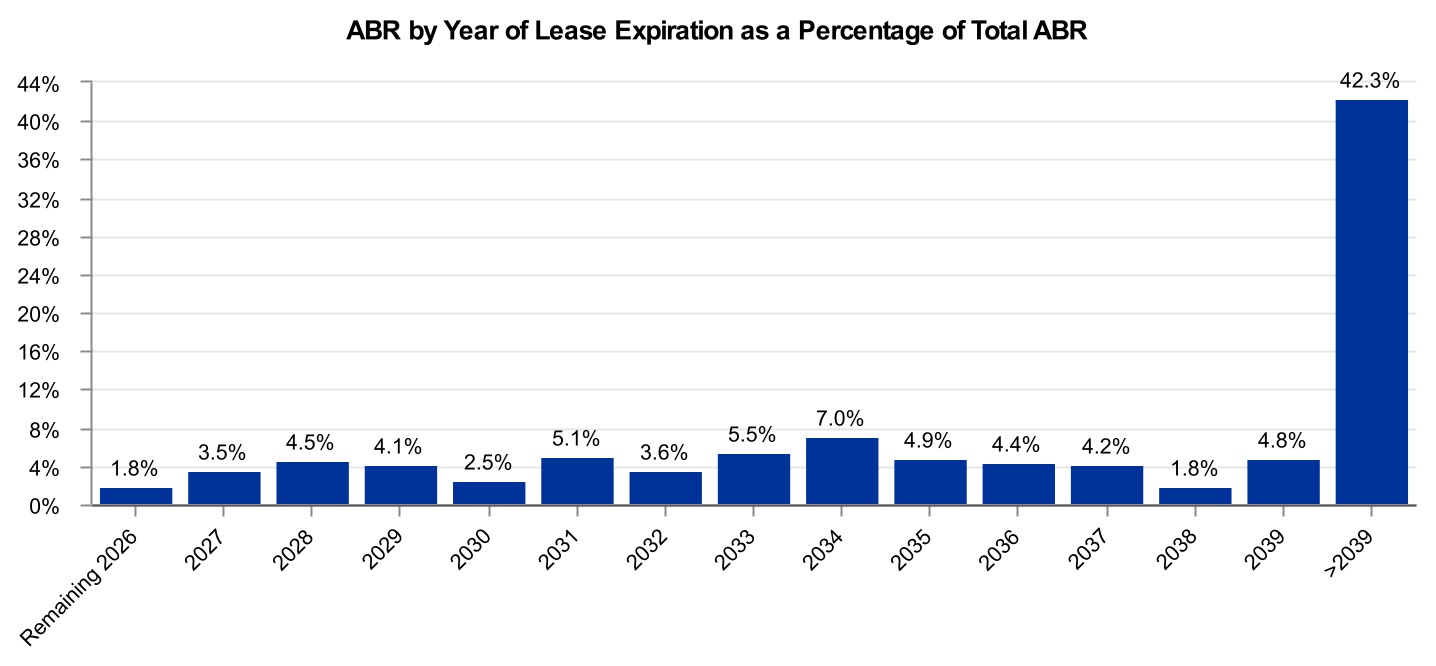
| Lease Expirations | |||||
Year of Lease Expiration (a) | Number of Leases Expiring | Number of Tenants with Leases Expiring | ABR | ABR % | Square Footage | Square Footage % | ||||||||||||||||||||||||||||||||
| Remaining 2026 | 12 | 12 | $ | 28,690 | 1.8 | % | 3,343 | 1.8 | % | |||||||||||||||||||||||||||||
| 2027 | 39 | 26 | 55,547 | 3.5 | % | 6,036 | 3.3 | % | ||||||||||||||||||||||||||||||
| 2028 | 46 | 28 | 70,593 | 4.5 | % | 7,698 | 4.2 | % | ||||||||||||||||||||||||||||||
| 2029 | 51 | 37 | 64,667 | 4.1 | % | 7,392 | 4.0 | % | ||||||||||||||||||||||||||||||
| 2030 | 32 | 26 | 39,994 | 2.5 | % | 3,793 | 2.0 | % | ||||||||||||||||||||||||||||||
| 2031 | 49 | 31 | 81,438 | 5.1 | % | 9,769 | 5.3 | % | ||||||||||||||||||||||||||||||
| 2032 | 46 | 24 | 56,731 | 3.6 | % | 7,307 | 3.9 | % | ||||||||||||||||||||||||||||||
| 2033 | 35 | 26 | 87,972 | 5.5 | % | 12,001 | 6.5 | % | ||||||||||||||||||||||||||||||
| 2034 | 73 | 28 | 110,316 | 7.0 | % | 10,887 | 5.9 | % | ||||||||||||||||||||||||||||||
| 2035 | 24 | 20 | 77,953 | 4.9 | % | 8,805 | 4.7 | % | ||||||||||||||||||||||||||||||
| 2036 | 46 | 21 | 69,715 | 4.4 | % | 8,083 | 4.4 | % | ||||||||||||||||||||||||||||||
| 2037 | 45 | 22 | 66,906 | 4.2 | % | 9,030 | 4.9 | % | ||||||||||||||||||||||||||||||
| 2038 | 46 | 13 | 27,874 | 1.8 | % | 2,766 | 1.5 | % | ||||||||||||||||||||||||||||||
| 2039 | 100 | 27 | 75,528 | 4.8 | % | 11,372 | 6.1 | % | ||||||||||||||||||||||||||||||
| Thereafter (>2039) | 319 | 119 | 669,868 | 42.3 | % | 73,487 | 39.6 | % | ||||||||||||||||||||||||||||||
| Vacant | — | — | — | — | % | 3,564 | 1.9 | % | ||||||||||||||||||||||||||||||
Total (b) | 963 | $ | 1,583,792 | 100.0 | % | 185,333 | 100.0 | % | ||||||||||||||||||||||||||||||
| Investing for the Long Run® | 30 | |||||||
| Investing for the Long Run® | 31 | |||||||
| Normalized Pro Rata Cash NOI | |||||
| Three Months Ended Mar. 31, 2026 | |||||
| Consolidated Lease Revenues | |||||
| Total lease revenues – as reported | $ | 402,831 | |||
| Income from finance leases and loans receivable – as reported | 27,686 | ||||
| Less: Income from secured loans receivable | (678) | ||||
| Less: Consolidated Reimbursable and Non-Reimbursable Property Expenses | |||||
| Reimbursable property expenses – as reported | 19,692 | ||||
| Non-reimbursable property expenses – as reported | 14,552 | ||||
| 395,595 | |||||
| Plus: NOI from Operating Properties | |||||
| Self-storage revenues | 1,906 | ||||
| Self-storage expenses | (814) | ||||
| 1,092 | |||||
| Hotel revenues | 8,684 | ||||
| Hotel expenses | (7,358) | ||||
| 1,326 | |||||
| Student housing and other revenues | 1,460 | ||||
| Student housing and other expenses | (522) | ||||
| 938 | |||||
| 398,951 | |||||
| Adjustments for Pro Rata Ownership of Real Estate Joint Ventures: | |||||
| Add: Pro rata share of NOI from equity method investments | 5,296 | ||||
| Less: Pro rata share of NOI attributable to noncontrolling interests | (58) | ||||
| 5,238 | |||||
| 404,189 | |||||
| Adjustments for Pro Rata Non-Cash Items: | |||||
| Less: Straight-line and other leasing and financing adjustments | (24,178) | ||||
| Add: Above- and below-market rent intangible lease amortization | 2,498 | ||||
| Add: Other non-cash items | 532 | ||||
| (21,148) | |||||
Pro Rata Cash NOI (a) | 383,041 | ||||
Adjustment to normalize for net lease investments and dispositions (b) | 6,228 | ||||
Adjustment to normalize for operating property dispositions (b) | (1,092) | ||||
Normalized Pro Rata Cash NOI (a) | $ | 388,177 | |||
| Investing for the Long Run® | 32 | |||||||
| Three Months Ended Mar. 31, 2026 | |||||
| Net Income Attributable to W. P. Carey | |||||
| Net income attributable to W. P. Carey – as reported | $ | 176,302 | |||
| Adjustments for Consolidated Operating Expenses | |||||
| Add: Operating expenses – as reported | 255,098 | ||||
| Less: Property expenses, excluding reimbursable tenant costs – as reported | (14,552) | ||||
| Less: Operating property expenses – as reported | (8,694) | ||||
| 231,852 | |||||
| Adjustments for Other Consolidated Revenues and Expenses: | |||||
| Less: Reimbursable property expenses – as reported | (19,692) | ||||
| Add: Benefit from income taxes – as reported | 14,634 | ||||
| Less: Other lease-related income – as reported | (10,452) | ||||
| Add: Other income and (expenses) – as reported | 8,281 | ||||
| Less: Other advisory income and reimbursements – as reported | (1,000) | ||||
| Less: Asset management fees revenue – as reported | (490) | ||||
| (8,719) | |||||
| Other Adjustments: | |||||
| Less: Straight-line and other leasing and financing adjustments | (24,178) | ||||
Adjustment to normalize for net lease investments and dispositions (b) | 6,228 | ||||
| Add: Adjustments for pro rata ownership | 5,459 | ||||
| Add: Above- and below-market rent intangible lease amortization | 2,498 | ||||
Adjustment to normalize for operating property dispositions (b) | (1,092) | ||||
| Less: Income from secured loans receivable | (678) | ||||
| Add: Property expenses, excluding reimbursable tenant costs, non-cash | 505 | ||||
| (11,258) | |||||
Normalized Pro Rata Cash NOI (a) | $ | 388,177 | |||
| Investing for the Long Run® | 33 | |||||||
| Adjusted EBITDA – Last Five Quarters | |||||
| Three Months Ended | |||||||||||||||||||||||||||||
| Mar. 31, 2026 | Dec. 31, 2025 | Sep. 30, 2025 | Jun. 30, 2025 | Mar. 31, 2025 | |||||||||||||||||||||||||
| Net income | $ | 176,496 | $ | 154,562 | $ | 141,225 | $ | 51,312 | $ | 125,816 | |||||||||||||||||||
Adjustments to Derive Adjusted EBITDA (a) | |||||||||||||||||||||||||||||
| Depreciation and amortization | 136,183 | 145,339 | 125,586 | 120,595 | 129,607 | ||||||||||||||||||||||||
| Interest expense | 78,460 | 75,431 | 75,226 | 71,795 | 68,804 | ||||||||||||||||||||||||
| Gain on sale of real estate, net | (54,141) | (52,791) | (44,401) | (52,824) | (43,777) | ||||||||||||||||||||||||
| Impairment charges — real estate | 40,008 | 39,690 | 19,474 | 4,349 | 6,854 | ||||||||||||||||||||||||
Straight-line and other leasing and financing adjustments (b) | (24,178) | (20,758) | (20,424) | (15,374) | (19,033) | ||||||||||||||||||||||||
| Provision for (benefit from) income taxes | 14,634 | (1,310) | 8,495 | 13,091 | 11,632 | ||||||||||||||||||||||||
| Stock-based compensation expense | 7,441 | 8,650 | 11,153 | 10,943 | 9,148 | ||||||||||||||||||||||||
Other (gains) and losses (c) | (6,791) | 10,131 | 31,011 | 148,768 | 42,197 | ||||||||||||||||||||||||
| Above- and below-market rent intangible lease amortization | 2,498 | 941 | 4,363 | 5,061 | 1,123 | ||||||||||||||||||||||||
| Merger and other expenses | 1,180 | 478 | 1,021 | 192 | 556 | ||||||||||||||||||||||||
| Other amortization and non-cash charges | 489 | 467 | 465 | 458 | 442 | ||||||||||||||||||||||||
| 195,783 | 206,268 | 211,969 | 307,054 | 207,553 | |||||||||||||||||||||||||
| Adjustments for Pro Rata Ownership | |||||||||||||||||||||||||||||
| Real Estate Joint Ventures: | |||||||||||||||||||||||||||||
| Add: Pro rata share of adjustments for equity method investments | 3,206 | 2,961 | 5,220 | 3,312 | 2,309 | ||||||||||||||||||||||||
| Less: Pro rata share of adjustments for amounts attributable to noncontrolling interests | (280) | (429) | (430) | (308) | (179) | ||||||||||||||||||||||||
| 2,926 | 2,532 | 4,790 | 3,004 | 2,130 | |||||||||||||||||||||||||
Adjustment to normalize for intra-period acquisitions and dispositions (d) | 4,363 | 3,312 | 2,545 | 3,222 | 7,117 | ||||||||||||||||||||||||
Adjusted EBITDA (e) | $ | 379,568 | $ | 366,674 | $ | 360,529 | $ | 364,592 | $ | 342,616 | |||||||||||||||||||
| Investing for the Long Run® | 34 | |||||||
| Reconciliation of Net Debt to Adjusted EBITDA | |||||
| Three Months Ended | |||||
| Mar. 31, 2026 | |||||
Adjusted EBITDA (a) | $ | 379,568 | |||
| Adjusted EBITDA (Annualized) | $ | 1,518,272 | |||
| As of | |||||
| Mar. 31, 2026 | |||||
Total Pro Rata Debt Outstanding (b) | $ | 8,929,648 | |||
| Less: Cash and cash equivalents | (239,266) | ||||
| Net Debt | $ | 8,690,382 | |||
Less: Expected proceeds from unsettled forward equity (c) | (653,472) | ||||
| Net Debt – Inclusive of Unsettled Forward Equity | $ | 8,036,910 | |||
| Net Debt to Adjusted EBITDA (Annualized) | 5.7x | ||||
| Net Debt to Adjusted EBITDA (Annualized) – Inclusive of Unsettled Forward Equity | 5.3x | ||||
| Investing for the Long Run® | 35 | |||||||
| Disclosures Regarding Non-GAAP and Other Metrics | |||||
| Investing for the Long Run® | 36 | |||||||
| Investing for the Long Run® | 37 | |||||||