Shareholder Report
|
6 Months Ended |
|
Feb. 28, 2026
USD ($)
Holding
|
|---|
| Shareholder Report [Line Items] |
|
|
| Document Type |
N-CSRS
|
|
| Amendment Flag |
false
|
|
| Registrant Name |
EATON VANCE GROWTH TRUST
|
|
| Entity Central Index Key |
0000102816
|
|
| Entity Investment Company Type |
N-1A
|
|
| Document Period End Date |
Feb. 28, 2026
|
|
| Shareholder Report Annual or Semi-Annual |
Semi-Annual Shareholder Report
|
|
| C000014185 |
|
|
| Shareholder Report [Line Items] |
|
|
| Fund Name |
Eaton Vance China Equity Fund
|
|
| Class Name |
Class A
|
|
| Trading Symbol |
EVCGX
|
|
| Annual or Semi-Annual Statement [Text Block] |
This semi-annual shareholder report contains important information about the Eaton Vance China Equity Fund for the period of September 1, 2025 to February 28, 2026.
|
|
| Additional Information [Text Block] |
You can find additional information about the Fund at www.eatonvance.com/open-end-mutual-fund-documents.php. You can also request this information by contacting us at 1-800-262-1122.
|
|
| Additional Information Phone Number |
1-800-262-1122
|
|
| Additional Information Website |
<span style="box-sizing: border-box; color: rgb(0, 0, 0); display: inline; flex-wrap: nowrap; font-size: 10.6667px; font-weight: 400; grid-area: auto; line-height: 16px; margin: 0px; overflow: visible; text-align: left; text-align-last: auto; white-space-collapse: preserve-breaks;">www.eatonvance.com/open-end-mutual-fund-documents.php</span>
|
|
| Expenses [Text Block] |
What were the Fund costs for the last six months?(based on a hypothetical $10,000 investment)
Table Summary
Class Name |
Costs of a $10,000 investment |
Costs paid as a percentage of a $10,000 investment |
Class A |
$74 |
1.50%Footnote Reference1 |
| Footnote |
Description |
Footnote1 |
Annualized | |
|
| Expenses Paid, Amount |
$ 74
|
|
| Expense Ratio, Percent |
1.50%
|
[1] |
| AssetsNet |
$ 37,486,306
|
|
| Holdings Count | Holding |
69
|
|
| InvestmentCompanyPortfolioTurnover |
25.00%
|
|
| Additional Fund Statistics [Text Block] |
Table Summary
Total Net Assets |
$37,486,306 |
# of Portfolio Holdings |
69 |
Portfolio Turnover Rate |
25% | |
|
| Holdings [Text Block] |
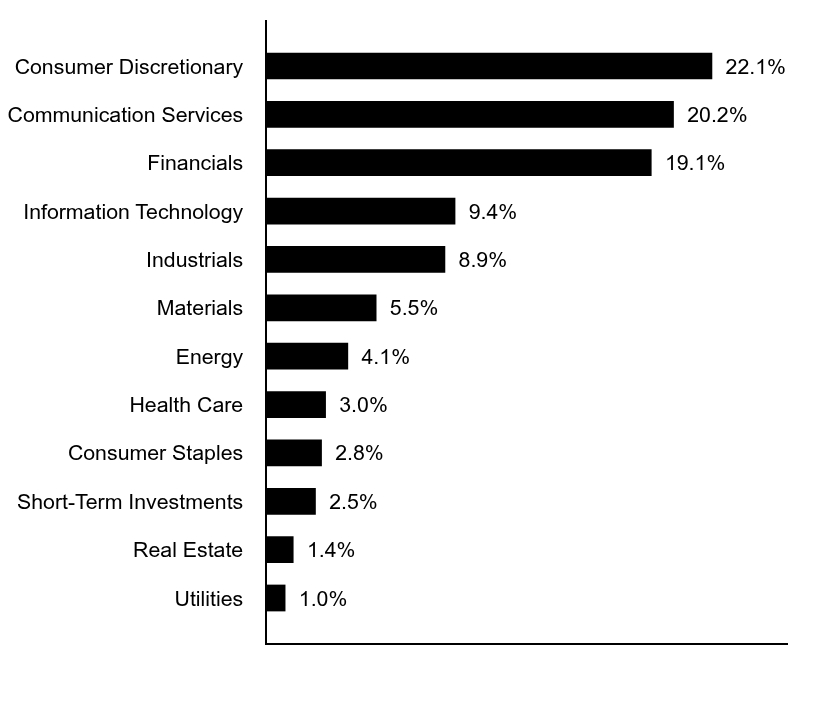
Sector Allocation (% of total investments)
Table Summary
Value |
Value |
Utilities |
1.0% |
Real Estate |
1.4% |
Short-Term Investments |
2.5% |
Consumer Staples |
2.8% |
Health Care |
3.0% |
Energy |
4.1% |
Materials |
5.5% |
Industrials |
8.9% |
Information Technology |
9.4% |
Financials |
19.1% |
Communication Services |
20.2% |
Consumer Discretionary |
22.1% | |
|
| Largest Holdings [Text Block] |
Top Ten Holdings (% of total investments)Footnote Referencea
Table Summary
Tencent Holdings Ltd. |
18.8% |
Alibaba Group Holding Ltd. |
14.4% |
China Construction Bank Corp., Class H |
7.5% |
Zijin Mining Group Co. Ltd., Class H |
4.0% |
Ping An Insurance Group Co. of China Ltd., Class H |
3.2% |
Industrial & Commercial Bank of China Ltd., Class H |
2.8% |
NAURA Technology Group Co. Ltd., Class A |
2.7% |
Wuxi Biologics Cayman, Inc. |
2.4% |
China Shenhua Energy Co. Ltd., Class H |
2.1% |
PetroChina Co. Ltd., Class H |
2.0% |
Total |
59.9% |
| Footnote |
Description |
Footnotea |
Excluding cash equivalents | |
|
| Material Fund Change [Text Block] |
|
|
| Updated Prospectus Phone Number |
1-800-262-1122
|
|
| C000014187 |
|
|
| Shareholder Report [Line Items] |
|
|
| Fund Name |
Eaton Vance China Equity Fund
|
|
| Class Name |
Class C
|
|
| Trading Symbol |
ECCGX
|
|
| Annual or Semi-Annual Statement [Text Block] |
This semi-annual shareholder report contains important information about the Eaton Vance China Equity Fund for the period of September 1, 2025 to February 28, 2026.
|
|
| Additional Information [Text Block] |
You can find additional information about the Fund at www.eatonvance.com/open-end-mutual-fund-documents.php. You can also request this information by contacting us at 1-800-262-1122.
|
|
| Additional Information Phone Number |
1-800-262-1122
|
|
| Additional Information Website |
<span style="box-sizing: border-box; color: rgb(0, 0, 0); display: inline; flex-wrap: nowrap; font-size: 10.6667px; font-weight: 400; grid-area: auto; line-height: 16px; margin: 0px; overflow: visible; text-align: left; text-align-last: auto; white-space-collapse: preserve-breaks;">www.eatonvance.com/open-end-mutual-fund-documents.php</span>
|
|
| Expenses [Text Block] |
What were the Fund costs for the last six months?(based on a hypothetical $10,000 investment)
Table Summary
Class Name |
Costs of a $10,000 investment |
Costs paid as a percentage of a $10,000 investment |
Class C |
$110 |
2.25%Footnote Reference1 |
| Footnote |
Description |
Footnote1 |
Annualized | |
|
| Expenses Paid, Amount |
$ 110
|
|
| Expense Ratio, Percent |
2.25%
|
[2] |
| AssetsNet |
$ 37,486,306
|
|
| Holdings Count | Holding |
69
|
|
| InvestmentCompanyPortfolioTurnover |
25.00%
|
|
| Additional Fund Statistics [Text Block] |
Table Summary
Total Net Assets |
$37,486,306 |
# of Portfolio Holdings |
69 |
Portfolio Turnover Rate |
25% | |
|
| Holdings [Text Block] |
Sector Allocation (% of total investments)
Table Summary
Value |
Value |
Utilities |
1.0% |
Real Estate |
1.4% |
Short-Term Investments |
2.5% |
Consumer Staples |
2.8% |
Health Care |
3.0% |
Energy |
4.1% |
Materials |
5.5% |
Industrials |
8.9% |
Information Technology |
9.4% |
Financials |
19.1% |
Communication Services |
20.2% |
Consumer Discretionary |
22.1% | |
|
| Largest Holdings [Text Block] |
Top Ten Holdings (% of total investments)Footnote Referencea
Table Summary
Tencent Holdings Ltd. |
18.8% |
Alibaba Group Holding Ltd. |
14.4% |
China Construction Bank Corp., Class H |
7.5% |
Zijin Mining Group Co. Ltd., Class H |
4.0% |
Ping An Insurance Group Co. of China Ltd., Class H |
3.2% |
Industrial & Commercial Bank of China Ltd., Class H |
2.8% |
NAURA Technology Group Co. Ltd., Class A |
2.7% |
Wuxi Biologics Cayman, Inc. |
2.4% |
China Shenhua Energy Co. Ltd., Class H |
2.1% |
PetroChina Co. Ltd., Class H |
2.0% |
Total |
59.9% |
| Footnote |
Description |
Footnotea |
Excluding cash equivalents | |
|
| Material Fund Change [Text Block] |
|
|
| Updated Prospectus Phone Number |
1-800-262-1122
|
|
| C000014184 |
|
|
| Shareholder Report [Line Items] |
|
|
| Fund Name |
Eaton Vance China Equity Fund
|
|
| Class Name |
Class I
|
|
| Trading Symbol |
EICGX
|
|
| Annual or Semi-Annual Statement [Text Block] |
This semi-annual shareholder report contains important information about the Eaton Vance China Equity Fund for the period of September 1, 2025 to February 28, 2026.
|
|
| Additional Information [Text Block] |
You can find additional information about the Fund at www.eatonvance.com/open-end-mutual-fund-documents.php. You can also request this information by contacting us at 1-800-262-1122.
|
|
| Additional Information Phone Number |
1-800-262-1122
|
|
| Additional Information Website |
<span style="box-sizing: border-box; color: rgb(0, 0, 0); display: inline; flex-wrap: nowrap; font-size: 10.6667px; font-weight: 400; grid-area: auto; line-height: 16px; margin: 0px; overflow: visible; text-align: left; text-align-last: auto; white-space-collapse: preserve-breaks;">www.eatonvance.com/open-end-mutual-fund-documents.php</span>
|
|
| Expenses [Text Block] |
What were the Fund costs for the last six months?(based on a hypothetical $10,000 investment)
Table Summary
Class Name |
Costs of a $10,000 investment |
Costs paid as a percentage of a $10,000 investment |
Class I |
$61 |
1.25%Footnote Reference1 |
| Footnote |
Description |
Footnote1 |
Annualized | |
|
| Expenses Paid, Amount |
$ 61
|
|
| Expense Ratio, Percent |
1.25%
|
[3] |
| AssetsNet |
$ 37,486,306
|
|
| Holdings Count | Holding |
69
|
|
| InvestmentCompanyPortfolioTurnover |
25.00%
|
|
| Additional Fund Statistics [Text Block] |
Table Summary
Total Net Assets |
$37,486,306 |
# of Portfolio Holdings |
69 |
Portfolio Turnover Rate |
25% | |
|
| Holdings [Text Block] |
Sector Allocation (% of total investments)
Table Summary
Value |
Value |
Utilities |
1.0% |
Real Estate |
1.4% |
Short-Term Investments |
2.5% |
Consumer Staples |
2.8% |
Health Care |
3.0% |
Energy |
4.1% |
Materials |
5.5% |
Industrials |
8.9% |
Information Technology |
9.4% |
Financials |
19.1% |
Communication Services |
20.2% |
Consumer Discretionary |
22.1% | |
|
| Largest Holdings [Text Block] |
Top Ten Holdings (% of total investments)Footnote Referencea
Table Summary
Tencent Holdings Ltd. |
18.8% |
Alibaba Group Holding Ltd. |
14.4% |
China Construction Bank Corp., Class H |
7.5% |
Zijin Mining Group Co. Ltd., Class H |
4.0% |
Ping An Insurance Group Co. of China Ltd., Class H |
3.2% |
Industrial & Commercial Bank of China Ltd., Class H |
2.8% |
NAURA Technology Group Co. Ltd., Class A |
2.7% |
Wuxi Biologics Cayman, Inc. |
2.4% |
China Shenhua Energy Co. Ltd., Class H |
2.1% |
PetroChina Co. Ltd., Class H |
2.0% |
Total |
59.9% |
| Footnote |
Description |
Footnotea |
Excluding cash equivalents | |
|
| Material Fund Change [Text Block] |
|
|
| Updated Prospectus Phone Number |
1-800-262-1122
|
|
| C000104752 |
|
|
| Shareholder Report [Line Items] |
|
|
| Fund Name |
Eaton Vance All Asset Strategy Fund
|
|
| Class Name |
Class A
|
|
| Trading Symbol |
EARAX
|
|
| Annual or Semi-Annual Statement [Text Block] |
This semi-annual shareholder report contains important information about the Eaton Vance All Asset Strategy Fund for the period of September 1, 2025 to February 28, 2026.
|
|
| Additional Information [Text Block] |
You can find additional information about the Fund at www.eatonvance.com/open-end-mutual-fund-documents.php. You can also request this information by contacting us at 1-800-262-1122.
|
|
| Additional Information Phone Number |
1-800-262-1122
|
|
| Additional Information Website |
<span style="box-sizing: border-box; color: rgb(0, 0, 0); display: inline; flex-wrap: nowrap; font-size: 10.6667px; font-weight: 400; grid-area: auto; line-height: 16px; margin: 0px; overflow: visible; text-align: left; text-align-last: auto; white-space-collapse: preserve-breaks;">www.eatonvance.com/open-end-mutual-fund-documents.php</span>
|
|
| Expenses [Text Block] |
What were the Fund costs for the last six months?(based on a hypothetical $10,000 investment)
Table Summary
Class Name |
Costs of a $10,000 investment |
Costs paid as a percentage of a $10,000 investment |
Class A |
$52 |
1.01%Footnote Reference1 |
| Footnote |
Description |
Footnote1 |
Annualized | |
|
| Expenses Paid, Amount |
$ 52
|
|
| Expense Ratio, Percent |
1.01%
|
[4] |
| AssetsNet |
$ 234,161,720
|
|
| Holdings Count | Holding |
255
|
|
| InvestmentCompanyPortfolioTurnover |
50.00%
|
|
| Additional Fund Statistics [Text Block] |
Table Summary
Total Net Assets |
$234,161,720 |
# of Portfolio Holdings |
255 |
Portfolio Turnover Rate |
50% | |
|
| Holdings [Text Block] |
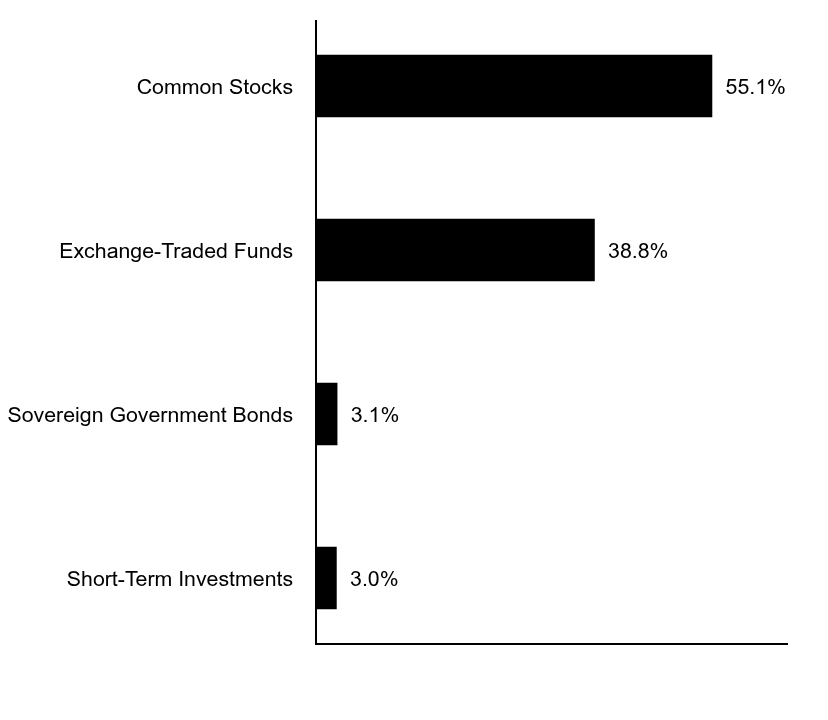
Asset Allocation (% of total investments)
Table Summary
Value |
Value |
Short-Term Investments |
3.0% |
Sovereign Government Bonds |
3.1% |
Exchange-Traded Funds |
38.8% |
Common Stocks |
55.1% | |
|
| Largest Holdings [Text Block] |
Top Ten Holdings (% of total investments)Footnote Referencea
Table Summary
Eaton Vance Mortgage Opportunities ETF |
11.0% |
Eaton Vance Total Return Bond ETF |
10.8% |
iShares Core MSCI Emerging Markets ETF |
4.2% |
Vanguard Emerging Markets Government Bond ETF |
4.1% |
iShares TIPS Bond ETF |
3.5% |
Vanguard Short-Term Treasury ETF |
3.2% |
Brazil Letras do Tesouro Nacional, 0.00%, 1/1/29 |
3.1% |
NVIDIA Corp. |
2.5% |
Apple, Inc. |
2.3% |
Microsoft Corp. |
1.8% |
Total |
46.5% |
| Footnote |
Description |
Footnotea |
Excluding cash equivalents | |
|
| Material Fund Change [Text Block] |
|
|
| Updated Prospectus Phone Number |
1-800-262-1122
|
|
| C000104753 |
|
|
| Shareholder Report [Line Items] |
|
|
| Fund Name |
Eaton Vance All Asset Strategy Fund
|
|
| Class Name |
Class C
|
|
| Trading Symbol |
ECRAX
|
|
| Annual or Semi-Annual Statement [Text Block] |
This semi-annual shareholder report contains important information about the Eaton Vance All Asset Strategy Fund for the period of September 1, 2025 to February 28, 2026.
|
|
| Additional Information [Text Block] |
You can find additional information about the Fund at www.eatonvance.com/open-end-mutual-fund-documents.php. You can also request this information by contacting us at 1-800-262-1122.
|
|
| Additional Information Phone Number |
1-800-262-1122
|
|
| Additional Information Website |
<span style="box-sizing: border-box; color: rgb(0, 0, 0); display: inline; flex-wrap: nowrap; font-size: 10.6667px; font-weight: 400; grid-area: auto; line-height: 16px; margin: 0px; overflow: visible; text-align: left; text-align-last: auto; white-space-collapse: preserve-breaks;">www.eatonvance.com/open-end-mutual-fund-documents.php</span>
|
|
| Expenses [Text Block] |
What were the Fund costs for the last six months?(based on a hypothetical $10,000 investment)
Table Summary
Class Name |
Costs of a $10,000 investment |
Costs paid as a percentage of a $10,000 investment |
Class C |
$91 |
1.76%Footnote Reference1 |
| Footnote |
Description |
Footnote1 |
Annualized | |
|
| Expenses Paid, Amount |
$ 91
|
|
| Expense Ratio, Percent |
1.76%
|
[5] |
| AssetsNet |
$ 234,161,720
|
|
| Holdings Count | Holding |
255
|
|
| InvestmentCompanyPortfolioTurnover |
50.00%
|
|
| Additional Fund Statistics [Text Block] |
Table Summary
Total Net Assets |
$234,161,720 |
# of Portfolio Holdings |
255 |
Portfolio Turnover Rate |
50% | |
|
| Holdings [Text Block] |
Asset Allocation (% of total investments)
Table Summary
Value |
Value |
Short-Term Investments |
3.0% |
Sovereign Government Bonds |
3.1% |
Exchange-Traded Funds |
38.8% |
Common Stocks |
55.1% | |
|
| Largest Holdings [Text Block] |
Top Ten Holdings (% of total investments)Footnote Referencea
Table Summary
Eaton Vance Mortgage Opportunities ETF |
11.0% |
Eaton Vance Total Return Bond ETF |
10.8% |
iShares Core MSCI Emerging Markets ETF |
4.2% |
Vanguard Emerging Markets Government Bond ETF |
4.1% |
iShares TIPS Bond ETF |
3.5% |
Vanguard Short-Term Treasury ETF |
3.2% |
Brazil Letras do Tesouro Nacional, 0.00%, 1/1/29 |
3.1% |
NVIDIA Corp. |
2.5% |
Apple, Inc. |
2.3% |
Microsoft Corp. |
1.8% |
Total |
46.5% |
| Footnote |
Description |
Footnotea |
Excluding cash equivalents | |
|
| Material Fund Change [Text Block] |
|
|
| Updated Prospectus Phone Number |
1-800-262-1122
|
|
| C000104754 |
|
|
| Shareholder Report [Line Items] |
|
|
| Fund Name |
Eaton Vance All Asset Strategy Fund
|
|
| Class Name |
Class I
|
|
| Trading Symbol |
EIRAX
|
|
| Annual or Semi-Annual Statement [Text Block] |
This semi-annual shareholder report contains important information about the Eaton Vance All Asset Strategy Fund for the period of September 1, 2025 to February 28, 2026.
|
|
| Additional Information [Text Block] |
You can find additional information about the Fund at www.eatonvance.com/open-end-mutual-fund-documents.php. You can also request this information by contacting us at 1-800-262-1122.
|
|
| Additional Information Phone Number |
1-800-262-1122
|
|
| Additional Information Website |
<span style="box-sizing: border-box; color: rgb(0, 0, 0); display: inline; flex-wrap: nowrap; font-size: 10.6667px; font-weight: 400; grid-area: auto; line-height: 16px; margin: 0px; overflow: visible; text-align: left; text-align-last: auto; white-space-collapse: preserve-breaks;">www.eatonvance.com/open-end-mutual-fund-documents.php</span>
|
|
| Expenses [Text Block] |
What were the Fund costs for the last six months?(based on a hypothetical $10,000 investment)
Table Summary
Class Name |
Costs of a $10,000 investment |
Costs paid as a percentage of a $10,000 investment |
Class I |
$39 |
0.76%Footnote Reference1 |
| Footnote |
Description |
Footnote1 |
Annualized | |
|
| Expenses Paid, Amount |
$ 39
|
|
| Expense Ratio, Percent |
0.76%
|
[6] |
| AssetsNet |
$ 234,161,720
|
|
| Holdings Count | Holding |
255
|
|
| InvestmentCompanyPortfolioTurnover |
50.00%
|
|
| Additional Fund Statistics [Text Block] |
Table Summary
Total Net Assets |
$234,161,720 |
# of Portfolio Holdings |
255 |
Portfolio Turnover Rate |
50% | |
|
| Holdings [Text Block] |
Asset Allocation (% of total investments)
Table Summary
Value |
Value |
Short-Term Investments |
3.0% |
Sovereign Government Bonds |
3.1% |
Exchange-Traded Funds |
38.8% |
Common Stocks |
55.1% | |
|
| Largest Holdings [Text Block] |
Top Ten Holdings (% of total investments)Footnote Referencea
Table Summary
Eaton Vance Mortgage Opportunities ETF |
11.0% |
Eaton Vance Total Return Bond ETF |
10.8% |
iShares Core MSCI Emerging Markets ETF |
4.2% |
Vanguard Emerging Markets Government Bond ETF |
4.1% |
iShares TIPS Bond ETF |
3.5% |
Vanguard Short-Term Treasury ETF |
3.2% |
Brazil Letras do Tesouro Nacional, 0.00%, 1/1/29 |
3.1% |
NVIDIA Corp. |
2.5% |
Apple, Inc. |
2.3% |
Microsoft Corp. |
1.8% |
Total |
46.5% |
| Footnote |
Description |
Footnotea |
Excluding cash equivalents | |
|
| Material Fund Change [Text Block] |
|
|
| Updated Prospectus Phone Number |
1-800-262-1122
|
|
| C000092730 |
|
|
| Shareholder Report [Line Items] |
|
|
| Fund Name |
Eaton Vance Equity Strategy Fund
|
|
| Class Name |
Class A
|
|
| Trading Symbol |
ERBAX
|
|
| Annual or Semi-Annual Statement [Text Block] |
This semi-annual shareholder report contains important information about the Eaton Vance Equity Strategy Fund for the period of September 1, 2025 to February 28, 2026.
|
|
| Additional Information [Text Block] |
You can find additional information about the Fund at www.eatonvance.com/open-end-mutual-fund-documents.php. You can also request this information by contacting us at 1-800-262-1122.
|
|
| Additional Information Phone Number |
1-800-262-1122
|
|
| Additional Information Website |
<span style="box-sizing: border-box; color: rgb(0, 0, 0); display: inline; flex-wrap: nowrap; font-size: 10.6667px; font-weight: 400; grid-area: auto; line-height: 16px; margin: 0px; overflow: visible; text-align: left; text-align-last: auto; white-space-collapse: preserve-breaks;">www.eatonvance.com/open-end-mutual-fund-documents.php</span>
|
|
| Expenses [Text Block] |
What were the Fund costs for the last six months?(based on a hypothetical $10,000 investment)
Table Summary
Class Name |
Costs of a $10,000 investment |
Costs paid as a percentage of a $10,000 investment |
Class A |
$58 |
1.10%Footnote Reference1 |
| Footnote |
Description |
Footnote1 |
Annualized | |
|
| Expenses Paid, Amount |
$ 58
|
|
| Expense Ratio, Percent |
1.10%
|
[7] |
| AssetsNet |
$ 575,932,910
|
|
| Holdings Count | Holding |
252
|
|
| InvestmentCompanyPortfolioTurnover |
109.00%
|
|
| Additional Fund Statistics [Text Block] |
Table Summary
Total Net Assets |
$575,932,910 |
# of Portfolio Holdings |
252 |
Portfolio Turnover Rate |
109% | |
|
| Holdings [Text Block] |
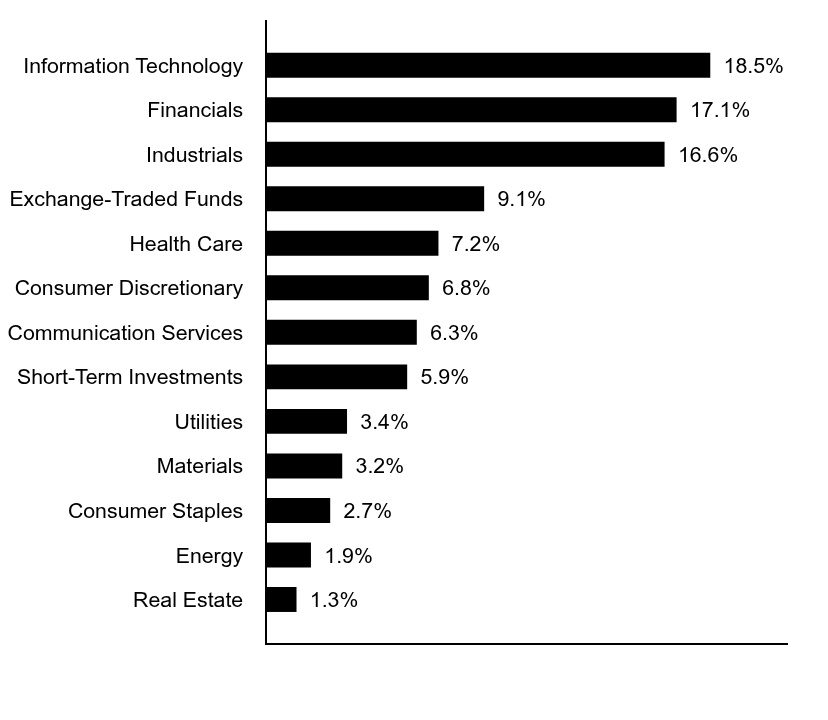
Sector Allocation (% of total investments)
Table Summary
Value |
Value |
Real Estate |
1.3% |
Energy |
1.9% |
Consumer Staples |
2.7% |
Materials |
3.2% |
Utilities |
3.4% |
Short-Term Investments |
5.9% |
Communication Services |
6.3% |
Consumer Discretionary |
6.8% |
Health Care |
7.2% |
Exchange-Traded Funds |
9.1% |
Industrials |
16.6% |
Financials |
17.1% |
Information Technology |
18.5% | |
|
| Largest Holdings [Text Block] |
Top Ten Holdings (% of total investments)Footnote Referencea
Table Summary
iShares Core MSCI Emerging Markets ETF |
5.1% |
NVIDIA Corp. |
4.0% |
Apple, Inc. |
3.6% |
Microsoft Corp. |
2.8% |
Amazon.com, Inc. |
2.0% |
Alphabet, Inc., Class A |
1.9% |
iShares MSCI Brazil ETF |
1.8% |
Meta Platforms, Inc., Class A |
1.5% |
Broadcom, Inc. |
1.5% |
iShares MSCI Taiwan ETF |
1.2% |
Total |
25.4% |
| Footnote |
Description |
Footnotea |
Excluding cash equivalents | |
|
| Material Fund Change [Text Block] |
|
|
| Updated Prospectus Phone Number |
1-800-262-1122
|
|
| C000092731 |
|
|
| Shareholder Report [Line Items] |
|
|
| Fund Name |
Eaton Vance Equity Strategy Fund
|
|
| Class Name |
Class C
|
|
| Trading Symbol |
ERBCX
|
|
| Annual or Semi-Annual Statement [Text Block] |
This semi-annual shareholder report contains important information about the Eaton Vance Equity Strategy Fund for the period of September 1, 2025 to February 28, 2026.
|
|
| Additional Information [Text Block] |
You can find additional information about the Fund at www.eatonvance.com/open-end-mutual-fund-documents.php. You can also request this information by contacting us at 1-800-262-1122.
|
|
| Additional Information Phone Number |
1-800-262-1122
|
|
| Additional Information Website |
<span style="box-sizing: border-box; color: rgb(0, 0, 0); display: inline; flex-wrap: nowrap; font-size: 10.6667px; font-weight: 400; grid-area: auto; line-height: 16px; margin: 0px; overflow: visible; text-align: left; text-align-last: auto; white-space-collapse: preserve-breaks;">www.eatonvance.com/open-end-mutual-fund-documents.php</span>
|
|
| Expenses [Text Block] |
What were the Fund costs for the last six months?(based on a hypothetical $10,000 investment)
Table Summary
Class Name |
Costs of a $10,000 investment |
Costs paid as a percentage of a $10,000 investment |
Class C |
$97 |
1.85%Footnote Reference1 |
| Footnote |
Description |
Footnote1 |
Annualized | |
|
| Expenses Paid, Amount |
$ 97
|
|
| Expense Ratio, Percent |
1.85%
|
[8] |
| AssetsNet |
$ 575,932,910
|
|
| Holdings Count | Holding |
252
|
|
| InvestmentCompanyPortfolioTurnover |
109.00%
|
|
| Additional Fund Statistics [Text Block] |
Table Summary
Total Net Assets |
$575,932,910 |
# of Portfolio Holdings |
252 |
Portfolio Turnover Rate |
109% | |
|
| Holdings [Text Block] |
Sector Allocation (% of total investments)
Table Summary
Value |
Value |
Real Estate |
1.3% |
Energy |
1.9% |
Consumer Staples |
2.7% |
Materials |
3.2% |
Utilities |
3.4% |
Short-Term Investments |
5.9% |
Communication Services |
6.3% |
Consumer Discretionary |
6.8% |
Health Care |
7.2% |
Exchange-Traded Funds |
9.1% |
Industrials |
16.6% |
Financials |
17.1% |
Information Technology |
18.5% | |
|
| Largest Holdings [Text Block] |
Top Ten Holdings (% of total investments)Footnote Referencea
Table Summary
iShares Core MSCI Emerging Markets ETF |
5.1% |
NVIDIA Corp. |
4.0% |
Apple, Inc. |
3.6% |
Microsoft Corp. |
2.8% |
Amazon.com, Inc. |
2.0% |
Alphabet, Inc., Class A |
1.9% |
iShares MSCI Brazil ETF |
1.8% |
Meta Platforms, Inc., Class A |
1.5% |
Broadcom, Inc. |
1.5% |
iShares MSCI Taiwan ETF |
1.2% |
Total |
25.4% |
| Footnote |
Description |
Footnotea |
Excluding cash equivalents | |
|
| Material Fund Change [Text Block] |
|
|
| Updated Prospectus Phone Number |
1-800-262-1122
|
|
| C000092732 |
|
|
| Shareholder Report [Line Items] |
|
|
| Fund Name |
Eaton Vance Equity Strategy Fund
|
|
| Class Name |
Class I
|
|
| Trading Symbol |
ERBIX
|
|
| Annual or Semi-Annual Statement [Text Block] |
This semi-annual shareholder report contains important information about the Eaton Vance Equity Strategy Fund for the period of September 1, 2025 to February 28, 2026.
|
|
| Additional Information [Text Block] |
You can find additional information about the Fund at www.eatonvance.com/open-end-mutual-fund-documents.php. You can also request this information by contacting us at 1-800-262-1122.
|
|
| Additional Information Phone Number |
1-800-262-1122
|
|
| Additional Information Website |
<span style="box-sizing: border-box; color: rgb(0, 0, 0); display: inline; flex-wrap: nowrap; font-size: 10.6667px; font-weight: 400; grid-area: auto; line-height: 16px; margin: 0px; overflow: visible; text-align: left; text-align-last: auto; white-space-collapse: preserve-breaks;">www.eatonvance.com/open-end-mutual-fund-documents.php</span>
|
|
| Expenses [Text Block] |
What were the Fund costs for the last six months?(based on a hypothetical $10,000 investment)
Table Summary
Class Name |
Costs of a $10,000 investment |
Costs paid as a percentage of a $10,000 investment |
Class I |
$45 |
0.85%Footnote Reference1 |
| Footnote |
Description |
Footnote1 |
Annualized | |
|
| Expenses Paid, Amount |
$ 45
|
|
| Expense Ratio, Percent |
0.85%
|
[9] |
| AssetsNet |
$ 575,932,910
|
|
| Holdings Count | Holding |
252
|
|
| InvestmentCompanyPortfolioTurnover |
109.00%
|
|
| Additional Fund Statistics [Text Block] |
Table Summary
Total Net Assets |
$575,932,910 |
# of Portfolio Holdings |
252 |
Portfolio Turnover Rate |
109% | |
|
| Holdings [Text Block] |
Sector Allocation (% of total investments)
Table Summary
Value |
Value |
Real Estate |
1.3% |
Energy |
1.9% |
Consumer Staples |
2.7% |
Materials |
3.2% |
Utilities |
3.4% |
Short-Term Investments |
5.9% |
Communication Services |
6.3% |
Consumer Discretionary |
6.8% |
Health Care |
7.2% |
Exchange-Traded Funds |
9.1% |
Industrials |
16.6% |
Financials |
17.1% |
Information Technology |
18.5% | |
|
| Largest Holdings [Text Block] |
Top Ten Holdings (% of total investments)Footnote Referencea
Table Summary
iShares Core MSCI Emerging Markets ETF |
5.1% |
NVIDIA Corp. |
4.0% |
Apple, Inc. |
3.6% |
Microsoft Corp. |
2.8% |
Amazon.com, Inc. |
2.0% |
Alphabet, Inc., Class A |
1.9% |
iShares MSCI Brazil ETF |
1.8% |
Meta Platforms, Inc., Class A |
1.5% |
Broadcom, Inc. |
1.5% |
iShares MSCI Taiwan ETF |
1.2% |
Total |
25.4% |
| Footnote |
Description |
Footnotea |
Excluding cash equivalents | |
|
| Material Fund Change [Text Block] |
|
|
| Updated Prospectus Phone Number |
1-800-262-1122
|
|
| C000014191 |
|
|
| Shareholder Report [Line Items] |
|
|
| Fund Name |
Eaton Vance Worldwide Health Sciences Fund
|
|
| Class Name |
Class A
|
|
| Trading Symbol |
ETHSX
|
|
| Annual or Semi-Annual Statement [Text Block] |
This semi-annual shareholder report contains important information about the Eaton Vance Worldwide Health Sciences Fund for the period of September 1, 2025 to February 28, 2026.
|
|
| Additional Information [Text Block] |
You can find additional information about the Fund at www.eatonvance.com/open-end-mutual-fund-documents.php. You can also request this information by contacting us at 1-800-262-1122.
|
|
| Additional Information Phone Number |
1-800-262-1122
|
|
| Additional Information Website |
<span style="box-sizing: border-box; color: rgb(0, 0, 0); display: inline; flex-wrap: nowrap; font-size: 10.6667px; font-weight: 400; grid-area: auto; line-height: 16px; margin: 0px; overflow: visible; text-align: left; text-align-last: auto; white-space-collapse: preserve-breaks;">www.eatonvance.com/open-end-mutual-fund-documents.php</span>
|
|
| Expenses [Text Block] |
What were the Fund costs for the last six months?(based on a hypothetical $10,000 investment)
Table Summary
Class Name |
Costs of a $10,000 investment |
Costs paid as a percentage of a $10,000 investment |
Class A |
$61 |
1.15%Footnote Reference1 |
| Footnote |
Description |
Footnote1 |
Annualized | |
|
| Expenses Paid, Amount |
$ 61
|
|
| Expense Ratio, Percent |
1.15%
|
[10] |
| AssetsNet |
$ 857,110,223
|
|
| Holdings Count | Holding |
45
|
|
| InvestmentCompanyPortfolioTurnover |
16.00%
|
|
| Additional Fund Statistics [Text Block] |
Table Summary
Total Net Assets |
$857,110,223 |
# of Portfolio Holdings |
45 |
Portfolio Turnover Rate |
16% | |
|
| Holdings [Text Block] |
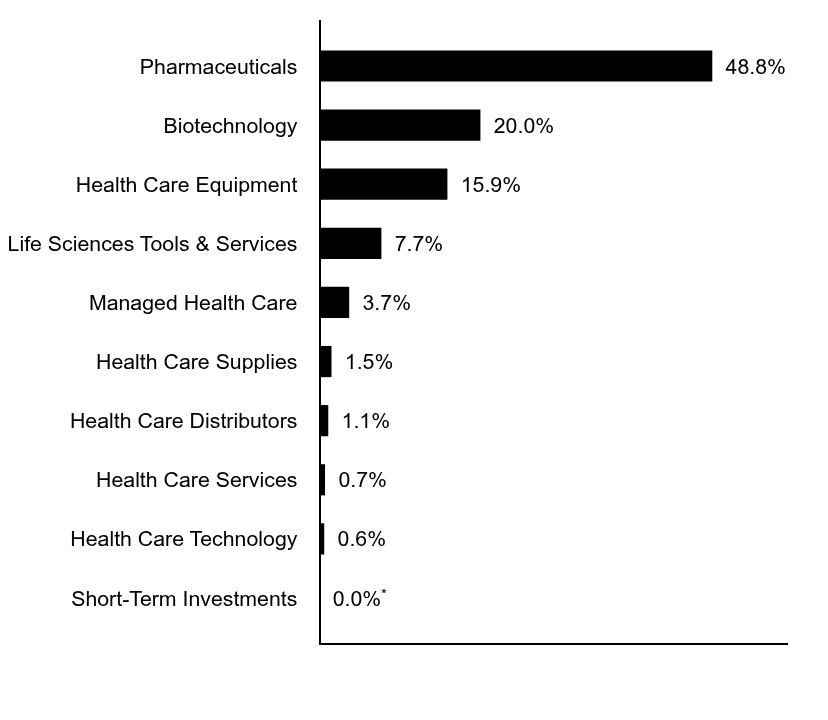
Sector Allocation (% of total investments)
Table Summary
Value |
Value |
Short-Term Investments |
0.0%Footnote Reference* |
Health Care Technology |
0.6% |
Health Care Services |
0.7% |
Health Care Distributors |
1.1% |
Health Care Supplies |
1.5% |
Managed Health Care |
3.7% |
Life Sciences Tools & Services |
7.7% |
Health Care Equipment |
15.9% |
Biotechnology |
20.0% |
Pharmaceuticals |
48.8% |
| Footnote |
Description |
Footnote* |
Amount is less than 0.05% | |
|
| Largest Holdings [Text Block] |
Top Ten Holdings (% of total investments)Footnote Referencea
Table Summary
Eli Lilly & Co. |
11.3% |
AbbVie, Inc. |
6.7% |
AstraZeneca PLC |
6.5% |
Johnson & Johnson |
6.3% |
Roche Holding AG PC |
5.8% |
Merck & Co., Inc. |
4.4% |
Bristol-Myers Squibb Co. |
4.1% |
UnitedHealth Group, Inc. |
3.7% |
Vertex Pharmaceuticals, Inc. |
3.5% |
Gilead Sciences, Inc. |
3.3% |
Total |
55.6% |
| Footnote |
Description |
Footnotea |
Excluding cash equivalents | |
|
| Material Fund Change [Text Block] |
|
|
| Updated Prospectus Phone Number |
1-800-262-1122
|
|
| C000014193 |
|
|
| Shareholder Report [Line Items] |
|
|
| Fund Name |
Eaton Vance Worldwide Health Sciences Fund
|
|
| Class Name |
Class C
|
|
| Trading Symbol |
ECHSX
|
|
| Annual or Semi-Annual Statement [Text Block] |
This semi-annual shareholder report contains important information about the Eaton Vance Worldwide Health Sciences Fund for the period of September 1, 2025 to February 28, 2026.
|
|
| Additional Information [Text Block] |
You can find additional information about the Fund at www.eatonvance.com/open-end-mutual-fund-documents.php. You can also request this information by contacting us at 1-800-262-1122.
|
|
| Additional Information Phone Number |
1-800-262-1122
|
|
| Additional Information Website |
<span style="box-sizing: border-box; color: rgb(0, 0, 0); display: inline; flex-wrap: nowrap; font-size: 10.6667px; font-weight: 400; grid-area: auto; line-height: 16px; margin: 0px; overflow: visible; text-align: left; text-align-last: auto; white-space-collapse: preserve-breaks;">www.eatonvance.com/open-end-mutual-fund-documents.php</span>
|
|
| Expenses [Text Block] |
What were the Fund costs for the last six months?(based on a hypothetical $10,000 investment)
Table Summary
Class Name |
Costs of a $10,000 investment |
Costs paid as a percentage of a $10,000 investment |
Class C |
$100 |
1.90%Footnote Reference1 |
| Footnote |
Description |
Footnote1 |
Annualized | |
|
| Expenses Paid, Amount |
$ 100
|
|
| Expense Ratio, Percent |
1.90%
|
[11] |
| AssetsNet |
$ 857,110,223
|
|
| Holdings Count | Holding |
45
|
|
| InvestmentCompanyPortfolioTurnover |
16.00%
|
|
| Additional Fund Statistics [Text Block] |
Table Summary
Total Net Assets |
$857,110,223 |
# of Portfolio Holdings |
45 |
Portfolio Turnover Rate |
16% | |
|
| Holdings [Text Block] |
Sector Allocation (% of total investments)
Table Summary
Value |
Value |
Short-Term Investments |
0.0%Footnote Reference* |
Health Care Technology |
0.6% |
Health Care Services |
0.7% |
Health Care Distributors |
1.1% |
Health Care Supplies |
1.5% |
Managed Health Care |
3.7% |
Life Sciences Tools & Services |
7.7% |
Health Care Equipment |
15.9% |
Biotechnology |
20.0% |
Pharmaceuticals |
48.8% |
| Footnote |
Description |
Footnote* |
Amount is less than 0.05% | |
|
| Largest Holdings [Text Block] |
Top Ten Holdings (% of total investments)Footnote Referencea
Table Summary
Eli Lilly & Co. |
11.3% |
AbbVie, Inc. |
6.7% |
AstraZeneca PLC |
6.5% |
Johnson & Johnson |
6.3% |
Roche Holding AG PC |
5.8% |
Merck & Co., Inc. |
4.4% |
Bristol-Myers Squibb Co. |
4.1% |
UnitedHealth Group, Inc. |
3.7% |
Vertex Pharmaceuticals, Inc. |
3.5% |
Gilead Sciences, Inc. |
3.3% |
Total |
55.6% |
| Footnote |
Description |
Footnotea |
Excluding cash equivalents | |
|
| Material Fund Change [Text Block] |
|
|
| Updated Prospectus Phone Number |
1-800-262-1122
|
|
| C000081646 |
|
|
| Shareholder Report [Line Items] |
|
|
| Fund Name |
Eaton Vance Worldwide Health Sciences Fund
|
|
| Class Name |
Class I
|
|
| Trading Symbol |
EIHSX
|
|
| Annual or Semi-Annual Statement [Text Block] |
This semi-annual shareholder report contains important information about the Eaton Vance Worldwide Health Sciences Fund for the period of September 1, 2025 to February 28, 2026.
|
|
| Additional Information [Text Block] |
You can find additional information about the Fund at www.eatonvance.com/open-end-mutual-fund-documents.php. You can also request this information by contacting us at 1-800-262-1122.
|
|
| Additional Information Phone Number |
1-800-262-1122
|
|
| Additional Information Website |
<span style="box-sizing: border-box; color: rgb(0, 0, 0); display: inline; flex-wrap: nowrap; font-size: 10.6667px; font-weight: 400; grid-area: auto; line-height: 16px; margin: 0px; overflow: visible; text-align: left; text-align-last: auto; white-space-collapse: preserve-breaks;">www.eatonvance.com/open-end-mutual-fund-documents.php</span>
|
|
| Expenses [Text Block] |
What were the Fund costs for the last six months?(based on a hypothetical $10,000 investment)
Table Summary
Class Name |
Costs of a $10,000 investment |
Costs paid as a percentage of a $10,000 investment |
Class I |
$47 |
0.90%Footnote Reference1 |
| Footnote |
Description |
Footnote1 |
Annualized | |
|
| Expenses Paid, Amount |
$ 47
|
|
| Expense Ratio, Percent |
0.90%
|
[12] |
| AssetsNet |
$ 857,110,223
|
|
| Holdings Count | Holding |
45
|
|
| InvestmentCompanyPortfolioTurnover |
16.00%
|
|
| Additional Fund Statistics [Text Block] |
Table Summary
Total Net Assets |
$857,110,223 |
# of Portfolio Holdings |
45 |
Portfolio Turnover Rate |
16% | |
|
| Holdings [Text Block] |
Sector Allocation (% of total investments)
Table Summary
Value |
Value |
Short-Term Investments |
0.0%Footnote Reference* |
Health Care Technology |
0.6% |
Health Care Services |
0.7% |
Health Care Distributors |
1.1% |
Health Care Supplies |
1.5% |
Managed Health Care |
3.7% |
Life Sciences Tools & Services |
7.7% |
Health Care Equipment |
15.9% |
Biotechnology |
20.0% |
Pharmaceuticals |
48.8% |
| Footnote |
Description |
Footnote* |
Amount is less than 0.05% | |
|
| Largest Holdings [Text Block] |
Top Ten Holdings (% of total investments)Footnote Referencea
Table Summary
Eli Lilly & Co. |
11.3% |
AbbVie, Inc. |
6.7% |
AstraZeneca PLC |
6.5% |
Johnson & Johnson |
6.3% |
Roche Holding AG PC |
5.8% |
Merck & Co., Inc. |
4.4% |
Bristol-Myers Squibb Co. |
4.1% |
UnitedHealth Group, Inc. |
3.7% |
Vertex Pharmaceuticals, Inc. |
3.5% |
Gilead Sciences, Inc. |
3.3% |
Total |
55.6% |
| Footnote |
Description |
Footnotea |
Excluding cash equivalents | |
|
| Material Fund Change [Text Block] |
|
|
| Updated Prospectus Phone Number |
1-800-262-1122
|
|
| C000014194 |
|
|
| Shareholder Report [Line Items] |
|
|
| Fund Name |
Eaton Vance Worldwide Health Sciences Fund
|
|
| Class Name |
Class R
|
|
| Trading Symbol |
ERHSX
|
|
| Annual or Semi-Annual Statement [Text Block] |
This semi-annual shareholder report contains important information about the Eaton Vance Worldwide Health Sciences Fund for the period of September 1, 2025 to February 28, 2026.
|
|
| Additional Information [Text Block] |
You can find additional information about the Fund at www.eatonvance.com/open-end-mutual-fund-documents.php. You can also request this information by contacting us at 1-800-262-1122.
|
|
| Additional Information Phone Number |
1-800-262-1122
|
|
| Additional Information Website |
<span style="box-sizing: border-box; color: rgb(0, 0, 0); display: inline; flex-wrap: nowrap; font-size: 10.6667px; font-weight: 400; grid-area: auto; line-height: 16px; margin: 0px; overflow: visible; text-align: left; text-align-last: auto; white-space-collapse: preserve-breaks;">www.eatonvance.com/open-end-mutual-fund-documents.php</span>
|
|
| Expenses [Text Block] |
What were the Fund costs for the last six months?(based on a hypothetical $10,000 investment)
Table Summary
Class Name |
Costs of a $10,000 investment |
Costs paid as a percentage of a $10,000 investment |
Class R |
$74 |
1.40%Footnote Reference1 |
| Footnote |
Description |
Footnote1 |
Annualized | |
|
| Expenses Paid, Amount |
$ 74
|
|
| Expense Ratio, Percent |
1.40%
|
[13] |
| AssetsNet |
$ 857,110,223
|
|
| Holdings Count | Holding |
45
|
|
| InvestmentCompanyPortfolioTurnover |
16.00%
|
|
| Additional Fund Statistics [Text Block] |
Table Summary
Total Net Assets |
$857,110,223 |
# of Portfolio Holdings |
45 |
Portfolio Turnover Rate |
16% | |
|
| Holdings [Text Block] |
Sector Allocation (% of total investments)
Table Summary
Value |
Value |
Short-Term Investments |
0.0%Footnote Reference* |
Health Care Technology |
0.6% |
Health Care Services |
0.7% |
Health Care Distributors |
1.1% |
Health Care Supplies |
1.5% |
Managed Health Care |
3.7% |
Life Sciences Tools & Services |
7.7% |
Health Care Equipment |
15.9% |
Biotechnology |
20.0% |
Pharmaceuticals |
48.8% |
| Footnote |
Description |
Footnote* |
Amount is less than 0.05% | |
|
| Largest Holdings [Text Block] |
Top Ten Holdings (% of total investments)Footnote Referencea
Table Summary
Eli Lilly & Co. |
11.3% |
AbbVie, Inc. |
6.7% |
AstraZeneca PLC |
6.5% |
Johnson & Johnson |
6.3% |
Roche Holding AG PC |
5.8% |
Merck & Co., Inc. |
4.4% |
Bristol-Myers Squibb Co. |
4.1% |
UnitedHealth Group, Inc. |
3.7% |
Vertex Pharmaceuticals, Inc. |
3.5% |
Gilead Sciences, Inc. |
3.3% |
Total |
55.6% |
| Footnote |
Description |
Footnotea |
Excluding cash equivalents | |
|
| Material Fund Change [Text Block] |
|
|
| Updated Prospectus Phone Number |
1-800-262-1122
|
|
|
|