UNITED STATES
SECURITIES AND EXCHANGE COMMISSION
Washington, D.C. 20549
Form N-CSR
CERTIFIED SHAREHOLDER REPORT OF REGISTERED
MANAGEMENT INVESTMENT COMPANIES
Investment Company Act File Number: 811-01241
Eaton Vance Growth Trust
(Exact Name of Registrant as Specified in Charter)
One Post Office Square, Boston, Massachusetts 02109
(Address of Principal Executive Offices)
Deidre E. Walsh
One Post Office Square, Boston, Massachusetts 02109
(Name and Address of Agent for Services)
(617) 482-8260
(Registrant’s Telephone Number)
August 31
Date of Fiscal Year End
February 28, 2026
Date of Reporting Period
Item 1. Reports to Stockholders
(a)
Eaton Vance China Equity Fund
Class A EVCGX
What were the Fund costs for the last six months?
(based on a hypothetical $10,000 investment)
Class Name |
Costs of a $10,000 investment |
Costs paid as a percentage of a $10,000 investment |
|---|---|---|
Class A |
$ |
| Footnote | Description |
Footnote1 |
Key Fund Statistics
Total Net Assets |
$ |
|---|---|
# of Portfolio Holdings |
|
Portfolio Turnover Rate |
What did the Fund invest in?
The following tables reflect what the Fund invested in as of the report date.
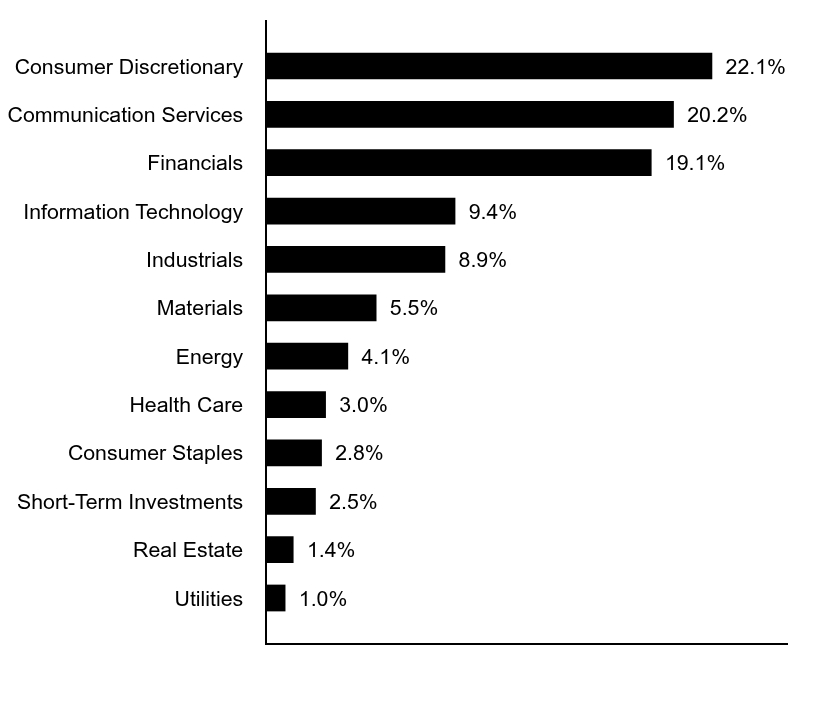
Sector Allocation (% of total investments)
Value |
Value |
|---|---|
Utilities |
|
Real Estate |
|
Short-Term Investments |
|
Consumer Staples |
|
Health Care |
|
Energy |
|
Materials |
|
Industrials |
|
Information Technology |
|
Financials |
|
Communication Services |
|
Consumer Discretionary |
Top Ten Holdings (% of total investments)Footnote Referencea
Tencent Holdings Ltd. |
|
|---|---|
Alibaba Group Holding Ltd. |
|
China Construction Bank Corp., Class H |
|
Zijin Mining Group Co. Ltd., Class H |
|
Ping An Insurance Group Co. of China Ltd., Class H |
|
Industrial & Commercial Bank of China Ltd., Class H |
|
NAURA Technology Group Co. Ltd., Class A |
|
Wuxi Biologics Cayman, Inc. |
|
China Shenhua Energy Co. Ltd., Class H |
|
PetroChina Co. Ltd., Class H |
|
Total |
| Footnote | Description |
Footnotea |
Excluding cash equivalents |
Additional Information

If you wish to view additional information about the Fund, including the prospectus, statement of additional information, financial statements and holdings, please scan the QR code or visit www.eatonvance.com/open-end-mutual-fund-documents.php. For proxy information, please visit www.eatonvance.com/proxyvoting.
Householding
The Funds may deliver a single copy of certain required shareholder documents (including prospectuses, shareholder reports, and proxy materials) to investors with the same last name and the same address. Your participation will continue indefinitely unless you instruct otherwise by calling
Not FDIC Insured | May Lose Value | No Bank Guarantee
Semi-Annual Shareholder Report February 28, 2026
EVCGX-TSR-SAR
Eaton Vance China Equity Fund
Class C ECCGX
What were the Fund costs for the last six months?
(based on a hypothetical $10,000 investment)
Class Name |
Costs of a $10,000 investment |
Costs paid as a percentage of a $10,000 investment |
|---|---|---|
Class C |
$ |
| Footnote | Description |
Footnote1 |
Key Fund Statistics
Total Net Assets |
$ |
|---|---|
# of Portfolio Holdings |
|
Portfolio Turnover Rate |
What did the Fund invest in?
The following tables reflect what the Fund invested in as of the report date.
Sector Allocation (% of total investments)
Value |
Value |
|---|---|
Utilities |
|
Real Estate |
|
Short-Term Investments |
|
Consumer Staples |
|
Health Care |
|
Energy |
|
Materials |
|
Industrials |
|
Information Technology |
|
Financials |
|
Communication Services |
|
Consumer Discretionary |
Top Ten Holdings (% of total investments)Footnote Referencea
Tencent Holdings Ltd. |
|
|---|---|
Alibaba Group Holding Ltd. |
|
China Construction Bank Corp., Class H |
|
Zijin Mining Group Co. Ltd., Class H |
|
Ping An Insurance Group Co. of China Ltd., Class H |
|
Industrial & Commercial Bank of China Ltd., Class H |
|
NAURA Technology Group Co. Ltd., Class A |
|
Wuxi Biologics Cayman, Inc. |
|
China Shenhua Energy Co. Ltd., Class H |
|
PetroChina Co. Ltd., Class H |
|
Total |
| Footnote | Description |
Footnotea |
Excluding cash equivalents |
Additional Information
If you wish to view additional information about the Fund, including the prospectus, statement of additional information, financial statements and holdings, please scan the QR code or visit www.eatonvance.com/open-end-mutual-fund-documents.php. For proxy information, please visit www.eatonvance.com/proxyvoting.
Householding
The Funds may deliver a single copy of certain required shareholder documents (including prospectuses, shareholder reports, and proxy materials) to investors with the same last name and the same address. Your participation will continue indefinitely unless you instruct otherwise by calling
Not FDIC Insured | May Lose Value | No Bank Guarantee
Semi-Annual Shareholder Report February 28, 2026
ECCGX-TSR-SAR
Eaton Vance China Equity Fund
Class I EICGX
What were the Fund costs for the last six months?
(based on a hypothetical $10,000 investment)
Class Name |
Costs of a $10,000 investment |
Costs paid as a percentage of a $10,000 investment |
|---|---|---|
Class I |
$ |
| Footnote | Description |
Footnote1 |
Key Fund Statistics
Total Net Assets |
$ |
|---|---|
# of Portfolio Holdings |
|
Portfolio Turnover Rate |
What did the Fund invest in?
The following tables reflect what the Fund invested in as of the report date.
Sector Allocation (% of total investments)
Value |
Value |
|---|---|
Utilities |
|
Real Estate |
|
Short-Term Investments |
|
Consumer Staples |
|
Health Care |
|
Energy |
|
Materials |
|
Industrials |
|
Information Technology |
|
Financials |
|
Communication Services |
|
Consumer Discretionary |
Top Ten Holdings (% of total investments)Footnote Referencea
Tencent Holdings Ltd. |
|
|---|---|
Alibaba Group Holding Ltd. |
|
China Construction Bank Corp., Class H |
|
Zijin Mining Group Co. Ltd., Class H |
|
Ping An Insurance Group Co. of China Ltd., Class H |
|
Industrial & Commercial Bank of China Ltd., Class H |
|
NAURA Technology Group Co. Ltd., Class A |
|
Wuxi Biologics Cayman, Inc. |
|
China Shenhua Energy Co. Ltd., Class H |
|
PetroChina Co. Ltd., Class H |
|
Total |
| Footnote | Description |
Footnotea |
Excluding cash equivalents |
Additional Information
If you wish to view additional information about the Fund, including the prospectus, statement of additional information, financial statements and holdings, please scan the QR code or visit www.eatonvance.com/open-end-mutual-fund-documents.php. For proxy information, please visit www.eatonvance.com/proxyvoting.
Householding
The Funds may deliver a single copy of certain required shareholder documents (including prospectuses, shareholder reports, and proxy materials) to investors with the same last name and the same address. Your participation will continue indefinitely unless you instruct otherwise by calling
Not FDIC Insured | May Lose Value | No Bank Guarantee
Semi-Annual Shareholder Report February 28, 2026
EICGX-TSR-SAR
Eaton Vance All Asset Strategy Fund
Class A EARAX
What were the Fund costs for the last six months?
(based on a hypothetical $10,000 investment)
Class Name |
Costs of a $10,000 investment |
Costs paid as a percentage of a $10,000 investment |
|---|---|---|
Class A |
$ |
| Footnote | Description |
Footnote1 |
Key Fund Statistics
Total Net Assets |
$ |
|---|---|
# of Portfolio Holdings |
|
Portfolio Turnover Rate |
What did the Fund invest in?
The following tables reflect what the Fund invested in as of the report date.
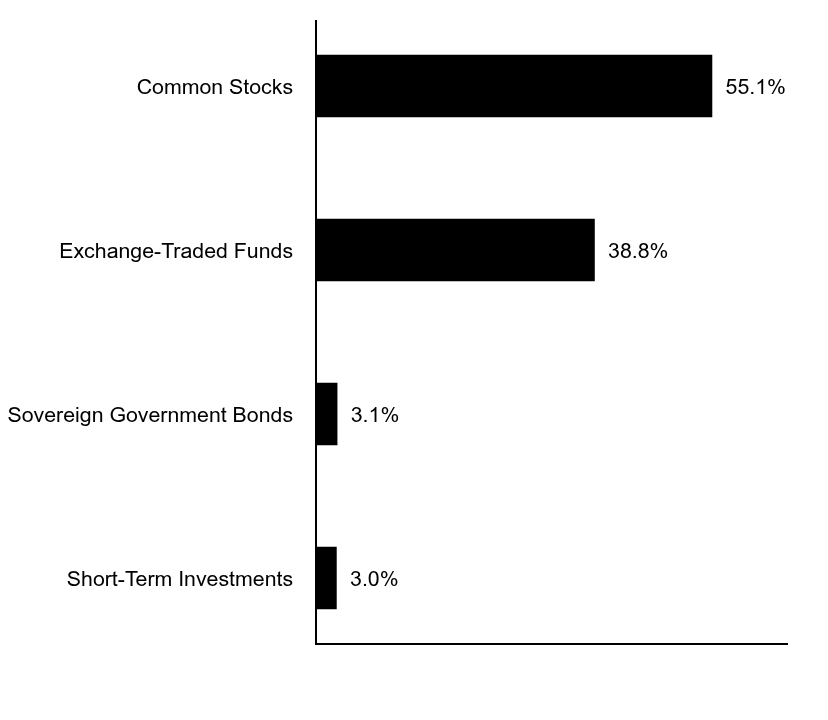
Asset Allocation (% of total investments)
Value |
Value |
|---|---|
Short-Term Investments |
|
Sovereign Government Bonds |
|
Exchange-Traded Funds |
|
Common Stocks |
Top Ten Holdings (% of total investments)Footnote Referencea
Eaton Vance Mortgage Opportunities ETF |
|
|---|---|
Eaton Vance Total Return Bond ETF |
|
iShares Core MSCI Emerging Markets ETF |
|
Vanguard Emerging Markets Government Bond ETF |
|
iShares TIPS Bond ETF |
|
Vanguard Short-Term Treasury ETF |
|
Brazil Letras do Tesouro Nacional, 0.00%, 1/1/29 |
|
NVIDIA Corp. |
|
Apple, Inc. |
|
Microsoft Corp. |
|
Total |
| Footnote | Description |
Footnotea |
Excluding cash equivalents |
Additional Information
If you wish to view additional information about the Fund, including the prospectus, statement of additional information, financial statements and holdings, please scan the QR code or visit www.eatonvance.com/open-end-mutual-fund-documents.php. For proxy information, please visit www.eatonvance.com/proxyvoting.
Householding
The Funds may deliver a single copy of certain required shareholder documents (including prospectuses, shareholder reports, and proxy materials) to investors with the same last name and the same address. Your participation will continue indefinitely unless you instruct otherwise by calling
Not FDIC Insured | May Lose Value | No Bank Guarantee
Semi-Annual Shareholder Report February 28, 2026
EARAX-TSR-SAR
Eaton Vance All Asset Strategy Fund
Class C ECRAX
What were the Fund costs for the last six months?
(based on a hypothetical $10,000 investment)
Class Name |
Costs of a $10,000 investment |
Costs paid as a percentage of a $10,000 investment |
|---|---|---|
Class C |
$ |
| Footnote | Description |
Footnote1 |
Key Fund Statistics
Total Net Assets |
$ |
|---|---|
# of Portfolio Holdings |
|
Portfolio Turnover Rate |
What did the Fund invest in?
The following tables reflect what the Fund invested in as of the report date.
Asset Allocation (% of total investments)
Value |
Value |
|---|---|
Short-Term Investments |
|
Sovereign Government Bonds |
|
Exchange-Traded Funds |
|
Common Stocks |
Top Ten Holdings (% of total investments)Footnote Referencea
Eaton Vance Mortgage Opportunities ETF |
|
|---|---|
Eaton Vance Total Return Bond ETF |
|
iShares Core MSCI Emerging Markets ETF |
|
Vanguard Emerging Markets Government Bond ETF |
|
iShares TIPS Bond ETF |
|
Vanguard Short-Term Treasury ETF |
|
Brazil Letras do Tesouro Nacional, 0.00%, 1/1/29 |
|
NVIDIA Corp. |
|
Apple, Inc. |
|
Microsoft Corp. |
|
Total |
| Footnote | Description |
Footnotea |
Excluding cash equivalents |
Additional Information
If you wish to view additional information about the Fund, including the prospectus, statement of additional information, financial statements and holdings, please scan the QR code or visit www.eatonvance.com/open-end-mutual-fund-documents.php. For proxy information, please visit www.eatonvance.com/proxyvoting.
Householding
The Funds may deliver a single copy of certain required shareholder documents (including prospectuses, shareholder reports, and proxy materials) to investors with the same last name and the same address. Your participation will continue indefinitely unless you instruct otherwise by calling
Not FDIC Insured | May Lose Value | No Bank Guarantee
Semi-Annual Shareholder Report February 28, 2026
ECRAX-TSR-SAR
Eaton Vance All Asset Strategy Fund
Class I EIRAX
What were the Fund costs for the last six months?
(based on a hypothetical $10,000 investment)
Class Name |
Costs of a $10,000 investment |
Costs paid as a percentage of a $10,000 investment |
|---|---|---|
Class I |
$ |
| Footnote | Description |
Footnote1 |
Key Fund Statistics
Total Net Assets |
$ |
|---|---|
# of Portfolio Holdings |
|
Portfolio Turnover Rate |
What did the Fund invest in?
The following tables reflect what the Fund invested in as of the report date.
Asset Allocation (% of total investments)
Value |
Value |
|---|---|
Short-Term Investments |
|
Sovereign Government Bonds |
|
Exchange-Traded Funds |
|
Common Stocks |
Top Ten Holdings (% of total investments)Footnote Referencea
Eaton Vance Mortgage Opportunities ETF |
|
|---|---|
Eaton Vance Total Return Bond ETF |
|
iShares Core MSCI Emerging Markets ETF |
|
Vanguard Emerging Markets Government Bond ETF |
|
iShares TIPS Bond ETF |
|
Vanguard Short-Term Treasury ETF |
|
Brazil Letras do Tesouro Nacional, 0.00%, 1/1/29 |
|
NVIDIA Corp. |
|
Apple, Inc. |
|
Microsoft Corp. |
|
Total |
| Footnote | Description |
Footnotea |
Excluding cash equivalents |
Additional Information
If you wish to view additional information about the Fund, including the prospectus, statement of additional information, financial statements and holdings, please scan the QR code or visit www.eatonvance.com/open-end-mutual-fund-documents.php. For proxy information, please visit www.eatonvance.com/proxyvoting.
Householding
The Funds may deliver a single copy of certain required shareholder documents (including prospectuses, shareholder reports, and proxy materials) to investors with the same last name and the same address. Your participation will continue indefinitely unless you instruct otherwise by calling
Not FDIC Insured | May Lose Value | No Bank Guarantee
Semi-Annual Shareholder Report February 28, 2026
EIRAX-TSR-SAR
Eaton Vance Equity Strategy Fund
Class A ERBAX
What were the Fund costs for the last six months?
(based on a hypothetical $10,000 investment)
Class Name |
Costs of a $10,000 investment |
Costs paid as a percentage of a $10,000 investment |
|---|---|---|
Class A |
$ |
| Footnote | Description |
Footnote1 |
Key Fund Statistics
Total Net Assets |
$ |
|---|---|
# of Portfolio Holdings |
|
Portfolio Turnover Rate |
What did the Fund invest in?
The following tables reflect what the Fund invested in as of the report date.
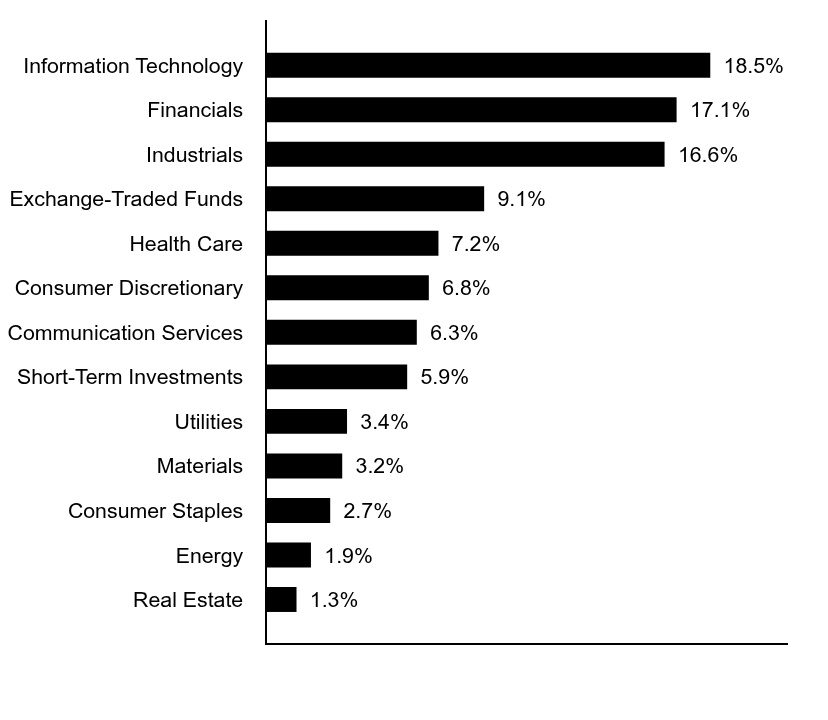
Sector Allocation (% of total investments)
Value |
Value |
|---|---|
Real Estate |
|
Energy |
|
Consumer Staples |
|
Materials |
|
Utilities |
|
Short-Term Investments |
|
Communication Services |
|
Consumer Discretionary |
|
Health Care |
|
Exchange-Traded Funds |
|
Industrials |
|
Financials |
|
Information Technology |
Top Ten Holdings (% of total investments)Footnote Referencea
iShares Core MSCI Emerging Markets ETF |
|
|---|---|
NVIDIA Corp. |
|
Apple, Inc. |
|
Microsoft Corp. |
|
Amazon.com, Inc. |
|
Alphabet, Inc., Class A |
|
iShares MSCI Brazil ETF |
|
Meta Platforms, Inc., Class A |
|
Broadcom, Inc. |
|
iShares MSCI Taiwan ETF |
|
Total |
| Footnote | Description |
Footnotea |
Excluding cash equivalents |
Additional Information
If you wish to view additional information about the Fund, including the prospectus, statement of additional information, financial statements and holdings, please scan the QR code or visit www.eatonvance.com/open-end-mutual-fund-documents.php. For proxy information, please visit www.eatonvance.com/proxyvoting.
Householding
The Funds may deliver a single copy of certain required shareholder documents (including prospectuses, shareholder reports, and proxy materials) to investors with the same last name and the same address. Your participation will continue indefinitely unless you instruct otherwise by calling
Not FDIC Insured | May Lose Value | No Bank Guarantee
Semi-Annual Shareholder Report February 28, 2026
ERBAX-TSR-SAR
Eaton Vance Equity Strategy Fund
Class C ERBCX
What were the Fund costs for the last six months?
(based on a hypothetical $10,000 investment)
Class Name |
Costs of a $10,000 investment |
Costs paid as a percentage of a $10,000 investment |
|---|---|---|
Class C |
$ |
| Footnote | Description |
Footnote1 |
Key Fund Statistics
Total Net Assets |
$ |
|---|---|
# of Portfolio Holdings |
|
Portfolio Turnover Rate |
What did the Fund invest in?
The following tables reflect what the Fund invested in as of the report date.
Sector Allocation (% of total investments)
Value |
Value |
|---|---|
Real Estate |
|
Energy |
|
Consumer Staples |
|
Materials |
|
Utilities |
|
Short-Term Investments |
|
Communication Services |
|
Consumer Discretionary |
|
Health Care |
|
Exchange-Traded Funds |
|
Industrials |
|
Financials |
|
Information Technology |
Top Ten Holdings (% of total investments)Footnote Referencea
iShares Core MSCI Emerging Markets ETF |
|
|---|---|
NVIDIA Corp. |
|
Apple, Inc. |
|
Microsoft Corp. |
|
Amazon.com, Inc. |
|
Alphabet, Inc., Class A |
|
iShares MSCI Brazil ETF |
|
Meta Platforms, Inc., Class A |
|
Broadcom, Inc. |
|
iShares MSCI Taiwan ETF |
|
Total |
| Footnote | Description |
Footnotea |
Excluding cash equivalents |
Additional Information
If you wish to view additional information about the Fund, including the prospectus, statement of additional information, financial statements and holdings, please scan the QR code or visit www.eatonvance.com/open-end-mutual-fund-documents.php. For proxy information, please visit www.eatonvance.com/proxyvoting.
Householding
The Funds may deliver a single copy of certain required shareholder documents (including prospectuses, shareholder reports, and proxy materials) to investors with the same last name and the same address. Your participation will continue indefinitely unless you instruct otherwise by calling
Not FDIC Insured | May Lose Value | No Bank Guarantee
Semi-Annual Shareholder Report February 28, 2026
ERBCX-TSR-SAR
Eaton Vance Equity Strategy Fund
Class I ERBIX
What were the Fund costs for the last six months?
(based on a hypothetical $10,000 investment)
Class Name |
Costs of a $10,000 investment |
Costs paid as a percentage of a $10,000 investment |
|---|---|---|
Class I |
$ |
| Footnote | Description |
Footnote1 |
Key Fund Statistics
Total Net Assets |
$ |
|---|---|
# of Portfolio Holdings |
|
Portfolio Turnover Rate |
What did the Fund invest in?
The following tables reflect what the Fund invested in as of the report date.
Sector Allocation (% of total investments)
Value |
Value |
|---|---|
Real Estate |
|
Energy |
|
Consumer Staples |
|
Materials |
|
Utilities |
|
Short-Term Investments |
|
Communication Services |
|
Consumer Discretionary |
|
Health Care |
|
Exchange-Traded Funds |
|
Industrials |
|
Financials |
|
Information Technology |
Top Ten Holdings (% of total investments)Footnote Referencea
iShares Core MSCI Emerging Markets ETF |
|
|---|---|
NVIDIA Corp. |
|
Apple, Inc. |
|
Microsoft Corp. |
|
Amazon.com, Inc. |
|
Alphabet, Inc., Class A |
|
iShares MSCI Brazil ETF |
|
Meta Platforms, Inc., Class A |
|
Broadcom, Inc. |
|
iShares MSCI Taiwan ETF |
|
Total |
| Footnote | Description |
Footnotea |
Excluding cash equivalents |
Additional Information
If you wish to view additional information about the Fund, including the prospectus, statement of additional information, financial statements and holdings, please scan the QR code or visit www.eatonvance.com/open-end-mutual-fund-documents.php. For proxy information, please visit www.eatonvance.com/proxyvoting.
Householding
The Funds may deliver a single copy of certain required shareholder documents (including prospectuses, shareholder reports, and proxy materials) to investors with the same last name and the same address. Your participation will continue indefinitely unless you instruct otherwise by calling
Not FDIC Insured | May Lose Value | No Bank Guarantee
Semi-Annual Shareholder Report February 28, 2026
ERBIX-TSR-SAR
Eaton Vance Worldwide Health Sciences Fund
Class A ETHSX
What were the Fund costs for the last six months?
(based on a hypothetical $10,000 investment)
Class Name |
Costs of a $10,000 investment |
Costs paid as a percentage of a $10,000 investment |
|---|---|---|
Class A |
$ |
| Footnote | Description |
Footnote1 |
Key Fund Statistics
Total Net Assets |
$ |
|---|---|
# of Portfolio Holdings |
|
Portfolio Turnover Rate |
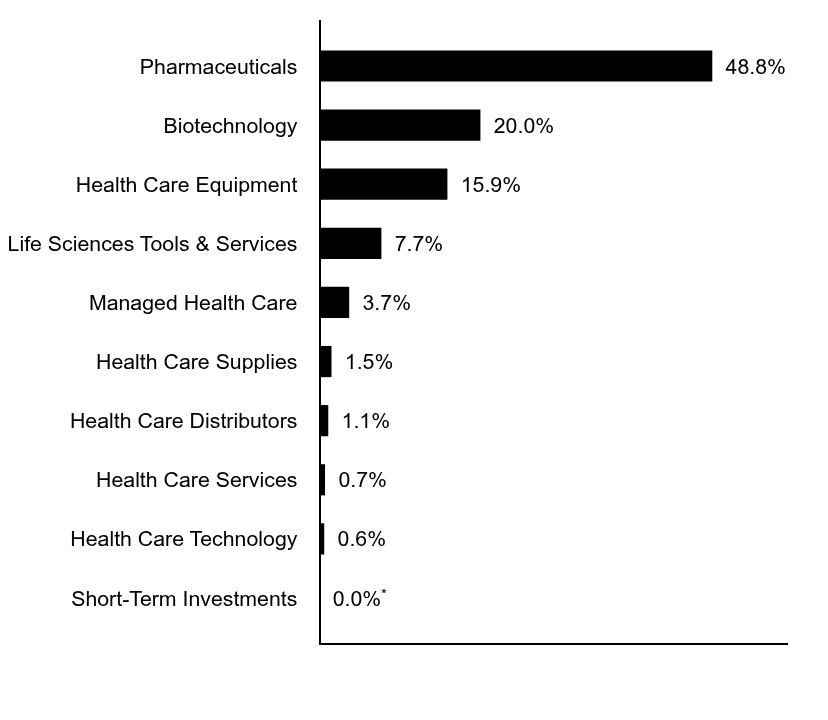
What did the Fund invest in?
The following tables reflect what the Fund invested in as of the report date.
Sector Allocation (% of total investments)
Value |
Value |
|---|---|
Short-Term Investments |
|
Health Care Technology |
|
Health Care Services |
|
Health Care Distributors |
|
Health Care Supplies |
|
Managed Health Care |
|
Life Sciences Tools & Services |
|
Health Care Equipment |
|
Biotechnology |
|
Pharmaceuticals |
| Footnote | Description |
Footnote* |
Top Ten Holdings (% of total investments)Footnote Referencea
Eli Lilly & Co. |
|
|---|---|
AbbVie, Inc. |
|
AstraZeneca PLC |
|
Johnson & Johnson |
|
Roche Holding AG PC |
|
Merck & Co., Inc. |
|
Bristol-Myers Squibb Co. |
|
UnitedHealth Group, Inc. |
|
Vertex Pharmaceuticals, Inc. |
|
Gilead Sciences, Inc. |
|
Total |
| Footnote | Description |
Footnotea |
Excluding cash equivalents |
Additional Information
If you wish to view additional information about the Fund, including the prospectus, statement of additional information, financial statements and holdings, please scan the QR code or visit www.eatonvance.com/open-end-mutual-fund-documents.php. For proxy information, please visit www.eatonvance.com/proxyvoting.
Householding
The Funds may deliver a single copy of certain required shareholder documents (including prospectuses, shareholder reports, and proxy materials) to investors with the same last name and the same address. Your participation will continue indefinitely unless you instruct otherwise by calling
Not FDIC Insured | May Lose Value | No Bank Guarantee
Semi-Annual Shareholder Report February 28, 2026
ETHSX-TSR-SAR
Eaton Vance Worldwide Health Sciences Fund
Class C ECHSX
What were the Fund costs for the last six months?
(based on a hypothetical $10,000 investment)
Class Name |
Costs of a $10,000 investment |
Costs paid as a percentage of a $10,000 investment |
|---|---|---|
Class C |
$ |
| Footnote | Description |
Footnote1 |
Key Fund Statistics
Total Net Assets |
$ |
|---|---|
# of Portfolio Holdings |
|
Portfolio Turnover Rate |
What did the Fund invest in?
The following tables reflect what the Fund invested in as of the report date.
Sector Allocation (% of total investments)
Value |
Value |
|---|---|
Short-Term Investments |
|
Health Care Technology |
|
Health Care Services |
|
Health Care Distributors |
|
Health Care Supplies |
|
Managed Health Care |
|
Life Sciences Tools & Services |
|
Health Care Equipment |
|
Biotechnology |
|
Pharmaceuticals |
| Footnote | Description |
Footnote* |
Top Ten Holdings (% of total investments)Footnote Referencea
Eli Lilly & Co. |
|
|---|---|
AbbVie, Inc. |
|
AstraZeneca PLC |
|
Johnson & Johnson |
|
Roche Holding AG PC |
|
Merck & Co., Inc. |
|
Bristol-Myers Squibb Co. |
|
UnitedHealth Group, Inc. |
|
Vertex Pharmaceuticals, Inc. |
|
Gilead Sciences, Inc. |
|
Total |
| Footnote | Description |
Footnotea |
Excluding cash equivalents |
Additional Information
If you wish to view additional information about the Fund, including the prospectus, statement of additional information, financial statements and holdings, please scan the QR code or visit www.eatonvance.com/open-end-mutual-fund-documents.php. For proxy information, please visit www.eatonvance.com/proxyvoting.
Householding
The Funds may deliver a single copy of certain required shareholder documents (including prospectuses, shareholder reports, and proxy materials) to investors with the same last name and the same address. Your participation will continue indefinitely unless you instruct otherwise by calling
Not FDIC Insured | May Lose Value | No Bank Guarantee
Semi-Annual Shareholder Report February 28, 2026
ECHSX-TSR-SAR
Eaton Vance Worldwide Health Sciences Fund
Class I EIHSX
What were the Fund costs for the last six months?
(based on a hypothetical $10,000 investment)
Class Name |
Costs of a $10,000 investment |
Costs paid as a percentage of a $10,000 investment |
|---|---|---|
Class I |
$ |
| Footnote | Description |
Footnote1 |
Key Fund Statistics
Total Net Assets |
$ |
|---|---|
# of Portfolio Holdings |
|
Portfolio Turnover Rate |
What did the Fund invest in?
The following tables reflect what the Fund invested in as of the report date.
Sector Allocation (% of total investments)
Value |
Value |
|---|---|
Short-Term Investments |
|
Health Care Technology |
|
Health Care Services |
|
Health Care Distributors |
|
Health Care Supplies |
|
Managed Health Care |
|
Life Sciences Tools & Services |
|
Health Care Equipment |
|
Biotechnology |
|
Pharmaceuticals |
| Footnote | Description |
Footnote* |
Top Ten Holdings (% of total investments)Footnote Referencea
Eli Lilly & Co. |
|
|---|---|
AbbVie, Inc. |
|
AstraZeneca PLC |
|
Johnson & Johnson |
|
Roche Holding AG PC |
|
Merck & Co., Inc. |
|
Bristol-Myers Squibb Co. |
|
UnitedHealth Group, Inc. |
|
Vertex Pharmaceuticals, Inc. |
|
Gilead Sciences, Inc. |
|
Total |
| Footnote | Description |
Footnotea |
Excluding cash equivalents |
Additional Information
If you wish to view additional information about the Fund, including the prospectus, statement of additional information, financial statements and holdings, please scan the QR code or visit www.eatonvance.com/open-end-mutual-fund-documents.php. For proxy information, please visit www.eatonvance.com/proxyvoting.
Householding
The Funds may deliver a single copy of certain required shareholder documents (including prospectuses, shareholder reports, and proxy materials) to investors with the same last name and the same address. Your participation will continue indefinitely unless you instruct otherwise by calling
Not FDIC Insured | May Lose Value | No Bank Guarantee
Semi-Annual Shareholder Report February 28, 2026
EIHSX-TSR-SAR
Eaton Vance Worldwide Health Sciences Fund
Class R ERHSX
What were the Fund costs for the last six months?
(based on a hypothetical $10,000 investment)
Class Name |
Costs of a $10,000 investment |
Costs paid as a percentage of a $10,000 investment |
|---|---|---|
Class R |
$ |
| Footnote | Description |
Footnote1 |
Key Fund Statistics
Total Net Assets |
$ |
|---|---|
# of Portfolio Holdings |
|
Portfolio Turnover Rate |
What did the Fund invest in?
The following tables reflect what the Fund invested in as of the report date.
Sector Allocation (% of total investments)
Value |
Value |
|---|---|
Short-Term Investments |
|
Health Care Technology |
|
Health Care Services |
|
Health Care Distributors |
|
Health Care Supplies |
|
Managed Health Care |
|
Life Sciences Tools & Services |
|
Health Care Equipment |
|
Biotechnology |
|
Pharmaceuticals |
| Footnote | Description |
Footnote* |
Top Ten Holdings (% of total investments)Footnote Referencea
Eli Lilly & Co. |
|
|---|---|
AbbVie, Inc. |
|
AstraZeneca PLC |
|
Johnson & Johnson |
|
Roche Holding AG PC |
|
Merck & Co., Inc. |
|
Bristol-Myers Squibb Co. |
|
UnitedHealth Group, Inc. |
|
Vertex Pharmaceuticals, Inc. |
|
Gilead Sciences, Inc. |
|
Total |
| Footnote | Description |
Footnotea |
Excluding cash equivalents |
Additional Information
If you wish to view additional information about the Fund, including the prospectus, statement of additional information, financial statements and holdings, please scan the QR code or visit www.eatonvance.com/open-end-mutual-fund-documents.php. For proxy information, please visit www.eatonvance.com/proxyvoting.
Householding
The Funds may deliver a single copy of certain required shareholder documents (including prospectuses, shareholder reports, and proxy materials) to investors with the same last name and the same address. Your participation will continue indefinitely unless you instruct otherwise by calling
Not FDIC Insured | May Lose Value | No Bank Guarantee
Semi-Annual Shareholder Report February 28, 2026
ERHSX-TSR-SAR