UNITED STATES
SECURITIES AND EXCHANGE COMMISSION
Washington, D.C. 20549
Form N-CSR
CERTIFIED SHAREHOLDER REPORT OF REGISTERED
MANAGEMENT INVESTMENT COMPANIES
Investment Company Act File Number: 811-01241
Eaton Vance Growth Trust
(Exact Name of Registrant as Specified in Charter)
One Post Office Square, Boston, Massachusetts 02109
(Address of Principal Executive Offices)
Deidre E. Walsh
One Post Office Square, Boston, Massachusetts 02109
(Name and Address of Agent for Services)
(617) 482-8260
(Registrant’s Telephone Number)
February 28
Date of Fiscal Year End
February 28, 2026
Date of Reporting Period
Item 1. Reports to Stockholders
(a)
Eaton Vance Focused Growth Opportunities Fund

Class A EAFGX
What were the Fund costs for the last year?
(based on a hypothetical $10,000 investment)
Class Name |
Costs of a $10,000 investment |
Costs paid as a percentage of a $10,000 investment |
|---|---|---|
Class A |
$ |
How did the Fund perform last year and what affected its performance?
Key contributors to (↑) and detractors from (↓) performance, relative to the Russell 1000® Growth Index (the Index):
↓ An overweight position in Shift4 Payments, Inc. detracted amid Global Blue integration concerns, leadership change and valuation pressure. The position was sold by the end of the period
↓ An overweight position in Nutanix, Inc. hurt returns as the stock underperformed due to missing revenue estimates and lowered guidance. The position was sold by the end of the period
↓ An overweight position in Gartner, Inc. lost value as government spending cuts and rising artificial intelligence (AI) alternatives challenged future growth expectations. The position was sold by the end of the period
↓ Among sectors, stock selection in financials, industrials, health care and real estate hurt returns the most
↑ An overweight position in Lam Research Corp. helped returns as the stock benefitted from surging demand for semiconductor equipment tied to the AI boom
↑ An overweight position in Broadcom Inc. rose in value on AI chip demand and strong earnings
↑ An underweight position in Visa, Inc. helped as the stock underperformed due to margin concerns and future competition worries
↑ Among sectors, stock selection in consumer staples and consumer discretionary, as well as underweights to consumer discretionary and financials helped returns
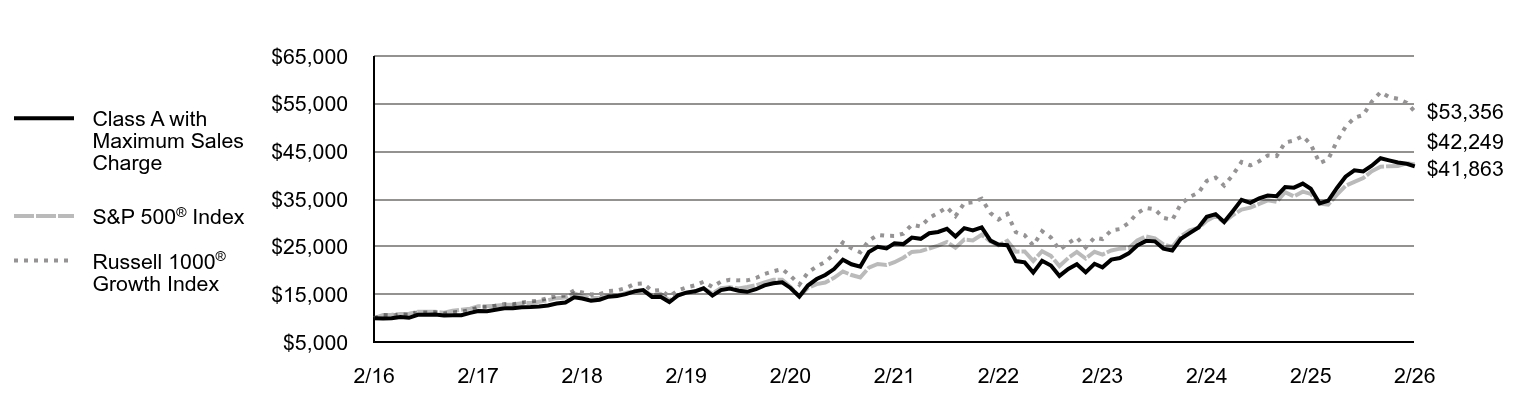
Fund Performance
Comparison of the change in value of a $10,000 investment for the period indicated.
2/16 |
$ |
$ |
$ |
|---|---|---|---|
3/16 |
$ |
$ |
$ |
4/16 |
$ |
$ |
$ |
5/16 |
$ |
$ |
$ |
6/16 |
$ |
$ |
$ |
7/16 |
$ |
$ |
$ |
8/16 |
$ |
$ |
$ |
9/16 |
$ |
$ |
$ |
10/16 |
$ |
$ |
$ |
11/16 |
$ |
$ |
$ |
12/16 |
$ |
$ |
$ |
1/17 |
$ |
$ |
$ |
2/17 |
$ |
$ |
$ |
3/17 |
$ |
$ |
$ |
4/17 |
$ |
$ |
$ |
5/17 |
$ |
$ |
$ |
6/17 |
$ |
$ |
$ |
7/17 |
$ |
$ |
$ |
8/17 |
$ |
$ |
$ |
9/17 |
$ |
$ |
$ |
10/17 |
$ |
$ |
$ |
11/17 |
$ |
$ |
$ |
12/17 |
$ |
$ |
$ |
1/18 |
$ |
$ |
$ |
2/18 |
$ |
$ |
$ |
3/18 |
$ |
$ |
$ |
4/18 |
$ |
$ |
$ |
5/18 |
$ |
$ |
$ |
6/18 |
$ |
$ |
$ |
7/18 |
$ |
$ |
$ |
8/18 |
$ |
$ |
$ |
9/18 |
$ |
$ |
$ |
10/18 |
$ |
$ |
$ |
11/18 |
$ |
$ |
$ |
12/18 |
$ |
$ |
$ |
1/19 |
$ |
$ |
$ |
2/19 |
$ |
$ |
$ |
3/19 |
$ |
$ |
$ |
4/19 |
$ |
$ |
$ |
5/19 |
$ |
$ |
$ |
6/19 |
$ |
$ |
$ |
7/19 |
$ |
$ |
$ |
8/19 |
$ |
$ |
$ |
9/19 |
$ |
$ |
$ |
10/19 |
$ |
$ |
$ |
11/19 |
$ |
$ |
$ |
12/19 |
$ |
$ |
$ |
1/20 |
$ |
$ |
$ |
2/20 |
$ |
$ |
$ |
3/20 |
$ |
$ |
$ |
4/20 |
$ |
$ |
$ |
5/20 |
$ |
$ |
$ |
6/20 |
$ |
$ |
$ |
7/20 |
$ |
$ |
$ |
8/20 |
$ |
$ |
$ |
9/20 |
$ |
$ |
$ |
10/20 |
$ |
$ |
$ |
11/20 |
$ |
$ |
$ |
12/20 |
$ |
$ |
$ |
1/21 |
$ |
$ |
$ |
2/21 |
$ |
$ |
$ |
3/21 |
$ |
$ |
$ |
4/21 |
$ |
$ |
$ |
5/21 |
$ |
$ |
$ |
6/21 |
$ |
$ |
$ |
7/21 |
$ |
$ |
$ |
8/21 |
$ |
$ |
$ |
9/21 |
$ |
$ |
$ |
10/21 |
$ |
$ |
$ |
11/21 |
$ |
$ |
$ |
12/21 |
$ |
$ |
$ |
1/22 |
$ |
$ |
$ |
2/22 |
$ |
$ |
$ |
3/22 |
$ |
$ |
$ |
4/22 |
$ |
$ |
$ |
5/22 |
$ |
$ |
$ |
6/22 |
$ |
$ |
$ |
7/22 |
$ |
$ |
$ |
8/22 |
$ |
$ |
$ |
9/22 |
$ |
$ |
$ |
10/22 |
$ |
$ |
$ |
11/22 |
$ |
$ |
$ |
12/22 |
$ |
$ |
$ |
1/23 |
$ |
$ |
$ |
2/23 |
$ |
$ |
$ |
3/23 |
$ |
$ |
$ |
4/23 |
$ |
$ |
$ |
5/23 |
$ |
$ |
$ |
6/23 |
$ |
$ |
$ |
7/23 |
$ |
$ |
$ |
8/23 |
$ |
$ |
$ |
9/23 |
$ |
$ |
$ |
10/23 |
$ |
$ |
$ |
11/23 |
$ |
$ |
$ |
12/23 |
$ |
$ |
$ |
1/24 |
$ |
$ |
$ |
2/24 |
$ |
$ |
$ |
3/24 |
$ |
$ |
$ |
4/24 |
$ |
$ |
$ |
5/24 |
$ |
$ |
$ |
6/24 |
$ |
$ |
$ |
7/24 |
$ |
$ |
$ |
8/24 |
$ |
$ |
$ |
9/24 |
$ |
$ |
$ |
10/24 |
$ |
$ |
$ |
11/24 |
$ |
$ |
$ |
12/24 |
$ |
$ |
$ |
1/25 |
$ |
$ |
$ |
2/25 |
$ |
$ |
$ |
3/25 |
$ |
$ |
$ |
4/25 |
$ |
$ |
$ |
5/25 |
$ |
$ |
$ |
6/25 |
$ |
$ |
$ |
7/25 |
$ |
$ |
$ |
8/25 |
$ |
$ |
$ |
9/25 |
$ |
$ |
$ |
10/25 |
$ |
$ |
$ |
11/25 |
$ |
$ |
$ |
12/25 |
$ |
$ |
$ |
1/26 |
$ |
$ |
$ |
2/26 |
$ |
$ |
$ |
Average Annual Total Returns (%)
Fund |
1 Year |
5 Years |
10 Years |
|---|---|---|---|
Class A |
|||
Class A with 5.25% Maximum Sales Charge |
|||
S&P 500® Index |
|||
Russell 1000® Growth Index |
Key Fund Statistics
Total Net Assets |
$ |
|---|---|
# of Portfolio Holdings |
|
Portfolio Turnover Rate |
|
Total Advisory Fees Paid |
$ |
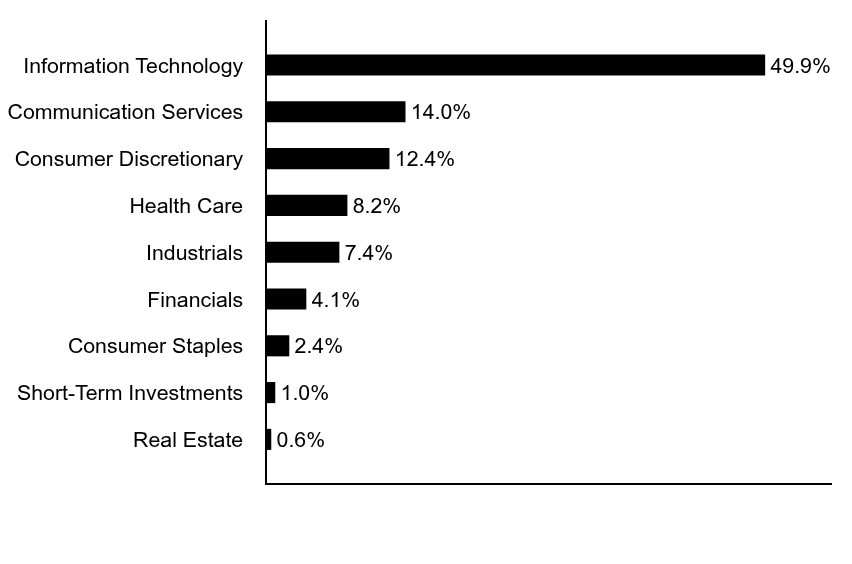
What did the Fund invest in?
The following tables reflect what the Fund invested in as of the report date.
Sector Allocation (% of total investments)
Value |
Value |
|---|---|
Real Estate |
|
Short-Term Investments |
|
Consumer Staples |
|
Financials |
|
Industrials |
|
Health Care |
|
Consumer Discretionary |
|
Communication Services |
|
Information Technology |
Top Ten Holdings (% of total investments)Footnote Referencea
NVIDIA Corp. |
|
|---|---|
Microsoft Corp. |
|
Apple, Inc. |
|
Amazon.com, Inc. |
|
Broadcom, Inc. |
|
Alphabet, Inc., Class C |
|
Meta Platforms, Inc., Class A |
|
Eli Lilly & Co. |
|
Netflix, Inc. |
|
Lam Research Corp. |
|
Total |
| Footnote | Description |
Footnotea |
Excluding cash equivalents |
Additional Information

If you wish to view additional information about the Fund, including the prospectus, statement of additional information, financial statements and holdings, please scan the QR code or visit www.eatonvance.com/open-end-mutual-fund-documents.php. For proxy information, please visit www.eatonvance.com/proxyvoting.
Householding
The Funds may deliver a single copy of certain required shareholder documents (including prospectuses, shareholder reports, and proxy materials) to investors with the same last name and the same address. Your participation will continue indefinitely unless you instruct otherwise by calling
Not FDIC Insured | May Lose Value | No Bank Guarantee
Annual Shareholder Report February 28, 2026
EAFGX-TSR-AR
Eaton Vance Focused Growth Opportunities Fund
Class C ECFGX
What were the Fund costs for the last year?
(based on a hypothetical $10,000 investment)
Class Name |
Costs of a $10,000 investment |
Costs paid as a percentage of a $10,000 investment |
|---|---|---|
Class C |
$ |
How did the Fund perform last year and what affected its performance?
Key contributors to (↑) and detractors from (↓) performance, relative to the Russell 1000® Growth Index (the Index):
↓ An overweight position in Shift4 Payments, Inc. detracted amid Global Blue integration concerns, leadership change and valuation pressure. The position was sold by the end of the period
↓ An overweight position in Nutanix, Inc. hurt returns as the stock underperformed due to missing revenue estimates and lowered guidance. The position was sold by the end of the period
↓ An overweight position in Gartner, Inc. lost value as government spending cuts and rising artificial intelligence (AI) alternatives challenged future growth expectations. The position was sold by the end of the period
↓ Among sectors, stock selection in financials, industrials, health care and real estate hurt returns the most
↑ An overweight position in Lam Research Corp. helped returns as the stock benefitted from surging demand for semiconductor equipment tied to the AI boom
↑ An overweight position in Broadcom Inc. rose in value on AI chip demand and strong earnings
↑ An underweight position in Visa, Inc. helped as the stock underperformed due to margin concerns and future competition worries
↑ Among sectors, stock selection in consumer staples and consumer discretionary, as well as underweights to consumer discretionary and financials helped returns
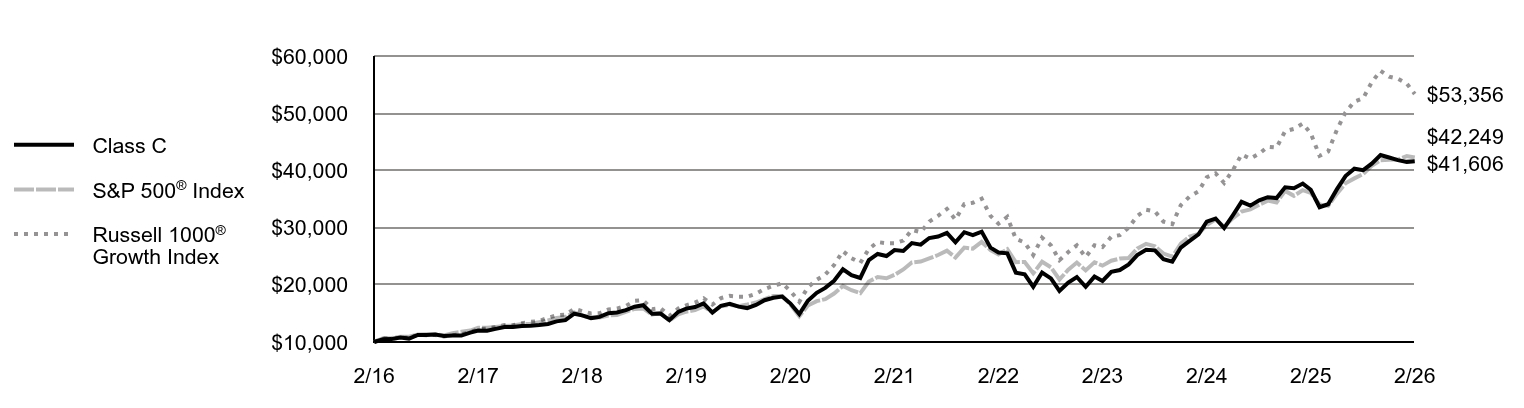
Fund Performance
Comparison of the change in value of a $10,000 investment for the period indicated.
2/16 |
$ |
$ |
$ |
|---|---|---|---|
3/16 |
$ |
$ |
$ |
4/16 |
$ |
$ |
$ |
5/16 |
$ |
$ |
$ |
6/16 |
$ |
$ |
$ |
7/16 |
$ |
$ |
$ |
8/16 |
$ |
$ |
$ |
9/16 |
$ |
$ |
$ |
10/16 |
$ |
$ |
$ |
11/16 |
$ |
$ |
$ |
12/16 |
$ |
$ |
$ |
1/17 |
$ |
$ |
$ |
2/17 |
$ |
$ |
$ |
3/17 |
$ |
$ |
$ |
4/17 |
$ |
$ |
$ |
5/17 |
$ |
$ |
$ |
6/17 |
$ |
$ |
$ |
7/17 |
$ |
$ |
$ |
8/17 |
$ |
$ |
$ |
9/17 |
$ |
$ |
$ |
10/17 |
$ |
$ |
$ |
11/17 |
$ |
$ |
$ |
12/17 |
$ |
$ |
$ |
1/18 |
$ |
$ |
$ |
2/18 |
$ |
$ |
$ |
3/18 |
$ |
$ |
$ |
4/18 |
$ |
$ |
$ |
5/18 |
$ |
$ |
$ |
6/18 |
$ |
$ |
$ |
7/18 |
$ |
$ |
$ |
8/18 |
$ |
$ |
$ |
9/18 |
$ |
$ |
$ |
10/18 |
$ |
$ |
$ |
11/18 |
$ |
$ |
$ |
12/18 |
$ |
$ |
$ |
1/19 |
$ |
$ |
$ |
2/19 |
$ |
$ |
$ |
3/19 |
$ |
$ |
$ |
4/19 |
$ |
$ |
$ |
5/19 |
$ |
$ |
$ |
6/19 |
$ |
$ |
$ |
7/19 |
$ |
$ |
$ |
8/19 |
$ |
$ |
$ |
9/19 |
$ |
$ |
$ |
10/19 |
$ |
$ |
$ |
11/19 |
$ |
$ |
$ |
12/19 |
$ |
$ |
$ |
1/20 |
$ |
$ |
$ |
2/20 |
$ |
$ |
$ |
3/20 |
$ |
$ |
$ |
4/20 |
$ |
$ |
$ |
5/20 |
$ |
$ |
$ |
6/20 |
$ |
$ |
$ |
7/20 |
$ |
$ |
$ |
8/20 |
$ |
$ |
$ |
9/20 |
$ |
$ |
$ |
10/20 |
$ |
$ |
$ |
11/20 |
$ |
$ |
$ |
12/20 |
$ |
$ |
$ |
1/21 |
$ |
$ |
$ |
2/21 |
$ |
$ |
$ |
3/21 |
$ |
$ |
$ |
4/21 |
$ |
$ |
$ |
5/21 |
$ |
$ |
$ |
6/21 |
$ |
$ |
$ |
7/21 |
$ |
$ |
$ |
8/21 |
$ |
$ |
$ |
9/21 |
$ |
$ |
$ |
10/21 |
$ |
$ |
$ |
11/21 |
$ |
$ |
$ |
12/21 |
$ |
$ |
$ |
1/22 |
$ |
$ |
$ |
2/22 |
$ |
$ |
$ |
3/22 |
$ |
$ |
$ |
4/22 |
$ |
$ |
$ |
5/22 |
$ |
$ |
$ |
6/22 |
$ |
$ |
$ |
7/22 |
$ |
$ |
$ |
8/22 |
$ |
$ |
$ |
9/22 |
$ |
$ |
$ |
10/22 |
$ |
$ |
$ |
11/22 |
$ |
$ |
$ |
12/22 |
$ |
$ |
$ |
1/23 |
$ |
$ |
$ |
2/23 |
$ |
$ |
$ |
3/23 |
$ |
$ |
$ |
4/23 |
$ |
$ |
$ |
5/23 |
$ |
$ |
$ |
6/23 |
$ |
$ |
$ |
7/23 |
$ |
$ |
$ |
8/23 |
$ |
$ |
$ |
9/23 |
$ |
$ |
$ |
10/23 |
$ |
$ |
$ |
11/23 |
$ |
$ |
$ |
12/23 |
$ |
$ |
$ |
1/24 |
$ |
$ |
$ |
2/24 |
$ |
$ |
$ |
3/24 |
$ |
$ |
$ |
4/24 |
$ |
$ |
$ |
5/24 |
$ |
$ |
$ |
6/24 |
$ |
$ |
$ |
7/24 |
$ |
$ |
$ |
8/24 |
$ |
$ |
$ |
9/24 |
$ |
$ |
$ |
10/24 |
$ |
$ |
$ |
11/24 |
$ |
$ |
$ |
12/24 |
$ |
$ |
$ |
1/25 |
$ |
$ |
$ |
2/25 |
$ |
$ |
$ |
3/25 |
$ |
$ |
$ |
4/25 |
$ |
$ |
$ |
5/25 |
$ |
$ |
$ |
6/25 |
$ |
$ |
$ |
7/25 |
$ |
$ |
$ |
8/25 |
$ |
$ |
$ |
9/25 |
$ |
$ |
$ |
10/25 |
$ |
$ |
$ |
11/25 |
$ |
$ |
$ |
12/25 |
$ |
$ |
$ |
1/26 |
$ |
$ |
$ |
2/26 |
$ |
$ |
$ |
Average Annual Total Returns (%)
Fund |
1 Year |
5 Years |
10 Years |
|---|---|---|---|
Class C, with conversion to Class A after 8 years |
|||
Class C, with 1% Maximum Contingent Deferred Sales Charge and conversion to Class A after 8 years |
|||
S&P 500® Index |
|||
Russell 1000® Growth Index |
Key Fund Statistics
Total Net Assets |
$ |
|---|---|
# of Portfolio Holdings |
|
Portfolio Turnover Rate |
|
Total Advisory Fees Paid |
$ |
What did the Fund invest in?
The following tables reflect what the Fund invested in as of the report date.
Sector Allocation (% of total investments)
Value |
Value |
|---|---|
Real Estate |
|
Short-Term Investments |
|
Consumer Staples |
|
Financials |
|
Industrials |
|
Health Care |
|
Consumer Discretionary |
|
Communication Services |
|
Information Technology |
Top Ten Holdings (% of total investments)Footnote Referencea
NVIDIA Corp. |
|
|---|---|
Microsoft Corp. |
|
Apple, Inc. |
|
Amazon.com, Inc. |
|
Broadcom, Inc. |
|
Alphabet, Inc., Class C |
|
Meta Platforms, Inc., Class A |
|
Eli Lilly & Co. |
|
Netflix, Inc. |
|
Lam Research Corp. |
|
Total |
| Footnote | Description |
Footnotea |
Excluding cash equivalents |
Additional Information
If you wish to view additional information about the Fund, including the prospectus, statement of additional information, financial statements and holdings, please scan the QR code or visit www.eatonvance.com/open-end-mutual-fund-documents.php. For proxy information, please visit www.eatonvance.com/proxyvoting.
Householding
The Funds may deliver a single copy of certain required shareholder documents (including prospectuses, shareholder reports, and proxy materials) to investors with the same last name and the same address. Your participation will continue indefinitely unless you instruct otherwise by calling
Not FDIC Insured | May Lose Value | No Bank Guarantee
Annual Shareholder Report February 28, 2026
ECFGX-TSR-AR
Eaton Vance Focused Growth Opportunities Fund
Class I EIFGX
What were the Fund costs for the last year?
(based on a hypothetical $10,000 investment)
Class Name |
Costs of a $10,000 investment |
Costs paid as a percentage of a $10,000 investment |
|---|---|---|
Class I |
$ |
How did the Fund perform last year and what affected its performance?
Key contributors to (↑) and detractors from (↓) performance, relative to the Russell 1000® Growth Index (the Index):
↓ An overweight position in Shift4 Payments, Inc. detracted amid Global Blue integration concerns, leadership change and valuation pressure. The position was sold by the end of the period
↓ An overweight position in Nutanix, Inc. hurt returns as the stock underperformed due to missing revenue estimates and lowered guidance. The position was sold by the end of the period
↓ An overweight position in Gartner, Inc. lost value as government spending cuts and rising artificial intelligence (AI) alternatives challenged future growth expectations. The position was sold by the end of the period
↓ Among sectors, stock selection in financials, industrials, health care and real estate hurt returns the most
↑ An overweight position in Lam Research Corp. helped returns as the stock benefitted from surging demand for semiconductor equipment tied to the AI boom
↑ An overweight position in Broadcom Inc. rose in value on AI chip demand and strong earnings
↑ An underweight position in Visa, Inc. helped as the stock underperformed due to margin concerns and future competition worries
↑ Among sectors, stock selection in consumer staples and consumer discretionary, as well as underweights to consumer discretionary and financials helped returns
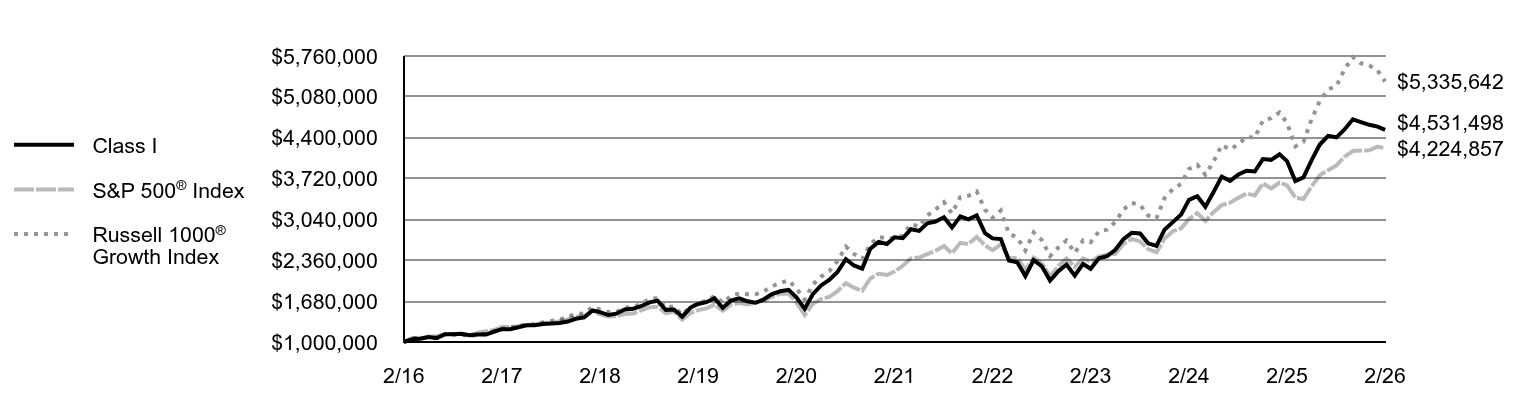
Fund Performance
Comparison of the change in value of a $1,000,000 investment for the period indicated.
2/16 |
$ |
$ |
$ |
|---|---|---|---|
3/16 |
$ |
$ |
$ |
4/16 |
$ |
$ |
$ |
5/16 |
$ |
$ |
$ |
6/16 |
$ |
$ |
$ |
7/16 |
$ |
$ |
$ |
8/16 |
$ |
$ |
$ |
9/16 |
$ |
$ |
$ |
10/16 |
$ |
$ |
$ |
11/16 |
$ |
$ |
$ |
12/16 |
$ |
$ |
$ |
1/17 |
$ |
$ |
$ |
2/17 |
$ |
$ |
$ |
3/17 |
$ |
$ |
$ |
4/17 |
$ |
$ |
$ |
5/17 |
$ |
$ |
$ |
6/17 |
$ |
$ |
$ |
7/17 |
$ |
$ |
$ |
8/17 |
$ |
$ |
$ |
9/17 |
$ |
$ |
$ |
10/17 |
$ |
$ |
$ |
11/17 |
$ |
$ |
$ |
12/17 |
$ |
$ |
$ |
1/18 |
$ |
$ |
$ |
2/18 |
$ |
$ |
$ |
3/18 |
$ |
$ |
$ |
4/18 |
$ |
$ |
$ |
5/18 |
$ |
$ |
$ |
6/18 |
$ |
$ |
$ |
7/18 |
$ |
$ |
$ |
8/18 |
$ |
$ |
$ |
9/18 |
$ |
$ |
$ |
10/18 |
$ |
$ |
$ |
11/18 |
$ |
$ |
$ |
12/18 |
$ |
$ |
$ |
1/19 |
$ |
$ |
$ |
2/19 |
$ |
$ |
$ |
3/19 |
$ |
$ |
$ |
4/19 |
$ |
$ |
$ |
5/19 |
$ |
$ |
$ |
6/19 |
$ |
$ |
$ |
7/19 |
$ |
$ |
$ |
8/19 |
$ |
$ |
$ |
9/19 |
$ |
$ |
$ |
10/19 |
$ |
$ |
$ |
11/19 |
$ |
$ |
$ |
12/19 |
$ |
$ |
$ |
1/20 |
$ |
$ |
$ |
2/20 |
$ |
$ |
$ |
3/20 |
$ |
$ |
$ |
4/20 |
$ |
$ |
$ |
5/20 |
$ |
$ |
$ |
6/20 |
$ |
$ |
$ |
7/20 |
$ |
$ |
$ |
8/20 |
$ |
$ |
$ |
9/20 |
$ |
$ |
$ |
10/20 |
$ |
$ |
$ |
11/20 |
$ |
$ |
$ |
12/20 |
$ |
$ |
$ |
1/21 |
$ |
$ |
$ |
2/21 |
$ |
$ |
$ |
3/21 |
$ |
$ |
$ |
4/21 |
$ |
$ |
$ |
5/21 |
$ |
$ |
$ |
6/21 |
$ |
$ |
$ |
7/21 |
$ |
$ |
$ |
8/21 |
$ |
$ |
$ |
9/21 |
$ |
$ |
$ |
10/21 |
$ |
$ |
$ |
11/21 |
$ |
$ |
$ |
12/21 |
$ |
$ |
$ |
1/22 |
$ |
$ |
$ |
2/22 |
$ |
$ |
$ |
3/22 |
$ |
$ |
$ |
4/22 |
$ |
$ |
$ |
5/22 |
$ |
$ |
$ |
6/22 |
$ |
$ |
$ |
7/22 |
$ |
$ |
$ |
8/22 |
$ |
$ |
$ |
9/22 |
$ |
$ |
$ |
10/22 |
$ |
$ |
$ |
11/22 |
$ |
$ |
$ |
12/22 |
$ |
$ |
$ |
1/23 |
$ |
$ |
$ |
2/23 |
$ |
$ |
$ |
3/23 |
$ |
$ |
$ |
4/23 |
$ |
$ |
$ |
5/23 |
$ |
$ |
$ |
6/23 |
$ |
$ |
$ |
7/23 |
$ |
$ |
$ |
8/23 |
$ |
$ |
$ |
9/23 |
$ |
$ |
$ |
10/23 |
$ |
$ |
$ |
11/23 |
$ |
$ |
$ |
12/23 |
$ |
$ |
$ |
1/24 |
$ |
$ |
$ |
2/24 |
$ |
$ |
$ |
3/24 |
$ |
$ |
$ |
4/24 |
$ |
$ |
$ |
5/24 |
$ |
$ |
$ |
6/24 |
$ |
$ |
$ |
7/24 |
$ |
$ |
$ |
8/24 |
$ |
$ |
$ |
9/24 |
$ |
$ |
$ |
10/24 |
$ |
$ |
$ |
11/24 |
$ |
$ |
$ |
12/24 |
$ |
$ |
$ |
1/25 |
$ |
$ |
$ |
2/25 |
$ |
$ |
$ |
3/25 |
$ |
$ |
$ |
4/25 |
$ |
$ |
$ |
5/25 |
$ |
$ |
$ |
6/25 |
$ |
$ |
$ |
7/25 |
$ |
$ |
$ |
8/25 |
$ |
$ |
$ |
9/25 |
$ |
$ |
$ |
10/25 |
$ |
$ |
$ |
11/25 |
$ |
$ |
$ |
12/25 |
$ |
$ |
$ |
1/26 |
$ |
$ |
$ |
2/26 |
$ |
$ |
$ |
Average Annual Total Returns (%)
Fund |
1 Year |
5 Years |
10 Years |
|---|---|---|---|
Class I |
|||
S&P 500® Index |
|||
Russell 1000® Growth Index |
Key Fund Statistics
Total Net Assets |
$ |
|---|---|
# of Portfolio Holdings |
|
Portfolio Turnover Rate |
|
Total Advisory Fees Paid |
$ |
What did the Fund invest in?
The following tables reflect what the Fund invested in as of the report date.
Sector Allocation (% of total investments)
Value |
Value |
|---|---|
Real Estate |
|
Short-Term Investments |
|
Consumer Staples |
|
Financials |
|
Industrials |
|
Health Care |
|
Consumer Discretionary |
|
Communication Services |
|
Information Technology |
Top Ten Holdings (% of total investments)Footnote Referencea
NVIDIA Corp. |
|
|---|---|
Microsoft Corp. |
|
Apple, Inc. |
|
Amazon.com, Inc. |
|
Broadcom, Inc. |
|
Alphabet, Inc., Class C |
|
Meta Platforms, Inc., Class A |
|
Eli Lilly & Co. |
|
Netflix, Inc. |
|
Lam Research Corp. |
|
Total |
| Footnote | Description |
Footnotea |
Excluding cash equivalents |
Additional Information
If you wish to view additional information about the Fund, including the prospectus, statement of additional information, financial statements and holdings, please scan the QR code or visit www.eatonvance.com/open-end-mutual-fund-documents.php. For proxy information, please visit www.eatonvance.com/proxyvoting.
Householding
The Funds may deliver a single copy of certain required shareholder documents (including prospectuses, shareholder reports, and proxy materials) to investors with the same last name and the same address. Your participation will continue indefinitely unless you instruct otherwise by calling
Not FDIC Insured | May Lose Value | No Bank Guarantee
Annual Shareholder Report February 28, 2026
EIFGX-TSR-AR
Eaton Vance Focused Value Opportunities Fund
Class A EAFVX
What were the Fund costs for the last year?
(based on a hypothetical $10,000 investment)
Class Name |
Costs of a $10,000 investment |
Costs paid as a percentage of a $10,000 investment |
|---|---|---|
Class A |
$ |
How did the Fund perform last year and what affected its performance?
Key contributors to (↑) and detractors from (↓) performance, relative to the Russell 1000® Value Index (the Index):
↓ An overweight position in Robert Half, Inc. hurt returns as shares were impacted by weaker-than-expected jobs markets
↓ An out-of-index position in Ryan Specialty Holdings, Inc. detracted as rising operating costs and margin compression offset solid top-line growth
↓ An overweight position in Boston Scientific Corp. detracted as weaker investor sentiment followed product sales misses, slower growth guidance, and heightened legal and regulatory risks
↓ Stock selections and sector positioning in health care, industrials and consumer discretionary sectors hurt returns
↑ An overweight position in Micron Technology, Inc. helped returns as Artificial Intelligence (AI) growth boosted demand for its high-bandwidth memory chips
↑ An overweight position in Intel Corp. rose in value, driven by major government and strategic investments, progress in advanced chip manufacturing, and improving AI-related demand
↑ An overweight position in Johnson Controls International Plc. increased in value as strong demand for data center cooling and building efficiency solutions-boosted orders, margins and earnings guidance amid AI driven infrastructure spending
↑ Among sectors, stock selections in information technology, financials and energy helped returns
Fund Performance
Comparison of the change in value of a $10,000 investment for the period indicated.
2/16 |
$ |
$ |
$ |
|---|---|---|---|
3/16 |
$ |
$ |
$ |
4/16 |
$ |
$ |
$ |
5/16 |
$ |
$ |
$ |
6/16 |
$ |
$ |
$ |
7/16 |
$ |
$ |
$ |
8/16 |
$ |
$ |
$ |
9/16 |
$ |
$ |
$ |
10/16 |
$ |
$ |
$ |
11/16 |
$ |
$ |
$ |
12/16 |
$ |
$ |
$ |
1/17 |
$ |
$ |
$ |
2/17 |
$ |
$ |
$ |
3/17 |
$ |
$ |
$ |
4/17 |
$ |
$ |
$ |
5/17 |
$ |
$ |
$ |
6/17 |
$ |
$ |
$ |
7/17 |
$ |
$ |
$ |
8/17 |
$ |
$ |
$ |
9/17 |
$ |
$ |
$ |
10/17 |
$ |
$ |
$ |
11/17 |
$ |
$ |
$ |
12/17 |
$ |
$ |
$ |
1/18 |
$ |
$ |
$ |
2/18 |
$ |
$ |
$ |
3/18 |
$ |
$ |
$ |
4/18 |
$ |
$ |
$ |
5/18 |
$ |
$ |
$ |
6/18 |
$ |
$ |
$ |
7/18 |
$ |
$ |
$ |
8/18 |
$ |
$ |
$ |
9/18 |
$ |
$ |
$ |
10/18 |
$ |
$ |
$ |
11/18 |
$ |
$ |
$ |
12/18 |
$ |
$ |
$ |
1/19 |
$ |
$ |
$ |
2/19 |
$ |
$ |
$ |
3/19 |
$ |
$ |
$ |
4/19 |
$ |
$ |
$ |
5/19 |
$ |
$ |
$ |
6/19 |
$ |
$ |
$ |
7/19 |
$ |
$ |
$ |
8/19 |
$ |
$ |
$ |
9/19 |
$ |
$ |
$ |
10/19 |
$ |
$ |
$ |
11/19 |
$ |
$ |
$ |
12/19 |
$ |
$ |
$ |
1/20 |
$ |
$ |
$ |
2/20 |
$ |
$ |
$ |
3/20 |
$ |
$ |
$ |
4/20 |
$ |
$ |
$ |
5/20 |
$ |
$ |
$ |
6/20 |
$ |
$ |
$ |
7/20 |
$ |
$ |
$ |
8/20 |
$ |
$ |
$ |
9/20 |
$ |
$ |
$ |
10/20 |
$ |
$ |
$ |
11/20 |
$ |
$ |
$ |
12/20 |
$ |
$ |
$ |
1/21 |
$ |
$ |
$ |
2/21 |
$ |
$ |
$ |
3/21 |
$ |
$ |
$ |
4/21 |
$ |
$ |
$ |
5/21 |
$ |
$ |
$ |
6/21 |
$ |
$ |
$ |
7/21 |
$ |
$ |
$ |
8/21 |
$ |
$ |
$ |
9/21 |
$ |
$ |
$ |
10/21 |
$ |
$ |
$ |
11/21 |
$ |
$ |
$ |
12/21 |
$ |
$ |
$ |
1/22 |
$ |
$ |
$ |
2/22 |
$ |
$ |
$ |
3/22 |
$ |
$ |
$ |
4/22 |
$ |
$ |
$ |
5/22 |
$ |
$ |
$ |
6/22 |
$ |
$ |
$ |
7/22 |
$ |
$ |
$ |
8/22 |
$ |
$ |
$ |
9/22 |
$ |
$ |
$ |
10/22 |
$ |
$ |
$ |
11/22 |
$ |
$ |
$ |
12/22 |
$ |
$ |
$ |
1/23 |
$ |
$ |
$ |
2/23 |
$ |
$ |
$ |
3/23 |
$ |
$ |
$ |
4/23 |
$ |
$ |
$ |
5/23 |
$ |
$ |
$ |
6/23 |
$ |
$ |
$ |
7/23 |
$ |
$ |
$ |
8/23 |
$ |
$ |
$ |
9/23 |
$ |
$ |
$ |
10/23 |
$ |
$ |
$ |
11/23 |
$ |
$ |
$ |
12/23 |
$ |
$ |
$ |
1/24 |
$ |
$ |
$ |
2/24 |
$ |
$ |
$ |
3/24 |
$ |
$ |
$ |
4/24 |
$ |
$ |
$ |
5/24 |
$ |
$ |
$ |
6/24 |
$ |
$ |
$ |
7/24 |
$ |
$ |
$ |
8/24 |
$ |
$ |
$ |
9/24 |
$ |
$ |
$ |
10/24 |
$ |
$ |
$ |
11/24 |
$ |
$ |
$ |
12/24 |
$ |
$ |
$ |
1/25 |
$ |
$ |
$ |
2/25 |
$ |
$ |
$ |
3/25 |
$ |
$ |
$ |
4/25 |
$ |
$ |
$ |
5/25 |
$ |
$ |
$ |
6/25 |
$ |
$ |
$ |
7/25 |
$ |
$ |
$ |
8/25 |
$ |
$ |
$ |
9/25 |
$ |
$ |
$ |
10/25 |
$ |
$ |
$ |
11/25 |
$ |
$ |
$ |
12/25 |
$ |
$ |
$ |
1/26 |
$ |
$ |
$ |
2/26 |
$ |
$ |
$ |
Average Annual Total Returns (%)
Fund |
1 Year |
5 Years |
10 Years |
|---|---|---|---|
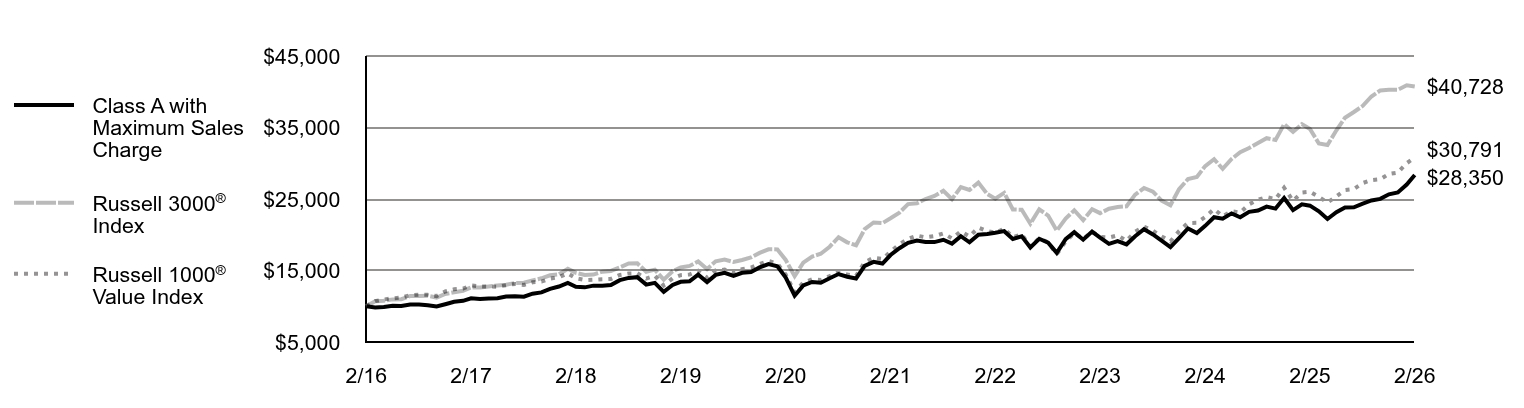
Class A |
|||
Class A with 5.25% Maximum Sales Charge |
|||
Russell 3000® Index |
|||
Russell 1000® Value Index |
Key Fund Statistics
Total Net Assets |
$ |
|---|---|
# of Portfolio Holdings |
|
Portfolio Turnover Rate |
|
Total Advisory Fees Paid |
$ |
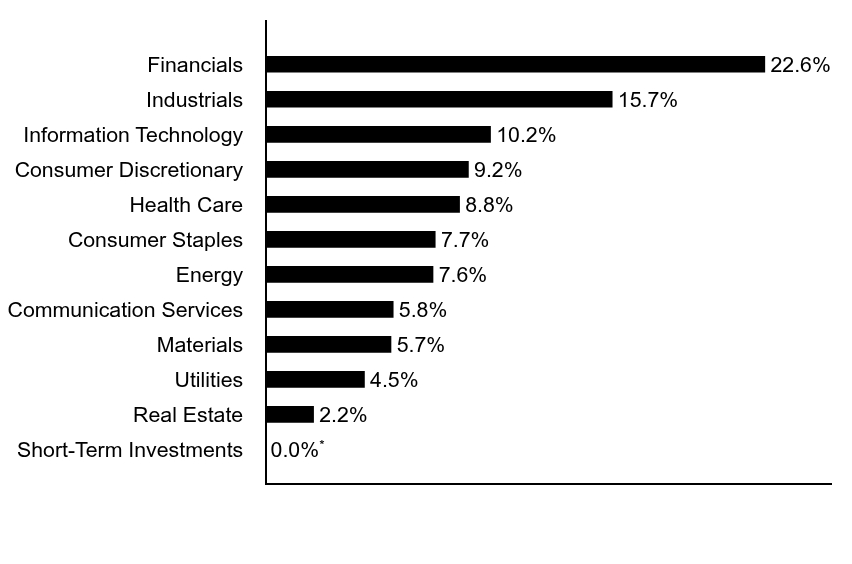
What did the Fund invest in?
The following tables reflect what the Fund invested in as of the report date.
Sector Allocation (% of total investments)
Value |
Value |
|---|---|
Short-Term Investments |
|
Real Estate |
|
Utilities |
|
Materials |
|
Communication Services |
|
Energy |
|
Consumer Staples |
|
Health Care |
|
Consumer Discretionary |
|
Information Technology |
|
Industrials |
|
Financials |
| Footnote | Description |
Footnote* |
Top Ten Holdings (% of total investments)Footnote Referencea
Amazon.com, Inc. |
|
|---|---|
Exxon Mobil Corp. |
|
Bristol-Myers Squibb Co. |
|
Bank of America Corp. |
|
Ball Corp. |
|
Meta Platforms, Inc., Class A |
|
United Parcel Service, Inc., Class B |
|
Micron Technology, Inc. |
|
Cisco Systems, Inc. |
|
Johnson Controls International PLC |
|
Total |
| Footnote | Description |
Footnotea |
Excluding cash equivalents |
Additional Information
If you wish to view additional information about the Fund, including the prospectus, statement of additional information, financial statements and holdings, please scan the QR code or visit www.eatonvance.com/open-end-mutual-fund-documents.php. For proxy information, please visit www.eatonvance.com/proxyvoting.
Householding
The Funds may deliver a single copy of certain required shareholder documents (including prospectuses, shareholder reports, and proxy materials) to investors with the same last name and the same address. Your participation will continue indefinitely unless you instruct otherwise by calling
Not FDIC Insured | May Lose Value | No Bank Guarantee
Annual Shareholder Report February 28, 2026
EAFVX-TSR-AR
Eaton Vance Focused Value Opportunities Fund
Class C ECFVX
What were the Fund costs for the last year?
(based on a hypothetical $10,000 investment)
Class Name |
Costs of a $10,000 investment |
Costs paid as a percentage of a $10,000 investment |
|---|---|---|
Class C |
$ |
How did the Fund perform last year and what affected its performance?
Key contributors to (↑) and detractors from (↓) performance, relative to the Russell 1000® Value Index (the Index):
↓ An overweight position in Robert Half, Inc. hurt returns as shares were impacted by weaker-than-expected jobs markets
↓ An out-of-index position in Ryan Specialty Holdings, Inc. detracted as rising operating costs and margin compression offset solid top-line growth
↓ An overweight position in Boston Scientific Corp. detracted as weaker investor sentiment followed product sales misses, slower growth guidance, and heightened legal and regulatory risks
↓ Stock selections and sector positioning in health care, industrials and consumer discretionary sectors hurt returns
↑ An overweight position in Micron Technology, Inc. helped returns as Artificial Intelligence (AI) growth boosted demand for its high-bandwidth memory chips
↑ An overweight position in Intel Corp. rose in value, driven by major government and strategic investments, progress in advanced chip manufacturing, and improving AI-related demand
↑ An overweight position in Johnson Controls International Plc. increased in value as strong demand for data center cooling and building efficiency solutions-boosted orders, margins and earnings guidance amid AI driven infrastructure spending
↑ Among sectors, stock selections in information technology, financials and energy helped returns
Fund Performance
Comparison of the change in value of a $10,000 investment for the period indicated.
2/16 |
$ |
$ |
$ |
|---|---|---|---|
3/16 |
$ |
$ |
$ |
4/16 |
$ |
$ |
$ |
5/16 |
$ |
$ |
$ |
6/16 |
$ |
$ |
$ |
7/16 |
$ |
$ |
$ |
8/16 |
$ |
$ |
$ |
9/16 |
$ |
$ |
$ |
10/16 |
$ |
$ |
$ |
11/16 |
$ |
$ |
$ |
12/16 |
$ |
$ |
$ |
1/17 |
$ |
$ |
$ |
2/17 |
$ |
$ |
$ |
3/17 |
$ |
$ |
$ |
4/17 |
$ |
$ |
$ |
5/17 |
$ |
$ |
$ |
6/17 |
$ |
$ |
$ |
7/17 |
$ |
$ |
$ |
8/17 |
$ |
$ |
$ |
9/17 |
$ |
$ |
$ |
10/17 |
$ |
$ |
$ |
11/17 |
$ |
$ |
$ |
12/17 |
$ |
$ |
$ |
1/18 |
$ |
$ |
$ |
2/18 |
$ |
$ |
$ |
3/18 |
$ |
$ |
$ |
4/18 |
$ |
$ |
$ |
5/18 |
$ |
$ |
$ |
6/18 |
$ |
$ |
$ |
7/18 |
$ |
$ |
$ |
8/18 |
$ |
$ |
$ |
9/18 |
$ |
$ |
$ |
10/18 |
$ |
$ |
$ |
11/18 |
$ |
$ |
$ |
12/18 |
$ |
$ |
$ |
1/19 |
$ |
$ |
$ |
2/19 |
$ |
$ |
$ |
3/19 |
$ |
$ |
$ |
4/19 |
$ |
$ |
$ |
5/19 |
$ |
$ |
$ |
6/19 |
$ |
$ |
$ |
7/19 |
$ |
$ |
$ |
8/19 |
$ |
$ |
$ |
9/19 |
$ |
$ |
$ |
10/19 |
$ |
$ |
$ |
11/19 |
$ |
$ |
$ |
12/19 |
$ |
$ |
$ |
1/20 |
$ |
$ |
$ |
2/20 |
$ |
$ |
$ |
3/20 |
$ |
$ |
$ |
4/20 |
$ |
$ |
$ |
5/20 |
$ |
$ |
$ |
6/20 |
$ |
$ |
$ |
7/20 |
$ |
$ |
$ |
8/20 |
$ |
$ |
$ |
9/20 |
$ |
$ |
$ |
10/20 |
$ |
$ |
$ |
11/20 |
$ |
$ |
$ |
12/20 |
$ |
$ |
$ |
1/21 |
$ |
$ |
$ |
2/21 |
$ |
$ |
$ |
3/21 |
$ |
$ |
$ |
4/21 |
$ |
$ |
$ |
5/21 |
$ |
$ |
$ |
6/21 |
$ |
$ |
$ |
7/21 |
$ |
$ |
$ |
8/21 |
$ |
$ |
$ |
9/21 |
$ |
$ |
$ |
10/21 |
$ |
$ |
$ |
11/21 |
$ |
$ |
$ |
12/21 |
$ |
$ |
$ |
1/22 |
$ |
$ |
$ |
2/22 |
$ |
$ |
$ |
3/22 |
$ |
$ |
$ |
4/22 |
$ |
$ |
$ |
5/22 |
$ |
$ |
$ |
6/22 |
$ |
$ |
$ |
7/22 |
$ |
$ |
$ |
8/22 |
$ |
$ |
$ |
9/22 |
$ |
$ |
$ |
10/22 |
$ |
$ |
$ |
11/22 |
$ |
$ |
$ |
12/22 |
$ |
$ |
$ |
1/23 |
$ |
$ |
$ |
2/23 |
$ |
$ |
$ |
3/23 |
$ |
$ |
$ |
4/23 |
$ |
$ |
$ |
5/23 |
$ |
$ |
$ |
6/23 |
$ |
$ |
$ |
7/23 |
$ |
$ |
$ |
8/23 |
$ |
$ |
$ |
9/23 |
$ |
$ |
$ |
10/23 |
$ |
$ |
$ |
11/23 |
$ |
$ |
$ |
12/23 |
$ |
$ |
$ |
1/24 |
$ |
$ |
$ |
2/24 |
$ |
$ |
$ |
3/24 |
$ |
$ |
$ |
4/24 |
$ |
$ |
$ |
5/24 |
$ |
$ |
$ |
6/24 |
$ |
$ |
$ |
7/24 |
$ |
$ |
$ |
8/24 |
$ |
$ |
$ |
9/24 |
$ |
$ |
$ |
10/24 |
$ |
$ |
$ |
11/24 |
$ |
$ |
$ |
12/24 |
$ |
$ |
$ |
1/25 |
$ |
$ |
$ |
2/25 |
$ |
$ |
$ |
3/25 |
$ |
$ |
$ |
4/25 |
$ |
$ |
$ |
5/25 |
$ |
$ |
$ |
6/25 |
$ |
$ |
$ |
7/25 |
$ |
$ |
$ |
8/25 |
$ |
$ |
$ |
9/25 |
$ |
$ |
$ |
10/25 |
$ |
$ |
$ |
11/25 |
$ |
$ |
$ |
12/25 |
$ |
$ |
$ |
1/26 |
$ |
$ |
$ |
2/26 |
$ |
$ |
$ |
Average Annual Total Returns (%)
Fund |
1 Year |
5 Years |
10 Years |
|---|---|---|---|
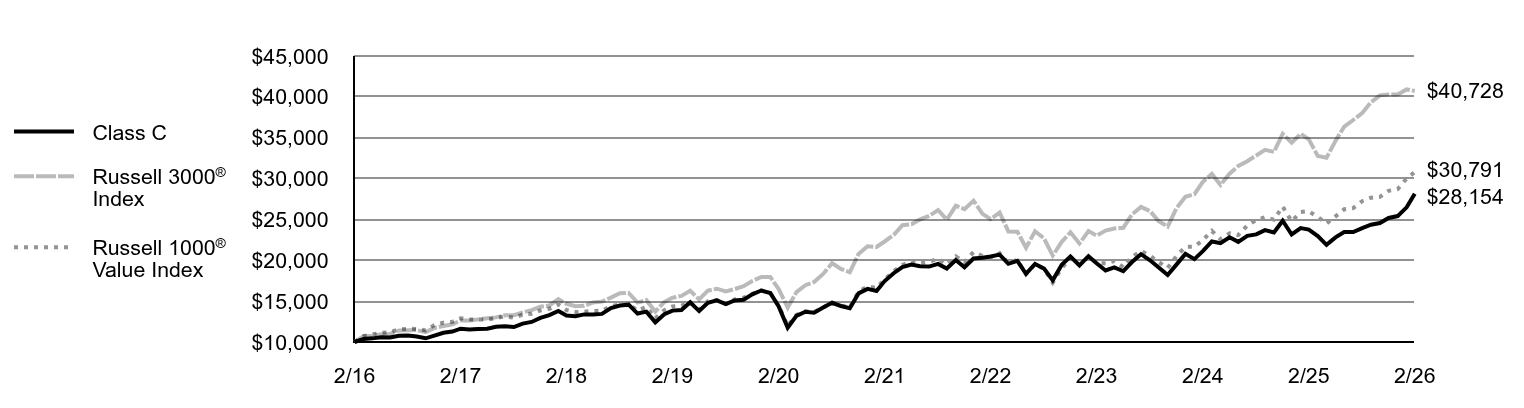
Class C, with conversion to Class A after 8 years |
|||
Class C, with 1% Maximum Contingent Deferred Sales Charge and conversion to Class A after 8 years |
|||
Russell 3000® Index |
|||
Russell 1000® Value Index |
Key Fund Statistics
Total Net Assets |
$ |
|---|---|
# of Portfolio Holdings |
|
Portfolio Turnover Rate |
|
Total Advisory Fees Paid |
$ |
What did the Fund invest in?
The following tables reflect what the Fund invested in as of the report date.
Sector Allocation (% of total investments)
Value |
Value |
|---|---|
Short-Term Investments |
|
Real Estate |
|
Utilities |
|
Materials |
|
Communication Services |
|
Energy |
|
Consumer Staples |
|
Health Care |
|
Consumer Discretionary |
|
Information Technology |
|
Industrials |
|
Financials |
| Footnote | Description |
Footnote* |
Top Ten Holdings (% of total investments)Footnote Referencea
Amazon.com, Inc. |
|
|---|---|
Exxon Mobil Corp. |
|
Bristol-Myers Squibb Co. |
|
Bank of America Corp. |
|
Ball Corp. |
|
Meta Platforms, Inc., Class A |
|
United Parcel Service, Inc., Class B |
|
Micron Technology, Inc. |
|
Cisco Systems, Inc. |
|
Johnson Controls International PLC |
|
Total |
| Footnote | Description |
Footnotea |
Excluding cash equivalents |
Additional Information
If you wish to view additional information about the Fund, including the prospectus, statement of additional information, financial statements and holdings, please scan the QR code or visit www.eatonvance.com/open-end-mutual-fund-documents.php. For proxy information, please visit www.eatonvance.com/proxyvoting.
Householding
The Funds may deliver a single copy of certain required shareholder documents (including prospectuses, shareholder reports, and proxy materials) to investors with the same last name and the same address. Your participation will continue indefinitely unless you instruct otherwise by calling
Not FDIC Insured | May Lose Value | No Bank Guarantee
Annual Shareholder Report February 28, 2026
ECFVX-TSR-AR
Eaton Vance Focused Value Opportunities Fund
Class I EIFVX
What were the Fund costs for the last year?
(based on a hypothetical $10,000 investment)
Class Name |
Costs of a $10,000 investment |
Costs paid as a percentage of a $10,000 investment |
|---|---|---|
Class I |
$ |
How did the Fund perform last year and what affected its performance?
Key contributors to (↑) and detractors from (↓) performance, relative to the Russell 1000® Value Index (the Index):
↓ An overweight position in Robert Half, Inc. hurt returns as shares were impacted by weaker-than-expected jobs markets
↓ An out-of-index position in Ryan Specialty Holdings, Inc. detracted as rising operating costs and margin compression offset solid top-line growth
↓ An overweight position in Boston Scientific Corp. detracted as weaker investor sentiment followed product sales misses, slower growth guidance, and heightened legal and regulatory risks
↓ Stock selections and sector positioning in health care, industrials and consumer discretionary sectors hurt returns
↑ An overweight position in Micron Technology, Inc. helped returns as Artificial Intelligence (AI) growth boosted demand for its high-bandwidth memory chips
↑ An overweight position in Intel Corp. rose in value, driven by major government and strategic investments, progress in advanced chip manufacturing, and improving AI-related demand
↑ An overweight position in Johnson Controls International Plc. increased in value as strong demand for data center cooling and building efficiency solutions-boosted orders, margins and earnings guidance amid AI driven infrastructure spending
↑ Among sectors, stock selections in information technology, financials and energy helped returns
Fund Performance
Comparison of the change in value of a $1,000,000 investment for the period indicated.
2/16 |
$ |
$ |
$ |
|---|---|---|---|
3/16 |
$ |
$ |
$ |
4/16 |
$ |
$ |
$ |
5/16 |
$ |
$ |
$ |
6/16 |
$ |
$ |
$ |
7/16 |
$ |
$ |
$ |
8/16 |
$ |
$ |
$ |
9/16 |
$ |
$ |
$ |
10/16 |
$ |
$ |
$ |
11/16 |
$ |
$ |
$ |
12/16 |
$ |
$ |
$ |
1/17 |
$ |
$ |
$ |
2/17 |
$ |
$ |
$ |
3/17 |
$ |
$ |
$ |
4/17 |
$ |
$ |
$ |
5/17 |
$ |
$ |
$ |
6/17 |
$ |
$ |
$ |
7/17 |
$ |
$ |
$ |
8/17 |
$ |
$ |
$ |
9/17 |
$ |
$ |
$ |
10/17 |
$ |
$ |
$ |
11/17 |
$ |
$ |
$ |
12/17 |
$ |
$ |
$ |
1/18 |
$ |
$ |
$ |
2/18 |
$ |
$ |
$ |
3/18 |
$ |
$ |
$ |
4/18 |
$ |
$ |
$ |
5/18 |
$ |
$ |
$ |
6/18 |
$ |
$ |
$ |
7/18 |
$ |
$ |
$ |
8/18 |
$ |
$ |
$ |
9/18 |
$ |
$ |
$ |
10/18 |
$ |
$ |
$ |
11/18 |
$ |
$ |
$ |
12/18 |
$ |
$ |
$ |
1/19 |
$ |
$ |
$ |
2/19 |
$ |
$ |
$ |
3/19 |
$ |
$ |
$ |
4/19 |
$ |
$ |
$ |
5/19 |
$ |
$ |
$ |
6/19 |
$ |
$ |
$ |
7/19 |
$ |
$ |
$ |
8/19 |
$ |
$ |
$ |
9/19 |
$ |
$ |
$ |
10/19 |
$ |
$ |
$ |
11/19 |
$ |
$ |
$ |
12/19 |
$ |
$ |
$ |
1/20 |
$ |
$ |
$ |
2/20 |
$ |
$ |
$ |
3/20 |
$ |
$ |
$ |
4/20 |
$ |
$ |
$ |
5/20 |
$ |
$ |
$ |
6/20 |
$ |
$ |
$ |
7/20 |
$ |
$ |
$ |
8/20 |
$ |
$ |
$ |
9/20 |
$ |
$ |
$ |
10/20 |
$ |
$ |
$ |
11/20 |
$ |
$ |
$ |
12/20 |
$ |
$ |
$ |
1/21 |
$ |
$ |
$ |
2/21 |
$ |
$ |
$ |
3/21 |
$ |
$ |
$ |
4/21 |
$ |
$ |
$ |
5/21 |
$ |
$ |
$ |
6/21 |
$ |
$ |
$ |
7/21 |
$ |
$ |
$ |
8/21 |
$ |
$ |
$ |
9/21 |
$ |
$ |
$ |
10/21 |
$ |
$ |
$ |
11/21 |
$ |
$ |
$ |
12/21 |
$ |
$ |
$ |
1/22 |
$ |
$ |
$ |
2/22 |
$ |
$ |
$ |
3/22 |
$ |
$ |
$ |
4/22 |
$ |
$ |
$ |
5/22 |
$ |
$ |
$ |
6/22 |
$ |
$ |
$ |
7/22 |
$ |
$ |
$ |
8/22 |
$ |
$ |
$ |
9/22 |
$ |
$ |
$ |
10/22 |
$ |
$ |
$ |
11/22 |
$ |
$ |
$ |
12/22 |
$ |
$ |
$ |
1/23 |
$ |
$ |
$ |
2/23 |
$ |
$ |
$ |
3/23 |
$ |
$ |
$ |
4/23 |
$ |
$ |
$ |
5/23 |
$ |
$ |
$ |
6/23 |
$ |
$ |
$ |
7/23 |
$ |
$ |
$ |
8/23 |
$ |
$ |
$ |
9/23 |
$ |
$ |
$ |
10/23 |
$ |
$ |
$ |
11/23 |
$ |
$ |
$ |
12/23 |
$ |
$ |
$ |
1/24 |
$ |
$ |
$ |
2/24 |
$ |
$ |
$ |
3/24 |
$ |
$ |
$ |
4/24 |
$ |
$ |
$ |
5/24 |
$ |
$ |
$ |
6/24 |
$ |
$ |
$ |
7/24 |
$ |
$ |
$ |
8/24 |
$ |
$ |
$ |
9/24 |
$ |
$ |
$ |
10/24 |
$ |
$ |
$ |
11/24 |
$ |
$ |
$ |
12/24 |
$ |
$ |
$ |
1/25 |
$ |
$ |
$ |
2/25 |
$ |
$ |
$ |
3/25 |
$ |
$ |
$ |
4/25 |
$ |
$ |
$ |
5/25 |
$ |
$ |
$ |
6/25 |
$ |
$ |
$ |
7/25 |
$ |
$ |
$ |
8/25 |
$ |
$ |
$ |
9/25 |
$ |
$ |
$ |
10/25 |
$ |
$ |
$ |
11/25 |
$ |
$ |
$ |
12/25 |
$ |
$ |
$ |
1/26 |
$ |
$ |
$ |
2/26 |
$ |
$ |
$ |
Average Annual Total Returns (%)
Fund |
1 Year |
5 Years |
10 Years |
|---|---|---|---|
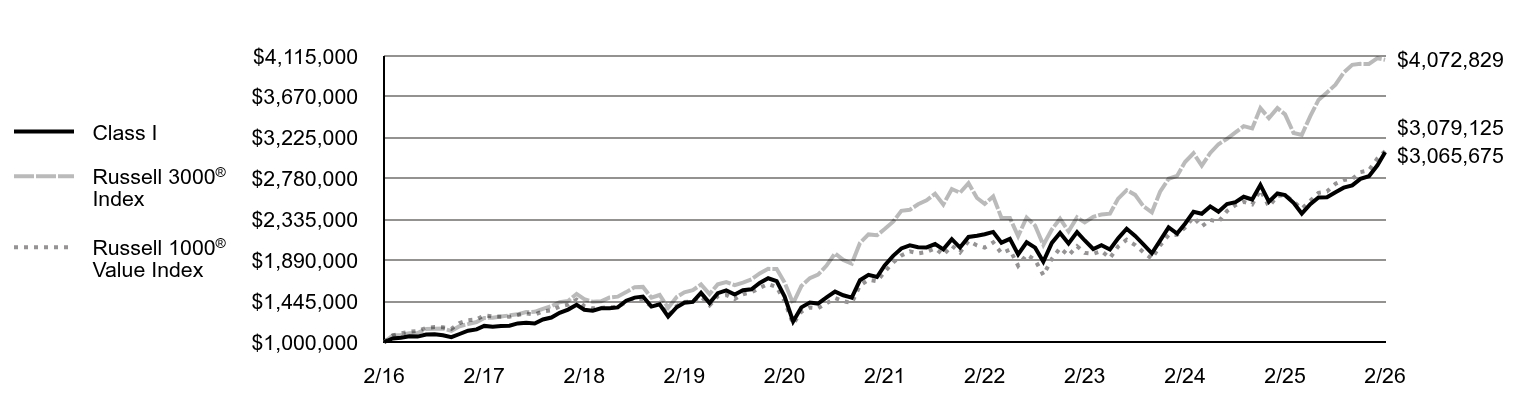
Class I |
|||
Russell 3000® Index |
|||
Russell 1000® Value Index |
Key Fund Statistics
Total Net Assets |
$ |
|---|---|
# of Portfolio Holdings |
|
Portfolio Turnover Rate |
|
Total Advisory Fees Paid |
$ |
What did the Fund invest in?
The following tables reflect what the Fund invested in as of the report date.
Sector Allocation (% of total investments)
Value |
Value |
|---|---|
Short-Term Investments |
|
Real Estate |
|
Utilities |
|
Materials |
|
Communication Services |
|
Energy |
|
Consumer Staples |
|
Health Care |
|
Consumer Discretionary |
|
Information Technology |
|
Industrials |
|
Financials |
| Footnote | Description |
Footnote* |
Top Ten Holdings (% of total investments)Footnote Referencea
Amazon.com, Inc. |
|
|---|---|
Exxon Mobil Corp. |
|
Bristol-Myers Squibb Co. |
|
Bank of America Corp. |
|
Ball Corp. |
|
Meta Platforms, Inc., Class A |
|
United Parcel Service, Inc., Class B |
|
Micron Technology, Inc. |
|
Cisco Systems, Inc. |
|
Johnson Controls International PLC |
|
Total |
| Footnote | Description |
Footnotea |
Excluding cash equivalents |
Additional Information
If you wish to view additional information about the Fund, including the prospectus, statement of additional information, financial statements and holdings, please scan the QR code or visit www.eatonvance.com/open-end-mutual-fund-documents.php. For proxy information, please visit www.eatonvance.com/proxyvoting.
Householding
The Funds may deliver a single copy of certain required shareholder documents (including prospectuses, shareholder reports, and proxy materials) to investors with the same last name and the same address. Your participation will continue indefinitely unless you instruct otherwise by calling
Not FDIC Insured | May Lose Value | No Bank Guarantee
Annual Shareholder Report February 28, 2026