Pay vs Performance Disclosure
Dec. 31, 2025
USD ($)
Dec. 31, 2024
USD ($)
Dec. 31, 2023
USD ($)
Dec. 31, 2022
USD ($)
Dec. 31, 2021
USD ($)
Pay Versus Performance
The following table shows the total compensation for NEOs for the past five fiscal years as set forth in the Summary Compensation Table in this proxy statement and the prior year’s proxy statement, the compensation actually paid or “CAP” to the CEO and on an average basis, other NEOs (in each case, as determined under SEC rules), our TSR, our peer group TSR consisting of the S&P Supercomposite Consumer Finance
Sub-Industry
Index, our net income, and our Company-Selected Measure, relative TSR against a defined group of peers. Value of Initial Fixed $100 Investment Based on: |
||||||||||||||||||||||||||||
Fiscal Year (a) |
SCT for CEO (b) (1) |
CAP to CEO (c) (2) |
Average SCT for other NEOs (d) (3) |
Average CAP to Other NEOs (e) (2) |
|
|
TSR (f) (4) |
|
Peer Group TSR (h) (4) |
|
Net Income ($ in mil- lions) (i) |
|
|
Company- Selected Measure: Relative TSR (k) (5) | ||||||||||||||
2025 |
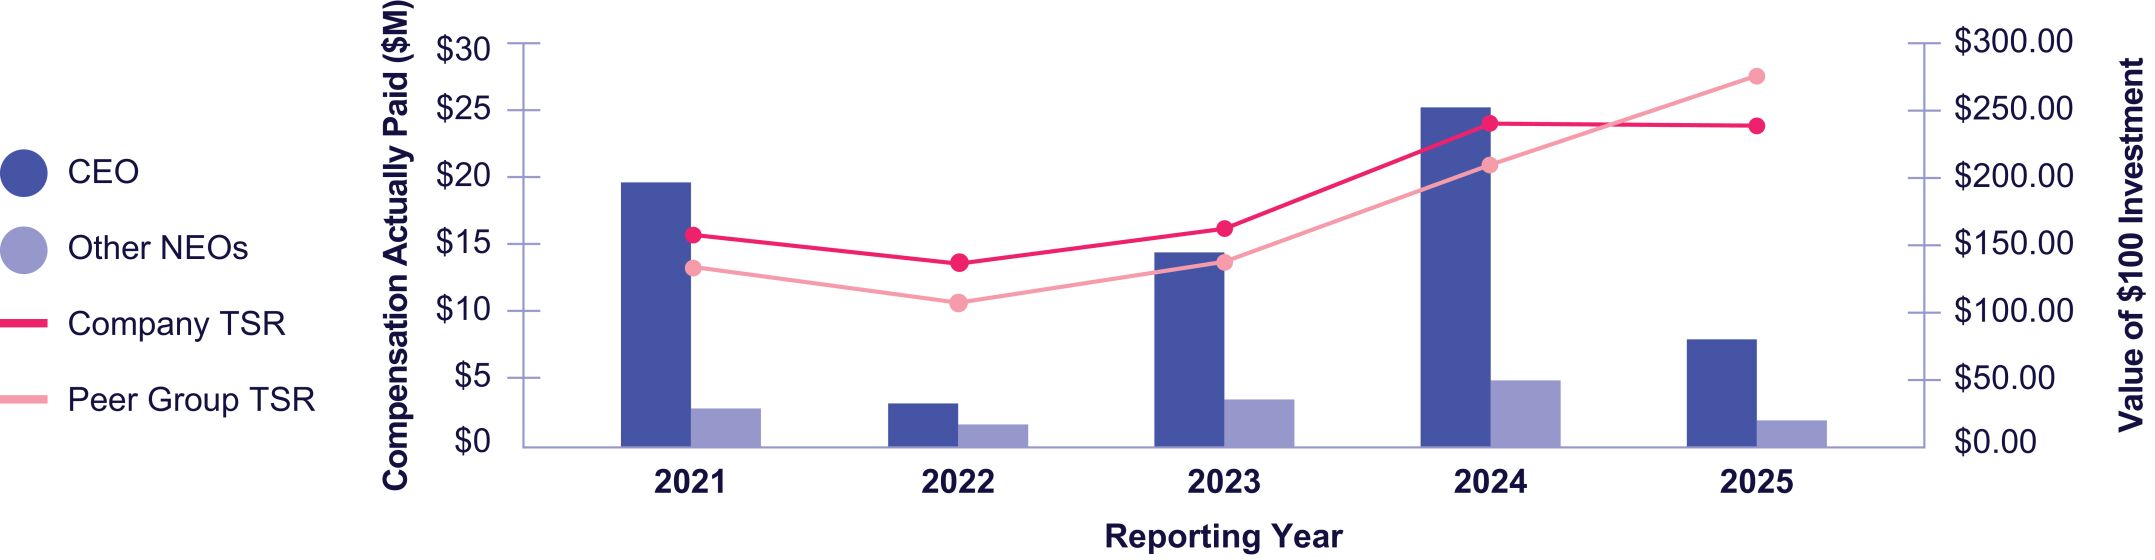
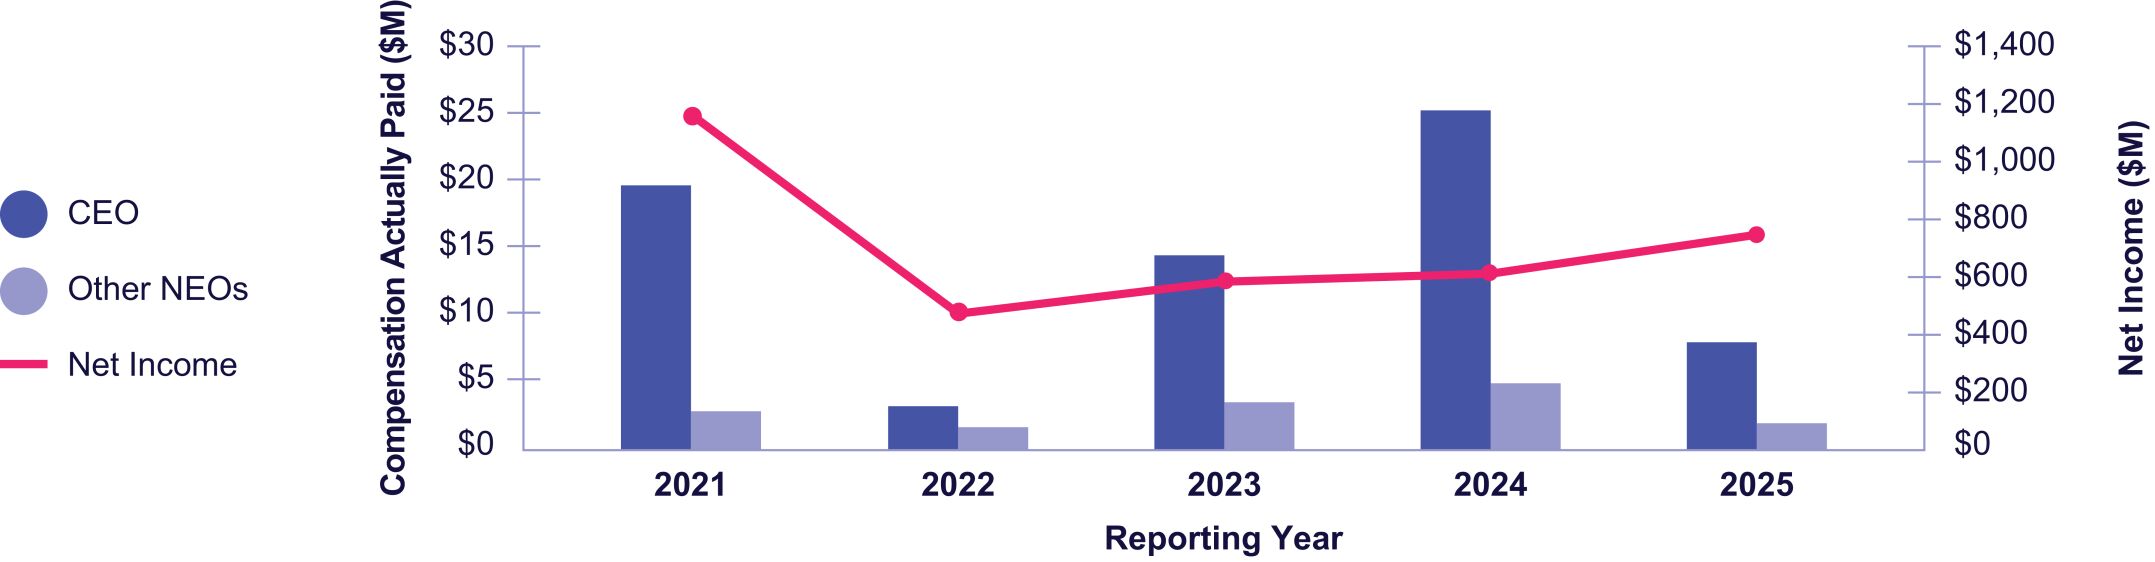
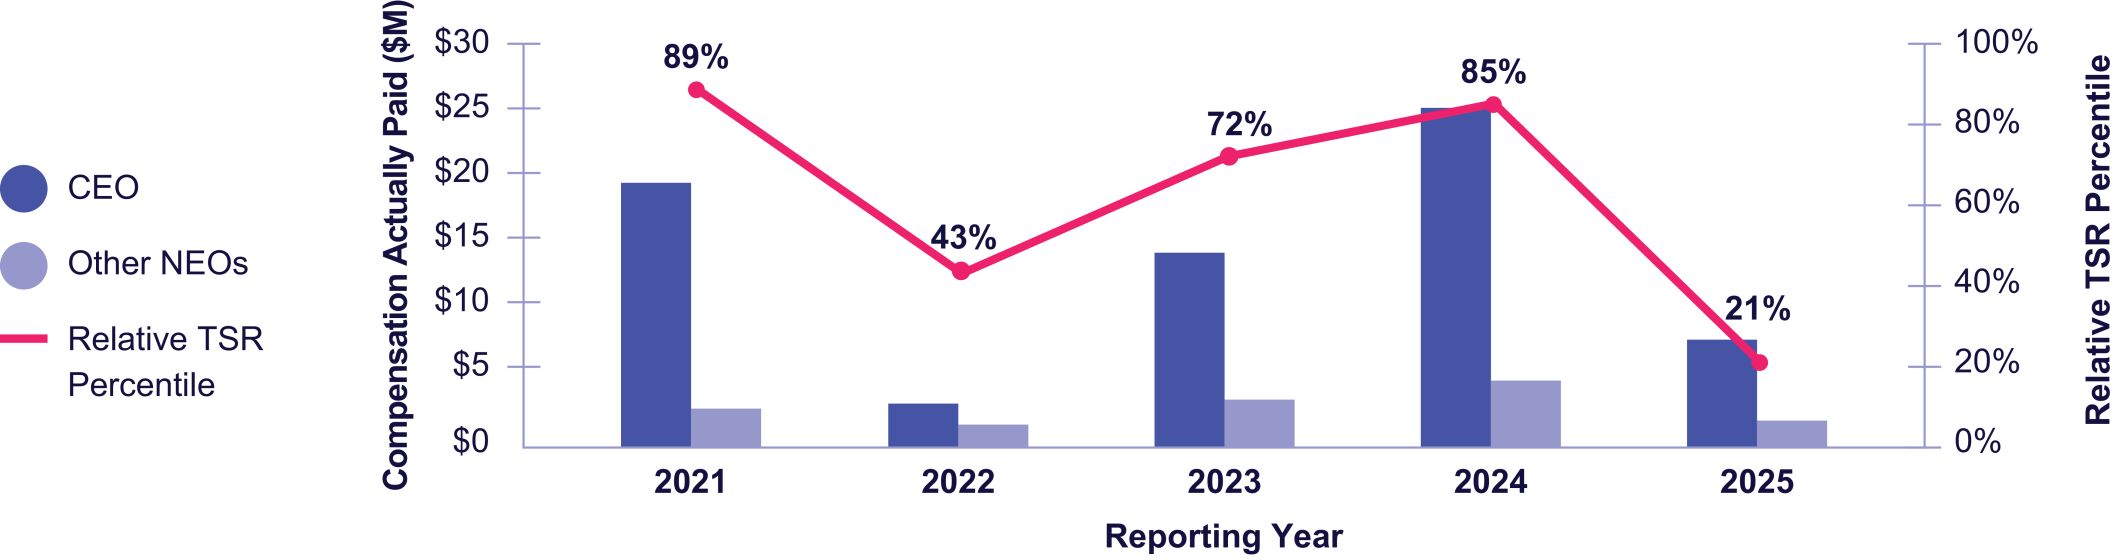
$11,261,733 | $8,241,614 | $2,878,895 | $2,489,155 | $242.21 | $279.21 | $744.8 | 21st percentile | ||||||||||||||||||||
2024 |
$11,804,848 | $25,241,063 | $2,981,064 | $4,947,273 | $242.73 | $213.41 | $608.33 | 85th percentile | ||||||||||||||||||||
2023 |
$9,399,485 | $14,463,384 | $2,649,478 | $3,539,537 | $164.81 | $141.33 | $581.4 | 72nd percentile | ||||||||||||||||||||
2022 |
$7,809,136 | $3,242,518 | $2,144,103 | $1,683,781 | $138.92 | $109.99 | $469.0 | 43rd percentile | ||||||||||||||||||||
2021 |
$7,047,062 | $19,612,482 | $2,067,229 | $2,891,752 | $160.50 | $136.54 | $1,160.5 | 89th percentile | ||||||||||||||||||||
| (1) | The dollar amounts reported in column (b) are the amounts of total compensation reported for Mr. Witter for each corresponding year in the “Total” column of the Summary Compensation Table. Refer to the Summary Compensation Table as set forth on page 49 of this proxy statement, on page 54 of the prior year’s proxy statement filed with the SEC on April 28, 2025, and on page 53 of the proxy statement filed with the SEC on April 26, 2024. |
| (2) | The dollar amounts reported in columns (c) and (e) represent the amount of “compensation actually paid” (otherwise known as CAP), adjusted as follows in the table below, as determined in accordance with SEC rules. None of the equity awards held by NEOs were forfeited during the preceding five years; therefore, no amounts are reported for forfeited awards. CAP does not necessarily represent cash and/or equity value transferred to the applicable NEO without restriction, but rather is a value calculated under applicable SEC rules. We do not have a defined benefit plan, so no adjustment for pension benefits is included in the table below. Fair values set forth in the table below are computed in accordance with ASC 718 as of the end of the respective fiscal year, other than fair values of the awards that vest in the covered year, which are valued as of the applicable vesting date. Similarly, no adjustment is made for dividends because the amount associated with such dividends are reflected in the fair value of the award for the covered fiscal year. The reconciliation from the Summary Compensation Table to CAP for fiscal year 2021 through fiscal year 2022 can be found in the proxy statement filed with the SEC on April 27, 2023. The reconciliation from the Summary Compensation Table to CAP for fiscal year 2023 can be found in the proxy statement filed with the SEC on April 26, 2024. The reconciliation from the Summary Compensation Table to CAP for fiscal year 2024 can be found in the proxy statement filed with the SEC on April 28, 2025. The reconciliation from the Summary Compensation Table to CAP for fiscal year 2025 is summarized in the table below. |
Fiscal Year |
Executives |
SCT (a) |
(Minus) Grant Date Fair Value of New Awards (b) |
Plus Year End Fair Value of New Awards (i) |
(Minus) Change in Fair Value of Prior Awards (ii) |
Plus Change in Fair Value of Vested Awards Granted in Prior Fiscal Years (iii) |
Plus Fair Value of Vested Awards Granted and Vested in Current Fiscal Year (iv) |
Plus Fair Value at Start of Fiscal Year of Awards That Failed to Meet Vesting Conditions (v) |
Plus Value of Dividends Paid on Equity Awards not reflected in Fair Value (vi) |
Equals CAP (c) |
||||||||||||||||||||||
2025 |
CEO | $ | 11,261,733 | ($ | 8,444,994 | ) | $ | 6,546,140 | ($ | 2,477,574 | ) | $ | 1,356,309 | $0 | $0 | $0 | $ | 8,241,614 | ||||||||||||||
2025 |
Other NEOs | $ | 2,878,895 | ($ | 1,444,332 | ) | $ | 1,157,770 | ($ | 302,154 | ) | $ | 198,976 | $0 | $0 | $0 | $ | 2,489,155 | ||||||||||||||
| (a) | The dollar amounts reported in the Summary Compensation Table for the applicable year. |
| (b) | The grant date fair value of equity awards represents the total of the amounts reported in the “Stock Awards” column in the Summary Compensation Table for the applicable year. |
The recalculated value of equity awards for each applicable year includes the addition (or subtraction, as applicable) of the following: |
| (i) | the year-end fair value of any equity awards granted in the applicable year that are outstanding and unvested as of the end of the year; |
| (ii) | the amount of change as of the end of the applicable year (from the end of the prior fiscal year) in fair value of any awards granted in prior years that are outstanding and unvested as of the end of the applicable year; |
| (iii) | for awards that are granted in prior years and vest in the applicable year, the change in the fair value as of the vesting date from the beginning of the applicable year; |
| (iv) | the vesting date fair value of any equity awards that are granted and vest in the applicable year; |
| (v) | awards that fail to meet vesting conditions during the fiscal year and are no longer outstanding; and |
| (vi) | value of dividends not otherwise captured in the calculation of each Fair Value used to calculate CAP. |
While the equity awards disclosed in the Summary Compensation Table are based on the grant date fair values computed in accordance with FASB ASC Topic 718, the equity award values disclosed pursuant to CAP in the table above are calculated in the following manner: |
| • | The stock prices used to calculate the figures in columns (i) and (ii) in the above table are as follows: $27.58 on December 31, 2024 and $27.06 on December 31, 2025. The stock prices used to calculate the figures in column (iii) in the above table are based on the closing prices on the vesting dates of the applicable awards. |
| • | The valuation assumptions and processes used to recalculate fair values did not materially differ from those disclosed at the time of grant. |
| (c) | “Compensation actually paid” does not necessarily represent cash and/or equity value transferred to the applicable NEO without restriction, but rather is a value calculated under applicable SEC rules. |
| (3) | The dollar amounts reported in column (d) are the average amounts of total compensation reported for the other Named Executive Officers for each corresponding year in the “Total” column of the Summary Compensation Table. Refer to the Summary Compensation Table as set forth on page 49 of this proxy statement, on page 54 of the prior year’s proxy statement filed with the SEC on April 28, 2025, and on page 53 of the proxy statement filed with the SEC on April 26, 2024. For each of 2021, 2022, 2023, 2024, and 2025, the other NEOs were: |
2025 |
Peter M. Graham, Kerri A. Palmer, Donna F. Vieira, Nicolas Jafarieh | |
2024 |
Peter M. Graham, Kerri A. Palmer, Donna F. Vieira, Nicolas Jafarieh | |
2023 |
Peter M. Graham, Kerri A. Palmer, Donna F. Vieira, Nicolas Jafarieh, Steven J. McGarry | |
2022 |
Steven J. McGarry, Kerri A. Palmer, Donna F. Vieira, Daniel P. Kennedy | |
2021 |
Steven J. McGarry, Kerri A. Palmer, Donna F. Vieira, Daniel P. Kennedy | |
| (4) | TSR is determined based on the value of an initial fixed investment of $100 measured from December 31, 2020. The TSR peer group consists of the S&P Supercomposite Consumer Finance Sub-Industry Index, which is used for our Stock Performance presentation set forth in the Company’s Annual Report on Form 10-K for the year ended December 31, 2025. |
| (5) | Our Company-Selected Measure is Relative TSR consistent with the peer group used in the PSU metric under our annual Long-Term Incentive Program. For illustrative purposes, calculations within this column are based on 1-year measurements (as opposed to the 3-year relative TSR performance period regarding the Company’s PSUs). For purposes of relative TSR, the peer group used in the PSU metric under our annual Long-Term Incentive Program consists of: (i) the S&P Supercomposite Consumer Finance Sub-Industry Index and (ii) the S&P 400 Regional Bank Sub-Industry Index. |
| (3) | The dollar amounts reported in column (d) are the average amounts of total compensation reported for the other Named Executive Officers for each corresponding year in the “Total” column of the Summary Compensation Table. Refer to the Summary Compensation Table as set forth on page 49 of this proxy statement, on page 54 of the prior year’s proxy statement filed with the SEC on April 28, 2025, and on page 53 of the proxy statement filed with the SEC on April 26, 2024. For each of 2021, 2022, 2023, 2024, and 2025, the other NEOs were: |
2025 |
Peter M. Graham, Kerri A. Palmer, Donna F. Vieira, Nicolas Jafarieh | |
2024 |
Peter M. Graham, Kerri A. Palmer, Donna F. Vieira, Nicolas Jafarieh | |
2023 |
Peter M. Graham, Kerri A. Palmer, Donna F. Vieira, Nicolas Jafarieh, Steven J. McGarry | |
2022 |
Steven J. McGarry, Kerri A. Palmer, Donna F. Vieira, Daniel P. Kennedy | |
2021 |
Steven J. McGarry, Kerri A. Palmer, Donna F. Vieira, Daniel P. Kennedy | |
Sub-Industry
Index, which is used for our Stock Performance presentation set forth in the Company’s Annual Report on Form 10-K
for the year ended December 31, 2025.
Fiscal Year |
Executives |
SCT (a) |
(Minus) Grant Date Fair Value of New Awards (b) |
Plus Year End Fair Value of New Awards (i) |
(Minus) Change in Fair Value of Prior Awards (ii) |
Plus Change in Fair Value of Vested Awards Granted in Prior Fiscal Years (iii) |
Plus Fair Value of Vested Awards Granted and Vested in Current Fiscal Year (iv) |
Plus Fair Value at Start of Fiscal Year of Awards That Failed to Meet Vesting Conditions (v) |
Plus Value of Dividends Paid on Equity Awards not reflected in Fair Value (vi) |
Equals CAP (c) |
||||||||||||||||||||||
2025 |
CEO | $ | 11,261,733 | ($ | 8,444,994 | ) | $ | 6,546,140 | ($ | 2,477,574 | ) | $ | 1,356,309 | $0 | $0 | $0 | $ | 8,241,614 | ||||||||||||||
2025 |
Other NEOs | $ | 2,878,895 | ($ | 1,444,332 | ) | $ | 1,157,770 | ($ | 302,154 | ) | $ | 198,976 | $0 | $0 | $0 | $ | 2,489,155 | ||||||||||||||
| (a) | The dollar amounts reported in the Summary Compensation Table for the applicable year. |
| (b) | The grant date fair value of equity awards represents the total of the amounts reported in the “Stock Awards” column in the Summary Compensation Table for the applicable year. |
The recalculated value of equity awards for each applicable year includes the addition (or subtraction, as applicable) of the following: |
| (i) | the year-end fair value of any equity awards granted in the applicable year that are outstanding and unvested as of the end of the year; |
| (ii) | the amount of change as of the end of the applicable year (from the end of the prior fiscal year) in fair value of any awards granted in prior years that are outstanding and unvested as of the end of the applicable year; |
| (iii) | for awards that are granted in prior years and vest in the applicable year, the change in the fair value as of the vesting date from the beginning of the applicable year; |
| (iv) | the vesting date fair value of any equity awards that are granted and vest in the applicable year; |
| (v) | awards that fail to meet vesting conditions during the fiscal year and are no longer outstanding; and |
| (vi) | value of dividends not otherwise captured in the calculation of each Fair Value used to calculate CAP. |
While the equity awards disclosed in the Summary Compensation Table are based on the grant date fair values computed in accordance with FASB ASC Topic 718, the equity award values disclosed pursuant to CAP in the table above are calculated in the following manner: |
| • | The stock prices used to calculate the figures in columns (i) and (ii) in the above table are as follows: $27.58 on December 31, 2024 and $27.06 on December 31, 2025. The stock prices used to calculate the figures in column (iii) in the above table are based on the closing prices on the vesting dates of the applicable awards. |
| • | The valuation assumptions and processes used to recalculate fair values did not materially differ from those disclosed at the time of grant. |
| (c) | “Compensation actually paid” does not necessarily represent cash and/or equity value transferred to the applicable NEO without restriction, but rather is a value calculated under applicable SEC rules. |
Compensation Actually Paid against Company and Peer Group TSR
Compensation Actually Paid against Net Income
Compensation Actually Paid against Relative TSR Percentile
Compensation Actually Paid against Company and Peer Group TSR
2025 Performance Measures
The Compensation Committee uses a mix of performance measures throughout the AIP
and
LTIP in order to align executive pay with Company performance. As required by SEC rules, the performance measures identified as the most important for NEOs
’ 2025 compensation decisions are listed in the table below. These performance measures are each described in more detail in the
CD&A. Most Important Performance Measures |
Relative TSR |
Adjusted Income Per Share |
Loan Originations |
Adjusted Non-interest Expenses |
Net Charge-Offs |