Pay vs Performance Disclosure - USD ($)
|
12 Months Ended |
48 Months Ended |
Dec. 31, 2025 |
Dec. 31, 2024 |
Dec. 31, 2023 |
Dec. 31, 2022 |
Dec. 31, 2021 |
Dec. 31, 2024 |
| Pay vs Performance Disclosure |
|
|
|
|
|
|
| Pay vs Performance Disclosure, Table |
| | | | | | | | | | | | | | | | | | | | | | | | | | | | | | | | | | | | | | | | | | | | | | | | | | | | | | | | | | | | | Value of Initial Fixed $100 Investment
Based on: | | | | | | Year | | Summary Compensation Table Total for PEO(1) ($) | | Compensation Actually Paid to PEO(2) ($) | | Average Summary Compensation Table Total for Non-PEO Named Executive Officers
($) | | Average Compensation Actually Paid to Non-PEO Named Executive Officers(3) ($) | | Total Shareholder Return(4) ($) | | Peer Group Total Shareholder Return(5) ($) | | Net Income(6) ($) (in millions) | | Adjusted Operating Income(7) ($) (in millions) | | 2025 | (8) | $ | 3,036,220 | | | $ | 3,036,220 | | | $ | 1,916,452 | | | $ | 839,659 | | | $ | 67.90 | | | $ | 66.56 | | | $ | 177.2 | | | $ | 301.6 | | | 2024 | (9) | 2,853,738 | | | 2,853,738 | | | 1,889,444 | | | 1,664,235 | | | 101.44 | | | 92.15 | | | 223.3 | | | 312.4 | | | 2023 | (9) | 1,623,464 | | | 968,673 | | | 1,699,055 | | | 1,182,396 | | | 94.73 | | | 99.25 | | | 251.4 | | | 365.7 | | | 2022 | (9) | 2,764,214 | | | 2,496,787 | | | 1,660,499 | | | 1,392,203 | | | 102.75 | | | 77.36 | | | 311.4 | | | 477.7 | | | 2021 | (9) | 4,751,179 | | | 4,693,851 | | | 1,788,194 | | | 2,013,948 | | | 112.63 | | | 110.85 | | | 354.1 | | | 504.7 | |
|
|
|
|
|
|
| Company Selected Measure Name |
(7)Adjusted Operating Income
|
|
|
|
|
|
| Named Executive Officers, Footnote |
Reflects compensation amounts reported in the “Summary Compensation Table” (“SCT”) for our PEO, Timothy P. Boyle for the respective years shown.
|
|
|
|
|
In 2021-2024, the Non-PEO NEOs were Joseph P. Boyle, Peter J. Bragdon, Jim A. Swanson, and Steven M. Potter.
|
| Peer Group Issuers, Footnote |
The peer group reflected for each fiscal year is the Russell 1000 Clothing and Accessories Index, which is used in the performance graph included in the Company’s Annual Report on Form 10-K for fiscal year 2025.
|
|
|
|
|
|
| PEO Total Compensation Amount |
$ 3,036,220
|
$ 2,853,738
|
$ 1,623,464
|
$ 2,764,214
|
$ 4,751,179
|
|
| PEO Actually Paid Compensation Amount |
$ 3,036,220
|
2,853,738
|
968,673
|
2,496,787
|
4,693,851
|
|
| Adjustment To PEO Compensation, Footnote |
For 2025, there were no adjustments made in the PVP Table to arrive at CAP for our PEO.
|
|
|
|
|
|
| Non-PEO NEO Average Total Compensation Amount |
$ 1,916,452
|
1,889,444
|
1,699,055
|
1,660,499
|
1,788,194
|
|
| Non-PEO NEO Average Compensation Actually Paid Amount |
$ 839,659
|
1,664,235
|
1,182,396
|
1,392,203
|
2,013,948
|
|
| Adjustment to Non-PEO NEO Compensation Footnote |
For 2025, the following table sets forth the adjustments made in the PVP Table to arrive at CAP for our Non-PEO NEOs: | | | | | | | Average Adjustments to Determine Compensation “Actually Paid” for Non-PEO NEOs | 2025 | | Average Summary Compensation Table Total | $ | 1,916,452 | | | Subtract: Average Amounts Reported under “Stock Awards” Column in the SCT | (507,988) | | | Subtract: Average Amounts Reported under “Option Awards” Column in the SCT | (239,688) | | | Add: Average Fair Value of Awards Granted during Year that Remain Unvested as of Year-end | 265,624 | | Add: Average Fair Value of Awards Granted during Year and Vested during Year | 15,466 | | Add/Subtract: Average Change in Fair Value from Prior Year-end to current Year-end of Awards Granted Prior to Year that were Outstanding and Unvested as of Year-end | (345,467) | | Add/Subtract: Average Change in Fair Value as of Vesting Date of Awards Granted Prior to Year that Vested during Year | 2,916 | | Subtract: Average Fair Value from Prior Year-end of Awards Granted in Prior Years that failed to meet vesting conditions during the Year | (267,656) | | | Average Compensation Actually Paid (as calculated) | $ | 839,659 | |
Non-PEO NEO Equity Valuations: All valuations of equity awards were estimated using assumptions and methodologies substantially consistent with those used at grant. These methodologies are consistent with the principles in FASB ASC 718 and are described further in our Annual Reports on Form 10-K. Stock option fair values are calculated based on the Black-Scholes option-pricing model as of each measurement date using updated stock price and other model inputs (i.e., expected term, volatility, dividend yield, risk-free rate) as of the measurement date. Time-based RSU fair values are calculated using the stock price as of each measurement date, reduced by the present value of dividends not received during the vesting period. PRSU fair values are calculated using the stock price as of each measurement date, reduced by the present value of dividends not received during the vesting period and reflect the probable outcome of the performance vesting conditions and Relative TSR PRSU fair value is calculated pursuant to a Monte Carlo simulation.
|
|
|
|
|
|
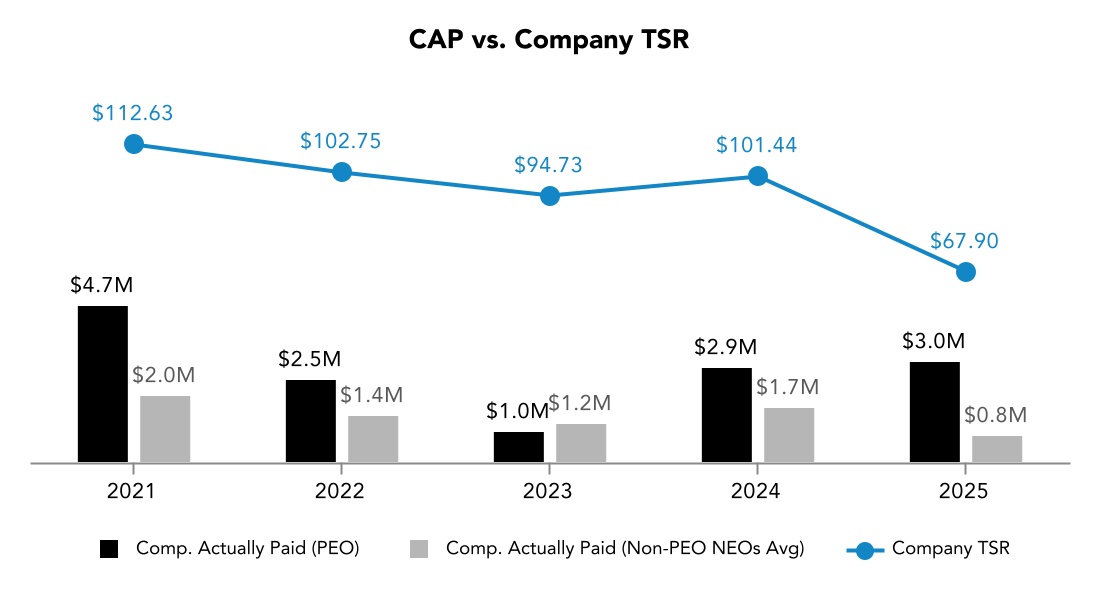
| Compensation Actually Paid vs. Total Shareholder Return |
CAP Versus the Company’s Cumulative TSR The following chart shows the relationship between the CAP to our PEO, the average CAP to our Non-PEO NEOs and the Company’s cumulative TSR over the five most recently completed fiscal years.
|
|
|
|
|
|
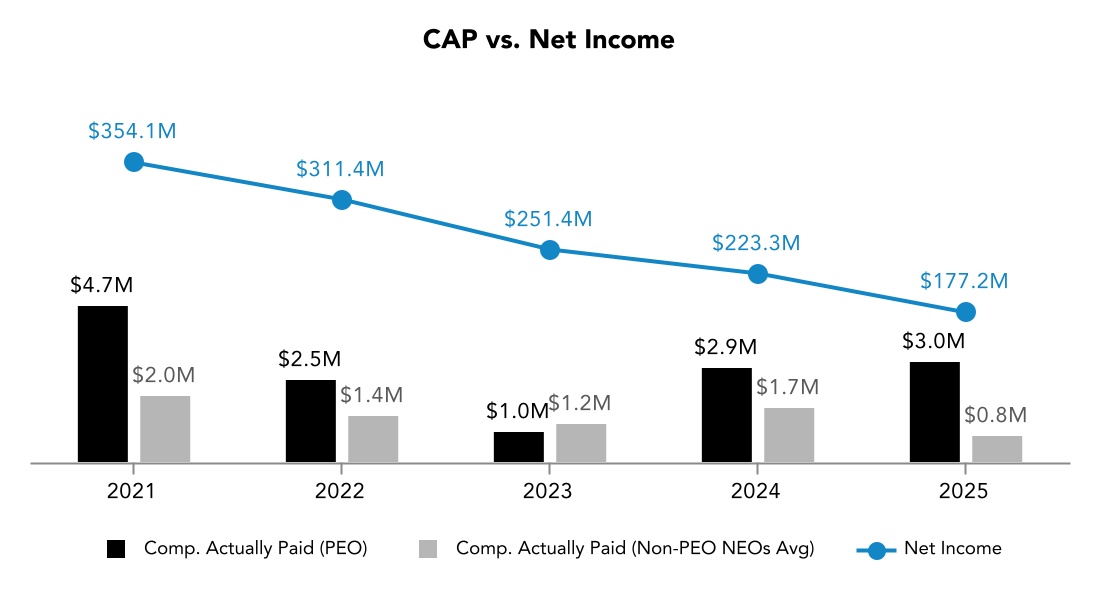
| Compensation Actually Paid vs. Net Income |
CAP Versus the Company’s Net Income The following chart shows the relationship between the CAP to our PEO, the average CAP to our Non-PEO NEOs and the Company’s net income over the five most recently completed fiscal years.
|
|
|
|
|
|
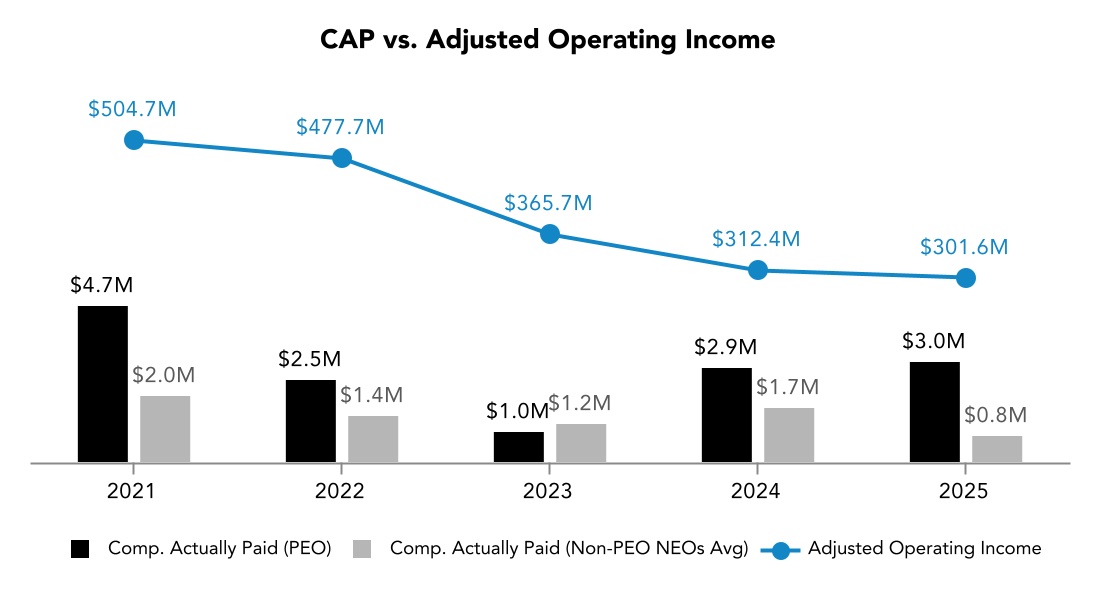
| Compensation Actually Paid vs. Company Selected Measure |
CAP Versus the Company’s Adjusted Operating Income The following chart shows the relationship between the CAP to our PEO, the average CAP to our Non-PEO NEOs and the Company’s adjusted operating income over the five most recently completed fiscal years.
|
|
|
|
|
|
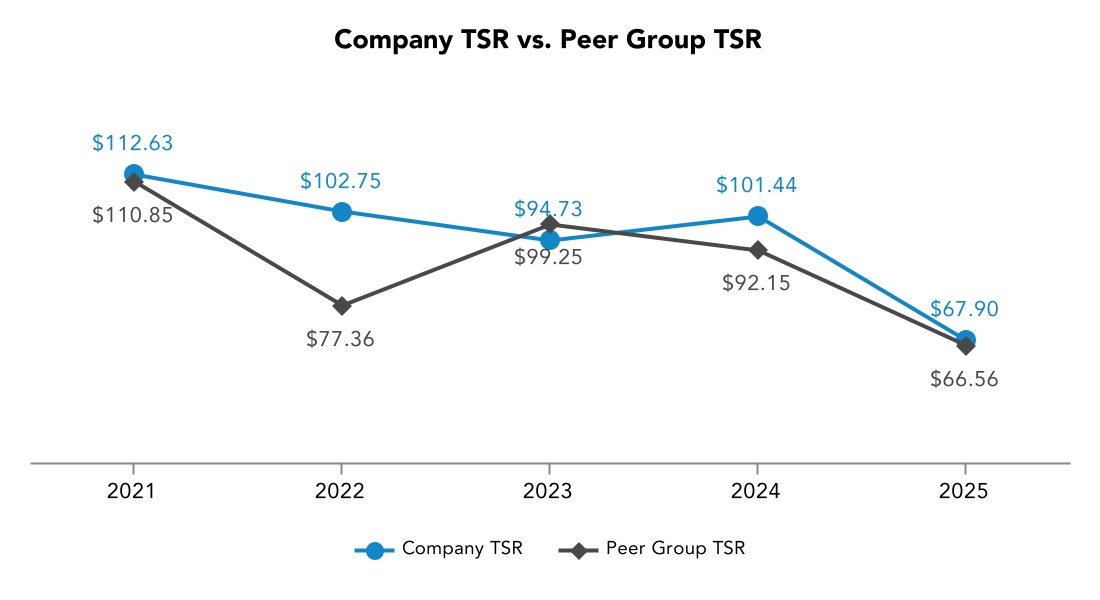
| Total Shareholder Return Vs Peer Group |
Company’s TSR and Peer Group Cumulative TSR The following chart compares our cumulative TSR over the five most recently completed fiscal years to that of our peer group TSR comprising the Russell 1000 Clothing and Accessories Index over the same period.
|
|
|
|
|
|
| Tabular List, Table |
| | | Top Financial Performance Measures Linking CAP to Company Performance in 2025 | •Adjusted Operating Income | •Adjusted Cumulative Operating Income | •Relative Total Shareholder Return | •Share Price |
|
|
|
|
|
|
| Total Shareholder Return Amount |
$ 67.90
|
101.44
|
94.73
|
102.75
|
112.63
|
|
| Peer Group Total Shareholder Return Amount |
66.56
|
92.15
|
99.25
|
77.36
|
110.85
|
|
| Net Income (Loss) |
$ 177,200,000
|
$ 223,300,000
|
$ 251,400,000
|
$ 311,400,000
|
$ 354,100,000
|
|
| Company Selected Measure Amount |
301,600,000
|
312,400,000
|
365,700,000
|
477,700,000
|
504,700,000
|
|
| PEO Name |
Timothy P. Boyle
|
|
|
|
|
|
| Additional 402(v) Disclosure |
Total Shareholder Return assumes an initial investment of $100 on December 31, 2020, including the reinvestment of dividends.The dollar amounts reported represent the amount of net income (in millions) reflected in the Company’s audited consolidated financial statements for the applicable year.
|
|
|
|
|
|
| Measure:: 1 |
|
|
|
|
|
|
| Pay vs Performance Disclosure |
|
|
|
|
|
|
| Name |
•Adjusted Operating Income
|
|
|
|
|
|
| Non-GAAP Measure Description |
Adjusted Operating Income equals Operating Income for the fiscal year as set forth in the audited consolidated financial statements of the Company, adjusted for annual corporate bonus expense and certain excluded items approved by the Talent and Compensation Committee as more fully described for 2025 above on page 24 of the Compensation Discussion and Analysis. We determined this to be the most important financial performance measure used to link Company performance to CAP to our PEO and Non-PEO NEOs in 2025.
|
|
|
|
|
|
| Measure:: 2 |
|
|
|
|
|
|
| Pay vs Performance Disclosure |
|
|
|
|
|
|
| Name |
•Adjusted Cumulative Operating Income
|
|
|
|
|
|
| Measure:: 3 |
|
|
|
|
|
|
| Pay vs Performance Disclosure |
|
|
|
|
|
|
| Name |
•Relative Total Shareholder Return
|
|
|
|
|
|
| Measure:: 4 |
|
|
|
|
|
|
| Pay vs Performance Disclosure |
|
|
|
|
|
|
| Other Performance Measure, Amount |
100
|
|
|
|
|
|
| Name |
•Share Price
|
|
|
|
|
|
| Non-PEO NEO | Year-end Fair Value of Equity Awards Granted in Covered Year that are Outstanding and Unvested |
|
|
|
|
|
|
| Pay vs Performance Disclosure |
|
|
|
|
|
|
| Adjustment to Compensation, Amount |
$ 265,624
|
|
|
|
|
|
| Non-PEO NEO | Year-over-Year Change in Fair Value of Equity Awards Granted in Prior Years That are Outstanding and Unvested |
|
|
|
|
|
|
| Pay vs Performance Disclosure |
|
|
|
|
|
|
| Adjustment to Compensation, Amount |
(345,467)
|
|
|
|
|
|
| Non-PEO NEO | Vesting Date Fair Value of Equity Awards Granted and Vested in Covered Year |
|
|
|
|
|
|
| Pay vs Performance Disclosure |
|
|
|
|
|
|
| Adjustment to Compensation, Amount |
15,466
|
|
|
|
|
|
| Non-PEO NEO | Change in Fair Value as of Vesting Date of Prior Year Equity Awards Vested in Covered Year |
|
|
|
|
|
|
| Pay vs Performance Disclosure |
|
|
|
|
|
|
| Adjustment to Compensation, Amount |
2,916
|
|
|
|
|
|
| Non-PEO NEO | Prior Year End Fair Value of Equity Awards Granted in Any Prior Year that Fail to Meet Applicable Vesting Conditions During Covered Year |
|
|
|
|
|
|
| Pay vs Performance Disclosure |
|
|
|
|
|
|
| Adjustment to Compensation, Amount |
(267,656)
|
|
|
|
|
|
| Non-PEO NEO | Aggregate Grant Date Fair Value Of Stock Award Amounts Reported In Summary Compensation Table [Member] |
|
|
|
|
|
|
| Pay vs Performance Disclosure |
|
|
|
|
|
|
| Adjustment to Compensation, Amount |
(507,988)
|
|
|
|
|
|
| Non-PEO NEO | Aggregate Grant Date Fair Value Of Option Award Amounts Reported In Summary Compensation Table [Member] |
|
|
|
|
|
|
| Pay vs Performance Disclosure |
|
|
|
|
|
|
| Adjustment to Compensation, Amount |
$ (239,688)
|
|
|
|
|
|