Table of Contents
As Filed with the Securities and Exchange Commission on April 28, 2026
Registration File Nos. 333-292533
811-08963
SECURITIES AND EXCHANGE COMMISSION
Washington, D.C. 20549
FORM N-4
REGISTRATION STATEMENT
UNDER
| THE SECURITIES ACT OF 1933 | ☐ | |
| PRE-EFFECTIVE AMENDMENT NO. | ☐ | |
| POST-EFFECTIVE AMENDMENT NO. 2 | ☒ |
and/or
REGISTRATION STATEMENT
UNDER
| THE INVESTMENT COMPANY ACT OF 1940 | ☐ | |
| AMENDMENT NO. 63 | ☒ |
(Check appropriate box or boxes.)
TIAA SEPARATE ACCOUNT VA-5
(Exact name of registrant)
Teachers Insurance and
Annuity Association of America
(Name of Insurance Company)
730 Third Avenue
New York, NY 10017
(Address of Insurance Company’s Principal Executive Offices)
Insurance Company’s Telephone Number, including Area Code: (212) 490-9000
| Name and Address of Agent for Service: | Copy to: | |
| John D. Piller, Sr. Esquire | Harry Eisenstein, Esquire | |
| Teachers Insurance and Annuity | Carlton Fields, P.A. | |
| Association of America | 1625 Eye Streer, NW | |
| 8500 Andrew Carnegie Boulevard, SSC-C2-04 | Suite 800, Washington, DC 20006 | |
| Charlotte, North Carolina 28262 | (202) 965-8142 | |
Approximate Date of Proposed Public Offering:
It is proposed that this filing will become effective (check appropriate box)
| ☐ | immediately upon filing pursuant to paragraph (b) of Rule 485 |
| ☒ | on May 1, 2026 pursuant to paragraph (b) of Rule 485 |
| ☐ | 60 days after filing pursuant to paragraph (a)(1) of Rule 485 |
| ☐ | on (date) pursuant to paragraph (a)(1) of Rule 485 |
If appropriate, check the following box:
| ☐ | This post-effective amendment designates a new effective date for a previously filed post-effective amendment. |
Table of Contents
PROSPECTUS
May 1, 2026
SINGLE PREMIUM IMMEDIATE ANNUITIES
Single Premium Immediate Variable Annuity Contracts Funded Through
TIAA Separate Account VA-5 of Teachers Insurance and Annuity Association of America
Important Note: TIAA is no longer offering the Single Premium Variable Annuity contracts for sale. Existing Contracts, or replacements for those Contracts, remain in effect.
This Prospectus describes information you should know about our Single Premium Immediate Variable Annuity Contracts (“SPIA” or “Contract”), which are offered by Teachers Insurance and Annuity Association of America (“TIAA”) and funded through the TIAA Separate Account VA-5 (the Separate Account). Before you invest, please read this Prospectus carefully, along with the underlying Fund Prospectus, and keep it for future reference.
Information explaining the Separate Account and Investments Options offered under the contract is detailed in the Separate Account overview and the Appendix.
Additional information about certain investment products, including variable annuities, has been prepared by the Securities and Exchange Commission’s (“SEC”) staff and is available at Investor.gov.
This Prospectus describes the Contracts issued by TIAA. It does not constitute an offering in any jurisdiction where such an offering cannot lawfully be made. The Contract is a complex investment vehicle and involves risks, including potential loss of principal. The contract is not a short-term investment and is not appropriate for an investor who needs ready access to cash. The issuer’s obligations under the Contract are subject to its financial strength and claims-paying ability. No dealer, salesperson, or anyone else is authorized to give any information or to make any representation about this offering other than what is contained in this Prospectus. If anyone does so, you should not rely on it. In addition, the Contracts or certain investment options under the Contracts will not be available to you unless approved by the regulatory authorities in your state.
The SEC has not approved or disapproved these securities or passed upon the adequacy of this Prospectus. Any representation to the contrary is a criminal offense.

Table of Contents
| 13 | ||||
| Transfer policies regarding Market Timing and excessive trading |
14 | |||
| Annuity Payments | 14 | |||
| 14 | ||||
| 14 | ||||
| 15 | ||||
| 15 | ||||
| 15 | ||||
| 15 | ||||
| 16 | ||||
| Benefits Available Under The Contract | 16 | |||
| The Contract Charges | 16 | |||
| 17 | ||||
| 17 | ||||
| Tax Matters | 17 | |||
| Other Information | 19 | |||
| 19 | ||||
| 19 | ||||
| 19 | ||||
| 19 | ||||
| 19 | ||||
| General Matters | 20 | |||
| 20 | ||||
| 20 | ||||
| 20 | ||||
| 20 | ||||
| 20 | ||||
| 21 | ||||
| 21 | ||||
| Appendix | 22 | |||
| 22 | ||||
| Single Premium Immediate Annuities Prospectus | 1 |
Table of Contents
Throughout the Prospectus, “TIAA,” “we,” and “our” refer to Teachers Insurance and Annuity Association of America. “You” and “your” mean any Contract owner or any prospective Contract owner.
1940 Act. The Investment Company Act of 1940, as amended.
Annuitant. The natural person whose life is used in determining the annuity payments to be received. The Annuitant may be the Contract owner or another person.
Annuity Unit. A measure used to calculate the amount of each variable annuity payment made under a contract.
Assumed Investment Return. This is the assumed annual rate of return used in calculating the amount of each variable annuity payment.
Beneficiary. The person or institution selected by the Contract owner to become the new Contract owner if the Contract owner dies while any annuity payments remain due.
Business Day. Any day that the New York Stock Exchange (NYSE) is open for trading. A Business Day ends at 4 p.m. Eastern Time, or when regular trading closes on the NYSE, if earlier.
Calendar Day. Any day of the year.
Commuted Value. The amount we will pay under certain circumstances in a lump sum instead of the remaining series of annuity payments. This amount is less than the total of the future payments, because the future interest assumed in computing the series of payments will not be earned if payment is made in one sum. For the Fixed Account, the Commuted Value is the sum of payments less the interest that would have been earned from the effective date of the Commuted Value calculation to the date each payment would have been made. For any variable Investment Account, the Commuted Value is based on interest at an effective annual rate of 4%, calculated using the amounts that would have been paid if periodic payments were to continue and the Annuity Unit value used for each payment equaled the value as of the effective date of the calculation.
Contract(s). The One-Life Annuity, the Two-Life Annuity, and the Fixed-Period Annuity SPIA Contracts offered by TIAA.
Contract owner. The person (or persons) who controls all the rights and benefits under a contract.
Current Value. The Present Value of the future annuity payments, which for variable payments is computed using the assumption that the relevant Investment Account has an effective annual rate of 4%. In the case of the One-Life and Two-Life Annuities, the Present Value is determined based on the age of the Annuitant(s), if alive; the remaining guaranteed period, if any; the frequency of payment; and the mortality tables used to determine the initial amount of annuity payments. In the case of the Fixed-Period Annuity, it is determined based on the last periodic payment date and the frequency of payment. This “Current Value” definition is used in determining the value of a refund in the event a contract is cancelled during the free look period.
Fixed Account. The account under the Contract supporting fixed annuity payments funded by assets in TIAA’s General Account.
Fund(s) or Underlying Fund(s). An investment company that is registered with the SEC in which an Investment Account is invested. The Contract allows you to indirectly invest in a series of investment companies that are listed on the front page of this Prospectus.
General Account. All of TIAA’s assets other than those allocated to the Separate Account or to any other TIAA Separate Account.
Good Order. An instruction that is received by TIAA that is sufficiently complete and clear, along with all forms, information, and supporting legal documentation so that TIAA does not need to exercise any discretion to follow such instruction. All orders to process any changes or transaction must be in Good Order. With respect to purchase requests, Good Order also generally includes receipt by us of sufficient funds to effect the transaction.
Income Change Method. The method you select for how often your variable annuity payments will be revalued. You can choose a monthly or annual Income Change Method.
Income Option. The form of annuity benefit that you select under the Two-Life Annuity. The Income Options for the Two-Life Annuity are: the Two-Life Annuity with Full Benefit While Either Annuitant Survives; the Two-Life Annuity with Two-Thirds Benefit While Either Annuitant Survives; and the Two-Life Annuity with One-Half Benefit While Second Annuitant Survives First Annuitant.
Investment Account. A sub-account of the Separate Account that invests its assets in shares of a corresponding Fund.
IRC. The Internal Revenue Code of 1986, as amended.
Issue Date. The day that the Contract is issued and becomes effective.
Non-Qualified Contracts. Annuity Contracts that are not issued in connection with a retirement plan intended to qualify for special federal income tax treatment under the IRC.
Premium. The amount you invest in the Contract.
Present Value. The Present Value of a series of payments is the lump-sum amount that is the current equivalent of a series of future payments calculated on the basis of a specified interest rate and, where applicable, mortality table.
Second Annuitant. The natural person whose life, together with the Annuitant’s life, is used to determine the amount of annuity payments and how long those payments will be made under the Two-Life Annuity Contract.
Separate Account. TIAA Separate Account VA-5.
| 2 | Prospectus Single Premium Immediate Annuities |
Table of Contents
SPIA(s). Three types of a Single Premium Immediate Annuity contract offered by TIAA. A One-Life Annuity, Two-Life Annuity, or a Fixed-Period Annuity.
TC Services. TIAA-CREF Individual & Institutional Services, LLC.
TIAA. Teachers Insurance and Annuity Association of America.
Nuveen Life Funds. Formerly known as TIAA-CREF Life Funds. The following are the eight Funds currently available under the Contracts as investment options through the Separate Account: Nuveen Life Growth Equity Fund, Nuveen Life Real Estate Securities Select Fund, Nuveen Life Core Equity Fund, Nuveen Life Small Cap Equity Fund, Nuveen Life International Equity Fund, Nuveen Life Large Cap Responsible Equity Fund, Nuveen Life Large Cap Value Fund and Nuveen Life Stock Index Fund (collectively, the “Nuveen Life Funds”).
Valuation Day. Any Business Day. Valuation days end as of the close of all U.S. national exchanges where securities or other investments of the Separate Account are principally traded.
| Single Premium Immediate Annuities Prospectus | 3 |
Table of Contents
Purpose of the Contract
The Contract is an individual single premium immediate variable annuity contract designed to accept a single lump sum premium and turn it into an immediate income stream of scheduled annuity payments. The annuity payments may be for the life of the named Annuitant(s), which may be you or another person named under the Contract, or for a specified period of time you select. You choose the frequency of these payments and the length of the annuity payments will depend on the Income Option you choose. You can choose fixed or variable annuity payments (or any combination of fixed and variable annuity payments) by allocating your single premium to the Fixed Account or to one or more of the Separate Account Investment Accounts. Annuity payments from the Fixed Account provide a fixed income payment at a minimum guaranteed interest rate. Annuity payments from Investment Accounts vary depending upon the Annuity Unit Value of each Account, which fluctuates depending upon market performance and may lose value, including loss of principal. Additional information about the underlying Funds ,also including the variable and fixed options is provided below in this Prospectus and in “Appendix A- Funds Available Under the Contract.”
You can transfer all or part of the future annuity income payable between the Fixed Account and the Investment Accounts. Transfers from the Fixed Account to an Investment Account may only be done through periodic transfers as described in the Contract. There are significant limitations on your right to transfer annuity income from the Fixed Account to Investment Accounts. We do not assess a transaction charge with any transfer.
You bear the risk of any decline in the account balance of your Contract resulting from the performance of the underlying Funds you have chosen. Your account value could decline significantly, and there is a risk of loss of the entire amount invested. You should consider the investment objectives, risks, and charges and expenses of each underlying Fund carefully before making an investment decision.
The Contract may be appropriate if you are ready to begin receiving annuity income payments immediately. It may not be appropriate for investors who may need to make additional withdrawals beyond the elected income payout options or those who intend to engage in frequent transfers.
Annuity Phase.
The Contract has only one phase, the annuity (or income) phase. Since your single premium payment is applied to provide immediate income, the Contract does not have an accumulation phase. Generally, there is no opportunity to withdraw from your account value other than through selecting an Income Option, or under certain circumstances, opting for a Commuted Value lump sum payout under a guaranteed period annuity or fixed-period annuity (see, below “Receiving a Lump-Sum Payment”).
The annuity phase begins when your application is approved and the Contract is issued. Your annuity income payments will start on the date you choose. You can choose between fixed or variable income payments, or a combination of these. Annuity income payments can be paid for an agreed upon timeframe, or for your lifetime.
Contract Features
Annuity Payments. The Contract provides for immediate income as scheduled payments.
Investment Options. The Contract provides the opportunity for tax-deferred growth by allocating your initial premium to a variety of investment options in addition to the Fixed Account.
Tax Treatment. You can transfer money between Investment Accounts without tax implications. Consult with a qualified tax adviser to determine the tax implications of annuity income payments received from the Contract.
| 4 | Prospectus Single Premium Immediate Annuities |
Table of Contents
IMPORTANT INFORMATION YOU SHOULD CONSIDER ABOUT THE CONTRACT
| FEES AND EXPENSES | Location in Prospectus | |||||||
|
Are There Charges for Early Withdrawals? |
None | Contract Options | ||||||
|
Are There Transaction Charges? |
None | Changing Investment Accounts and Income Change Methods | ||||||
| Are There Ongoing Fees and Expenses annual charges? |
The table below describes the fees and expenses that you may pay each year, depending on the options you choose. Please refer to your Contract specifications page for information about the specific fees you will pay each year based on the options you have elected. | |||||||
| Annual Fee | Minimum | Maximum | ||||||
| Base Contract1 | 0.60% | 0.60% | The Contract Charges | |||||
| Investment Options (Underlying Fund fees and expenses)2 |
0.08% | 0.60% | Other Charges and Expenses Appendix A—Funds Available Under the Contract | |||||
| Optional benefits available for an additional charge (for single optional benefit, if elected)3 | None | None | Benefits Available Under the Contract | |||||
| 1 Deducted daily as a percentage of average account value. 2 As a percentage of net assets. 3 There are no optional benefits available under the Contract. |
||||||||
| Because your Contract is customizable, the choices you make affect how much you will pay. To help you understand the cost of owning your Contract, the following table shows the lowest and highest cost you could pay each year, based on current charges. This estimate assumes that you do not take withdrawals from the Contract. | ||||||||
| Lowest Annual Cost: $1,312 | Highest Annual Cost: $1,845 | |||||||
| Assumes:
• Investment of $100,000
• 5% annual appreciation
• Least expensive Underlying Fund fees and expenses
• No optional benefits
• No sales charges
• No additional purchase payments, transfers or withdrawals |
Assumes:
• Investment of $100,000
• 5% annual appreciation
• Most expensive combination of Underlying Fund fees and expenses
• No optional benefits2
• No sales charges
• No additional purchase payments, transfers or withdrawals |
|||||||
| There are no optional benefits available under the Contract. | ||||||||
| RISKS | Location in Prospectus | |||||||
| Is There a Risk of Loss from Poor Performance? | • You can lose money by investing in your Contract, including loss of principal. |
Principal Risks of Investing in the Contract | ||||||
| Is this a Short-Term Investment? | • The Contract is not designed for short-term investing and is not appropriate for an investor who needs ready access to cash. |
Principal Risks of Investing in the Contract | ||||||
| What are the Risks Associated with Investment Options? | • An investment in the Contract is subject to the risk of poor investment performance. Performance can vary depending on the performance of the investment options that you choose under the Contract (e.g., Underlying Funds).
• Each investment option (including any Fixed Account investment option) has its own unique risks.
• You should review the investment options before making an investment decision. |
Principal Risks of Investing in the Contract | ||||||
| What are the Risks Related to the Insurance Company? | • An investment in the Contract is subject to risks related to TIAA, and any obligations, guarantees or benefits of the Contract are subject to TIAA’s claims-paying ability. More information about TIAA, including its financial strength ratings, is available upon request by visiting our website at: tiaa.org/public/. |
Principal Risks of Investing In the Contract | ||||||
| RESTRICTIONS | Location in Prospectus | |||||||
| Are there Restrictions on the Investment Options? | • We have adopted policies and procedures to discourage market timing and frequent transaction activity.
• We have limited the number of transfers and exchanges permitted into or out of an Investment Account.
• We reserve the right to add or close Investment Accounts, substitute another fund or other investment vehicles or combine Investment Accounts. |
Transfer Policies Regarding Market Timing and Excessive Trading
Transfer Policies Regarding Market Timing and Excessive Trading
Changing Investment Accounts and Income Change Methods
Adding and Closing Accounts or Substituting Funds; Adding or Deleting Contract Options or Income Methods | ||||||
| Are There any Restrictions on the Optional Benefits? | • There are no optional benefits associated with the Contract. |
Benefits Available Under the Contract | ||||||
| Single Premium Immediate Annuities Prospectus | 5 |
Table of Contents
| TAXES | Location in Prospectus | |||||||
| What are the Contracts’ Tax Implications? | • You should consult with a tax professional to determine the tax implications of an investment in and purchase payments received under the Contract.
• Generally, you are not taxed until you begin receiving income payments from the Income Option you selected under Contract.
• Income payments you receive from the Income Option you selected will be subject to ordinary income tax and may be subject to tax penalties if taken before age 591⁄2.
• Premium taxes may apply. |
Possible Adverse Tax Consequences.
Tax Matters
Tax Matters
Premium Taxes | ||||||
| CONFLICTS OF INTEREST | Location in Prospectus | |||||||
| How are the Investment Professional Compensated? | • Your investment professional may receive compensation for selling this Contract to you, in the form of an additional cash benefit (e.g., a bonus). Accordingly, your investment professional may have a financial incentive to offer or recommend this Contract over another investment. |
Conflicts of Interest | ||||||
| Should I Exchange my Contract? | • Some investment professionals may have a financial incentive to offer you a new contract in place of the one you already own. You should only exchange your Contract if you determine, after comparing the features, fees, and risks of both contracts and any fees or penalties to terminate the existing contract, that it is preferable for you to purchase the new contract rather than continue to own the existing contract. |
Conflicts of Interest | ||||||
The following tables describe the fees and expenses that you will pay when buying and owning the Contract. Please refer to your Contract specifications page for information about the specific fees you will pay each year based on the options you have elected.
The first table describes the fees and expenses that you will pay at the time that you buy the Contract or transfer Contract value between investment options. State premium taxes may also be deducted.
Transaction Expenses
| Charge | ||
| Sales Load Imposed on Purchases (as a percentage of premiums) | None | |
| Deferred Sales Load (or Surrender Charge) (as a percentage of premiums or amount surrendered, as applicable) | None | |
| Exchange Fee | None | |
The next table describes the fees and expenses that you will pay each year during the time that you own the Contract (not including Fund fees and expenses).
Annual Contract Expenses
| Charge | ||
| Administrative Expenses | None | |
| Base Contract Expenses (as a percentage of average account value) without waiver | 1.20% | |
| Base Contract Expenses (as a percentage of average account value) with waiver1 | 0.60% | |
| 1. | TIAA has waived (0.60%) of the Mortality and Expense Risk Charge, which reduces the Total Annual Base Contract Expenses to 0.68%. TIAA will provide at least three months’ notice to you before it raises these charges above (0.60%). |
The next table shows the minimum and maximum total operating expenses charged by the Funds that you may pay periodically during the time that you own the Contract. A complete list of the Funds available under the Contract, including their annual expenses, may be found in this Prospectus under: Appendix A—“Funds Available Under the Contract”.
Annual Fund Expenses
| Minimum | Maximum | |||
| Expenses that are deducted from Fund assets, including management fees, distribution and/or service (12b-1) fees and other expenses (before fee waiver/expense reimbursements) | 0.08% | 0.68% | ||
| Expenses that are deducted from Fund assets, including management fees, distribution and/or service (12b-1) fees and other expenses (after fee waiver/expense reimbursements1) | 0.08% | 0.60% |
| 1 | Certain Funds, including the Fund with the maximum total annual fund operating expenses (before fee waiver/expense reimbursements), are subject to an expense reimbursement arrangement between such Fund and the investment adviser, which is expected to continue until at least April 30, 2026. |
| 6 | Prospectus Single Premium Immediate Annuities |
Table of Contents
Example
These Examples are presented to help you compare the cost of investing in the Contract with the cost of investing in other variable annuity contracts. These costs include transaction expenses, annual Contract expenses, and Annual Fund Expenses.
These Examples assume a male, age 65 has elected to receive income payments beginning in year 1. The first Example represents $100,000 invested in a Contract with a life Income Option and a 10-year guarantee, and the second Example represents $100,000 invested in a Contract with a life Income Option and a 20-year guarantee, for the time periods indicated. Each Example also assumes a 5% return each year, assumes the most expensive Annual Fund Expenses and the least expensive Annual Fund Expenses, and assumes no elected optional benefits. A surrender option is not available under the Contract. Although your actual costs may be higher or lower, based on these assumptions, your cost would be:
Example 1:
| Your Cost of Investing in the Contract 1, 2 | ||||||||
| 1 Year | 3 Years | 5 Years | 10 Years | |||||
| Lifetime Income with 10 Year Guarantee Period | ||||||||
| Maximum Fund Expenses | $1,845 | $5,315 | $8,482 | $15,001 | ||||
| Minimum Fund Expenses | $1,312 | $3,800 | $6,097 | $10,920 | ||||
| 1 | This Example used the maximum contractual Annual Base Contract Charge (administrative expense charge and mortality and expense risk charge) of 1.20%. |
| 2 | A surrender option and optional benefits are not available under the Contract. |
Example 2:
| Your Cost of Investing in the Contract 1, 2 | ||||||||
| 1 Year | 3 Years | 5 Years | 10 Years | |||||
| Lifetime Income with 20 Year Guarantee Period. | ||||||||
| Maximum Fund Expenses | $1,845 | $5,315 | $8,482 | $15,001 | ||||
| Minimum Fund Expenses | $1,312 | $3,800 | $6,097 | $10,920 | ||||
| 1 | This Example used the maximum contractual Annual Base Contract Charge (administrative expense charge and mortality and expense risk charge) of 1.20%. |
| 2 | A surrender option and optional benefits are not available under the Contract. |
PRINCIPAL RISKS OF INVESTING IN THE CONTRACT
Investing in the Contract involves risks. The following are the principal risks of an investment in the Contract. You should carefully consider the below risks in addition to the other information contained in this Prospectus. Additional risks and details regarding various risk and benefits of investing in the Contract are described in relevant sections of this Prospectus. The Contract may be subject to additional risks other than those identified and described in the Prospectus.
Risk of Loss. The Contract is subject to market risk (the risk that your investments and income payments may decline in value or underperform your expectations). As a result, you can lose money by investing in the Contract, including loss of principal. An investment in the Contract is not a bank deposit and is not insured or guaranteed by the Federal Deposit Insurance Corporation or any other governmental agency.
Not a Short-Term Investment. This Contract is not appropriate as a short-term investment. It is also not appropriate for an investor who needs ready access to cash, since as a single premium annuity there is no accumulation phase. Generally, there is no opportunity to withdraw from your account value other than through selecting an Income Option, or under certain circumstances, opting for a Commuted Value lump sum payout under a guaranteed period annuity or fixed-period annuity (see, below “Receiving a Lump-Sum Payment”). The Contract is intended to provide income for a specific time period or for the life of an Annuitant. The benefits of tax deferral also mean the Contract is more beneficial to investors with a long time horizon.
Investment Risk. As with all variable annuities, an investment in the Contract is subject to the risk of poor investment performance of the Underlying Funds. Performance can vary depending on the performance of the Underlying Funds you selected available under the Contract. You bear the risk of any decline in the account balance of your Contract resulting from the performance of the Underlying Funds you have chosen. Your account value could decline significantly, and there is a risk of loss of the entire amount invested. You should review these investment options before making an investment decision.
Each investment option will have its own unique risks. We do not provide any investment advice and do not recommend or endorse any particular Underlying Fund. We do not guarantee the investment performance of the Separate
| Single Premium Immediate Annuities Prospectus | 7 |
Table of Contents
Account or the Underlying Funds, and you bear the entire investment risk. Information regarding the Funds available under your Contract is provided below in this Prospectus and in “Appendix A—Funds Available Under the Contract”.
Contract Benefits Risk. Investors may transfer amounts among the investment options but the timing of these transfers may not be successful.
Contract Changes Risk. We may, as permitted by applicable law, add, combine, or delete investment accounts within the separate account. If have unit-annuities in an investment account that is deleted, you must transfer them to an available investment account or to the fixed account.
We can add, delete or stop providing unit-annuities in any investment account. We can also stop providing unit-annuities payable under either the annual or monthly income change method from any current or future investment account. If you have annuity units payable from an investment account that is deleted or in which we stop providing unit-annuities, you must transfer them to another investment account that maintains annuity units or to the fixed account.
For further details, please refer to additional information provided in the prospectus.
Risks Associated with TIAA. An investment in the Contract is subject to risks related to TIAA and any obligations, guarantees or benefits of the Contract are subject to TIAA’s financial strength and claims-paying ability. As an insurance company, we are required by state insurance regulation to hold a specified amount of reserves in order to meet the contractual obligations of our General Account. In order to meet our claims-paying obligations, we monitor our reserves so that we hold amounts required under state law to cover actual or expected Contract and claims payments. However, it is important to note that there is no guarantee that we will always be able to meet our claims-paying obligations and that there are risks to purchasing any insurance product. Information about TIAA, including its financial strength ratings is available by visiting our website at tiaa.org/public/.
Possible Adverse Tax Consequences. Tax considerations associated with the Contract can vary and can be complicated. Adverse tax consequences may result if contributions, distributions, and other transactions with respect to the Contract are not made or effected in compliance with the law. We cannot provide detailed information on all tax aspects of the Contract. Moreover, the tax aspects that apply to a particular person’s Contract may vary depending on the facts applicable to that person and state of residence. Tax rules may change without notice. We cannot predict whether, when, or how these rules could change. Any change could affect Contracts purchased before the change. We cannot predict what, if any, legislation will be proposed or enacted. Before making contributions to your Contract or taking other action related to your Contract, you should consult with a qualified tax advisor to determine the tax implications of an investment in, and payments received under, the Contract.
Risks Related to Cybersecurity and Other Business Continuity Risks. With the increased use of connected technologies such as the Internet to conduct business, the Separate Account and its service providers (including, but not limited to, TIAA, TC Services, and financial intermediaries) are susceptible to cybersecurity risks. In general, cybersecurity attacks can result from infection by computer viruses or other malicious software or from deliberate actions or unintentional events, including gaining unauthorized access through “hacking” or other means to digital systems, networks, or devices that are used to service the Separate Account’s operations in order to misappropriate assets or sensitive information, corrupt data, or cause operational disruption. Cybersecurity attacks can also occur without gaining unauthorized access- for example, through a ‘denial-of- service’ attack that disrupts the Separate Account’s systems or those of its service providers. In addition, authorized persons could inadvertently or intentionally release and possibly destroy confidential or proprietary information stored on the Separate Account’s systems or the systems of its service providers.
Cybersecurity failures by us or any of our service providers, the Underlying Portfolios, or the issuers of securities in which the Underlying Funds invest, have the ability to result in disruptions and to impact business operations, and may adversely affect the Separate Account and the value of your Accumulation Units. Such disruptions or impacts may result in: financial losses, interference with our processing of Contract transactions, including the processing of orders from TIAA’s website or with the Underlying Portfolios; interfere with the Separate Account’s ability to calculate unit values; barriers to trading and order processing; your inability to transact business with us; violations of applicable federal and state privacy or other laws, regulatory fines, litigation, penalties, reputational damage, reimbursement or other compensation costs, or additional compliance costs. The Separate Account and its service providers may also maintain sensitive information (including relating to personally identifiable information of investors) and a cybersecurity breach may cause such information to be lost, improperly accessed, used or disclosed. The Separate Account may incur additional, incremental costs to prevent and mitigate the risks of cybersecurity attacks or incidents in the future. The Separate Account and its Contract Owners could be negatively impacted by such cybersecurity attacks or incidents. Although the Separate Account has established business continuity plans and risk-based processes and controls to address such cybersecurity risks, there are inherent limitations in such plans and systems in part due to the evolving nature of technology and cybersecurity attack tactics. As a result, it is possible that the Separate Account or the Separate Account’s service providers will not be able to adequately identify or prepare for all cybersecurity attacks. In
| 8 | Prospectus Single Premium Immediate Annuities |
Table of Contents
addition, the Separate Account cannot directly control the cybersecurity plans or systems implemented by its service providers.
Other disruptive events, including, but not limited to, natural disasters, terrorism, or public health or pandemic crises (such as the COVID-19 pandemic from late 2019-mid-2022), may adversely affect our ability to conduct business. Such adverse effects may include the inability of TIAA’s employees, or the employees of its affiliates and service providers, to perform their responsibilities as a result of any such event. Any resulting disruptions to the Separate Account’s business operations can interfere with our processing of contract transactions (including the processing of orders from our website), impact our ability to calculate annuity unit values, or cause other operational issues.
WHO WE ARE AND OTHER RELATED INFORMATION
TEACHERS INSURANCE AND ANNUITY ASSOCIATION OF AMERICA (“TIAA”)
TIAA is a stock life insurance company, organized under the laws of New York State. It was founded on March 4, 1918, by the Carnegie Foundation for the Advancement of Teaching. All of the stock of TIAA is held by the TIAA Board of Governors, a nonprofit New York membership corporation whose main purpose is to hold TIAA’s stock. TIAA’s headquarters are at 730 Third Avenue, New York, New York 10017-3206. TIAA also offers other types of insurance products and some of these products, such as fixed annuities, are supported by the assets in our general account. These insurance products are subject to our financial strength and claims-paying ability.
TIAA is the companion organization of the College Retirement Equities Fund (CREF), the first company in the United States to issue a variable annuity. CREF is a nonprofit membership corporation established in the State of New York in 1952. Together, TIAA and CREF serve as a retirement system for the nation’s education and research communities and form one of the largest retirement systems in the U.S. based on assets under management. CREF does not stand behind TIAA’s guarantees and TIAA does not guarantee CREF products.
The Contract was issued by TIAA Life, a stock life insurance company organized under the laws of the State of New York on November 20, 1996. Prior to merger into TIAA after close of business on December 31, 2025 all of the stock of TIAA Life was held by TIAA. After the merger TIAA is solely responsible for the contractual obligations under contracts issued by TC Life.
On July 27, 1998, we established the Separate Account under New York law. Prior to January 1, 2026, the Separate Account was called TIAA-CREF Life Separate Account VA-1. We own the assets in the Separate Account, and we are obligated to pay all benefits under the Contract. We may use the Separate Account to support other variable annuity contracts we issue. The Separate Account is registered with the Securities and Exchange Commission (“SEC”) as a unit investment trust under the 1940 Act and qualifies as a “Separate Account” within the meaning of the federal securities laws. This registration does not involve supervision of the management or investment practices or policies of the Separate Account by the SEC.
We have divided the Separate Account into Investment Accounts, each of which invests in shares of one Portfolio. The Investment Accounts buy and sell Portfolio shares at net asset value. Any dividends and distributions from a Portfolio are reinvested at net asset value in shares of that Portfolio.
The assets in the Separate Account are kept separate from our General Account and our other Separate Accounts. Assets equal to the reserves and contract liabilities of the Separate Account will not be charged with liabilities that arise from any other business we may conduct. We may transfer assets, in excess of the reserves and contract liabilities of the Separate Account, to our General Account. All income, gains and losses, whether or not realized, of an Investment Account will be credited to or charged against that Investment Account without regard to our other income, gains or losses. The valuation of all assets in the Separate Account will be determined in accordance with all applicable laws and regulations. The Separate Account may include other Investment Accounts that are not available under the Contract and are not discussed in this Prospectus.
THE UNDERLYING FUNDS
You may allocate any portion of the Premium to the Separate Account, which currently has eight subaccounts, or variable Investment Accounts. These variable Investment Accounts invest in shares of the Funds of the Nuveen Life Funds. Nuveen Life Funds is an open-end management investment company that was organized as a statutory trust under Delaware law on August 13, 1998. The Nuveen Life Funds currently consists of eleven Funds, but may add other Funds in the future.
Please note that not all of the Funds currently described in the Prospectus for the Nuveen Life Funds are available to you under your Contract. When you consult the Nuveen Life Funds Prospectus, you should be careful to refer only to the information regarding the Funds available under your Contract. A separate Prospectus for the Funds provides more information about the Funds and isfurther described below in Appendix A—Funds Available Under the Contract”. The Prospectus for the Funds may provide information for other Funds that are not available through your Contract. When you consult the Prospectus, you should be careful to refer only to the information regarding the eight Funds described below.
This Prospectus is designed to provide information mainly about the variable Investment Accounts. The
| Single Premium Immediate Annuities Prospectus | 9 |
Table of Contents
following is a brief description of the Fixed Account. Amounts allocated to the Fixed Account become part of the General Account assets of TIAA, which support various insurance and annuity obligations. The General Account includes all the assets of TIAA, except those in the Separate Account (i.e., the Investment Accounts) or in any other TIAA Separate Account. Interests in the Fixed Account have not been registered under the Securities Act of 1933 (the “1933 Act”), nor is the Fixed Account registered as an investment company under the 1940 Act. Neither the Fixed Account nor any interests therein are generally subject to the 1933 Act or 1940 Act. For more details about the Fixed Account, refer to your Contract. Any amounts in the Fixed Account are subject to our financial strength and claims-paying ability.
ADDING AND CLOSING ACCOUNTS OR SUBSTITUTING FUNDS; ADDING OR DELETING CONTRACT OPTIONS OR INCOME METHODS
We can add new Investment Accounts in the future that would invest in other Funds. We do not guarantee that the Separate Account, any existing Investment Account or any Investment Account added in the future, will always be available. We reserve the right to add or close accounts, substitute one Fund for another with the same or different fees and charges, combine accounts or investment portfolios, liquidate the Investment Accounts or add, delete or stop providing Contracts for use with any Investment Account. We can also stop or start providing certain contract options or Income Options under either the annual or monthly Income Change Methods from current or future Investment Accounts. We can also make any changes to the separate account or to the Contract required by applicable laws relating to annuities or otherwise. TIAA can make these and some other changes at its discretion, subject to any required New York Department of Financial Services, SEC or state approval. The Separate Account can (1) operate under the 1940 Act as an investment company, or in any other form permitted by law, (2) deregister under the 1940 Act if registration is no longer required, or (3) combine with other Separate Accounts. As permitted by law, TIAA may transfer the Separate Account assets to another Separate Account or account of TIAA or another insurance company or transfer the Contract to another insurance company.
The Separate Account is the legal owner of the shares of the Funds of the Nuveen Life Funds offered through your Contract. It therefore has the right to vote its shares at any meeting of the Nuveen Life Funds’ shareholders. The Nuveen Life Funds do not plan to hold annual shareholder meetings. However, when shareholder meetings are held, you have the right to instruct us how to vote the shares supporting your Contract.
If we do not receive timely instructions, we will vote your shares in the same proportion as the aggregate voting instructions received on all outstanding Contracts. Please note that the effect of proportional voting is that a small number of Contract owners may control the outcome of a vote. TIAA may vote the shares of the Funds in its own right in some cases, if it determines that it may legally do so.
The number of votes that a Contract owner has the right to instruct is calculated separately for each variable Investment Account and includes fractional votes. The Contract owner has a voting interest in each Investment Account from which variable annuity payments are made. The number of votes you have is calculated based on the amounts to be paid from each variable Investment Account to meet our future annuity obligations to you. As variable annuity payments are made to you, the number of votes you have diminishes.
Contracts are no longer available for sale. Each Contract was offered by TC Services, a subsidiary of TIAA which is registered with the SEC as a broker-dealer and a member of Financial Industry Regulatory Authority or FINRA. TC Services is considered the “principal underwriter” for interests in the Contract. The main office of TC Services is located at 730 Third Avenue, New York, New York 10017-3206. No commissions are paid to TC Services or any other entity in connection with the distribution of each Contract.
THE CONTRACTS WE OFFER AND INCOME OPTIONS
WHAT IS TIAA’S SINGLE PREMIUM IMMEDIATE ANNUITY?
TIAA’s Single Premium Immediate Annuity is a contract (“SPIA” or “Contract”) offered by TIAA, which provides various Income Options for you to choose. Each Contract is designed to provide you with a stream of income for the life of the named Annuitant(s) (which may be you or another person) or for a specified period of time you select. You may purchase a One-Life Annuity, a Two-Life Annuity, or a Fixed-Period Annuity, each of which is described further below. You can then choose a combination of fixed and variable annuity payments by allocating your single Premium to a TIAA Fixed Account or to one or more of the following eight Separate Account variable Investment Accounts, which are described in more detail in this Prospectus and under “Appendix A—Funds Available Under the Contract”.
Here are the eight Separate Account investment options:
• Nuveen Life Growth Equity Fund |
• Nuveen Life Real Estate Securities Select Fund | |
• Nuveen Life Core Equity Fund |
• Nuveen Life Small Cap Equity Fund | |
• Nuveen Life International Equity Fund |
• Nuveen Life Large Cap Responsible Equity Fund | |
• Nuveen Life Large Cap Value Fund |
• Nuveen Life Stock Index Fund |
You generally are not taxed on any earnings or appreciation on the assets in the Contract until money is withdrawn from the Contract. As with all variable annuities, your variable
| 10 | Prospectus Single Premium Immediate Annuities |
Table of Contents
annuity payments will increase or decrease depending on how well the Investment Account’s Fund investment performs over time. TIAA does not guarantee the investment performance of the Funds or the Investment Accounts, and you bear the entire investment risk.
A separate Prospectus for the Funds provides more information about the Funds listed above. Note that the Prospectus for the Funds may provide information for other Funds that are not available through the Contract. When you consult the Fund’s Prospectus, you should be careful to refer only to the information regarding the Funds listed above.
Each Contract and certain investment options under that Contract will not be available to you unless approved by the regulatory authorities in your state.
TIAA’s SPIAs allow you, the owner, to apply a single sum of money to one of three types of annuity Contracts and receive a stream of income for the life of the named Annuitant(s) (which may be you or another person) or for a specified period of time you select. You may purchase a One-Life Annuity, a Two-Life Annuity, or a Fixed-Period Annuity. Each of these Contracts uses a different method to determine the duration of annuity income payments. The total value of annuity payments made to you (or your Beneficiary) may be less than the Premium you paid depending on the duration of your Contract.
The types of Contracts we offer are:
| • | One-Life Annuity. This option pays you or your Beneficiary income as long as the Annuitant lives, with or without an optional guaranteed period. If you elect a guaranteed period (10, 15 or 20 years) and the Annuitant dies before the guaranteed period ends, annuity income payments will continue to you or your Beneficiary until the end of the period. The guaranteed period may be limited by applicable tax laws. If you do not elect a guaranteed period, all annuity income payments end when the Annuitant dies—so that it’s possible for you to receive only one payment if the Annuitant dies before the second payment is made, two payments if the Annuitant dies before the third payment is made, etc. |
| • | Two-Life Annuity. This option pays income to you or your Beneficiary as long as the Annuitant or second Annuitant lives or until the end of an optional specified guaranteed period, whichever period is longer. The guaranteed period may be limited by applicable tax laws. There are three types of Income Options under the Two-Life Annuity, all available with or without a guaranteed period—Two-Life Annuity with Full Benefit While Either Annuitant Survives, Two-Life Annuity with Two- Thirds Benefit While Either Annuitant Survives, and Two-Life Annuity with One-Half Benefit While Second Annuitant Survives First Annuitant. |
| • | Fixed-Period Annuity. This option pays you or your Beneficiary income for a stated period of not less than five nor more than thirty years. At the end of the period you have chosen, payments stop. The period you choose may be limited by applicable tax laws. |
Under each Contract, TIAA promises to pay the named Annuitant(s) (which may be you or another person), an income in the form of annuity payments. You choose the frequency of these payments. You can only make one single premium payment and, after your initial premium payment, you may not make any additional premium payments. You can use the Contract to provide you with a stream of income for the life of the named Annuitant(s) or for a specified period of time elected. How long we make annuity payments under the Contract will depend on the type of Contract you choose, as well as the length of any guaranteed period you elect. Generally, there is no opportunity to withdraw from your account value other than through selecting an Income Option or, under certain circumstances, opting for a Commuted Value lump sum payout under a guaranteed period annuity or fixed-period annuity (see, below “Receiving a Lump-Sum Payment”).
The Contract includes both fixed and variable components—that is, you can allocate your single premium between the Fixed Account or one or more Separate Account variable Investment Accounts. Annuity payments from the Fixed Account are guaranteed by TIAA over the life of the Contract. Annuity payments from the Separate Account’s variable Investment Accounts increase or decrease, depending on the performance of the Funds underlying the Investment Account. Your variable payments will also change depending on the Income Change Method you choose—i.e., whether you choose to have your payments revalued monthly or annually.
Each Contract is currently approved in all states, including the District of Columbia.
PURCHASING THE CONTRACT AND REMITTING PREMIUM
The Premium. We are no longer issuing new contracts.
CAN I ASSIGN THE CONTRACT?
Neither you nor any other person may assign or pledge ownership of this Contract or any benefits under its terms. Any such action will be void and of no effect.
LOANS
Loans are not an option under the Contracts.
If you (the Owner) die, your designated Beneficiary(ies) or, if none, the person chosen as the Annuitant or second Annuitant (if applicable), will become the owner and remaining annuity income payments will be made to him or her. If there is no surviving Beneficiary and the Annuitant and second Annuitant, if any, has died before the end of a guaranteed period, the Commuted Value of any payments remaining due will be paid in one lump- sum to your estate.
| Single Premium Immediate Annuities Prospectus | 11 |
Table of Contents
DEFINITION OF SPOUSE UNDER FEDERAL LAW
A person who meets the definition of “spouse” under federal law may avail themselves of certain contractual rights and benefits. Any right of a spouse that is made available to continue the Contract and all Contract provisions relating to spouses and spousal continuation are available only to a person who meets the definition of “spouse” under federal law. The U.S. Supreme Court has held that same-sex marriages must be permitted under state law and that marriages recognized under state law will be recognized for federal law purposes. IRS guidance provides that civil unions and domestic partnerships that may be recognized under state law are not marriages unless denominated as such.
The impact of the Respect for Marriage Act, providing certain protections for interracial and same-sex marriages, on IRS guidance regarding civil unions and domestic partnerships is uncertain. Please consult a qualified tax adviser for more information on this subject.
You or your Beneficiary have the right to receive in a lump sum the Commuted Value of any periodic payments or other amounts remaining due (i) from a One-Life or Two-Life Annuity if the Annuitant(s) dies during the guaranteed period, or (ii) under a Fixed- Period Annuity from the variable Investment Accounts. (Under the One-Life and Two-Life Annuities, no lump sum payment is available during the lifetime of Annuitant(s), or if the Annuitant dies after the end of the guaranteed period. Under a Fixed-Period Annuity, a lump-sum payment from the Fixed Account is only available to your beneficiaries after your death.)
The Commuted Value will be less than the total of the future payments, because the future interest we’ve assumed in computing the series of payments won’t be earned if payment is made in one sum. The effective date of the calculation of the Commuted Value is the Business Day on which we receive the request for a Commuted Value, in a form acceptable to us.
A lump-sum payment is subject to tax and may be subject to a 10% premature distribution tax if made before age 591⁄2. (See “Federal Income Taxes.”) In addition, if your Contract does not have a guaranteed period, no Commuted Value will be available.
There are no material state variations of the same Contract type from one state-specific contract to another state specific contract in terms of features, benefits and charges. You should review your Contract along with this prospectus to understand the product features, benefits and charges under your Contract.
Please note that your investment professional may receive compensation for selling this Contract to you, in the form of an additional cash benefit (e.g., a bonus). Accordingly, your investment professional may have a financial incentive to offer or recommend this Contract over another investment. In addition, some investment professionals may have a financial incentive to offer you a new contract in place of the one you already own. You should only exchange your Contract if you determine, after comparing the features, fees, and risks of both contracts, that it is preferable for you to purchase the new contract rather than continue to own the existing Contract.
Amounts allocated to the Fixed Account become part of the General Account assets of TIAA, which support various insurance and annuity obligations. The General Account includes all the assets of TIAA, except those in the Separate Account (i.e., the Investment Accounts) or in any other TIAA Separate Account. For more details about the Fixed Account, refer to your Contract. Any amounts in the Fixed Account are subject to our financial strength and claims-paying ability.
THE VARIABLE INVESTMENT ACCOUNTS
WHAT ARE MY INVESTMENT OPTIONS UNDER THE CONTRACT?
Under each of TIAA’s Contracts, you can choose fixed or variable annuity payments (or any combination of fixed and variable payments) by allocating your single Premium to the Fixed Account or to one or more of the Separate Account’s variable Investment Accounts. Annuity payments from the Fixed Account are guaranteed over the life of the Contract. If you selected any or all of the eight variable Investment Accounts available to you, your annuity payments from the Separate Account’s variable Investment Accounts will increase or decrease, depending on how well the Funds underlying the Investment Accounts perform over time. TIAA does not guarantee the investment performance of the Funds or the variable Investment Accounts, and you bear the entire investment risk. Your payments will also change depending on the Income Change Method you choose—i.e., whether you choose to have your payments revalued monthly or annually, which is discussed below.
You may allocate any portion of the Premium to the Separate Account’s eight variable Investment Accounts available under the Contract. Each of these Funds is available to Contract Owners as an investment option without a restriction unless indicated otherwise in Appendix A—Funds Available Under the Contract. Refer to the Nuveen Life fund Prospectus for additional details. Please note, the Prospectus for Nuveen Life Funds includes eleven funds, but only eight of those funds are made available as investment options under your Contract.
| 12 | Prospectus Single Premium Immediate Annuities |
Table of Contents
GENERAL DESCRIPTION OF THE FUNDS:
Active Equity Funds:
The Nuveen Life Growth Equity Fund seeks a favorable long-term return, mainly through capital appreciation, primarily from equity securities.
The Nuveen Life Core Equity Fund seeks a favorable long-term total return, through both capital appreciation and investment income, primarily from income-producing equity securities.
The Nuveen Life International Equity Fund seeks a favorable long-term total return, mainly through capital appreciation, primarily from equity securities of foreign issuers.
The Nuveen Life Large Cap Value Fund seeks a favorable long-term total return, mainly through capital appreciation, primarily from equity securities of large domestic companies.
The Nuveen Life Small Cap Equity Fund seeks a favorable long-term total return, mainly through capital appreciation, primarily from equity securities of smaller domestic companies.
Index Funds:
The Nuveen Life Stock Index Fund seeks a favorable long-term total return, mainly through capital appreciation, by investing primarily in a portfolio of equity securities selected to track the overall U.S. equity markets.
Specialty Funds:
The Nuveen Life Large Cap Responsible Equity Fund seeks a favorable long-term total return that reflects the investment performance of the overall U.S. stock market while giving special consideration to certain environmental, social and governance (“ESG”) criteria.
The Nuveen Life Real Estate Securities Select Fund seeks a favorable long-term total return through both capital appreciation and current income, by investing primarily in equity securities of companies principally engaged in or related to the real estate industry.
Teachers Advisors, LLC (“Advisors”), an indirect subsidiary of TIAA, manages the assets of the Nuveen Life Funds. Advisors also manages the Stock Index Account of the TIAA Separate Account VA-5, TIAA-CREF Mutual Funds, and TIAA-CREF Institutional Mutual Funds. The same personnel also manage the CREF accounts on behalf of TIAA-CREF Investment Management, LLC, an investment adviser that is also a TIAA subsidiary.
The investment objectives, techniques and restrictions of the Nuveen Life Funds, including the risks of investing in the Funds, are described fully in their Prospectus and SAI. The Prospectus and SAI of the Nuveen Life Funds may be obtained by writing Nuveen Life Funds, 730 Third Avenue, New York, New York 10017-3206, by calling 877 825-0411, or by accessing our internet website at www.tiaa.org. You should read the Prospectus for the Nuveen Life Funds carefully before investing in the separate account.
CHANGING INVESTMENT ACCOUNTS AND INCOME CHANGE METHODS
You may “transfer” all or part of the future annuity payments one time in each calendar quarter from each variable Investment Account to another variable Investment Account or to the Fixed Account. One time in a calendar year, under the One-Life and Two-Life Annuities, you will also be able to transfer the Present Value of future amounts payable from the Fixed Account to any of the variable Investment Accounts (provided they are equity accounts), either in a lump sum of up to 20% of annuity income in any year, or in installment payments over a five-year period. Due to this limitation, it may take several years to transfer all of your future annuity payments from the Fixed Account to the variable Investment Accounts. Once income has been transferred from the Fixed Account to a variable Investment Account it cannot be transferred back to the Fixed Account.
You may not transfer payments from the Fixed Account to the variable Investment Accounts under the Fixed-Period Annuity. All transfers must consist of a periodic payment of at least $100 or the entire payment. We do not assess a transaction charge with any transfers.
We will process your transfer as of the Business Day we receive your request in Good Order. Alternatively, you can choose to have a transfer take effect at the close of any future Business Day, or the last Calendar Day of the current or any future month, even if it’s not a Business Day. Transfers under the Annual Income Change Method will affect your annuity payments beginning on the May 1 following the March 31 (or, if March 31 is not a Valuation Day, the immediately preceding Valuation Day) which is on or after the effective date of the transfer. Transfers under the Monthly Income Change Method and all transfers into or out of the Fixed Account will affect your annuity payments beginning with the first payment due after the monthly payment Valuation Day that is on or after the transfer date. If you live in any of the following states, no transfers maybe made during the period in which any portion of your Premium is temporarily held in the General Account: Georgia, Hawaii, Idaho, Iowa, Louisiana, Massachusetts, Michigan, Missouri, Nebraska, North Carolina, Oklahoma, Rhode Island, South Carolina, Utah, Washington, West Virginia or Wisconsin. For more information on how we calculate transfer amounts, see “Calculating Variable Annuity Payments.”
You can switch between the Annual and Monthly Income Change Methods at any time, but only once a year, and the switch will go into effect on March 31 (or, if March 31 is not a Valuation Day, the immediately preceding Valuation Day).
To request a transfer or to switch your Income Change Method, call Retirement Services, toll-free at 800-842-2252, or write the TIAA home office at 730 Third Avenue, New York 10017-3206. Please note that telephone transactions may not always be available.
| Single Premium Immediate Annuities Prospectus | 13 |
Table of Contents
TRANSFER POLICIES REGARDING MARKET TIMING AND EXCESSIVE TRADING
Variable annuity Contract Owners could try to profit from transferring money back and forth among Investment Accounts in an effort to “time” the market or for other reasons. As money is shifted in and out of these accounts, we incur transaction costs and the underlying Funds incur expenses for buying and selling securities.
In addition, excessive trading can interfere with efficient portfolio management and cause dilution, if traders are able to take advantage of pricing inefficiencies. The risk of pricing inefficiencies may be increased for Funds invested primarily in foreign securities. These costs are borne by all Contract Owners, including long-term investors who do not generate the costs. The Contract is not intended for market timing or frequent trading.
Under this Contract, market timing is unlikely, due to the nature of the Contract and its transfer limitations. In particular, transfers of all or part of the future annuity income payable are available only one time each calendar quarter from each variable Investment Account to another variable Investment Account or to the Fixed Account. Transfers of the Present Value of future amounts payable from the Fixed Account to any of the variable Investment Accounts are available only one time in a calendar year. (see “Fixed Account”)
The Nuveen Life Funds may have adopted their own policies and procedures with respect to market timing and excessive trading of their respective shares. The Nuveen Life Funds Prospectus describes any such policies and procedures. While we reserve the right to enforce these policies and procedures, we may not have the contractual authority or the operational capacity to apply the market timing and excessive trading policies and procedures of the Nuveen Life Funds. However, we have entered into a written agreement, as required by SEC regulation, with the principal underwriter of the Nuveen Life Funds that obligates us to provide to the Fund promptly upon request certain information about the trading activity of individual Contract owners, and to execute instructions from the Fund to restrict or prohibit further purchases or transfers by specific Contract owners who violate the market timing and excessive trading policies established by the Fund.
We seek to apply our transfer policies uniformly to all Contract owners. No exceptions are made with respect to the policies. The Contract is not appropriate for market timing. You should not invest in the Contract if you want to engage in market timing activity.
You may elect to receive monthly, quarterly, semi-annual or annual payments under any of the Contracts. If your annuity payments would be less than $100 under the payment option you choose, we may make annuity payments less frequently than that.
Your first annuity payment date will be specified in your Contract. If you choose monthly payments, the first annuity payment date will either be the first day of the next month, or the first day of the month after that if your Premium is received after the 20th day of a month. If you choose quarterly, semi-annual or annual payments, your first annuity payment date will be the first day of the month that is either three months, six months, or twelve months, as applicable, following the month we receive your Premium. We will generally issue your subsequent payments on the first of a month, at monthly, quarterly, semi-annual, or annual intervals from your first annuity payment date. Your first annuity check may be delayed while we process and calculate the amount of your initial payment.
We will send your payments by mail to your home address or (at your request) by mail or electronic funds transfer to your bank. If the address or bank where you want your payments changes, it is your responsibility to let us know. We can send payments to your residence or most banks abroad.
Annuity payments are subject to our financial strength and claims-paying ability.
PAYMENTS FROM THE VARIABLE INVESTMENT ACCOUNTS
The amount of variable annuity payments we pay will depend upon the number and value of your Annuity Units in a particular Investment Account. The number of Annuity Units you purchase is determined on the Contract Issue Date. (If you live in Georgia, Hawaii, Idaho, Iowa, Louisiana, Massachusetts, Michigan, Missouri, Nebraska, North Carolina, Oklahoma, Rhode Island, South Carolina, Utah, Washington, West Virginia or Wisconsin, the number of Annuity Units you purchase will be determined as of the date that we transfer your temporary investment in the General Account to the variable Investment Accounts, i.e., seven days plus the number of days in the free look period applicable in your state, calculated from the Issue Date of your Contract). Annuity unit values are calculated as of each Valuation Day based primarily on the net investment results of the Funds underlying the particular Investment Account. For the formulas used to determine Annuity Unit values, see the SAI.
Your initial annuity payments will be determined based on:
| • | the amount of your Premium |
| • | whether the Contract is a One-Life, Two-Life or has a guaranteed period or is a Fixed-Period Annuity |
| • | the length of the fixed period or guaranteed period, as applicable |
| • | the frequency of payment you choose |
| • | the age of the Annuitant and any second Annuitant, as applicable |
| • | in the case of the Two-Life Annuity, the Income Option selected |
| 14 | Prospectus Single Premium Immediate Annuities |
Table of Contents
| • | an assumed annual investment return of 4%, and |
| • | the mortality basis then in effect, in the case of One-Life or Two-Life Annuities |
Over the life of the Contract, payments will go up or down based on the investment experience of the Funds underlying the variable Investment Accounts relative to the 4% assumed annual investment return, and whether you choose to have your payments revalued monthly or annually (i.e., your choice of Income Change Method). In general, your payments will increase if the performance of the variable Investment Account (net of expenses) is greater than 4% and decrease if the performance is less than 4%.
You may choose either an Annual or Monthly Income Change Method for your variable annuity payments. Under the Annual Income Change Method, the amount of payments from the variable Investment Accounts will change each May 1, based on the net investment results of the Funds underlying the Investment Account during the prior year (from the day following the last Valuation Day in March of the prior year through the last Valuation day in March of the current year). Under the Monthly Income Change Method, payments from the variable Investment Accounts will change every month, based on the net investment results during the previous month. The amount of your next payment will be determined as of the 20th day of each month (or, if the 20th is not a Business Day, the prior Business Day).
For a more complete discussion of how we determine the amount of variable annuity payments, see “Calculating Variable Annuity Payments” and the SAI.
PAYMENTS FROM THE FIXED ACCOUNT
On the Contract Issue Date, the dollar amount of each annuity payment is fixed, based on:
| • | the amount of your Premium |
| • | whether the Contract is a One-Life, Two-Life or Fixed-Period Annuity |
| • | the length of the fixed period or guaranteed period, as applicable |
| • | the frequency of payment you choose |
| • | the age of the Annuitant and any second Annuitant, as applicable |
| • | the interest rates then in effect |
| • | the Income Option selected, in the case of the Two-Life Annuity, and |
| • | the mortality basis then in effect, in the case of One-Life or Two-Life Annuities |
Subsequent fixed payments will be for the same amount (except in the case of a Two-Life Annuity, in which fixed payments may change upon the Annuitant’s death). The amount of each annuity payment from the Fixed Account does not change as a result of the investment experience of any variable Investment Account.
There are significant limits on your right to “transfer” all or part of your future annuity payments from the Fixed Account to the variable Investment Accounts. Due to these limitations, if you want to transfer all of your future annuity payments from the Fixed Account to one or more variable Investment Accounts, it may take several years to do so. You should carefully consider whether payments from the Fixed Account meet your investment needs. See above “Changing Investment Accounts and Income Change Methods.”
We may delay any payments from the Separate Account only if (1) the New York Stock Exchange is closed (or trading restricted by the SEC) on a day that isn’t a weekend or holiday; (2) an SEC-recognized emergency makes it impractical for us to sell securities or determine the value of assets in the Separate Account; or (3) the SEC says by order that we can or must postpone payments to protect you and other Separate Account Contract owners. In addition, transfers of Contract Value from and within the fixed and variable Investment Accounts may be deferred under these circumstances.
If a check has been submitted as the Premium, we have the right to defer any payments until the check has been honored.
CALCULATING VARIABLE ANNUITY PAYMENTS
The amount of each variable annuity payment from each Investment Account is equal to the number of Annuity Units payable multiplied by the then-Current Value of one Annuity Unit for the variable Investment Account and Income Change Method you chose.
DETERMINING THE NUMBER OF ANNUITY UNITS PAYABLE
The number of Annuity Units you purchase under the Contract is derived by dividing the portion of the Premium (net of any Premium taxes) you allocated to a particular Investment Account and Income Change Method by the product of the Annuity Unit value for that Investment Account and Income Change Method, and an annuity factor that represents the Present Value of an annuity that continues for as long as annuity payments would need to be paid. The annuity factor will reflect an interest rate for discounting future payments of 4 percent, the timing and frequency of future payments, and, if applicable, the mortality assumptions for the person(s) on whose life or lives the annuity payments will be based. Mortality assumptions will be based on the mortality basis then in effect under the Contract.
The number of Annuity Units for each variable Investment Account and Income Change Method under a Contract is generally determined on the Contract Issue Date and remains fixed unless there is a “transfer” of Annuity Units or you change your Income Change Method. The number of Annuity Units payable from a particular Investment Account and Income Change Method under your Contract will be reduced by the number of Annuity Units you transfer out of that Investment Account or Income Change
| Single Premium Immediate Annuities Prospectus | 15 |
Table of Contents
Method. The number of Annuity Units payable will be increased by any internal transfers you make to that Investment Account and Income Change Method. If you live in Georgia, Hawaii, Idaho, Iowa, Louisiana, Massachusetts, Michigan, Missouri, Nebraska, North Carolina, Oklahoma, Rhode Island, South Carolina, Utah, Washington, West Virginia or Wisconsin, the number of Annuity Units payable from each variable Investment Account will be determined as of the date that we transfer your temporary investment in the General Account to the variable Investment Accounts. See “Changing Investment Accounts and Income Change Methods.”
Annuity Unit valuations for each Investment Account will occur only on Business Days, and thus the last Calendar Day of each month will not be a Valuation Day unless it falls on a Business Day. If the last Calendar Day of a month does not fall on a Business Day, the last Valuation Day for such months shall be deemed to be the last Business Day of the month. The Annuity Unit value for each Income Change Method is determined by updating the Annuity Unit value from the previous Valuation Day to reflect the net investment performance of the account for the current valuation period relative to the 4 percent Assumed Investment Return. We further adjust the Annuity Unit value to reflect the fact that annuity payment amounts are redetermined only once a month or once a year (depending on the income change (revaluation) method chosen). The purpose of the adjustment is to equitably apportion any account gains or losses among those Annuitants who receive
annuity income for the entire period between valuation dates and those who start or stop receiving annuity income between the two dates. In general, from period to period your payments will increase if the performance of the account is greater than a 4 percent net annual rate of return and decrease if the performance is less than a 4 percent net annual rate of return.
For participants under the Annual Income Change Method, the value of the Annuity Unit for payments remains level until the following May 1. For those who have already begun receiving annuity income as of March 31, the value of the Annuity Unit for payments due on and after the next succeeding May 1 is equal to the Annuity Unit value determined as of the last Valuation Day in March. For participants under the Monthly Income Change Method, the value of the Annuity Unit for payments changes on the payment Valuation Day of each month for the payment due on the first of the following month.
TIAA reserves the right to modify the specific dates that payments will change and the associated payment valuation date. We also can delete or stop offering the annual or monthly Income Change Methods.
For the more detailed formula we use for determining Annuity Unit values, see the SAI.
BENEFITS AVAILABLE UNDER THE CONTRACT
There are no optional benefits associated with the Contract.
The following table summarizes information about benefits available under the Contract.
| Summary of Benefits | ||||||||
| Name of Benefit | Purpose | Standard/Optional | Maximum Fee | Brief Description of Restrictions/Limitations | ||||
| Transfers | You may transfer all or part of future annuity payments from the Fixed Account and between the Investment Accounts. | Optional | None | • Subject generally to a minimum amount of $100. • Transfers from the Fixed Account are permanent and limited by additional rules, which are discussed above under “Changing Investment Accounts and Income Change Methods”. • Transfers from each Investment Account cannot be made more frequently than once per calendar quarter. • Transfers are subject to our “Transfer Policies Regarding Market Timing and Frequent Trading”. | ||||
Charges, Expenses and Related Fees. There are charges, expenses and related fees associated with variable annuity contracts that will reduce the return on investment in the Contract. Your Contract may include the following charges, expenses and related fees.
The Base Contract Charge. The Base Contract Charge includes the Separate Account Charges, which consist of an Administrative Expense Charge and the Mortality and Expense Risk Charge.
| 16 | Prospectus Single Premium Immediate Annuities |
Table of Contents
We deduct charges each Valuation Day from the assets of each variable Investment Account for various services required to administer the Separate Account and the Contracts and to cover certain insurance risks borne by TIAA. The Contracts allow for total Separate Account charges (i.e., administrative expense and mortality and expense risk charges) at an annual rate of 1.20% of average daily net assets of each Investment Account. TIAA has waived a portion of the mortality and expense risk charges so that current Separate Account charges are at an annual rate of 0.60% of net assets annually. While TIAA reserves the right to increase the Separate Account charges at any time, we will provide at least three months’ notice before any increase.
Administrative Expense Charge. This charge is for administration and operations, such as allocating the Premium and administering the Contracts. The daily deduction is equal to an annual rate of 0.20% of average daily net assets.
Mortality and Expense Risk Charge. TIAA imposes a daily charge as compensation for bearing certain mortality and expense risks in connection with the Contracts. The current daily deduction is equal to 0.40% of net assets annually.
TIAA’s mortality risks come from its obligations under the Contracts to make annuity payments under the One-Life Annuity and the Two-Life Annuity. TIAA assumes the risk of making annuity payments regardless of how long the Annuitant(s) may live or whether the mortality experience of Annuitants as a group is better than expected.
TIAA’s expense risk is the possibility that TIAA’s actual expenses for administering and marketing the Contract and for operating the Separate Account will be higher than the amount recovered through the administrative expense deduction.
If the mortality and expense risk charge is not enough to cover our costs, we will absorb the deficit. On the other hand, if the charge more than covers costs, we will profit. We will pay a fee from our General Account assets, which may include amounts derived from the mortality and expense risk charge, to TIAA-CREF Individual & Institutional Services, LLC (“TC Services”), the principal underwriter of the Contract.
Fund Expenses. Each Investment Account purchases shares of the corresponding Fund at net asset value. Certain deductions and expenses of the Nuveen Life Funds are paid out of the assets of the Nuveen Life Funds. These expenses include charges for investment advice, portfolio accounting, custody, and similar services provided for a Fund. Advisors is entitled to an annual fee based on a percentage of the average daily net assets of each Fund, under an investment management agreement between Advisors and the Nuveen Life Funds.
Fund expenses are not fixed or specified under the terms of the Contract and may change periodically. For more information on Fund deductions and expenses, read the Nuveen Life Funds Prospectus.
No Deductions from Premium. The Contracts do not provide for charges or other deductions from the Premium.
Premium Taxes. Currently, residents of several states may be subject to Premium taxes on their Contract. We will deduct any charges for Premium taxes from your Premium before it’s applied to provide annuity payments. State Premium taxes currently range from 0.00 percent to 3.50 percent of non-qualified Premium payments.
Annual Account Fee or Maintenance Fee. We do not assess an annual account or annual maintenance fee.
FEDERAL INCOME TAXES
The following discussion assumes the Contracts qualify as annuity Contracts for federal income tax purposes and that the merger of TC Life into TIAA was not taxable event with respect to Contracts (see the SAI for more information). The following discussion is based on our understanding of current federal income tax law and is subject to change. For complete information on your personal tax situation, check with a qualified tax adviser.
NON-NATURAL PERSONS
When the Owner of any Contract is not a natural person (such as a trust), the Owner must generally include in income any increases in the value of the Contract during the taxable year. There are significant exceptions to this rule, such as grantor trusts and certain trusts for the benefit of individuals and a prospective Contract owner which is not a natural person should discuss these potential exceptions with a qualified tax adviser.
TAXATION OF ANNUITY PAYMENTS
Generally, the annuity payments from a non-qualified annuity contract include both a return of Premium and interest or investment gain. Accordingly, only a portion of the annuity payments you receive will be includable in your gross income and subject to federal income tax and state income tax, where applicable. However, when the entire Premium has been recovered or returned, the full amount of any additional annuity payments is includable in gross income. Currently capital gains tax rates are not applicable to annuities.
If, after the Contract Issue Date, annuity payments stop because an Annuitant died, any Premium that has not been recovered is generally allowable as a deduction for your last taxable year.
Transferring, assigning, pledging, or exchanging a Contract, designating an Annuitant, payee, or other Beneficiary who is not the owner, or the selection of certain maturity dates may have adverse tax consequences
| Single Premium Immediate Annuities Prospectus | 17 |
Table of Contents
including treatment as a distribution. An owner contemplating any such actions should consult a tax advisor.
RECEIVING LUMP SUMS
The Internal Revenue Service currently takes the position that any lump-sum payment from an immediate annuity contract is fully taxable. The amount that is taxable is the excess of the amount distributed to you over the unrecovered investment in the Contract. You should consult a qualified tax adviser before taking a lump-sum payment from your Contract. See “Receiving a Lump-sum Payment.”
The Internal Revenue Code (IRC) also provides that you may be subject to a premature distribution tax if you take a lump-sum payment from certain distributions from your Contract. The amount of the premature distribution tax is equal to 10% of the amount that is includable in income. Some lump-sum payments will be exempt from this treatment. They include any amounts:
| • | paid on or after the taxpayer reaches age 59½; |
| • | paid after the taxpayer’s death; |
| • | paid if the taxpayer becomes totally disabled (as that term is defined in the IRC); or |
| • | paid in a series of substantially equal payments made annually (or more frequently) over life or life expectancy. |
Other exceptions may be applicable under certain circumstances and special rules may be applicable in connection with exceptions enumerated above. You should consult a tax advisor with regard to exceptions from the premature distribution tax.
TAXATION UPON DEATH
Amounts may be distributed from the Contract because of the death of an owner or the Annuitant. Generally, such amounts are includable in the income of the recipient:
| • | if distributed in a lump sum, these amounts are taxed in the same manner as other lump-sum distributions; or |
| • | if distributed under an annuity payment option, these amounts are taxed in the same manner as annuity payments. |
For these purposes, the “investment in the Contract” is not affected by the owner’s or Annuitant’s death. That is, the “investment in the Contract” remains generally the total Premium payments, less amounts received, which were not includable in gross income.
MEDICARE TAX
Distributions from non-qualified annuity Contracts are considered “investment income” for purposes of the Medicare surtax on investment income enacted as part of the Health Care and Education Reconciliation Act of 2010. Thus, in certain circumstances, a 3.8% tax may be applied to some or all of the taxable portion of distributions (e.g. earnings) to individuals whose income exceeds certain threshold amounts. Please consult a qualified tax advisor for more information.
WITHHOLDING
Annuity distributions usually are subject to withholding for the recipient’s federal income tax liability at rates that vary according to the type of distribution and the recipient’s tax status. However, recipients can usually choose not to have tax withheld from distributions. Unnecessary withholdings, delays in payment while we attempt to verify information and other adverse tax and financial consequences may result if you or your Beneficiary do not provide us with a valid Social Security number or other taxpayer identification number, or if the taxpayer fails to properly complete and execute tax-related forms and certifications required for us to process distributions and administer your Contract.
POSSIBLE CHARGE FOR TIAA’S TAXES
Currently we don’t charge the Separate Account for any federal, state, or local taxes on it or its Contracts (other than Premium taxes—see “Other Charges and Expenses”), but we reserve the right to charge the Separate Account or the Contracts for any tax or other cost resulting from the tax laws that we believe should be attributed to them.
DIVERSIFICATION AND DISTRIBUTION REQUIREMENTS
The IRC provides that the underlying investments for a variable annuity must satisfy certain diversification requirements in order for a Non-Qualified Contract to be treated as an annuity contract. The Contract must also meet certain distribution requirements at the death of an owner in order to be treated as an annuity contract. These diversification and distribution requirements are discussed in the Statement of Additional Information.
OTHER TAX ISSUES
Federal Estate Taxes, Generation-Skipping Transfer Taxes. A purchaser should keep in mind that the value of an annuity Contract owned by a decedent and payable to a Beneficiary by virtue of surviving the decedent is included in the decedent’s gross estate. Depending on the terms of the annuity Contract, the value of the annuity included in the gross estate may be the value of the lump sum payment payable to the designated Beneficiary or the actuarial value of the payments to be received by the Beneficiary. Consult an estate planning adviser for more information.
Under certain circumstances, the IRC may impose a “generation skipping transfer tax” (“GST”) when all or part of an annuity Contract is transferred to, or a death benefit is paid to, an individual two or more generations younger than the Owner. Regulations issued under the IRC may require us to deduct the tax from your Contract, or from any applicable payment, and pay it directly to the IRS.
For 2026 the federal estate tax, gift tax and GST tax exemptions and maximum rates are $13,990,000 and 40%, respectively. The exemption amounts are permanently increased for 2026 under the 2025 One Big Beautiful Bill Act (See “Enacted Tax Legislation”) to $15 million and could
| 18 | Prospectus Single Premium Immediate Annuities |
Table of Contents
increase in subsequent years with inflation. The maximum rate remains at 40% for 2026. The potential application of these taxes underscores the importance of seeking guidance from a qualified adviser to help ensure that your estate plan adequately addresses your needs and those of your beneficiaries under all possible scenarios.
Annuity purchases by residents of Puerto Rico. The IRS’ current position is that income received by residents of Puerto Rico from non-qualified annuity Contracts issued by a U.S. insurer is U.S.-source income that is generally subject to United States federal income tax.
Annuity purchases by nonresident aliens and foreign corporations. The discussion above provides general information regarding U.S. federal income tax consequences to annuity purchasers that are U.S. citizens or residents. Purchasers that are not U.S. citizens or residents will generally be subject to U.S. federal withholding tax on taxable distributions from annuity contracts at a 30% rate, unless a lower treaty rate applies. In addition, such purchasers may be subject to state and/or municipal taxes and taxes that may be imposed by the purchaser’s country of citizenship or residence. Additional withholding may occur with respect to entity purchasers (including foreign corporations, partnerships and trusts) that are not U.S. residents. This Contract may not be available to certain foreign entity purchasers. Prospective purchasers are advised to consult with a qualified tax advisor regarding U.S., state, and foreign taxation with respect to an annuity Contract purchase.
Foreign Tax Credits. We may benefit from any foreign tax credits attributable to taxes paid by certain Funds to foreign jurisdictions to the extent permitted under federal tax law.
Recent Tax Legislation. On July 4, 2025, Congress enacted the One Big Beautiful Bill Act, Public Law 119-21. This law did not specifically address taxation of annuity contracts. However, the Act concerns individual tax rates and expiring individual tax provisions, among many other individual tax provisions, and is likely to affect your personal tax situation. One such provision is the increase to the federal estate tax, gift tax and GST tax exemptions (see “Federal Estate Taxes, Generation-Skipping Transfer Taxes”). You should consult a tax adviser with respect to these legislative developments.
Possible Tax Law Changes. Although the likelihood of legislative changes is uncertain, there is always the possibility that the tax treatment of the Contract could change by legislation or otherwise. Consult a qualified tax adviser with respect to legislative developments and their effect on the Contract. We have the right to modify the Contract in response to legislative changes that could otherwise diminish the favorable tax treatment that annuity Contract Owners currently receive. We make no guarantee regarding the tax status of any Contract and the above discussion does not constitute tax advice.
TAX ADVICE
What we tell you here about federal and other taxes is not comprehensive and is for general information only. It doesn’t cover every situation. Taxation varies depending on the circumstances, and state and local taxes may also be involved. For complete information on your personal tax situation, check with a qualified tax adviser.
Neither the Separate Account, TIAA nor TC Services is involved in any legal action that we consider likely to have a material adverse effect on the Separate Account, the ability of TIAA to meet its obligations under the Contract, or the ability of TC Services to perform its Contract with the Separate Account.
You will receive a confirmation statement when you remit your Premium, or make a “transfer” to or from the Separate Account or among the variable Investment Accounts. The statement will show the date and amount of each transaction.
You will also receive, at least semi-annually, reports containing the financial statements of the Nuveen Life Funds and a schedule of investments held by the Nuveen Life Funds.
BENEFITS BASED ON INCORRECT INFORMATION
If the amounts of benefits provided under a contract were based on information that is incorrect, benefits will be recalculated on the basis of the correct data. If any overpayments or underpayments have been made by the Separate Account, appropriate adjustments will be made.
We reserve the right to require satisfactory proof that anyone named to receive benefits under a contract is living on the date payment is due. If this proof is not received after a request in writing, the separate account will have the right to make reduced payments or to withhold payments entirely until such proof is received.
PAYMENT TO AN ESTATE, GUARDIAN, TRUSTEE, ETC.
We reserve the right to pay in one sum the commuted value of any benefits due an estate, corporation, partnership, trustee or other entity that is not a natural person. Neither TIAA nor the Separate Account will be responsible for the conduct of any executor, trustee, guardian, or other third party to whom payment is made.
| Single Premium Immediate Annuities Prospectus | 19 |
Table of Contents
The benefits under your Contract are paid by us from our General Account assets and/or your Contract Value held in the Separate Account. It is important that you understand how your Contract works and how our ability to meet our obligations affects your Contract. Payment of your Contract benefits is not guaranteed and depends upon certain factors discussed below.
Assets in the Separate Account. You assume all of the investment risk for Contract Value allocated to the Investment Accounts. Your Contract Value in the Investment Accounts is part of the assets of the Separate Account. These assets are segregated and insulated from our General Account, and may not be charged with liabilities arising from any other business that we may conduct. This means that your Contract Value allocated to the Separate Account should generally not be adversely affected by the financial condition of our General Account. With very limited exceptions, all assets in the Separate Account attributable to your Contract Value and that of all other Contract owners would receive a priority of payment status over other claims in the event of an insolvency or receivership. See “SEPARATE ACCOUNT.”
Assets in the General Account. Any guarantees under the Contract that exceed your Contract Value in the Separate Account, such as those associated with the death benefit, are paid from our General Account (not the Separate Account). Therefore, any amounts that we may be obligated to pay under the Contract in excess of the accumulated value in the Separate Account are subject to our financial strength and claims-paying ability and our long-term ability to make such payments. The assets of the Separate Account, however, are also available to cover the liabilities of our General Account, but only to the extent that the Separate Account assets exceed the Separate Account liabilities arising under the Contracts supported by it. We issue other types of insurance policies and financial products as well, such as market value adjusted annuities, and we also pay our obligations under these products from the assets in our General Account. These General Account products are subject to our claims-paying ability. In the event of an insolvency or receivership, payments we make from our General Account to satisfy claims under the Contract would generally receive the same priority as our other contract holder obligations.
Our Financial Condition. Among the laws and regulations applicable to us as an insurance company are those which regulate the investments we can make with assets held in our General Account. In general, those laws and regulations determine the amount and type of investments which we can make with General Account assets. In addition, state insurance regulations require that insurance companies calculate and establish on their financial statements a specified amount of reserves in order to meet the contractual obligations to pay the claims of our Contract owners. In order to meet our claims-paying obligations, we regularly monitor our reserves to ensure we hold sufficient amounts required under state law to cover actual or expected contract and claims payments. In addition, we actively hedge our investments in our General Account. However, it is important to note that there is no guarantee that we will always be able to meet our claims paying obligations; there are risks to purchasing any insurance product.
State insurance regulators also require insurance companies to maintain a minimum amount of capital, which acts as a cushion in the event that the insurer suffers a financial impairment, based on the inherent risks in the insurer’s operations. These risks include those associated with losses that we may incur as the result of defaults on the payment of interest or principal on our General Account assets, which include bonds, mortgages, general real estate investments, and stocks, as well as the loss in value of these investments resulting from a loss in their market value. We continually evaluate our investment portfolio to mitigate market risk and actively manage the investments in the portfolio.
How to Obtain More Information. We encourage both existing and prospective Contract owners to read and understand our financial statements. We prepare our financial statements on a statutory basis. Our audited financial statements, as well as the financial statements of the Separate Account, are located in the Statement of Additional Information (“SAI”). For information on how to obtain a free copy of the SAI, see the cover page of this Prospectus.
We will not consider any notice, form, request, or payment to have been received by TIAA until it reaches our Administrative Office. You can ask questions by calling toll-free 800-842-2252.
If you received this prospectus electronically and would like a paper copy, please call 800-842-2252, and we will send it to you.
To cut costs and eliminate duplicate documents sent to your home, we may begin mailing only one copy of the Prospectus, Prospectus supplements, annual and semi-annual reports, or any other required documents, to your household, even if more than one Contract owner lives there. If you would prefer to continue receiving your own copy of any of these documents, you may call us toll-free at 877.825.0411, or write us.
For some transactions, we may require your signature to be notarized or guaranteed by a commercial bank or a member of a national securities exchange.
| 20 | Prospectus Single Premium Immediate Annuities |
Table of Contents
We reserve the right to correct any errors or omissions on any form, report or statement that we send you.
GENERAL INFORMATION ON UNCLAIMED PROPERTY
Every state has some form of unclaimed property laws that imposes varying legal and practical obligations on insurers and, indirectly, on Contract owners, Annuitants, Beneficiaries and other payees of proceeds. Unclaimed property laws generally provide for escheatment to the state of unclaimed proceeds under various circumstances.
Contract owners are urged to keep their own, as well as their Annuitants’, Beneficiaries’ and other payees’, information up to date, including full names, postal and electronic media addresses, telephone numbers, dates of birth, and social security numbers. Such updates can be communicated in writing to TIAA, 8500 Andrew Carnegie Blvd., Charlotte, NC 28262; or by calling us between the hours of 8:00 a.m. and 10:00 p.m. ET, Monday-Friday and 9:00 a.m. to 6:00 p.m. ET Saturday at 800-842-2252; or 24 hours a day via our website www.tiaa.org.
| 21 | Prospectus Single Premium Immediate Annuities |
Table of Contents
| APPENDIX |
Appendix A—Funds Available Under the Contract
The following is a list of Funds available under the Contract. Each of the Funds listed is available to you as an investment option without a restriction, unless indicated otherwise below. More information about the Funds is available in the Prospectuses for the Funds, which may be amended from time to time and can be found online at https://vpx.broadridge.com/GetContract1.asp?cid=tiaavpx&fid=NRVA01516. You can also request this information at no cost by calling 800 842-2252.
The current expenses and performance information below reflects fees and expenses of the Funds, but do not reflect the other fees and expenses that your Contract may charge. Expenses would be higher and performance would be lower if these other charges were included. Each Fund’s past performance is not necessarily an indication of future performance.
| Type | Fund Name and Adviser/Subadvisor | Current Expenses |
Average Annual Total Returns (12/31/25) |
|||||||||||||||
| 1 year | 5 years | 10 Years | ||||||||||||||||
| Equity | Nuveen Life Growth Equity Fund—Teachers Advisors, LLC, an indirect subsidiary of TIAA. | 0.52 | % | 15.30 | % | 11.03 | % | 15.49 | % | |||||||||
| Equity | Nuveen Life Core Equity Fund—Teachers Advisors, LLC, an indirect subsidiary of TIAA. | 0.51 | % | 13.80 | % | 13.66 | % | 14.01 | % | |||||||||
| Equity | Nuveen Life International Equity Fund—Teachers Advisors, LLC, an indirect subsidiary of TIAA.1 | 0.60 | % | 32.44 | % | 8.09 | % | 7.96 | % | |||||||||
| Equity | Nuveen Life Large Cap Value Fund—Teachers Advisors, LLC, an indirect subsidiary of TIAA.1 | 0.52 | % | 17.23 | % | 12.63 | % | 10.76 | % | |||||||||
| Equity | Nuveen Life Small Cap Equity Fund—Teachers Advisors, LLC, an indirect subsidiary of TIAA.1 | 0.53 | % | 16.40 | % | 11.02 | % | 11.04 | % | |||||||||
| Index | Nuveen Life Stock Index Fund—Teachers Advisors, LLC, an indirect subsidiary of TIAA.1 | 0.08 | % | 17.04 | % | 13.10 | % | 14.21 | % | |||||||||
| Specialty | Nuveen Life Real Estate Securities Select Fund—Teachers Advisors, LLC, an indirect subsidiary of TIAA.1 | 0.57 | % | 1.86 | % | 3.55 | % | 5.88 | % | |||||||||
| Specialty | Nuveen Life Large Cap Responsible Equity Fund—Teachers Advisors, LLC, an indirect subsidiary of TIAA.1 | 0.22 | % | 16.63 | % | 11.83 | % | 13.62 | % | |||||||||
| 1. | The Fund’s annual expenses reflect a temporary fee reduction. Please refer to the Fund Prospectus for additional information. |
| Single Premium Immediate Annuities Prospectus | 22 |
Table of Contents
For more information about Single Premium Immediate Annuity
How to reach us
TIAA website
Account performance, personal account information and transactions, product descriptions, and information about investment choices and Income Options
www.tiaa.org
24 hours a day, 7 days a week
Administrative Office
800 842-2252
8:00 a.m. to 10:00 p.m. ET Monday–Friday
9:00 a.m. to 6:00 p.m. ET Saturday
EDGAR Contract Identifier C000017020
The Statement of Additional Information (“SAI”) dated May 1, 2026, has been filed with the SEC and is incorporated by reference into this Prospectus and is legally part of the Prospectus. We will provide the SAI without charge upon request. For a free copy of the SAI and to make inquiries about your Contract please call 800 842-2252 or write to us at our Administrative Office:
Teachers Insurance and Annuity Association of America
P.O. Box 724508
Atlanta, Georgia 31139
You may also obtain reports and other information about the Separate Account on the SEC’s website at www.sec.gov and copies of this information may be obtained, upon payment of a duplicating fee, by electronic request at the following email address: publicinfo@sec.gov.

A10861
(05/26)
Table of Contents

Statement of Additional Information
Single Premium Immediate Variable Annuity Contracts
Funded through
TIAA Separate Account VA-5
And
Teachers Insurance and Annuity Association of America
MAY 1, 2026
This Statement of Additional Information (“SAI”) contains additional information regarding the Single Premium Immediate Variable Annuity Contracts (the “Contract”) funded through TIAA Separate Account VA-5 and offered by Teachers Insurance and Annuity Association of America (the “Company” or “TIAA”).
This SAI is not a Prospectus and should be read together with the current Prospectus for the Contract dated May 1, 2026. You may obtain a copy of the Prospectus at no charge by writing us at: Teachers Insurance and Annuity Association of America TIAA, 730 Third Avenue, New York, N.Y. 10017-3206, by calling us toll-free at 877 825-0411; by visiting our website at: www.tiaa.org/public/Prospectuses, or by accessing the Securities and Exchange Commission’s website at http://www.sec.gov/. Terms used in the Prospectus are incorporated by reference into this SAI.
Table of Contents
TABLE OF CONTENTS
| General Information and History | B-2 | |
| B-2 | ||
| B-2 | ||
| Services | B-2 | |
| Experts | B-3 | |
| B-3 | ||
| Principal Underwriter | B-3 | |
| Purchases of Securities Being Offered | B-3 | |
| Annuity Payments | B-3 | |
| Additional Information | B-4 | |
| B-4 | ||
| B-4 | ||
| B-4 | ||
| B-4 | ||
| Financial Statements | B-5 | |
General Information and History
Teachers Insurance and Annuity Association of America (“TIAA”)
TIAA is a stock life insurance company, organized under the laws of New York State. It was founded on March 4, 1918, by the Carnegie Foundation for the Advancement of Teaching. All of the stock of TIAA is held by the TIAA Board of Governors, a nonprofit New York membership corporation whose main purpose is to hold TIAA’s stock. TIAA’s headquarters are at 730 Third Avenue, New York, New York 10017-3206. TIAA also offers annuities, insurance policies and financial products other than Intelligent Variable Annuity, and some of these products, such as fixed annuities, are supported by the assets in our general account.
TIAA is the companion organization of the College Retirement Equities Fund (“CREF”), the first company in the United States to issue a variable annuity. CREF is a nonprofit membership corporation established in New York State in 1952. Together, TIAA and CREF form the principal retirement system for the nation’s education and research communities and form one of the largest pension systems based on assets under management in the United States. CREF does not stand behind TIAA’s guarantees, and TIAA does not guarantee CREF’s products
On July 27, 1998, we established what is now known as TIAA Separate Account VA-5 (the “Separate Account”) under New York law (prior to January 1, 2026 this Separate Account was named TIAA-CREF Life Separate Account VA-1). We own the assets in the Separate Account and we are obligated to pay all benefits under the Contract. We may use the Separate Account to support other variable annuity contracts we issue. The Separate Account is registered with the Securities and Exchange Commission (“SEC”) as a unit investment trust under the 1940 Act and qualifies as a “separate account” within the meaning of the federal securities laws. This registration does not involve supervision of the management or investment practices or policies of the Separate Account by the SEC.
We have divided the Separate Account into Investment Accounts, each of which invests in shares of one Portfolio. The Investment Accounts buy and sell Portfolio shares at net asset value. Any dividends and distributions from a Portfolio are reinvested at net asset value in shares of that Portfolio.
The assets in the Separate Account are kept separate from our General Account and our other separate accounts. Assets equal to the reserves and contract liabilities of the Separate Account will not be charged with liabilities that arise from any other business we may conduct. We may transfer assets, in excess of the reserves and contract liabilities of the Separate Account, to our General Account. All income, gains and losses, whether or not realized, of an Investment Account will be credited to or charged against that Investment Account without regard to our other income, gains or losses. The valuation of all assets in the Separate Account will be determined in accordance with all applicable laws and regulations. The Separate Account may include other Investment Accounts that are not available under the Contract and are not discussed in this Prospectus.
Pursuant to an administrative service agreement with our parent company, TIAA, McCamish Systems LLC, a Georgia Limited Liability Company, provides product administration to TIAA McCamish Systems LLC is located at 3225 Cumberland Blvd SE, Suite 700, Atlanta, GA 30339. For years 2025, 2024and 2023, TIAA Life provided total compensation for product administrative services of $3,898,552.65, $4,206,735 and $3,807,319 respectively, for all life insurance and non-qualified annuities product administration.
We have an agreement with State Street Bank and Trust Company, a trust company established under the laws of the Commonwealth of Massachusetts, to perform investment accounting and recordkeeping functions for the investment securities, other non-cash investment properties, and/or monies in the Separate Account of TIAA Life. State Street Bank and Trust Company is located at 801 Pennsylvania, Kansas City, MO 64105. For years 2025, 2024 and 2023, TIAA Life paid custody fees of $421,143.78, $425,325 and $426,719 respectively.
| B-2 | Statement of Additional Information ∎ Single Premium Immediate Annuities |
Table of Contents
TIAA Life on behalf of the Separate Account has entered an agreement whereby JP Morgan will provide certain custodial settlement and other associated services to the Separate Account. JP Morgan is located at Chase Metrotech Center, Brooklyn, NY 11245. For years 2025, 2024 and 2023, TIAA Life provided compensation for trade settlement services of $55,372.74 $54,479.49 and $63,370 respectively.
Independent Registered Public Accounting Firm
Separate Account Financial Statements
The financial statements of TIAA Separate Account VA-5 as of December 31, 2025 and for each of the periods indicated therein included in this Registration Statement have been so included in reliance on the report of PricewaterhouseCoopers LLP, an independent registered public accounting firm, given on the authority of said firm as experts in auditing and accounting.
TIAA Statutory-Basis Financial Statements
The statutory-basis financial statements as of December 31, 2025 and 2024 and for each of the three years in the period ended December 31, 2025 included in this Registration Statement have been so included in reliance on the report of PricewaterhouseCoopers LLP, an independent registered public accounting firm, given on the authority of said firm as experts in auditing and accounting.
Distribution of the Contracts.
We offer each Contract to the public on a continuous basis. We anticipate continuing to offer the Contracts but reserve the right to discontinue the offering.
Each Contract is offered by TIAA-CREF Individual & Institutional Services, LLC (“TC Services”), a subsidiary of TIAA which is registered with the SEC as broker-dealers and a member of Financial Industry Regulatory Authority or FINRA. TC Services may also enter into selling agreements with third parties to distribute the Contracts. TC Services is considered the “principal underwriter” for interests in the Contract. Anyone distributing a Contract must be a registered representative of TC Services or have entered into a selling agreement with TC Services. The main offices of TC Services is at 730 Third Avenue, New York, New York 10017-3206. No commissions are paid to TC Services or any other entity in connection with the distribution of each Contract. We paid TC Services for the fiscal year ended December 31, $4,065,420, $3,124,753 and $2,371,159 in 2025, 2024 and 2023 respectively. We intend to recoup payments made to TC Services through fees and charges imposed under the Contract.
Purchases of Securities Being Offered
TIAA’s Single Premium Immediate Annuity is a contract (“SPIA” or Contract”) offered by TIAA, which provides various Income Options for a Contract Owner to choose. Each Contract is designed to provide the Contract Owner with a stream of income for the life of the named Annuitant(s) (which may be you or another person) or for a specified period of time you select. You may purchase a One-Life Annuity, a Two-Life Annuity, or a Fixed-Period Annuity., which are described further in the Prospectus. Each Contract only provides for one single premium payment and no additional premium payments are permitted under the Contract. You can then choose a combination of fixed and variable annuity payments by allocating your single Premium to a TIAA Fixed Account or to one or more of the following eight separate account variable Investment Accounts, which are described in more detail in the Prospectus and under “Appendix A—Funds Available Under the Contract” in the Prospectus.
As discussed in the Prospectus, TIAA does not charge a sales load nor offer different levels of classes under the Contract. There are no special purchase plans or special exchange privileges under the Contract. However, a Contract Owner may exchange among other certain Investment Accounts available in the Prospectus, subject to the terms of the Contract. TIAA has adopted policies restricting frequent trading activity, which are discussed further in the Prospectus under the heading “Transfer Policies Regarding Market Timing and Frequent Trading.”
Calculating Annuity Unit Values.
Separate Annuity Unit values are maintained for Annuity Units payable from each Investment Account under each Income Change Method. The values are calculated as of each Valuation Day. Annuity Unit values for an Income Change Method are determined by multiplying each Investment Account’s Annuity Unit value at the end of the previous Valuation Day by that account’s net investment factor for the valuation period, and dividing the result by the value of $1.00 accumulated with interest over the valuation period at an effective annual rate of 4%. The resulting value is then adjusted to reflect that annuity income amounts are redetermined only on the payment valuation date for that Income Change Method. The purpose of the adjustment is
| Single Premium Immediate Annuities ∎ Statement of Additional Information | B-3 |
Table of Contents
to equitably apportion assets of each account among those who receive annuity income for the entire period between two payment valuation dates for an Income Change Method, and those who start or stop receiving annuity income under that Income Change Method between the two dates.
An Investment Account’s net investment factor equals its gross investment factor minus the separate account charge incurred since the previous Valuation Day. An Investment Account’s gross investment factor equals A divided by B, as follows:
| A equals | i. | the net asset value of the shares in the Fund(s) held by the account as of the end of the Valuation Day, excluding the net effect of Contractowners’ transactions (i.e., Premiums received, benefits paid, and transfers to and from the account) made during that day; plus | ||
| ii. | investment income and capital gains distributed to the account; less | |||
| iii. | any amount paid and/or reserved for tax liability resulting from the operation of the account since the previous Valuation Day. | |||
| B equals | the value of the shares in the Fund(s) held by the account as of the end of the prior Valuation Day, including the net effect of Contractowners’ transactions made during the prior Valuation Day. |
For more information about Annuity payments, see the Prospectus under “Annuity Payments”.
TIAA and the Separate Account are subject to regulation by the New York Department of Financial Services (“Department”) as well as by the insurance regulatory authorities of other states and jurisdictions. TIAA and the Separate Account must file with the Department periodic statements on forms promulgated by the Department. The separate account books and assets are subject to review and examination by the Department and the Department’s agents at all times, and a full examination into the affairs of the Separate Account is made at least every five years. In addition, a full examination of the Separate Account’s operations is usually conducted periodically by some other states.
All matters of applicable state law pertaining to the Contracts, including TIAA’s right to issue the Contracts, have been passed upon by Deirdre Hykal, Executive Vice President, General Counsel, Product & Distribution Law of TIAA.
Carlton Fields, P.A. has provided advice on certain matters relating to the federal securities laws.
A registration statement has been filed with the Securities and Exchange Commission (“SEC”), under the Securities Act of 1933 (“1933 Act”), and all material rights and obligations with respect to the Contracts are disclosed in the Prospectus. Not all of the information set forth in the registration statement, and its amendments and exhibits has been included in the Prospectus or this Statement of Additional Information. Statements contained in this registration statement concerning the contents of the Contracts and other legal instruments are intended to be summaries. For a complete statement of the terms of these documents, you should refer to the instruments filed with the SEC.
Diversification Requirements. Section 817(h) of the Internal Revenue Code (“IRC”) and the regulations under it provide that separate account investments underlying a non-qualified contract must be “adequately diversified” for it to qualify as an annuity contract under IRC section 72. The Separate Account intends to comply with the diversification requirements of the regulations under section 817(h). This will affect how we make investments.
Under the IRC, you could be considered the owner of the assets of the Separate Account used to support your contract. If this happens, you’d have to include income and gains from the Separate Account assets in your gross income. The Internal Revenue Service (IRS) has published rulings stating that a variable Contract owner will be considered the owner of separate account assets if the Contract owner has any powers that the actual owner of the assets might have, such as the ability to exercise investment control. Your ownership rights under the Contract are similar but not identical to those described by the IRS in rulings that held that contract owners were not owners of separate account assets, so the IRS therefore might not rule the same way in your case. Teachers Insurance and Annuity Association of America (“TIAA”) reserves the right to change the Contract if necessary to help prevent your being considered the owner of the Separate Account’s assets.
Required Distributions. All payments upon the death of a Contract owner will be made according to the requirements of section 72(s) of the IRC. Under that IRC section, if you die before we begin making annuity payments, all payments under the Contract must be distributed within five years of your death. However, if your Beneficiary is a natural person and payments begin within one year of your death, and within 60 days of the date we receive due proof of death, the distribution may be made over the lifetime of your Beneficiary or over a period not to exceed your Beneficiary’s life expectancy, as defined in the Code. If your spouse (as defined under Federal law) is the sole Beneficiary entitled to payments, he or she may choose to become the owner and continue the Contract. If you die on or after the date we begin making annuity payments, the remaining interest in the
| B-4 | Statement of Additional Information ∎ Single Premium Immediate Annuities |
Table of Contents
Contract must be distributed at least as quickly as under the method of distribution being used as of the date of your death. If the owner is not a natural person, the death of the Annuitant is treated as the death of the owner for these distribution requirements.
The Contract is designed to comply with section 72(s). TIAA will review the Contract and amend it if necessary to make sure that it continues to comply with the section’s requirements.
The merger of the Contracts’ issuer TC Life into TIAA on January 1, 2026 did not result in a material change to the Contracts. Accordingly, we do not believe that the merger was a taxable event that would alter the investment in the contract or other tax attributes of the Contracts. However, TIAA has not obtained rulings from the IRS as to the tax consequences of the merger.
Audited financial statements of the Separate Account and TIAA follow. TIAA’s financial statements should be considered only as bearing upon TIAA’s ability to meet its obligations under the Contracts. They should not be considered as bearing on the investment performance of the assets held in the Separate Account.
| Single Premium Immediate Annuities ∎ Statement of Additional Information | B-5 |
Table of Contents
| TIAA Separate Account VA-5 (formerly, TIAA-CREF Life Separate Account VA-1) | ||
| Audited financial statements | ||
| For the period or year ended December 31, 2025 | ||
| Report of independent registered public accounting firm | B-7 | |
| Statements of Assets and Liabilities | B-9 | |
| Statements of Operations | B-9 | |
| Statements of Changes in Net Assets | B-24 | |
| Notes to Financial Statements | B-62 | |
| B-6 | Statement of Additional Information ∎ TIAA Separate Account VA-5 (formerly, TIAA-CREF Life Separate Account VA-1) |
Table of Contents
Report of Independent Registered Public Accounting Firm
To the Board of Trustees of Teachers Insurance and Annuity Association of America and the Contract Owners of TIAA Separate Account VA-5
Opinions on the Financial Statements
We have audited the accompanying statements of assets and liabilities of each of the sub-accounts of TIAA Separate Account VA-5 indicated in the table below as of the dates indicated in the table below, and the related statements of operations and of changes in net assets for each of the periods indicated in the table below, including the related notes (collectively referred to as the “financial statements”). In our opinion, the financial statements present fairly, in all material respects, the financial position of each of the sub-accounts of TIAA Separate Account VA-5 as of the dates indicated in the table below, and the results of each of their operations and the changes in each of their net assets for the periods indicated in the table below, in conformity with accounting principles generally accepted in the United States of America.
| Nuveen Life Balanced(1) |
MFS Massachusetts Investors Growth Stock Portfolio(1) | |
| Nuveen Life Core Bond(1) |
MFS Utilities Series – Initial Class(1) | |
| Nuveen Life Core Equity(1) |
Neuberger Berman Advisers Management Trust Mid Cap Intrinsic Value Portfolio–I Class(1) | |
| Nuveen Life Growth Equity(1) |
Neuberger Berman Advisers Management Trust Sustainable Equity Portfolio–I Class(1) | |
| Nuveen Life International Equity(1) |
Nomura VIP International Core Equity Series—Standard Class(3) | |
| Nuveen Life Large Cap Responsible Equity(1) |
Nomura VIP Small Cap Value Series—Standard Class(1) | |
| Nuveen Life Large Cap Value(1) |
PIMCO VIT All Asset Portfolio—Institutional Class(1) | |
| Nuveen Life Money Market(1) |
PIMCO VIT Commodity Real Return Strategy Portfolio- Institutional Class(1) | |
| Nuveen Life Real Estate Securities Select(1) |
PIMCO VIT Emerging Markets Bond Portfolio—Institutional Class(1) | |
| Nuveen Life Small Cap Equity(1) |
PIMCO VIT Global Bond Opportunities Portfolio (Unhedged)—Institutional Class(1) | |
| Nuveen Life Stock Index(1) |
PIMCO VIT Real Return Portfolio—Institutional Class(1) | |
| Calamos Growth and Income Portfolio(1) |
PSF Natural Resources Portfolio—Class II(2) | |
| ClearBridge Variable Growth Portfolio—Class I(1) |
PSF PGIM Jennison Blend Portfolio—Class II(1) | |
| ClearBridge Variable Small Cap Growth Portfolio—Class I(1) |
PSF PGIM Jennison Value Portfolio—Class II(1) | |
| Columbia Variable Portfolio—Acorn(1) |
PVC Equity Income Account—Class 1(1) | |
| Columbia Variable Portfolio—Acorn International(1) |
PVC MidCap Account—Class 1(1) | |
| Credit Suisse Trust-Commodity Return Strategy Portfolio(1) |
Royce Capital Fund Micro-Cap Portfolio—Investment Class(1) | |
| Dimensional VA Equity Allocation Portfolio(1) |
Royce Capital Fund Small-Cap Portfolio—Investment Class(1) | |
| Dimensional VA Global Bond Portfolio(1) |
T. Rowe Price Health Sciences Portfolio I(1) | |
| Dimensional VA Global Moderate Allocation Portfolio(1) |
T. Rowe Price Limited-Term Bond Portfolio(1) | |
| Dimensional VA International Small Portfolio(1) |
Templeton Developing Markets VIP Fund—Class 1(1) | |
| Dimensional VA International Value Portfolio(1) |
Vanguard VIF Balanced Portfolio(1) | |
| Dimensional VA Short-Term Fixed Portfolio(1) |
Vanguard VIF Capital Growth Portfolio(1) | |
| Dimensional VA US Large Value Portfolio(1) |
Vanguard VIF Conservative Allocation Portfolio(1) | |
| Dimensional VA US Targeted Value Portfolio(1) |
Vanguard VIF Equity Index Portfolio(1) | |
| Franklin Income VIP Fund—Class 1(1) |
Vanguard VIF Global Bond Index Portfolio(1) | |
| Franklin Mutual Shares VIP Fund—Class 1(1) |
Vanguard VIF High Yield Bond Portfolio(1) | |
| Franklin Small-Mid Cap Growth VIP Fund—Class 1(1) |
Vanguard VIF International Portfolio(1) | |
| Janus Henderson Forty Portfolio—Institutional Shares(1) |
Vanguard VIF Mid-Cap Index Portfolio(1) | |
| Janus Henderson Mid Cap Value Portfolio-Institutional Shares(1) |
Vanguard VIF Moderate Allocation Portfolio(1) | |
| Janus Henderson Overseas Portfolio—Institutional Shares(1) |
Vanguard VIF Real Estate Index Portfolio(1) | |
| John Hancock Disciplined Value Emerging Markets Equity Trust(1) |
Vanguard VIF Small Company Growth Portfolio(1) | |
| LVIP Fidelity Institutional AM Total Bond—Standard Class(1) |
Vanguard VIF Total Bond Market Index Portfolio(1) | |
| Matson Money Fixed Income VI Portfolio(1) |
Vanguard VIF Total International Stock Market Index Portfolio(1) | |
| Matson Money International Equity VI Portfolio(1) |
Vanguard VIF Total Stock Market Index Portfolio(1) | |
| Matson Money U.S. Equity VI Portfolio(1) |
VY CBRE Global Real Estate Portfolio—Class I(1) | |
| MFS Global Equity Series—Initial Class(1) |
Western Asset Variable Global High Yield Bond Portfolio Class I(1) | |
| MFS Growth Series—Initial Class(1) |
||
| (1) | Statement of assets and liabilities as of December 31, 2025, statement of operations for the year ended December 31, 2025 and statement of changes in net assets for the years ended December 31, 2025 and December 31, 2024. |
| (2) | Statement of assets and liabilities as of April 11, 2025, statement of operations for the period January 1, 2025 through April 11, 2025 and statement of changes in net assets for the period January 1, 2025 through April 11, 2025 and for the year ended December 31, 2024. |
| (3) | Statement of assets and liabilities as of December 31, 2025, statement of operations for the year ended December 31, 2025 and statement of changes in net assets for the year ended December 31, 2025 and for the period April 26, 2024 (commencement of operations) through December 31, 2024. |
| TIAA Separate Account VA-5 (formerly, TIAA-CREF Life Separate Account VA-1) ∎ Statement of Additional Information | B-7 |
Table of Contents
Basis for Opinions
These financial statements are the responsibility of the Teachers Insurance and Annuity Association of America management. Our responsibility is to express an opinion on the financial statements of each of the sub-accounts of TIAA Separate Account VA-5 based on our audits. We are a public accounting firm registered with the Public Company Accounting Oversight Board (United States) (PCAOB) and are required to be independent with respect to each of the sub-accounts of TIAA Separate Account VA-5 in accordance with the U.S. federal securities laws and the applicable rules and regulations of the Securities and Exchange Commission and the PCAOB.
We conducted our audits of these financial statements in accordance with the standards of the PCAOB. Those standards require that we plan and perform the audit to obtain reasonable assurance about whether the financial statements are free of material misstatement, whether due to error or fraud.
Our audits included performing procedures to assess the risks of material misstatement of the financial statements, whether due to error or fraud, and performing procedures that respond to those risks. Such procedures included examining, on a test basis, evidence regarding the amounts and disclosures in the financial statements. Our audits also included evaluating the accounting principles used and significant estimates made by management, as well as evaluating the overall presentation of the financial statements. Our procedures included confirmation of investments owned as of December 31, 2025, by correspondence with the transfer agents of the investee mutual funds. We believe that our audits provide a reasonable basis for our opinions.
/s/ PricewaterhouseCoopers LLP
Charlotte, North Carolina
April 28, 2026
We have served as the auditor of one or more of the sub-accounts of TIAA Separate Account VA-5 since 2005.
| B-8 | Statement of Additional Information ∎ TIAA Separate Account VA-5 (formerly, TIAA-CREF Life Separate Account VA-1) |
Table of Contents
| Statements of Assets and Liabilities
TIAA Separate Account VA-5 (formerly, TIAA-CREF Life Separate Account VA-1) ∎ December 31, 2025 |
| Nuveen |
Nuveen Life Core Bond Sub-Account |
Nuveen Life Core Equity Sub-Account |
Nuveen Life Growth Equity Sub-Account |
Nuveen Life International Equity Sub-Account |
||||||||||||||||
| ASSETS |
||||||||||||||||||||
| Investments, at value |
$ | 65,268,469 | $ | 166,456,710 | $ | 194,069,131 | $ | 165,724,636 | $ | 156,594,693 | ||||||||||
| Total assets |
$ | 65,268,469 | $ | 166,456,710 | $ | 194,069,131 | $ | 165,724,636 | $ | 156,594,693 | ||||||||||
| NET ASSETS |
||||||||||||||||||||
| Accumulation fund |
$ | 65,268,469 | $ | 166,456,710 | $ | 168,092,839 | $ | 149,249,624 | $ | 150,003,646 | ||||||||||
| Annuity fund |
— | — | 25,976,292 | 16,475,012 | 6,591,047 | |||||||||||||||
| Net assets |
$ | 65,268,469 | $ | 166,456,710 | $ | 194,069,131 | $ | 165,724,636 | $ | 156,594,693 | ||||||||||
| Investments, at cost |
$ | 62,758,406 | $ | 170,299,698 | $ | 167,050,127 | $ | 116,895,662 | $ | 117,474,948 | ||||||||||
| Shares held in corresponding Funds |
4,870,781 | 17,917,837 | 8,745,792 | 6,433,410 | 12,846,160 | |||||||||||||||
| UNIT VALUE |
||||||||||||||||||||
| Personal Annuity Select/Single Premium Immediate Annuity |
$ | — | $ | — | $ | 180.66 | $ | 128.53 | $ | 55.02 | ||||||||||
| Lifetime Variable Select Annuity |
— | 45.56 | 180.58 | 128.62 | 55.02 | |||||||||||||||
| Intelligent Variable Annuity |
||||||||||||||||||||
| Band 1 |
51.33 | 46.39 | 183.89 | 130.92 | 56.00 | |||||||||||||||
| Band 2 |
52.25 | 47.67 | 188.94 | 134.52 | 57.53 | |||||||||||||||
| Band 3 |
52.88 | 48.53 | 192.38 | 136.97 | 58.58 | |||||||||||||||
| Band 4 |
53.83 | 49.87 | 197.67 | 140.73 | 60.19 | |||||||||||||||
| Band 5 |
50.73 | 45.56 | 180.60 | 128.58 | 54.99 | |||||||||||||||
| Band 6 |
51.64 | 46.81 | 185.55 | 132.11 | 56.50 | |||||||||||||||
| Band 7 |
52.25 | 47.67 | 188.94 | 134.52 | 57.53 | |||||||||||||||
| Band 8 |
53.19 | 48.98 | 194.13 | 138.21 | 59.12 | |||||||||||||||
TIAA Separate Account VA-5 (formerly, TIAA-CREF Life Separate Account VA-1) ∎ For the period or year ended December 31, 2025
| Nuveen Life Balanced Sub-Account |
Nuveen Life Core Bond Sub-Account |
Nuveen Life Core Equity Sub-Account |
Nuveen Life Growth Equity Sub-Account |
Nuveen Life International Equity Sub-Account |
||||||||||||||||
| INVESTMENT INCOME |
||||||||||||||||||||
| Dividends |
$ | 1,724,000 | $ | 6,722,155 | $ | 1,657,905 | $ | 123,527 | $ | 2,602,337 | ||||||||||
| Expenses |
||||||||||||||||||||
| Administrative expenses |
62,170 | 182,542 | 316,574 | 259,409 | 184,900 | |||||||||||||||
| Mortality and expense risk charges |
35,389 | 202,482 | 549,268 | 456,039 | 307,757 | |||||||||||||||
| Guaranteed minimum death benefits |
30,344 | 51,971 | 20,389 | 17,494 | 32,741 | |||||||||||||||
| Total expenses |
127,903 | 436,995 | 886,231 | 732,942 | 525,398 | |||||||||||||||
| Net investment income (loss) |
1,596,097 | 6,285,160 | 771,674 | (609,415 | ) | 2,076,939 | ||||||||||||||
| REALIZED AND UNREALIZED GAIN (LOSS) ON INVESTMENTS |
|
|||||||||||||||||||
| Realized gain (loss) on investments |
2,230,006 | (2,771,888 | ) | 4,213,418 | 8,379,155 | 5,704,367 | ||||||||||||||
| Capital gain distributions |
2,426,879 | — | 23,306,703 | 3,877,473 | — | |||||||||||||||
| Net realized gain (loss) |
4,656,885 | (2,771,888 | ) | 27,520,121 | 12,256,628 | 5,704,367 | ||||||||||||||
| Net change in unrealized appreciation (depreciation) on investments |
1,098,971 | 7,068,493 | (5,144,552 | ) | 10,204,736 | 30,287,459 | ||||||||||||||
| Net realized and unrealized gain (loss) on investments |
5,755,856 | 4,296,605 | 22,375,569 | 22,461,364 | 35,991,826 | |||||||||||||||
| Net increase (decrease) in net assets from operations |
$ | 7,351,953 | $ | 10,581,765 | $ | 23,147,243 | $ | 21,851,949 | $ | 38,068,765 | ||||||||||
| See notes to financial statements | TIAA Separate Account VA-5 (formerly, TIAA-CREF Life Separate Account VA-1) ∎ Statement of Additional Information | B-9 |
Table of Contents
| Statements of Assets and Liabilities
TIAA Separate Account VA-5 (formerly, TIAA-CREF Life Separate Account VA-1) ∎ December 31, 2025 |
| Nuveen Life Large Cap Responsible Equity Sub-Account |
Nuveen Life Large Cap Value |
Nuveen Life Money Market |
Nuveen Life Real Estate |
Nuveen Life Small Cap |
||||||||||||||||
| ASSETS |
||||||||||||||||||||
| Investments, at value |
$ | 98,963,199 | $ | 78,895,900 | $ | 114,540,214 | $ | 53,755,351 | $ | 65,156,084 | ||||||||||
| Total assets |
$ | 98,963,199 | $ | 78,895,900 | $ | 114,540,214 | $ | 53,755,351 | $ | 65,156,084 | ||||||||||
| NET ASSETS |
||||||||||||||||||||
| Accumulation fund |
$ | 89,999,670 | $ | 67,590,204 | $ | 114,540,214 | $ | 47,299,602 | $ | 58,440,079 | ||||||||||
| Annuity fund |
8,963,529 | 11,305,696 | — | 6,455,749 | 6,716,005 | |||||||||||||||
| Net assets |
$ | 98,963,199 | $ | 78,895,900 | $ | 114,540,214 | $ | 53,755,351 | $ | 65,156,084 | ||||||||||
| Investments, at cost |
$ | 85,180,514 | $ | 67,019,258 | $ | 114,540,214 | $ | 56,211,386 | $ | 56,407,164 | ||||||||||
| Shares held in corresponding Funds |
4,652,713 | 3,762,322 | 114,540,214 | 4,002,632 | 4,123,803 | |||||||||||||||
| UNIT VALUE |
||||||||||||||||||||
| Personal Annuity Select/Single Premium Immediate Annuity |
$ | 158.42 | $ | 181.71 | $ | — | $ | 152.03 | $ | 229.17 | ||||||||||
| Lifetime Variable Select Annuity |
159.02 | 181.75 | 12.95 | 152.14 | 229.30 | |||||||||||||||
| Intelligent Variable Annuity |
||||||||||||||||||||
| Band 1 |
161.23 | 184.97 | 13.20 | 154.79 | 233.30 | |||||||||||||||
| Band 2 |
165.66 | 190.06 | 13.56 | 159.04 | 239.71 | |||||||||||||||
| Band 3 |
168.68 | 193.52 | 13.81 | 161.94 | 244.08 | |||||||||||||||
| Band 4 |
173.31 | 198.84 | 14.19 | 166.39 | 250.78 | |||||||||||||||
| Band 5 |
158.35 | 181.66 | 12.96 | 152.02 | 229.12 | |||||||||||||||
| Band 6 |
162.70 | 186.65 | 13.32 | 156.19 | 235.41 | |||||||||||||||
| Band 7 |
165.66 | 190.06 | 13.56 | 159.04 | 239.71 | |||||||||||||||
| Band 8 |
170.21 | 195.28 | 13.94 | 163.41 | 246.29 | |||||||||||||||
Statements of Operations
TIAA Separate Account VA-5 (formerly, TIAA-CREF Life Separate Account VA-1) ∎ For the period or year ended December 31, 2025
| Nuveen Life Large Cap Responsible Equity Sub-Account |
Nuveen Life Large Cap Value |
Nuveen Life Money Market |
Nuveen Life Real Estate |
Nuveen Life Small Cap |
||||||||||||||||
| INVESTMENT INCOME |
||||||||||||||||||||
| Dividends |
$ | 1,104,290 | $ | 1,076,271 | $ | 4,791,679 | $ | 1,566,971 | $ | 614,332 | ||||||||||
| Expenses |
||||||||||||||||||||
| Administrative expenses |
152,180 | 120,157 | 124,108 | 96,849 | 99,841 | |||||||||||||||
| Mortality and expense risk charges |
250,180 | 193,641 | 166,988 | 169,297 | 172,192 | |||||||||||||||
| Guaranteed minimum death benefits |
11,631 | 10,489 | 42,630 | 4,256 | 5,946 | |||||||||||||||
| Total expenses |
413,991 | 324,287 | 333,726 | 270,402 | 277,979 | |||||||||||||||
| Net investment income (loss) |
690,299 | 751,984 | 4,457,953 | 1,296,569 | 336,353 | |||||||||||||||
| REALIZED AND UNREALIZED GAIN (LOSS) ON INVESTMENTS |
|
|||||||||||||||||||
| Realized gain (loss) on investments |
2,786,082 | 1,828,672 | — | (789,102 | ) | 1,018,480 | ||||||||||||||
| Capital gain distributions |
10,915,336 | 5,124,053 | — | 1,410,672 | 7,339,885 | |||||||||||||||
| Net realized gain (loss) |
13,701,418 | 6,952,725 | — | 621,570 | 8,358,365 | |||||||||||||||
| Net change in unrealized appreciation (depreciation) on investments |
(56,750 | ) | 3,735,053 | — | (1,144,129 | ) | 333,887 | |||||||||||||
| Net realized and unrealized gain (loss) on investments |
13,644,668 | 10,687,778 | — | (522,559 | ) | 8,692,252 | ||||||||||||||
| Net increase (decrease) in net assets from operations |
$ | 14,334,967 | $ | 11,439,762 | $ | 4,457,953 | $ | 774,010 | $ | 9,028,605 | ||||||||||
| B-10 | Statement of Additional Information ∎ TIAA Separate Account VA-5 (formerly, TIAA-CREF Life Separate Account VA-1) | See notes to financial statements |
Table of Contents
| continued |
| Life Stock Index |
Calamos Growth and Income Portfolio Sub-Account |
ClearBridge Variable Portfolio-Class I |
ClearBridge Variable Small Cap Growth Portfolio-Class I Sub-Account |
Columbia Variable Portfolio—Acorn Sub-Account |
||||||||||||||||
| ASSETS |
||||||||||||||||||||
| Investments, at value |
$ | 722,273,337 | $ | 5,672,741 | $ | 30,519,559 | $ | 5,681,720 | $ | 7,379,937 | ||||||||||
| Total assets |
$ | 722,273,337 | $ | 5,672,741 | $ | 30,519,559 | $ | 5,681,720 | $ | 7,379,937 | ||||||||||
| NET ASSETS |
||||||||||||||||||||
| Accumulation fund |
$ | 652,423,206 | $ | 5,672,741 | $ | 30,519,559 | $ | 5,681,720 | $ | 7,379,937 | ||||||||||
| Annuity fund |
69,850,131 | — | — | — | — | |||||||||||||||
| Net assets |
$ | 722,273,337 | $ | 5,672,741 | $ | 30,519,559 | $ | 5,681,720 | $ | 7,379,937 | ||||||||||
| Investments, at cost |
$ | 464,436,036 | $ | 4,094,925 | $ | 33,918,490 | $ | 5,579,017 | $ | 6,281,133 | ||||||||||
| Shares held in corresponding Funds |
13,839,305 | 229,202 | 2,172,211 | 201,479 | 464,147 | |||||||||||||||
| UNIT VALUE |
||||||||||||||||||||
| Personal Annuity Select/Single Premium Immediate Annuity |
$ | 209.21 | $ | — | $ | — | $ | — | $ | — | ||||||||||
| Lifetime Variable Select Annuity |
209.11 | — | — | — | — | |||||||||||||||
| Intelligent Variable Annuity |
||||||||||||||||||||
| Band 1 |
212.96 | — | 65.68 | 67.30 | 129.83 | |||||||||||||||
| Band 2 |
218.80 | — | 67.48 | 69.15 | 133.40 | |||||||||||||||
| Band 3 |
222.79 | — | 68.71 | 70.41 | 135.83 | |||||||||||||||
| Band 4 |
228.91 | 65.84 | 70.60 | 72.34 | 139.56 | |||||||||||||||
| Band 5 |
209.14 | — | 64.50 | 66.10 | 127.51 | |||||||||||||||
| Band 6 |
214.89 | — | 66.27 | 67.91 | 131.01 | |||||||||||||||
| Band 7 |
218.80 | — | 67.48 | 69.15 | 133.40 | |||||||||||||||
| Band 8 |
224.81 | 64.66 | 69.34 | 71.05 | 137.06 | |||||||||||||||
| Nuveen Life Stock Index |
Calamos Growth and Income Portfolio Sub-Account |
ClearBridge Variable Portfolio-Class I |
ClearBridge Variable Small Cap Growth Portfolio-Class I Sub-Account |
Columbia
Variable Portfolio—Acorn Sub-Account |
||||||||||||||||
| INVESTMENT INCOME |
||||||||||||||||||||
| Dividends |
$ | 8,595,123 | $ | 16,279 | $ | — | $ | — | $ | — | ||||||||||
| Expenses |
||||||||||||||||||||
| Administrative expenses |
1,024,344 | 5,373 | 30,305 | 5,250 | 6,980 | |||||||||||||||
| Mortality and expense risk charges |
1,783,792 | — | 50,508 | 3,586 | 6,894 | |||||||||||||||
| Guaranteed minimum death benefits |
120,539 | 1,640 | 14,630 | 1,852 | 2,505 | |||||||||||||||
| Total expenses |
2,928,675 | 7,013 | 95,443 | 10,688 | 16,379 | |||||||||||||||
| Net investment income (loss) |
5,666,448 | 9,266 | (95,443 | ) | (10,688 | ) | (16,379 | ) | ||||||||||||
| REALIZED AND UNREALIZED GAIN (LOSS) ON INVESTMENTS |
|
|||||||||||||||||||
| Realized gain (loss) on investments |
52,383,538 | 161,172 | (3,082,899 | ) | 143,328 | 416,384 | ||||||||||||||
| Capital gain distributions |
29,617,641 | 441,023 | 4,659,108 | 382,044 | — | |||||||||||||||
| Net realized gain (loss) |
82,001,179 | 602,195 | 1,576,209 | 525,372 | 416,384 | |||||||||||||||
| Net change in unrealized appreciation (depreciation) on investments |
17,307,611 | 258,412 | 2,328,193 | (39,142 | ) | (74,542 | ) | |||||||||||||
| Net realized and unrealized gain (loss) on investments |
99,308,790 | 860,607 | 3,904,402 | 486,230 | 341,842 | |||||||||||||||
| Net increase (decrease) in net assets from operations |
$ | 104,975,238 | $ | 869,873 | $ | 3,808,959 | $ | 475,542 | $ | 325,463 | ||||||||||
| See notes to financial statements | TIAA Separate Account VA-5 (formerly, TIAA-CREF Life Separate Account VA-1) ∎ Statement of Additional Information | B-11 |
Table of Contents
| Statements of Assets and Liabilities
TIAA Separate Account VA-5 (formerly, TIAA-CREF Life Separate Account VA-1) ∎ December 31, 2025 |
| Columbia Variable Portfolio—Acorn International Sub-Account |
Credit Suisse Trust- Commodity Return Strategy Portfolio Sub-Account |
Dimensional VA Equity Allocation Portfolio Sub-Account |
Dimensional VA Global Bond Portfolio Sub-Account |
Dimensional VA Global Moderate Allocation Portfolio Sub-Account |
||||||||||||||||
| ASSETS |
||||||||||||||||||||
| Investments, at value |
$ | 11,547,732 | $ | 599,614 | $ | 17,913,738 | $ | 53,893,804 | $ | 53,965,051 | ||||||||||
| Total assets |
$ | 11,547,732 | $ | 599,614 | $ | 17,913,738 | $ | 53,893,804 | $ | 53,965,051 | ||||||||||
| NET ASSETS |
||||||||||||||||||||
| Accumulation fund |
$ | 11,547,732 | $ | 599,614 | $ | 17,913,738 | $ | 53,893,804 | $ | 53,965,051 | ||||||||||
| Net assets |
$ | 11,547,732 | $ | 599,614 | $ | 17,913,738 | $ | 53,893,804 | $ | 53,965,051 | ||||||||||
| Investments, at cost |
$ | 11,438,501 | $ | 564,304 | $ | 15,127,986 | $ | 55,191,702 | $ | 46,254,688 | ||||||||||
| Shares held in corresponding Funds |
564,958 | 30,131 | 971,461 | 5,527,570 | 2,978,204 | |||||||||||||||
| UNIT VALUE |
||||||||||||||||||||
| Personal Annuity Select/Single Premium Immediate Annuity |
$ | — | $ | — | $ | — | $ | — | $ | — | ||||||||||
| Lifetime Variable Select Annuity |
— | — | — | — | — | |||||||||||||||
| Intelligent Variable Annuity |
||||||||||||||||||||
| Band 1 |
75.89 | 25.51 | 59.70 | 29.91 | 55.93 | |||||||||||||||
| Band 2 |
77.97 | 25.98 | 60.47 | 30.53 | 56.96 | |||||||||||||||
| Band 3 |
79.39 | 26.30 | 60.98 | 30.95 | 57.65 | |||||||||||||||
| Band 4 |
81.57 | 26.78 | 61.76 | 31.59 | 58.72 | |||||||||||||||
| Band 5 |
— | 25.20 | 59.20 | 29.50 | 55.25 | |||||||||||||||
| Band 6 |
76.57 | — | 59.96 | 30.11 | 56.27 | |||||||||||||||
| Band 7 |
77.97 | 25.98 | 60.47 | 30.53 | 56.96 | |||||||||||||||
| Band 8 |
80.11 | 26.46 | 61.24 | 31.16 | 58.01 | |||||||||||||||
Statements of Operations
TIAA Separate Account VA-5 (formerly, TIAA-CREF Life Separate Account VA-1) ∎ For the period or year ended December 31, 2025
| Columbia
Variable Portfolio—Acorn International Sub-Account |
Credit Suisse Trust- Commodity Return Strategy Portfolio Sub-Account |
Dimensional VA Equity Allocation Portfolio Sub-Account |
Dimensional VA Global Bond Portfolio Sub-Account |
Dimensional VA Global Moderate Allocation Portfolio Sub-Account |
||||||||||||||||
| INVESTMENT INCOME |
||||||||||||||||||||
| Dividends |
$ | 146,054 | $ | 21,211 | $ | 341,621 | $ | 2,186,118 | $ | 1,318,477 | ||||||||||
| Expenses |
||||||||||||||||||||
| Administrative expenses |
11,626 | 552 | 16,233 | 54,275 | 49,596 | |||||||||||||||
| Mortality and expense risk charges |
986 | 1,116 | 20,390 | 80,013 | 73,801 | |||||||||||||||
| Guaranteed minimum death benefits |
4,178 | 128 | 2,424 | 12,849 | 22,034 | |||||||||||||||
| Total expenses |
16,790 | 1,796 | 39,047 | 147,137 | 145,431 | |||||||||||||||
| Net investment income (loss) |
129,264 | 19,415 | 302,574 | 2,038,981 | 1,173,046 | |||||||||||||||
| REALIZED AND UNREALIZED GAIN (LOSS) ON INVESTMENTS |
|
|||||||||||||||||||
| Realized gain (loss) on investments |
(475,258 | ) | (98,632 | ) | 1,020,373 | (749,806 | ) | 1,881,933 | ||||||||||||
| Capital gain distributions |
56,533 | — | 207,705 | — | 492,244 | |||||||||||||||
| Net realized gain (loss) |
(418,725 | ) | (98,632 | ) | 1,228,078 | (749,806 | ) | 2,374,177 | ||||||||||||
| Net change in unrealized appreciation (depreciation) on investments |
1,644,962 | 156,271 | 1,452,915 | 875,412 | 3,092,283 | |||||||||||||||
| Net realized and unrealized gain (loss) on investments |
1,226,237 | 57,639 | 2,680,993 | 125,606 | 5,466,460 | |||||||||||||||
| Net increase (decrease) in net assets from operations |
$ | 1,355,501 | $ | 77,054 | $ | 2,983,567 | $ | 2,164,587 | $ | 6,639,506 | ||||||||||
| B-12 | Statement of Additional Information ∎ TIAA Separate Account VA-5 (formerly, TIAA-CREF Life Separate Account VA-1) | See notes to financial statements |
Table of Contents
| continued |
| Dimensional VA International Small Portfolio Sub-Account |
Dimensional VA International Value Portfolio Sub-Account |
Dimensional VA Short-Term Fixed Portfolio Sub-Account |
Dimensional VA US Large Value Portfolio Sub-Account |
Dimensional VA |
||||||||||||||||
| ASSETS |
||||||||||||||||||||
| Investments, at value |
$ | 53,943,617 | $ | 121,191,799 | $ | 77,125,591 | $ | 75,084,954 | $ | 50,606,082 | ||||||||||
| Total assets |
$ | 53,943,617 | $ | 121,191,799 | $ | 77,125,591 | $ | 75,084,954 | $ | 50,606,082 | ||||||||||
| NET ASSETS |
||||||||||||||||||||
| Accumulation fund |
$ | 53,943,617 | $ | 121,191,799 | $ | 77,125,591 | $ | 75,084,954 | $ | 50,606,082 | ||||||||||
| Net assets |
$ | 53,943,617 | $ | 121,191,799 | $ | 77,125,591 | $ | 75,084,954 | $ | 50,606,082 | ||||||||||
| Investments, at cost |
$ | 45,166,252 | $ | 93,551,046 | $ | 77,873,908 | $ | 71,924,041 | $ | 50,564,071 | ||||||||||
| Shares held in corresponding Funds |
3,649,771 | 6,540,302 | 7,658,946 | 2,150,815 | 2,271,368 | |||||||||||||||
| UNIT VALUE |
||||||||||||||||||||
| Personal Annuity Select/Single Premium Immediate Annuity |
$ | — | $ | — | $ | — | $ | — | $ | — | ||||||||||
| Lifetime Variable Select Annuity |
— | — | — | — | — | |||||||||||||||
| Intelligent Variable Annuity |
||||||||||||||||||||
| Band 1 |
71.48 | 72.08 | 28.69 | 102.59 | 102.32 | |||||||||||||||
| Band 2 |
72.97 | 73.57 | 29.28 | 104.72 | 104.44 | |||||||||||||||
| Band 3 |
73.97 | 74.59 | 29.69 | 106.16 | 105.88 | |||||||||||||||
| Band 4 |
75.50 | 76.13 | 30.30 | 108.35 | 108.07 | |||||||||||||||
| Band 5 |
70.51 | 71.10 | 28.30 | 101.20 | 100.93 | |||||||||||||||
| Band 6 |
71.98 | 72.58 | 28.89 | 103.29 | 103.03 | |||||||||||||||
| Band 7 |
72.97 | 73.57 | 29.28 | 104.72 | 104.44 | |||||||||||||||
| Band 8 |
74.48 | 75.10 | 29.89 | 106.88 | 106.61 | |||||||||||||||
| Dimensional VA International Small Portfolio Sub-Account |
Dimensional VA International Value Portfolio Sub-Account |
Dimensional VA Short-Term Fixed Portfolio Sub-Account |
Dimensional VA US Large Value Portfolio Sub-Account |
Dimensional VA |
||||||||||||||||
| INVESTMENT INCOME |
||||||||||||||||||||
| Dividends |
$ | 1,657,404 | $ | 4,700,328 | $ | 3,201,436 | $ | 1,350,429 | $ | 873,465 | ||||||||||
| Expenses |
||||||||||||||||||||
| Administrative expenses |
50,131 | 108,498 | 77,335 | 72,139 | 47,185 | |||||||||||||||
| Mortality and expense risk charges |
81,142 | 172,637 | 119,434 | 111,395 | 67,343 | |||||||||||||||
| Guaranteed minimum death benefits |
17,481 | 38,106 | 27,614 | 22,929 | 14,831 | |||||||||||||||
| Total expenses |
148,754 | 319,241 | 224,383 | 206,463 | 129,359 | |||||||||||||||
| Net investment income (loss) |
1,508,650 | 4,381,087 | 2,977,053 | 1,143,966 | 744,106 | |||||||||||||||
| REALIZED AND UNREALIZED GAIN (LOSS) ON INVESTMENTS |
||||||||||||||||||||
| Realized gain (loss) on investments |
2,097,260 | 8,702,090 | 167,669 | 1,647,871 | 9,711 | |||||||||||||||
| Capital gain distributions |
2,005,298 | 3,421,466 | — | 4,218,002 | 3,951,680 | |||||||||||||||
| Net realized gain (loss) |
4,102,558 | 12,123,556 | 167,669 | 5,865,873 | 3,961,391 | |||||||||||||||
| Net change in unrealized appreciation (depreciation) on investments |
9,903,408 | 23,806,091 | (90,075 | ) | 3,484,940 | (651,333 | ) | |||||||||||||
| Net realized and unrealized gain (loss) on investments |
14,005,966 | 35,929,647 | 77,594 | 9,350,813 | 3,310,058 | |||||||||||||||
| Net increase (decrease) in net assets from operations |
$ | 15,514,616 | $ | 40,310,734 | $ | 3,054,647 | $ | 10,494,779 | $ | 4,054,164 | ||||||||||
| See notes to financial statements | TIAA Separate Account VA-5 (formerly, TIAA-CREF Life Separate Account VA-1) ∎ Statement of Additional Information | B-13 |
Table of Contents
| Statements of Assets and Liabilities
TIAA Separate Account VA-5 (formerly, TIAA-CREF Life Separate Account VA-1) ∎ December 31, 2025 |
| Franklin Income VIP Fund-Class 1 Sub-Account |
Franklin Mutual Shares VIP Fund-Class 1 Sub-Account |
Franklin Small-Mid Cap Growth VIP Fund-Class 1 Sub-Account |
Janus Henderson Forty Portfolio-Institutional Shares Sub-Account |
Janus Henderson Mid Cap Value Portfolio-Institutional Shares Sub-Account |
||||||||||||||||
| ASSETS |
||||||||||||||||||||
| Investments, at value |
$ | 8,513,175 | $ | 2,128,483 | $ | 14,025,464 | $ | 18,624,084 | $ | 9,237,819 | ||||||||||
| Total assets |
$ | 8,513,175 | $ | 2,128,483 | $ | 14,025,464 | $ | 18,624,084 | $ | 9,237,819 | ||||||||||
| NET ASSETS |
||||||||||||||||||||
| Accumulation fund |
$ | 8,513,175 | $ | 2,128,483 | $ | 14,025,464 | $ | 18,624,084 | $ | 9,237,819 | ||||||||||
| Net assets |
$ | 8,513,175 | $ | 2,128,483 | $ | 14,025,464 | $ | 18,624,084 | $ | 9,237,819 | ||||||||||
| Investments, at cost |
$ | 8,254,831 | $ | 2,089,709 | $ | 12,877,149 | $ | 15,650,979 | $ | 8,936,537 | ||||||||||
| Shares held in corresponding Funds |
531,409 | 128,222 | 752,036 | 313,431 | 519,855 | |||||||||||||||
| UNIT VALUE |
||||||||||||||||||||
| Personal Annuity Select/Single Premium Immediate Annuity |
$ | — | $ | — | $ | — | $ | — | $ | — | ||||||||||
| Lifetime Variable Select Annuity |
— | — | — | — | — | |||||||||||||||
| Intelligent Variable Annuity |
||||||||||||||||||||
| Band 1 |
46.84 | 52.54 | 92.21 | 274.78 | 56.85 | |||||||||||||||
| Band 2 |
48.12 | 53.98 | 94.75 | 282.32 | 58.41 | |||||||||||||||
| Band 3 |
49.00 | 54.97 | 96.47 | 287.47 | 59.48 | |||||||||||||||
| Band 4 |
50.35 | 56.48 | 99.12 | 295.37 | 61.11 | |||||||||||||||
| Band 5 |
— | — | 90.56 | 269.86 | — | |||||||||||||||
| Band 6 |
47.26 | 53.02 | 93.05 | 277.27 | 57.37 | |||||||||||||||
| Band 7 |
— | — | 94.75 | 282.32 | 58.41 | |||||||||||||||
| Band 8 |
49.44 | 55.47 | 97.35 | 290.08 | 60.02 | |||||||||||||||
Statements of Operations
TIAA Separate Account VA-5 (formerly, TIAA-CREF Life Separate Account VA-1) ∎ For the period or year ended December 31, 2025
| Franklin Income VIP Fund-Class 1 Sub-Account |
Franklin Mutual Shares VIP Fund-Class 1 Sub-Account |
Franklin Small-Mid Cap Growth VIP Fund-Class 1 Sub-Account |
Janus Henderson
Forty Portfolio-Institutional Shares Sub-Account |
Janus Henderson Mid Cap Value Portfolio-Institutional Shares Sub-Account |
||||||||||||||||
| INVESTMENT INCOME |
||||||||||||||||||||
| Dividends |
$ | 412,538 | $ | 45,873 | $ | — | $ | 12,211 | $ | 73,914 | ||||||||||
| Expenses |
||||||||||||||||||||
| Administrative expenses |
8,197 | 2,028 | 14,081 | 17,609 | 9,078 | |||||||||||||||
| Mortality and expense risk charges |
2,657 | 501 | 11,361 | 8,656 | 2,155 | |||||||||||||||
| Guaranteed minimum death benefits |
2,661 | 1,160 | 5,417 | 7,328 | 2,580 | |||||||||||||||
| Total expenses |
13,515 | 3,689 | 30,859 | 33,593 | 13,813 | |||||||||||||||
| Net investment income (loss) |
399,023 | 42,184 | (30,859 | ) | (21,382 | ) | 60,101 | |||||||||||||
| REALIZED AND UNREALIZED GAIN (LOSS) ON INVESTMENTS |
||||||||||||||||||||
| Realized gain (loss) on investments |
35,083 | (10,062 | ) | 436,749 | 974,371 | 155,536 | ||||||||||||||
| Capital gain distributions |
82,559 | 199,092 | 624,270 | 2,015,077 | 854,646 | |||||||||||||||
| Net realized gain (loss) |
117,642 | 189,030 | 1,061,019 | 2,989,448 | 1,010,182 | |||||||||||||||
| Net change in unrealized appreciation (depreciation) on investments |
461,441 | (5,921 | ) | (659,319 | ) | (200,546 | ) | (518,599 | ) | |||||||||||
| Net realized and unrealized gain (loss) on investments |
579,083 | 183,109 | 401,700 | 2,788,902 | 491,583 | |||||||||||||||
| Net increase (decrease) in net assets from operations |
$ | 978,106 | $ | 225,293 | $ | 370,841 | $ | 2,767,520 | $ | 551,684 | ||||||||||
| B-14 | Statement of Additional Information ∎ TIAA Separate Account VA-5 (formerly, TIAA-CREF Life Separate Account VA-1) | See notes to financial statements |
Table of Contents
| continued |
| Janus Henderson Overseas Portfolio-Institutional Shares Sub-Account |
John Hancock Disciplined Value Emerging Markets Equity Trust Sub-Account |
LVIP Fidelity Institutional AM® Total Bond—Standard Class Sub-Account |
Matson Money Fixed Income VI Portfolio Sub-Account |
Matson Money International Equity VI Portfolio Sub-Account |
||||||||||||||||
| ASSETS |
||||||||||||||||||||
| Investments, at value |
$ | 2,126,187 | $ | 50,810,618 | $ | 60,552,613 | $ | 23,753,246 | $ | 20,520,754 | ||||||||||
| Total assets |
$ | 2,126,187 | $ | 50,810,618 | $ | 60,552,613 | $ | 23,753,246 | $ | 20,520,754 | ||||||||||
| NET ASSETS |
||||||||||||||||||||
| Accumulation fund |
$ | 2,126,187 | $ | 50,810,618 | $ | 60,552,613 | $ | 23,753,246 | $ | 20,520,754 | ||||||||||
| Net assets |
$ | 2,126,187 | $ | 50,810,618 | $ | 60,552,613 | $ | 23,753,246 | $ | 20,520,754 | ||||||||||
| Investments, at cost |
$ | 1,322,913 | $ | 41,267,337 | $ | 62,690,358 | $ | 23,776,603 | $ | 17,257,346 | ||||||||||
| Shares held in corresponding Funds |
38,090 | 4,147,806 | 6,803,664 | 988,483 | 622,218 | |||||||||||||||
| UNIT VALUE |
||||||||||||||||||||
| Personal Annuity Select/Single Premium Immediate Annuity |
$ | — | $ | — | $ | — | $ | — | $ | — | ||||||||||
| Lifetime Variable Select Annuity |
— | — | — | — | — | |||||||||||||||
| Intelligent Variable Annuity |
||||||||||||||||||||
| Band 1 |
— | 44.22 | 18.44 | 27.24 | 49.16 | |||||||||||||||
| Band 2 |
— | 44.96 | 18.94 | 27.73 | 50.04 | |||||||||||||||
| Band 3 |
— | 45.46 | 19.29 | 28.06 | 50.64 | |||||||||||||||
| Band 4 |
119.04 | 46.22 | 19.82 | 28.57 | 51.54 | |||||||||||||||
| Band 5 |
— | 43.73 | 18.11 | 26.92 | 48.58 | |||||||||||||||
| Band 6 |
— | 44.46 | 18.60 | 27.41 | 49.45 | |||||||||||||||
| Band 7 |
— | 44.96 | 18.94 | 27.73 | 50.04 | |||||||||||||||
| Band 8 |
116.91 | 45.71 | 19.46 | 28.23 | 50.94 | |||||||||||||||
| Janus Henderson
Overseas Portfolio-Institutional Shares Sub-Account |
John Hancock Disciplined Value Emerging Markets Equity Trust Sub-Account |
LVIP Fidelity Institutional AM® Total Bond—Standard Class Sub-Account |
Matson Money Fixed Income VI Portfolio Sub-Account |
Matson Money International Equity VI Portfolio Sub-Account |
||||||||||||||||
| INVESTMENT INCOME |
||||||||||||||||||||
| Dividends |
$ | 27,664 | $ | 594,692 | $ | 2,547,452 | $ | 792,465 | $ | 683,978 | ||||||||||
| Expenses |
||||||||||||||||||||
| Administrative expenses |
1,927 | 46,993 | 61,299 | 23,622 | 19,380 | |||||||||||||||
| Mortality and expense risk charges |
— | 82,957 | 42,176 | 34,887 | 28,347 | |||||||||||||||
| Guaranteed minimum death benefits |
280 | 20,016 | 23,821 | 7,132 | 5,172 | |||||||||||||||
| Total expenses |
2,207 | 149,966 | 127,296 | 65,641 | 52,899 | |||||||||||||||
| Net investment income (loss) |
25,457 | 444,726 | 2,420,156 | 726,824 | 631,079 | |||||||||||||||
| REALIZED AND UNREALIZED GAIN (LOSS) ON INVESTMENTS |
||||||||||||||||||||
| Realized gain (loss) on investments |
46,164 | 3,619,958 | (1,465,422 | ) | 232,025 | 1,755,023 | ||||||||||||||
| Capital gain distributions |
— | — | — | — | 1,024,487 | |||||||||||||||
| Net realized gain (loss) |
46,164 | 3,619,958 | (1,465,422 | ) | 232,025 | 2,779,510 | ||||||||||||||
| Net change in unrealized appreciation (depreciation) on investments |
415,262 | 8,821,037 | 2,931,536 | 75,608 | 3,170,630 | |||||||||||||||
| Net realized and unrealized gain (loss) on investments |
461,426 | 12,440,995 | 1,466,114 | 307,633 | 5,950,140 | |||||||||||||||
| Net increase (decrease) in net assets from operations |
$ | 486,883 | $ | 12,885,721 | $ | 3,886,270 | $ | 1,034,457 | $ | 6,581,219 | ||||||||||
| See notes to financial statements | TIAA Separate Account VA-5 (formerly, TIAA-CREF Life Separate Account VA-1) ∎ Statement of Additional Information | B-15 |
Table of Contents
| Statements of Assets and Liabilities
TIAA Separate Account VA-5 (formerly, TIAA-CREF Life Separate Account VA-1) ∎ December 31, 2025 |
| Matson Money U.S. Equity VI Portfolio Sub-Account |
MFS
Global Equity Series-Initial Class Sub-Account |
MFS Growth Series-Initial Class Sub-Account |
MFS Massachusetts Investors Growth Stock Portfolio Sub-Account |
MFS Utilities Series-Initial Class Sub-Account |
||||||||||||||||
| ASSETS |
||||||||||||||||||||
| Investments, at value |
$ | 26,084,057 | $ | 4,221,226 | $ | 1,398,015 | $ | 6,941,593 | $ | 3,585,170 | ||||||||||
| Total assets |
$ | 26,084,057 | $ | 4,221,226 | $ | 1,398,015 | $ | 6,941,593 | $ | 3,585,170 | ||||||||||
| NET ASSETS |
||||||||||||||||||||
| Accumulation fund |
$ | 26,084,057 | $ | 4,221,226 | $ | 1,398,015 | $ | 6,941,593 | $ | 3,585,170 | ||||||||||
| Net assets |
$ | 26,084,057 | $ | 4,221,226 | $ | 1,398,015 | $ | 6,941,593 | $ | 3,585,170 | ||||||||||
| Investments, at cost |
$ | 25,626,449 | $ | 4,530,954 | $ | 1,252,233 | $ | 6,776,229 | $ | 3,308,053 | ||||||||||
| Shares held in corresponding Funds |
790,426 | 215,149 | 20,604 | 307,831 | 95,022 | |||||||||||||||
| UNIT VALUE |
||||||||||||||||||||
| Personal Annuity Select/Single Premium Immediate Annuity |
$ | — | $ | — | $ | — | $ | — | $ | — | ||||||||||
| Lifetime Variable Select Annuity |
— | — | — | — | — | |||||||||||||||
| Intelligent Variable Annuity |
||||||||||||||||||||
| Band 1 |
64.96 | 50.34 | — | 69.33 | 103.74 | |||||||||||||||
| Band 2 |
66.13 | 51.72 | — | 71.23 | 106.59 | |||||||||||||||
| Band 3 |
66.92 | 52.67 | — | 72.53 | 108.53 | |||||||||||||||
| Band 4 |
68.12 | 54.11 | 195.14 | 74.52 | 111.51 | |||||||||||||||
| Band 5 |
64.20 | 49.44 | — | 68.09 | 101.88 | |||||||||||||||
| Band 6 |
65.35 | 50.80 | — | 69.96 | 104.68 | |||||||||||||||
| Band 7 |
66.13 | 51.72 | — | 71.23 | 106.59 | |||||||||||||||
| Band 8 |
67.32 | 53.15 | 191.64 | 73.19 | 109.51 | |||||||||||||||
Statements of Operations
TIAA Separate Account VA-5 (formerly, TIAA-CREF Life Separate Account VA-1) ∎ For the period or year ended December 31, 2025
| Matson Money U.S. Equity VI Portfolio Sub-Account |
MFS
Global Equity Series-Initial Class Sub-Account |
MFS
Growth Series-Initial Class Sub-Account |
MFS Massachusetts Investors Growth Stock Portfolio Sub-Account |
MFS Utilities Series-Initial Class Sub-Account |
||||||||||||||||
| INVESTMENT INCOME |
||||||||||||||||||||
| Dividends |
$ | 300,679 | $ | 39,143 | $ | — | $ | 19,886 | $ | 98,628 | ||||||||||
| Expenses |
||||||||||||||||||||
| Administrative expenses |
24,937 | 4,193 | 1,310 | 7,749 | 3,509 | |||||||||||||||
| Mortality and expense risk charges |
35,212 | 3,377 | 1 | 3,908 | 1,667 | |||||||||||||||
| Guaranteed minimum death benefits |
6,591 | 782 | 394 | 3,195 | 1,708 | |||||||||||||||
| Total expenses |
66,740 | 8,352 | 1,705 | 14,852 | 6,884 | |||||||||||||||
| Net investment income (loss) |
233,939 | 30,791 | (1,705 | ) | 5,034 | 91,744 | ||||||||||||||
| REALIZED AND UNREALIZED GAIN (LOSS) ON INVESTMENTS |
|
|||||||||||||||||||
| Realized gain (loss) on investments |
425,298 | 60,946 | 3,340 | 551,509 | 39,158 | |||||||||||||||
| Capital gain distributions |
1,553,471 | 712,282 | 237,903 | 1,048,231 | 45,106 | |||||||||||||||
| Net realized gain (loss) |
1,978,769 | 773,228 | 241,243 | 1,599,740 | 84,264 | |||||||||||||||
| Net change in unrealized appreciation (depreciation) on investments |
649,419 | (261,725 | ) | (88,588 | ) | (646,119 | ) | 302,923 | ||||||||||||
| Net realized and unrealized gain (loss) on investments |
2,628,188 | 511,503 | 152,655 | 953,621 | 387,187 | |||||||||||||||
| Net increase (decrease) in net assets from operations |
$ | 2,862,127 | $ | 542,294 | $ | 150,950 | $ | 958,655 | $ | 478,931 | ||||||||||
| B-16 | Statement of Additional Information ∎ TIAA Separate Account VA-5 (formerly, TIAA-CREF Life Separate Account VA-1) | See notes to financial statements |
Table of Contents
| continued |
|
Neuberger Berman I Class Sub-Account |
Neuberger Berman I Class Sub-Account |
Nomura VIP International Core Equity Series—Standard Class Sub-Account |
Nomura
VIP Small Cap Value Series-Standard Class Sub-Account |
PIMCO VIT All Asset Portfolio-Institutional Class Sub-Account |
||||||||||||||||
| ASSETS |
||||||||||||||||||||
| Investments, at value |
$ | 48,832,343 | $ | 2,745,553 | $ | 47,021,465 | $ | 33,413,146 | $ | 4,116,473 | ||||||||||
| Total assets |
$ | 48,832,343 | $ | 2,745,553 | $ | 47,021,465 | $ | 33,413,146 | $ | 4,116,473 | ||||||||||
| NET ASSETS |
||||||||||||||||||||
| Accumulation fund |
$ | 48,832,343 | $ | 2,745,553 | $ | 47,021,465 | $ | 33,413,146 | $ | 4,116,473 | ||||||||||
| Net assets |
$ | 48,832,343 | $ | 2,745,553 | $ | 47,021,465 | $ | 33,413,146 | $ | 4,116,473 | ||||||||||
| Investments, at cost |
$ | 46,961,097 | $ | 2,174,769 | $ | 41,925,591 | $ | 31,253,911 | $ | 3,965,540 | ||||||||||
| Shares held in corresponding Funds |
2,975,767 | 64,208 | 2,430,050 | 833,661 | 421,770 | |||||||||||||||
| UNIT VALUE |
||||||||||||||||||||
| Personal Annuity Select/Single Premium Immediate Annuity |
$ | — | $ | — | $ | — | $ | — | $ | — | ||||||||||
| Lifetime Variable Select Annuity |
— | — | — | — | — | |||||||||||||||
| Intelligent Variable Annuity |
||||||||||||||||||||
| Band 1 |
48.41 | 82.14 | 22.04 | 114.44 | 27.41 | |||||||||||||||
| Band 2 |
49.74 | 84.40 | 22.65 | 117.58 | 28.17 | |||||||||||||||
| Band 3 |
50.65 | — | 23.06 | 119.72 | 28.68 | |||||||||||||||
| Band 4 |
52.04 | 88.30 | 23.69 | 123.01 | 29.47 | |||||||||||||||
| Band 5 |
47.55 | — | 21.65 | 112.39 | — | |||||||||||||||
| Band 6 |
48.85 | — | 22.24 | 115.47 | 27.66 | |||||||||||||||
| Band 7 |
49.74 | 84.40 | 22.65 | 117.58 | — | |||||||||||||||
| Band 8 |
51.11 | 86.72 | 23.27 | 120.81 | 28.94 | |||||||||||||||
|
Neuberger Berman I Class Sub-Account |
Neuberger Berman I Class Sub-Account |
Nomura
VIP International Core Equity Series—Standard Class Sub-Account |
Nomura VIP Small Cap Value Series-Standard Class Sub-Account |
PIMCO VIT All Asset Portfolio-Institutional Class Sub-Account |
||||||||||||||||
| INVESTMENT INCOME |
||||||||||||||||||||
| Dividends |
$ | 212,658 | $ | — | $ | 609,170 | $ | 404,142 | $ | 198,180 | ||||||||||
| Expenses |
||||||||||||||||||||
| Administrative expenses |
45,470 | 2,627 | 46,015 | 31,702 | 4,225 | |||||||||||||||
| Mortality and expense risk charges |
51,686 | 361 | 41,345 | 25,342 | 1,371 | |||||||||||||||
| Guaranteed minimum death benefits |
19,668 | 590 | 19,124 | 12,071 | 1,307 | |||||||||||||||
| Total expenses |
116,824 | 3,578 | 106,484 | 69,115 | 6,903 | |||||||||||||||
| Net investment income (loss) |
95,834 | (3,578 | ) | 502,686 | 335,027 | 191,277 | ||||||||||||||
| REALIZED AND UNREALIZED GAIN (LOSS) ON INVESTMENTS |
|
|||||||||||||||||||
| Realized gain (loss) on investments |
(113,271 | ) | 222,161 | 1,104,895 | 286,131 | (278,316 | ) | |||||||||||||
| Capital gain distributions |
4,990,151 | 154,687 | 2,241,075 | 1,968,255 | — | |||||||||||||||
| Net realized gain (loss) |
4,876,880 | 376,848 | 3,345,970 | 2,254,386 | (278,316 | ) | ||||||||||||||
| Net change in unrealized appreciation (depreciation) on investments |
129,794 | (39,899 | ) | 5,981,317 | (84,759 | ) | 648,766 | |||||||||||||
| Net realized and unrealized gain (loss) on investments |
5,006,674 | 336,949 | 9,327,287 | 2,169,627 | 370,450 | |||||||||||||||
| Net increase (decrease) in net assets from operations |
$ | 5,102,508 | $ | 333,371 | $ | 9,829,973 | $ | 2,504,654 | $ | 561,727 | ||||||||||
| See notes to financial statements | TIAA Separate Account VA-5 (formerly, TIAA-CREF Life Separate Account VA-1) ∎ Statement of Additional Information | B-17 |
Table of Contents
| Statements of Assets and Liabilities
TIAA Separate Account VA-5 (formerly, TIAA-CREF Life Separate Account VA-1) ∎ December 31, 2025 |
| PIMCO VIT Commodity Real |
PIMCO VIT Emerging Markets Bond Portfolio- Institutional Class Sub-Account |
PIMCO VIT Global Bond Opportunities Portfolio (Unhedged)- Institutional Class Sub-Account |
PIMCO VIT Real Return Portfolio- Institutional Class Sub-Account |
PSF Natural Sub-Account ‡ |
||||||||||||||||
| ASSETS |
||||||||||||||||||||
| Investments, at value |
$ | 2,271,257 | $ | 46,774,852 | $ | 6,790,255 | $ | 103,294,170 | $ | — | ||||||||||
| Total assets |
$ | 2,271,257 | $ | 46,774,852 | $ | 6,790,255 | $ | 103,294,170 | $ | — | ||||||||||
| NET ASSETS |
||||||||||||||||||||
| Accumulation fund |
$ | 2,271,257 | $ | 46,774,852 | $ | 6,790,255 | $ | 103,294,170 | $ | — | ||||||||||
| Net assets |
$ | 2,271,257 | $ | 46,774,852 | $ | 6,790,255 | $ | 103,294,170 | $ | — | ||||||||||
| Investments, at cost |
$ | 2,151,127 | $ | 43,323,194 | $ | 6,731,989 | $ | 103,303,035 | $ | — | ||||||||||
| Shares held in corresponding Funds |
362,821 | 4,095,871 | 681,753 | 8,600,680 | — | |||||||||||||||
| UNIT VALUE |
||||||||||||||||||||
| Personal Annuity Select/Single Premium Immediate Annuity |
$ | — | $ | — | $ | — | $ | — | $ | — | ||||||||||
| Lifetime Variable Select Annuity |
— | — | — | — | — | |||||||||||||||
| Intelligent Variable Annuity |
||||||||||||||||||||
| Band 1 |
27.43 | 38.38 | 20.54 | 21.42 | — | |||||||||||||||
| Band 2 |
27.94 | 39.09 | 21.11 | 22.01 | — | |||||||||||||||
| Band 3 |
28.28 | 39.57 | 21.49 | 22.41 | — | |||||||||||||||
| Band 4 |
28.80 | 40.30 | 22.08 | 23.03 | — | |||||||||||||||
| Band 5 |
27.10 | 37.92 | 20.18 | 21.04 | — | |||||||||||||||
| Band 6 |
27.60 | 38.62 | 20.73 | 21.62 | — | |||||||||||||||
| Band 7 |
27.94 | 39.09 | 21.11 | 22.01 | — | |||||||||||||||
| Band 8 |
28.45 | 39.81 | 21.69 | 22.62 | — | |||||||||||||||
Statements of Operations
TIAA Separate Account VA-5 (formerly, TIAA-CREF Life Separate Account VA-1) ∎ For the period or year ended December 31, 2025
| PIMCO VIT Commodity Real Return Strategy Portfolio-Institutional Class Sub-Account |
PIMCO VIT Emerging Markets Bond Portfolio- Institutional Class Sub-Account |
PIMCO VIT Global Bond Opportunities Portfolio (Unhedged)- Institutional Class Sub-Account |
PIMCO VIT Real Return Portfolio- Institutional Class Sub-Account |
PSF Natural Sub-Account ‡ |
||||||||||||||||
| INVESTMENT INCOME |
||||||||||||||||||||
| Dividends |
$ | 70,787 | $ | 3,123,500 | $ | 298,027 | $ | 3,559,988 | $ | — | ||||||||||
| Expenses |
||||||||||||||||||||
| Administrative expenses |
2,475 | 44,295 | 6,379 | 102,582 | 797 | |||||||||||||||
| Mortality and expense risk charges |
3,244 | 66,715 | 4,315 | 127,905 | 621 | |||||||||||||||
| Guaranteed minimum death benefits |
1,015 | 18,732 | 1,170 | 40,997 | 191 | |||||||||||||||
| Total expenses |
6,734 | 129,742 | 11,864 | 271,484 | 1,609 | |||||||||||||||
| Net investment income (loss) |
64,053 | 2,993,758 | 286,163 | 3,288,504 | (1,609 | ) | ||||||||||||||
| REALIZED AND UNREALIZED GAIN (LOSS) ON INVESTMENTS |
|
|||||||||||||||||||
| Realized gain (loss) on investments |
(83,236 | ) | (1,070,919 | ) | (112,231 | ) | (2,681,199 | ) | 170,000 | |||||||||||
| Capital gain distributions |
— | — | — | — | — | |||||||||||||||
| Net realized gain (loss) |
(83,236 | ) | (1,070,919 | ) | (112,231 | ) | (2,681,199 | ) | 170,000 | |||||||||||
| Net change in unrealized appreciation (depreciation) on investments |
423,219 | 4,225,671 | 581,473 | 7,000,080 | (343,758 | ) | ||||||||||||||
| Net realized and unrealized gain (loss) on investments |
339,983 | 3,154,752 | 469,242 | 4,318,881 | (173,758 | ) | ||||||||||||||
| Net increase (decrease) in net assets from operations |
$ | 404,036 | $ | 6,148,510 | $ | 755,405 | $ | 7,607,385 | $ | (175,367 | ) | |||||||||
| ‡ | PSF Natural Resources Portfolio merged into the PSF PGIM Jennison Blend Portfolio Fund Sub-Account on April 11, 2025. |
| B-18 | Statement of Additional Information ∎ TIAA Separate Account VA-5 (formerly, TIAA-CREF Life Separate Account VA-1) | See notes to financial statements |
Table of Contents
| continued |
| PSF PGIM Sub-Account |
PSF PGIM Sub-Account |
PVC Equity Income Account- Class 1 Sub-Account |
PVC MidCap Sub-Account |
Royce Capital Fund Sub-Account |
||||||||||||||||
| ASSETS |
||||||||||||||||||||
| Investments, at value |
$ | 31,813,830 | $ | 10,623,131 | $ | 111,650,775 | $ | 8,124,856 | $ | 738,882 | ||||||||||
| Total assets |
$ | 31,813,830 | $ | 10,623,131 | $ | 111,650,775 | $ | 8,124,856 | $ | 738,882 | ||||||||||
| NET ASSETS |
||||||||||||||||||||
| Accumulation fund |
$ | 31,813,830 | $ | 10,623,131 | $ | 111,650,775 | $ | 8,124,856 | $ | 738,882 | ||||||||||
| Net assets |
$ | 31,813,830 | $ | 10,623,131 | $ | 111,650,775 | $ | 8,124,856 | $ | 738,882 | ||||||||||
| Investments, at cost |
$ | 23,157,781 | $ | 5,581,522 | $ | 101,560,644 | $ | 8,038,316 | $ | 715,826 | ||||||||||
| Shares held in corresponding Funds |
227,485 | 155,468 | 3,515,453 | 130,940 | 77,695 | |||||||||||||||
| UNIT VALUE |
||||||||||||||||||||
| Personal Annuity Select/Single Premium Immediate Annuity |
$ | — | $ | — | $ | — | $ | — | $ | — | ||||||||||
| Lifetime Variable Select Annuity |
— | — | — | — | — | |||||||||||||||
| Intelligent Variable Annuity |
||||||||||||||||||||
| Band 1 |
87.51 | 91.62 | 79.46 | — | 40.46 | |||||||||||||||
| Band 2 |
89.91 | 94.14 | 81.65 | — | 41.57 | |||||||||||||||
| Band 3 |
91.55 | 95.85 | 83.13 | — | — | |||||||||||||||
| Band 4 |
94.07 | 98.49 | 85.42 | 109.39 | 43.49 | |||||||||||||||
| Band 5 |
85.94 | — | 78.04 | — | — | |||||||||||||||
| Band 6 |
88.30 | — | 80.18 | — | — | |||||||||||||||
| Band 7 |
89.91 | 94.14 | 81.65 | — | 41.57 | |||||||||||||||
| Band 8 |
92.38 | 96.72 | 83.89 | 107.44 | 42.71 | |||||||||||||||
| PSF PGIM Sub-Account |
PSF PGIM Sub-Account |
PVC
Equity Income Account- Class 1 Sub-Account |
PVC MidCap Sub-Account |
Royce Capital Fund Sub-Account |
||||||||||||||||
| INVESTMENT INCOME |
||||||||||||||||||||
| Dividends |
$ | — | $ | — | $ | 1,898,212 | $ | 25,293 | $ | — | ||||||||||
| Expenses |
||||||||||||||||||||
| Administrative expenses |
29,771 | 10,054 | 105,475 | 8,752 | 646 | |||||||||||||||
| Mortality and expense risk charges |
2,945 | 3,007 | 95,367 | 147 | 84 | |||||||||||||||
| Guaranteed minimum death benefits |
9,502 | 3,459 | 42,122 | 2,638 | 221 | |||||||||||||||
| Total expenses |
42,218 | 16,520 | 242,964 | 11,537 | 951 | |||||||||||||||
| Net investment income (loss) |
(42,218 | ) | (16,520 | ) | 1,655,248 | 13,756 | (951 | ) | ||||||||||||
| REALIZED AND UNREALIZED GAIN (LOSS) ON INVESTMENTS |
|
|||||||||||||||||||
| Realized gain (loss) on investments |
1,459,021 | 641,593 | 2,963,191 | 381,938 | 4,958 | |||||||||||||||
| Capital gain distributions |
— | — | 10,025,938 | 1,014,252 | 110,166 | |||||||||||||||
| Net realized gain (loss) |
1,459,021 | 641,593 | 12,989,129 | 1,396,190 | 115,124 | |||||||||||||||
| Net change in unrealized appreciation (depreciation) on investments |
3,855,490 | 875,252 | 449,107 | (1,223,214 | ) | (24,258 | ) | |||||||||||||
| Net realized and unrealized gain (loss) on investments |
5,314,511 | 1,516,845 | 13,438,236 | 172,976 | 90,866 | |||||||||||||||
| Net increase (decrease) in net assets from operations |
$ | 5,272,293 | $ | 1,500,325 | $ | 15,093,484 | $ | 186,732 | $ | 89,915 | ||||||||||
| See notes to financial statements | TIAA Separate Account VA-5 (formerly, TIAA-CREF Life Separate Account VA-1) ∎ Statement of Additional Information | B-19 |
Table of Contents
| Statements of Assets and Liabilities
TIAA Separate Account VA-5 (formerly, TIAA-CREF Life Separate Account VA-1) ∎ December 31, 2025 |
| Royce Capital Fund Small-Cap Portfolio- Investment Class Sub-Account |
T. Rowe
Price® Health Sciences Portfolio I Sub-Account |
T. Rowe
Price® Limited-Term Bond Portfolio Sub-Account |
Templeton Developing Markets VIP Fund-Class 1 Sub-Account |
Vanguard VIF Balanced Portfolio Sub-Account |
||||||||||||||||
| ASSETS |
||||||||||||||||||||
| Investments, at value |
$ | 9,134,472 | $ | 6,375,287 | $ | 57,601,116 | $ | 42,125,077 | $ | 6,478,656 | ||||||||||
| Total assets |
$ | 9,134,472 | $ | 6,375,287 | $ | 57,601,116 | $ | 42,125,077 | $ | 6,478,656 | ||||||||||
| NET ASSETS |
||||||||||||||||||||
| Accumulation fund |
$ | 9,134,472 | $ | 6,375,287 | $ | 57,601,116 | $ | 42,125,077 | $ | 6,478,656 | ||||||||||
| Net assets |
$ | 9,134,472 | $ | 6,375,287 | $ | 57,601,116 | $ | 42,125,077 | $ | 6,478,656 | ||||||||||
| Investments, at cost |
$ | 8,908,572 | $ | 6,109,469 | $ | 56,708,888 | $ | 30,607,084 | $ | 6,022,366 | ||||||||||
| Shares held in corresponding Funds |
969,689 | 109,035 | 12,126,551 | 3,452,875 | 254,965 | |||||||||||||||
| UNIT VALUE |
||||||||||||||||||||
| Personal Annuity Select/Single Premium Immediate Annuity |
$ | — | $ | — | $ | — | $ | — | $ | — | ||||||||||
| Lifetime Variable Select Annuity |
— | — | — | — | — | |||||||||||||||
| Intelligent Variable Annuity |
||||||||||||||||||||
| Band 1 |
32.28 | 63.53 | 30.18 | 27.71 | 45.72 | |||||||||||||||
| Band 2 |
33.16 | 64.59 | 30.81 | 28.47 | 46.11 | |||||||||||||||
| Band 3 |
33.77 | 65.31 | 31.24 | 28.99 | 46.37 | |||||||||||||||
| Band 4 |
34.70 | 66.40 | 31.89 | 29.79 | 46.77 | |||||||||||||||
| Band 5 |
31.70 | 62.83 | 29.76 | 27.22 | 45.46 | |||||||||||||||
| Band 6 |
32.57 | 63.88 | 30.39 | 27.96 | 45.85 | |||||||||||||||
| Band 7 |
33.16 | 64.59 | 30.81 | 28.47 | 46.11 | |||||||||||||||
| Band 8 |
34.08 | 65.67 | 31.54 | 29.26 | 46.51 | |||||||||||||||
Statements of Operations
TIAA Separate Account VA-5 (formerly, TIAA-CREF Life Separate Account VA-1) ∎ For the period or year ended December 31, 2025
| Royce Capital Fund Small-Cap Portfolio- Investment Class Sub-Account |
T. Rowe Price® Health Sciences Portfolio I Sub-Account |
T. Rowe Price® Limited-Term Bond Portfolio Sub-Account |
Templeton Developing Markets VIP Fund-Class 1 Sub-Account |
Vanguard VIF Balanced Portfolio Sub-Account |
||||||||||||||||
| INVESTMENT INCOME |
||||||||||||||||||||
| Dividends |
$ | 161,706 | $ | — | $ | 2,415,482 | $ | 271,393 | $ | 106,607 | ||||||||||
| Expenses |
||||||||||||||||||||
| Administrative expenses |
8,704 | 5,934 | 56,300 | 35,773 | 5,485 | |||||||||||||||
| Mortality and expense risk charges |
2,196 | 7,051 | 66,124 | 38,726 | 9,728 | |||||||||||||||
| Guaranteed minimum death benefits |
2,589 | 3,287 | 27,521 | 12,336 | 1,632 | |||||||||||||||
| Total expenses |
13,489 | 16,272 | 149,945 | 86,835 | 16,845 | |||||||||||||||
| Net investment income (loss) |
148,217 | (16,272 | ) | 2,265,537 | 184,558 | 89,762 | ||||||||||||||
| REALIZED AND UNREALIZED GAIN (LOSS) ON INVESTMENTS |
|
|||||||||||||||||||
| Realized gain (loss) on investments |
194,012 | (274,617 | ) | (308,074 | ) | 2,322,327 | 240,098 | |||||||||||||
| Capital gain distributions |
621,403 | 214,476 | — | 594,413 | 456,631 | |||||||||||||||
| Net realized gain (loss) |
815,415 | (60,141 | ) | (308,074 | ) | 2,916,740 | 696,729 | |||||||||||||
| Net change in unrealized appreciation (depreciation) on investments |
(200,166 | ) | 1,061,418 | 1,016,338 | 10,567,877 | 28,604 | ||||||||||||||
| Net realized and unrealized gain (loss) on investments |
615,249 | 1,001,277 | 708,264 | 13,484,617 | 725,333 | |||||||||||||||
| Net increase (decrease) in net assets from operations |
$ | 763,466 | $ | 985,005 | $ | 2,973,801 | $ | 13,669,175 | $ | 815,095 | ||||||||||
| B-20 | Statement of Additional Information ∎ TIAA Separate Account VA-5 (formerly, TIAA-CREF Life Separate Account VA-1) | See notes to financial statements |
Table of Contents
| continued |
| Vanguard VIF Capital Growth Portfolio Sub-Account |
Vanguard VIF Conservative Allocation Portfolio Sub-Account |
Vanguard VIF Equity Index Portfolio Sub-Account |
Vanguard VIF Global Bond Index Portfolio Sub-Account |
Vanguard VIF High Yield Bond Portfolio Sub-Account |
||||||||||||||||
| ASSETS |
||||||||||||||||||||
| Investments, at value |
$ | 32,247,619 | $ | 6,280,224 | $ | 297,418,381 | $ | 5,308,643 | $ | 64,898,357 | ||||||||||
| Total assets |
$ | 32,247,619 | $ | 6,280,224 | $ | 297,418,381 | $ | 5,308,643 | $ | 64,898,357 | ||||||||||
| NET ASSETS |
||||||||||||||||||||
| Accumulation fund |
$ | 32,247,619 | $ | 6,280,224 | $ | 297,418,381 | $ | 5,308,643 | $ | 64,898,357 | ||||||||||
| Net assets |
$ | 32,247,619 | $ | 6,280,224 | $ | 297,418,381 | $ | 5,308,643 | $ | 64,898,357 | ||||||||||
| Investments, at cost |
$ | 25,960,921 | $ | 6,050,053 | $ | 230,049,698 | $ | 5,180,035 | $ | 61,894,742 | ||||||||||
| Shares held in corresponding Funds |
521,637 | 237,348 | 3,628,824 | 281,925 | 8,595,809 | |||||||||||||||
| UNIT VALUE |
||||||||||||||||||||
| Personal Annuity Select/Single Premium Immediate Annuity |
$ | — | $ | — | $ | — | $ | — | $ | — | ||||||||||
| Lifetime Variable Select Annuity |
— | — | — | — | — | |||||||||||||||
| Intelligent Variable Annuity |
||||||||||||||||||||
| Band 1 |
98.74 | 34.71 | 96.80 | 24.40 | 40.98 | |||||||||||||||
| Band 2 |
100.39 | 35.01 | 98.42 | 24.61 | 41.67 | |||||||||||||||
| Band 3 |
101.50 | 35.21 | 99.51 | 24.75 | 42.13 | |||||||||||||||
| Band 4 |
103.20 | 35.51 | 101.17 | 24.96 | 42.84 | |||||||||||||||
| Band 5 |
97.65 | — | 95.74 | 24.27 | 40.53 | |||||||||||||||
| Band 6 |
99.28 | 34.81 | 97.34 | 24.47 | 41.21 | |||||||||||||||
| Band 7 |
100.39 | 35.01 | 98.42 | 24.61 | 41.67 | |||||||||||||||
| Band 8 |
102.06 | 35.31 | 100.06 | 24.82 | 42.36 | |||||||||||||||
| Vanguard VIF Capital Growth Portfolio Sub-Account |
Vanguard VIF Conservative Allocation Portfolio Sub-Account |
Vanguard VIF Equity Index Portfolio Sub-Account |
Vanguard VIF Global Bond Index Portfolio Sub-Account |
Vanguard VIF High Yield Bond Portfolio Sub-Account |
||||||||||||||||
| INVESTMENT INCOME |
||||||||||||||||||||
| Dividends |
$ | 317,528 | $ | 93,245 | $ | 2,695,790 | $ | 119,196 | $ | 3,940,244 | ||||||||||
| Expenses |
||||||||||||||||||||
| Administrative expenses |
26,156 | 4,295 | 257,877 | 4,365 | 61,623 | |||||||||||||||
| Mortality and expense risk charges |
21,164 | 8,300 | 214,577 | 5,018 | 106,585 | |||||||||||||||
| Guaranteed minimum death benefits |
3,621 | 1,230 | 46,996 | 393 | 23,342 | |||||||||||||||
| Total expenses |
50,941 | 13,825 | 519,450 | 9,776 | 191,550 | |||||||||||||||
| Net investment income (loss) |
266,587 | 79,420 | 2,176,340 | 109,420 | 3,748,694 | |||||||||||||||
| REALIZED AND UNREALIZED GAIN (LOSS) ON INVESTMENTS |
|
|||||||||||||||||||
| Realized gain (loss) on investments |
2,015,233 | 53,610 | 8,880,934 | 20,450 | (683,159 | ) | ||||||||||||||
| Capital gain distributions |
1,364,347 | 109,231 | 5,194,303 | 7,266 | — | |||||||||||||||
| Net realized gain (loss) |
3,379,580 | 162,841 | 14,075,237 | 27,716 | (683,159 | ) | ||||||||||||||
| Net change in unrealized appreciation (depreciation) on investments |
2,595,726 | 252,162 | 26,558,665 | 91,120 | 2,145,717 | |||||||||||||||
| Net realized and unrealized gain (loss) on investments |
5,975,306 | 415,003 | 40,633,902 | 118,836 | 1,462,558 | |||||||||||||||
| Net increase (decrease) in net assets from operations |
$ | 6,241,893 | $ | 494,423 | $ | 42,810,242 | $ | 228,256 | $ | 5,211,252 | ||||||||||
| See notes to financial statements | TIAA Separate Account VA-5 (formerly, TIAA-CREF Life Separate Account VA-1) ∎ Statement of Additional Information | B-21 |
Table of Contents
| Statements of Assets and Liabilities
TIAA Separate Account VA-5 (formerly, TIAA-CREF Life Separate Account VA-1) ∎ December 31, 2025 |
| Vanguard VIF International Portfolio Sub-Account |
Vanguard
VIF Index Portfolio |
Vanguard VIF Moderate Allocation Portfolio Sub-Account |
Vanguard VIF Real Estate Index Portfolio Sub-Account |
Vanguard VIF Small Company Growth Portfolio Sub-Account |
||||||||||||||||
| ASSETS |
||||||||||||||||||||
| Investments, at value |
$ | 4,376,637 | $ | 106,356,880 | $ | 8,833,138 | $ | 30,174,803 | $ | 20,461,249 | ||||||||||
| Total assets |
$ | 4,376,637 | $ | 106,356,880 | $ | 8,833,138 | $ | 30,174,803 | $ | 20,461,249 | ||||||||||
| NET ASSETS |
||||||||||||||||||||
| Accumulation fund |
$ | 4,376,637 | $ | 106,356,880 | $ | 8,833,138 | $ | 30,174,803 | $ | 20,461,249 | ||||||||||
| Net assets |
$ | 4,376,637 | $ | 106,356,880 | $ | 8,833,138 | $ | 30,174,803 | $ | 20,461,249 | ||||||||||
| Investments, at cost |
$ | 3,951,765 | $ | 90,966,271 | $ | 8,027,068 | $ | 29,434,458 | $ | 18,546,861 | ||||||||||
| Shares held in corresponding Funds |
153,083 | 3,803,894 | 265,419 | 2,608,021 | 1,072,955 | |||||||||||||||
| UNIT VALUE |
||||||||||||||||||||
| Personal Annuity Select/Single Premium Immediate Annuity |
$ | — | $ | — | $ | — | $ | — | $ | — | ||||||||||
| Lifetime Variable Select Annuity |
— | — | — | — | — | |||||||||||||||
| Intelligent Variable Annuity |
||||||||||||||||||||
| Band 1 |
43.47 | 67.18 | 41.08 | 40.35 | 60.17 | |||||||||||||||
| Band 2 |
43.84 | 68.30 | 41.43 | 41.03 | 61.17 | |||||||||||||||
| Band 3 |
44.09 | 69.06 | 41.67 | 41.48 | 61.85 | |||||||||||||||
| Band 4 |
44.46 | 70.21 | 42.02 | 42.18 | 62.89 | |||||||||||||||
| Band 5 |
43.22 | 66.44 | 40.85 | 39.91 | 59.50 | |||||||||||||||
| Band 6 |
43.59 | 67.55 | 41.20 | 40.58 | 60.50 | |||||||||||||||
| Band 7 |
43.84 | 68.30 | 41.43 | 41.03 | 61.17 | |||||||||||||||
| Band 8 |
44.21 | 69.44 | 41.79 | 41.71 | 62.19 | |||||||||||||||
Statements of Operations
TIAA Separate Account VA-5 (formerly, TIAA-CREF Life Separate Account VA-1) ∎ For the period or year ended December 31, 2025
| Vanguard VIF International Portfolio Sub-Account |
Vanguard
VIF Index Portfolio |
Vanguard VIF Moderate Allocation Portfolio Sub-Account |
Vanguard VIF Real Estate Index Portfolio Sub-Account |
Vanguard
VIF Small Company Growth Portfolio Sub-Account |
||||||||||||||||
| INVESTMENT INCOME |
||||||||||||||||||||
| Dividends |
$ | 39,584 | $ | 1,281,430 | $ | 143,784 | $ | 825,637 | $ | 90,667 | ||||||||||
| Expenses |
||||||||||||||||||||
| Administrative expenses |
4,635 | 102,564 | 6,438 | 29,995 | 19,740 | |||||||||||||||
| Mortality and expense risk charges |
6,227 | 174,115 | 13,136 | 50,155 | 28,818 | |||||||||||||||
| Guaranteed minimum death benefits |
1,660 | 39,263 | 2,610 | 10,253 | 6,799 | |||||||||||||||
| Total expenses |
12,522 | 315,942 | 22,184 | 90,403 | 55,357 | |||||||||||||||
| Net investment income (loss) |
27,062 | 965,488 | 121,600 | 735,234 | 35,310 | |||||||||||||||
| REALIZED AND UNREALIZED GAIN (LOSS) ON INVESTMENTS |
|
|||||||||||||||||||
| Realized gain (loss) on investments |
293,515 | 1,146,955 | 173,183 | (1,240,382 | ) | 52,097 | ||||||||||||||
| Capital gain distributions |
266,788 | 5,105,053 | 241,545 | 528,659 | 1,288,907 | |||||||||||||||
| Net realized gain (loss) |
560,303 | 6,252,008 | 414,728 | (711,723 | ) | 1,341,004 | ||||||||||||||
| Net change in unrealized appreciation (depreciation) on investments |
217,123 | 3,695,562 | 389,008 | 799,065 | (3,299 | ) | ||||||||||||||
| Net realized and unrealized gain (loss) on investments |
777,426 | 9,947,570 | 803,736 | 87,342 | 1,337,705 | |||||||||||||||
| Net increase (decrease) in net assets from operations |
$ | 804,488 | $ | 10,913,058 | $ | 925,336 | $ | 822,576 | $ | 1,373,015 | ||||||||||
| B-22 | Statement of Additional Information ∎ TIAA Separate Account VA-5 (formerly, TIAA-CREF Life Separate Account VA-1) | See notes to financial statements |
Table of Contents
| continued |
| Vanguard VIF Total Bond Market Index Portfolio Sub-Account |
Vanguard VIF Total International Stock Market Index Portfolio Sub-Account |
Vanguard VIF Total Stock Market Index Portfolio Sub-Account |
VY CBRE Global Real Estate Portfolio-Class I Sub-Account |
Western Asset Variable Global High Yield Bond Portfolio-Class I Sub-Account |
||||||||||||||||
| ASSETS |
||||||||||||||||||||
| Investments, at value |
$ | 334,536,617 | $ | 31,976,975 | $ | 58,388,247 | $ | 7,885,511 | $ | 12,842,105 | ||||||||||
| Total assets |
$ | 334,536,617 | $ | 31,976,975 | $ | 58,388,247 | $ | 7,885,511 | $ | 12,842,105 | ||||||||||
| NET ASSETS |
||||||||||||||||||||
| Accumulation fund |
$ | 334,536,617 | $ | 31,976,975 | $ | 58,388,247 | $ | 7,885,511 | $ | 12,842,105 | ||||||||||
| Net assets |
$ | 334,536,617 | $ | 31,976,975 | $ | 58,388,247 | $ | 7,885,511 | $ | 12,842,105 | ||||||||||
| Investments, at cost |
$ | 328,843,288 | $ | 26,771,539 | $ | 51,831,176 | $ | 7,578,658 | $ | 12,682,159 | ||||||||||
| Shares held in corresponding Funds |
30,975,613 | 1,190,505 | 958,284 | 761,150 | 2,071,307 | |||||||||||||||
| UNIT VALUE |
||||||||||||||||||||
| Personal Annuity Select/Single Premium Immediate Annuity |
$ | — | $ | — | $ | — | $ | — | $ | — | ||||||||||
| Lifetime Variable Select Annuity |
— | — | — | — | — | |||||||||||||||
| Intelligent Variable Annuity |
||||||||||||||||||||
| Band 1 |
28.60 | 49.36 | 62.13 | 52.95 | 22.17 | |||||||||||||||
| Band 2 |
29.08 | 49.78 | 62.66 | 54.21 | 22.78 | |||||||||||||||
| Band 3 |
29.41 | 50.06 | 63.02 | 55.07 | 23.19 | |||||||||||||||
| Band 4 |
29.90 | 50.49 | 63.56 | 56.38 | 23.83 | |||||||||||||||
| Band 5 |
28.29 | 49.08 | 61.78 | 52.13 | — | |||||||||||||||
| Band 6 |
28.76 | 49.50 | 62.31 | 53.37 | 22.37 | |||||||||||||||
| Band 7 |
29.08 | 49.78 | 62.66 | 54.21 | 22.78 | |||||||||||||||
| Band 8 |
29.57 | 50.20 | 63.20 | 55.50 | 23.40 | |||||||||||||||
| Vanguard VIF Total Bond Market Index Portfolio Sub-Account |
Vanguard VIF Total International Stock Market Index Portfolio Sub-Account |
Vanguard VIF Total Stock Market Index Portfolio Sub-Account |
VY CBRE Global Real Estate Portfolio-Class I Sub-Account |
Western Asset Variable Global High Yield Bond Portfolio-Class I Sub-Account |
||||||||||||||||
| INVESTMENT INCOME |
||||||||||||||||||||
| Dividends |
$ | 10,471,965 | $ | 623,913 | $ | 400,053 | $ | 236,781 | $ | 853,300 | ||||||||||
| Expenses |
||||||||||||||||||||
| Administrative expenses |
311,618 | 24,212 | 38,848 | 8,091 | 12,713 | |||||||||||||||
| Mortality and expense risk charges |
546,505 | 33,178 | 57,750 | 1,102 | 2,026 | |||||||||||||||
| Guaranteed minimum death benefits |
112,578 | 5,799 | 7,985 | 2,958 | 5,016 | |||||||||||||||
| Total expenses |
970,701 | 63,189 | 104,583 | 12,151 | 19,755 | |||||||||||||||
| Net investment income (loss) |
9,501,264 | 560,724 | 295,470 | 224,630 | 833,545 | |||||||||||||||
| REALIZED AND UNREALIZED GAIN (LOSS) ON INVESTMENTS |
|
|||||||||||||||||||
| Realized gain (loss) on investments |
(9,136,583 | ) | 975,573 | 2,266,023 | (66,355 | ) | (102,050 | ) | ||||||||||||
| Capital gain distributions |
— | 380,344 | 1,867,543 | — | — | |||||||||||||||
| Net realized gain (loss) |
(9,136,583 | ) | 1,355,917 | 4,133,566 | (66,355 | ) | (102,050 | ) | ||||||||||||
| Net change in unrealized appreciation (depreciation) on investments |
19,421,865 | 4,544,502 | 1,325,583 | 388,515 | 455,007 | |||||||||||||||
| Net realized and unrealized gain (loss) on investments |
10,285,282 | 5,900,419 | 5,459,149 | 322,160 | 352,957 | |||||||||||||||
| Net increase (decrease) in net assets from operations |
$ | 19,786,546 | $ | 6,461,143 | $ | 5,754,619 | $ | 546,790 | $ | 1,186,502 | ||||||||||
| See notes to financial statements | TIAA Separate Account VA-5 (formerly, TIAA-CREF Life Separate Account VA-1) ∎ Statement of Additional Information | B-23 |
Table of Contents
| Statements of Changes in Net Assets
TIAA Separate Account VA-5 (formerly, TIAA-CREF Life Separate Account VA-1) ∎ For the period or year ended |
| Nuveen Life Balanced Sub-Account |
Nuveen Life Core Bond Sub-Account |
|||||||||||||||
| December 31, 2025 | December 31, 2024 | December 31, 2025 | December 31, 2024 | |||||||||||||
| FROM OPERATIONS |
||||||||||||||||
| Net investment income (loss) |
$ | 1,596,097 | $ | 1,081,567 | $ | 6,285,160 | $ | 5,623,531 | ||||||||
| Net realized gain (loss) |
4,656,885 | 2,015,346 | (2,771,888 | ) | (4,939,935 | ) | ||||||||||
| Net change in unrealized appreciation (depreciation) on investments |
1,098,971 | 2,990,847 | 7,068,493 | 3,096,045 | ||||||||||||
| Net increase (decrease) in net assets from operations |
7,351,953 | 6,087,760 | 10,581,765 | 3,779,641 | ||||||||||||
| FROM CONTRACTOWNER TRANSACTIONS |
||||||||||||||||
| Premiums (a) |
856,145 | 434,834 | 4,229,045 | 5,967,652 | ||||||||||||
| Net contractowner transfers |
(834,377 | ) | (2,714,861 | ) | 2,138,033 | 3,403,628 | ||||||||||
| Withdrawals and death benefits (b) |
(2,144,513 | ) | (7,754,608 | ) | (11,209,257 | ) | (11,131,883 | ) | ||||||||
| Net increase (decrease) in net assets resulting
from |
(2,122,745 | ) | (10,034,635 | ) | (4,842,179 | ) | (1,760,603 | ) | ||||||||
| Net increase (decrease) in net assets |
5,229,208 | (3,946,875 | ) | 5,739,586 | 2,019,038 | |||||||||||
| NET ASSETS |
||||||||||||||||
| Beginning of period |
60,039,261 | 63,986,136 | 160,717,124 | 158,698,086 | ||||||||||||
| End of period |
$ | 65,268,469 | $ | 60,039,261 | $ | 166,456,710 | $ | 160,717,124 | ||||||||
| CHANGES IN ACCUMULATION UNITS OUTSTANDING: |
||||||||||||||||
| Beginning of period |
1,276,216 | 1,512,705 | 3,555,299 | 3,605,100 | ||||||||||||
| Units purchased |
17,081 | 9,580 | 92,128 | 137,618 | ||||||||||||
| Units sold/transferred |
(68,786 | ) | (246,069 | ) | (209,268 | ) | (187,419 | ) | ||||||||
| End of period |
1,224,511 | 1,276,216 | 3,438,159 | 3,555,299 | ||||||||||||
| (a) | Amounts presented are net of premium expense charges. |
| (b) | Amounts include payments for other daily and monthly fee and expense charges. |
| B-24 | Statement of Additional Information ∎ TIAA Separate Account VA-5 (formerly, TIAA-CREF Life Separate Account VA-1) | See notes to financial statements |
Table of Contents
| continued |
| Nuveen Life Core Equity Sub-Account |
Nuveen Life Growth Equity Sub-Account |
|||||||||||||||
| December 31, 2025 | December 31, 2024 | December 31, 2025 | December 31, 2024 | |||||||||||||
| FROM OPERATIONS |
||||||||||||||||
| Net investment income (loss) |
$ | 771,674 | $ | 590,825 | $ | (609,415 | ) | $ | (328,811 | ) | ||||||
| Net realized gain (loss) |
27,520,121 | 12,278,513 | 12,256,628 | 6,615,421 | ||||||||||||
| Net change in unrealized appreciation (depreciation) on investments |
(5,144,552 | ) | 31,026,921 | 10,204,736 | 28,814,610 | |||||||||||
| Net increase (decrease) in net assets from operations |
23,147,243 | 43,896,259 | 21,851,949 | 35,101,220 | ||||||||||||
| FROM CONTRACTOWNER TRANSACTIONS |
||||||||||||||||
| Premiums (a) |
562,166 | 992,676 | 2,622,484 | 2,220,182 | ||||||||||||
| Net contractowner transfers |
(3,767,762 | ) | 2,063,677 | (1,422,008 | ) | 787,514 | ||||||||||
| Annuity payments |
(4,086,121 | ) | (4,195,260 | ) | (2,401,283 | ) | (2,138,882 | ) | ||||||||
| Withdrawals and death benefits (b) |
(11,615,555 | ) | (12,538,116 | ) | (11,814,239 | ) | (8,635,971 | ) | ||||||||
| Net increase (decrease) in net assets resulting
from |
(18,907,272 | ) | (13,677,023 | ) | (13,015,046 | ) | (7,767,157 | ) | ||||||||
| Net increase (decrease) in net assets |
4,239,971 | 30,219,236 | 8,836,903 | 27,334,063 | ||||||||||||
| NET ASSETS |
||||||||||||||||
| Beginning of period |
189,829,160 | 159,609,924 | 156,887,733 | 129,553,670 | ||||||||||||
| End of period |
$ | 194,069,131 | $ | 189,829,160 | $ | 165,724,636 | $ | 156,887,733 | ||||||||
| CHANGES IN ACCUMULATION UNITS OUTSTANDING: |
||||||||||||||||
| Beginning of period |
1,009,347 | 1,086,549 | 1,239,548 | 1,299,146 | ||||||||||||
| Units purchased |
3,169 | 6,470 | 21,451 | 21,741 | ||||||||||||
| Units sold/transferred |
(104,925 | ) | (83,672 | ) | (130,162 | ) | (81,339 | ) | ||||||||
| End of period |
907,591 | 1,009,347 | 1,130,837 | 1,239,548 | ||||||||||||
| (a) | Amounts presented are net of premium expense charges. |
| (b) | Amounts include payments for other daily and monthly fee and expense charges. |
| See notes to financial statements | TIAA Separate Account VA-5 (formerly, TIAA-CREF Life Separate Account VA-1) ∎ Statement of Additional Information | B-25 |
Table of Contents
| Statements of Changes in Net Assets
TIAA Separate Account VA-5 (formerly, TIAA-CREF Life Separate Account VA-1) ∎ For the period or year ended |
| Nuveen Life International Equity Sub-Account |
Nuveen Life Large Cap Responsible Equity Sub-Account |
|||||||||||||||
| December 31, 2025 | December 31, 2024 | December 31, 2025 | December 31, 2024 | |||||||||||||
| FROM OPERATIONS |
||||||||||||||||
| Net investment income (loss) |
$ | 2,076,939 | $ | 2,190,955 | $ | 690,299 | $ | 924,702 | ||||||||
| Net realized gain (loss) |
5,704,367 | 2,402,231 | 13,701,418 | 7,679,074 | ||||||||||||
| Net change in unrealized appreciation (depreciation) on investments |
30,287,459 | (1,111,208 | ) | (56,750 | ) | 5,770,429 | ||||||||||
| Net increase (decrease) in net assets from operations |
38,068,765 | 3,481,978 | 14,334,967 | 14,374,205 | ||||||||||||
| FROM CONTRACTOWNER TRANSACTIONS |
||||||||||||||||
| Premiums (a) |
9,289,663 | 8,018,389 | 296,218 | 449,650 | ||||||||||||
| Net contractowner transfers |
(1,062,692 | ) | 1,555,948 | (1,530,488 | ) | (288,465 | ) | |||||||||
| Annuity payments |
(957,016 | ) | (896,529 | ) | (1,291,260 | ) | (1,216,011 | ) | ||||||||
| Withdrawals and death benefits (b) |
(7,406,165 | ) | (6,373,113 | ) | (6,033,725 | ) | (5,008,000 | ) | ||||||||
| Net increase (decrease) in net assets resulting
from |
(136,210 | ) | 2,304,695 | (8,559,255 | ) | (6,062,826 | ) | |||||||||
| Net increase (decrease) in net assets |
37,932,555 | 5,786,673 | 5,775,712 | 8,311,379 | ||||||||||||
| NET ASSETS |
||||||||||||||||
| Beginning of period |
118,662,138 | 112,875,465 | 93,187,487 | 84,876,108 | ||||||||||||
| End of period |
$ | 156,594,693 | $ | 118,662,138 | $ | 98,963,199 | $ | 93,187,487 | ||||||||
| CHANGES IN ACCUMULATION UNITS OUTSTANDING: |
||||||||||||||||
| Beginning of period |
2,620,749 | 2,568,286 | 600,295 | 646,078 | ||||||||||||
| Units purchased |
185,835 | 182,252 | 1,998 | 3,351 | ||||||||||||
| Units sold/transferred |
(191,218 | ) | (129,789 | ) | (52,949 | ) | (49,134 | ) | ||||||||
| End of period |
2,615,366 | 2,620,749 | 549,344 | 600,295 | ||||||||||||
| (a) | Amounts presented are net of premium expense charges. |
| (b) | Amounts include payments for other daily and monthly fee and expense charges. |
| B-26 | Statement of Additional Information ∎ TIAA Separate Account VA-5 (formerly, TIAA-CREF Life Separate Account VA-1) | See notes to financial statements |
Table of Contents
| continued |
| Nuveen Life Large Cap Value Sub-Account |
Nuveen Life Money Market Sub-Account |
|||||||||||||||
| December 31, 2025 | December 31, 2024 | December 31, 2025 | December 31, 2024 | |||||||||||||
| FROM OPERATIONS |
||||||||||||||||
| Net investment income (loss) |
$ | 751,984 | $ | 801,371 | $ | 4,457,953 | $ | 5,022,659 | ||||||||
| Net realized gain (loss) |
6,952,725 | 8,295,285 | — | — | ||||||||||||
| Net change in unrealized appreciation (depreciation) on investments |
3,735,053 | 597,690 | — | — | ||||||||||||
| Net increase (decrease) in net assets from operations |
11,439,762 | 9,694,346 | 4,457,953 | 5,022,659 | ||||||||||||
| FROM CONTRACTOWNER TRANSACTIONS |
||||||||||||||||
| Premiums (a) |
384,977 | 327,257 | 27,462,602 | 16,680,370 | ||||||||||||
| Net contractowner transfers |
2,521,729 | (2,086,046 | ) | 34,402,479 | 22,393,075 | |||||||||||
| Annuity payments |
(1,745,401 | ) | (1,409,892 | ) | — | — | ||||||||||
| Withdrawals and death benefits (b) |
(3,822,740 | ) | (5,384,442 | ) | (56,439,265 | ) | (45,889,295 | ) | ||||||||
| Net increase (decrease) in net assets resulting
from |
(2,661,435 | ) | (8,553,123 | ) | 5,425,816 | (6,815,850 | ) | |||||||||
| Net increase (decrease) in net assets |
8,778,327 | 1,141,223 | 9,883,769 | (1,793,191 | ) | |||||||||||
| NET ASSETS |
||||||||||||||||
| Beginning of period |
70,117,573 | 68,976,350 | 104,656,445 | 106,449,636 | ||||||||||||
| End of period |
$ | 78,895,900 | $ | 70,117,573 | $ | 114,540,214 | $ | 104,656,445 | ||||||||
| CHANGES IN ACCUMULATION UNITS OUTSTANDING: |
||||||||||||||||
| Beginning of period |
382,111 | 432,572 | 7,937,175 | 8,479,435 | ||||||||||||
| Units purchased |
2,152 | 2,110 | 2,115,102 | 1,342,554 | ||||||||||||
| Units sold/transferred |
(24,276 | ) | (52,571 | ) | (1,709,131 | ) | (1,884,814 | ) | ||||||||
| End of period |
359,987 | 382,111 | 8,343,146 | 7,937,175 | ||||||||||||
| (a) | Amounts presented are net of premium expense charges. |
| (b) | Amounts include payments for other daily and monthly fee and expense charges. |
| See notes to financial statements | TIAA Separate Account VA-5 (formerly, TIAA-CREF Life Separate Account VA-1) ∎ Statement of Additional Information | B-27 |
Table of Contents
| Statements of Changes in Net Assets
TIAA Separate Account VA-5 (formerly, TIAA-CREF Life Separate Account VA-1) ∎ For the period or year ended |
| Nuveen Life Real Estate Securities Select Sub-Account |
Nuveen Life Small Cap Equity Sub-Account |
|||||||||||||||
| December 31, 2025 | December 31, 2024 | December 31, 2025 | December 31, 2024 | |||||||||||||
| FROM OPERATIONS |
||||||||||||||||
| Net investment income (loss) |
$ | 1,296,569 | $ | 1,390,145 | $ | 336,353 | $ | 251,921 | ||||||||
| Net realized gain (loss) |
621,570 | (904,193 | ) | 8,358,365 | 1,566,185 | |||||||||||
| Net change in unrealized appreciation (depreciation) on investments |
(1,144,129 | ) | 1,956,947 | 333,887 | 6,518,478 | |||||||||||
| Net increase (decrease) in net assets from operations |
774,010 | 2,442,899 | 9,028,605 | 8,336,584 | ||||||||||||
| FROM CONTRACTOWNER TRANSACTIONS |
||||||||||||||||
| Premiums (a) |
398,841 | 311,078 | 410,922 | 385,405 | ||||||||||||
| Net contractowner transfers |
376,467 | (707,412 | ) | (871,039 | ) | (799,759 | ) | |||||||||
| Annuity payments |
(1,260,997 | ) | (1,207,937 | ) | (979,700 | ) | (1,053,611 | ) | ||||||||
| Withdrawals and death benefits (b) |
(4,691,326 | ) | (6,350,690 | ) | (4,133,533 | ) | (3,316,630 | ) | ||||||||
| Net increase (decrease) in net assets resulting
from |
(5,177,015 | ) | (7,954,961 | ) | (5,573,350 | ) | (4,784,595 | ) | ||||||||
| Net increase (decrease) in net assets |
(4,403,005 | ) | (5,512,062 | ) | 3,455,255 | 3,551,989 | ||||||||||
| NET ASSETS |
||||||||||||||||
| Beginning of period |
58,158,356 | 63,670,418 | 61,700,829 | 58,148,840 | ||||||||||||
| End of period |
$ | 53,755,351 | $ | 58,158,356 | $ | 65,156,084 | $ | 61,700,829 | ||||||||
| CHANGES IN ACCUMULATION UNITS OUTSTANDING: |
||||||||||||||||
| Beginning of period |
330,640 | 382,913 | 272,155 | 295,786 | ||||||||||||
| Units purchased |
2,446 | 2,042 | 1,895 | 2,100 | ||||||||||||
| Units sold/transferred |
(29,340 | ) | (54,315 | ) | (26,050 | ) | (25,731 | ) | ||||||||
| End of period |
303,746 | 330,640 | 248,000 | 272,155 | ||||||||||||
| (a) | Amounts presented are net of premium expense charges. |
| (b) | Amounts include payments for other daily and monthly fee and expense charges. |
| B-28 | Statement of Additional Information ∎ TIAA Separate Account VA-5 (formerly, TIAA-CREF Life Separate Account VA-1) | See notes to financial statements |
Table of Contents
| continued |
| Nuveen Life Stock Index Sub-Account |
Calamos Growth and Income Portfolio Sub-Account |
|||||||||||||||
| December 31, 2025 | December 31, 2024 | December 31, 2025 | December 31, 2024 | |||||||||||||
| FROM OPERATIONS |
||||||||||||||||
| Net investment income (loss) |
$ | 5,666,448 | $ | 5,969,434 | $ | 9,266 | $ | 12,609 | ||||||||
| Net realized gain (loss) |
82,001,179 | 66,374,755 | 602,195 | 146,179 | ||||||||||||
| Net change in unrealized appreciation (depreciation) on investments |
17,307,611 | 62,371,993 | 258,412 | 780,855 | ||||||||||||
| Net increase (decrease) in net assets from operations |
104,975,238 | 134,716,182 | 869,873 | 939,643 | ||||||||||||
| FROM CONTRACTOWNER TRANSACTIONS |
||||||||||||||||
| Premiums (a) |
6,736,112 | 5,998,699 | 96,599 | 8,229 | ||||||||||||
| Net contractowner transfers |
(7,834,564 | ) | (12,639,999 | ) | (316,223 | ) | (129,056 | ) | ||||||||
| Annuity payments |
(9,362,216 | ) | (9,286,893 | ) | — | — | ||||||||||
| Withdrawals and death benefits (b) |
(50,888,606 | ) | (48,548,866 | ) | (200,119 | ) | (121,176 | ) | ||||||||
| Net increase (decrease) in net assets resulting
from |
(61,349,274 | ) | (64,477,059 | ) | (419,743 | ) | (242,003 | ) | ||||||||
| Net increase (decrease) in net assets |
43,625,964 | 70,239,123 | 450,130 | 697,640 | ||||||||||||
| NET ASSETS |
||||||||||||||||
| Beginning of period |
678,647,373 | 608,408,250 | 5,222,611 | 4,524,971 | ||||||||||||
| End of period |
$ | 722,273,337 | $ | 678,647,373 | $ | 5,672,741 | $ | 5,222,611 | ||||||||
| CHANGES IN ACCUMULATION UNITS OUTSTANDING: |
||||||||||||||||
| Beginning of period |
3,327,422 | 3,692,916 | 93,521 | 97,972 | ||||||||||||
| Units purchased |
33,460 | 36,327 | 1,530 | 161 | ||||||||||||
| Units sold/transferred |
(347,089 | ) | (401,821 | ) | (8,371 | ) | (4,612 | ) | ||||||||
| End of period |
3,013,793 | 3,327,422 | 86,680 | 93,521 | ||||||||||||
| (a) | Amounts presented are net of premium expense charges. |
| (b) | Amounts include payments for other daily and monthly fee and expense charges. |
| See notes to financial statements | TIAA Separate Account VA-5 (formerly, TIAA-CREF Life Separate Account VA-1) ∎ Statement of Additional Information | B-29 |
Table of Contents
| Statements of Changes in Net Assets
TIAA Separate Account VA-5 (formerly, TIAA-CREF Life Separate Account VA-1) ∎ For the period or year ended |
| ClearBridge Variable Growth Portfolio–Class I Sub-Account |
ClearBridge Variable Small Cap Growth Portfolio–Class I Sub-Account |
|||||||||||||||
| December 31, 2025 | December 31, 2024 | December 31, 2025 | December 31, 2024 | |||||||||||||
| FROM OPERATIONS |
||||||||||||||||
| Net investment income (loss) |
$ | (95,443 | ) | $ | (71,528 | ) | $ | (10,688 | ) | $ | (12,391 | ) | ||||
| Net realized gain (loss) |
1,576,209 | 4,393,273 | 525,372 | (236,630 | ) | |||||||||||
| Net change in unrealized appreciation (depreciation) on investments |
2,328,193 | (840,709 | ) | (39,142 | ) | 455,795 | ||||||||||
| Net increase (decrease) in net assets from operations |
3,808,959 | 3,481,036 | 475,542 | 206,774 | ||||||||||||
| FROM CONTRACTOWNER TRANSACTIONS |
||||||||||||||||
| Premiums (a) |
584,483 | 317,175 | 779,747 | 159,568 | ||||||||||||
| Net contractowner transfers |
(1,748,834 | ) | (3,104,426 | ) | (301,049 | ) | (149,324 | ) | ||||||||
| Withdrawals and death benefits (b) |
(1,675,258 | ) | (1,831,190 | ) | (290,362 | ) | (540,792 | ) | ||||||||
| Net increase (decrease) in net assets resulting
from |
(2,839,609 | ) | (4,618,441 | ) | 188,336 | (530,548 | ) | |||||||||
| Net increase (decrease) in net assets |
969,350 | (1,137,405 | ) | 663,878 | (323,774 | ) | ||||||||||
| NET ASSETS |
||||||||||||||||
| Beginning of period |
29,550,209 | 30,687,614 | 5,017,842 | 5,341,616 | ||||||||||||
| End of period |
$ | 30,519,559 | $ | 29,550,209 | $ | 5,681,720 | $ | 5,017,842 | ||||||||
| CHANGES IN ACCUMULATION UNITS OUTSTANDING: |
||||||||||||||||
| Beginning of period |
493,577 | 577,170 | 77,078 | 86,657 | ||||||||||||
| Units purchased |
8,867 | 5,759 | 11,407 | 2,628 | ||||||||||||
| Units sold/transferred |
(55,700 | ) | (89,352 | ) | (8,353 | ) | (12,207 | ) | ||||||||
| End of period |
446,744 | 493,577 | 80,132 | 77,078 | ||||||||||||
| (a) | Amounts presented are net of premium expense charges. |
| (b) | Amounts include payments for other daily and monthly fee and expense charges. |
| B-30 | Statement of Additional Information ∎ TIAA Separate Account VA-5 (formerly, TIAA-CREF Life Separate Account VA-1) | See notes to financial statements |
Table of Contents
| continued |
| Columbia Variable Portfolio—Acorn Sub-Account |
Columbia Variable Portfolio—Acorn International Sub-Account |
|||||||||||||||
| December 31, 2025 | December 31, 2024 | December 31, 2025 | December 31, 2024 | |||||||||||||
| FROM OPERATIONS |
||||||||||||||||
| Net investment income (loss) |
$ | (16,379 | ) | $ | (16,415 | ) | $ | 129,264 | $ | 140,874 | ||||||
| Net realized gain (loss) |
416,384 | 331,310 | (418,725 | ) | (90,029 | ) | ||||||||||
| Net change in unrealized appreciation (depreciation) on investments |
(74,542 | ) | 548,156 | 1,644,962 | (1,066,068 | ) | ||||||||||
| Net increase (decrease) in net assets from operations |
325,463 | 863,051 | 1,355,501 | (1,015,223 | ) | |||||||||||
| FROM CONTRACTOWNER TRANSACTIONS |
||||||||||||||||
| Premiums (a) |
471,797 | 430,676 | 66,520 | 160,435 | ||||||||||||
| Net contractowner transfers |
(177,503 | ) | (13,256 | ) | (106,410 | ) | 126,788 | |||||||||
| Withdrawals and death benefits (b) |
(296,644 | ) | (237,271 | ) | (689,023 | ) | (623,548 | ) | ||||||||
| Net increase (decrease) in net assets resulting
from |
(2,350 | ) | 180,149 | (728,913 | ) | (336,325 | ) | |||||||||
| Net increase (decrease) in net assets |
323,113 | 1,043,200 | 626,588 | (1,351,548 | ) | |||||||||||
| NET ASSETS |
||||||||||||||||
| Beginning of period |
7,056,824 | 6,013,624 | 10,921,144 | 12,272,692 | ||||||||||||
| End of period |
$ | 7,379,937 | $ | 7,056,824 | $ | 11,547,732 | $ | 10,921,144 | ||||||||
| CHANGES IN ACCUMULATION UNITS OUTSTANDING: |
||||||||||||||||
| Beginning of period |
54,066 | 52,613 | 152,305 | 158,368 | ||||||||||||
| Units purchased |
3,765 | 3,607 | 830 | 2,089 | ||||||||||||
| Units sold/transferred |
(3,673 | ) | (2,154 | ) | (10,500 | ) | (8,152 | ) | ||||||||
| End of period |
54,158 | 54,066 | 142,635 | 152,305 | ||||||||||||
| (a) | Amounts presented are net of premium expense charges. |
| (b) | Amounts include payments for other daily and monthly fee and expense charges. |
| See notes to financial statements | TIAA Separate Account VA-5 (formerly, TIAA-CREF Life Separate Account VA-1) ∎ Statement of Additional Information | B-31 |
Table of Contents
| Statements of Changes in Net Assets
TIAA Separate Account VA-5 (formerly, TIAA-CREF Life Separate Account VA-1) ∎ For the period or year ended |
| Credit Suisse Trust-Commodity Return Strategy Portfolio Sub-Account |
Dimensional VA Equity Allocation Portfolio Sub-Account |
|||||||||||||||
| December 31, 2025 | December 31, 2024 | December 31, 2025 | December 31, 2024 | |||||||||||||
| FROM OPERATIONS |
||||||||||||||||
| Net investment income (loss) |
$ | 19,415 | $ | 15,100 | $ | 302,574 | $ | 241,440 | ||||||||
| Net realized gain (loss) |
(98,632 | ) | (36,461 | ) | 1,228,078 | 789,194 | ||||||||||
| Net change in unrealized appreciation (depreciation) on investments |
156,271 | 45,750 | 1,452,915 | 734,002 | ||||||||||||
| Net increase (decrease) in net assets from operations |
77,054 | 24,389 | 2,983,567 | 1,764,636 | ||||||||||||
| FROM CONTRACTOWNER TRANSACTIONS |
||||||||||||||||
| Premiums (a) |
10,718 | 1,942 | 52,308 | 121,766 | ||||||||||||
| Net contractowner transfers |
68,890 | (34,860 | ) | 300,294 | 3,226,822 | |||||||||||
| Withdrawals and death benefits (b) |
(49,699 | ) | (59,687 | ) | (662,081 | ) | (1,276,999 | ) | ||||||||
| Net increase (decrease) in net assets resulting
from |
29,909 | (92,605 | ) | (309,479 | ) | 2,071,589 | ||||||||||
| Net increase (decrease) in net assets |
106,963 | (68,216 | ) | 2,674,088 | 3,836,225 | |||||||||||
| NET ASSETS |
||||||||||||||||
| Beginning of period |
492,651 | 560,867 | 15,239,650 | 11,403,425 | ||||||||||||
| End of period |
$ | 599,614 | $ | 492,651 | $ | 17,913,738 | $ | 15,239,650 | ||||||||
| CHANGES IN ACCUMULATION UNITS OUTSTANDING: |
||||||||||||||||
| Beginning of period |
21,823 | 25,862 | 299,509 | 257,756 | ||||||||||||
| Units purchased |
443 | 91 | 1,037 | 2,495 | ||||||||||||
| Units sold/transferred |
626 | (4,130 | ) | (7,051 | ) | 39,258 | ||||||||||
| End of period |
22,892 | 21,823 | 293,495 | 299,509 | ||||||||||||
| (a) | Amounts presented are net of premium expense charges. |
| (b) | Amounts include payments for other daily and monthly fee and expense charges. |
| B-32 | Statement of Additional Information ∎ TIAA Separate Account VA-5 (formerly, TIAA-CREF Life Separate Account VA-1) | See notes to financial statements |
Table of Contents
| continued |
| Dimensional VA Global Bond Portfolio Sub-Account |
Dimensional VA Global Moderate Allocation Portfolio Sub-Account |
|||||||||||||||
| December 31, 2025 | December 31, 2024 | December 31, 2025 | December 31, 2024 | |||||||||||||
| FROM OPERATIONS |
||||||||||||||||
| Net investment income (loss) |
$ | 2,038,981 | $ | 2,481,119 | $ | 1,173,046 | $ | 1,144,817 | ||||||||
| Net realized gain (loss) |
(749,806 | ) | (681,172 | ) | 2,374,177 | 1,257,276 | ||||||||||
| Net change in unrealized appreciation (depreciation) on investments |
875,412 | 980,200 | 3,092,283 | 2,719,198 | ||||||||||||
| Net increase (decrease) in net assets from operations |
2,164,587 | 2,780,147 | 6,639,506 | 5,121,291 | ||||||||||||
| FROM CONTRACTOWNER TRANSACTIONS |
||||||||||||||||
| Premiums (a) |
32,906 | 274,471 | 1,639,150 | 806,665 | ||||||||||||
| Net contractowner transfers |
394,518 | 837,204 | (998,977 | ) | (654,750 | ) | ||||||||||
| Withdrawals and death benefits (b) |
(3,753,426 | ) | (5,187,312 | ) | (1,468,250 | ) | (1,404,157 | ) | ||||||||
| Net increase (decrease) in net assets resulting from contractowner transactions |
(3,326,002 | ) | (4,075,637 | ) | (828,077 | ) | (1,252,242 | ) | ||||||||
| Net increase (decrease) in net assets |
(1,161,415 | ) | (1,295,490 | ) | 5,811,429 | 3,869,049 | ||||||||||
| NET ASSETS |
||||||||||||||||
| Beginning of period |
55,055,219 | 56,350,709 | 48,153,622 | 44,284,573 | ||||||||||||
| End of period |
$ | 53,893,804 | $ | 55,055,219 | $ | 53,965,051 | $ | 48,153,622 | ||||||||
| CHANGES IN ACCUMULATION UNITS OUTSTANDING: |
||||||||||||||||
| Beginning of period |
1,860,142 | 2,003,267 | 961,572 | 989,409 | ||||||||||||
| Units purchased |
1,095 | 9,523 | 30,241 | 16,999 | ||||||||||||
| Units sold/transferred |
(118,792 | ) | (152,648 | ) | (51,976 | ) | (44,836 | ) | ||||||||
| End of period |
1,742,445 | 1,860,142 | 939,837 | 961,572 | ||||||||||||
| (a) | Amounts presented are net of premium expense charges. |
| (b) | Amounts include payments for other daily and monthly fee and expense charges. |
| See notes to financial statements | TIAA Separate Account VA-5 (formerly, TIAA-CREF Life Separate Account VA-1) ∎ Statement of Additional Information | B-33 |
Table of Contents
| Statements of Changes in Net Assets
TIAA Separate Account VA-5 (formerly, TIAA-CREF Life Separate Account VA-1) ∎ For the period or year ended |
| Dimensional VA International Small Portfolio Sub-Account |
Dimensional VA International Value Portfolio Sub-Account |
|||||||||||||||
| December 31, 2025 | December 31, 2024 | December 31, 2025 | December 31, 2024 | |||||||||||||
| FROM OPERATIONS |
||||||||||||||||
| Net investment income (loss) |
$ | 1,508,650 | $ | 1,488,383 | $ | 4,381,087 | $ | 3,543,879 | ||||||||
| Net realized gain (loss) |
4,102,558 | 1,729,674 | 12,123,556 | 10,111,336 | ||||||||||||
| Net change in unrealized appreciation (depreciation) on investments |
9,903,408 | (1,515,644 | ) | 23,806,091 | (7,460,369 | ) | ||||||||||
| Net increase (decrease) in net assets from operations |
15,514,616 | 1,702,413 | 40,310,734 | 6,194,846 | ||||||||||||
| FROM CONTRACTOWNER TRANSACTIONS |
||||||||||||||||
| Premiums (a) |
954,444 | 635,536 | 478,205 | 1,238,078 | ||||||||||||
| Net contractowner transfers |
(3,883,974 | ) | (507,747 | ) | (8,634,764 | ) | (2,903,771 | ) | ||||||||
| Withdrawals and death benefits (b) |
(5,244,055 | ) | (3,440,261 | ) | (6,557,605 | ) | (7,388,126 | ) | ||||||||
| Net increase (decrease) in net assets resulting from contractowner transactions |
(8,173,585 | ) | (3,312,472 | ) | (14,714,164 | ) | (9,053,819 | ) | ||||||||
| Net increase (decrease) in net assets |
7,341,031 | (1,610,059 | ) | 25,596,570 | (2,858,973 | ) | ||||||||||
| NET ASSETS |
||||||||||||||||
| Beginning of period |
46,602,586 | 48,212,645 | 95,595,229 | 98,454,202 | ||||||||||||
| End of period |
$ | 53,943,617 | $ | 46,602,586 | $ | 121,191,799 | $ | 95,595,229 | ||||||||
| CHANGES IN ACCUMULATION UNITS OUTSTANDING: |
||||||||||||||||
| Beginning of period |
867,719 | 930,523 | 1,875,861 | 2,055,565 | ||||||||||||
| Units purchased |
14,236 | 11,930 | 8,037 | 24,676 | ||||||||||||
| Units sold/transferred |
(150,220 | ) | (74,734 | ) | (252,386 | ) | (204,380 | ) | ||||||||
| End of period |
731,735 | 867,719 | 1,631,512 | 1,875,861 | ||||||||||||
| (a) | Amounts presented are net of premium expense charges. |
| (b) | Amounts include payments for other daily and monthly fee and expense charges. |
| B-34 | Statement of Additional Information ∎ TIAA Separate Account VA-5 (formerly, TIAA-CREF Life Separate Account VA-1) | See notes to financial statements |
Table of Contents
| continued |
| Dimensional VA Short-Term Fixed Portfolio Sub-Account |
Dimensional VA US Large Value Portfolio Sub-Account |
|||||||||||||||
| December 31, 2025 | December 31, 2024 | December 31, 2025 | December 31, 2024 | |||||||||||||
| FROM OPERATIONS |
||||||||||||||||
| Net investment income (loss) |
$ | 2,977,053 | $ | 3,505,118 | $ | 1,143,966 | $ | 1,258,478 | ||||||||
| Net realized gain (loss) |
167,669 | 168,167 | 5,865,873 | 14,902,363 | ||||||||||||
| Net change in unrealized appreciation (depreciation) on investments |
(90,075 | ) | 275,494 | 3,484,940 | (6,981,325 | ) | ||||||||||
| Net increase (decrease) in net assets from operations |
3,054,647 | 3,948,779 | 10,494,779 | 9,179,516 | ||||||||||||
| FROM CONTRACTOWNER TRANSACTIONS |
||||||||||||||||
| Premiums (a) |
468,112 | 994,911 | 326,028 | 704,260 | ||||||||||||
| Net contractowner transfers |
1,104,786 | 2,875,633 | (3,092,984 | ) | (1,181,318 | ) | ||||||||||
| Withdrawals and death benefits (b) |
(5,460,496 | ) | (8,664,769 | ) | (5,172,534 | ) | (8,568,265 | ) | ||||||||
| Net increase (decrease) in net assets resulting from contractowner transactions |
(3,887,598 | ) | (4,794,225 | ) | (7,939,490 | ) | (9,045,323 | ) | ||||||||
| Net increase (decrease) in net assets |
(832,951 | ) | (845,446 | ) | 2,555,289 | 134,193 | ||||||||||
| NET ASSETS |
||||||||||||||||
| Beginning of period |
77,958,542 | 78,803,988 | 72,529,665 | 72,395,472 | ||||||||||||
| End of period |
$ | 77,125,591 | $ | 77,958,542 | $ | 75,084,954 | $ | 72,529,665 | ||||||||
| CHANGES IN ACCUMULATION UNITS OUTSTANDING: |
||||||||||||||||
| Beginning of period |
2,751,521 | 2,931,186 | 793,963 | 897,993 | ||||||||||||
| Units purchased |
16,208 | 36,184 | 3,437 | 8,156 | ||||||||||||
| Units sold/transferred |
(160,406 | ) | (215,849 | ) | (87,395 | ) | (112,186 | ) | ||||||||
| End of period |
2,607,323 | 2,751,521 | 710,005 | 793,963 | ||||||||||||
| (a) | Amounts presented are net of premium expense charges. |
| (b) | Amounts include payments for other daily and monthly fee and expense charges. |
| See notes to financial statements | TIAA Separate Account VA-5 (formerly, TIAA-CREF Life Separate Account VA-1) ∎ Statement of Additional Information | B-35 |
Table of Contents
| Statements of Changes in Net Assets
TIAA Separate Account VA-5 (formerly, TIAA-CREF Life Separate Account VA-1) ∎ For the period or year ended |
| Dimensional VA US Targeted Value Portfolio Sub-Account |
Franklin Income VIP Fund-Class 1 Sub-Account |
|||||||||||||||
| December 31, 2025 | December 31, 2024 | December 31, 2025 | December 31, 2024 | |||||||||||||
| FROM OPERATIONS |
||||||||||||||||
| Net investment income (loss) |
$ | 744,106 | $ | 524,896 | $ | 399,023 | $ | 388,158 | ||||||||
| Net realized gain (loss) |
3,961,391 | 3,547,007 | 117,642 | 11,943 | ||||||||||||
| Net change in unrealized appreciation (depreciation) on investments |
(651,333 | ) | (389,696 | ) | 461,441 | 144,689 | ||||||||||
| Net increase (decrease) in net assets from operations |
4,054,164 | 3,682,207 | 978,106 | 544,790 | ||||||||||||
| FROM CONTRACTOWNER TRANSACTIONS |
||||||||||||||||
| Premiums (a) |
1,203,845 | 1,139,485 | 51,625 | 62,396 | ||||||||||||
| Net contractowner transfers |
393,937 | (535,591 | ) | 40,025 | 52,655 | |||||||||||
| Withdrawals and death benefits (b) |
(2,973,463 | ) | (7,003,530 | ) | (527,982 | ) | (574,271 | ) | ||||||||
| Net increase (decrease) in net assets resulting from contractowner transactions |
(1,375,681 | ) | (6,399,636 | ) | (436,332 | ) | (459,220 | ) | ||||||||
| Net increase (decrease) in net assets |
2,678,483 | (2,717,429 | ) | 541,774 | 85,570 | |||||||||||
| NET ASSETS |
||||||||||||||||
| Beginning of period |
47,927,599 | 50,645,028 | 7,971,401 | 7,885,831 | ||||||||||||
| End of period |
$ | 50,606,082 | $ | 47,927,599 | $ | 8,513,175 | $ | 7,971,401 | ||||||||
| CHANGES IN ACCUMULATION UNITS OUTSTANDING: |
||||||||||||||||
| Beginning of period |
494,036 | 563,944 | 180,777 | 192,815 | ||||||||||||
| Units purchased |
12,565 | 12,495 | 1,090 | 1,436 | ||||||||||||
| Units sold/transferred |
(27,417 | ) | (82,403 | ) | (11,179 | ) | (13,474 | ) | ||||||||
| End of period |
479,184 | 494,036 | 170,688 | 180,777 | ||||||||||||
| (a) | Amounts presented are net of premium expense charges. |
| (b) | Amounts include payments for other daily and monthly fee and expense charges. |
| B-36 | Statement of Additional Information ∎ TIAA Separate Account VA-5 (formerly, TIAA-CREF Life Separate Account VA-1) | See notes to financial statements |
Table of Contents
| continued |
| Franklin Mutual Shares VIP Fund-Class 1 Sub-Account |
Franklin Small-Mid Cap Growth VIP Fund-Class 1 Sub-Account |
|||||||||||||||
| December 31, 2025 | December 31, 2024 | December 31, 2025 | December 31, 2024 | |||||||||||||
| FROM OPERATIONS |
||||||||||||||||
| Net investment income (loss) |
$ | 42,184 | $ | 45,761 | $ | (30,859 | ) | $ | (36,052 | ) | ||||||
| Net realized gain (loss) |
189,030 | (17,284 | ) | 1,061,019 | (109,114 | ) | ||||||||||
| Net change in unrealized appreciation (depreciation) on investments |
(5,921 | ) | 234,693 | (659,319 | ) | 1,595,351 | ||||||||||
| Net increase (decrease) in net assets from operations |
225,293 | 263,170 | 370,841 | 1,450,185 | ||||||||||||
| FROM CONTRACTOWNER TRANSACTIONS |
||||||||||||||||
| Premiums (a) |
1,890 | 2,077 | 311,543 | 381,015 | ||||||||||||
| Net contractowner transfers |
15,939 | (182,643 | ) | 137,204 | (1,264,414 | ) | ||||||||||
| Withdrawals and death benefits (b) |
(130,107 | ) | (438,054 | ) | (665,877 | ) | (715,805 | ) | ||||||||
| Net increase (decrease) in net assets resulting
from |
(112,278 | ) | (618,620 | ) | (217,130 | ) | (1,599,204 | ) | ||||||||
| Net increase (decrease) in net assets |
113,015 | (355,450 | ) | 153,711 | (149,019 | ) | ||||||||||
| NET ASSETS |
||||||||||||||||
| Beginning of period |
2,015,468 | 2,370,918 | 13,871,753 | 14,020,772 | ||||||||||||
| End of period |
$ | 2,128,483 | $ | 2,015,468 | $ | 14,025,464 | $ | 13,871,753 | ||||||||
| CHANGES IN ACCUMULATION UNITS OUTSTANDING: |
||||||||||||||||
| Beginning of period |
40,428 | 53,048 | 146,835 | 166,372 | ||||||||||||
| Units purchased |
36 | 43 | 3,319 | 4,370 | ||||||||||||
| Units sold/transferred |
(2,221 | ) | (12,663 | ) | (5,667 | ) | (23,907 | ) | ||||||||
| End of period |
38,243 | 40,428 | 144,487 | 146,835 | ||||||||||||
| (a) | Amounts presented are net of premium expense charges. |
| (b) | Amounts include payments for other daily and monthly fee and expense charges. |
| See notes to financial statements | TIAA Separate Account VA-5 (formerly, TIAA-CREF Life Separate Account VA-1) ∎ Statement of Additional Information | B-37 |
Table of Contents
| Statements of Changes in Net Assets
TIAA Separate Account VA-5 (formerly, TIAA-CREF Life Separate Account VA-1) ∎ For the period or year ended |
| Janus Henderson Forty Portfolio- Institutional Shares Sub-Account |
Janus Henderson Mid Cap Value Portfolio– Institutional Shares Sub-Account |
|||||||||||||||
| December 31, 2025 | December 31, 2024 | December 31, 2025 | December 31, 2024 | |||||||||||||
| FROM OPERATIONS |
||||||||||||||||
| Net investment income (loss) |
$ | (21,382 | ) | $ | (16,664 | ) | $ | 60,101 | $ | 76,904 | ||||||
| Net realized gain (loss) |
2,989,448 | 1,483,339 | 1,010,182 | 733,576 | ||||||||||||
| Net change in unrealized appreciation (depreciation) on investments |
(200,546 | ) | 2,585,665 | (518,599 | ) | 313,339 | ||||||||||
| Net increase (decrease) in net assets from operations |
2,767,520 | 4,052,340 | 551,684 | 1,123,819 | ||||||||||||
| FROM CONTRACTOWNER TRANSACTIONS |
||||||||||||||||
| Premiums (a) |
33,294 | 116,762 | 30,162 | 120,565 | ||||||||||||
| Net contractowner transfers |
(1,123,668 | ) | (189,727 | ) | (221,683 | ) | (151,359 | ) | ||||||||
| Withdrawals and death benefits (b) |
(941,050 | ) | (781,436 | ) | (633,372 | ) | (410,731 | ) | ||||||||
| Net increase (decrease) in net assets resulting
from |
(2,031,424 | ) | (854,401 | ) | (824,893 | ) | (441,525 | ) | ||||||||
| Net increase (decrease) in net assets |
736,096 | 3,197,939 | (273,209 | ) | 682,294 | |||||||||||
| NET ASSETS |
||||||||||||||||
| Beginning of period |
17,887,988 | 14,690,049 | 9,511,028 | 8,828,734 | ||||||||||||
| End of period |
$ | 18,624,084 | $ | 17,887,988 | $ | 9,237,819 | $ | 9,511,028 | ||||||||
| CHANGES IN ACCUMULATION UNITS OUTSTANDING: |
||||||||||||||||
| Beginning of period |
72,650 | 76,720 | 167,160 | 175,363 | ||||||||||||
| Units purchased |
120 | 525 | 509 | 2,400 | ||||||||||||
| Units sold/transferred |
(8,649 | ) | (4,595 | ) | (15,147 | ) | (10,603 | ) | ||||||||
| End of period |
64,121 | 72,650 | 152,522 | 167,160 | ||||||||||||
| (a) | Amounts presented are net of premium expense charges. |
| (b) | Amounts include payments for other daily and monthly fee and expense charges. |
| B-38 | Statement of Additional Information ∎ TIAA Separate Account VA-5 (formerly, TIAA-CREF Life Separate Account VA-1) | See notes to financial statements |
Table of Contents
| continued |
| Janus Henderson Overseas Portfolio- Institutional Shares Sub-Account |
John Hancock Disciplined Value Emerging Markets Equity Trust Sub-Account |
|||||||||||||||
| December 31, 2025 | December 31, 2024 | December 31, 2025 | December 31, 2024 | |||||||||||||
| FROM OPERATIONS |
||||||||||||||||
| Net investment income (loss) |
$ | 25,457 | $ | 23,017 | $ | 444,726 | $ | 1,668,289 | ||||||||
| Net realized gain (loss) |
46,164 | 75,505 | 3,619,958 | 1,152,330 | ||||||||||||
| Net change in unrealized appreciation (depreciation) on investments |
415,262 | 12,643 | 8,821,037 | (3,909,043 | ) | |||||||||||
| Net increase (decrease) in net assets from operations |
486,883 | 111,165 | 12,885,721 | (1,088,424 | ) | |||||||||||
| FROM CONTRACTOWNER TRANSACTIONS |
||||||||||||||||
| Premiums (a) |
6,010 | 68,308 | 382,163 | 455,579 | ||||||||||||
| Net contractowner transfers |
(26,784 | ) | (22,480 | ) | (1,621,699 | ) | 611,319 | |||||||||
| Withdrawals and death benefits (b) |
(86,984 | ) | (172,105 | ) | (2,576,287 | ) | (2,542,823 | ) | ||||||||
| Net increase (decrease) in net assets resulting
from |
(107,758 | ) | (126,277 | ) | (3,815,823 | ) | (1,475,925 | ) | ||||||||
| Net increase (decrease) in net assets |
379,125 | (15,112 | ) | 9,069,898 | (2,564,349 | ) | ||||||||||
| NET ASSETS |
||||||||||||||||
| Beginning of period |
1,747,062 | 1,762,174 | 41,740,720 | 44,305,069 | ||||||||||||
| End of period |
$ | 2,126,187 | $ | 1,747,062 | $ | 50,810,618 | $ | 41,740,720 | ||||||||
| CHANGES IN ACCUMULATION UNITS OUTSTANDING: |
||||||||||||||||
| Beginning of period |
18,943 | 20,213 | 1,219,860 | 1,259,506 | ||||||||||||
| Units purchased |
62 | 791 | 9,846 | 12,903 | ||||||||||||
| Units sold/transferred |
(1,096 | ) | (2,061 | ) | (106,066 | ) | (52,549 | ) | ||||||||
| End of period |
17,909 | 18,943 | 1,123,640 | 1,219,860 | ||||||||||||
| (a) | Amounts presented are net of premium expense charges. |
| (b) | Amounts include payments for other daily and monthly fee and expense charges. |
| See notes to financial statements | TIAA Separate Account VA-5 (formerly, TIAA-CREF Life Separate Account VA-1) ∎ Statement of Additional Information | B-39 |
Table of Contents
| Statements of Changes in Net Assets
TIAA Separate Account VA-5 (formerly, TIAA-CREF Life Separate Account VA-1) ∎ For the period or year ended |
| LVIP Fidelity Institutional AM® Total Bond—Standard Class Sub-Account |
Matson Money Fixed Income VI Portfolio Sub-Account |
|||||||||||||||
| December 31, 2025 | December 31, 2024 | December 31, 2025 | December 31, 2024 | |||||||||||||
| FROM OPERATIONS |
||||||||||||||||
| Net investment income (loss) |
$ | 2,420,156 | $ | 2,556,855 | $ | 726,824 | $ | 778,201 | ||||||||
| Net realized gain (loss) |
(1,465,422 | ) | (2,356,438 | ) | 232,025 | (121,778 | ) | |||||||||
| Net change in unrealized appreciation (depreciation) on investments |
2,931,536 | 949,490 | 75,608 | 170,638 | ||||||||||||
| Net increase (decrease) in net assets from operations |
3,886,270 | 1,149,907 | 1,034,457 | 827,061 | ||||||||||||
| FROM CONTRACTOWNER TRANSACTIONS |
||||||||||||||||
| Premiums (a) |
419,378 | 826,318 | 89,149 | 222,550 | ||||||||||||
| Net contractowner transfers |
(2,609,216 | ) | 1,305,776 | 1,327,126 | 1,016,581 | |||||||||||
| Withdrawals and death benefits (b) |
(4,609,553 | ) | (3,319,264 | ) | (2,730,298 | ) | (4,055,292 | ) | ||||||||
| Net increase (decrease) in net assets resulting
from |
(6,799,391 | ) | (1,187,170 | ) | (1,314,023 | ) | (2,816,161 | ) | ||||||||
| Net increase (decrease) in net assets |
(2,913,121 | ) | (37,263 | ) | (279,566 | ) | (1,989,100 | ) | ||||||||
| NET ASSETS |
||||||||||||||||
| Beginning of period |
63,465,734 | 63,502,997 | 24,032,812 | 26,021,912 | ||||||||||||
| End of period |
$ | 60,552,613 | $ | 63,465,734 | $ | 23,753,246 | $ | 24,032,812 | ||||||||
| CHANGES IN ACCUMULATION UNITS OUTSTANDING: |
||||||||||||||||
| Beginning of period |
3,482,244 | 3,561,191 | 899,427 | 1,013,933 | ||||||||||||
| Units purchased |
22,392 | 46,468 | 3,360 | 8,695 | ||||||||||||
| Units sold/transferred |
(388,987 | ) | (125,415 | ) | (54,894 | ) | (123,201 | ) | ||||||||
| End of period |
3,115,649 | 3,482,244 | 847,893 | 899,427 | ||||||||||||
| (a) | Amounts presented are net of premium expense charges. |
| (b) | Amounts include payments for other daily and monthly fee and expense charges. |
| B-40 | Statement of Additional Information ∎ TIAA Separate Account VA-5 (formerly, TIAA-CREF Life Separate Account VA-1) | See notes to financial statements |
Table of Contents
| continued |
| Matson Money International Equity VI Portfolio Sub-Account |
Matson Money U.S. Equity VI Portfolio Sub-Account |
|||||||||||||||
| December 31, 2025 | December 31, 2024 | December 31, 2025 | December 31, 2024 | |||||||||||||
| FROM OPERATIONS |
||||||||||||||||
| Net investment income (loss) |
$ | 631,079 | $ | 482,409 | $ | 233,939 | $ | 123,633 | ||||||||
| Net realized gain (loss) |
2,779,510 | 1,429,379 | 1,978,769 | 2,582,991 | ||||||||||||
| Net change in unrealized appreciation (depreciation) on investments |
3,170,630 | (937,515 | ) | 649,419 | 216,190 | |||||||||||
| Net increase (decrease) in net assets from operations |
6,581,219 | 974,273 | 2,862,127 | 2,922,814 | ||||||||||||
| FROM CONTRACTOWNER TRANSACTIONS |
||||||||||||||||
| Premiums (a) |
44,305 | 490,547 | 40,642 | 528,048 | ||||||||||||
| Net contractowner transfers |
(2,450,637 | ) | (882,539 | ) | 710,631 | (2,906,490 | ) | |||||||||
| Withdrawals and death benefits (b) |
(1,735,230 | ) | (1,625,986 | ) | (2,298,068 | ) | (2,368,166 | ) | ||||||||
| Net increase (decrease) in net assets resulting
from |
(4,141,562 | ) | (2,017,978 | ) | (1,546,795 | ) | (4,746,608 | ) | ||||||||
| Net increase (decrease) in net assets |
2,439,657 | (1,043,705 | ) | 1,315,332 | (1,823,794 | ) | ||||||||||
| NET ASSETS |
||||||||||||||||
| Beginning of period |
18,081,097 | 19,124,802 | 24,768,725 | 26,592,519 | ||||||||||||
| End of period |
$ | 20,520,754 | $ | 18,081,097 | $ | 26,084,057 | $ | 24,768,725 | ||||||||
| CHANGES IN ACCUMULATION UNITS OUTSTANDING: |
||||||||||||||||
| Beginning of period |
504,644 | 564,883 | 413,826 | 500,213 | ||||||||||||
| Units purchased |
1,130 | 13,801 | 710 | 9,587 | ||||||||||||
| Units sold/transferred |
(100,159 | ) | (74,040 | ) | (24,561 | ) | (95,974 | ) | ||||||||
| End of period |
405,615 | 504,644 | 389,975 | 413,826 | ||||||||||||
| (a) | Amounts presented are net of premium expense charges. |
| (b) | Amounts include payments for other daily and monthly fee and expense charges. |
| See notes to financial statements | TIAA Separate Account VA-5 (formerly, TIAA-CREF Life Separate Account VA-1) ∎ Statement of Additional Information | B-41 |
Table of Contents
| Statements of Changes in Net Assets
TIAA Separate Account VA-5 (formerly, TIAA-CREF Life Separate Account VA-1) ∎ For the period or year ended |
| MFS Global Equity Series-Initial Class Sub-Account |
MFS Growth Series-Initial Class Sub-Account |
|||||||||||||||
| December 31, 2025 | December 31, 2024 | December 31, 2025 | December 31, 2024 | |||||||||||||
| FROM OPERATIONS |
||||||||||||||||
| Net investment income (loss) |
$ | 30,791 | $ | 38,881 | $ | (1,705 | ) | $ | (1,555 | ) | ||||||
| Net realized gain (loss) |
773,228 | 319,615 | 241,243 | 105,359 | ||||||||||||
| Net change in unrealized appreciation (depreciation) on investments |
(261,725 | ) | (41,114 | ) | (88,588 | ) | 207,547 | |||||||||
| Net increase (decrease) in net assets from operations |
542,294 | 317,382 | 150,950 | 311,351 | ||||||||||||
| FROM CONTRACTOWNER TRANSACTIONS |
||||||||||||||||
| Premiums (a) |
3,592 | 3,944 | 1,022 | 2,980 | ||||||||||||
| Net contractowner transfers |
(691,828 | ) | (1,330,865 | ) | (5,348 | ) | (62,908 | ) | ||||||||
| Withdrawals and death benefits (b) |
(215,766 | ) | (321,417 | ) | (7,047 | ) | (5,036 | ) | ||||||||
| Net increase (decrease) in net assets resulting
from |
(904,002 | ) | (1,648,338 | ) | (11,373 | ) | (64,964 | ) | ||||||||
| Net increase (decrease) in net assets |
(361,708 | ) | (1,330,956 | ) | 139,577 | 246,387 | ||||||||||
| NET ASSETS |
||||||||||||||||
| Beginning of period |
4,582,934 | 5,913,890 | 1,258,438 | 1,012,051 | ||||||||||||
| End of period |
$ | 4,221,226 | $ | 4,582,934 | $ | 1,398,015 | $ | 1,258,438 | ||||||||
| CHANGES IN ACCUMULATION UNITS OUTSTANDING: |
||||||||||||||||
| Beginning of period |
97,805 | 133,415 | 7,267 | 7,673 | ||||||||||||
| Units purchased |
72 | 84 | 5 | 19 | ||||||||||||
| Units sold/transferred |
(18,541 | ) | (35,694 | ) | (67 | ) | (425 | ) | ||||||||
| End of period |
79,336 | 97,805 | 7,205 | 7,267 | ||||||||||||
| (a) | Amounts presented are net of premium expense charges. |
| (b) | Amounts include payments for other daily and monthly fee and expense charges. |
| B-42 | Statement of Additional Information ∎ TIAA Separate Account VA-5 (formerly, TIAA-CREF Life Separate Account VA-1) | See notes to financial statements |
Table of Contents
| continued |
| MFS Massachusetts Investors Growth Stock Portfolio Sub-Account |
MFS Utilities Series-Initial Class Sub-Account |
|||||||||||||||
| December 31, 2025 | December 31, 2024 | December 31, 2025 | December 31, 2024 | |||||||||||||
| FROM OPERATIONS |
||||||||||||||||
| Net investment income (loss) |
$ | 5,034 | $ | 9,644 | $ | 91,744 | $ | 69,009 | ||||||||
| Net realized gain (loss) |
1,599,740 | 1,133,543 | 84,264 | 64,709 | ||||||||||||
| Net change in unrealized appreciation (depreciation) on investments |
(646,119 | ) | 257,098 | 302,923 | 204,140 | |||||||||||
| Net increase (decrease) in net assets from operations |
958,655 | 1,400,285 | 478,931 | 337,858 | ||||||||||||
| FROM CONTRACTOWNER TRANSACTIONS |
||||||||||||||||
| Premiums (a) |
24,551 | 61,675 | 25,006 | 114,093 | ||||||||||||
| Net contractowner transfers |
(1,766,584 | ) | (1,544,123 | ) | (226,442 | ) | (83,719 | ) | ||||||||
| Withdrawals and death benefits (b) |
(550,407 | ) | (1,138,362 | ) | (169,178 | ) | (331,040 | ) | ||||||||
| Net increase (decrease) in net assets resulting
from |
(2,292,440 | ) | (2,620,810 | ) | (370,614 | ) | (300,666 | ) | ||||||||
| Net increase (decrease) in net assets |
(1,333,785 | ) | (1,220,525 | ) | 108,317 | 37,192 | ||||||||||
| NET ASSETS |
||||||||||||||||
| Beginning of period |
8,275,378 | 9,495,903 | 3,476,853 | 3,439,661 | ||||||||||||
| End of period |
$ | 6,941,593 | $ | 8,275,378 | $ | 3,585,170 | $ | 3,476,853 | ||||||||
| CHANGES IN ACCUMULATION UNITS OUTSTANDING: |
||||||||||||||||
| Beginning of period |
124,012 | 166,086 | 36,567 | 40,317 | ||||||||||||
| Units purchased |
356 | 970 | 263 | 1,260 | ||||||||||||
| Units sold/transferred |
(29,992 | ) | (43,044 | ) | (4,189 | ) | (5,010 | ) | ||||||||
| End of period |
94,376 | 124,012 | 32,641 | 36,567 | ||||||||||||
| (a) | Amounts presented are net of premium expense charges. |
| (b) | Amounts include payments for other daily and monthly fee and expense charges. |
| See notes to financial statements | TIAA Separate Account VA-5 (formerly, TIAA-CREF Life Separate Account VA-1) ∎ Statement of Additional Information | B-43 |
Table of Contents
| Statements of Changes in Net Assets
TIAA Separate Account VA-5 (formerly, TIAA-CREF Life Separate Account VA-1) ∎ For the period or year ended |
| Neuberger Berman Advisers Management Trust Mid Cap Intrinsic Value Portfolio–I Class Sub-Account |
Neuberger Berman Advisers Management Trust Sustainable Equity Portfolio–I Class Sub-Account |
|||||||||||||||
| December 31, 2025 | December 31, 2024 | December 31, 2025 | December 31, 2024 | |||||||||||||
| FROM OPERATIONS |
||||||||||||||||
| Net investment income (loss) |
$ | 95,834 | $ | 190,875 | $ | (3,578 | ) | $ | 2,130 | |||||||
| Net realized gain (loss) |
4,876,880 | 2,541,111 | 376,848 | 225,200 | ||||||||||||
| Net change in unrealized appreciation (depreciation) on investments |
129,794 | 1,093,642 | (39,899 | ) | 329,821 | |||||||||||
| Net increase (decrease) in net assets from operations |
5,102,508 | 3,825,628 | 333,371 | 557,151 | ||||||||||||
| FROM CONTRACTOWNER TRANSACTIONS |
||||||||||||||||
| Premiums (a) |
712,170 | 791,345 | 200,760 | 8,828 | ||||||||||||
| Net contractowner transfers |
(170,851 | ) | (1,352,606 | ) | (278,751 | ) | 52,803 | |||||||||
| Withdrawals and death benefits (b) |
(2,589,758 | ) | (2,545,211 | ) | (244,600 | ) | (140,795 | ) | ||||||||
| Net increase (decrease) in net assets resulting
from |
(2,048,439 | ) | (3,106,472 | ) | (322,591 | ) | (79,164 | ) | ||||||||
| Net increase (decrease) in net assets |
3,054,069 | 719,156 | 10,780 | 477,987 | ||||||||||||
| NET ASSETS |
||||||||||||||||
| Beginning of period |
45,778,274 | 45,059,118 | 2,734,773 | 2,256,786 | ||||||||||||
| End of period |
$ | 48,832,343 | $ | 45,778,274 | $ | 2,745,553 | $ | 2,734,773 | ||||||||
| CHANGES IN ACCUMULATION UNITS OUTSTANDING: |
||||||||||||||||
| Beginning of period |
1,010,271 | 1,086,132 | 35,448 | 36,932 | ||||||||||||
| Units purchased |
16,089 | 18,397 | 2,360 | 124 | ||||||||||||
| Units sold/transferred |
(65,135 | ) | (94,258 | ) | (6,529 | ) | (1,608 | ) | ||||||||
| End of period |
961,225 | 1,010,271 | 31,279 | 35,448 | ||||||||||||
| (a) | Amounts presented are net of premium expense charges. |
| (b) | Amounts include payments for other daily and monthly fee and expense charges. |
| B-44 | Statement of Additional Information ∎ TIAA Separate Account VA-5 (formerly, TIAA-CREF Life Separate Account VA-1) | See notes to financial statements |
Table of Contents
| continued |
| Nomura VIP International Core Equity Series—Standard Class Sub-Account |
Nomura VIP Small Cap Value Series- Standard Class Sub-Account |
|||||||||||||||
| December 31, 2025 | December 31, 2024 (c) | December 31, 2025 | December 31, 2024 | |||||||||||||
| FROM OPERATIONS |
||||||||||||||||
| Net investment income (loss) |
$ | 502,686 | $ | 458,145 | $ | 335,027 | $ | 353,736 | ||||||||
| Net realized gain (loss) |
3,345,970 | 191,792 | 2,254,386 | 2,625,327 | ||||||||||||
| Net change in unrealized appreciation (depreciation) on investments |
5,981,317 | (885,443 | ) | (84,759 | ) | 446,850 | ||||||||||
| Net increase (decrease) in net assets from operations |
9,829,973 | (235,506 | ) | 2,504,654 | 3,425,913 | |||||||||||
| FROM CONTRACTOWNER TRANSACTIONS |
||||||||||||||||
| Premiums (a) |
475,901 | 336,586 | 415,859 | 456,699 | ||||||||||||
| Net contractowner transfers |
(2,372,074 | ) | 43,471,587 | (119,721 | ) | (1,920,307 | ) | |||||||||
| Withdrawals and death benefits (b) |
(2,991,662 | ) | (1,493,340 | ) | (1,575,943 | ) | (2,101,543 | ) | ||||||||
| Net increase (decrease) in net assets resulting
from |
(4,887,835 | ) | 42,314,833 | (1,279,805 | ) | (3,565,151 | ) | |||||||||
| Net increase (decrease) in net assets |
4,942,138 | 42,079,327 | 1,224,849 | (139,238 | ) | |||||||||||
| NET ASSETS |
||||||||||||||||
| Beginning of period |
42,079,327 | — | 32,188,297 | 32,327,535 | ||||||||||||
| End of period |
$ | 47,021,465 | $ | 42,079,327 | $ | 33,413,146 | $ | 32,188,297 | ||||||||
| CHANGES IN ACCUMULATION UNITS OUTSTANDING: |
||||||||||||||||
| Beginning of period |
2,267,425 | — | 289,549 | 325,341 | ||||||||||||
| Units purchased |
22,024 | 17,516 | 3,805 | 4,368 | ||||||||||||
| Units sold/transferred |
(264,354 | ) | 2,249,909 | (16,885 | ) | (40,160 | ) | |||||||||
| End of period |
2,025,095 | 2,267,425 | 276,469 | 289,549 | ||||||||||||
| (a) | Amounts presented are net of premium expense charges. |
| (b) | Amounts include payments for other daily and monthly fee and expense charges. |
| (c) | For the period April 26, 2024 (commencement of operations) to December 31, 2024. |
| See notes to financial statements | TIAA Separate Account VA-5 (formerly, TIAA-CREF Life Separate Account VA-1) ∎ Statement of Additional Information | B-45 |
Table of Contents
| Statements of Changes in Net Assets
TIAA Separate Account VA-5 (formerly, TIAA-CREF Life Separate Account VA-1) ∎ For the period or year ended |
| PIMCO VIT All Asset Portfolio-Institutional Class Sub-Account |
PIMCO VIT Commodity Real Return Strategy Portfolio–Institutional Class Sub-Account |
|||||||||||||||
| December 31, 2025 | December 31, 2024 | December 31, 2025 | December 31, 2024 | |||||||||||||
| FROM OPERATIONS |
||||||||||||||||
| Net investment income (loss) |
$ | 191,277 | $ | 250,034 | $ | 64,053 | $ | 58,239 | ||||||||
| Net realized gain (loss) |
(278,316 | ) | (12,943 | ) | (83,236 | ) | (498,519 | ) | ||||||||
| Net change in unrealized appreciation (depreciation) on investments |
648,766 | (97,243 | ) | 423,219 | 549,066 | |||||||||||
| Net increase (decrease) in net assets from operations |
561,727 | 139,848 | 404,036 | 108,786 | ||||||||||||
| FROM CONTRACTOWNER TRANSACTIONS |
||||||||||||||||
| Premiums (a) |
28,654 | 55,587 | 18,100 | 27,030 | ||||||||||||
| Net contractowner transfers |
(353,691 | ) | (10,576 | ) | (630,723 | ) | (109,475 | ) | ||||||||
| Withdrawals and death benefits (b) |
(53,703 | ) | (30,503 | ) | (145,616 | ) | (326,853 | ) | ||||||||
| Net increase (decrease) in net assets resulting
from |
(378,740 | ) | 14,508 | (758,239 | ) | (409,298 | ) | |||||||||
| Net increase (decrease) in net assets |
182,987 | 154,356 | (354,203 | ) | (300,512 | ) | ||||||||||
| NET ASSETS |
||||||||||||||||
| Beginning of period |
3,933,486 | 3,779,130 | 2,625,460 | 2,925,972 | ||||||||||||
| End of period |
$ | 4,116,473 | $ | 3,933,486 | $ | 2,271,257 | $ | 2,625,460 | ||||||||
| CHANGES IN ACCUMULATION UNITS OUTSTANDING: |
||||||||||||||||
| Beginning of period |
154,219 | 154,064 | 110,703 | 128,717 | ||||||||||||
| Units purchased |
1,089 | 2,252 | 703 | 1,172 | ||||||||||||
| Units sold/transferred |
(13,973 | ) | (2,097 | ) | (30,953 | ) | (19,186 | ) | ||||||||
| End of period |
141,335 | 154,219 | 80,453 | 110,703 | ||||||||||||
| (a) | Amounts presented are net of premium expense charges. |
| (b) | Amounts include payments for other daily and monthly fee and expense charges. |
| B-46 | Statement of Additional Information ∎ TIAA Separate Account VA-5 (formerly, TIAA-CREF Life Separate Account VA-1) | See notes to financial statements |
Table of Contents
| continued |
| PIMCO VIT Emerging Markets Bond Portfolio-Institutional Class Sub-Account |
PIMCO VIT Global Bond Opportunities Portfolio (Unhedged)-Institutional Class Sub-Account |
|||||||||||||||
| December 31, 2025 | December 31, 2024 | December 31, 2025 | December 31, 2024 | |||||||||||||
| FROM OPERATIONS |
||||||||||||||||
| Net investment income (loss) |
$ | 2,993,758 | $ | 2,629,253 | $ | 286,163 | $ | 209,645 | ||||||||
| Net realized gain (loss) |
(1,070,919 | ) | (2,058,799 | ) | (112,231 | ) | (158,757 | ) | ||||||||
| Net change in unrealized appreciation (depreciation) on investments |
4,225,671 | 2,418,738 | 581,473 | (79,420 | ) | |||||||||||
| Net increase (decrease) in net assets from operations |
6,148,510 | 2,989,192 | 755,405 | (28,532 | ) | |||||||||||
| FROM CONTRACTOWNER TRANSACTIONS |
||||||||||||||||
| Premiums (a) |
1,153,927 | 1,079,334 | 9,893 | 103,592 | ||||||||||||
| Net contractowner transfers |
(667,451 | ) | (130,046 | ) | 186,002 | 508,117 | ||||||||||
| Withdrawals and death benefits (b) |
(2,574,916 | ) | (2,553,230 | ) | (205,063 | ) | (454,206 | ) | ||||||||
| Net increase (decrease) in net assets resulting
from |
(2,088,440 | ) | (1,603,942 | ) | (9,168 | ) | 157,503 | |||||||||
| Net increase (decrease) in net assets |
4,060,070 | 1,385,250 | 746,237 | 128,971 | ||||||||||||
| NET ASSETS |
||||||||||||||||
| Beginning of period |
42,714,782 | 41,329,532 | 6,044,018 | 5,915,047 | ||||||||||||
| End of period |
$ | 46,774,852 | $ | 42,714,782 | $ | 6,790,255 | $ | 6,044,018 | ||||||||
| CHANGES IN ACCUMULATION UNITS OUTSTANDING: |
||||||||||||||||
| Beginning of period |
1,248,931 | 1,301,874 | 313,622 | 305,766 | ||||||||||||
| Units purchased |
31,962 | 33,094 | 490 | 5,620 | ||||||||||||
| Units sold/transferred |
(95,466 | ) | (86,037 | ) | (1,870 | ) | 2,236 | |||||||||
| End of period |
1,185,427 | 1,248,931 | 312,242 | 313,622 | ||||||||||||
| (a) | Amounts presented are net of premium expense charges. |
| (b) | Amounts include payments for other daily and monthly fee and expense charges. |
| See notes to financial statements | TIAA Separate Account VA-5 (formerly, TIAA-CREF Life Separate Account VA-1) ∎ Statement of Additional Information | B-47 |
Table of Contents
| Statements of Changes in Net Assets
TIAA Separate Account VA-5 (formerly, TIAA-CREF Life Separate Account VA-1) ∎ For the period or year ended |
| PIMCO VIT Real Return Portfolio- Institutional Class Sub-Account |
PSF Natural Resources Portfolio–Class II Sub-Account |
|||||||||||||||
| December 31, 2025 | December 31, 2024 | December 31, 2025 (d) | December 31, 2024 | |||||||||||||
| FROM OPERATIONS |
||||||||||||||||
| Net investment income (loss) |
$ | 3,288,504 | $ | 2,513,227 | $ | (1,609 | ) | $ | (6,511 | ) | ||||||
| Net realized gain (loss) |
(2,681,199 | ) | (2,812,860 | ) | 170,000 | 242,264 | ||||||||||
| Net change in unrealized appreciation (depreciation) on investments |
7,000,080 | 2,307,950 | (343,758 | ) | (117,327 | ) | ||||||||||
| Net increase (decrease) in net assets from operations |
7,607,385 | 2,008,317 | (175,367 | ) | 118,426 | |||||||||||
| FROM CONTRACTOWNER TRANSACTIONS |
||||||||||||||||
| Premiums (a) |
1,050,258 | 952,802 | 5,134 | 60,614 | ||||||||||||
| Net contractowner transfers |
(152,500 | ) | 2,696,026 | (2,536,760 | ) | (77,529 | ) | |||||||||
| Withdrawals and death benefits (b) |
(6,078,059 | ) | (5,990,286 | ) | (101,907 | ) | (384,990 | ) | ||||||||
| Net increase (decrease) in net assets resulting
from |
(5,180,301 | ) | (2,341,458 | ) | (2,633,533 | ) | (401,905 | ) | ||||||||
| Net increase (decrease) in net assets |
2,427,084 | (333,141 | ) | (2,808,900 | ) | (283,479 | ) | |||||||||
| NET ASSETS |
||||||||||||||||
| Beginning of period |
100,867,086 | 101,200,227 | 2,808,900 | 3,092,379 | ||||||||||||
| End of period |
$ | 103,294,170 | $ | 100,867,086 | $ | — | $ | 2,808,900 | ||||||||
| CHANGES IN ACCUMULATION UNITS OUTSTANDING: |
||||||||||||||||
| Beginning of period |
4,872,457 | 5,005,829 | 41,754 | 47,820 | ||||||||||||
| Units purchased |
48,526 | 46,371 | 76 | 907 | ||||||||||||
| Units sold/transferred |
(312,674 | ) | (179,743 | ) | (41,830 | ) | (6,973 | ) | ||||||||
| End of period |
4,608,309 | 4,872,457 | — | 41,754 | ||||||||||||
| (a) | Amounts presented are net of premium expense charges. |
| (b) | Amounts include payments for other daily and monthly fee and expense charges. |
| (d) | PSF Natural Resources Portfolio merged into the PSF PGIM Jennison Blend Portfolio Fund Sub-Account on April 11, 2025. |
| B-48 | Statement of Additional Information ∎ TIAA Separate Account VA-5 (formerly, TIAA-CREF Life Separate Account VA-1) | See notes to financial statements |
Table of Contents
| continued |
| PSF PGIM Jennison Blend Portfolio—Class II Sub-Account |
PSF PGIM Jennison Value Portfolio–Class II Sub-Account |
|||||||||||||||
| December 31, 2025 (d) | December 31, 2024 | December 31, 2025 | December 31, 2024 | |||||||||||||
| FROM OPERATIONS |
||||||||||||||||
| Net investment income (loss) |
$ | (42,218 | ) | $ | (52,395 | ) | $ | (16,520 | ) | $ | (16,012 | ) | ||||
| Net realized gain (loss) |
1,459,021 | 2,328,893 | 641,593 | 497,291 | ||||||||||||
| Net change in unrealized appreciation (depreciation) on investments |
3,855,490 | 3,894,345 | 875,252 | 1,272,778 | ||||||||||||
| Net increase (decrease) in net assets from operations |
5,272,293 | 6,170,843 | 1,500,325 | 1,754,057 | ||||||||||||
| FROM CONTRACTOWNER TRANSACTIONS |
||||||||||||||||
| Premiums (a) |
108,868 | 171,653 | 27,894 | 105,079 | ||||||||||||
| Net contractowner transfers |
1,601,927 | (2,241,700 | ) | (491,146 | ) | (135,254 | ) | |||||||||
| Withdrawals and death benefits (b) |
(3,022,036 | ) | (1,750,272 | ) | (582,150 | ) | (342,179 | ) | ||||||||
| Net increase (decrease) in net assets resulting from contractowner transactions |
(1,311,241 | ) | (3,820,319 | ) | (1,045,402 | ) | (372,354 | ) | ||||||||
| Net increase (decrease) in net assets |
3,961,052 | 2,350,524 | 454,923 | 1,381,703 | ||||||||||||
| NET ASSETS |
||||||||||||||||
| Beginning of period |
27,852,778 | 25,502,254 | 10,168,208 | 8,786,505 | ||||||||||||
| End of period |
$ | 31,813,830 | $ | 27,852,778 | $ | 10,623,131 | $ | 10,168,208 | ||||||||
| CHANGES IN ACCUMULATION UNITS OUTSTANDING: |
||||||||||||||||
| Beginning of period |
352,315 | 411,599 | 121,398 | 126,232 | ||||||||||||
| Units purchased |
1,258 | 2,370 | 312 | 1,524 | ||||||||||||
| Units sold/transferred |
(12,795 | ) | (61,654 | ) | (12,572 | ) | (6,358 | ) | ||||||||
| End of period |
340,778 | 352,315 | 109,138 | 121,398 | ||||||||||||
| (a) | Amounts presented are net of premium expense charges. |
| (b) | Amounts include payments for other daily and monthly fee and expense charges. |
| (d) | PSF Natural Resources Portfolio merged into the PSF PGIM Jennison Blend Portfolio Fund Sub-Account on April 11, 2025. |
| See notes to financial statements | TIAA Separate Account VA-5 (formerly, TIAA-CREF Life Separate Account VA-1) ∎ Statement of Additional Information | B-49 |
Table of Contents
| Statements of Changes in Net Assets
TIAA Separate Account VA-5 (formerly, TIAA-CREF Life Separate Account VA-1) ∎ For the period or year ended |
| PVC Equity Income Account-Class 1 Sub-Account |
PVC MidCap Account–Class 1 Sub-Account |
|||||||||||||||
| December 31, 2025 | December 31, 2024 | December 31, 2025 | December 31, 2024 | |||||||||||||
| FROM OPERATIONS |
||||||||||||||||
| Net investment income (loss) |
$ | 1,655,248 | $ | 1,859,683 | $ | 13,756 | $ | 9,901 | ||||||||
| Net realized gain (loss) |
12,989,129 | 3,220,497 | 1,396,190 | 966,257 | ||||||||||||
| Net change in unrealized appreciation (depreciation) on investments |
449,107 | 9,404,882 | (1,223,214 | ) | 725,322 | |||||||||||
| Net increase (decrease) in net assets from operations |
15,093,484 | 14,485,062 | 186,732 | 1,701,480 | ||||||||||||
| FROM CONTRACTOWNER TRANSACTIONS |
||||||||||||||||
| Premiums (a) |
2,447,980 | 1,928,122 | 4,487 | 46,494 | ||||||||||||
| Net contractowner transfers |
(2,079,287 | ) | (6,190,886 | ) | (1,103,141 | ) | (172,554 | ) | ||||||||
| Withdrawals and death benefits (b) |
(6,606,284 | ) | (5,829,783 | ) | (545,686 | ) | (887,358 | ) | ||||||||
| Net increase (decrease) in net assets resulting
from |
(6,237,591 | ) | (10,092,547 | ) | (1,644,340 | ) | (1,013,418 | ) | ||||||||
| Net increase (decrease) in net assets |
8,855,893 | 4,392,515 | (1,457,608 | ) | 688,062 | |||||||||||
| NET ASSETS |
||||||||||||||||
| Beginning of period |
102,794,882 | 98,402,367 | 9,582,464 | 8,894,402 | ||||||||||||
| End of period |
$ | 111,650,775 | $ | 102,794,882 | $ | 8,124,856 | $ | 9,582,464 | ||||||||
| CHANGES IN ACCUMULATION UNITS OUTSTANDING: |
||||||||||||||||
| Beginning of period |
1,423,548 | 1,579,473 | 89,600 | 99,961 | ||||||||||||
| Units purchased |
32,850 | 28,849 | 41 | 469 | ||||||||||||
| Units sold/transferred |
(121,279 | ) | (184,774 | ) | (14,963 | ) | (10,830 | ) | ||||||||
| End of period |
1,335,119 | 1,423,548 | 74,678 | 89,600 | ||||||||||||
| (a) | Amounts presented are net of premium expense charges. |
| (b) | Amounts include payments for other daily and monthly fee and expense charges. |
| B-50 | Statement of Additional Information ∎ TIAA Separate Account VA-5 (formerly, TIAA-CREF Life Separate Account VA-1) | See notes to financial statements |
Table of Contents
| continued |
| Royce Capital Fund Micro-Cap Portfolio– Investment Class Sub-Account |
Royce Capital Fund Small-Cap Portfolio– Investment Class Sub-Account |
|||||||||||||||
| December 31, 2025 | December 31, 2024 | December 31, 2025 | December 31, 2024 | |||||||||||||
| FROM OPERATIONS |
||||||||||||||||
| Net investment income (loss) |
$ | (951 | ) | $ | (1,009 | ) | $ | 148,217 | $ | 92,608 | ||||||
| Net realized gain (loss) |
115,124 | (126,649 | ) | 815,415 | 721,452 | |||||||||||
| Net change in unrealized appreciation (depreciation) on investments |
(24,258 | ) | 193,383 | (200,166 | ) | (517,629 | ) | |||||||||
| Net increase (decrease) in net assets from operations |
89,915 | 65,725 | 763,466 | 296,431 | ||||||||||||
| FROM CONTRACTOWNER TRANSACTIONS |
||||||||||||||||
| Premiums (a) |
819 | 727 | 26,478 | 96,151 | ||||||||||||
| Net contractowner transfers |
5,724 | (282,137 | ) | 49,543 | (279,000 | ) | ||||||||||
| Withdrawals and death benefits (b) |
(6,399 | ) | (8,936 | ) | (577,920 | ) | (484,091 | ) | ||||||||
| Net increase (decrease) in net assets resulting
from |
144 | (290,346 | ) | (501,899 | ) | (666,940 | ) | |||||||||
| Net increase (decrease) in net assets |
90,059 | (224,621 | ) | 261,567 | (370,509 | ) | ||||||||||
| NET ASSETS |
||||||||||||||||
| Beginning of period |
648,823 | 873,444 | 8,872,905 | 9,243,414 | ||||||||||||
| End of period |
$ | 738,882 | $ | 648,823 | $ | 9,134,472 | $ | 8,872,905 | ||||||||
| CHANGES IN ACCUMULATION UNITS OUTSTANDING: |
||||||||||||||||
| Beginning of period |
17,156 | 26,176 | 280,861 | 303,056 | ||||||||||||
| Units purchased |
23 | 20 | 832 | 3,286 | ||||||||||||
| Units sold/transferred |
(65 | ) | (9,040 | ) | (15,783 | ) | (25,481 | ) | ||||||||
| End of period |
17,114 | 17,156 | 265,910 | 280,861 | ||||||||||||
| (a) | Amounts presented are net of premium expense charges. |
| (b) | Amounts include payments for other daily and monthly fee and expense charges. |
| See notes to financial statements | TIAA Separate Account VA-5 (formerly, TIAA-CREF Life Separate Account VA-1) ∎ Statement of Additional Information | B-51 |
Table of Contents
| Statements of Changes in Net Assets
TIAA Separate Account VA-5 (formerly, TIAA-CREF Life Separate Account VA-1) ∎ For the period or year ended |
| T. Rowe Price® Health Sciences Portfolio I Sub-Account |
T. Rowe Price® Limited-Term Bond Portfolio Sub-Account |
|||||||||||||||
| December 31, 2025 | December 31, 2024 | December 31, 2025 | December 31, 2024 | |||||||||||||
| FROM OPERATIONS |
||||||||||||||||
| Net investment income (loss) |
$ | (16,272 | ) | $ | (22,687 | ) | $ | 2,265,537 | $ | 2,059,143 | ||||||
| Net realized gain (loss) |
(60,141 | ) | 625,850 | (308,074 | ) | (435,064 | ) | |||||||||
| Net change in unrealized appreciation (depreciation) on investments |
1,061,418 | (482,913 | ) | 1,016,338 | 780,527 | |||||||||||
| Net increase (decrease) in net assets from operations |
985,005 | 120,250 | 2,973,801 | 2,404,606 | ||||||||||||
| FROM CONTRACTOWNER TRANSACTIONS |
||||||||||||||||
| Premiums (a) |
10,987 | 106,781 | 409,186 | 736,443 | ||||||||||||
| Net contractowner transfers |
(634,996 | ) | (231,123 | ) | 5,296,538 | 1,404,109 | ||||||||||
| Withdrawals and death benefits (b) |
(482,427 | ) | (406,302 | ) | (4,323,189 | ) | (3,627,868 | ) | ||||||||
| Net increase (decrease) in net assets resulting
from |
(1,106,436 | ) | (530,644 | ) | 1,382,535 | (1,487,316 | ) | |||||||||
| Net increase (decrease) in net assets |
(121,431 | ) | (410,394 | ) | 4,356,336 | 917,290 | ||||||||||
| NET ASSETS |
||||||||||||||||
| Beginning of period |
6,496,718 | 6,907,112 | 53,244,780 | 52,327,490 | ||||||||||||
| End of period |
$ | 6,375,287 | $ | 6,496,718 | $ | 57,601,116 | $ | 53,244,780 | ||||||||
| CHANGES IN ACCUMULATION UNITS OUTSTANDING: |
||||||||||||||||
| Beginning of period |
117,764 | 127,203 | 1,803,282 | 1,862,109 | ||||||||||||
| Units purchased |
185 | 1,978 | 13,529 | 25,509 | ||||||||||||
| Units sold/transferred |
(20,174 | ) | (11,417 | ) | 26,124 | (84,336 | ) | |||||||||
| End of period |
97,775 | 117,764 | 1,842,935 | 1,803,282 | ||||||||||||
| (a) | Amounts presented are net of premium expense charges. |
| (b) | Amounts include payments for other daily and monthly fee and expense charges. |
| B-52 | Statement of Additional Information ∎ TIAA Separate Account VA-5 (formerly, TIAA-CREF Life Separate Account VA-1) | See notes to financial statements |
Table of Contents
| continued |
| Templeton Developing Markets VIP Fund- Class 1 Sub-Account |
Vanguard VIF Balanced Portfolio Sub-Account |
|||||||||||||||
| December 31, 2025 | December 31, 2024 | December 31, 2025 | December 31, 2024 | |||||||||||||
| FROM OPERATIONS |
||||||||||||||||
| Net investment income (loss) |
$ | 184,558 | $ | 1,067,092 | $ | 89,762 | $ | 86,868 | ||||||||
| Net realized gain (loss) |
2,916,740 | (760,359 | ) | 696,729 | 208,908 | |||||||||||
| Net change in unrealized appreciation (depreciation) on investments |
10,567,877 | 1,698,333 | 28,604 | 339,929 | ||||||||||||
| Net increase (decrease) in net assets from operations |
13,669,175 | 2,005,066 | 815,095 | 635,705 | ||||||||||||
| FROM CONTRACTOWNER TRANSACTIONS |
||||||||||||||||
| Premiums (a) |
3,984,013 | 2,960,610 | 90,543 | 463,163 | ||||||||||||
| Net contractowner transfers |
(3,345,371 | ) | 42,212 | 1,161,308 | 528,303 | |||||||||||
| Withdrawals and death benefits (b) |
(1,690,813 | ) | (1,646,774 | ) | (928,006 | ) | (571,297 | ) | ||||||||
| Net increase (decrease) in net assets resulting
from |
(1,052,171 | ) | 1,356,048 | 323,845 | 420,169 | |||||||||||
| Net increase (decrease) in net assets |
12,617,004 | 3,361,114 | 1,138,940 | 1,055,874 | ||||||||||||
| NET ASSETS |
||||||||||||||||
| Beginning of period |
29,508,073 | 26,146,959 | 5,339,716 | 4,283,842 | ||||||||||||
| End of period |
$ | 42,125,077 | $ | 29,508,073 | $ | 6,478,656 | $ | 5,339,716 | ||||||||
| CHANGES IN ACCUMULATION UNITS OUTSTANDING: |
||||||||||||||||
| Beginning of period |
1,489,366 | 1,430,961 | 134,012 | 123,091 | ||||||||||||
| Units purchased |
169,201 | 157,134 | 2,083 | 11,827 | ||||||||||||
| Units sold/transferred |
(208,254 | ) | (98,729 | ) | 4,088 | (906 | ) | |||||||||
| End of period |
1,450,313 | 1,489,366 | 140,183 | 134,012 | ||||||||||||
| (a) | Amounts presented are net of premium expense charges. |
| (b) | Amounts include payments for other daily and monthly fee and expense charges. |
| See notes to financial statements | TIAA Separate Account VA-5 (formerly, TIAA-CREF Life Separate Account VA-1) ∎ Statement of Additional Information | B-53 |
Table of Contents
| Statements of Changes in Net Assets
TIAA Separate Account VA-5 (formerly, TIAA-CREF Life Separate Account VA-1) ∎ For the period or year ended |
| Vanguard VIF Capital Growth Portfolio Sub-Account |
Vanguard VIF Conservative Allocation Portfolio Sub-Account |
|||||||||||||||
| December 31, 2025 | December 31, 2024 | December 31, 2025 | December 31, 2024 | |||||||||||||
| FROM OPERATIONS |
||||||||||||||||
| Net investment income (loss) |
$ | 266,587 | $ | 205,203 | $ | 79,420 | $ | 72,191 | ||||||||
| Net realized gain (loss) |
3,379,580 | 1,371,135 | 162,841 | 47,536 | ||||||||||||
| Net change in unrealized appreciation (depreciation) on investments |
2,595,726 | 1,328,186 | 252,162 | 95,606 | ||||||||||||
| Net increase (decrease) in net assets from operations |
6,241,893 | 2,904,524 | 494,423 | 215,333 | ||||||||||||
| FROM CONTRACTOWNER TRANSACTIONS |
||||||||||||||||
| Premiums (a) |
349,542 | 132,092 | 934,986 | 507,616 | ||||||||||||
| Net contractowner transfers |
2,996,653 | 287,931 | 2,162,238 | 38,243 | ||||||||||||
| Withdrawals and death benefits (b) |
(397,141 | ) | (1,082,815 | ) | (807,053 | ) | (159,812 | ) | ||||||||
| Net increase (decrease) in net assets resulting
from |
2,949,054 | (662,792 | ) | 2,290,171 | 386,047 | |||||||||||
| Net increase (decrease) in net assets |
9,190,947 | 2,241,732 | 2,784,594 | 601,380 | ||||||||||||
| NET ASSETS |
||||||||||||||||
| Beginning of period |
23,056,672 | 20,814,940 | 3,495,630 | 2,894,250 | ||||||||||||
| End of period |
$ | 32,247,619 | $ | 23,056,672 | $ | 6,280,224 | $ | 3,495,630 | ||||||||
| CHANGES IN ACCUMULATION UNITS OUTSTANDING: |
||||||||||||||||
| Beginning of period |
290,824 | 297,751 | 112,043 | 99,421 | ||||||||||||
| Units purchased |
4,280 | 1,710 | 28,291 | 16,768 | ||||||||||||
| Units sold/transferred |
20,381 | (8,637 | ) | 38,574 | (4,146 | ) | ||||||||||
| End of period |
315,485 | 290,824 | 178,908 | 112,043 | ||||||||||||
| (a) | Amounts presented are net of premium expense charges. |
| (b) | Amounts include payments for other daily and monthly fee and expense charges. |
| B-54 | Statement of Additional Information ∎ TIAA Separate Account VA-5 (formerly, TIAA-CREF Life Separate Account VA-1) | See notes to financial statements |
Table of Contents
| continued |
| Vanguard VIF Equity Index Portfolio Sub-Account |
Vanguard VIF Global Bond Index Portfolio Sub-Account |
|||||||||||||||
| December 31, 2025 | December 31, 2024 | December 31, 2025 | December 31, 2024 | |||||||||||||
| FROM OPERATIONS |
||||||||||||||||
| Net investment income (loss) |
$ | 2,176,340 | $ | 2,140,884 | $ | 109,420 | $ | 92,339 | ||||||||
| Net realized gain (loss) |
14,075,237 | 38,175,221 | 27,716 | (17,428 | ) | |||||||||||
| Net change in unrealized appreciation (depreciation) on investments |
26,558,665 | 4,466,136 | 91,120 | (1,546 | ) | |||||||||||
| Net increase (decrease) in net assets from operations |
42,810,242 | 44,782,241 | 228,256 | 73,365 | ||||||||||||
| FROM CONTRACTOWNER TRANSACTIONS |
||||||||||||||||
| Premiums (a) |
20,861,091 | 11,092,133 | 51,729 | 317,492 | ||||||||||||
| Net contractowner transfers |
5,792,997 | 3,125,627 | 1,200,592 | 716,068 | ||||||||||||
| Withdrawals and death benefits (b) |
(5,065,559 | ) | (5,969,621 | ) | (143,201 | ) | (143,980 | ) | ||||||||
| Net increase (decrease) in net assets resulting
from |
21,588,529 | 8,248,139 | 1,109,120 | 889,580 | ||||||||||||
| Net increase (decrease) in net assets |
64,398,771 | 53,030,380 | 1,337,376 | 962,945 | ||||||||||||
| NET ASSETS |
||||||||||||||||
| Beginning of period |
233,019,610 | 179,989,230 | 3,971,267 | 3,008,322 | ||||||||||||
| End of period |
$ | 297,418,381 | $ | 233,019,610 | $ | 5,308,643 | $ | 3,971,267 | ||||||||
| CHANGES IN ACCUMULATION UNITS OUTSTANDING: |
||||||||||||||||
| Beginning of period |
2,736,629 | 2,645,123 | 168,998 | 130,284 | ||||||||||||
| Units purchased |
233,899 | 145,926 | 2,114 | 13,639 | ||||||||||||
| Units sold/transferred |
1,723 | (54,420 | ) | 43,002 | 25,075 | |||||||||||
| End of period |
2,972,251 | 2,736,629 | 214,114 | 168,998 | ||||||||||||
| (a) | Amounts presented are net of premium expense charges. |
| (b) | Amounts include payments for other daily and monthly fee and expense charges. |
| See notes to financial statements | TIAA Separate Account VA-5 (formerly, TIAA-CREF Life Separate Account VA-1) ∎ Statement of Additional Information | B-55 |
Table of Contents
| Statements of Changes in Net Assets
TIAA Separate Account VA-5 (formerly, TIAA-CREF Life Separate Account VA-1) ∎ For the period or year ended |
| Vanguard VIF High Yield Bond Portfolio Sub-Account |
Vanguard VIF International Portfolio Sub-Account |
|||||||||||||||
| December 31, 2025 | December 31, 2024 | December 31, 2025 | December 31, 2024 | |||||||||||||
| FROM OPERATIONS |
||||||||||||||||
| Net investment income (loss) |
$ | 3,748,694 | $ | 3,031,655 | $ | 27,062 | $ | 41,250 | ||||||||
| Net realized gain (loss) |
(683,159 | ) | (542,678 | ) | 560,303 | 358,445 | ||||||||||
| Net change in unrealized appreciation (depreciation) on investments |
2,145,717 | 926,661 | 217,123 | (12,606 | ) | |||||||||||
| Net increase (decrease) in net assets from operations |
5,211,252 | 3,415,638 | 804,488 | 387,089 | ||||||||||||
| FROM CONTRACTOWNER TRANSACTIONS |
||||||||||||||||
| Premiums (a) |
1,921,933 | 1,975,099 | 9,482 | 1,500 | ||||||||||||
| Net contractowner transfers |
1,795,626 | 993,980 | (330,263 | ) | 484,097 | |||||||||||
| Withdrawals and death benefits (b) |
(3,428,066 | ) | (3,722,318 | ) | (387,562 | ) | (727,461 | ) | ||||||||
| Net increase (decrease) in net assets resulting
from |
289,493 | (753,239 | ) | (708,343 | ) | (241,864 | ) | |||||||||
| Net increase (decrease) in net assets |
5,500,745 | 2,662,399 | 96,145 | 145,225 | ||||||||||||
| NET ASSETS |
||||||||||||||||
| Beginning of period |
59,397,612 | 56,735,213 | 4,280,492 | 4,135,267 | ||||||||||||
| End of period |
$ | 64,898,357 | $ | 59,397,612 | $ | 4,376,637 | $ | 4,280,492 | ||||||||
| CHANGES IN ACCUMULATION UNITS OUTSTANDING: |
||||||||||||||||
| Beginning of period |
1,547,772 | 1,569,524 | 116,403 | 122,291 | ||||||||||||
| Units purchased |
48,409 | 53,687 | 237 | 44 | ||||||||||||
| Units sold/transferred |
(49,448 | ) | (75,439 | ) | (17,256 | ) | (5,932 | ) | ||||||||
| End of period |
1,546,733 | 1,547,772 | 99,384 | 116,403 | ||||||||||||
| (a) | Amounts presented are net of premium expense charges. |
| (b) | Amounts include payments for other daily and monthly fee and expense charges. |
| B-56 | Statement of Additional Information ∎ TIAA Separate Account VA-5 (formerly, TIAA-CREF Life Separate Account VA-1) | See notes to financial statements |
Table of Contents
| continued |
| Vanguard VIF Mid-Cap Index Portfolio Sub-Account |
Vanguard VIF Moderate Allocation Portfolio Sub-Account |
|||||||||||||||
| December 31, 2025 | December 31, 2024 | December 31, 2025 | December 31, 2024 | |||||||||||||
| FROM OPERATIONS |
||||||||||||||||
| Net investment income (loss) |
$ | 965,488 | $ | 1,049,250 | $ | 121,600 | $ | 109,560 | ||||||||
| Net realized gain (loss) |
6,252,008 | 3,585,079 | 414,728 | 117,005 | ||||||||||||
| Net change in unrealized appreciation (depreciation) on investments |
3,695,562 | 8,789,784 | 389,008 | 291,163 | ||||||||||||
| Net increase (decrease) in net assets from operations |
10,913,058 | 13,424,113 | 925,336 | 517,728 | ||||||||||||
| FROM CONTRACTOWNER TRANSACTIONS |
||||||||||||||||
| Premiums (a) |
1,921,423 | 3,181,179 | 1,912,557 | 219,955 | ||||||||||||
| Net contractowner transfers |
(649,301 | ) | (5,781,326 | ) | 948,543 | 471,354 | ||||||||||
| Withdrawals and death benefits (b) |
(5,484,582 | ) | (5,752,581 | ) | (565,975 | ) | (640,551 | ) | ||||||||
| Net increase (decrease) in net assets resulting
from |
(4,212,460 | ) | (8,352,728 | ) | 2,295,125 | 50,758 | ||||||||||
| Net increase (decrease) in net assets |
6,700,598 | 5,071,385 | 3,220,461 | 568,486 | ||||||||||||
| NET ASSETS |
||||||||||||||||
| Beginning of period |
99,656,282 | 94,584,897 | 5,612,677 | 5,044,191 | ||||||||||||
| End of period |
$ | 106,356,880 | $ | 99,656,282 | $ | 8,833,138 | $ | 5,612,677 | ||||||||
| CHANGES IN ACCUMULATION UNITS OUTSTANDING: |
||||||||||||||||
| Beginning of period |
1,616,923 | 1,761,518 | 156,901 | 155,110 | ||||||||||||
| Units purchased |
30,861 | 55,083 | 47,802 | 6,156 | ||||||||||||
| Units sold/transferred |
(100,180 | ) | (199,678 | ) | 8,369 | (4,365 | ) | |||||||||
| End of period |
1,547,604 | 1,616,923 | 213,072 | 156,901 | ||||||||||||
| (a) | Amounts presented are net of premium expense charges. |
| (b) | Amounts include payments for other daily and monthly fee and expense charges. |
| See notes to financial statements | TIAA Separate Account VA-5 (formerly, TIAA-CREF Life Separate Account VA-1) ∎ Statement of Additional Information | B-57 |
Table of Contents
| Statements of Changes in Net Assets
TIAA Separate Account VA-5 (formerly, TIAA-CREF Life Separate Account VA-1) ∎ For the period or year ended |
| Vanguard VIF Real Estate Index Portfolio Sub-Account |
Vanguard VIF Small Company Growth Portfolio Sub-Account |
|||||||||||||||
| December 31, 2025 | December 31, 2024 | December 31, 2025 | December 31, 2024 | |||||||||||||
| FROM OPERATIONS |
||||||||||||||||
| Net investment income (loss) |
$ | 735,234 | $ | 1,005,669 | $ | 35,310 | $ | 52,787 | ||||||||
| Net realized gain (loss) |
(711,723 | ) | (1,926,695 | ) | 1,341,004 | (512,591 | ) | |||||||||
| Net change in unrealized appreciation (depreciation) on investments |
799,065 | 2,114,071 | (3,299 | ) | 2,418,265 | |||||||||||
| Net increase (decrease) in net assets from operations |
822,576 | 1,193,045 | 1,373,015 | 1,958,461 | ||||||||||||
| FROM CONTRACTOWNER TRANSACTIONS |
||||||||||||||||
| Premiums (a) |
839,013 | 471,046 | 177,566 | 251,052 | ||||||||||||
| Net contractowner transfers |
555,237 | (4,389,990 | ) | (4,109,979 | ) | 1,440,314 | ||||||||||
| Withdrawals and death benefits (b) |
(1,801,929 | ) | (3,777,169 | ) | (1,057,400 | ) | (1,471,642 | ) | ||||||||
| Net increase (decrease) in net assets resulting
from |
(407,679 | ) | (7,696,113 | ) | (4,989,813 | ) | 219,724 | |||||||||
| Net increase (decrease) in net assets |
414,897 | (6,503,068 | ) | (3,616,798 | ) | 2,178,185 | ||||||||||
| NET ASSETS |
||||||||||||||||
| Beginning of period |
29,759,906 | 36,262,974 | 24,078,047 | 21,899,862 | ||||||||||||
| End of period |
$ | 30,174,803 | $ | 29,759,906 | $ | 20,461,249 | $ | 24,078,047 | ||||||||
| CHANGES IN ACCUMULATION UNITS OUTSTANDING: |
||||||||||||||||
| Beginning of period |
742,714 | 944,727 | 413,596 | 418,320 | ||||||||||||
| Units purchased |
20,359 | 12,086 | 3,061 | 4,409 | ||||||||||||
| Units sold/transferred |
(33,009 | ) | (214,099 | ) | (85,751 | ) | (9,133 | ) | ||||||||
| End of period |
730,064 | 742,714 | 330,906 | 413,596 | ||||||||||||
| (a) | Amounts presented are net of premium expense charges. |
| (b) | Amounts include payments for other daily and monthly fee and expense charges. |
| B-58 | Statement of Additional Information ∎ TIAA Separate Account VA-5 (formerly, TIAA-CREF Life Separate Account VA-1) | See notes to financial statements |
Table of Contents
| continued |
| Vanguard VIF Total Bond Market Index Portfolio Sub-Account |
Vanguard VIF Total International Stock Market Index Portfolio Sub-Account |
|||||||||||||||
| December 31, 2025 | December 31, 2024 | December 31, 2025 | December 31, 2024 | |||||||||||||
| FROM OPERATIONS |
||||||||||||||||
| Net investment income (loss) |
$ | 9,501,264 | $ | 6,853,388 | $ | 560,724 | $ | 579,355 | ||||||||
| Net realized gain (loss) |
(9,136,583 | ) | (9,749,334 | ) | 1,355,917 | (435,457 | ) | |||||||||
| Net change in unrealized appreciation (depreciation) on investments |
19,421,865 | 5,463,476 | 4,544,502 | 902,613 | ||||||||||||
| Net increase (decrease) in net assets from operations |
19,786,546 | 2,567,530 | 6,461,143 | 1,046,511 | ||||||||||||
| FROM CONTRACTOWNER TRANSACTIONS |
||||||||||||||||
| Premiums (a) |
19,085,929 | 15,394,901 | 6,495,345 | 433,084 | ||||||||||||
| Net contractowner transfers |
19,699,502 | 18,338,192 | 980,766 | 2,471,215 | ||||||||||||
| Withdrawals and death benefits (b) |
(15,826,349 | ) | (21,440,046 | ) | (1,358,654 | ) | (6,512,144 | ) | ||||||||
| Net increase (decrease) in net assets resulting
from |
22,959,082 | 12,293,047 | 6,117,457 | (3,607,845 | ) | |||||||||||
| Net increase (decrease) in net assets |
42,745,628 | 14,860,577 | 12,578,600 | (2,561,334 | ) | |||||||||||
| NET ASSETS |
||||||||||||||||
| Beginning of period |
291,790,989 | 276,930,412 | 19,398,375 | 21,959,709 | ||||||||||||
| End of period |
$ | 334,536,617 | $ | 291,790,989 | $ | 31,976,975 | $ | 19,398,375 | ||||||||
| CHANGES IN ACCUMULATION UNITS OUTSTANDING: |
||||||||||||||||
| Beginning of period |
10,664,443 | 10,217,921 | 510,863 | 606,153 | ||||||||||||
| Units purchased |
681,335 | 574,626 | 136,344 | 11,298 | ||||||||||||
| Units sold/transferred |
92,439 | (128,104 | ) | (8,326 | ) | (106,588 | ) | |||||||||
| End of period |
11,438,217 | 10,664,443 | 638,881 | 510,863 | ||||||||||||
| (a) | Amounts presented are net of premium expense charges. |
| (b) | Amounts include payments for other daily and monthly fee and expense charges. |
| See notes to financial statements | TIAA Separate Account VA-5 (formerly, TIAA-CREF Life Separate Account VA-1) ∎ Statement of Additional Information | B-59 |
Table of Contents
| Statements of Changes in Net Assets
TIAA Separate Account VA-5 (formerly, TIAA-CREF Life Separate Account VA-1) ∎ For the period or year ended |
| Vanguard VIF Total Stock Market Index Portfolio Sub-Account |
VY CBRE Global Real Estate Portfolio– Class I Sub-Account |
|||||||||||||||
| December 31, 2025 | December 31, 2024 | December 31, 2025 | December 31, 2024 | |||||||||||||
| FROM OPERATIONS |
||||||||||||||||
| Net investment income (loss) |
$ | 295,470 | $ | 293,242 | $ | 224,630 | $ | 265,896 | ||||||||
| Net realized gain (loss) |
4,133,566 | 2,270,977 | (66,355 | ) | (120,014 | ) | ||||||||||
| Net change in unrealized appreciation (depreciation) on investments |
1,325,583 | 3,657,211 | 388,515 | (56,090 | ) | |||||||||||
| Net increase (decrease) in net assets from operations |
5,754,619 | 6,221,430 | 546,790 | 89,792 | ||||||||||||
| FROM CONTRACTOWNER TRANSACTIONS |
||||||||||||||||
| Premiums (a) |
23,300,191 | 1,001,589 | 49,061 | 112,831 | ||||||||||||
| Net contractowner transfers |
(1,568,202 | ) | 1,311,167 | (1,227,788 | ) | 1,057,975 | ||||||||||
| Withdrawals and death benefits (b) |
(1,327,028 | ) | (5,380,087 | ) | (404,497 | ) | (484,415 | ) | ||||||||
| Net increase (decrease) in net assets resulting
from |
20,404,961 | (3,067,331 | ) | (1,583,224 | ) | 686,391 | ||||||||||
| Net increase (decrease) in net assets |
26,159,580 | 3,154,099 | (1,036,434 | ) | 776,183 | |||||||||||
| NET ASSETS |
||||||||||||||||
| Beginning of period |
32,228,667 | 29,074,568 | 8,921,945 | 8,145,762 | ||||||||||||
| End of period |
$ | 58,388,247 | $ | 32,228,667 | $ | 7,885,511 | $ | 8,921,945 | ||||||||
| CHANGES IN ACCUMULATION UNITS OUTSTANDING: |
||||||||||||||||
| Beginning of period |
597,312 | 664,994 | 170,758 | 157,576 | ||||||||||||
| Units purchased |
376,411 | 19,090 | 881 | 2,078 | ||||||||||||
| Units sold/transferred |
(46,709 | ) | (86,772 | ) | (30,735 | ) | 11,104 | |||||||||
| End of period |
927,014 | 597,312 | 140,904 | 170,758 | ||||||||||||
| (a) | Amounts presented are net of premium expense charges. |
| (b) | Amounts include payments for other daily and monthly fee and expense charges. |
| B-60 | Statement of Additional Information ∎ TIAA Separate Account VA-5 (formerly, TIAA-CREF Life Separate Account VA-1) | See notes to financial statements |
Table of Contents
| concluded |
| Western Asset Variable Global High Yield Bond Portfolio–Class I Sub-Account |
||||||||
| December 31, 2025 | December 31, 2024 | |||||||
| FROM OPERATIONS |
||||||||
| Net investment income (loss) |
$ | 833,545 | $ | 774,275 | ||||
| Net realized gain (loss) |
(102,050 | ) | (738,333 | ) | ||||
| Net change in unrealized appreciation (depreciation) on investments |
455,007 | 789,152 | ||||||
| Net increase (decrease) in net assets from operations |
1,186,502 | 825,094 | ||||||
| FROM CONTRACTOWNER TRANSACTIONS |
||||||||
| Premiums (a) |
66,673 | 132,762 | ||||||
| Net contractowner transfers |
(224,317 | ) | (294,580 | ) | ||||
| Withdrawals and death benefits (b) |
(892,605 | ) | (688,318 | ) | ||||
| Net increase (decrease) in net assets resulting
from |
(1,050,249 | ) | (850,136 | ) | ||||
| Net increase (decrease) in net assets |
136,253 | (25,042 | ) | |||||
| NET ASSETS |
||||||||
| Beginning of period |
12,705,852 | 12,730,894 | ||||||
| End of period |
$ | 12,842,105 | $ | 12,705,852 | ||||
| CHANGES IN ACCUMULATION UNITS OUTSTANDING: |
||||||||
| Beginning of period |
593,299 | 647,013 | ||||||
| Units purchased |
2,927 | 6,428 | ||||||
| Units sold/transferred |
(52,225 | ) | (60,142 | ) | ||||
| End of period |
544,001 | 593,299 | ||||||
| (a) | Amounts presented are net of premium expense charges. |
| (b) | Amounts include payments for other daily and monthly fee and expense charges. |
| See notes to financial statements | TIAA Separate Account VA-5 (formerly, TIAA-CREF Life Separate Account VA-1) ∎ Statement of Additional Information | B-61 |
Table of Contents
TIAA Separate Account VA-5 (formerly, TIAA-CREF Life Separate Account VA-1)
Note 1 — organization and significant accounting policies
TIAA Separate Account VA-5, (the “Separate Account”) was established by TIAA-CREF Life Insurance Company (“TIAA-CREF Life”) as a separate investment account under New York law on July 27, 1998 and is registered with the Securities and Exchange Commission (“Commission”) as a unit investment trust under the Investment Company Act of 1940, as amended (“1940 Act”). Prior to January 1, 2026, the Separate Account was called TIAA-CREF Life Separate Account VA-1. TIAA-CREF Life, as a legal reserve life insurance company under the insurance laws of the State of New York, was a wholly owned subsidiary of Teachers Insurance and Annuity Association of America (“TIAA”).
On December 4, 2025, TIAA and its wholly owned subsidiary, TIAA-CREF Life, executed an Agreement and Plan of Merger. Effective at the close of business on December 31, 2025, following the receipt of all required regulatory approvals, TIAA-CREF Life merged with and into TIAA, with TIAA as the surviving entity.
Investors participate in the Separate Account by purchasing one of four different variable annuity contracts: the Personal Annuity Select (“PAS”), Single Premium Immediate Annuity (“SPIA”), the Lifetime Variable Select Annuity (the “Lifetime Contract”) and the Intelligent Variable Annuity (the “Intelligent VA,” and together with PAS, SPIA and the Lifetime Contract, the Contracts.) Premiums received from the Contracts are allocated to investment accounts, the (“Sub-Accounts”) that invest in non-proprietary funds or Nuveen Life Funds (collectively, the “Funds”). Nuveen Life Funds is an open-end management investment company registered with the Commission and managed by Teachers Advisors, LLC (the, “Adviser”), a wholly owned indirect subsidiary of TIAA. The Adviser is registered with the Commission as an investment adviser. PAS and SPIA currently offers 8 investment Sub-Account options, the Lifetime Contract currently offers 10 investment Sub-Account options and the Intelligent VA offer 74 investment Sub-Account options. Accumulation unit values are calculated daily for each investment account. None of the Contracts are available for sale to new customers. However, policy owners may continue to invest their premiums in the Sub-Accounts.
Accumulation and Annuity Funds: The Accumulation Fund represents the net assets attributable to participants in the accumulation phase of their investment. The Annuity Fund represents the net assets attributable to the participants currently receiving annuity payments. The net increase or decrease in net assets from investment operations is apportioned between the Sub-Accounts based upon their relative daily net asset values. Annuitants bear no mortality risk under their contracts. Initial annuity payments are calculated based on the total value of a participant’s accumulation units on the last valuation day before the annuity start date, the income option chosen, an assumed annual investment return and expense and mortality assumptions. Annuity payments vary after the initial payment based on investment performance and Sub-Account expenses.
Net assets allocated to contracts in the payout period are computed according to the Annuity 2000 Mortality Table with four year setbacks for contracts issued prior to 2015 and 2012 Individual Annuity Reserving for contracts issued after 2014. The 2012 IAR Mortality Table is used for determining the minimum standard of valuation for any individual annuity or pure endowment contract issued after January 1, 2015. The mortality risk is fully borne by TIAA Life and may result in additional amounts being transferred into the variable annuity account by TIAA to cover greater longevity of annuitants than expected. Conversely, if amounts allocated exceed amounts required, transfers may be made to TIAA.
Effective April 11, 2025, the PSF Natural Resources Portfolio Fund Sub-Account merged into PSF PGIM Jennison Blend Portfolio Fund Sub-Account.
Effective May 1, 2025, the following Fund names have changed (with a corresponding change to the Sub-Account name):
| Current Fund | New Fund | |
| LVIP Macquarie Diversified Income Fund—Standard Class |
LVIP Fidelity Institutional AM® Total Bond—Standard Class | |
Effective June 1, 2025, the following Fund names have changed (with a corresponding change to the Sub-Account name):
| Current Fund | New Fund | |
| Wanger Acorn Wanger International |
Columbia Variable Portfolio—Acorn Columbia Variable Portfolio—Acorn International | |
Effective December 1, 2025, the following Fund names have changed (with a corresponding change to the Sub-Account name):
| Current Fund | New Fund | |
| Macquarie VIP International Core Equity Series—Standard Macquarie VIP Small Cap Value Series—Standard Class |
Nomura VIP International Core Equity Series—Standard Class Nomura VIP Small Cap Value Series-Standard Class | |
| B-62 | Statement of Additional Information ∎ TIAA Separate Account VA-5 (formerly, TIAA-CREF Life Separate Account VA-1) |
Table of Contents
| continued |
The accompanying financial statements were prepared in accordance with accounting principles generally accepted in the United States of America (“U.S. GAAP”) which may require the use of estimates made by management and the evaluation of subsequent events. Actual results may differ from those estimates. The Separate Account is an investment company and follows the accounting guidance in the Financial Accounting Standards Board (“FASB”) Accounting Standards Codification 946, Financial Services-Investment Companies. The following is a summary of the significant accounting policies consistently followed by the Sub-Accounts.
Security valuation: All investments in securities are recorded at their estimated fair value as described in the valuation of investments note to the financial statements.
Investments and investment income: Security transactions are accounted for as of the trade date for financial reporting purposes. Dividend income and capital gain distributions are recorded on the ex-dividend date. Realized gains and losses on security transactions are based on the specific identification method.
Income taxes: The Separate Account is taxed as a life insurance company under Subchapter L of the Internal Revenue Code. The Separate Account should incur no federal income tax liability. Under the rules of taxation applicable to life insurance companies, the Separate Account’s Accumulation Fund for participants will generally be treated as life insurance reserves; therefore, any increase in such reserves will be deductible. The Separate Account files, as a component of the TIAA tax return, a U.S. Federal return. The Separate Account also files income tax returns in applicable state and local jurisdictions. The Separate Account’s federal income tax returns are generally subject to examination for a period of three fiscal years after filed. State and local tax returns may be subject to examination for an additional period of time depending on the jurisdiction. Management has analyzed the Separate Account’s tax positions taken for all open federal income tax years and has concluded that no provision for income tax is required in the Separate Account’s financial statements.
Segment Reporting: The Separate Account represents a single operating segment. Product Management of the Separate Account acts as the chief operating decision maker (“CODM”), as defined in U.S. GAAP. The CODM monitors the operating results of the Separate Account as a whole and is responsible for the Separate Account’s long-term strategic asset allocation in accordance with the terms of its prospectus, based on a defined investment strategy. The financial information in the form of the Separate Account’s Sub-Accounts, total returns, expense ratios and changes in net assets (i.e., changes in net assets resulting from operations, premiums and withdrawal and death benefits), which are used by the CODM to assess the segment’s performance and to make resource allocation decisions for the Separate Account’s single segment, is consistent with that presented within the Separate Account’s financial statements. Segment assets are reflected on the Statement of Assets and Liabilities as “total assets” and significant segment revenues and expenses are listed on the Statement of Operations.
Note 2—valuation of investments
U.S. GAAP establishes a hierarchy that categorizes market inputs to valuation methods. The three levels of inputs are:
| • | Level 1—quoted prices in active markets for identical securities |
| • | Level 2—other significant observable inputs (including quoted prices for similar securities, interest rates, credit spreads, etc.) |
| • | Level 3—significant unobservable inputs (including the Sub-Accounts’ own assumptions in determining the fair value of investments) |
The availability of observable inputs can vary from security to security and is affected by a wide variety of factors, including, for example the type of security, whether the security is new and not yet established in the marketplace, the liquidity of markets, and other characteristics particular to the security. To the extent that valuation is based on models or inputs that are less observable or unobservable in the market, the determination of fair value requires more judgment. Accordingly, the degree of judgment exercised in determining fair value is greatest for instruments categorized in Level 3. The inputs or methodology used for valuing securities are not necessarily an indication of the risk associated with investing in those securities.
A description of the valuation techniques applied to the Sub-Accounts’ investments follows:
Investments in registered investment companies: These investments are valued at their net asset value on the valuation date. These investments are categorized in Level 1 of the fair value hierarchy.
As of December 31, 2025, all of the investments in the Sub-Accounts were investments in registered investment companies and were valued based on Level 1 inputs.
| TIAA Separate Account VA-5 (formerly, TIAA-CREF Life Separate Account VA-1) ∎ Statement of Additional Information | B-63 |
Table of Contents
| Notes to financial statements |
TIAA Separate Account VA-5 (formerly, TIAA-CREF Life Separate Account VA-1)
Note 3—expense charges and affiliates
TIAA provides all administrative services for the Sub-Accounts. Daily charges are deducted from the net assets of the Sub-Accounts for services required to administer the Separate Account and the contracts, and to cover certain insurance risks borne by TIAA. The following are the current administrative expense charges for the contracts:
Administrative expense
(as a percentage of average account value)
| Intelligent Variable Annuity |
Personal Annuity Select |
Lifetime Variable Select |
||||||||||||||
| Maximum contractual fee |
0.30% | 0.20% | 0.20% | |||||||||||||
| Current fee |
0.10% | 0.20% | 0.20% | |||||||||||||
TIAA imposes a daily charge that is deducted from the net assets of the Sub-Accounts for bearing certain mortality and expense risks in connection with the contracts. The following are the mortality and expense risk charges for the contracts:
Mortality and expense risk charges
(as a percentage of average account value)
| Personal Annuity Select |
Lifetime Variable Select |
|||||||||||||||
| Maximum contractual fee |
1.00% | 1.00% | ||||||||||||||
| Current fee |
0.40% | 0.40% | ||||||||||||||
Intelligent Variable Annuity
| Maximum contractual fee |
Current fee |
|||||||||||||||
| If accumulation value is less than $100,000 |
0.40% | 0.40% | ||||||||||||||
| If accumulation value is between $100,000-$500,000 |
0.25% | 0.25% | ||||||||||||||
| If accumulation value is greater than $500,000 |
0.15% | 0.15% | ||||||||||||||
| After the first 10 contract years |
0.00% | 0.00% | ||||||||||||||
There are other daily, monthly, and annual fees and expenses that a contractowner will pay when buying, owning and surrendering the policy. These fees and expenses include as follows:
| Additional expense charges | Intelligent Variable Annuity |
Personal Annuity Select |
Lifetime Variable Select |
|||||||||||||
| Maximum annual contract fees (waived for accumulation values > $25,000) |
$ | 25 | $ | 0 | $ | 25 | ||||||||||
| Optional guaranteed minimum death benefit charge |
0.10% | None | None | |||||||||||||
| Premium taxes (a) |
0.00% to 3.50% | 0.00% to 3.50% | 0.00% to 3.50% | |||||||||||||
| Maximum transfer fee |
$ | 0 | $ | 0 | $ | 25 | ||||||||||
| (a) | Only applicable in certain states. |
The Sub-Accounts indirectly pay expenses of the underlying funds. With respect to investments in the Funds, these include management fees paid to the Adviser. The contracts are distributed by TIAA-CREF Individual & Institutional Services, LLC (“Services”), a subsidiary of TIAA. Services may also enter into selling agreements with third parties to distribute the contracts.
| B-64 | Statement of Additional Information ∎ TIAA Separate Account VA-5 (formerly, TIAA-CREF Life Separate Account VA-1) |
Table of Contents
| continued |
Note 4—investments
Purchases and sales of securities for the Sub-Accounts for the year ended December 31, 2025 were as follows:
| Sub-Accounts | Purchases | Sales | ||||||
| Nuveen Life Balanced |
$ | 25,764,592 | $ | 23,864,361 | ||||
| Nuveen Life Core Bond |
34,177,616 | 32,734,635 | ||||||
| Nuveen Life Core Equity |
32,957,984 | 27,786,879 | ||||||
| Nuveen Life Growth Equity |
20,499,254 | 30,246,242 | ||||||
| Nuveen Life International Equity |
27,062,125 | 25,121,396 | ||||||
| Nuveen Life Large Cap Responsible Equity |
16,058,426 | 13,012,046 | ||||||
| Nuveen Life Large Cap Value |
14,551,573 | 11,336,971 | ||||||
| Nuveen Life Money Market |
117,127,550 | 107,243,781 | ||||||
| Nuveen Life Real Estate Securities Select |
6,937,321 | 9,407,095 | ||||||
| Nuveen Life Small Cap Equity |
13,045,440 | 10,942,552 | ||||||
| Nuveen Life Stock Index |
93,153,216 | 119,218,401 | ||||||
| Calamos Growth and Income Portfolio |
554,970 | 524,424 | ||||||
| ClearBridge Variable Growth Portfolio-Class I |
15,397,463 | 13,673,407 | ||||||
| ClearBridge Variable Small Cap Growth Portfolio-Class I |
2,112,638 | 1,552,946 | ||||||
| Columbia Variable Portfolio—Acorn |
2,446,113 | 2,464,842 | ||||||
| Columbia Variable Portfolio—Acorn International |
1,349,530 | 1,892,646 | ||||||
| Credit Suisse Trust-Commodity Return Strategy Portfolio |
356,741 | 307,417 | ||||||
| Dimensional VA Equity Allocation Portfolio |
6,041,716 | 5,840,917 | ||||||
| Dimensional VA Global Bond Portfolio |
14,031,278 | 15,318,299 | ||||||
| Dimensional VA Global Moderate Allocation Portfolio |
12,781,429 | 11,944,216 | ||||||
| Dimensional VA International Small Portfolio |
16,013,863 | 20,673,500 | ||||||
| Dimensional VA International Value Portfolio |
30,103,046 | 37,014,657 | ||||||
| Dimensional VA Short-Term Fixed Portfolio |
19,551,046 | 20,461,591 | ||||||
| Dimensional VA US Large Value Portfolio |
16,756,132 | 19,333,654 | ||||||
| Dimensional VA US Targeted Value Portfolio |
13,842,260 | 10,522,155 | ||||||
| Franklin Income VIP Fund-Class 1 |
1,551,324 | 1,506,074 | ||||||
| Franklin Mutual Shares VIP Fund-Class 1 |
282,326 | 153,328 | ||||||
| Franklin Small-Mid Cap Growth VIP Fund-Class 1 |
3,331,965 | 2,955,684 | ||||||
| Janus Henderson Forty Portfolio-Institutional Shares |
6,272,132 | 6,309,861 | ||||||
| Janus Henderson Mid Cap Value Portfolio-Institutional Shares |
1,452,382 | 1,362,528 | ||||||
| Janus Henderson Overseas Portfolio-Institutional Shares |
34,860 | 117,161 | ||||||
| John Hancock Disciplined Value Emerging Markets Equity Trust |
12,739,642 | 16,110,739 | ||||||
| LVIP Fidelity Institutional AM® Total Bond—Standard Class |
6,813,889 | 11,193,124 | ||||||
| Matson Money Fixed Income VI Portfolio |
7,001,231 | 7,588,430 | ||||||
| Matson Money International Equity VI Portfolio |
5,886,230 | 8,372,226 | ||||||
| Matson Money U.S. Equity VI Portfolio |
7,849,275 | 7,608,660 | ||||||
| MFS Global Equity Series-Initial Class |
1,243,421 | 1,404,350 | ||||||
| MFS Growth Series-Initial Class |
238,894 | 14,069 | ||||||
| MFS Massachusetts Investors Growth Stock Portfolio |
4,757,943 | 5,997,118 | ||||||
| MFS Utilities Series-Initial Class |
651,377 | 885,141 | ||||||
| Neuberger Berman Advisers Management Trust Mid Cap Intrinsic Value Portfolio-I Class |
16,319,154 | 13,281,608 | ||||||
| Neuberger Berman Advisers Management Trust Sustainable Equity Portfolio-I Class |
457,812 | 629,294 | ||||||
| Nomura VIP International Core Equity Series—Standard Class |
11,053,982 | 13,198,056 | ||||||
| Nomura VIP Small Cap Value Series-Standard Class |
9,385,858 | 8,362,381 | ||||||
| PIMCO VIT All Asset Portfolio-Institutional Class |
1,466,114 | 1,653,577 | ||||||
| PIMCO VIT Commodity Real Return Strategy Portfolio-Institutional Class |
866,224 | 1,560,410 | ||||||
| PIMCO VIT Emerging Markets Bond Portfolio-Institutional Class |
13,656,813 | 12,751,495 | ||||||
| PIMCO VIT Global Bond Opportunities Portfolio (Unhedged)-Institutional Class |
1,628,947 | 1,351,952 | ||||||
| PIMCO VIT Real Return Portfolio-Institutional Class |
22,651,570 | 24,543,367 | ||||||
| PSF Natural Resources Portfolio-Class II |
153,404 | 2,788,546 | ||||||
| PSF PGIM Jennison Blend Portfolio—Class II |
4,809,788 | 6,163,247 | ||||||
| PSF PGIM Jennison Value Portfolio-Class II |
235,526 | 1,297,448 | ||||||
| PVC Equity Income Account-Class 1 |
29,115,205 | 23,671,610 | ||||||
| PVC MidCap Account-Class 1 |
1,529,769 | 2,146,101 | ||||||
| Royce Capital Fund Micro-Cap Portfolio-Investment Class |
222,588 | 113,229 | ||||||
| TIAA Separate Account VA-5 (formerly, TIAA-CREF Life Separate Account VA-1) ∎ Statement of Additional Information | B-65 |
Table of Contents
| Notes to financial statements |
TIAA Separate Account VA-5 (formerly, TIAA-CREF Life Separate Account VA-1)
| Sub-Accounts | Purchases | Sales | ||||||
| Royce Capital Fund Small-Cap Portfolio-Investment Class |
$ | 1,384,597 | $ | 1,116,876 | ||||
| T. Rowe Price® Health Sciences Portfolio I |
1,543,638 | 2,451,870 | ||||||
| T. Rowe Price® Limited-Term Bond Portfolio |
22,642,562 | 18,994,490 | ||||||
| Templeton Developing Markets VIP Fund-Class 1 |
10,538,814 | 10,812,014 | ||||||
| Vanguard VIF Balanced Portfolio |
3,566,837 | 2,696,599 | ||||||
| Vanguard VIF Capital Growth Portfolio |
19,794,228 | 15,214,240 | ||||||
| Vanguard VIF Conservative Allocation Portfolio |
4,532,358 | 2,053,536 | ||||||
| Vanguard VIF Equity Index Portfolio |
61,940,882 | 32,981,710 | ||||||
| Vanguard VIF Global Bond Index Portfolio |
2,230,284 | 1,004,478 | ||||||
| Vanguard VIF High Yield Bond Portfolio |
22,010,505 | 17,972,318 | ||||||
| Vanguard VIF International Portfolio |
2,256,241 | 2,670,734 | ||||||
| Vanguard VIF Mid-Cap Index Portfolio |
26,398,070 | 24,539,989 | ||||||
| Vanguard VIF Moderate Allocation Portfolio |
4,233,976 | 1,575,706 | ||||||
| Vanguard VIF Real Estate Index Portfolio |
10,876,693 | 10,020,479 | ||||||
| Vanguard VIF Small Company Growth Portfolio |
7,951,275 | 11,616,871 | ||||||
| Vanguard VIF Total Bond Market Index Portfolio |
96,174,745 | 63,714,399 | ||||||
| Vanguard VIF Total International Stock Market Index Portfolio |
13,272,257 | 6,213,732 | ||||||
| Vanguard VIF Total Stock Market Index Portfolio |
35,030,457 | 12,462,483 | ||||||
| VY CBRE Global Real Estate Portfolio-Class I |
2,356,040 | 3,714,634 | ||||||
| Western Asset Variable Global High Yield Bond Portfolio-Class I |
2,258,029 | 2,474,733 | ||||||
Note 5—condensed financial information
| For the period ended December 31 | ||||||||||||||||||||||||||||||||
| Period | Accumulation units outstanding, end of period (000’s) |
Accumulation unit value, beginning of
period |
Accumulation unit value, end of period lowest to highest |
Net assets, end of period |
Ratio of investment income to average net assets(c)(f) |
Ratio of to average net assets |
Total return(b)(h) | |||||||||||||||||||||||||
| Nuveen Life Balanced Sub-Account |
|
|||||||||||||||||||||||||||||||
| 2025 | 1,225 | $45.28 to $47.81 | $50.73 to $53.83 | $65,268 | 2.77% | 0.10% to 0.60% | 12.03% to 12.59% | |||||||||||||||||||||||||
| 2024 | 1,276 | $41.27 to $43.36 | $45.28 to $47.81 | $60,039 | 2.04% | 0.10% to 0.60% | 9.71% to 10.26% | |||||||||||||||||||||||||
| 2023 | 1,513 | $35.86 to $37.49 | $41.27 to $43.36 | $63,986 | 2.46% | 0.10% to 0.60% | 15.08% to 15.65% | |||||||||||||||||||||||||
| 2022 | 1,598 | $43.25 to $44.99 | $35.86 to $37.49 | $58,561 | 2.57% | 0.10% to 0.60% | (17.09)% to (16.67)% | |||||||||||||||||||||||||
| 2021 | 1,716 | $39.64 to $41.02 | $43.25 to $44.99 | $75,690 | 1.79% | 0.10% to 0.60% | 9.13% to 9.67% | |||||||||||||||||||||||||
| Nuveen Life Core Bond Sub-Account |
|
|||||||||||||||||||||||||||||||
| 2025 | 3,438 | $42.81 to $46.62 | $45.56 to $49.87 | $166,457 | 4.17% | 0.10% to 0.60% | 6.42% to 6.96% | |||||||||||||||||||||||||
| 2024 | 3,555 | $41.93 to $45.44 | $42.81 to $46.62 | $160,717 | 3.82% | 0.10% to 0.60% | 2.10% to 2.61% | |||||||||||||||||||||||||
| 2023 | 3,605 | $39.69 to $42.80 | $41.93 to $45.44 | $158,698 | 3.09% | 0.10% to 0.60% | 5.64% to 6.17% | |||||||||||||||||||||||||
| 2022 | 3,673 | $46.01 to $49.36 | $39.69 to $42.80 | $152,013 | 2.20% | 0.10% to 0.60% | (13.73)% to (13.30)% | |||||||||||||||||||||||||
| 2021 | 3,803 | $46.75 to $49.90 | $46.01 to $49.36 | $181,621 | 2.36% | 0.10% to 0.60% | (1.58)% to (1.08)% | |||||||||||||||||||||||||
| Nuveen Life Core Equity Sub-Account |
|
|||||||||||||||||||||||||||||||
| 2025 | 908 | $159.64 to $173.87 | $180.58 to $197.67 | $194,069 | 0.89% | 0.10% to 0.60% | 13.12% to 13.68% | |||||||||||||||||||||||||
| 2024 | 1,009 | $124.66 to $135.10 | $159.64 to $173.87 | $189,829 | 0.81% | 0.10% to 0.60% | 28.05% to 28.70% | |||||||||||||||||||||||||
| 2023 | 1,087 | $94.35 to $101.74 | $124.66 to $135.10 | $159,610 | 1.08% | 0.10% to 0.60% | 32.14% to 32.80% | |||||||||||||||||||||||||
| 2022 | 1,177 | $122.06 to $130.96 | $94.35 to $101.74 | $130,126 | 0.74% | 0.10% to 0.60% | (22.70)% to (22.32)% | |||||||||||||||||||||||||
| 2021 | 1,306 | $98.10 to $104.73 | $122.06 to $130.96 | $186,576 | 0.90% | 0.10% to 0.60% | 24.42% to 25.05% | |||||||||||||||||||||||||
| Nuveen Life Growth Equity Sub-Account |
|
|||||||||||||||||||||||||||||||
| 2025 | 1,131 | $112.15 to $122.18 | $128.53 to $140.73 | $165,725 | 0.08% | 0.10% to 0.60% | 14.61% to 15.19% | |||||||||||||||||||||||||
| 2024 | 1,240 | $87.96 to $95.35 | $112.15 to $122.18 | $156,888 | 0.25% | 0.10% to 0.60% | 27.49% to 28.14% | |||||||||||||||||||||||||
| 2023 | 1,299 | $60.43 to $65.18 | $87.96 to $95.35 | $129,554 | 0.26% | 0.10% to 0.60% | 45.55% to 46.28% | |||||||||||||||||||||||||
| 2022 | 1,380 | $90.63 to $97.27 | $60.43 to $65.18 | $94,184 | 0.00% | 0.10% to 0.60% | (33.32)% to (32.99)% | |||||||||||||||||||||||||
| 2021 | 1,448 | $78.49 to $83.82 | $90.63 to $97.27 | $146,562 | 0.28% | 0.10% to 0.60% | 15.47% to 16.05% | |||||||||||||||||||||||||
| Nuveen Life International Equity Sub-Account |
|
|||||||||||||||||||||||||||||||
| 2025 | 2,615 | $41.77 to $45.50 | $54.99 to $60.19 | $156,595 | 1.87% | 0.10% to 0.60% | 31.65% to 32.31% | |||||||||||||||||||||||||
| 2024 | 2,621 | $40.55 to $43.94 | $41.77 to $45.50 | $118,662 | 2.23% | 0.10% to 0.60% | 3.02% to 3.54% | |||||||||||||||||||||||||
| 2023 | 2,568 | $35.04 to $37.78 | $40.55 to $43.94 | $112,875 | 2.11% | 0.10% to 0.60% | 15.72% to 16.30% | |||||||||||||||||||||||||
| 2022 | 2,613 | $42.32 to $45.41 | $35.04 to $37.78 | $98,856 | 3.18% | 0.10% to 0.60% | (17.20)% to (16.79)% | |||||||||||||||||||||||||
| 2021 | 2,517 | $38.41 to $41.00 | $42.32 to $45.41 | $114,705 | 1.18% | 0.10% to 0.60% | 10.18% to 10.73% | |||||||||||||||||||||||||
| B-66 | Statement of Additional Information ∎ TIAA Separate Account VA-5 (formerly, TIAA-CREF Life Separate Account VA-1) |
Table of Contents
| continued |
| For the period ended December 31 | ||||||||||||||||||||||||||||||||
| Period | Accumulation units outstanding, end of period (000’s) |
Accumulation unit value, beginning of
period |
Accumulation unit value, end of period lowest to highest |
Net assets, end of period |
Ratio of investment income to average net assets(c)(f) |
Ratio of to average net assets |
Total return(b)(h) | |||||||||||||||||||||||||
| Nuveen Life Large Cap Responsible Equity Sub-Account |
|
|||||||||||||||||||||||||||||||
| 2025 | 549 | $136.59 to $148.75 | $158.35 to $173.31 | $98,963 | 1.16% | 0.10% to 0.60% | 15.93% to 16.51% | |||||||||||||||||||||||||
| 2024 | 600 | $116.43 to $126.16 | $136.59 to $148.75 | $93,187 | 1.45% | 0.10% to 0.60% | 17.31% to 17.90% | |||||||||||||||||||||||||
| 2023 | 646 | $95.68 to $103.17 | $116.43 to $126.16 | $84,876 | 1.39% | 0.10% to 0.60% | 21.68% to 22.29% | |||||||||||||||||||||||||
| 2022 | 681 | $117.15 to $125.68 | $95.68 to $103.17 | $73,492 | 1.23% | 0.10% to 0.60% | (18.32)% to (17.91)% | |||||||||||||||||||||||||
| 2021 | 748 | $93.27 to $99.57 | $117.15 to $125.68 | $97,583 | 1.17% | 0.10% to 0.60% | 25.60% to 26.23% | |||||||||||||||||||||||||
| Nuveen Life Large Cap Value Sub-Account |
|
|||||||||||||||||||||||||||||||
| 2025 | 360 | $155.89 to $169.78 | $181.66 to $198.84 | $78,896 | 1.45% | 0.10% to 0.60% | 16.53% to 17.12% | |||||||||||||||||||||||||
| 2024 | 382 | $136.64 to $148.07 | $155.89 to $169.78 | $70,118 | 1.55% | 0.10% to 0.60% | 14.08% to 14.66% | |||||||||||||||||||||||||
| 2023 | 433 | $120.26 to $129.67 | $136.64 to $148.07 | $68,976 | 1.67% | 0.10% to 0.60% | 13.62% to 14.19% | |||||||||||||||||||||||||
| 2022 | 483 | $130.23 to $139.72 | $120.26 to $129.67 | $66,549 | 1.27% | 0.10% to 0.60% | (7.65)% to (7.19)% | |||||||||||||||||||||||||
| 2021 | 540 | $103.28 to $110.25 | $130.23 to $139.72 | $79,163 | 1.49% | 0.10% to 0.60% | 26.09% to 26.72% | |||||||||||||||||||||||||
| Nuveen Life Money Market Sub-Account |
|
|||||||||||||||||||||||||||||||
| 2025 | 8,343 | $12.51 to $13.63 | $12.95 to $14.19 | $114,540 | 4.12% | 0.10% to 0.60% | 3.58% to 4.10% | |||||||||||||||||||||||||
| 2024 | 7,937 | $11.96 to $12.97 | $12.51 to $13.63 | $104,656 | 5.04% | 0.10% to 0.60% | 4.53% to 5.06% | |||||||||||||||||||||||||
| 2023 | 8,479 | $11.46 to $12.37 | $11.96 to $12.97 | $106,450 | 4.91% | 0.10% to 0.60% | 4.40% to 4.92% | |||||||||||||||||||||||||
| 2022 | 8,794 | $11.36 to $12.20 | $11.46 to $12.37 | $105,244 | 1.54% | 0.10% to 0.60% | 0.86% to 1.36% | |||||||||||||||||||||||||
| 2021 | 6,947 | $11.43 to $12.21 | $11.36 to $12.20 | $82,011 | 0.00% | 0.10% to 0.60% | (0.60)% to (0.10)% | |||||||||||||||||||||||||
| Nuveen Life Real Estate Securities Select Sub-Account |
|
|||||||||||||||||||||||||||||||
| 2025 | 304 | $150.14 to $163.52 | $152.02 to $166.39 | $53,755 | 2.79% | 0.10% to 0.60% | 1.25% to 1.76% | |||||||||||||||||||||||||
| 2024 | 331 | $144.16 to $156.22 | $150.14 to $163.52 | $58,158 | 2.81% | 0.10% to 0.60% | 4.15% to 4.67% | |||||||||||||||||||||||||
| 2023 | 383 | $129.47 to $139.60 | $144.16 to $156.22 | $63,670 | 2.59% | 0.10% to 0.60% | 11.35% to 11.90% | |||||||||||||||||||||||||
| 2022 | 441 | $182.49 to $195.79 | $129.47 to $139.60 | $64,943 | 1.51% | 0.10% to 0.60% | (29.05)% to (28.70)% | |||||||||||||||||||||||||
| 2021 | 483 | $131.58 to $140.46 | $182.49 to $195.79 | $98,462 | 1.64% | 0.10% to 0.60% | 38.69% to 39.39% | |||||||||||||||||||||||||
| Nuveen Life Small Cap Equity Sub-Account |
|
|||||||||||||||||||||||||||||||
| 2025 | 248 | $198.03 to $215.67 | $229.12 to $250.78 | $65,156 | 1.02% | 0.10% to 0.60% | 15.70% to 16.28% | |||||||||||||||||||||||||
| 2024 | 272 | $171.74 to $186.10 | $198.03 to $215.67 | $61,701 | 0.89% | 0.10% to 0.60% | 15.31% to 15.89% | |||||||||||||||||||||||||
| 2023 | 296 | $145.62 to $157.01 | $171.74 to $186.10 | $58,149 | 0.86% | 0.10% to 0.60% | 17.94% to 18.53% | |||||||||||||||||||||||||
| 2022 | 313 | $173.62 to $186.27 | $145.62 to $157.01 | $51,364 | 0.48% | 0.10% to 0.60% | (16.13)% to (15.71)% | |||||||||||||||||||||||||
| 2021 | 347 | $140.01 to $149.46 | $173.62 to $186.27 | $67,160 | 0.51% | 0.10% to 0.60% | 24.01% to 24.63% | |||||||||||||||||||||||||
| Nuveen Life Stock Index Sub-Account |
|
|||||||||||||||||||||||||||||||
| 2025 | 3,014 | $179.74 to $195.79 | $209.11 to $228.91 | $722,273 | 1.26% | 0.10% to 0.60% | 16.34% to 16.92% | |||||||||||||||||||||||||
| 2024 | 3,327 | $146.22 to $158.47 | $179.74 to $195.79 | $678,647 | 1.35% | 0.10% to 0.60% | 22.93% to 23.55% | |||||||||||||||||||||||||
| 2023 | 3,693 | $116.83 to $125.99 | $146.22 to $158.47 | $608,408 | 1.47% | 0.10% to 0.60% | 25.16% to 25.78% | |||||||||||||||||||||||||
| 2022 | 3,995 | $145.43 to $156.05 | $116.83 to $125.99 | $522,030 | 1.33% | 0.10% to 0.60% | (19.67)% to (19.26)% | |||||||||||||||||||||||||
| 2021 | 4,137 | $116.46 to $124.34 | $145.43 to $156.05 | $675,674 | 1.35% | 0.10% to 0.60% | 24.88% to 25.50% | |||||||||||||||||||||||||
| Calamos Growth and Income Portfolio Sub-Account |
|
|||||||||||||||||||||||||||||||
| 2025 | 87 | $55.19 to $56.14 | $64.66 to $65.84 | $5,673 | 0.30% | 0.10% to 0.20% | 17.16% to 17.28% | |||||||||||||||||||||||||
| 2024 | 94 | $45.67 to $46.41 | $55.19 to $56.14 | $5,223 | 0.38% | 0.10% to 0.20% | 20.84% to 20.96% | |||||||||||||||||||||||||
| 2023 | 98 | $38.10 to $38.68 | $45.67 to $46.41 | $4,525 | 0.57% | 0.10% to 0.20% | 19.88% to 20.00% | |||||||||||||||||||||||||
| 2022 | 106 | $44.59 to $47.84 | $38.10 to $38.68 | $4,062 | 0.69% | 0.10% to 0.20% | (19.23)% to (19.15)% | |||||||||||||||||||||||||
| 2021 | 110 | $36.95 to $39.44 | $44.59 to $47.84 | $5,212 | 0.37% | 0.10% to 0.59% | 20.67% to 21.28% | |||||||||||||||||||||||||
| ClearBridge Variable Growth Portfolio-Class I Sub-Account |
|
|||||||||||||||||||||||||||||||
| 2025 | 447 | $57.26 to $62.36 | $64.50 to $70.60 | $30,520 | 0.00% | 0.10% to 0.60% | 12.64% to 13.20% | |||||||||||||||||||||||||
| 2024 | 494 | $51.07 to $55.34 | $57.26 to $62.36 | $29,550 | 0.11% | 0.10% to 0.60% | 12.12% to 12.68% | |||||||||||||||||||||||||
| 2023 | 577 | $41.29 to $44.53 | $51.07 to $55.34 | $30,688 | 0.30% | 0.10% to 0.60% | 23.68% to 24.30% | |||||||||||||||||||||||||
| 2022 | 622 | $56.45 to $60.57 | $41.29 to $44.53 | $26,625 | 0.46% | 0.10% to 0.60% | (26.85)% to (26.49)% | |||||||||||||||||||||||||
| 2021 | 610 | $51.49 to $54.97 | $56.45 to $60.57 | $35,628 | 0.16% | 0.10% to 0.60% | 9.64% to 10.19% | |||||||||||||||||||||||||
| ClearBridge Variable Small Cap Growth Portfolio-Class I Sub-Account |
|
|||||||||||||||||||||||||||||||
| 2025 | 80 | $60.87 to $66.30 | $66.10 to $72.34 | $5,682 | 0.00% | 0.10% to 0.60% | 8.58% to 9.12% | |||||||||||||||||||||||||
| 2024 | 77 | $58.60 to $63.50 | $60.87 to $66.30 | $5,018 | 0.00% | 0.10% to 0.60% | 3.87% to 4.40% | |||||||||||||||||||||||||
| 2023 | 87 | $54.39 to $58.64 | $58.60 to $63.50 | $5,342 | 0.00% | 0.10% to 0.60% | 7.45% to 8.72% | |||||||||||||||||||||||||
| 2022 | 94 | $76.89 to $82.50 | $54.39 to $58.64 | $5,352 | 0.00% | 0.10% to 0.60% | (29.27)% to (28.92)% | |||||||||||||||||||||||||
| 2021 | 95 | $68.69 to $73.33 | $76.89 to $82.50 | $7,604 | 0.00% | 0.10% to 0.60% | 11.94% to 12.50% | |||||||||||||||||||||||||
| TIAA Separate Account VA-5 (formerly, TIAA-CREF Life Separate Account VA-1) ∎ Statement of Additional Information | B-67 |
Table of Contents
| Notes to financial statements |
TIAA Separate Account VA-5 (formerly, TIAA-CREF Life Separate Account VA-1)
| For the period ended December 31 | ||||||||||||||||||||||||||||||||
| Period | Accumulation units outstanding, end of period (000’s) |
Accumulation unit value, beginning of
period |
Accumulation unit value, end of period lowest to highest |
Net assets, end of period |
Ratio of investment income to average net assets(c)(f) |
Ratio of to average net assets |
Total return(b)(h) | |||||||||||||||||||||||||
| Columbia Variable Portfolio—Acorn Sub-Account |
|
|||||||||||||||||||||||||||||||
| 2025 | 54 | $122.79 to $133.73 | $127.51 to $139.56 | $7,380 | 0.00% | 0.10% to 0.60% | 3.84% to 4.36% | |||||||||||||||||||||||||
| 2024 | 54 | $108.19 to $117.24 | $122.79 to $133.73 | $7,057 | 0.00% | 0.10% to 0.60% | 13.49% to 14.06% | |||||||||||||||||||||||||
| 2023 | 53 | $89.41 to $96.40 | $108.19 to $117.24 | $6,014 | 0.00% | 0.10% to 0.60% | 21.01% to 21.61% | |||||||||||||||||||||||||
| 2022 | 36 | $135.18 to $145.03 | $89.41 to $96.40 | $3,369 | 0.00% | 0.10% to 0.60% | (33.86)% to (33.53)% | |||||||||||||||||||||||||
| 2021 | 26 | $124.88 to $133.31 | $135.18 to $145.03 | $3,723 | 0.83% | 0.10% to 0.60% | 8.25% to 8.79% | |||||||||||||||||||||||||
| Columbia Variable Portfolio—Acorn International Sub-Account |
|
|||||||||||||||||||||||||||||||
| 2025 | 143 | $66.49 to $72.42 | $75.89 to $81.57 | $11,548 | 1.26% | 0.10% to 0.50% | 12.19% to 12.64% | |||||||||||||||||||||||||
| 2024 | 152 | $72.91 to $79.01 | $66.49 to $72.42 | $10,921 | 1.38% | 0.10% to 0.60% | (8.80)% to (8.34)% | |||||||||||||||||||||||||
| 2023 | 158 | $62.71 to $67.62 | $72.91 to $79.01 | $12,273 | 0.32% | 0.10% to 0.60% | 16.26% to 17.43% | |||||||||||||||||||||||||
| 2022 | 166 | $95.37 to $102.32 | $62.71 to $67.62 | $10,951 | 0.91% | 0.10% to 0.60% | (34.24)% to (33.91)% | |||||||||||||||||||||||||
| 2021 | 158 | $80.75 to $86.21 | $95.37 to $102.32 | $15,733 | 0.55% | 0.10% to 0.60% | 18.10% to 18.69% | |||||||||||||||||||||||||
| Credit Suisse Trust-Commodity Return Strategy Portfolio Sub-Account |
|
|||||||||||||||||||||||||||||||
| 2025 | 23 | $21.98 to $23.24 | $25.20 to $26.78 | $600 | 3.56% | 0.10% to 0.60% | 7.11% to 15.24% | |||||||||||||||||||||||||
| 2024 | 22 | $21.09 to $22.19 | $21.98 to $23.24 | $493 | 2.94% | 0.10% to 0.60% | 4.20% to 4.72% | |||||||||||||||||||||||||
| 2023 | 26 | $23.35 to $24.44 | $21.09 to $22.19 | $561 | 19.61% | 0.10% to 0.60% | (9.66)% to (9.21)% | |||||||||||||||||||||||||
| 2022 | 42 | $20.24 to $21.09 | $23.35 to $24.44 | $999 | 13.80% | 0.10% to 0.60% | 2.64% to 15.91% | |||||||||||||||||||||||||
| 2021 | 27 | $15.92 to $16.50 | $20.24 to $21.09 | $561 | 5.83% | 0.10% to 0.60% | (4.92)% to 27.77% | |||||||||||||||||||||||||
| Dimensional VA Equity Allocation Portfolio Sub-Account |
|
|||||||||||||||||||||||||||||||
| 2025 | 293 | $49.65 to $51.54 | $59.20 to $61.76 | $17,914 | 2.10% | 0.10% to 0.60% | 19.23% to 19.82% | |||||||||||||||||||||||||
| 2024 | 300 | $43.40 to $44.83 | $49.65 to $51.54 | $15,240 | 2.04% | 0.10% to 0.60% | 14.41% to 14.98% | |||||||||||||||||||||||||
| 2023 | 258 | $36.34 to $37.35 | $43.40 to $44.83 | $11,403 | 2.17% | 0.10% to 0.60% | 19.43% to 20.03% | |||||||||||||||||||||||||
| 2022 | 291 | $42.35 to $43.31 | $36.34 to $37.35 | $10,751 | 1.74% | 0.10% to 0.60% | (14.20)% to (13.77)% | |||||||||||||||||||||||||
| 2021 | 315 | $34.26 to $34.86 | $42.35 to $43.31 | $13,516 | 1.34% | 0.10% to 0.60% | 8.04% to 24.25% | |||||||||||||||||||||||||
| Dimensional VA Global Bond Portfolio Sub-Account |
|
|||||||||||||||||||||||||||||||
| 2025 | 1,742 | $28.44 to $30.30 | $29.50 to $31.59 | $53,894 | 4.03% | 0.10% to 0.60% | 3.73% to 4.25% | |||||||||||||||||||||||||
| 2024 | 1,860 | $27.15 to $28.78 | $28.44 to $30.30 | $55,055 | 4.71% | 0.10% to 0.60% | 4.75% to 5.28% | |||||||||||||||||||||||||
| 2023 | 2,003 | $26.00 to $27.42 | $27.15 to $28.78 | $56,351 | 4.05% | 0.10% to 0.60% | 4.43% to 4.95% | |||||||||||||||||||||||||
| 2022 | 1,999 | $27.93 to $29.31 | $26.00 to $27.42 | $53,594 | 1.57% | 0.10% to 0.60% | (6.89)% to (6.43)% | |||||||||||||||||||||||||
| 2021 | 2,102 | $28.39 to $29.65 | $27.93 to $29.31 | $60,366 | 0.72% | 0.10% to 0.60% | (1.63)% to (1.14)% | |||||||||||||||||||||||||
| Dimensional VA Global Moderate Allocation Portfolio Sub-Account |
|
|||||||||||||||||||||||||||||||
| 2025 | 940 | $48.47 to $51.25 | $55.25 to $58.72 | $53,965 | 2.66% | 0.10% to 0.60% | 14.00% to 14.57% | |||||||||||||||||||||||||
| 2024 | 962 | $43.54 to $45.81 | $48.47 to $51.25 | $48,154 | 2.75% | 0.10% to 0.60% | 11.32% to 11.88% | |||||||||||||||||||||||||
| 2023 | 989 | $38.18 to $39.97 | $43.54 to $45.81 | $44,285 | 2.77% | 0.10% to 0.60% | 14.04% to 14.61% | |||||||||||||||||||||||||
| 2022 | 987 | $43.14 to $44.93 | $38.18 to $39.97 | $38,556 | 1.44% | 0.10% to 0.60% | (11.49)% to (11.05)% | |||||||||||||||||||||||||
| 2021 | 1,034 | $38.00 to $39.38 | $43.14 to $44.93 | $45,573 | 1.50% | 0.10% to 0.60% | 13.52% to 14.09% | |||||||||||||||||||||||||
| Dimensional VA International Small Portfolio Sub-Account |
|
|||||||||||||||||||||||||||||||
| 2025 | 732 | $51.78 to $55.17 | $70.51 to $75.50 | $53,944 | 3.30% | 0.10% to 0.60% | 36.17% to 36.85% | |||||||||||||||||||||||||
| 2024 | 868 | $50.18 to $53.20 | $51.78 to $55.17 | $46,603 | 3.38% | 0.10% to 0.60% | 3.19% to 3.71% | |||||||||||||||||||||||||
| 2023 | 931 | $44.24 to $46.66 | $50.18 to $53.20 | $48,213 | 3.14% | 0.10% to 0.60% | 13.43% to 14.00% | |||||||||||||||||||||||||
| 2022 | 994 | $54.04 to $56.72 | $44.24 to $46.66 | $45,208 | 2.61% | 0.10% to 0.60% | (18.14)% to (17.73)% | |||||||||||||||||||||||||
| 2021 | 972 | $47.46 to $49.56 | $54.04 to $56.72 | $53,870 | 2.56% | 0.10% to 0.60% | 13.88% to 14.45% | |||||||||||||||||||||||||
| Dimensional VA International Value Portfolio Sub-Account |
|
|||||||||||||||||||||||||||||||
| 2025 | 1,632 | $49.12 to $52.33 | $71.10 to $76.13 | $121,192 | 4.33% | 0.10% to 0.60% | 44.77% to 45.49% | |||||||||||||||||||||||||
| 2024 | 1,876 | $46.34 to $49.13 | $49.12 to $52.33 | $95,595 | 3.89% | 0.10% to 0.60% | 5.98% to 6.52% | |||||||||||||||||||||||||
| 2023 | 2,056 | $39.56 to $41.72 | $46.34 to $49.13 | $98,454 | 4.71% | 0.10% to 0.60% | 17.16% to 17.74% | |||||||||||||||||||||||||
| 2022 | 2,291 | $41.22 to $43.26 | $39.56 to $41.72 | $93,246 | 3.89% | 0.10% to 0.60% | (4.03)% to (3.55)% | |||||||||||||||||||||||||
| 2021 | 2,398 | $35.11 to $36.66 | $41.22 to $43.26 | $101,463 | 3.98% | 0.10% to 0.60% | 17.41% to 18.00% | |||||||||||||||||||||||||
| Dimensional VA Short-Term Fixed Portfolio Sub-Account |
|
|||||||||||||||||||||||||||||||
| 2025 | 2,607 | $27.29 to $29.07 | $28.30 to $30.30 | $77,126 | 4.14% | 0.10% to 0.60% | 3.71% to 4.23% | |||||||||||||||||||||||||
| 2024 | 2,752 | $26.03 to $27.59 | $27.29 to $29.07 | $77,959 | 4.78% | 0.10% to 0.60% | 4.85% to 5.38% | |||||||||||||||||||||||||
| 2023 | 2,931 | $24.94 to $26.31 | $26.03 to $27.59 | $78,804 | 3.74% | 0.10% to 0.60% | 4.36% to 4.88% | |||||||||||||||||||||||||
| 2022 | 3,027 | $25.38 to $26.64 | $24.94 to $26.31 | $77,670 | 1.27% | 0.10% to 0.60% | (1.75)% to (1.25)% | |||||||||||||||||||||||||
| 2021 | 3,235 | $25.58 to $26.72 | $25.38 to $26.64 | $84,242 | 0.01% | 0.10% to 0.60% | (0.79)% to (0.29)% | |||||||||||||||||||||||||
| B-68 | Statement of Additional Information ∎ TIAA Separate Account VA-5 (formerly, TIAA-CREF Life Separate Account VA-1) |
Table of Contents
| continued |
| For the period ended December 31 | ||||||||||||||||||||||||||||||||
| Period | Accumulation units outstanding, end of period (000’s) |
Accumulation unit value, beginning of
period |
Accumulation unit value, end of period lowest to highest |
Net assets, end of period |
Ratio of investment income to average net assets(c)(f) |
Ratio of to average net assets |
Total return(b)(h) | |||||||||||||||||||||||||
| Dimensional VA US Large Value Portfolio Sub-Account |
|
|||||||||||||||||||||||||||||||
| 2025 | 710 | $87.90 to $93.64 | $101.20 to $108.35 | $75,085 | 1.87% | 0.10% to 0.60% | 15.13% to 15.71% | |||||||||||||||||||||||||
| 2024 | 794 | $77.99 to $82.67 | $87.90 to $93.64 | $72,530 | 2.00% | 0.10% to 0.60% | 12.70% to 13.27% | |||||||||||||||||||||||||
| 2023 | 898 | $70.73 to $74.61 | $77.99 to $82.67 | $72,395 | 2.31% | 0.10% to 0.60% | 10.26% to 10.81% | |||||||||||||||||||||||||
| 2022 | 919 | $74.81 to $78.51 | $70.73 to $74.61 | $66,871 | 2.19% | 0.10% to 0.60% | (5.45)% to (4.97)% | |||||||||||||||||||||||||
| 2021 | 962 | $59.24 to $61.86 | $74.81 to $78.51 | $73,868 | 1.76% | 0.10% to 0.60% | 26.28% to 26.91% | |||||||||||||||||||||||||
| Dimensional VA US Targeted Value Portfolio Sub-Account |
|
|||||||||||||||||||||||||||||||
| 2025 | 479 | $93.20 to $99.30 | $100.93 to $108.07 | $50,606 | 1.85% | 0.10% to 0.60% | 8.29% to 8.84% | |||||||||||||||||||||||||
| 2024 | 494 | $86.71 to $91.92 | $93.20 to $99.30 | $47,928 | 1.38% | 0.10% to 0.60% | 7.49% to 8.03% | |||||||||||||||||||||||||
| 2023 | 564 | $72.67 to $76.65 | $86.71 to $91.92 | $50,645 | 1.60% | 0.10% to 0.60% | 19.32% to 19.91% | |||||||||||||||||||||||||
| 2022 | 596 | $76.33 to $80.10 | $72.67 to $76.65 | $44,643 | 1.28% | 0.10% to 0.60% | (4.79)% to (4.31)% | |||||||||||||||||||||||||
| 2021 | 659 | $54.97 to $57.41 | $76.33 to $80.10 | $51,711 | 1.49% | 0.10% to 0.60% | 38.85% to 39.54% | |||||||||||||||||||||||||
| Franklin Income VIP Fund-Class 1 Sub-Account |
|
|||||||||||||||||||||||||||||||
| 2025 | 171 | $41.00 to $44.65 | $46.84 to $50.35 | $8,513 | 5.02% | 0.10% to 0.50% | 12.31% to 12.76% | |||||||||||||||||||||||||
| 2024 | 181 | $38.38 to $41.59 | $41.00 to $44.65 | $7,971 | 5.04% | 0.10% to 0.60% | 6.81% to 7.35% | |||||||||||||||||||||||||
| 2023 | 193 | $35.47 to $38.24 | $38.38 to $41.59 | $7,886 | 5.27% | 0.10% to 0.60% | 8.22% to 8.76% | |||||||||||||||||||||||||
| 2022 | 232 | $37.65 to $40.39 | $35.47 to $38.24 | $8,711 | 5.37% | 0.10% to 0.60% | (5.80)% to (5.33)% | |||||||||||||||||||||||||
| 2021 | 272 | $32.37 to $34.56 | $37.65 to $40.39 | $10,752 | 4.67% | 0.10% to 0.60% | 16.31% to 16.89% | |||||||||||||||||||||||||
| Franklin Mutual Shares VIP Fund-Class 1 Sub-Account |
|
|||||||||||||||||||||||||||||||
| 2025 | 38 | $46.43 to $50.56 | $52.54 to $56.48 | $2,128 | 2.26% | 0.10% to 0.50% | 11.26% to 11.70% | |||||||||||||||||||||||||
| 2024 | 40 | $41.89 to $45.40 | $46.43 to $50.56 | $2,015 | 2.18% | 0.10% to 0.60% | 10.82% to 11.38% | |||||||||||||||||||||||||
| 2023 | 53 | $37.06 to $39.96 | $41.89 to $45.40 | $2,371 | 2.12% | 0.10% to 0.60% | 13.05% to 13.62% | |||||||||||||||||||||||||
| 2022 | 56 | $40.15 to $43.08 | $37.06 to $39.96 | $2,180 | 2.10% | 0.10% to 0.60% | (7.71)% to (7.25)% | |||||||||||||||||||||||||
| 2021 | 58 | $33.80 to $36.08 | $40.15 to $43.08 | $2,464 | 3.21% | 0.10% to 0.60% | 18.81% to 19.40% | |||||||||||||||||||||||||
| Franklin Small-Mid Cap Growth VIP Fund-Class 1 Sub-Account |
|
|||||||||||||||||||||||||||||||
| 2025 | 144 | $88.71 to $96.61 | $90.56 to $99.12 | $14,025 | 0.00% | 0.10% to 0.60% | 2.09% to 2.60% | |||||||||||||||||||||||||
| 2024 | 147 | $80.17 to $86.88 | $88.71 to $96.61 | $13,872 | 0.00% | 0.10% to 0.60% | 10.64% to 11.20% | |||||||||||||||||||||||||
| 2023 | 166 | $63.45 to $68.41 | $80.17 to $86.88 | $14,021 | 0.00% | 0.10% to 0.60% | 26.37% to 27.29% | |||||||||||||||||||||||||
| 2022 | 169 | $96.01 to $103.01 | $63.45 to $68.41 | $11,180 | 0.00% | 0.10% to 0.60% | (33.92)% to (33.59)% | |||||||||||||||||||||||||
| 2021 | 153 | $87.61 to $93.52 | $96.01 to $103.01 | $15,280 | 0.00% | 0.10% to 0.60% | 9.59% to 10.14% | |||||||||||||||||||||||||
| Janus Henderson Forty Portfolio-Institutional Shares Sub-Account |
|
|||||||||||||||||||||||||||||||
| 2025 | 64 | $229.79 to $250.26 | $269.86 to $295.37 | $18,624 | 0.07% | 0.10% to 0.60% | 17.44% to 18.02% | |||||||||||||||||||||||||
| 2024 | 73 | $179.95 to $195.00 | $229.79 to $250.26 | $17,888 | 0.11% | 0.10% to 0.60% | 27.70% to 28.34% | |||||||||||||||||||||||||
| 2023 | 77 | $129.34 to $139.46 | $179.95 to $195.00 | $14,690 | 0.20% | 0.10% to 0.60% | 39.13% to 39.82% | |||||||||||||||||||||||||
| 2022 | 73 | $195.83 to $210.09 | $129.34 to $139.46 | $10,053 | 0.18% | 0.10% to 0.60% | (33.95)% to (33.62)% | |||||||||||||||||||||||||
| 2021 | 88 | $160.30 to $171.12 | $195.83 to $210.09 | $18,168 | 0.00% | 0.10% to 0.60% | 22.16% to 22.77% | |||||||||||||||||||||||||
| Janus Henderson Mid-Cap Value Portfolio-Institutional Shares Sub-Account |
|
|||||||||||||||||||||||||||||||
| 2025 | 153 | $53.65 to $57.44 | $56.85 to $61.11 | $9,238 | 0.81% | 0.10% to 0.50% | 5.97% to 6.39% | |||||||||||||||||||||||||
| 2024 | 167 | $46.91 to $50.84 | $53.65 to $57.44 | $9,511 | 0.97% | 0.10% to 0.50% | 12.54% to 12.99% | |||||||||||||||||||||||||
| 2023 | 175 | $42.37 to $45.68 | $46.91 to $50.84 | $8,829 | 1.12% | 0.10% to 0.60% | 10.73% to 11.29% | |||||||||||||||||||||||||
| 2022 | 189 | $45.13 to $48.42 | $42.37 to $45.68 | $8,567 | 1.31% | 0.10% to 0.60% | (6.12)% to (5.65)% | |||||||||||||||||||||||||
| 2021 | 200 | $37.92 to $40.48 | $45.13 to $48.42 | $9,531 | 0.44% | 0.10% to 0.60% | 19.01% to 19.61% | |||||||||||||||||||||||||
| Janus Henderson Overseas Portfolio-Institutional Shares Sub-Account |
|
|||||||||||||||||||||||||||||||
| 2025 | 18 | $90.90 to $92.47 | $116.91 to $119.04 | $2,126 | 1.43% | 0.10% to 0.20% | 28.62% to 28.74% | |||||||||||||||||||||||||
| 2024 | 19 | $86.06 to $87.45 | $90.90 to $92.47 | $1,747 | 1.32% | 0.10% to 0.20% | 5.62% to 5.73% | |||||||||||||||||||||||||
| 2023 | 20 | $77.19 to $78.96 | $86.06 to $87.45 | $1,762 | 1.46% | 0.10% to 0.20% | 10.65% to 10.76% | |||||||||||||||||||||||||
| 2022 | 22 | $80.60 to $86.48 | $77.19 to $78.96 | $1,694 | 1.76% | 0.10% to 0.25% | (8.83)% to (8.70)% | |||||||||||||||||||||||||
| 2021 | 22 | $71.39 to $76.21 | $80.60 to $86.48 | $1,907 | 1.12% | 0.10% to 0.50% | 13.01% to 13.47% | |||||||||||||||||||||||||
| John Hancock Disciplined Value Emerging Markets Equity Trust Sub-Account |
|
|||||||||||||||||||||||||||||||
| 2025 | 1,124 | $33.33 to $35.05 | $43.73 to $46.22 | $50,811 | 1.26% | 0.10% to 0.60% | 31.21% to 31.87% | |||||||||||||||||||||||||
| 2024 | 1,220 | $34.37 to $35.96 | $33.33 to $35.05 | $41,741 | 4.19% | 0.10% to 0.60% | (3.03)% to (2.54)% | |||||||||||||||||||||||||
| 2023 | 1,260 | $30.03 to $31.26 | $34.37 to $35.96 | $44,305 | 1.62% | 0.10% to 0.60% | 14.46% to 15.04% | |||||||||||||||||||||||||
| 2022 | 1,349 | $34.18 to $35.41 | $30.03 to $31.26 | $41,296 | 3.76% | 0.10% to 0.60% | (12.16)% to (11.72)% | |||||||||||||||||||||||||
| 2021 | 1,325 | $30.91 to $31.86 | $34.18 to $35.41 | $46,070 | 2.41% | 0.10% to 0.60% | 10.58% to 11.14% | |||||||||||||||||||||||||
| TIAA Separate Account VA-5 (formerly, TIAA-CREF Life Separate Account VA-1) ∎ Statement of Additional Information | B-69 |
Table of Contents
| Notes to financial statements |
TIAA Separate Account VA-5 (formerly, TIAA-CREF Life Separate Account VA-1)
| For the period ended December 31 | ||||||||||||||||||||||||||||||||
| Period | Accumulation units outstanding, end of period (000’s) |
Accumulation unit value, beginning of
period |
Accumulation unit value, end of period lowest to highest |
Net assets, end of period |
Ratio of investment income to average net assets(c)(f) |
Ratio of to average net assets |
Total return(b)(h) | |||||||||||||||||||||||||
| LVIP Fidelity Institutional AM® Total Bond—Standard Class Sub-Account |
|
|||||||||||||||||||||||||||||||
| 2025 | 3,116 | $17.07 to $18.59 | $18.11 to $19.82 | $60,553 | 4.15% | 0.10% to 0.60% | 6.08% to 6.61% | |||||||||||||||||||||||||
| 2024 | 3,482 | $16.84 to $18.25 | $17.07 to $18.59 | $63,466 | 4.24% | 0.10% to 0.60% | 1.37% to 1.88% | |||||||||||||||||||||||||
| 2023 | 3,561 | $15.94 to $17.19 | $16.84 to $18.25 | $63,503 | 4.08% | 0.10% to 0.60% | 5.60% to 6.13% | |||||||||||||||||||||||||
| 2022 | 3,647 | $18.62 to $19.98 | $15.94 to $17.19 | $61,020 | 3.32% | 0.10% to 0.60% | (14.37)% to (13.94)% | |||||||||||||||||||||||||
| 2021 | (i) | 3,675 | $18.57 to $19.85 | $18.62 to $19.98 | $71,417 | 2.76% | 0.10% to 0.60% | 0.30% to 0.63% | ||||||||||||||||||||||||
| Matson Money Fixed Income VI Portfolio Sub-Account |
|
|||||||||||||||||||||||||||||||
| 2025 | 848 | $25.85 to $27.29 | $26.92 to $28.57 | $23,753 | 3.35% | 0.10% to 0.60% | 4.14% to 4.66% | |||||||||||||||||||||||||
| 2024 | 899 | $25.07 to $26.34 | $25.85 to $27.29 | $24,033 | 3.45% | 0.10% to 0.60% | 3.12% to 3.64% | |||||||||||||||||||||||||
| 2023 | 1,014 | $23.96 to $24.82 | $25.07 to $26.34 | $26,022 | 2.63% | 0.09% to 0.60% | 3.56% to 5.06% | |||||||||||||||||||||||||
| 2022 | 1,088 | $25.93 to $26.76 | $23.96 to $24.82 | $26,593 | 1.15% | 0.20% to 0.60% | (7.60)% to (7.23)% | |||||||||||||||||||||||||
| 2021 | 1,178 | $26.44 to $27.17 | $25.93 to $26.76 | $31,137 | 0.31% | 0.20% to 0.60% | (1.93)% to (1.54)% | |||||||||||||||||||||||||
| Matson Money International Equity VI Portfolio Sub-Account |
|
|||||||||||||||||||||||||||||||
| 2025 | 406 | $34.65 to $36.58 | $48.58 to $51.54 | $20,521 | 3.52% | 0.10% to 0.60% | 40.20% to 40.91% | |||||||||||||||||||||||||
| 2024 | 505 | $33.05 to $34.72 | $34.65 to $36.58 | $18,081 | 2.89% | 0.10% to 0.60% | 4.83% to 5.36% | |||||||||||||||||||||||||
| 2023 | 565 | $28.74 to $30.05 | $33.05 to $34.72 | $19,125 | 3.13% | 0.10% to 0.60% | 14.98% to 15.55% | |||||||||||||||||||||||||
| 2022 | 650 | $32.38 to $33.68 | $28.74 to $30.05 | $19,083 | 2.18% | 0.10% to 0.60% | (11.22)% to (4.02)% | |||||||||||||||||||||||||
| 2021 | 641 | $28.49 to $29.49 | $32.38 to $33.68 | $21,163 | 3.07% | 0.10% to 0.60% | 13.62% to 14.19% | |||||||||||||||||||||||||
| Matson Money U.S. Equity VI Portfolio Sub-Account |
|
|||||||||||||||||||||||||||||||
| 2025 | 390 | $57.85 to $61.08 | $64.20 to $68.12 | $26,084 | 1.21% | 0.10% to 0.60% | 10.98% to 11.53% | |||||||||||||||||||||||||
| 2024 | 414 | $51.88 to $54.50 | $57.85 to $61.08 | $24,769 | 0.80% | 0.10% to 0.60% | 11.51% to 12.08% | |||||||||||||||||||||||||
| 2023 | 500 | $44.83 to $46.86 | $51.88 to $54.50 | $26,593 | 1.03% | 0.10% to 0.60% | 15.71% to 16.29% | |||||||||||||||||||||||||
| 2022 | 557 | $49.99 to $51.99 | $44.83 to $46.86 | $25,534 | 0.77% | 0.10% to 0.60% | (10.31)% to (9.86)% | |||||||||||||||||||||||||
| 2021 | 596 | $38.31 to $39.24 | $49.99 to $51.99 | $30,374 | 0.94% | 0.10% to 0.60% | 7.47% to 30.93% | |||||||||||||||||||||||||
| MFS Global Equity Series-Initial Class Sub-Account |
|
|||||||||||||||||||||||||||||||
| 2025 | 79 | $43.79 to $47.69 | $49.44 to $54.11 | $4,221 | 0.93% | 0.10% to 0.60% | 12.91% to 13.48% | |||||||||||||||||||||||||
| 2024 | 98 | $41.72 to $45.21 | $43.79 to $47.69 | $4,583 | 0.93% | 0.10% to 0.60% | 4.95% to 5.47% | |||||||||||||||||||||||||
| 2023 | 133 | $36.76 to $39.64 | $41.72 to $45.21 | $5,914 | 0.79% | 0.10% to 0.59% | 13.50% to 14.07% | |||||||||||||||||||||||||
| 2022 | 133 | $44.95 to $48.23 | $36.76 to $39.64 | $5,155 | 0.55% | 0.10% to 0.60% | (18.22)% to (17.81)% | |||||||||||||||||||||||||
| 2021 | 134 | $38.58 to $41.19 | $44.95 to $48.23 | $6,310 | 0.62% | 0.10% to 0.60% | 16.51% to 17.09% | |||||||||||||||||||||||||
| MFS Growth Series-Initial Class Sub-Account |
|
|||||||||||||||||||||||||||||||
| 2025 | 7 | $171.15 to $174.10 | $191.64 to $195.14 | $1,398 | 0.00% | 0.10% to 0.20% | 11.97% to 12.08% | |||||||||||||||||||||||||
| 2024 | 7 | $130.45 to $132.56 | $171.15 to $174.10 | $1,258 | 0.00% | 0.10% to 0.20% | 31.20% to 31.33% | |||||||||||||||||||||||||
| 2023 | 8 | $90.58 to $97.67 | $130.45 to $132.56 | $1,012 | 0.00% | 0.10% to 0.20% | 35.59% to 35.73% | |||||||||||||||||||||||||
| 2022 | 8 | $133.30 to $143.01 | $90.58 to $97.67 | $754 | 0.00% | 0.10% to 0.59% | (32.04)% to (31.70)% | |||||||||||||||||||||||||
| 2021 | 8 | $108.55 to $115.88 | $133.30 to $143.01 | $1,186 | 0.00% | 0.10% to 0.60% | 22.79% to 23.41% | |||||||||||||||||||||||||
| MFS Massachusetts Investors Growth Stock Portfolio Sub-Account |
|
|||||||||||||||||||||||||||||||
| 2025 | 94 | $62.32 to $67.88 | $68.09 to $74.52 | $6,942 | 0.26% | 0.10% to 0.60% | 9.24% to 9.79% | |||||||||||||||||||||||||
| 2024 | 124 | $53.93 to $58.44 | $62.32 to $67.88 | $8,275 | 0.33% | 0.10% to 0.60% | 15.57% to 16.15% | |||||||||||||||||||||||||
| 2023 | 166 | $43.75 to $47.17 | $53.93 to $58.44 | $9,496 | 0.30% | 0.10% to 0.60% | 23.27% to 23.88% | |||||||||||||||||||||||||
| 2022 | 173 | $54.51 to $58.48 | $43.75 to $47.17 | $7,954 | 0.11% | 0.10% to 0.60% | (19.74)% to (19.34)% | |||||||||||||||||||||||||
| 2021 | 183 | $43.53 to $46.47 | $54.51 to $58.48 | $10,389 | 0.23% | 0.10% to 0.60% | 25.22% to 25.85% | |||||||||||||||||||||||||
| MFS Utilities Series-Initial Class Sub-Account |
|
|||||||||||||||||||||||||||||||
| 2025 | 33 | $89.12 to $97.05 | $101.88 to $111.51 | $3,585 | 2.81% | 0.10% to 0.60% | 14.32% to 14.89% | |||||||||||||||||||||||||
| 2024 | 37 | $80.29 to $87.01 | $89.12 to $97.05 | $3,477 | 2.24% | 0.10% to 0.60% | 10.99% to 11.55% | |||||||||||||||||||||||||
| 2023 | 40 | $82.51 to $88.97 | $80.29 to $87.01 | $3,440 | 3.40% | 0.10% to 0.60% | (2.69)% to (2.21)% | |||||||||||||||||||||||||
| 2022 | 50 | $82.39 to $88.39 | $82.51 to $88.97 | $4,333 | 2.45% | 0.10% to 0.60% | 0.15% to 0.65% | |||||||||||||||||||||||||
| 2021 | 47 | $72.65 to $77.55 | $82.39 to $88.39 | $4,062 | 1.72% | 0.10% to 0.60% | 13.41% to 13.98% | |||||||||||||||||||||||||
| Neuberger Berman Advisers Management Trust Mid Cap Intrinsic Value Portfolio-I Class Sub-Account |
|
|||||||||||||||||||||||||||||||
| 2025 | 961 | $42.88 to $46.70 | $47.55 to $52.04 | $48,832 | 0.47% | 0.10% to 0.60% | 10.89% to 11.45% | |||||||||||||||||||||||||
| 2024 | 1,010 | $39.64 to $42.96 | $42.88 to $46.70 | $45,778 | 0.71% | 0.10% to 0.60% | 8.16% to 8.71% | |||||||||||||||||||||||||
| 2023 | 1,086 | $35.93 to $38.74 | $39.64 to $42.96 | $45,059 | 1.05% | 0.10% to 0.60% | 10.34% to 10.89% | |||||||||||||||||||||||||
| 2022 | 1,119 | $40.05 to $42.97 | $35.93 to $38.74 | $41,803 | 0.59% | 0.10% to 0.60% | (10.29)% to (9.84)% | |||||||||||||||||||||||||
| 2021 | 1,228 | $30.34 to $32.39 | $40.05 to $42.97 | $50,975 | 0.59% | 0.10% to 0.60% | 32.00% to 32.66% | |||||||||||||||||||||||||
| B-70 | Statement of Additional Information ∎ TIAA Separate Account VA-5 (formerly, TIAA-CREF Life Separate Account VA-1) |
Table of Contents
| continued |
| For the period ended December 31 | ||||||||||||||||||||||||||||||||
| Period | Accumulation units outstanding, end of period (000’s) |
Accumulation unit value, beginning of
period |
Accumulation unit value, end of period lowest to highest |
Net assets, end of period |
Ratio of investment income to average net assets(c)(f) |
Ratio of to average net assets |
Total return(b)(h) | |||||||||||||||||||||||||
| Neuberger Berman Advisers Management Trust Sustainable Equity Portfolio-I Class Sub-Account |
|
|||||||||||||||||||||||||||||||
| 2025 | 31 | $71.35 to $77.71 | $82.14 to $88.30 | $2,746 | 0.00% | 0.10% to 0.50% | 13.17% to 13.63% | |||||||||||||||||||||||||
| 2024 | 35 | $57.04 to $61.81 | $71.35 to $77.71 | $2,735 | 0.23% | 0.10% to 0.60% | 25.09% to 25.72% | |||||||||||||||||||||||||
| 2023 | 37 | $45.22 to $48.76 | $57.04 to $61.81 | $2,257 | 0.34% | 0.10% to 0.60% | 4.39% to 26.77% | |||||||||||||||||||||||||
| 2022 | 40 | $55.79 to $59.85 | $45.22 to $48.76 | $1,908 | 0.42% | 0.10% to 0.60% | (18.94)% to (18.53)% | |||||||||||||||||||||||||
| 2021 | 46 | $45.45 to $48.52 | $55.79 to $59.85 | $2,680 | 0.38% | 0.10% to 0.60% | 22.74% to 23.35% | |||||||||||||||||||||||||
| Nomura VIP International Core Equity Series—Standard Class Sub-Account |
|
|||||||||||||||||||||||||||||||
| 2025 | 2,025 | $17.49 to $19.04 | $21.65 to $23.69 | $47,021 | 1.32% | 0.10% to 0.60% | 23.81% to 24.43% | |||||||||||||||||||||||||
| 2024 | (k) | 2,267 | $17.63 to $19.13 | $17.49 to $19.04 | $42,079 | 1.83% | 0.10% to 0.60% | (0.81)% to (0.47)% | ||||||||||||||||||||||||
| Nomura VIP Small Cap Value Series-Standard Class Sub-Account |
|
|||||||||||||||||||||||||||||||
| 2025 | 276 | $104.53 to $113.84 | $112.39 to $123.01 | $33,413 | 1.27% | 0.10% to 0.60% | 7.51% to 8.05% | |||||||||||||||||||||||||
| 2024 | 290 | $94.47 to $102.37 | $104.53 to $113.84 | $32,188 | 1.35% | 0.10% to 0.60% | 10.65% to 11.21% | |||||||||||||||||||||||||
| 2023 | 325 | $86.84 to $93.63 | $94.47 to $102.37 | $32,328 | 0.96% | 0.10% to 0.60% | 8.79% to 9.33% | |||||||||||||||||||||||||
| 2022 | 340 | $99.37 to $106.61 | $86.84 to $93.63 | $30,836 | 0.83% | 0.10% to 0.60% | (12.61)% to (12.18)% | |||||||||||||||||||||||||
| 2021 | 368 | $74.37 to $79.39 | $99.37 to $106.61 | $37,969 | 0.85% | 0.10% to 0.60% | 33.61% to 34.28% | |||||||||||||||||||||||||
| PIMCO VIT All Asset Portfolio-Institutional Class Sub-Account |
|
|||||||||||||||||||||||||||||||
| 2025 | 141 | $23.69 to $25.80 | $27.41 to $29.47 | $4,116 | 4.67% | 0.10% to 0.50% | 13.77% to 14.23% | |||||||||||||||||||||||||
| 2024 | 154 | $22.93 to $24.84 | $23.69 to $25.80 | $3,933 | 6.54% | 0.10% to 0.60% | 3.32% to 3.85% | |||||||||||||||||||||||||
| 2023 | 154 | $21.30 to $22.97 | $22.93 to $24.84 | $3,779 | 3.02% | 0.10% to 0.60% | 7.64% to 8.17% | |||||||||||||||||||||||||
| 2022 | 193 | $24.26 to $26.02 | $21.30 to $22.97 | $4,367 | 7.71% | 0.10% to 0.60% | (12.18)% to (11.75)% | |||||||||||||||||||||||||
| 2021 | 226 | $20.96 to $22.38 | $24.26 to $26.02 | $5,757 | 10.93% | 0.10% to 0.60% | 15.72% to 16.30% | |||||||||||||||||||||||||
| PIMCO VIT Commodity Real Return Strategy Portfolio-Institutional Class Sub-Account |
|
|||||||||||||||||||||||||||||||
| 2025 | 80 | $22.90 to $24.21 | $27.10 to $28.80 | $2,271 | 2.86% | 0.10% to 0.60% | 18.36% to 18.95% | |||||||||||||||||||||||||
| 2024 | 111 | $22.08 to $23.23 | $22.90 to $24.21 | $2,625 | 2.35% | 0.10% to 0.60% | 3.71% to 4.23% | |||||||||||||||||||||||||
| 2023 | 129 | $24.07 to $25.20 | $22.08 to $23.23 | $2,926 | 15.72% | 0.10% to 0.60% | (8.30)% to (7.84)% | |||||||||||||||||||||||||
| 2022 | 150 | $22.26 to $23.19 | $24.07 to $25.20 | $3,707 | 22.74% | 0.10% to 0.60% | 8.14% to 8.68% | |||||||||||||||||||||||||
| 2021 | 141 | $16.78 to $17.39 | $22.26 to $23.19 | $3,207 | 4.50% | 0.10% to 0.60% | 32.67% to 33.34% | |||||||||||||||||||||||||
| PIMCO VIT Emerging Markets Bond Portfolio-Institutional Class Sub-Account |
|
|||||||||||||||||||||||||||||||
| 2025 | 1,185 | $33.13 to $35.03 | $37.92 to $40.30 | $46,775 | 7.05% | 0.10% to 0.60% | 14.46% to 15.03% | |||||||||||||||||||||||||
| 2024 | 1,249 | $30.95 to $32.56 | $33.13 to $35.03 | $42,715 | 6.57% | 0.10% to 0.60% | 7.04% to 7.58% | |||||||||||||||||||||||||
| 2023 | 1,302 | $27.98 to $29.29 | $30.95 to $32.56 | $41,330 | 5.84% | 0.10% to 0.60% | 10.61% to 11.17% | |||||||||||||||||||||||||
| 2022 | 1,344 | $33.34 to $34.73 | $27.98 to $29.29 | $38,446 | 4.97% | 0.10% to 0.60% | (16.09)% to (15.67)% | |||||||||||||||||||||||||
| 2021 | 1,305 | $34.38 to $35.63 | $33.34 to $34.73 | $44,396 | 4.63% | 0.10% to 0.60% | (3.00)% to (2.51)% | |||||||||||||||||||||||||
| PIMCO VIT Global Bond Opportunities Portfolio (Unhedged)-Institutional Class Sub-Account |
|
|||||||||||||||||||||||||||||||
| 2025 | 312 | $17.97 to $19.58 | $20.18 to $22.08 | $6,790 | 4.67% | 0.10% to 0.60% | 12.25% to 12.81% | |||||||||||||||||||||||||
| 2024 | 314 | $18.15 to $19.66 | $17.97 to $19.58 | $6,044 | 3.68% | 0.10% to 0.60% | (0.95)% to (0.45)% | |||||||||||||||||||||||||
| 2023 | 306 | $17.32 to $18.67 | $18.15 to $19.66 | $5,915 | 2.40% | 0.10% to 0.59% | 4.79% to 5.31% | |||||||||||||||||||||||||
| 2022 | 310 | $19.55 to $20.97 | $17.32 to $18.67 | $5,679 | 1.64% | 0.10% to 0.60% | (11.40)% to (10.96)% | |||||||||||||||||||||||||
| 2021 | 292 | $20.49 to $21.87 | $19.55 to $20.97 | $6,029 | 5.16% | 0.10% to 0.60% | (4.59)% to (4.11)% | |||||||||||||||||||||||||
| PIMCO VIT Real Return Portfolio-Institutional Class Sub-Account |
|
|||||||||||||||||||||||||||||||
| 2025 | 4,608 | $19.60 to $21.34 | $21.04 to $23.03 | $103,294 | 3.47% | 0.10% to 0.60% | 7.36% to 7.90% | |||||||||||||||||||||||||
| 2024 | 4,872 | $19.27 to $20.89 | $19.60 to $21.34 | $100,867 | 2.76% | 0.10% to 0.60% | 1.67% to 2.18% | |||||||||||||||||||||||||
| 2023 | 5,006 | $18.68 to $20.14 | $19.27 to $20.89 | $101,200 | 3.14% | 0.10% to 0.60% | 3.21% to 3.72% | |||||||||||||||||||||||||
| 2022 | 5,184 | $21.29 to $22.85 | $18.68 to $20.14 | $100,994 | 7.14% | 0.10% to 0.60% | (12.30)% to (11.86)% | |||||||||||||||||||||||||
| 2021 | 5,437 | $20.26 to $21.63 | $21.29 to $22.85 | $120,386 | 5.14% | 0.10% to 0.60% | 5.11% to 5.64% | |||||||||||||||||||||||||
| PSF PGIM Jennison Blend Portfolio—Class II Sub-Account |
|
|||||||||||||||||||||||||||||||
| 2025 | 341 | $73.24 to $79.77 | $85.94 to $94.07 | $31,814 | 0.00% | 0.10% to 0.60% | 17.34% to 17.93% | |||||||||||||||||||||||||
| 2024 | 352 | $58.57 to $63.47 | $73.24 to $79.77 | $27,853 | 0.00% | 0.10% to 0.60% | 25.05% to 25.68% | |||||||||||||||||||||||||
| 2023 | (j) | 412 | $57.32 | $58.57 to $63.47 | $25,502 | 0.00% | 0.10% to 0.63% | 2.96% to 3.38% | ||||||||||||||||||||||||
| PSF PGIM Jennison Value Portfolio-Class II Sub-Account |
|
|||||||||||||||||||||||||||||||
| 2025 | 109 | $79.10 to $84.69 | $91.62 to $98.49 | $10,623 | 0.00% | 0.10% to 0.50% | 3.84% to 16.29% | |||||||||||||||||||||||||
| 2024 | 121 | $64.93 to $70.36 | $79.10 to $84.69 | $10,168 | 0.00% | 0.10% to 0.50% | 19.88% to 20.36% | |||||||||||||||||||||||||
| 2023 | 126 | $56.93 to $61.38 | $64.93 to $70.36 | $8,787 | 0.00% | 0.10% to 0.60% | 14.06% to 14.63% | |||||||||||||||||||||||||
| 2022 | 132 | $62.42 to $66.97 | $56.93 to $61.38 | $8,021 | 0.00% | 0.10% to 0.60% | (8.80)% to (8.35)% | |||||||||||||||||||||||||
| 2021 | 143 | $49.34 to $52.67 | $62.42 to $66.97 | $9,493 | 0.00% | 0.10% to 0.60% | 26.52% to 27.16% | |||||||||||||||||||||||||
| TIAA Separate Account VA-5 (formerly, TIAA-CREF Life Separate Account VA-1) ∎ Statement of Additional Information | B-71 |
Table of Contents
| Notes to financial statements |
TIAA Separate Account VA-5 (formerly, TIAA-CREF Life Separate Account VA-1)
| For the period ended December 31 | ||||||||||||||||||||||||||||||||
| Period | Accumulation units outstanding, end of period (000’s) |
Accumulation unit value, beginning of
period |
Accumulation unit value, end of period lowest to highest |
Net assets, end of period |
Ratio of investment income to average net assets(c)(f) |
Ratio of to average net assets |
Total return(b)(h) | |||||||||||||||||||||||||
| PVC Equity Income Account-Class 1 Sub-Account |
|
|||||||||||||||||||||||||||||||
| 2025 | 1,335 | $67.97 to $74.03 | $78.04 to $85.42 | $111,651 | 1.80% | 0.10% to 0.60% | 14.81% to 15.39% | |||||||||||||||||||||||||
| 2024 | 1,424 | $59.21 to $64.16 | $67.97 to $74.03 | $102,795 | 2.07% | 0.10% to 0.60% | 14.80% to 15.38% | |||||||||||||||||||||||||
| 2023 | 1,579 | $53.56 to $57.75 | $59.21 to $64.16 | $98,402 | 2.10% | 0.10% to 0.60% | 10.55% to 11.10% | |||||||||||||||||||||||||
| 2022 | 1,663 | $60.20 to $64.58 | $53.56 to $57.75 | $93,017 | 1.90% | 0.10% to 0.60% | (11.03)% to (10.59)% | |||||||||||||||||||||||||
| 2021 | 1,784 | $49.45 to $52.79 | $60.20 to $64.58 | $111,694 | 1.98% | 0.10% to 0.60% | 21.73% to 22.34% | |||||||||||||||||||||||||
| PVC MidCap Account-Class 1 Sub-Account |
|
|||||||||||||||||||||||||||||||
| 2025 | 75 | $101.35 to $107.59 | $107.44 to $109.39 | $8,125 | 0.29% | 0.10% to 0.20% | 1.58% to 1.68% | |||||||||||||||||||||||||
| 2024 | 90 | $84.65 to $89.54 | $101.35 to $107.59 | $9,582 | 0.24% | 0.10% to 0.45% | 19.73% to 20.15% | |||||||||||||||||||||||||
| 2023 | 100 | $65.93 to $71.09 | $84.65 to $89.54 | $8,894 | 0.00% | 0.10% to 0.45% | 25.52% to 25.96% | |||||||||||||||||||||||||
| 2022 | 103 | $86.12 to $92.39 | $65.93 to $71.09 | $7,236 | 0.19% | 0.10% to 0.60% | (23.44)% to (23.05)% | |||||||||||||||||||||||||
| 2021 | 105 | $69.02 to $73.68 | $86.12 to $92.39 | $9,513 | 0.13% | 0.10% to 0.60% | 24.78% to 25.40% | |||||||||||||||||||||||||
| Royce Capital Fund Micro-Cap Portfolio-Investment Class Sub-Account |
|
|||||||||||||||||||||||||||||||
| 2025 | 17 | $35.10 to $38.22 | $40.46 to $43.49 | $739 | 0.00% | 0.10% to 0.50% | 13.32% to 13.78% | |||||||||||||||||||||||||
| 2024 | 17 | $31.06 to $33.66 | $35.10 to $38.22 | $649 | 0.00% | 0.10% to 0.60% | 12.99% to 13.56% | |||||||||||||||||||||||||
| 2023 | 26 | $26.31 to $28.37 | $31.06 to $33.66 | $873 | 0.00% | 0.10% to 0.60% | 7.23% to 18.66% | |||||||||||||||||||||||||
| 2022 | 27 | $34.12 to $36.61 | $26.31 to $28.37 | $764 | 0.00% | 0.10% to 0.60% | (22.90)% to (22.51)% | |||||||||||||||||||||||||
| 2021 | 41 | $26.41 to $28.19 | $34.12 to $36.61 | $1,467 | 0.00% | 0.10% to 0.60% | 29.20% to 29.85% | |||||||||||||||||||||||||
| Royce Capital Fund Small-Cap Portfolio-Investment Class Sub-Account |
|
|||||||||||||||||||||||||||||||
| 2025 | 266 | $29.28 to $31.88 | $31.70 to $34.70 | $9,134 | 1.86% | 0.10% to 0.60% | 8.28% to 8.82% | |||||||||||||||||||||||||
| 2024 | 281 | $28.48 to $30.86 | $29.28 to $31.88 | $8,873 | 1.18% | 0.10% to 0.60% | 2.78% to 3.30% | |||||||||||||||||||||||||
| 2023 | 303 | $22.75 to $24.53 | $28.48 to $30.86 | $9,243 | 0.90% | 0.10% to 0.60% | 25.17% to 25.80% | |||||||||||||||||||||||||
| 2022 | 317 | $25.21 to $27.05 | $22.75 to $24.53 | $7,676 | 0.39% | 0.10% to 0.60% | (9.74)% to (9.29)% | |||||||||||||||||||||||||
| 2021 | 352 | $19.69 to $21.02 | $25.21 to $27.05 | $9,375 | 1.43% | 0.10% to 0.60% | 28.05% to 28.69% | |||||||||||||||||||||||||
| T. Rowe Price® Health Sciences Portfolio I Sub-Account |
|
|||||||||||||||||||||||||||||||
| 2025 | 98 | $53.52 to $56.28 | $62.83 to $66.40 | $6,375 | 0.00% | 0.10% to 0.60% | 17.40% to 17.98% | |||||||||||||||||||||||||
| 2024 | 118 | $52.96 to $55.42 | $53.52 to $56.28 | $6,497 | 0.00% | 0.10% to 0.60% | 1.04% to 1.55% | |||||||||||||||||||||||||
| 2023 | 127 | $51.75 to $53.88 | $52.96 to $55.42 | $6,907 | 0.00% | 0.10% to 0.60% | 2.35% to 2.86% | |||||||||||||||||||||||||
| 2022 | 138 | $59.48 to $61.62 | $51.75 to $53.88 | $7,314 | 0.00% | 0.10% to 0.60% | (13.00)% to (12.56)% | |||||||||||||||||||||||||
| 2021 | 136 | $52.91 to $54.53 | $59.48 to $61.62 | $8,262 | 0.00% | 0.10% to 0.60% | 12.43% to 12.99% | |||||||||||||||||||||||||
| T. Rowe Price® Limited-Term Bond Portfolio Sub-Account |
|
|||||||||||||||||||||||||||||||
| 2025 | 1,843 | $28.33 to $30.20 | $29.76 to $31.89 | $57,601 | 4.29% | 0.10% to 0.60% | 5.08% to 5.61% | |||||||||||||||||||||||||
| 2024 | 1,803 | $27.15 to $28.80 | $28.33 to $30.20 | $53,245 | 4.20% | 0.10% to 0.60% | 4.33% to 4.86% | |||||||||||||||||||||||||
| 2023 | 1,862 | $26.03 to $27.47 | $27.15 to $28.80 | $52,327 | 3.30% | 0.10% to 0.60% | 4.31% to 4.84% | |||||||||||||||||||||||||
| 2022 | 2,027 | $27.42 to $28.80 | $26.03 to $27.47 | $54,185 | 1.94% | 0.10% to 0.60% | (5.09)% to (4.61)% | |||||||||||||||||||||||||
| 2021 | 2,071 | $27.55 to $28.79 | $27.42 to $28.80 | $58,155 | 1.33% | 0.10% to 0.60% | (0.47)% to 0.03% | |||||||||||||||||||||||||
| Templeton Developing Markets VIP Fund-Class 1 Sub-Account |
|
|||||||||||||||||||||||||||||||
| 2025 | 1,450 | $18.67 to $20.34 | $27.22 to $29.79 | $42,125 | 0.76% | 0.10% to 0.60% | 45.77% to 46.50% | |||||||||||||||||||||||||
| 2024 | 1,489 | $17.40 to $18.85 | $18.67 to $20.34 | $29,508 | 4.04% | 0.10% to 0.60% | 7.33% to 7.87% | |||||||||||||||||||||||||
| 2023 | 1,431 | $15.52 to $16.73 | $17.40 to $18.85 | $26,147 | 2.29% | 0.10% to 0.60% | 12.10% to 12.66% | |||||||||||||||||||||||||
| 2022 | 1,352 | $19.94 to $21.39 | $15.52 to $16.73 | $21,887 | 2.94% | 0.10% to 0.60% | (22.17)% to (21.78)% | |||||||||||||||||||||||||
| 2021 | 1,107 | $21.23 to $22.66 | $19.94 to $21.39 | $22,946 | 1.05% | 0.10% to 0.60% | (6.07)% to (5.60)% | |||||||||||||||||||||||||
| Vanguard VIF Balanced Portfolio Sub-Account |
|
|||||||||||||||||||||||||||||||
| 2025 | 140 | $39.27 to $40.20 | $45.46 to $46.77 | $6,479 | 1.69% | 0.10% to 0.60% | 3.08% to 16.35% | |||||||||||||||||||||||||
| 2024 | 134 | $34.41 to $35.05 | $39.27 to $40.20 | $5,340 | 1.93% | 0.10% to 0.60% | 14.11% to 14.69% | |||||||||||||||||||||||||
| 2023 | 123 | $30.28 to $30.69 | $34.41 to $35.05 | $4,284 | 2.02% | 0.10% to 0.60% | 13.64% to 14.21% | |||||||||||||||||||||||||
| 2022 | 140 | $35.55 to $35.85 | $30.28 to $30.69 | $4,283 | 2.02% | 0.10% to 0.60% | (14.81)% to (14.39)% | |||||||||||||||||||||||||
| 2021 | 134 | $25.95 to $27.58 | $35.55 to $35.85 | $4,802 | 0.71% | 0.10% to 0.60% | 2.83% to 19.06% | |||||||||||||||||||||||||
| B-72 | Statement of Additional Information ∎ TIAA Separate Account VA-5 (formerly, TIAA-CREF Life Separate Account VA-1) |
Table of Contents
| continued |
| For the period ended December 31 | ||||||||||||||||||||||||||||||||
| Period | Accumulation units outstanding, end of period (000’s) |
Accumulation unit value, beginning of
period |
Accumulation unit value, end of period lowest to highest |
Net assets, end of period |
Ratio of investment income to average net assets(c)(f) |
Ratio of to average net assets |
Total return(b)(h) | |||||||||||||||||||||||||
| Vanguard VIF Capital Growth Portfolio Sub-Account |
|
|||||||||||||||||||||||||||||||
| 2025 | 315 | $76.17 to $80.09 | $97.65 to $103.20 | $32,248 | 1.21% | 0.10% to 0.60% | 28.21% to 28.85% | |||||||||||||||||||||||||
| 2024 | 291 | $67.57 to $70.69 | $76.17 to $80.09 | $23,057 | 1.09% | 0.10% to 0.60% | 12.73% to 13.30% | |||||||||||||||||||||||||
| 2023 | 298 | $53.11 to $55.29 | $67.57 to $70.69 | $20,815 | 1.03% | 0.10% to 0.60% | 27.22% to 27.85% | |||||||||||||||||||||||||
| 2022 | 300 | $63.22 to $65.49 | $53.11 to $55.29 | $16,395 | 0.89% | 0.10% to 0.60% | (15.99)% to (15.57)% | |||||||||||||||||||||||||
| 2021 | 309 | $52.33 to $53.93 | $63.22 to $65.49 | $19,993 | 0.88% | 0.10% to 0.60% | 20.81% to 21.42% | |||||||||||||||||||||||||
| Vanguard VIF Conservative Allocation Portfolio Sub-Account |
|
|||||||||||||||||||||||||||||||
| 2025 | 179 | $30.80 to $31.53 | $34.71 to $35.51 | $6,280 | 2.17% | 0.10% to 0.50% | 12.17% to 12.62% | |||||||||||||||||||||||||
| 2024 | 112 | $28.83 to $29.36 | $30.80 to $31.53 | $3,496 | 2.59% | 0.10% to 0.60% | 6.84% to 7.38% | |||||||||||||||||||||||||
| 2023 | 99 | $25.78 to $26.12 | $28.83 to $29.36 | $2,894 | 1.97% | 0.10% to 0.61% | 6.85% to 12.40% | |||||||||||||||||||||||||
| 2022 | 91 | $30.47 to $30.73 | $25.78 to $26.12 | $2,357 | 3.46% | 0.10% to 0.60% | (15.40)% to (14.98)% | |||||||||||||||||||||||||
| 2021 | 109 | $28.92 to $29.02 | $30.47 to $30.73 | $3,341 | 0.62% | 0.10% to 0.56% | 4.34% to 5.88% | |||||||||||||||||||||||||
| Vanguard VIF Equity Index Portfolio Sub-Account |
|
|||||||||||||||||||||||||||||||
| 2025 | 2,972 | $81.83 to $86.04 | $95.74 to $101.17 | $297,418 | 1.05% | 0.10% to 0.60% | 17.00% to 17.58% | |||||||||||||||||||||||||
| 2024 | 2,737 | $65.94 to $68.99 | $81.83 to $86.04 | $233,020 | 1.25% | 0.10% to 0.60% | 24.09% to 24.72% | |||||||||||||||||||||||||
| 2023 | 2,645 | $52.60 to $54.76 | $65.94 to $68.99 | $179,989 | 1.38% | 0.10% to 0.60% | 25.36% to 25.99% | |||||||||||||||||||||||||
| 2022 | 2,601 | $64.71 to $67.04 | $52.60 to $54.76 | $140,644 | 1.35% | 0.10% to 0.60% | (18.72)% to (18.31)% | |||||||||||||||||||||||||
| 2021 | 2,714 | $50.64 to $52.20 | $64.71 to $67.04 | $179,891 | 1.22% | 0.10% to 0.60% | 27.78% to 28.42% | |||||||||||||||||||||||||
| Vanguard VIF Global Bond Index Portfolio Sub-Account |
|
|||||||||||||||||||||||||||||||
| 2025 | 214 | $23.20 to $23.64 | $24.27 to $24.96 | $5,309 | 2.73% | 0.10% to 0.60% | 3.21% to 5.59% | |||||||||||||||||||||||||
| 2024 | 169 | $22.86 to $23.19 | $23.20 to $23.64 | $3,971 | 2.78% | 0.10% to 0.50% | 1.52% to 1.93% | |||||||||||||||||||||||||
| 2023 | 130 | $21.57 to $21.80 | $22.86 to $23.19 | $3,008 | 1.77% | 0.10% to 0.50% | 3.77% to 6.41% | |||||||||||||||||||||||||
| 2022 | 86 | $24.95 to $25.12 | $21.57 to $21.80 | $1,863 | 2.63% | 0.10% to 0.50% | (13.56)% to (13.21)% | |||||||||||||||||||||||||
| 2021 | 75 | $25.54 to $25.61 | $24.95 to $25.12 | $1,884 | 1.34% | 0.10% to 0.50% | (2.33)% to (1.94)% | |||||||||||||||||||||||||
| Vanguard VIF High Yield Bond Portfolio Sub-Account |
|
|||||||||||||||||||||||||||||||
| 2025 | 1,547 | $37.35 to $39.27 | $40.53 to $42.84 | $64,898 | 6.39% | 0.10% to 0.60% | 8.53% to 9.07% | |||||||||||||||||||||||||
| 2024 | 1,548 | $35.30 to $36.93 | $37.35 to $39.27 | $59,398 | 5.58% | 0.10% to 0.60% | 5.81% to 6.34% | |||||||||||||||||||||||||
| 2023 | 1,570 | $31.80 to $33.10 | $35.30 to $36.93 | $56,735 | 4.87% | 0.10% to 0.60% | 11.00% to 11.55% | |||||||||||||||||||||||||
| 2022 | 1,565 | $35.29 to $36.56 | $31.80 to $33.10 | $50,758 | 5.06% | 0.10% to 0.60% | (9.90)% to (9.45)% | |||||||||||||||||||||||||
| 2021 | 1,610 | $34.25 to $35.30 | $35.29 to $36.56 | $57,834 | 4.03% | 0.10% to 0.60% | 3.06% to 3.57% | |||||||||||||||||||||||||
| Vanguard VIF International Portfolio Sub-Account |
|
|||||||||||||||||||||||||||||||
| 2025 | 99 | $36.24 to $37.10 | $43.22 to $44.46 | $4,377 | 0.85% | 0.10% to 0.60% | 19.25% to 19.85% | |||||||||||||||||||||||||
| 2024 | 116 | $33.45 to $34.07 | $36.24 to $37.10 | $4,280 | 1.21% | 0.10% to 0.60% | 8.36% to 8.90% | |||||||||||||||||||||||||
| 2023 | 122 | $29.35 to $29.74 | $33.45 to $34.07 | $4,135 | 1.66% | 0.10% to 0.60% | 13.97% to 14.54% | |||||||||||||||||||||||||
| 2022 | 154 | $42.25 to $42.61 | $29.35 to $29.74 | $4,555 | 1.24% | 0.10% to 0.60% | (30.54)% to (30.19)% | |||||||||||||||||||||||||
| 2021 | 111 | $43.17 to $43.32 | $42.25 to $42.61 | $4,703 | 0.27% | 0.10% to 0.60% | (2.13)% to (1.64)% | |||||||||||||||||||||||||
| Vanguard VIF Mid-Cap Index Portfolio Sub-Account |
|
|||||||||||||||||||||||||||||||
| 2025 | 1,548 | $59.92 to $63.01 | $66.44 to $70.21 | $106,357 | 1.25% | 0.10% to 0.60% | 10.87% to 11.43% | |||||||||||||||||||||||||
| 2024 | 1,617 | $52.39 to $54.81 | $59.92 to $63.01 | $99,656 | 1.40% | 0.10% to 0.60% | 14.38% to 14.96% | |||||||||||||||||||||||||
| 2023 | 1,762 | $45.50 to $47.37 | $52.39 to $54.81 | $94,585 | 1.41% | 0.10% to 0.60% | 15.14% to 15.71% | |||||||||||||||||||||||||
| 2022 | 1,785 | $56.38 to $58.41 | $45.50 to $47.37 | $82,945 | 1.12% | 0.10% to 0.60% | (19.31)% to (18.90)% | |||||||||||||||||||||||||
| 2021 | 1,787 | $45.61 to $47.01 | $56.38 to $58.41 | $102,675 | 1.07% | 0.10% to 0.60% | 23.61% to 24.23% | |||||||||||||||||||||||||
| Vanguard VIF Moderate Allocation Portfolio Sub-Account |
|
|||||||||||||||||||||||||||||||
| 2025 | 213 | $35.37 to $36.04 | $40.85 to $42.02 | $8,833 | 2.23% | 0.10% to 0.60% | 11.20% to 15.95% | |||||||||||||||||||||||||
| 2024 | 157 | $32.25 to $32.73 | $35.37 to $36.04 | $5,613 | 2.35% | 0.20% to 0.60% | 9.66% to 10.10% | |||||||||||||||||||||||||
| 2023 | 155 | $28.08 to $28.46 | $32.25 to $32.73 | $5,044 | 2.11% | 0.20% to 0.60% | 10.80% to 15.26% | |||||||||||||||||||||||||
| 2022 | 154 | $33.60 to $33.88 | $28.08 to $28.46 | $4,356 | 2.58% | 0.10% to 0.60% | (16.43)% to (16.01)% | |||||||||||||||||||||||||
| 2021 | 104 | $30.71 to $30.81 | $33.60 to $33.88 | $3,510 | 1.21% | 0.10% to 0.60% | 9.42% to 9.96% | |||||||||||||||||||||||||
| Vanguard VIF Real Estate Index Portfolio Sub-Account |
|
|||||||||||||||||||||||||||||||
| 2025 | 730 | $38.94 to $40.95 | $39.91 to $42.18 | $30,175 | 2.75% | 0.10% to 0.60% | 2.49% to 3.01% | |||||||||||||||||||||||||
| 2024 | 743 | $37.40 to $39.13 | $38.94 to $40.95 | $29,760 | 3.48% | 0.10% to 0.60% | 4.11% to 4.64% | |||||||||||||||||||||||||
| 2023 | 945 | $33.69 to $35.07 | $37.40 to $39.13 | $36,263 | 2.43% | 0.10% to 0.60% | 11.03% to 11.59% | |||||||||||||||||||||||||
| 2022 | 940 | $45.98 to $47.63 | $33.69 to $35.07 | $32,400 | 1.90% | 0.10% to 0.60% | (26.74)% to (26.37)% | |||||||||||||||||||||||||
| 2021 | 965 | $32.99 to $34.00 | $45.98 to $47.63 | $45,268 | 1.79% | 0.10% to 0.60% | 39.37% to 40.07% | |||||||||||||||||||||||||
| TIAA Separate Account VA-5 (formerly, TIAA-CREF Life Separate Account VA-1) ∎ Statement of Additional Information | B-73 |
Table of Contents
| Notes to financial statements |
TIAA Separate Account VA-5 (formerly, TIAA-CREF Life Separate Account VA-1)
| For the period ended December 31 | ||||||||||||||||||||||||||||||||
| Period | Accumulation units outstanding, end of period (000’s) |
Accumulation unit value, beginning of
period |
Accumulation unit value, end of period lowest to highest |
Net assets, end of period |
Ratio of investment income to average net assets(c)(f) |
Ratio of to average net assets |
Total return(b)(h) | |||||||||||||||||||||||||
| Vanguard VIF Small Company Growth Portfolio Sub-Account |
|
|||||||||||||||||||||||||||||||
| 2025 | 331 | $56.42 to $59.32 | $59.50 to $62.89 | $20,461 | 0.46% | 0.10% to 0.60% | 5.47% to 6.00% | |||||||||||||||||||||||||
| 2024 | 414 | $50.96 to $53.32 | $56.42 to $59.32 | $24,078 | 0.56% | 0.10% to 0.60% | 10.71% to 11.27% | |||||||||||||||||||||||||
| 2023 | 418 | $42.85 to $44.61 | $50.96 to $53.32 | $21,900 | 0.39% | 0.10% to 0.60% | 18.93% to 19.53% | |||||||||||||||||||||||||
| 2022 | 395 | $57.74 to $59.82 | $42.85 to $44.61 | $17,314 | 0.25% | 0.10% to 0.60% | (25.80)% to (25.43)% | |||||||||||||||||||||||||
| 2021 | 383 | $50.86 to $52.42 | $57.74 to $59.82 | $22,560 | 0.36% | 0.10% to 0.60% | 13.53% to 14.10% | |||||||||||||||||||||||||
| Vanguard VIF Total Bond Market Index Portfolio Sub-Account |
|
|||||||||||||||||||||||||||||||
| 2025 | 11,438 | $26.61 to $27.99 | $28.29 to $29.90 | $334,537 | 3.36% | 0.10% to 0.60% | 6.30% to 6.83% | |||||||||||||||||||||||||
| 2024 | 10,664 | $26.45 to $27.67 | $26.61 to $27.99 | $291,791 | 2.75% | 0.10% to 0.60% | 0.63% to 1.14% | |||||||||||||||||||||||||
| 2023 | 10,218 | $25.20 to $26.23 | $26.45 to $27.67 | $276,930 | 2.44% | 0.10% to 0.60% | 4.95% to 5.47% | |||||||||||||||||||||||||
| 2022 | 9,912 | $29.21 to $30.26 | $25.20 to $26.23 | $255,016 | 2.04% | 0.10% to 0.60% | (13.73)% to (13.30)% | |||||||||||||||||||||||||
| 2021 | 9,973 | $29.90 to $30.82 | $29.21 to $30.26 | $296,786 | 1.94% | 0.10% to 0.60% | (2.30)% to (1.82)% | |||||||||||||||||||||||||
| Vanguard VIF Total International Stock Market Index Portfolio Sub-Account |
|
|||||||||||||||||||||||||||||||
| 2025 | 639 | $37.39 to $38.27 | $49.08 to $50.49 | $31,977 | 2.57% | 0.10% to 0.60% | 31.25% to 31.91% | |||||||||||||||||||||||||
| 2024 | 511 | $35.81 to $36.47 | $37.39 to $38.27 | $19,398 | 3.13% | 0.10% to 0.60% | 4.42% to 4.95% | |||||||||||||||||||||||||
| 2023 | 606 | $31.18 to $31.59 | $35.81 to $36.47 | $21,960 | 2.86% | 0.10% to 0.63% | 14.85% to 15.43% | |||||||||||||||||||||||||
| 2022 | 625 | $37.41 to $37.66 | $31.18 to $31.59 | $19,660 | 3.44% | 0.10% to 0.70% | (16.43)% to 12.65% | |||||||||||||||||||||||||
| 2021 | 601 | $34.64 to $34.73 | $37.41 to $37.66 | $22,548 | 0.66% | 0.10% to 0.50% | 7.99% to 8.42% | |||||||||||||||||||||||||
| Vanguard VIF Total Stock Market Index Portfolio Sub-Account |
|
|||||||||||||||||||||||||||||||
| 2025 | 927 | $53.15 to $54.41 | $61.78 to $63.56 | $58,388 | 1.03% | 0.10% to 0.60% | 16.23% to 16.82% | |||||||||||||||||||||||||
| 2024 | 597 | $43.22 to $44.02 | $53.15 to $54.41 | $32,229 | 1.26% | 0.10% to 0.60% | 22.97% to 23.59% | |||||||||||||||||||||||||
| 2023 | 665 | $34.52 to $34.99 | $43.22 to $44.02 | $29,075 | 1.09% | 0.10% to 0.60% | 25.20% to 25.82% | |||||||||||||||||||||||||
| 2022 | 614 | $43.19 to $43.56 | $34.52 to $34.99 | $21,372 | 1.26% | 0.10% to 0.60% | (20.07)% to (19.67)% | |||||||||||||||||||||||||
| 2021 | 526 | $34.59 to $34.70 | $43.19 to $43.56 | $22,822 | 0.67% | 0.10% to 0.60% | 11.74% to 25.51% | |||||||||||||||||||||||||
| VY CBRE Global Real Estate Portfolio-Class I Sub-Account |
|
|||||||||||||||||||||||||||||||
| 2025 | 141 | $49.10 to $52.83 | $52.13 to $56.38 | $7,886 | 2.93% | 0.10% to 0.60% | 6.18% to 6.71% | |||||||||||||||||||||||||
| 2024 | 171 | $49.21 to $52.69 | $49.10 to $52.83 | $8,922 | 3.20% | 0.10% to 0.60% | (0.23)% to 0.28% | |||||||||||||||||||||||||
| 2023 | 158 | $43.97 to $46.84 | $49.21 to $52.69 | $8,146 | 2.02% | 0.10% to 0.60% | 11.92% to 12.97% | |||||||||||||||||||||||||
| 2022 | 154 | $58.93 to $62.47 | $43.97 to $46.84 | $7,065 | 3.27% | 0.10% to 0.60% | (25.40)% to (25.02)% | |||||||||||||||||||||||||
| 2021 | 165 | $44.09 to $46.51 | $58.93 to $62.47 | $10,047 | 2.89% | 0.10% to 0.60% | 33.66% to 34.33% | |||||||||||||||||||||||||
| Western Asset Variable Global High Yield Bond Portfolio-Class I Sub-Account |
|
|||||||||||||||||||||||||||||||
| 2025 | 544 | $19.92 to $21.69 | $22.17 to $23.83 | $12,842 | 6.70% | 0.10% to 0.50% | 9.41% to 9.85% | |||||||||||||||||||||||||
| 2024 | 593 | $18.72 to $20.28 | $19.92 to $21.69 | $12,706 | 6.38% | 0.10% to 0.60% | 6.42% to 6.95% | |||||||||||||||||||||||||
| 2023 | 647 | $17.08 to $18.41 | $18.72 to $20.28 | $12,731 | 5.51% | 0.10% to 0.60% | 9.60% to 10.15% | |||||||||||||||||||||||||
| 2022 | 721 | $19.91 to $21.36 | $17.08 to $18.41 | $12,838 | 6.63% | 0.10% to 0.60% | (14.24)% to (13.81)% | |||||||||||||||||||||||||
| 2021 | 755 | $19.77 to $21.11 | $19.91 to $21.36 | $15,644 | 4.49% | 0.10% to 0.60% | 0.72% to 1.22% | |||||||||||||||||||||||||
| (a) | Does not include expenses of underlying fund. |
| (b) | Not annualized for periods less than one year. Certain bands for some Sub-Accounts were activated in 2025. The commencement date of the activated bands varies across Sub-Accounts. The total return presented for the activated bands represents the return from commencement to December 31, 2025. |
| (c) | Periods less than one year are annualized and are not necessarily indicative of a full year of operations. |
| (f) | These amounts represent the dividends, excluding distributions of capital gains, received by the Sub-Account from the underlying mutual fund, divided by the average net assets. These ratios exclude those expenses, such as mortality and expense charges, that are assessed against contractowner accounts either through reductions in the unit values or the redemption of units. The recognition of investment income by the Sub-Account is affected by the timing of the declaration of dividends by the underlying fund in which the Sub-Account invests. |
| (g) | These amounts represent the annualized expenses of the Sub-Account, consisting primarily of administration and mortality and expense charges, for each period indicated. These ratios include only these expenses that result in a direct reduction to unit values. Charges made directly to contractowner accounts through the redemption of units and expenses of the underlying fund have been excluded. |
| (h) | These amounts represent the total return for the periods indicated, including changes in the value of the underlying fund, and expenses assessed through the reduction of unit values. These total returns do not include any expenses assessed through the redemption of units. Investment options with a date notation indicate the effective date of that investment option in the Sub-Account. The total return is calculated for each period indicated or from the effective date through the end of the reporting period. As the total return is presented as a range of minimum to maximum values, with varying expense ratio amounts, some individual contractowners total returns may not be within the ranges presented. |
| (i) | Sub-account commenced operations on April 30, 2021. |
| (j) | Sub-account commenced operations on December 8, 2023. |
| (k) | Sub-account commenced operations on April 26, 2024. |
| B-74 | Statement of Additional Information ∎ TIAA Separate Account VA-5 (formerly, TIAA-CREF Life Separate Account VA-1) |
Table of Contents
Table of contents for audited statutory—basis financial statements
| TEACHERS INSURANCE AND ANNUITY ASSOCIATION OF AMERICA December 31, 2025 | ||
| Page | ||
| Report of independent auditors | B-76 | |
| Statutory–basis financial statements: | ||
| Statements of admitted assets, liabilities and capital and contingency reserves | B-78 | |
| Statements of operations | B-79 | |
| Statements of changes in capital and contingency reserves | B-80 | |
| Statements of cash flows | B-81 | |
| Notes to financial statements | B-82 | |
| Teachers Insurance and Annuity Association of America ∎ Statement of Additional Information | B-75 |
Table of Contents

Report of independent auditors
To the Board of Trustees of Teachers Insurance and Annuity Association of America
Opinions
We have audited the accompanying statutory-basis financial statements of Teachers Insurance and Annuity Association of America (the “Company”), which comprise the statutory-basis statements of admitted assets, liabilities and capital and contingency reserves as of December 31, 2025 and 2024, and the related statutory-basis statements of operations, of changes in capital and contingency reserves, and of cash flows for each of the three years in the period ended December 31, 2025, including the related notes (collectively referred to as the “financial statements”).
Unmodified opinion on statutory basis of accounting
In our opinion, the accompanying financial statements present fairly, in all material respects, the admitted assets, liabilities and capital and contingency reserves of the Company as of December 31, 2025 and 2024, and the results of its operations and its cash flows for each of the three years in the period ended December 31, 2025, in accordance with the accounting practices prescribed or permitted by the New York State Department of Financial Services described in Note 2.
Adverse opinion on U.S. generally accepted accounting principles
In our opinion, because of the significance of the matter discussed in the Basis for Adverse Opinion on U.S. Generally Accepted Accounting Principles section of our report, the accompanying financial statements do not present fairly, in accordance with accounting principles generally accepted in the United States of America, the financial position of the Company as of December 31, 2025 and 2024, or the results of its operations or its cash flows for each of the three years in the period ended December 31, 2025.
Basis for opinions
We conducted our audit in accordance with auditing standards generally accepted in the United States of America (US GAAS). Our responsibilities under those standards are further described in the Auditors’ Responsibilities for the Audit of the Financial Statements section of our report. We are required to be independent of the Company and to meet our other ethical responsibilities, in accordance with the relevant ethical requirements relating to our audit. We believe that the audit evidence we have obtained is sufficient and appropriate to provide a basis for our audit opinions.
Basis for adverse opinion on U.S. generally accepted accounting principles
As described in Note 2 to the financial statements, the financial statements are prepared by the Company on the basis of the accounting practices prescribed or permitted by the New York State Department of Financial Services, which is a basis of accounting other than accounting principles generally accepted in the United States of America.
The effects on the financial statements of the variances between the statutory basis of accounting described in Note 2 and accounting principles generally accepted in the United States of America, although not reasonably determinable, are presumed to be material.
PricewaterhouseCoopers LLP
300 Madison Avenue
New York, New York 10017
(646) 471 3000
| B-76 | Statement of Additional Information ∎ Teachers Insurance and Annuity Association of America |
Table of Contents
Responsibilities of management for the financial statements
Management is responsible for the preparation and fair presentation of the financial statements in accordance with the accounting practices prescribed or permitted by the New York State Department of Financial Services. Management is also responsible for the design, implementation, and maintenance of internal control relevant to the preparation and fair presentation of financial statements that are free from material misstatement, whether due to fraud or error.
In preparing the financial statements, management is required to evaluate whether there are conditions or events, considered in the aggregate, that raise substantial doubt about the Company’s ability to continue as a going concern for one year after the date the financial statements are available to be issued.
Auditors’ responsibilities for the audit of the financial statements
Our objectives are to obtain reasonable assurance about whether the financial statements as a whole are free from material misstatement, whether due to fraud or error, and to issue an auditors’ report that includes our opinion. Reasonable assurance is a high level of assurance but is not absolute assurance and therefore is not a guarantee that an audit conducted in accordance with US GAAS will always detect a material misstatement when it exists. The risk of not detecting a material misstatement resulting from fraud is higher than for one resulting from error, as fraud may involve collusion, forgery, intentional omissions, misrepresentations, or the override of internal control. Misstatements are considered material if there is a substantial likelihood that, individually or in the aggregate, they would influence the judgment made by a reasonable user based on the financial statements.
In performing an audit in accordance with US GAAS, we:
| • | Exercise professional judgment and maintain professional skepticism throughout the audit. |
| • | Identify and assess the risks of material misstatement of the financial statements, whether due to fraud or error, and design and perform audit procedures responsive to those risks. Such procedures include examining, on a test basis, evidence regarding the amounts and disclosures in the financial statements. |
| • | Obtain an understanding of internal control relevant to the audit in order to design audit procedures that are appropriate in the circumstances, but not for the purpose of expressing an opinion on the effectiveness of the Company’s internal control. Accordingly, no such opinion is expressed. |
| • | Evaluate the appropriateness of accounting policies used and the reasonableness of significant accounting estimates made by management, as well as evaluate the overall presentation of the financial statements. |
| • | Conclude whether, in our judgment, there are conditions or events, considered in the aggregate, that raise substantial doubt about the Company’s ability to continue as a going concern for a reasonable period of time. |
We are required to communicate with those charged with governance regarding, among other matters, the planned scope and timing of the audit, significant audit findings, and certain internal control-related matters that we identified during the audit.
/s/ PricewaterhouseCoopers LLP
New York, New York
March 11, 2026
| Teachers Insurance and Annuity Association of America ∎ Statement of Additional Information | B-77 |
Table of Contents
Statutory–basis statements of admitted assets, liabilities and capital and contingency reserves
Teachers Insurance and Annuity Association of America
| December 31, | ||||||||||||
| (in millions, except share amounts) | 2025 | 2024 | ||||||||||
| ADMITTED ASSETS |
||||||||||||
| Bonds |
$ | 222,873 | $ | 213,616 | ||||||||
| Preferred stocks |
908 | 1,054 | ||||||||||
| Common stocks |
3,920 | 2,361 | ||||||||||
| Mortgage loans |
36,692 | 38,205 | ||||||||||
| Real estate |
3,424 | 3,518 | ||||||||||
| Cash, cash equivalents and short-term investments |
520 | 3,541 | ||||||||||
| Contract loans |
362 | 433 | ||||||||||
| Derivatives |
1,448 | 1,929 | ||||||||||
| Securities lending collateral assets |
2,474 | 1,373 | ||||||||||
| Other invested assets |
43,663 | 43,476 | ||||||||||
| Total cash and invested assets |
316,284 | 309,506 | ||||||||||
| Investment income due and accrued |
2,288 | 2,128 | ||||||||||
| Net deferred federal income tax asset |
1,783 | 1,799 | ||||||||||
| Other assets |
1,873 | 1,248 | ||||||||||
| Separate account assets |
58,134 | 53,294 | ||||||||||
| Total admitted assets |
$ | 380,362 | $ | 367,975 | ||||||||
| LIABILITIES, CAPITAL AND CONTINGENCY RESERVES |
||||||||||||
| Liabilities |
||||||||||||
| Reserves for life and health insurance, annuities and deposit-type contracts |
$ | 263,239 | $ | 257,099 | ||||||||
| Dividends due to policyholders |
2,312 | 2,308 | ||||||||||
| Interest maintenance reserve |
1,193 | 1,539 | ||||||||||
| Borrowed money |
110 | 100 | ||||||||||
| Asset valuation reserve |
6,358 | 6,172 | ||||||||||
| Derivatives |
831 | 98 | ||||||||||
| Payable for collateral for securities loaned |
2,474 | 1,373 | ||||||||||
| Other liabilities |
5,170 | 6,005 | ||||||||||
| Separate account liabilities |
57,002 | 52,231 | ||||||||||
| Total liabilities |
338,689 | 326,925 | ||||||||||
| Capital and Contingency Reserves |
||||||||||||
| Capital stock and additional paid-in capital (2,500 shares of $1,000 par value common stock authorized, issued and outstanding and $550,000 paid-in capital) |
3 | 3 | ||||||||||
| Surplus notes |
5,942 | 5,942 | ||||||||||
| Contingency reserves: |
||||||||||||
| For investment losses, annuity and insurance mortality, and other risks |
35,728 | 35,105 | ||||||||||
| Total capital and contingency reserves |
41,673 | 41,050 | ||||||||||
| Total liabilities, capital and contingency reserves |
$ | 380,362 | $ | 367,975 | ||||||||
| B-78 | Statement of Additional Information ∎ Teachers Insurance and Annuity Association of America | See notes to statutory-basis financial statements |
Table of Contents
Statutory–basis statements of operations
Teachers Insurance and Annuity Association of America
| For the Years Ended December 31, | ||||||||||||||||
| (in millions) | 2025 | 2024 | 2023 | |||||||||||||
| REVENUES |
||||||||||||||||
| Insurance and annuity premiums and other considerations |
$ | 21,842 | $ | 19,876 | $ | 19,457 | ||||||||||
| Annuity dividend additions |
2,314 | 2,723 | 3,065 | |||||||||||||
| Net investment income |
14,612 | 13,931 | 13,640 | |||||||||||||
| Other revenue |
360 | 355 | 357 | |||||||||||||
| Total revenues |
$ | 39,128 | $ | 36,885 | $ | 36,519 | ||||||||||
| BENEFITS AND EXPENSES |
||||||||||||||||
| Policy and contract benefits |
$ | 27,088 | $ | 26,499 | $ | 27,993 | ||||||||||
| Dividends to policyholders |
4,329 | 4,661 | 5,100 | |||||||||||||
| Increase in policy and contract reserves |
5,213 | 3,648 | 3,905 | |||||||||||||
| Net operating expenses |
1,440 | 1,645 | 1,636 | |||||||||||||
| Net transfers to (from) separate accounts |
(1,294 | ) | (906 | ) | (3,082 | ) | ||||||||||
| Total benefits and expenses |
$ | 36,776 | $ | 35,547 | $ | 35,552 | ||||||||||
| Income before federal income taxes and net realized capital gains (losses) |
$ | 2,352 | $ | 1,338 | $ | 967 | ||||||||||
| Federal income tax expense (benefit) |
4 | (125 | ) | 8 | ||||||||||||
| Net realized capital gains (losses) less capital gains taxes, after transfers to the interest maintenance reserve |
(2,510 | ) | (2,677 | ) | (1,690 | ) | ||||||||||
| Net income (loss) |
$ | (162 | ) | $ | (1,214 | ) | $ | (731 | ) | |||||||
| See notes to statutory-basis financial statements | Teachers Insurance and Annuity Association of America ∎ Statement of Additional Information | B-79 |
Table of Contents
Statutory–basis statements of changes in capital and
contingency reserves
Teachers Insurance and Annuity Association of America
| (in millions) | Capital Stock and Additional Paid-in Capital |
Surplus Notes |
Contingency Reserves |
Total | ||||||||||||
| Balance, December 31, 2022 |
$ | 3 | $ | 6,291 | $ | 36,435 | $ | 42,729 | ||||||||
| Net income (loss) |
— | — | (731 | ) | (731 | ) | ||||||||||
| Change in net unrealized capital gains (losses) on investments, net of $(55) in taxes |
— | — | 230 | 230 | ||||||||||||
| Change in asset valuation reserve |
— | — | (226 | ) | (226 | ) | ||||||||||
| Change in liability for reinsurance in unauthorized companies |
— | — | 1 | 1 | ||||||||||||
| Change in net deferred income tax |
— | — | 609 | 609 | ||||||||||||
| Change in post-retirement benefit liability |
— | — | (4 | ) | (4 | ) | ||||||||||
| Change in non-admitted assets: |
||||||||||||||||
| Deferred federal income tax asset |
— | — | (126 | ) | (126 | ) | ||||||||||
| Other assets |
— | — | (342 | ) | (342 | ) | ||||||||||
| Surplus (contributed to) withdrawn from Separate Accounts |
— | — | (618 | ) | (618 | ) | ||||||||||
| Change in surplus in separate accounts |
— | — | 594 | 594 | ||||||||||||
| Balance, December 31, 2023 |
$ | 3 | $ | 6,291 | $ | 35,822 | $ | 42,116 | ||||||||
| Net income (loss) |
— | — | (1,214 | ) | (1,214 | ) | ||||||||||
| Change in net unrealized capital gains (losses) on investments, net of $(18) in taxes |
— | — | 73 | 73 | ||||||||||||
| Change in asset valuation reserve |
— | — | 701 | 701 | ||||||||||||
| Change in net deferred income tax |
— | — | 385 | 385 | ||||||||||||
| Change in post-retirement benefit liability |
— | — | (6 | ) | (6 | ) | ||||||||||
| Change in non-admitted assets: |
||||||||||||||||
| Deferred federal income tax asset |
— | — | (309 | ) | (309 | ) | ||||||||||
| Other assets |
— | — | (313 | ) | (313 | ) | ||||||||||
| Surplus (contributed to) withdrawn from Separate Accounts |
— | — | (294 | ) | (294 | ) | ||||||||||
| Change in surplus of separate accounts |
— | — | 260 | 260 | ||||||||||||
| Change in surplus notes |
— | (349 | ) | — | (349 | ) | ||||||||||
| Balance, December 31, 2024 |
$ | 3 | $ | 5,942 | $ | 35,105 | $ | 41,050 | ||||||||
| Net income (loss) |
— | — | (162 | ) | (162 | ) | ||||||||||
| Change in net unrealized capital gains (losses) on investments, net of $(210) in taxes |
— | — | 867 | 867 | ||||||||||||
| Change in asset valuation reserve |
— | — | (186 | ) | (186 | ) | ||||||||||
| Change in liability for reinsurance in unauthorized companies |
— | — | (6 | ) | (6 | ) | ||||||||||
| Change in net deferred income tax |
— | — | 237 | 237 | ||||||||||||
| Change in post-retirement benefit liability |
— | — | (9 | ) | (9 | ) | ||||||||||
| Change in non-admitted assets: |
||||||||||||||||
| Deferred federal income tax asset |
— | — | (43 | ) | (43 | ) | ||||||||||
| Other assets |
— | — | (109 | ) | (109 | ) | ||||||||||
| Change in surplus of separate accounts |
— | — | 34 | 34 | ||||||||||||
| Balance, December 31, 2025 |
$ | 3 | $ | 5,942 | $ | 35,728 | $ | 41,673 | ||||||||
| B-80 | Statement of Additional Information ∎ Teachers Insurance and Annuity Association of America | See notes to statutory-basis financial statements |
Table of Contents
Statutory–basis statements of cash flows
Teachers Insurance and Annuity Association of America
| For the Years Ended December 31, | ||||||||||||||||
| (in millions) | 2025 | 2024 | 2023 | |||||||||||||
| CASH FROM OPERATIONS |
||||||||||||||||
| Insurance and annuity premiums and other considerations |
$ | 21,850 | $ | 19,889 | $ | 19,457 | ||||||||||
| Net investment income |
13,912 | 13,422 | 12,967 | |||||||||||||
| Miscellaneous income |
318 | 335 | 343 | |||||||||||||
| Total receipts |
36,080 | 33,646 | 32,767 | |||||||||||||
| Policy and contract benefits |
26,239 | 25,849 | 27,397 | |||||||||||||
| Operating expenses |
1,217 | 1,665 | 1,536 | |||||||||||||
| Dividends paid to policyholders |
2,011 | 1,990 | 1,943 | |||||||||||||
| Federal income taxes paid (received) |
4 | (40 | ) | (31 | ) | |||||||||||
| Net transfers to (from) separate accounts |
(1,294 | ) | (595 | ) | (2,479 | ) | ||||||||||
| Total Disbursements |
28,177 | 28,869 | 28,366 | |||||||||||||
| Net cash from operations |
7,903 | 4,777 | 4,401 | |||||||||||||
| CASH FROM INVESTMENTS |
||||||||||||||||
| Proceeds from investments sold, matured, or repaid: |
||||||||||||||||
| Bonds |
25,763 | 20,226 | 24,883 | |||||||||||||
| Stocks |
3,123 | 2,543 | 7,482 | |||||||||||||
| Mortgage loans and real estate |
5,821 | 4,012 | 2,630 | |||||||||||||
| Other invested assets |
4,996 | 3,885 | 2,950 | |||||||||||||
| Miscellaneous proceeds |
312 | 1,026 | 1,331 | |||||||||||||
| Cost of investments acquired: |
||||||||||||||||
| Bonds |
34,574 | 21,469 | 21,896 | |||||||||||||
| Stocks |
4,438 | 2,984 | 3,329 | |||||||||||||
| Mortgage loans and real estate |
3,738 | 2,193 | 6,049 | |||||||||||||
| Other invested assets |
4,960 | 5,484 | 10,056 | |||||||||||||
| Miscellaneous applications |
3,205 | 1,338 | 1,071 | |||||||||||||
| Net cash used in investments |
(10,900 | ) | (1,776 | ) | (3,125 | ) | ||||||||||
| CASH FROM FINANCING AND OTHER |
||||||||||||||||
| Surplus notes |
1 | (350 | ) | — | ||||||||||||
| Borrowed money |
10 | (60 | ) | 60 | ||||||||||||
| Net deposits on deposit-type contracts funds |
63 | 104 | (60 | ) | ||||||||||||
| Other cash provided (applied) |
(98 | ) | 48 | (1,780 | ) | |||||||||||
| Net cash from financing and other |
(24 | ) | (258 | ) | (1,780 | ) | ||||||||||
| NET CHANGE IN CASH, CASH EQUIVALENTS AND SHORT-TERM INVESTMENTS |
(3,021 | ) | 2,743 | (504 | ) | |||||||||||
| CASH, CASH EQUIVALENTS AND SHORT-TERM INVESTMENTS, BEGINNING OF YEAR |
3,541 | 798 | 1,302 | |||||||||||||
| CASH, CASH EQUIVALENTS AND SHORT-TERM INVESTMENTS, END OF YEAR |
$ | 520 | $ | 3,541 | $ | 798 | ||||||||||
| See notes to statutory-basis financial statements | Teachers Insurance and Annuity Association of America ∎ Statement of Additional Information | B-81 |
Table of Contents
| Notes to statutory–basis financial statements |
Teachers Insurance and Annuity Association of America
December 31, 2025
Note 1—organization
Teachers Insurance and Annuity Association of America (“TIAA” or the “Company”) was established in 1918 as a stock life insurance company under the insurance laws of the State of New York. All of the outstanding common stock of TIAA is held by the TIAA Board of Governors (“Board of Governors”), a not-for-profit corporation incorporated in the State of New York originally created for the purpose of holding the stock of TIAA.
On December 4, 2025, the Company and its wholly owned subsidiary, TIAA-CREF Life Insurance Company (“TIAA Life”), executed an Agreement and Plan of Merger. Effective at the close of business on December 31, 2025, after the receipt of all required regulatory approvals, TIAA Life merged with and into the Company, with the Company as the surviving entity.
The merger was accounted for in accordance with SSAP 68, Business Combinations and Goodwill, as a statutory merger. As such, financial statements for periods prior to the merger were combined and the recorded assets, liabilities, and surplus of TIAA Life on a statutory basis were carried forward to the merged company. The common capital stock of TIAA Life was deemed cancelled by operation of law under the Plans of Merger. Each share of the Company’s capital stock issued and outstanding immediately before the merger continues to represent one share of the capital stock.
Summarized financial information for TIAA and TIAA Life presented separately for the current year and the periods prior to the merger is as follows:
| December 31, 2025 | ||||||||||||||||
| TIAA | TIAA Life | Eliminations | Merged Totals | |||||||||||||
| Total admitted assets |
$ | 361,260 | $ | 19,997 | $ | (895 | ) | $ | 380,362 | |||||||
| Total liabilities |
319,587 | 19,112 | (10 | ) | 338,689 | |||||||||||
| Total capital and contingency reserves |
41,673 | 885 | (885 | ) | 41,673 | |||||||||||
| Total revenues |
38,348 | 780 | — | 39,128 | ||||||||||||
| Total benefits and expenses |
36,090 | 686 | — | 36,776 | ||||||||||||
| Net income (loss) |
(242 | ) | 80 | — | (162 | ) | ||||||||||
| Other surplus adjustments |
862 | (20 | ) | (57 | ) | 785 | ||||||||||
| December 31, 2024 | ||||||||||||||||
| TIAA | TIAA Life | Eliminations | Merged Totals | |||||||||||||
| Total admitted assets |
$ | 349,971 | $ | 18,838 | $ | (834 | ) | $ | 367,975 | |||||||
| Total liabilities |
308,918 | 18,013 | (6 | ) | 326,925 | |||||||||||
| Total capital and contingency reserves |
41,053 | 825 | (828 | ) | 41,050 | |||||||||||
| Total revenues |
36,260 | 685 | (60 | ) | 36,885 | |||||||||||
| Total benefits and expenses |
34,936 | 611 | — | 35,547 | ||||||||||||
| Net income (loss) |
(1,216 | ) | 62 | (60 | ) | (1,214 | ) | |||||||||
| Other surplus adjustments |
158 | (69 | ) | 59 | 148 | |||||||||||
| December 31, 2023 | ||||||||||||||||
| TIAA | TIAA Life | Eliminations | Merged Totals | |||||||||||||
| Total capital and contingency reserves |
$ | 42,111 | $ | 832 | $ | (827 | ) | $ | 42,116 | |||||||
| Total revenues |
35,985 | 652 | (118 | ) | 36,519 | |||||||||||
| Total benefits and expenses |
34,975 | 577 | — | 35,552 | ||||||||||||
| Net income (loss) |
(674 | ) | 61 | (118 | ) | (731 | ) | |||||||||
| Other surplus adjustments |
63 | (126 | ) | 181 | 118 | |||||||||||
Eliminations included in the table above represent adjustments for TIAA’s investment in TIAA Life within total admitted assets and capital and contingency reserves, as well as related intercompany activity, including dividends paid from TIAA Life to TIAA included within total revenues and net income (loss).
The Company’s primary purpose is to aid and strengthen non-profit educational and research organizations, governmental entities, and other non-profit institutions by providing retirement and insurance benefits for their employees and their families and by counseling such organizations and their employees on benefit plans and other measures of economic security. In addition, TIAA may otherwise engage in any business permitted under the New York Insurance Law for a domestic life stock insurance company, provided that such business supports this purpose, including without limitation by (i) enhancing the creditworthiness, financial strength and reputation of TIAA, (ii) providing all of the holders and beneficiaries of TIAA’s contracts and policies with
| B-82 | Statement of Additional Information ∎ Teachers Insurance and Annuity Association of America |
Table of Contents
| continued |
benefits of scale, increased diversity in offered products and newly innovated products and (iii) providing for additional infrastructure and support to TIAA.
The Company also issues non-qualified annuity contracts with fixed and variable components, and funding agreements issued directly to states in support of state sponsored 529 college savings and scholarship plans.
Note 2—significant accounting policies
Basis of Presentation:
The financial statements of TIAA are presented on the basis of statutory accounting principles prescribed or permitted by the New York State Department of Financial Services (“NYDFS” or the “Department”); a comprehensive basis of accounting that differs from accounting principles generally accepted in the United States (“GAAP”). The Department requires insurance companies domiciled in the State of New York to prepare their statutory-basis financial statements in accordance with the National Association of Insurance Commissioners’ (“NAIC”) Accounting Practices and Procedures Manual (“NAIC SAP”), subject to any deviation prescribed or permitted by the Department (“New York SAP”).
Under Regulation No. 172 (11 NYCRR 83), the Department did not adopt certain NAIC SAP guidance, specifically subparagraph 4.a. of SSAP No. 26R, Bonds, and the third sentence in footnote 1 of SSAP No. 97, Investments in Subsidiary, Controlled and Affiliated Entities, to treat certain exchange traded funds (“ETFs”) designated by the Securities Valuation Office (“SVO”), (“SVO-Identified ETFs”), as qualifying for bond accounting treatment. Rather, the Department requires these SVO-identified ETFs to be reflected as equities under SSAP No. 30R, “Unaffiliated Common Stock”. However, if the ETF meets certain criteria, the asset valuation reserve (“AVR”) and interest maintenance reserve (“IMR”) may be retained under SSAP No. 26R, and the ETF can be treated as a bond for the purpose of a domestic insurer’s risk based capital (“RBC”) report. The total balance of investment grade ETF holdings treated as equities as of December 31, 2025 and 2024, but treated as bonds for AVR, IMR and RBC, are $2,248 million and $648 million, respectively. This prescribed practice does not result in a difference to net income or capital and contingency reserves when compared to NAIC SAP.
The table below provides a reconciliation of the Company’s net income and capital and contingency reserves between NAIC SAP and the New York SAP Annual Statement filed with the Department.
|
For the Years Ended December 31, |
||||||||||||||||
| (in millions) | NAIC SAP# |
Financial Statement Line | 2025 | 2024 | 2023 | |||||||||||
| Net income, New York SAP |
$ | (162 | ) | $ | (1,214 | ) | $ | (731 | ) | |||||||
| New York SAP Prescribed Practices that are an increase/(decrease) to NAIC SAP: |
||||||||||||||||
| Additional reserves for term conversions |
51R | Increase in policy and contract reserves | (2 | ) | (3 | ) | (3 | ) | ||||||||
| Net income (loss), NAIC SAP |
$ | (164 | ) | $ | (1,217 | ) | $ | (734 | ) | |||||||
| Capital and surplus, New York SAP |
$ | 41,673 | $ | 41,050 | $ | 42,116 | ||||||||||
| New York SAP Prescribed Practices that are an increase/(decrease) to NAIC SAP: |
||||||||||||||||
| Deferred Premium Asset Limitation |
51R, 61R | Other assets | — | — | 1 | |||||||||||
| Additional reserves for term conversions |
51R | Reserves for life and health insurance, annuities and deposit-type contracts | 15 | 17 | 19 | |||||||||||
| Capital and surplus, NAIC SAP |
$ | 41,688 | $ | 41,067 | $ | 42,136 | ||||||||||
The additional reserve for the term conversions results from the Department requiring in Regulation No. 147 (11 NYCRR 98), Valuation of Life Insurance Reserves, Section 98.4 for any policy which guarantees renewal, or conversion to another policy, without evidence of insurability, additional reserves shall be held to account for excess mortality due to anti-selection with appropriate margins to cover expenses and risk of moderately adverse deviations in experience.
The deferred premium asset limitation results from the NYDFS Circular Letter No. 11 (2010), which prescribed the calculation and clarified the accounting for deferred premium assets when reinsurance is involved.
The Company’s RBC as of December 31, 2025 and 2024 would not have triggered a regulatory event without the use of the New York SAP prescribed and permitted practices.
Accounting Principles Generally Accepted in the United States: The Financial Accounting Standards Board (“FASB”) dictates the accounting principles for financial statements that are prepared in conformity with GAAP with applicable authoritative accounting pronouncements. As a result, the Company cannot refer to financial statements prepared in accordance with NAIC SAP and New York SAP as having been prepared in accordance with GAAP.
| Teachers Insurance and Annuity Association of America ∎ Statement of Additional Information | B-83 |
Table of Contents
| Notes to statutory–basis financial statements |
Teachers Insurance and Annuity Association of America
December 31, 2025
The primary differences between GAAP and NAIC SAP can be summarized as follows:
Under GAAP:
| • | Investments in bonds considered to be available-for-sale (“AFS”) are carried at fair value rather than at amortized cost under NAIC SAP; |
| • | For held-to-maturity and AFS investments, lifetime expected credit losses are immediately recognized through the allowance for credit losses, and is adjusted at each reporting period. Under NAIC SAP, an impairment for securities other than asset-backed securities is recorded through earnings for the difference between amortized cost and fair value. For asset-backed securities, non-interest related other-than-temporary impairment (“OTTI”) losses shall be recorded through the AVR, while interest related other-than-temporary impairment losses may be recorded through the IMR in certain circumstances; |
| • | If in the aggregate, the Company has a net negative cash balance, the negative cash is recorded as a liability rather than as a negative asset under NAIC SAP; |
| • | Changes in the allowance for estimable uncollectible amounts related to mortgage loans are recorded through earnings rather than as unrealized losses on impairments included in the AVR, which is a component of surplus under NAIC SAP; |
| • | Changes in the value of certain other invested assets accounted for under the equity method of accounting are recorded through earnings rather than as unrealized gains (losses), which is a component of surplus under NAIC SAP; |
| • | Investments in wholly-owned subsidiaries, other entities under the control of the parent, and certain variable interest entities are consolidated in the parent’s financial statements rather than being carried at the parent’s share of the underlying GAAP equity or statutory surplus of a domestic insurance subsidiary under NAIC SAP; |
| • | Contracts that contain an embedded derivative are bifurcated from the host contract and accounted for separately under GAAP, whereas under NAIC SAP, the embedded derivative is not bifurcated between components and is accounted for as part of the host contract; |
| • | All derivative instruments are carried at fair value under GAAP, whereas under NAIC SAP, certain derivative instruments are carried at amortized cost; |
| • | Changes in the fair value of derivative instruments are generally reported through earnings unless they qualify and are designated for cash flow or net investment hedge accounting, whereas under NAIC SAP, changes in the fair value of derivative instruments not carried at amortized cost are recorded as unrealized capital gains or losses and reported as changes in surplus; |
| • | Certain assets designated as “non-admitted assets” and excluded from assets in the statutory balance sheet are included in the GAAP balance sheet; |
| • | Surplus notes are reported as a liability under GAAP rather than a component of capital and contingency reserves under NAIC SAP; |
| • | The AVR is not recognized under GAAP. The AVR is established under NAIC SAP with changes recorded as a direct charge to surplus; |
| • | The IMR is not recognized under GAAP. The realized gains and losses resulting from changes in interest rates are reported as a component of net income under GAAP rather than being deferred and subsequently amortized into income over the remaining expected life of the investment sold under NAIC SAP; |
| • | Dividends on participating policies are accrued when earned under GAAP rather than being recognized for the year when they are approved under NAIC SAP; |
| • | Policy acquisition costs, such as commissions, and other costs incurred in connection with acquiring new business, are deferred and amortized over the expected lives of the policies issued rather than being expensed when incurred under NAIC SAP; |
| • | Policy and contract reserves are based on management’s best estimates of expected mortality, morbidity, persistency and interest rather than being based on statutory mortality, morbidity and interest requirements under NAIC SAP; |
| • | Deferred income taxes, subject to valuation allowance, include federal and state income taxes and changes in the deferred tax are reflected in earnings. Under NAIC SAP, deferred taxes exclude state income taxes and are admitted to the extent they can be realized within three years subject to a 15% limitation of capital and surplus with changes in the net deferred tax reflected as a component of surplus; |
| • | Contracts that do not subject the Company to significant risks arising from policyholder mortality or morbidity are reported as a deposit liability. Under NAIC SAP, an annuity contract containing a life contingency is required to be classified as a life insurance contract, regardless of the significance of any mortality and morbidity risk, and amounts received and paid under these contracts are reported as revenue and benefits, respectively; |
| • | Assets and liabilities are reported gross of reinsurance under GAAP and net of reinsurance under NAIC SAP. Certain reinsurance transactions are accounted for as financing transactions under GAAP and as reinsurance under NAIC SAP. |
| B-84 | Statement of Additional Information ∎ Teachers Insurance and Annuity Association of America |
Table of Contents
| continued |
| Transactions recorded as financing have no impact on premiums or losses incurred, while under NAIC SAP, premiums paid to the reinsurer are recorded as ceded premiums (a reduction in revenue) and expected reimbursement for losses from the reinsurer are recorded as a reduction in losses; |
| • | When reserves ceded to an unauthorized reinsurer exceed the assets or letters of credit supporting the reserves no liability is established under GAAP. Under NAIC SAP, a liability is established and changes to these amounts are credited or charged directly to unassigned surplus (deficit). |
| • | Revenue recognition for administrative service expense reimbursements are recognized as gross revenue and gross expense in the Statements of Operations when the Company is the principal in the transaction and where the Company controls the administrative services before transferring them to the customer. Under NAIC SAP, the administration expenses incurred are included in operating expenses and any offsetting reimbursements are netted against operating expenses. |
The effects of these differences, while not determined, are presumed to be material.
Use of Estimates: The preparation of statutory-basis financial statements requires management to make estimates and assumptions that impact the reported amounts of assets and liabilities at the date of the financial statements. Management is also required to disclose contingent assets and liabilities at the date of the financial statements and the reported amounts of revenues and expenses during the reporting periods. Actual results may differ from those estimates.
The most significant estimates include those used in the recognition of OTTIs, reserves for life and health insurance, annuities and deposit-type contracts and the valuation of deferred tax assets.
Reclassifications: Certain prior year amounts within these financial statement footnotes have been reclassified to conform to the current year presentation. No reclassifications were made to the Statements of Admitted Assets, Liabilities, and Capital and Contingency Reserves and the related Statements of Operations, Changes in Capital and Contingency Reserves, and Cash Flows.
Accounting policies:
The following is a summary of the significant accounting policies followed by the Company:
Bonds: Upon acquisition, the Company classifies bonds as either issuer credit obligations (“ICO”) or asset-backed securities (“ABS”). Bonds classified as ICO are supported entirely by the general creditworthiness of the issuer. Bonds classified as ABS are repaid by cash flows derived from specified underlying assets, subject to additional requirements related to credit enhancement and meaningful cash flows. Debt securities not meeting the criteria for either ICO or ABS classification are reported as debt securities not meeting the definition of a bond included in Other Invested Assets.
Bonds are stated at amortized cost using the constant yield method. Bonds in or near default (rated NAIC 6) are stated at the lower of amortized cost or fair value. NAIC ratings are applied to bonds and other securities. Categories 1 and 2 are considered investment grade, while Categories 3 through 6 are considered below investment grade. The principal for Treasury Inflation Protected Securities (“TIPS”) bonds is adjusted based on inflation and is recorded as an unrealized gain or loss and amortized over the remaining life of the security. Bonds are recorded on a trade date basis, except for private placement bonds, which are recorded on the funding date. Bonds that the Company intends to sell prior to maturity (“held for sale”) are stated at the lower of amortized cost or fair value.
Estimated future cash flows and expected prepayment speeds are used to determine the amortization of asset-backed securities under the prospective method. Expected future cash flows and prepayment speeds are evaluated quarterly. Certain asset-backed securities are reported at the lower of amortized cost or fair value as a result of the NAIC modeling process.
If it is determined that a decline in the fair value of a bond, excluding asset-backed securities, is other-than-temporary, the cost basis of the bond is written down to fair value and the amount of the write down is accounted for as a realized loss. The new cost basis is not changed for subsequent recoveries in fair value. Future declines in fair value which are determined to be other-than-temporary are recorded as realized losses.
For asset-backed securities and debt securities that do not qualify as bonds which the Company has the intent and ability to hold for a period of time sufficient to recover the amortized cost basis, when an OTTI has occurred because the Company does not expect to recover the entire amortized cost basis of the security, the amount of the OTTI recognized as a realized loss is the difference between the security’s amortized cost basis and the present value of cash flows expected to be collected, discounted at the asset-backed security’s effective interest rate.
For asset-backed securities and debt securities that do not qualify as bonds , when an OTTI has occurred because the Company intends to sell the security or does not have the intent and ability to retain the security for a period of time sufficient to recover the amortized cost basis, the amount of the OTTI realized is the difference between the security’s amortized cost basis and fair value at the balance sheet date.
| Teachers Insurance and Annuity Association of America ∎ Statement of Additional Information | B-85 |
Table of Contents
| Notes to statutory–basis financial statements |
Teachers Insurance and Annuity Association of America
December 31, 2025
In periods subsequent to the recognition of an OTTI loss for an asset-backed security, the Company accounts for the other-than-temporarily impaired security as if the security had been purchased on the measurement date of the impairment. The difference between the new amortized cost basis and the cash flows expected to be collected is accreted as interest income in future periods based on prospective changes in cash flow estimates.
Preferred Stocks: Non-perpetual preferred stocks are stated at amortized cost unless they have an NAIC rating designation of 4, 5, or 6, which are stated at the lower of amortized cost or fair value. Perpetual and mandatory convertible preferred stocks are carried at fair value. The fair value of preferred stocks is determined using prices provided by independent pricing services or internally developed pricing models. When it is determined that a decline in fair value of an investment is other-than-temporary, the cost basis of the investment is reduced to its fair value and the amount of the reduction is accounted for as a realized loss.
Common Stocks: Unaffiliated common stocks are stated at fair value, which is based on quoted market prices, where available. Changes in fair value are recorded through surplus as an unrealized gain or loss. When it is determined that a decline in fair value of an investment is other-than-temporary, the cost basis of the investment is reduced to its fair value and the amount of the reduction is accounted for as a realized loss. Investment grade bond ETFs are accounted for as common stocks and are stated at fair value.
Investments in subsidiary, controlled and affiliated (“SCA”) entities are stated at the value of their underlying net assets as follows: (1) domestic insurance subsidiaries are stated at the value of their underlying statutory surplus, and (2) non-insurance subsidiaries are stated at the value of their underlying audited GAAP equity. Dividends and distributions from subsidiaries are recorded in investment income to the extent they are not in excess of the investee’s undistributed accumulated earnings, and changes in the equity of subsidiaries are recorded directly to surplus as unrealized gains or losses.
Mortgage Loans: Mortgage loans are stated at amortized cost, net of valuation allowances. Amortized cost consists of the unpaid principal balance of the loans, net of unamortized premiums, discounts, and certain mortgage origination fees. Mortgage loans held for sale are stated at the lower of amortized cost or fair value. Mortgage loans are evaluated for impairment when it is probable that the receipt of contractual payments of principal and interest may not occur when scheduled. If the impairment is considered to be temporary, a valuation allowance is established for the excess of the carrying value of the mortgage over its estimated fair value. Changes in valuation allowance for mortgage loans are included in net unrealized capital gains and losses on investments.
When an event occurs resulting in an impairment that is other-than-temporary, a direct write-down is recorded as a realized loss and a new cost basis is established. The fair value of mortgage loans is generally determined using a discounted cash flow methodology based on coupon rates, maturity provisions and credit assumptions.
Real Estate: Real estate occupied by the Company and real estate held for the production of income is carried at depreciated cost, less encumbrances. Real estate held for sale is carried at the lower of depreciated cost or fair value, less encumbrances, and estimated costs to sell. The Company utilizes the straight-line method of depreciation on real estate and it is generally computed over a forty-year period. A real estate property may be considered impaired when events or circumstances indicate that the carrying value may not be recoverable. When the Company determines that an investment in real estate is impaired, a direct write-down is made to reduce the carrying value of the property to its estimated fair value based on an external appraisal, net of encumbrances, and a realized loss is recorded. The Company makes investments in commercial real estate directly, through SCA entities and through real estate limited partnerships which are included in “Other invested assets.” The Company monitors the effects of current and expected market conditions and other factors on its real estate investments to identify and quantify any impairment in value. The Company evaluates the recoverability of income producing directly held real estate investments based on undiscounted cash flows and then reviews the results of an independent third party appraisal to determine the fair value and if an impairment is required.
Other Invested Assets: Other invested assets primarily include investments in joint ventures, partnerships, and limited liability companies which are stated at cost, adjusted for the Company’s underlying equity percentage based on the respective entity’s most recent available audited US GAAP or International Financial Reporting Standards financial statements.
Dividends and distributions from subsidiaries are recorded in investment income to the extent they are not in excess of the investee’s undistributed accumulated earnings, and changes in the equity of subsidiaries are recorded directly to surplus as unrealized gains or losses.
Other invested assets include the Company’s investments in debt securities that do not qualify as bonds under the Principles-Based Bond Definition and shall be reported as non-bond debt securities in scope of SSAP No. 21—Other Admitted Assets. Other invested assets also include residual tranches which apply the Allowable Earned Yield measurement method elected and shall be reported in scope under SSAP No. 21—Other Admitted Assets.
The Company monitors the effects of current and expected market conditions and other factors on these investments to identify and quantify any impairment in value. The Company assesses the investments for potential impairment by performing analysis
| B-86 | Statement of Additional Information ∎ Teachers Insurance and Annuity Association of America |
Table of Contents
| continued |
between the fair value and the cost basis of the investments. The Company evaluates recoverability of the Company’s direct investment to determine if an OTTI has occurred. When it is determined that a decline in fair value of an investment is other-than-temporary, the cost basis of the investment is reduced to its fair value, and the amount of the reduction is accounted for as a realized loss.
Cash and Cash Equivalents: Cash includes cash on deposit and cash equivalents. Cash equivalents are short-term, highly liquid investments with original maturities of three months or less at the date of purchase and are stated at amortized cost. If in the aggregate, the Company has a net negative cash balance, the negative cash is recorded as a negative asset.
Short-Term Investments: Short-term investments (investments with remaining maturities greater than three months and less than or equal to one year at the time of acquisition, excluding those investments classified as cash equivalents) that are not impaired are stated at amortized cost using the straight line interest method. Short-term investments that are impaired are stated at the lower of amortized cost or fair value.
Contract Loans: Contract loans are stated at outstanding principal balances. Interest income accrued on contract loans past due 90 days or more are included in the unpaid balance of the loan. The excess of unpaid contract loan balances over the cash surrender value, if any, is non-admitted and reflected as an adjustment to surplus. Interest income on such contract loans is recorded as earned using the contractually agreed upon interest rate.
Derivative Instruments: The Company designates its derivative transactions as hedging or replication transactions.
Derivatives that qualify and are designated for hedge accounting are reported as assets or liabilities on the balance sheet and accounted for in a manner consistent with the hedged item. Swap coupon cash flows and income accruals are reported as a component of net investment income. The gains or losses on these contracts are recognized in a manner consistent with the disposed hedged item.
Derivatives used in hedging relationships that do not qualify or are not designated for hedge accounting are carried at fair value. Changes in fair value are reported in surplus as net unrealized capital gains (losses). Swap coupon cash flows and income accruals are reported as a component of net investment income. The gains or losses on these contracts are recognized as realized capital gains (losses) and are subject to IMR or AVR treatment.
Derivatives used in replication transactions are accounted for in a manner consistent with the cash instrument and the replicated asset. Accordingly, these derivatives are carried at amortized cost or fair value. Amortization of derivative premiums and accretion of derivative discounts, swap coupon cash flows and income accruals are recorded as a component of net investment income. The gains or losses on these contracts are recognized as realized capital gains (losses) and are subject to IMR or AVR treatment.
The Company monitors the unrealized loss position for replication credit default swaps. If it is determined that a decline in fair value is other than temporary, the cost basis will be written down to fair value and the amount of the write down is accounted for as a realized loss.
The Company does not offset the carrying values recognized in the balance sheet for derivatives executed with the same counterparty under the same master netting agreement.
The net premiums and discounts of derivative trades are reported on the cash flow statement as either miscellaneous proceeds within proceeds from investments sold, matured or repaid or miscellaneous applications within cost of investments acquired. Upon termination, the net proceeds and payments are recorded on the cash flow statement as miscellaneous proceeds from investments sold, matured or repaid or miscellaneous applications within cost of investments acquired.
Investment Income Due and Accrued: Investment income due is investment income earned and legally due to be paid to the Company at the reporting date. Investment income accrued is investment income earned but not legally due to be paid to the Company until subsequent to the reporting date. The Company writes off amounts deemed uncollectible as a charge against investment income in the period such determination is made. Amounts deemed collectible, but over 90 days past due for any invested asset except mortgage loans in default are non-admitted. Amounts deemed collectible, but over 180 days past due for mortgage loans in default are non-admitted. The Company accrues interest income on impaired loans to the extent it is deemed collectible.
Separate Accounts: Separate accounts are established in conformity with insurance laws, are segregated from the Company’s general account and are maintained for the benefit of separate account contract holders. In accordance with the provisions of the separate account products, some separate account assets are considered legally insulated, which prevents such assets from being generally available to satisfy claims resulting from the General Account with the exception of the Separate Account MVA-1, which is not legally insulated. Separate accounts are accounted for at fair value, except the TIAA Stable Value separate account, which supports book value separate account agreements, in which case the assets are accounted for at amortized cost. Separate account liabilities reflect the contractual obligations of the insurer arising out of the provisions of the insurance contract. Separate account premiums and other considerations are recorded as income within “Insurance and annuity premiums and other
| Teachers Insurance and Annuity Association of America ∎ Statement of Additional Information | B-87 |
Table of Contents
| Notes to statutory–basis financial statements |
Teachers Insurance and Annuity Association of America
December 31, 2025
considerations” and as an offsetting expense within “Net transfers to (from) separate accounts”. Separate account benefits and surrenders are recorded as expenses within “Policy and contract benefits” with an offsetting contra expense within “Net transfers to (from) separate accounts”. Transfers to or from the general account products from or to the separate account products are recorded within the “Net transfers to (from) separate accounts”.
Foreign Currency Transactions and Translation: Investments denominated in foreign currencies and foreign currency contracts are valued in U.S. dollars, based on exchange rates at the balance sheet date. Investment transactions in foreign currencies are recorded at the exchange rates prevailing on the respective transaction dates. All other asset and liability accounts denominated in foreign currencies are adjusted to reflect exchange rates at the balance sheet date. Realized and unrealized gains and losses due to foreign exchange transactions and translation adjustments are not separately reported but are collectively included in realized and unrealized capital gains and losses, respectively.
Non-Admitted Assets: For statutory accounting purposes, certain assets are designated as non-admitted assets. Changes in non-admitted assets are reported as a direct adjustment to surplus.
At December 31, the major categories of assets that are non-admitted are as follows (in millions):
| 2025 | 2024 | Change | ||||||||||
| Net deferred federal income tax asset |
$ | 3,293 | $ | 3,250 | $ | 43 | ||||||
| Furniture and electronic data processing equipment |
818 | 705 | 113 | |||||||||
| Invested assets |
885 | 880 | 5 | |||||||||
| Prepaid expenses |
185 | 195 | (10 | ) | ||||||||
| Other |
222 | 221 | 1 | |||||||||
| Total |
$ | 5,403 | $ | 5,251 | $ | 152 | ||||||
Electronic Data Processing Equipment, Computer Software, Furniture and Equipment and Leasehold Improvements: Electronic data processing (“EDP”) equipment, computer software and furniture and equipment which qualify for capitalization are depreciated over the lesser of useful life or 3 years. Office alterations and leasehold tenant improvements which qualify for capitalization are depreciated over the lesser of useful life or 5 years or the remaining life of the lease, respectively.
At December 31, the accumulated depreciation on EDP equipment, computer software, furniture and equipment and leasehold improvements is as follows (in millions):
| 2025 | 2024 | |||||||
| EDP equipment and computer software |
$ | 2,422 | $ | 2,287 | ||||
| Furniture and equipment and leasehold improvements |
$ | 233 | $ | 204 | ||||
Repurchase Agreement: Repurchase agreements are agreements between a seller and a buyer, whereby the seller of securities sells and simultaneously agrees to repurchase the same or substantially the same securities from the buyer at a stated price on a specified date. Repurchase agreements are generally accounted for as secured borrowings. The assets transferred are not removed from the balance sheet; the cash collateral received is reported on the balance sheet with an offsetting liability reported in “Other liabilities.”
Reverse Repurchase Agreement: Reverse repurchase agreements are agreements to purchase and resell short-term securities. Reverse repurchase agreements are generally accounted for as secured borrowings. The assets transferred stay on the transferee’s balance sheet. The Company records the amount paid for these securities purchased under agreements to resell in short-term investments.
Securities Lending Program: The Company has a securities lending program whereby it may lend securities to qualified institutional borrowers to earn additional income. The Company receives collateral (in the form of cash) against the loaned securities and maintains collateral in an amount not less than 102% of the market value of loaned securities during the period of the loan. The cash collateral received is reported in “Securities lending collateral assets” with an offsetting collateral liability included in “Payable for collateral for securities loaned.” Securities lending income is recorded in the accompanying Statements of Operations in “Net investment income.”
Insurance and Annuity Premiums and Other Considerations: Life insurance premiums are recognized as revenue over the premium-paying period of the related policies. Annuity premiums and other considerations, including consideration on annuity product rollovers, are recognized as revenue when received. Deposits on deposit-type contracts are recorded directly as a liability when received. Expenses incurred when acquiring new business are charged to operations as incurred.
| B-88 | Statement of Additional Information ∎ Teachers Insurance and Annuity Association of America |
Table of Contents
| continued |
Reserves for Life and Health Insurance, Annuities and Deposit-type Contracts: Policy and contract reserves are determined in accordance with standard valuation methods approved by the Department and are computed in accordance with standard actuarial methodology. The reserves established utilize assumptions for interest, mortality and other risks insured. Such reserves are established to provide for adequate contractual benefits guaranteed under policy and contract provisions.
Liabilities for deposit-type contracts, which do not contain any life contingencies, are equal to deposits received and interest credited to the benefit of contract holders, less surrenders or withdrawals (that represent a return to the contract holders) plus additional reserves (if any) necessitated by actuarial guidelines and statutory regulations. The Company’s funding agreements that are issued directly to states in support of state sponsored 529 college savings and scholarship plans do not contain life contingencies and are accounted for as deposit-type contracts. Funding agreements used in an investment spread capacity are also included within deposit-type contracts.
Reinsurance: The Company enters into reinsurance agreements in the normal course of its insurance business to reduce overall risk. The Company remains liable for reinsurance ceded if the reinsurer fails to meet its obligation on the business assumed. All reinsurance is placed with unaffiliated reinsurers. A liability is established for reserves ceded to unauthorized reinsurers which are not secured by or in excess of letters of credit or trust agreements. The Company does not have reinsurance agreements in effect under which the reinsurer may unilaterally cancel the agreement. Reinsurance premiums, benefits and reserves are accounted for on bases consistent with those used in accounting for the original policies issued and the terms of the reinsurance contracts. The Company records a receivable for reinsured benefits paid but not yet reimbursed by the reinsurer and reduces policyholders’ reserves for the portion of insurance liabilities that are reinsured. Commissions and expense allowances on reinsurance ceded are reported within other income in the summary of operations, and the balance sheet provision for due and accrued amounts is reported as an asset. Amounts shown in the financial statements are reported net of the impact of reinsurance.
Asset Valuation Reserve and Interest Maintenance Reserve: Mandatory reserves have been established for the General Account and separate Account investments, where required. Such reserves consist of the AVR for potential credit-related losses on applicable General Account and separate account invested assets. Changes to the AVR are reported as direct additions to or deductions from surplus. An IMR is established for interest-related realized capital gains (losses) resulting from changes in the general level of interest rates for the General Account, as well as any separate accounts, not carried at fair value. Transfers to the IMR are deducted from realized capital gains and losses and are net of related federal income tax. IMR amortization, as calculated under the grouped method, is included in net investment income. Net realized capital gains (losses) are presented net of federal income tax expense or benefit and IMR transfer. For bonds, excluding loan-back and structured securities, losses from other-than-temporary impairments are recorded entirely to either the AVR or the IMR in accordance with the nature of the impairment.
Net Realized Capital Gains (Losses): Realized capital gains (losses), net of taxes, exclude gains (losses) deferred into the IMR and gains (losses) of the separate accounts. Realized capital gains (losses), including OTTI, are recognized in net income and are determined using the specific identification method.
Dividends Due to Policyholders: Dividends on insurance policies and pension annuity non-participating contracts in the payout phase are declared by the TIAA Board of Trustees (the “Board”) and recorded in December of each year. Dividends on pension annuity non-participating contracts in the accumulation phase are declared by the Board in February of each year, and such dividends on the various existing vintages of pension annuity contracts in the accumulation phase are credited to policyholders during the ensuing twelve month period beginning March 1.
Federal Income Taxes: Current federal income taxes are charged or credited based upon amounts estimated to be payable or recoverable as a result of operations for the current year and any adjustments to such estimates from prior years. Deferred federal income tax assets (“DTAs”) and deferred federal income tax liabilities (“DTLs”) are recognized for expected future tax consequences of temporary differences between statutory and taxable income. Temporary differences are identified and measured using a balance sheet approach whereby statutory and tax balance sheets are compared. Changes in DTAs and DTLs are recognized as a separate component of surplus except for net deferred taxes related to the unrealized appreciation or depreciation on investments, which are included in the change in unrealized capital gains (losses) on investments. Net DTAs are admitted to the extent permissible. Gross DTAs are reduced by a statutory valuation allowance if it is more likely than not that some portion or all of the gross DTA will not be realized. The Company is required to establish a tax loss contingency if it is more likely than not that a tax position will not be sustained. The amount of the contingency reserve is management’s best estimate of the amount of the original tax benefit that could be reversed upon audit, unless the best estimate is greater than 50% of the original tax benefit, in which case the reserve is equal to the entire tax benefit.
The Company files a consolidated federal income tax return with its includable insurance and non-insurance subsidiaries. The consolidating companies participate in tax allocation agreements. The tax allocation agreements provide that each member of the group is allocated its share of the consolidated tax provision or benefit, determined generally on a separate company basis, but may, where applicable, recognize the tax benefits of net operating losses or capital losses utilizable by the consolidated group.
| Teachers Insurance and Annuity Association of America ∎ Statement of Additional Information | B-89 |
Table of Contents
| Notes to statutory–basis financial statements |
Teachers Insurance and Annuity Association of America
December 31, 2025
Intercompany tax balances are settled quarterly on an estimated basis with a final settlement occurring within 30 days of the filing of the consolidated return. The tax allocation agreements are not applied to subsidiaries that are disregarded under federal tax law.
Statements of Cash Flows: Noncash activities are excluded from the Statutory - Basis Statements of Cash Flows. These noncash activities for the years ended December 31 include the following (in millions):
| 2025 | 2024 | 2023 | ||||||||||
| Exchange/transfer/conversion/distribution of invested assets |
$ | 5,730 | $ | 6,047 | $ | 4,192 | ||||||
| Annuity dividend additions |
$ | 2,314 | $ | 2,723 | $ | 3,065 | ||||||
| Capitalized interest |
$ | 482 | $ | 392 | $ | 339 | ||||||
| Interest credited on deposit-type contracts |
$ | 674 | $ | 660 | $ | 490 | ||||||
Application of new accounting pronouncements:
Recently Issued Accounting Guidance:
The NAIC adopted 2024-10, Book Value Separate Accounts, in February 2025. Adopted revisions clarify measurement method guidance and prescribe guidance for how transfers to/from the general account and a book value separate account shall be recognized, which will ultimately result in a net zero impact in the IMR between the selling account and the purchasing account. The revisions are effective January 1, 2026. The Company is currently evaluating the impact of adoption; however, it is not expected to have a material impact to the financial statements.
The NAIC adopted 2025-13, Residential Mortgage Loans Held in Statutory Trusts, in December 2025. These revisions add residential mortgage loans held in qualifying investment trusts to the scope of SSAP 37, Mortgage Loans. Additionally, the guidance requires reporting of these residential mortgage loans as Mortgage Loans. The revised guidance is effective January 1, 2027 with early adoption permitted beginning January 1, 2026. The Company plans to early adopt this guidance which will result in the reclassification of approximately $800 million of residential mortgage loans held in a trust from Other Invested Assets to Mortgage Loans.
Recently Adopted Accounting Pronouncements:
During 2023 and 2024, the NAIC adopted several issuances under the overarching principles-based bond definition project. These issuances primarily revised SSAP No. 26, Bonds; SSAP No. 43, Asset-Backed Securities; and SSAP No. 21, Other Admitted Assets. The revisions provide a principles-based framework for bond classification. To be classified as a bond, an investment must qualify as either an ICO or an ABS within the updated framework. Investments not meeting this definition shall not be classified as bonds. The Company adopted the revisions effective January 1, 2025. The total carrying value of investments reclassified from Bonds to Other Invested Assets upon reevaluation under the updated framework was not material to the Company’s financial statements.
In March 2024, the NAIC adopted revisions to SSAP 21, Other Admitted Assets, to prescribe the accounting guidance (measurement method) for all residual interests regardless of legal form. Upon adoption, residual interests will be reported initially at cost. Subsequent to initial acquisition, residuals will be reported either 1) at the lower of amortized cost or fair value under the Allowable Earned Yield method, or 2) using the calculated practical expedient method. The Allowable Earned Yield method is based on a discounted cash flow methodology and allows for cash receipts to be recorded as investment income up to the calculated allowable yield, with the excess cash flow applied to the amortized cost balance. The practical expedient is a cost recovery method, resulting in no interest income recognition until the residual interest has a carrying value of zero. The Company elected to use the Allowable Earned Yield method, which was adopted January 1, 2025 on a prospective basis using the December 31, 2024 carrying value as the starting point of the calculation. The adoption of this guidance did not have a material impact to the Company’s financial statements.
The NAIC adopted 2024-22, ASU 2024-01—Scope Application of Profits Interest and Similar Awards, in February 2025 which adopted with modification FASB ASU 2024-01. The revisions require reporting entities which issue profits interest or similar awards as compensation to either employees or non-employees in exchange for goods or services to apply the guidance in SSAP 104, Share-Based Payments to determine whether the award is a share-based payment transaction and in scope of SSAP 104. This guidance was effective December 31, 2025 and did not have a material impact to the Company’s financial statements.
| B-90 | Statement of Additional Information ∎ Teachers Insurance and Annuity Association of America |
Table of Contents
| continued |
Note 3—long-term bonds, preferred stocks, and unaffiliated common stocks
The book/adjusted carrying value, estimated fair value, excess of fair value over book/adjusted carrying value and excess of book/adjusted carrying value over fair value of long-term bonds at December 31, is shown below (in millions):
| 2025 |
|
|||||||||||||||||||
| Excess of | ||||||||||||||||||||
| Book/ Value |
Fair Value Over Book/Adjusted Carrying Value |
Book/Adjusted Carrying Value Over Fair Value |
Estimated Fair Value |
|||||||||||||||||
| Issuer Credit Obligations: |
||||||||||||||||||||
| U.S. governments |
$ | 16,257 | $ | 51 | $ | (2,030 | ) | $ | 14,278 | |||||||||||
| Non-U.S. sovereign jurisdiction securities |
3,617 | 118 | (197 | ) | 3,538 | |||||||||||||||
| Municipal bonds–general obligations |
1,807 | 28 | (113 | ) | 1,722 | |||||||||||||||
| Municipal bonds–special revenues |
13,380 | 66 | (1,453 | ) | 11,993 | |||||||||||||||
| Single entity backed obligations |
776 | 1 | (108 | ) | 669 | |||||||||||||||
| Project finance bonds issued by operating entities |
8,374 | 71 | (719 | ) | 7,726 | |||||||||||||||
| Mortgage loans that qualify as SVO-identified credit tenant loans |
141 | — | (10 | ) | 131 | |||||||||||||||
| Corporate bonds |
127,164 | 1,378 | (11,264 | ) | 117,278 | |||||||||||||||
| Bonds issued by funds representing operating entities |
137 | — | (19 | ) | 118 | |||||||||||||||
| Bank loans |
9,203 | 56 | (269 | ) | 8,990 | |||||||||||||||
| Other issuer credit obligations |
216 | 3 | (1 | ) | 218 | |||||||||||||||
| Total ICO |
$ | 181,072 | $ | 1,772 | $ | (16,183 | ) | $ | 166,661 | |||||||||||
| 2024 | ||||||||||||||||||||
| Excess of | ||||||||||||||||||||
| Book/ Adjusted Carrying Value |
Fair Value Over Book/Adjusted Carrying Value |
Book/Adjusted Carrying Value Over Fair Value |
Estimated Fair Value |
|||||||||||||||||
| Issuer Credit Obligations: |
(in millions | ) | ||||||||||||||||||
| U.S. governments |
$ | 18,668 | $ | 40 | $ | (2,701 | ) | $ | 16,007 | |||||||||||
| Non-U.S. sovereign jurisdiction securities |
3,577 | 53 | (328 | ) | 3,302 | |||||||||||||||
| Municipal bonds–general obligations |
959 | 1 | (131 | ) | 829 | |||||||||||||||
| Municipal bonds–special revenues |
13,026 | 61 | (1,640 | ) | 11,447 | |||||||||||||||
| Single entity backed obligations |
653 | 5 | (21 | ) | 637 | |||||||||||||||
| Project finance bonds issued by operating entities |
8,154 | 65 | (812 | ) | 7,407 | |||||||||||||||
| Mortgage loans that qualify as SVO-identified credit tenant loans |
111 | 0 | (7 | ) | 104 | |||||||||||||||
| Corporate bonds |
118,100 | 802 | (13,133 | ) | 105,769 | |||||||||||||||
| Bonds issued by funds representing operating entities |
155 | — | (11 | ) | 144 | |||||||||||||||
| Bank loans |
10,157 | 91 | (235 | ) | 10,013 | |||||||||||||||
| Other issuer credit obligations |
27 | — | — | 27 | ||||||||||||||||
| Total ICO |
$ | 173,587 | $ | 1,118 | $ | (19,019 | ) | $ | 155,686 | |||||||||||
| 2025 | ||||||||||||||||||||
| Excess of | ||||||||||||||||||||
| Book/ Adjusted Carrying Value |
Fair Value Over Book/Adjusted Carrying Value |
Book/Adjusted Carrying Value Over Fair Value |
Estimated Fair Value |
|||||||||||||||||
| Asset-Backed Securities: |
||||||||||||||||||||
| Financial asset-backed securities–self-liquidating |
$ | 30,081 | $ | 412 | $ | (1,609 | ) | $ | 28,884 | |||||||||||
| Financial asset-backed securities–not self-liquidating |
617 | 1 | (8 | ) | 610 | |||||||||||||||
| Non-financial asset-backed securities–practical expedient |
3,553 | 78 | (59 | ) | 3,572 | |||||||||||||||
| Non-financial asset-backed securities–full analysis |
7,550 | 94 | (178 | ) | 7,466 | |||||||||||||||
| Total ABS |
$ | 41,801 | $ | 585 | $ | (1,854 | ) | $ | 40,532 | |||||||||||
| Teachers Insurance and Annuity Association of America ∎ Statement of Additional Information | B-91 |
Table of Contents
| Notes to statutory–basis financial statements |
Teachers Insurance and Annuity Association of America
December 31, 2025
| 2024 | ||||||||||||||||||||
| Excess of | ||||||||||||||||||||
| Book/ Adjusted Carrying Value |
Fair Value Over Book/Adjusted Carrying Value |
Book/Adjusted Carrying Value Over Fair Value |
Estimated Fair Value |
|||||||||||||||||
| Asset-Backed Securities: |
||||||||||||||||||||
| Financial asset-backed securities—self-liquidating |
$ | 39,447 | $ | 336 | $ | (2,859 | ) | $ | 36,924 | |||||||||||
| Financial asset-backed securities—not self-liquidating |
46 | 13 | (2 | ) | 57 | |||||||||||||||
| Non-financial asset-backed securities—practical expedient |
536 | 4 | (27 | ) | 513 | |||||||||||||||
| Non-financial asset-backed securities—full analysis |
— | — | — | — | ||||||||||||||||
| Total ABS |
$ | 40,029 | $ | 353 | $ | (2,888 | ) | $ | 37,494 | |||||||||||
Impairment Review Process: All securities are subjected to the Company’s process for identifying OTTI. The Company writes down securities it deems to have an OTTI in value during the period the securities are deemed to be impaired, based on management’s case-by-case evaluation of the decline in value and prospects for recovery. Management considers a wide range of factors in the impairment evaluation process, including, but not limited to, the following: (a) the length of time the fair value has been below amortized cost; (b) the financial condition and near-term prospects of the issuer; (c) whether the debtor is current on contractually obligated interest and principal payments; (d) the intent and ability of the Company to retain the investment for a period of time sufficient to allow for any anticipated recovery in fair value or repayment; (e) information obtained from regulators and ratings agencies; (f) the potential for impairments in an entire industry sector or sub-sector; (g) the potential for impairments in certain economically-depressed geographic locations and (h) the potential for impairment based on an estimated discounted cash flow analysis for asset-backed securities and debt securities that no longer qualify as bonds. Where decline in value is considered to be other-than-temporary, the Company recognizes a realized loss and adjusts the cost basis of the security accordingly. The Company does not change the revised cost basis for subsequent recoveries in value.
Unrealized Losses on Bonds, Preferred Stocks and Unaffiliated Common Stocks: The gross unrealized losses and estimated fair values for securities by the length of time that individual securities are in a continuous unrealized loss position are shown in the table below (in millions):
| Less than twelve months | Twelve months or more | |||||||||||||||||||||||||||
| Amortized Cost |
Gross Unrealized Loss |
Estimated Fair Value |
Amortized Cost |
Gross Unrealized Loss |
Estimated Fair Value |
|||||||||||||||||||||||
| December 31, 2025 |
||||||||||||||||||||||||||||
| Issuer Credit Obligations |
$ | 14,989 | $ | (332 | ) | $ | 14,657 | $ | 114,842 | $ | (15,535 | ) | $ | 99,307 | ||||||||||||||
| Asset-Backed Securities |
2,671 | (92 | ) | 2,579 | 24,313 | (1,797 | ) | 22,516 | ||||||||||||||||||||
| Total bonds |
17,660 | (424 | ) | 17,236 | 139,155 | (17,332 | ) | 121,823 | ||||||||||||||||||||
| Unaffiliated common stocks |
124 | (40 | ) | 84 | 250 | (45 | ) | 205 | ||||||||||||||||||||
| Preferred stocks |
25 | (6 | ) | 19 | 161 | (43 | ) | 118 | ||||||||||||||||||||
| Total bonds and stocks |
$ | 17,809 | $ | (470 | ) | $ | 17,339 | $ | 139,566 | $ | (17,420 | ) | $ | 122,146 | ||||||||||||||
| Less than twelve months | Twelve months or more | |||||||||||||||||||||||||||
| Amortized Cost |
Gross Unrealized Loss |
Estimated Fair Value |
Amortized Cost |
Gross Unrealized Loss |
Estimated Fair Value |
|||||||||||||||||||||||
| December 31, 2024 |
||||||||||||||||||||||||||||
| Issuer Credit Obligations |
$ | 25,799 | $ | (769 | ) | $ | 25,030 | $ | 107,206 | $ | (16,314 | ) | $ | 90,892 | ||||||||||||||
| Asset-Backed Securities |
5,554 | (142 | ) | 5,412 | 38,951 | (4,385 | ) | 34,566 | ||||||||||||||||||||
| Total bonds |
31,353 | (911 | ) | 30,442 | 146,157 | (20,699 | ) | 125,458 | ||||||||||||||||||||
| Unaffiliated common stocks |
310 | (9 | ) | 301 | 851 | (50 | ) | 801 | ||||||||||||||||||||
| Preferred stocks |
— | — | — | 152 | (40 | ) | 112 | |||||||||||||||||||||
| Total bonds and stocks |
$ | 31,663 | $ | (920 | ) | $ | 30,743 | $ | 147,160 | $ | (20,789 | ) | $ | 126,371 | ||||||||||||||
Estimated fair values for bonds are subject to market fluctuations, including changes in interest rates. Generally, if interest rates increase, the value of bonds will decrease, and conversely a decline in general interest rates will tend to increase the value of bonds. As of December 31, 2025, 97% of unrealized losses were from investment grade bonds. Based upon the Company’s
| B-92 | Statement of Additional Information ∎ Teachers Insurance and Annuity Association of America |
Table of Contents
| continued |
current evaluation of these securities in accordance with its impairment policy, the Company has concluded that these securities are not other-than-temporarily impaired. Additionally, the Company currently intends and has the ability to hold the securities with unrealized losses for a period of time sufficient for them to recover.
Scheduled Maturities of Bonds: The carrying value and estimated fair value of bonds, categorized by contractual maturity, are shown below (in millions). Bonds not due at a single maturity date have been included in the following table based on the year of final maturity. Actual maturities may differ from contractual maturities because borrowers may prepay obligations with or without call or prepayment penalties.
| December 31, 2025 | December 31, 2024 | |||||||||||||||||||||||
| Issuer Credit Obligation | Book/Adjusted Carrying Value |
Estimated Fair Value |
Book/Adjusted Carrying Value |
Estimated Fair Value |
||||||||||||||||||||
| Due in one year or less |
$ | 6,164 | $ | 6,163 | $ | 15,041 | $ | 14,810 | ||||||||||||||||
| Due after one year through five years |
35,671 | 34,965 | 39,610 | 38,266 | ||||||||||||||||||||
| Due after five years through ten years |
42,896 | 42,171 | 34,832 | 32,823 | ||||||||||||||||||||
| Due after ten years through twenty years |
51,784 | 46,811 | 47,302 | 41,088 | ||||||||||||||||||||
| Due after twenty years |
44,557 | 36,551 | 36,802 | 28,699 | ||||||||||||||||||||
| Subtotal of ICO |
$ | 181,072 | $ | 166,661 | $ | 173,587 | $ | 155,686 | ||||||||||||||||
| Asset-Backed Securities |
||||||||||||||||||||||||
| Due in one year or less |
$ | 391 | $ | 433 | $ | 553 | $ | 550 | ||||||||||||||||
| Due after one year through five years |
2,131 | 2,190 | 2,011 | 1,987 | ||||||||||||||||||||
| Due after five years through ten years |
2,882 | 2,873 | 2,822 | 2,747 | ||||||||||||||||||||
| Due after ten years through twenty years |
15,982 | 15,664 | 15,151 | 14,371 | ||||||||||||||||||||
| Due after twenty years |
20,415 | 19,372 | 19,492 | 17,839 | ||||||||||||||||||||
| Subtotal of ABS |
$ | 41,801 | $ | 40,532 | $ | 40,029 | $ | 37,494 | ||||||||||||||||
| Total Bonds |
$ | 222,873 | $ | 207,193 | $ | 213,616 | $ | 193,180 | ||||||||||||||||
Bond Diversification: The following table presents the diversification of the carrying values of long-term bond investments at December 31, for issuer credit obligations and asset-backed securities bonds.
| 2025 | 2024 | |||||||
| Corporate Bonds |
57.2 | % | 62.6 | % | ||||
| Other Asset-Backed |
7.6 | % | 7.4 | % | ||||
| U.S. Government Obligations |
7.3 | % | 6.1 | % | ||||
| Municipal Bonds–Special Revenue |
6.0 | % | 5.9 | % | ||||
| Agency commercial mortgage-backed securities / residential mortgage-backed securities |
5.0 | % | 7.6 | % | ||||
| Non-Agency commercial mortgage-backed securities / residential mortgage-backed securities |
4.6 | % | 3.1 | % | ||||
| Bank Loans |
4.1 | % | 4.7 | % | ||||
| Project Finance Bonds |
3.7 | % | — | % | ||||
| Non-U.S. Sovereign Jurisdiction |
1.6 | % | 1.5 | % | ||||
| Non-Agency collateralized loan obligations/collateralized bond obligations/collateralized debt obligations |
1.0 | % | 0.7 | % | ||||
| Municipal Bonds–General Obligations |
0.8 | % | 0.3 | % | ||||
| Other |
1.1 | % | 0.1 | % | ||||
| Total |
100.0 | % | 100.0 | % | ||||
The following table presents the carrying value of the long-term bond portfolio by investment grade as of December 31, (in millions):
| 2025 | 2024 | |||||||||||||||
| NAIC 1 and 2 |
$ | 203,129 | 91.1 | % | $ | 191,933 | 89.8 | % | ||||||||
| NAIC 3 through 6 |
19,744 | 8.9 | 21,683 | 10.2 | ||||||||||||
| Total |
$ | 222,873 | 100.0 | % | $ | 213,616 | 100.0 | % | ||||||||
| Teachers Insurance and Annuity Association of America ∎ Statement of Additional Information | B-93 |
Table of Contents
| Notes to statutory–basis financial statements |
Teachers Insurance and Annuity Association of America
December 31, 2025
Asset-backed Securities: The near-term prepayment assumptions for asset-backed securities are based on historical averages drawing from performance experience for a particular transaction and may vary by security type. The long-term assumptions are adjusted based on expected performance.
For the years ended December 31, 2025 and 2024, the Company recognized OTTI on asset-backed securities of $118 million and $115 million, respectively.
Other Disclosures: The following table represents the carrying amount of bonds and stocks denominated in a foreign currency as of December 31, (in millions):
| 2025 | 2024 | |||||||
| Carrying amount of bonds and stocks denominated in foreign currency |
$ | 8,902 | $ | 6,646 | ||||
| Carrying amount of bonds and stocks denominated in foreign currency which are collateralized by real estate |
$ | 1,232 | $ | 1,097 | ||||
Note 4—mortgage loans
The Company originates mortgage loans that are principally collateralized by commercial real estate. The composition of the mortgage loan portfolio as of December 31, is as follows (in millions):
| Loan Type | 2025 | 2024 | ||||||
| Commercial loans |
$ | 31,937 | $ | 33,005 | ||||
| Mezzanine loans |
859 | 1,506 | ||||||
| Residential loans |
3,896 | 3,694 | ||||||
| Total |
$ | 36,692 | $ | 38,205 | ||||
The maximum and minimum lending rates for mortgage loans originated or purchased during 2025 and 2024 are as follows:
| 2025 | 2024 | |||||||||||||||
| Loan Type | Maximum | Minimum | Maximum | Minimum | ||||||||||||
| Commercial loans |
7.75 | % | 3.50 | % | 12.00 | % | 3.95 | % | ||||||||
| Mezzanine loans |
N/A | N/A | 12.58 | % | 12.58 | % | ||||||||||
| Residential loans |
7.63 | % | 4.50 | % | N/A | N/A | ||||||||||
The maximum percentage of any one loan to the value (“LTV”) of the property at the time of the loan, exclusive of insured, guaranteed, or purchase money mortgages, originated or purchased during 2025 and 2024 are as follows:
| Maximum LTV | ||||||||||||||||
| Loan Type | 2025 | 2024 | ||||||||||||||
| Commercial loans |
76.2 | % | 113.6 | % | ||||||||||||
| Mezzanine loans |
N/A | 52.1 | % | |||||||||||||
| Residential loans |
80.0 | % | N/A | |||||||||||||
There were no mezzanine mortgage loans originated or purchased during 2025. There were no residential mortgage loans originated or purchased during 2024.
Impairment Review Process: The Company monitors the effects of current and expected market conditions and other factors on the collectability of mortgage loans to identify and quantify any impairment in value. Impairments are classified as either temporary, for which a recovery is anticipated, or other-than-temporary. Mortgage loans held to maturity with other-than-temporarily impaired values at December 31, 2025 and 2024 have been written down to net realizable values based upon independent appraisals of the collateral. For impaired mortgage loans where the impairments are deemed to be temporary, an allowance for credit losses is established.
| B-94 | Statement of Additional Information ∎ Teachers Insurance and Annuity Association of America |
Table of Contents
| continued |
The following table provides the recorded investment on impaired loans with or without an allowance for credit losses and impaired loans subject to a participant or co-lender mortgage loan agreement for which the Company is restricted from unilaterally foreclosing on the mortgage loan as of December 31, (in millions):
| Mortgage Loans | ||||||||||||
| 2025 | 2024 | 2023 | ||||||||||
| With allowance for credit losses–Commercial |
$ | 229 | $ | 677 | $ | 941 | ||||||
| With allowance for credit losses–Residential |
— | — | — | |||||||||
| No allowance for credit losses–Commercial |
692 | 490 | 619 | |||||||||
| No allowance for credit losses–Residential |
— | — | — | |||||||||
| Total |
$ | 921 | $ | 1,167 | $ | 1,560 | ||||||
| Subject to a participant or co-lender mortgage loan agreement for which the Company is restricted from unilaterally foreclosing on the mortgage loan |
$ | 180 | $ | 124 | $ | 221 | ||||||
The following table provides information for investment in impaired loans for the years ended December 31, (in millions):
| Commercial | ||||||||||||
| 2025 | 2024 | 2023 | ||||||||||
| Average recorded investment |
$ | 921 | $ | 1,167 | $ | 1,560 | ||||||
| Interest income recognized |
$ | 37 | $ | 48 | $ | 71 | ||||||
| Recorded investments on nonaccrual status |
$ | 836 | $ | 1,095 | $ | 360 | ||||||
| Amount of interest income recognized using a cash-basis method of accounting |
$ | — | $ | — | $ | — | ||||||
Credit quality
For commercial and mezzanine mortgage loans, the primary credit quality indicators are the loan-to-value ratio, debt service coverage ratio, and delinquency. LTV ratios compare the unpaid principal balance of the loan to the estimated fair value of the underlying collateral. Generally, the higher the loan-to-value ratio, the higher the risk of experiencing a credit loss. Debt service coverage compares a property’s net operating income to amounts needed to service the principal and interest due under the loan. Generally, the lower the debt service coverage ratio, the higher the risk of experiencing a credit loss. The debt service coverage ratio and the loan-to-value ratio, as well as the values utilized in calculating these ratios, are updated quarterly, with a portion of the loan portfolio updated annually. Delinquency is defined as a mortgage loan which is past due. Commercial mortgage loans more than 30 days past due are considered delinquent.
For residential mortgage loans, the Company’s primary credit quality indicator is performance versus non-performance. The Company generally defines nonperforming residential mortgage loans as those that are 90 or more days past due and/or on non-accrual status. Generally, nonperforming residential loans have a higher risk of experiencing a credit loss.
The credit quality of the recorded investment, which represents carrying value plus accrued interest, in commercial and mezzanine mortgage loans at December 31, are as follows (in millions):
| Recorded Investment—Commercial and Mezzanine | ||||||||||||||||
| Loan-to-value Ratios | ||||||||||||||||
| 2025 | > 70% | < 70% | Total | % of Total | ||||||||||||
| Debt service coverage ratios: |
||||||||||||||||
| Greater than 1.20x |
$ | 9,031 | $ | 18,671 | $ | 27,702 | 84.0 | % | ||||||||
| Less than 1.20x |
3,093 | 1,673 | 4,766 | 14.5 | % | |||||||||||
| Construction |
222 | 275 | 497 | 1.5 | % | |||||||||||
| Total |
$ | 12,346 | $ | 20,619 | $ | 32,965 | 100.0 | % | ||||||||
| Recorded Investment—Commercial and Mezzanine | ||||||||||||||||
| Loan-to-value Ratios | ||||||||||||||||
| 2024 | > 70% | < 70% | Total | % of Total | ||||||||||||
| Debt service coverage ratios: |
||||||||||||||||
| Greater than 1.20x |
$ | 10,139 | $ | 18,131 | $ | 28,270 | 81.4 | % | ||||||||
| Less than 1.20x |
3,885 | 2,066 | 5,951 | 17.1 | % | |||||||||||
| Construction |
— | 531 | 531 | 1.5 | % | |||||||||||
| Total |
$ | 14,024 | $ | 20,728 | $ | 34,752 | 100.0 | % | ||||||||
| Teachers Insurance and Annuity Association of America ∎ Statement of Additional Information | B-95 |
Table of Contents
| Notes to statutory–basis financial statements |
Teachers Insurance and Annuity Association of America
December 31, 2025
The credit quality of the recorded investment, which represents carrying value plus accrued interest, in residential mortgage loans at December 31, are as follows (in millions):
| 2025 | 2024 | |||||||||||||||||||
| Residential | Recorded Investment |
% of total | Recorded Investment |
% of total | ||||||||||||||||
| Credit quality indicators: |
||||||||||||||||||||
| Performing |
$ | 3,902 | 99.6 | % | $ | 3,704 | 99.7 | % | ||||||||||||
| Nonperforming |
15 | 0.4 | % | 10 | 0.3 | % | ||||||||||||||
| Total |
$ | 3,917 | 100.0 | % | $ | 3,714 | 100.0 | % | ||||||||||||
Mortgage Loan Age Analysis: The following table sets forth an age analysis of mortgage loans and identification of mortgage loans in which the Company is a participant or co-lender in a mortgage loan agreement as of December 31, (in millions):
| Residential | Commercial |
|
|
|||||||||||||||||||||||||
| 2025 | Insured | All Other | Insured | All Other | Mezzanine | Total | ||||||||||||||||||||||
| Recorded investment |
||||||||||||||||||||||||||||
| Current |
$ | — | $ | 3,882 | $ | — | $ | 32,102 | $ | 720 | $ | 36,704 | ||||||||||||||||
| 30-59 days past due |
$ | — | $ | 19 | $ | — | $ | — | $ | 47 | $ | 66 | ||||||||||||||||
| 60-89 days past due |
$ | — | $ | 1 | $ | — | $ | — | $ | — | $ | 1 | ||||||||||||||||
| 90-179 days past due |
$ | — | $ | 5 | $ | — | $ | — | $ | — | $ | 5 | ||||||||||||||||
| 180+ days past due |
$ | — | $ | 10 | $ | — | $ | — | $ | 96 | $ | 106 | ||||||||||||||||
| Participant or co-lender in a mortgage loan agreement |
||||||||||||||||||||||||||||
| Recorded investment |
$ | — | $ | — | $ | — | $ | 4,046 | $ | 862 | $ | 4,908 | ||||||||||||||||
| Residential | Commercial |
|
|
|||||||||||||||||||||||||
| 2024 | Insured | All Other | Insured | All Other | Mezzanine | Total | ||||||||||||||||||||||
| Recorded investment |
||||||||||||||||||||||||||||
| Current |
$ | — | $ | 3,682 | $ | — | $ | 33,155 | $ | 1,447 | $ | 38,284 | ||||||||||||||||
| 30-59 days past due |
$ | — | $ | 18 | $ | — | $ | — | $ | — | $ | 18 | ||||||||||||||||
| 60-89 days past due |
$ | — | $ | 4 | $ | — | $ | — | $ | — | $ | 4 | ||||||||||||||||
| 90-179 days past due |
$ | — | $ | 5 | $ | — | $ | 64 | $ | — | $ | 69 | ||||||||||||||||
| 180+ days past due |
$ | — | $ | 4 | $ | — | $ | — | $ | 86 | $ | 90 | ||||||||||||||||
| Participant or co-lender in a mortgage loan agreement |
||||||||||||||||||||||||||||
| Recorded investment |
$ | — | $ | — | $ | — | $ | 4,024 | $ | 1,533 | $ | 5,557 | ||||||||||||||||
Mortgage Loan Diversification: The following tables set forth the mortgage loan portfolio by property type and geographic distribution as of December 31:
| Mortgage Loans by Property Type (Commercial & Residential): |
||||||||
| 2025 | 2024 | |||||||
| % of Total | % of Total | |||||||
| Apartments |
27.3 | % | 26.3 | % | ||||
| Office buildings |
20.9 | 22.3 | ||||||
| Industrial buildings |
17.0 | 15.2 | ||||||
| Shopping centers |
12.7 | 14.6 | ||||||
| Other–commercial |
11.5 | 11.9 | ||||||
| Residential |
10.6 | 9.7 | ||||||
| Total |
100.0 | % | 100.0 | % | ||||
| Mortgage Loans by Geographic Distribution: | ||||||||||||||||||||
| 2025 |
|
2024 | ||||||||||||||||||
| % of Total |
|
% of Total | ||||||||||||||||||
| Commercial | Residential | Commercial | Residential | |||||||||||||||||
| Pacific |
19.2 | % | 44.2 | % | 21.0 | % | 44.2 | % | ||||||||||||
| South Atlantic |
16.5 | 15.4 | 16.2 | 16.1 | ||||||||||||||||
| Middle Atlantic |
16.9 | 8.2 | 17.8 | 8.5 | ||||||||||||||||
| South Central |
8.5 | 10.3 | 9.9 | 10.6 | ||||||||||||||||
| North Central |
10.8 | 5.2 | 9.0 | 5.3 | ||||||||||||||||
| B-96 | Statement of Additional Information ∎ Teachers Insurance and Annuity Association of America |
Table of Contents
| continued |
| Mortgage Loans by Geographic Distribution: | ||||||||||||||||||||
| 2025 |
|
2024 | ||||||||||||||||||
| % of Total |
|
% of Total | ||||||||||||||||||
| Commercial | Residential | Commercial | Residential | |||||||||||||||||
| New England |
7.7 | 3.2 | 7.8 | 2.7 | ||||||||||||||||
| Mountain |
2.5 | 13.5 | 2.2 | 12.6 | ||||||||||||||||
| Other |
17.9 | — | 16.1 | — | ||||||||||||||||
| Total |
100.0 | % | 100.0 | % | 100.0 | % | 100.0 | % | ||||||||||||
Scheduled Mortgage Loan Maturities: At December 31, contractual maturities for mortgage loans are as follows (in millions):
| 2025 | 2024 |
|
||||||||||
| Carrying Value | Carrying Value | |||||||||||
| Due in one year or less |
$ | 5,304 | $ | 4,187 | ||||||||
| Due after one year through five years |
18,387 | 20,702 | ||||||||||
| Due after five years through ten years |
8,768 | 8,603 | ||||||||||
| Due after ten years |
4,233 | 4,713 | ||||||||||
| Total |
$ | 36,692 | $ | 38,205 | ||||||||
Actual maturities may differ from contractual maturities because borrowers may have the right to prepay mortgages, although prepayment premiums may be applicable.
With respect to impaired loans, the Company accrues interest income to the extent it is deemed collectible. Cash received on impaired mortgage loans that are performing according to their contractual terms is applied in accordance with those terms. For mortgage loans in the process of foreclosure, cash received is initially held in suspense and applied as a return of principal at the time that the foreclosure process is completed, or the mortgage is otherwise disposed.
There were no amounts due from related parties that are collateralized by real estate owned by the Company’s investment subsidiaries and affiliates for the years ended December 31, 2025 or 2024.
Note 5—real estate
At December 31, 2025 and 2024, the Company’s directly owned real estate investments, were carried net of third party mortgage encumbrances. There were $328 million of third party mortgage encumbrances as of December 31, 2025, and $439 million for December 31, 2024.
The directly owned real estate portfolio is diversified by property type and geographic region based on carrying value at December 31, as follows:
| Directly Owned Real Estate by Property Type: | ||||||||
| 2025 | 2024 | |||||||
| % of Total | % of Total | |||||||
| Industrial buildings |
54.1 | % | 53.7 | % | ||||
| Office buildings |
22.3 | 22.3 | ||||||
| Apartments |
15.2 | 15.8 | ||||||
| Retail |
4.7 | 4.5 | ||||||
| Mixed-use projects |
2.1 | 2.1 | ||||||
| Farmland (Vineyard) |
1.3 | 1.3 | ||||||
| Land under development |
0.3 | 0.3 | ||||||
| Total |
100.0 | % | 100.0 | % | ||||
| Directly Owned Real Estate by Geographic Region: | ||||||||
| 2025 | 2024 | |||||||
| % of Total | % of Total | |||||||
| Pacific |
30.3 | % | 31.1 | % | ||||
| South Atlantic |
20.6 | 22.5 | ||||||
| Mountain |
16.7 | 16.6 | ||||||
| South Central |
11.8 | 10.7 | ||||||
| Teachers Insurance and Annuity Association of America ∎ Statement of Additional Information | B-97 |
Table of Contents
| Notes to statutory–basis financial statements |
Teachers Insurance and Annuity Association of America
December 31, 2025
| Directly Owned Real Estate by Geographic Region: | ||||||||
| 2025 | 2024 | |||||||
| % of Total | % of Total | |||||||
| Middle Atlantic |
9.8 | 9.7 | ||||||
| North Central |
10.8 | 9.4 | ||||||
| Total |
100.0 | % | 100.0 | % | ||||
Note 6—subsidiary, controlled and affiliated entities
The Company holds interests in SCA entities which are reported as “Common stock” or “Other invested assets”. The carrying value of investments in SCA entities at December 31, are shown below (in millions):
| 2025 | 2024 | |||||||
| Net carrying value of the SCA entities |
||||||||
| Reported as common stock |
$ | 216 | $ | 183 | ||||
| Reported as other invested assets |
27,674 | 27,749 | ||||||
| Total net carrying value |
$ | 27,890 | $ | 27,932 | ||||
As of December 31, 2025 and 2024, no investment in a SCA entity exceeded 10% of the Company’s admitted assets, and the Company does not have any material investments in foreign insurance subsidiaries. The Company did not have any significant investments in non-insurance SCA entities reported as common stocks as of December 31, 2025 and 2024.
As of December 31, 2025 and 2024, the Company held $266 million and $155 million in bonds of affiliates, respectively.
As of December 31, 2025 and 2024, the net amount due to SCA entities was $367 million and $528 million, respectively. The net amounts are generally settled on a daily or monthly basis. These balances are reported in “Other assets” and “Other liabilities.” The Company has a subsidiary deposit program which allows certain subsidiaries the ability to deposit excess cash with the Company and earn daily interest. The deposits from this program are included in the net amount due to SCA entities and were $801 million and $646 million as of December 31, 2025 and 2024, respectively.
The Company holds investments in downstream non-insurance holding companies, which are valued by the Company utilizing the look-through approach as defined in SSAP 97, Investments in Subsidiary, Controlled and Affiliated Entities. The financial statements for the downstream non-insurance holding companies are not audited and the Company has limited the value of its investment in these non-insurance holding companies by excluding immaterial assets that are not audited. All liabilities, commitments, contingencies, guarantees or obligations of these subsidiaries, which are required to be recorded as liabilities, commitments, contingencies, guarantees or obligations under applicable accounting guidance, are reflected in the Company’s determination of the carrying value of the investment in these subsidiaries, if not already recorded in the subsidiaries’ financial statements. The Company’s carrying value in these downstream non-insurance holding companies is $9,223 million and $9,161 million as of December 31, 2025 and 2024, respectively. Significant holdings as of December 31, are as follows (in millions):
| 2025 | 2024 | |||||||
| Subsidiary | Carrying Value | Carrying Value | ||||||
| TIAA Global Ag Holdco LLC |
$ | 1,106 | $ | 1,030 | ||||
| T-C Europe LP |
1,094 | 962 | ||||||
| Demeter Agricultural Properties, LLC |
512 | 437 | ||||||
| ND Properties LLC |
413 | 377 | ||||||
| TGA APAC Fund Holdings LLC |
406 | 381 | ||||||
| Occator Agricultural Properties, LLC |
389 | 425 | ||||||
| TIAA Super Regional Mall Member Sub LLC |
358 | 365 | ||||||
| TGA European RE Holdings I LLC |
347 | 384 | ||||||
| NGFF Holdco, LLC |
291 | 302 | ||||||
| NGTF Holdco LLC |
275 | 292 | ||||||
| TIAA Infrastructure Investments, LLC |
263 | 242 | ||||||
| T-C Lux Fund Holdings LLC |
249 | 225 | ||||||
| 730 Digital Infra LLC |
247 | 130 | ||||||
| TGA European RE Holdings III LLC |
224 | — | ||||||
| TGA MKP Member LLC |
192 | 200 | ||||||
| TGA Sparrow Investor LLC |
186 | 201 | ||||||
| T-C Waterford Blue Lagoon LLC |
168 | 175 | ||||||
| T-C MV Member LLC |
163 | 185 | ||||||
| B-98 | Statement of Additional Information ∎ Teachers Insurance and Annuity Association of America |
Table of Contents
| continued |
| 2025 | 2024 | |||||||
| Subsidiary | Carrying Value | Carrying Value | ||||||
| TEFF Holdco LLC |
146 | 98 | ||||||
| T-C UK RE Holdings III LLC |
145 | 140 | ||||||
| TIAA NBS LLC |
142 | 136 | ||||||
| 730 Data Centers, LLC |
141 | 226 | ||||||
| TGA JL MCF II Investor Member LLC |
122 | 130 | ||||||
| T-C MV Member II LLC |
118 | 153 | ||||||
| TIAA GCREIT Holdings LLC |
114 | 185 | ||||||
| T-C SV Member LLC |
114 | 105 | ||||||
| TGA Sparrow II Investor LLC |
110 | 116 | ||||||
| TIAA GTR Holdco LLC |
96 | 117 | ||||||
| TGA SS Self Storage Portfolio Inv Mbr LLC |
86 | 108 | ||||||
| TGA Peaceable Investor Member LLC |
60 | 70 | ||||||
| Other |
946 | 1,264 | ||||||
| Total |
$ | 9,223 | $ | 9,161 | ||||
Note 7—other invested assets
As of December 31, 2025 and 2024, the components of the Company’s carrying value in “Other invested assets” are (in millions):
| 2025 | 2024 | |||||||
| Affiliated other invested assets |
$ | 27,674 | $ | 27,749 | ||||
| Unaffiliated other invested assets |
15,748 | 15,212 | ||||||
| Receivables for securities, derivative collateral and line of credit |
241 | 515 | ||||||
| Total other invested assets |
$ | 43,663 | $ | 43,476 | ||||
As of December 31, 2025 and 2024, affiliated other invested assets consist primarily of investments through downstream legal entities in the following (in millions):
| 2025 | 2024 | |||||||
| Real estate and mortgage loans |
$ | 10,110 | $ | 10,592 | ||||
| Operating subsidiaries and affiliates |
6,165 | 6,257 | ||||||
| Investment subsidiaries |
4,599 | 4,274 | ||||||
| Agriculture and timber |
5,286 | 4,973 | ||||||
| Energy and infrastructure |
1,514 | 1,653 | ||||||
| Total affiliated other invested assets |
$ | 27,674 | $ | 27,749 | ||||
Of the $6,165 million and $6,257 million of operating subsidiaries and affiliates as of December 31, 2025 and 2024, $5,789 million and $5,917 million were attributed to Nuveen, LLC, TIAA’s largest subsidiary, respectively.
As of December 31, 2025 and 2024, unaffiliated other invested assets consist primarily of joint ventures.
The following table presents the OTTI recorded for the years ended December 31, (in millions) for “Other invested assets” for which the carrying value is not expected to be recovered:
| 2025 | 2024 | 2023 | ||||||||||
| Operating Subsidiaries |
$ | 1,198 | $ | 1,150 | $ | 1,013 | ||||||
| All Other |
1,117 | 219 | 166 | |||||||||
| Total |
$ | 2,315 | $ | 1,369 | $ | 1,179 | ||||||
|
|
||||||||||||
The following table presents the carrying value for “Other invested assets” denominated in foreign currency for the years ended December 31, (in millions):
| 2025 | 2024 | |||||||
| Other invested assets denominated in foreign currency |
$ | 1,592 | $ | 1,190 | ||||
| Teachers Insurance and Annuity Association of America ∎ Statement of Additional Information | B-99 |
Table of Contents
| Notes to statutory–basis financial statements |
Teachers Insurance and Annuity Association of America
December 31, 2025
Note 8—investments commitments
The outstanding obligation for future investments at December 31, 2025, is shown below by asset category (in millions):
| 2026 | In later years | Total Commitments | ||||||||||
| Bonds |
$ | 1,480 | $ | 2,695 | $ | 4,175 | ||||||
| Mortgage loans |
509 | — | 509 | |||||||||
| Real estate |
5 | 1 | 6 | |||||||||
| Other invested assets |
2,675 | 9,130 | 11,805 | |||||||||
| Total |
$ | 4,669 | $ | 11,826 | $ | 16,495 | ||||||
The funding of bond commitments is contingent upon the continued favorable financial performance of the potential borrowers and the funding of real estate and commercial mortgage commitments is generally contingent upon the underlying properties meeting specified requirements, including construction, leasing and occupancy. The funding of residential mortgage loan commitments is contingent upon the loan meeting specified guidelines including property appraisal reviews and confirmation of borrower credit. For other invested assets, primarily fund investments, there are scheduled capital calls that extend into future years.
Note 9—investment income and capital gains and losses
Net Investment Income: The components of net investment income for the years ended December 31, are as follows (in millions):
| 2025 | 2024 | 2023 | ||||||||||
| Bonds |
$ | 10,245 | $ | 9,959 | $ | 9,500 | ||||||
| Stocks |
333 | 279 | 141 | |||||||||
| Mortgage loans |
1,738 | 1,773 | 1,759 | |||||||||
| Real estate |
472 | 499 | 492 | |||||||||
| Derivatives |
280 | 297 | 299 | |||||||||
| Other invested assets |
2,535 | 2,202 | 2,292 | |||||||||
| Cash, cash equivalents and short-term investments |
61 | 87 | 78 | |||||||||
| Contract loans |
19 | 3 | 3 | |||||||||
| Total gross investment income |
15,683 | 15,099 | 14,564 | |||||||||
| Less investment expenses |
(1,222 | ) | (1,376 | ) | (1,359 | ) | ||||||
| Net investment income before amortization of IMR |
14,461 | 13,723 | 13,205 | |||||||||
| Plus amortization of IMR |
151 | 208 | 435 | |||||||||
| Net investment income |
$ | 14,612 | $ | 13,931 | $ | 13,640 | ||||||
The gross, nonadmitted and admitted amounts for interest income due and accrued for the years ended December 31, are as follows (in millions):
| 2025 | 2024 | |||||||
| Gross |
$ | 2,288 | $ | 2,128 | ||||
| Nonadmitted |
— | — | ||||||
| Total admitted interest income due and accrued |
$ | 2,288 | $ | 2,128 | ||||
The cumulative amounts of paid-in-kind (“PIK”) interest included in the current principal balance for the years ended December 31, are as follows (in millions):
| 2025 | 2024 | |||||||
| Cumulative amounts of PIK interest included in the current principal balance |
$ | 1,520 | $ | 1,582 | ||||
| B-100 | Statement of Additional Information ∎ Teachers Insurance and Annuity Association of America |
Table of Contents
| continued |
Realized Capital Gains and Losses: The net realized capital gains (losses) on sales, redemptions and write-downs due to OTTI for the years ended December 31, are as follows (in millions):
| 2025 | 2024 | 2023 | ||||||||||
| Bonds |
$ | (373 | ) | $ | (615 | ) | $ | (479 | ) | |||
| Stocks |
39 | (33 | ) | (718 | ) | |||||||
| Mortgage loans |
(269 | ) | (722 | ) | (402 | ) | ||||||
| Real estate |
49 | 98 | 60 | |||||||||
| Derivatives |
(152 | ) | (108 | ) | (43 | ) | ||||||
| Other invested assets |
(2,065 | ) | (1,582 | ) | (1,249 | ) | ||||||
| Cash, cash equivalents and short-term investments |
66 | 23 | 86 | |||||||||
| Total before capital gains taxes and transfers to IMR |
(2,705 | ) | (2,939 | ) | (2,745 | ) | ||||||
| Transfers to IMR |
195 | 262 | 1,047 | |||||||||
| Capital gain/loss tax benefit (expense) |
— | — | 8 | |||||||||
| Net realized capital losses less capital gains taxes, after transfers to IMR |
$ | (2,510 | ) | $ | (2,677 | ) | $ | (1,690 | ) | |||
Write-downs of investments resulting from OTTI, included in the preceding table, are as follows for the years ended December 31, (in millions):
| 2025 | 2024 | 2023 | ||||||||||
| Other-than-temporary impairments: |
||||||||||||
| Bonds |
$ | 266 | $ | 505 | $ | 214 | ||||||
| Stocks |
104 | 45 | 57 | |||||||||
| Mortgage loans |
202 | 702 | 364 | |||||||||
| Real estate |
8 | 68 | 100 | |||||||||
| Other invested assets |
2,315 | 1,369 | 1,179 | |||||||||
| Total |
$ | 2,895 | $ | 2,689 | $ | 1,914 | ||||||
Information related to the sales of long-term bonds are as follows for the years ended December 31, (in millions):
| Sales of long term bonds (ICO) | 2025 | 2024 | 2023 | |||||||||
| Proceeds from sales |
$ | 7,161 | $ | 5,904 | $ | 9,977 | ||||||
| Gross gains on sales |
63 | 90 | 117 | |||||||||
| Gross losses on sales |
201 | 159 | 279 | |||||||||
| Sales of long term bonds (ABS) | 2025 | 2024 | 2023 | |||||||||
| Proceeds from sales |
$ | 1,549 | $ | 559 | $ | 3,698 | ||||||
| Gross gains on sales |
16 | 1 | 80 | |||||||||
| Gross losses on sales |
19 | 21 | 104 | |||||||||
The Company performs periodic reviews of its portfolio to identify investments which may have deteriorated in credit quality to determine if any are candidates for sale in order to maintain a quality portfolio of investments. In accordance with the Company’s valuation and impairment process, the investments which are deemed held for sale will be monitored quarterly for further declines in fair value at which point an OTTI will be recorded until actual disposal of the investment.
Note 10—disclosures about fair value of financial instruments
Fair Value of Financial Instruments
Included in the Company’s financial statements are certain financial instruments carried at fair value. Other financial instruments are periodically measured at fair value, such as when impaired, or for certain bonds and preferred stocks when carried at the lower of cost or fair value.
Fair value is the price that would be received to sell an asset or paid to transfer a liability in an orderly transaction between market participants at the measurement date.
Fair values of financial instruments are based on quoted market prices when available. When market prices are not available, fair values are primarily provided by a third party-pricing service for identical or comparable assets, or through the use of valuation methodologies using observable market inputs. These fair values are generally estimated using a discounted cash flow analysis,
| Teachers Insurance and Annuity Association of America ∎ Statement of Additional Information | B-101 |
Table of Contents
| Notes to statutory–basis financial statements |
Teachers Insurance and Annuity Association of America
December 31, 2025
incorporating current market inputs for similar financial instruments with comparable terms and credit quality. In instances where there is little or no market activity for the same or similar instruments, the Company estimates fair value using methods, models and assumptions that management believes market participants would use to determine a current transaction price in a hypothetical market. These valuation techniques involve management estimation and judgment for many factors including market bid/ask spreads, and such estimations may become significant with increasingly complex instruments or pricing models.
The Company’s financial assets and liabilities are classified, for disclosure purposes, based on a hierarchy defined by SSAP No. 100R, Fair Value Measurements. The fair value hierarchy prioritizes the inputs to valuation techniques used to measure fair value into three broad levels. The hierarchy gives the highest ranking to fair values determined using unadjusted quoted prices in active markets for identical assets and liabilities (Level 1) and the lowest ranking to fair values determined using methodologies and models with unobservable inputs (Level 3). An asset’s or a liability’s classification is based on the lowest level input that is significant to its measurement. For example, a Level 3 fair value measurement may include inputs that are both observable (Levels 1 and Level 2) and unobservable (Level 3). The levels of the fair value hierarchy are as follows:
Level 1—Inputs are unadjusted quoted prices in active markets for identical assets and liabilities that the Company has the ability to access at the measurement date.
Level 2—Other than quoted prices within Level 1 inputs are observable for the asset or liability, either directly or indirectly.
Level 2 inputs include:
| • | Quoted prices for similar assets or liabilities in active markets, |
| • | Quoted prices for identical or similar assets or liabilities in markets that are not active, |
| • | Inputs other than quoted prices that are observable for the asset or liability, |
| • | Inputs that are derived principally from or corroborated by observable market data by correlation or other means. |
Level 3—Inputs are unobservable inputs for the asset or liability supported by little or no market activity. Unobservable inputs reflect the Company’s own assumptions about the assumptions that market participants would use in pricing the asset or liability. The Company’s data used to develop unobservable inputs is adjusted if information is reasonably available without undue cost and effort that indicates that market participants would use different assumptions.
Net Asset Value (“NAV”) practical expedient—TIAA has elected the NAV practical expedient for certain investments held by its separate account. These investments are excluded from the valuation hierarchy, as these investments are fair valued using their net asset value as a practical expedient since market quotations or values from independent pricing services are not readily available. The separate account assets that have elected the NAV practical expedient represent investments in limited partnerships and limited liability companies that invest in real estate properties. The fair value, determined by the NAV practical expedient, of these assets were $840 million and $740 million for the years ended December 31, 2025 and 2024, respectively, and total unfunded commitments were $165 million and $232 million for the years ended December 31, 2025 and 2024, respectively. For these investments, redemptions are prohibited prior to liquidation.
The following table provides information about the aggregate fair value of the Company’s financial instruments and their level within the fair value hierarchy as well as investments valued at their NAV, at December 31, 2025 (in millions):
| Aggregate Fair Value |
Statement Value |
Level 1 | Level 2 | Level 3 | NAV | |||||||||||||||||||
| Assets: |
||||||||||||||||||||||||
| Bonds: |
||||||||||||||||||||||||
| Issuer Credit Obligations |
$ | 166,661 | $ | 181,072 | $ | — | $ | 166,205 | $ | 456 | $ | — | ||||||||||||
| Asset-Backed Securities |
40,532 | 41,801 | — | 40,009 | 523 | — | ||||||||||||||||||
| Total Bonds |
207,193 | 222,873 | — | 206,214 | 979 | — | ||||||||||||||||||
| Common stock(1) |
3,704 | 3,704 | 3,168 | 97 | 439 | — | ||||||||||||||||||
| Preferred stock |
877 | 908 | — | 829 | 48 | — | ||||||||||||||||||
| Mortgage loans |
33,869 | 36,692 | — | — | 33,869 | — | ||||||||||||||||||
| Derivatives |
79 | 1,448 | — | (947 | ) # | 1,026 | — | |||||||||||||||||
| Other invested assets(1) |
581 | 527 | — | 581 | — | — | ||||||||||||||||||
| Contract loans |
362 | 362 | — | — | 362 | — | ||||||||||||||||||
| Separate account assets |
58,101 | 58,134 | 30,044 | 5,147 | 22,070 | 840 | ||||||||||||||||||
| Cash, cash equivalents & short term investments |
519 | 520 | 90 | 427 | 2 | — | ||||||||||||||||||
| Total |
$ | 305,285 | $ | 325,168 | $ | 33,302 | $ | 212,348 | $ | 58,795 | $ | 840 | ||||||||||||
| B-102 | Statement of Additional Information ∎ Teachers Insurance and Annuity Association of America |
Table of Contents
| continued |
| Aggregate Fair Value |
Statement Value |
Level 1 | Level 2 | Level 3 | NAV | |||||||||||||||||||
| Liabilities: |
||||||||||||||||||||||||
| Deposit-type contracts |
$ | 19,023 | $ | 19,023 | $ | — | $ | — | $ | 19,023 | $ | — | ||||||||||||
| FHLB debt |
110 | 110 | — | — | 110 | — | ||||||||||||||||||
| Separate account liabilities |
57,002 | 57,002 | — | — | 57,002 | — | ||||||||||||||||||
| Derivatives |
703 | 831 | — | 734 | (31 | )* | — | |||||||||||||||||
| Total |
$ | 76,838 | $ | 76,966 | $ | — | $ | 734 | $ | 76,104 | $ | — | ||||||||||||
| (1) | Excludes investments accounted for under the equity method. |
| # | The negative amount in the asset table represents the negative fair value of effective asset swaps, bond forwards, certain effective cross currency swaps and replications. |
| * | The negative amount in the liabilities table represents the positive market value of certain effective cross currency swaps and Tranched Credit Default Index Replications that were traded at a discount. |
The following table provides information about the aggregate fair value of the Company’s financial instruments and their level within the fair value hierarchy as well as investments valued at their NAV at December 31, 2024 (in millions):
| Aggregate Fair Value |
Statement Value |
Level 1 | Level 2 | Level 3 | NAV | |||||||||||||||||||
| Assets: |
||||||||||||||||||||||||
| Issuer Credit Obligations |
$ | 155,686 | $ | 173,587 | $ | — | $ | 154,896 | $ | 790 | $ | — | ||||||||||||
| Asset-Backed Securities |
37,494 | 40,029 | — | 36,890 | 604 | — | ||||||||||||||||||
| Total Bonds |
193,180 | 213,616 | — | 191,786 | 1,394 | — | ||||||||||||||||||
| Common stock(1) |
2,178 | 2,178 | 1,553 | 139 | 486 | — | ||||||||||||||||||
| Preferred stock |
1,024 | 1,054 | 53 | 910 | 61 | — | ||||||||||||||||||
| Mortgage loans |
34,053 | 38,205 | — | — | 34,053 | — | ||||||||||||||||||
| Derivatives |
930 | 1,929 | — | 54 | 876 | — | ||||||||||||||||||
| Other invested assets(1) |
229 | 216 | — | 229 | — | — | ||||||||||||||||||
| Contract loans |
433 | 433 | — | — | 433 | — | ||||||||||||||||||
| Separate account assets |
53,154 | 53,294 | 26,679 | 4,162 | 21,573 | 740 | ||||||||||||||||||
| Cash, cash equivalents & short term investments |
3,543 | 3,541 | 310 | 3,219 | 14 | — | ||||||||||||||||||
| Total |
$ | 288,724 | $ | 314,466 | $ | 28,595 | $ | 200,499 | $ | 58,890 | $ | 740 | ||||||||||||
| Aggregate Fair Value |
Statement Value |
Level 1 | Level 2 | Level 3 | NAV | |||||||||||||||||||
| Liabilities: |
||||||||||||||||||||||||
| Deposit-type contracts |
$ | 18,288 | $ | 18,288 | $ | — | $ | — | $ | 18,288 | $ | — | ||||||||||||
| FHLB debt |
100 | 100 | — | — | 100 | — | ||||||||||||||||||
| Separate account liabilities |
52,231 | 52,231 | — | — | 52,231 | — | ||||||||||||||||||
| Derivatives |
(28 | ) | 98 | — | 47 | (75 | )* | — | ||||||||||||||||
| Total |
$ | 70,591 | $ | 70,717 | $ | — | $ | 47 | $ | 70,544 | $ | — | ||||||||||||
| (1) | Excludes investments accounted for under the equity method. |
| * | The negative amount in the liabilities table represents the positive market value of the Tranched Credit Default Index Replications that were traded at a discount. |
The estimated fair values of the financial instruments presented above are determined by the Company using market information available as of December 31, 2025 and 2024. Considerable judgment is required to interpret market data in developing the estimates of fair value for financial instruments for which there are no available market value quotations. The estimates presented are not necessarily indicative of the amounts the Company could realize in a market exchange. The use of different market assumptions and/or estimation methodologies may have a material effect on the estimated fair value amounts.
| Teachers Insurance and Annuity Association of America ∎ Statement of Additional Information | B-103 |
Table of Contents
| Notes to statutory–basis financial statements |
Teachers Insurance and Annuity Association of America
December 31, 2025
Level 1 financial instruments
Unadjusted quoted prices for these securities are provided to the Company by independent pricing services. Common stock, preferred stock, and separate account assets in Level 1 primarily include mutual fund investments valued by the respective mutual fund companies, exchange listed equities, and public real estate investment trusts. Bond ETFs are classified as common stock and are valued using quoted market prices.
Cash included in Level 1 represents cash on hand.
Level 2 financial instruments
Bonds included in Level 2 are valued principally by third party pricing services using market observable inputs. Because most bonds do not trade daily, independent pricing services regularly derive fair values using recent trades of securities with similar features. When recent trades are not available, pricing models are used to estimate the fair values of securities by discounting future cash flows at estimated market interest rates. Typical inputs to models used by independent pricing services include but are not limited to benchmark yields, reported trades, broker-dealer quotes, issuer spreads, benchmark securities, bids, offers, reference data, and industry and economic events. Additionally, for asset-backed securities, valuation is based primarily on market inputs including benchmark yields, expected prepayment speeds, loss severity, delinquency rates, weighted average coupon, weighted average maturity and issuance specific information. Issuance specific information includes collateral type, payment terms of underlying assets, payment priority within the tranche, structure of the security, deal performance and vintage of loans.
Preferred stocks included in Level 2 include those which are traded in an inactive market for which prices for identical securities are not available. Valuations are based principally on observable inputs including quoted prices in markets that are not considered active.
Derivative assets and liabilities classified in Level 2 represent over-the-counter instruments that include, but are not limited to, fair value hedges using foreign currency swaps, foreign currency forwards, interest rate swaps, credit default swaps, bond forwards, total return swaps and swaptions. Fair values for these instruments are determined internally using market observable inputs that include, but are not limited to, forward currency rates, interest rates, credit default rates and published observable market indices.
Other invested assets in Level 2 include surplus notes and debt securities that do no qualify as bonds within other invested assets that are valued by a third party pricing vendor using primarily observable market inputs. Observable inputs include benchmark yields, reported trades, market dealer quotes, issuer spreads, two-sided markets, benchmark securities, bids, offers and reference data. Additionally, for residual tranches or interests, valuation may be based on market inputs including benchmark yields, expected prepayment speeds, loss severity, delinquency rates, weighted average coupon, weighted average maturity and issuance specific information. Issuance specific information includes collateral type, payment terms of underlying assets, payment priority within the tranche, structure of the security, deal performance and vintage of loans.
Separate account assets in Level 2 consist principally of short-term government agency notes and corporate bonds that are valued principally by third party pricing services using market observable inputs.
Cash equivalents, short term investments and common stock included in Level 2 are valued principally by third party services using market observable inputs.
Level 3 financial instruments
Valuation techniques for issuer credit obligations, asset-backed securities, debt securities that do not qualify as bonds within other invested assets, and short-term investments included in Level 3 are generally the same as those described in Level 2 except that the techniques utilize inputs that are not readily observable in the market, including illiquidity premiums and spread adjustments to reflect industry trends or specific credit-related issues. The Company assesses the significance of unobservable inputs for each security and classifies that security in Level 3 as a result of the significance of unobservable inputs.
Estimated fair value for privately traded common equity securities are principally determined using valuation and discounted cash flow models that require a substantial level of judgment. Included in Level 3 common stock is the Company’s holdings in the Federal Home Loan Bank of New York (“FHLBNY”) stock as described in Note 18—FHLBNY Membership and Borrowings. As prescribed in the FHLBNY’s capital plan, the par value of the capital stock is $100 and all capital stock is issued, redeemed, repurchased, or transferred at par value. Since there is not an observable market for the FHLBNY’s stock, these securities have been classified as Level 3.
Preferred shares are valued using valuation and discounted cash flow models that require a substantial level of judgment.
Mortgage loans are valued using discounted cash flow models that utilize inputs which include loan and market interest rates, credit spreads, the nature and quality of underlying collateral and the remaining term of the loans.
| B-104 | Statement of Additional Information ∎ Teachers Insurance and Annuity Association of America |
Table of Contents
| continued |
Derivatives assets classified as Level 3 represent structured financial instruments that rely on inputs that are significant to the estimated fair value that are not observable in the market or cannot be corroborated by observable market data. Significant inputs that are unobservable generally include references to inputs outside the observable portion of credit curves or other relevant market measures. These unobservable inputs require significant management judgment or assumptions. Level 3 methodologies are validated through periodic comparison of the Company’s fair values to external broker-dealer values.
Contract loans are fully collateralized by the cash surrender value of underlying insurance policies and are valued based on the carrying value of the loan, which is determined to be its fair value, and are classified as Level 3.
Separate account assets classified as Level 3 primarily include directly owned real estate properties, real estate joint ventures and real estate limited partnerships. Directly owned real estate properties are valued on a quarterly basis based on independent third party appraisals. Real estate joint venture interests are valued based on the fair value of the underlying real estate, any related mortgage loans payable and other factors such as ownership percentage, ownership rights, buy/sell agreements, distribution provisions and capital call obligations. Real estate limited partnership interests are valued based on the most recent NAV of the partnership.
Separate account liabilities are accounted for at fair value, except the TIAA Stable Value separate account, which supports book value separate account agreements, in which case the assets are accounted for at amortized cost. Separate account liabilities reflect the contractual obligations of the insurer arising out of the provisions of the insurance contract.
FHLB debt provides additional liquidity to the Company to support general business operations. FHLB debt held by the Company is generally comprised of short term advances and is reflected as borrowed money within the Company’s financial statements. Borrowings outstanding at December 31, 2025 and 2024, had maturity dates less than three business days from the reporting date. Accordingly, the fair value of the debt is valued using the par value, which approximates fair value.
Deposit-type contracts include FHLB funding agreements, funding agreements issued directly to states, and other deposit-type contracts. FHLB funding agreements are used in an investment spread capacity and are valued using the par value, which approximates fair value. Funding agreements issued directly to states and other deposit-type contracts are valued based on the accumulated account value, which approximates fair value. All deposit-type contracts are classified as Level 3.
Assets and liabilities measured and reported at fair value
The following table provides information about the aggregate fair value for financial instruments measured and reported at fair value and their level within the fair value hierarchy as well as investments valued at their NAV at December 31, (in millions):
| 2025 | ||||||||||||||||||||
| Level 1 | Level 2 | Level 3 | NAV | Total | ||||||||||||||||
| Assets at fair value: |
||||||||||||||||||||
| Bonds |
||||||||||||||||||||
| Issuer Credit Obligation |
$ | — | $ | 1,194 | $ | — | $ | — | $ | 1,194 | ||||||||||
| Asset-Backed Securities |
— | 350 | 3 | — | 353 | |||||||||||||||
| Total bonds |
$ | — | $ | 1,544 | $ | 3 | $ | — | $ | 1,547 | ||||||||||
| Common stock |
||||||||||||||||||||
| Industrial and miscellaneous |
$ | 3,169 | $ | 97 | $ | 439 | $ | — | $ | 3,705 | ||||||||||
| Total common stocks |
$ | 3,169 | $ | 97 | $ | 439 | $ | — | $ | 3,705 | ||||||||||
| Preferred stock |
$ | — | $ | 768 | $ | 48 | $ | — | $ | 816 | ||||||||||
| Total preferred stocks |
$ | — | $ | 768 | $ | 48 | $ | — | $ | 816 | ||||||||||
| Derivatives |
||||||||||||||||||||
| Foreign exchange contracts |
$ | — | $ | 233 | $ | — | $ | — | $ | 233 | ||||||||||
| Credit default swaps |
— | — | — | — | — | |||||||||||||||
| Total derivatives |
$ | — | $ | 233 | $ | — | $ | — | $ | 233 | ||||||||||
| Separate accounts assets |
$ | 30,006 | $ | 1,813 | $ | 22,070 | $ | 840 | $ | 54,729 | ||||||||||
| Total assets at fair value |
$ | 33,175 | $ | 4,455 | $ | 22,560 | $ | 840 | $ | 61,030 | ||||||||||
| Liabilities at fair value: |
||||||||||||||||||||
| Derivatives |
||||||||||||||||||||
| Interest rate contracts |
$ | — | $ | 3 | $ | — | $ | — | $ | 3 | ||||||||||
| Foreign exchange contracts |
— | 437 | — | — | 437 | |||||||||||||||
| Total liabilities at fair value |
$ | — | $ | 440 | $ | — | $ | — | $ | 440 | ||||||||||
| Teachers Insurance and Annuity Association of America ∎ Statement of Additional Information | B-105 |
Table of Contents
| Notes to statutory–basis financial statements |
Teachers Insurance and Annuity Association of America
December 31, 2025
| 2024 | ||||||||||||||||||||
| Level 1 | Level 2 | Level 3 | NAV | Total | ||||||||||||||||
| Assets at fair value: |
||||||||||||||||||||
| Bonds |
||||||||||||||||||||
| Issuer Credit Obligation |
$ | — | $ | 1,079 | $ | — | $ | — | $ | 1,079 | ||||||||||
|
Asset-Backed Securities |
— | 637 | — | — | 637 | |||||||||||||||
| Total bonds |
$ | — | $ | 1,716 | $ | — | $ | — | $ | 1,716 | ||||||||||
| Common stock |
||||||||||||||||||||
| Industrial and miscellaneous |
$ | 1,553 | $ | 139 | $ | 486 | $ | — | $ | 2,178 | ||||||||||
| Total common stocks |
$ | 1,553 | $ | 139 | $ | 486 | $ | — | $ | 2,178 | ||||||||||
| Preferred stock |
$ | 52 | $ | 848 | $ | 61 | $ | — | $ | 961 | ||||||||||
| Total preferred stocks |
$ | 52 | $ | 848 | $ | 61 | $ | — | $ | 961 | ||||||||||
| Derivatives |
||||||||||||||||||||
| Foreign exchange contracts |
$ | — | $ | 779 | $ | — | $ | — | $ | 779 | ||||||||||
| Total derivatives |
$ | — | $ | 779 | $ | — | $ | — | $ | 779 | ||||||||||
| Separate accounts assets |
$ | 26,654 | $ | 1,241 | $ | 21,573 | $ | 740 | $ | 50,208 | ||||||||||
| Total assets at fair value |
$ | 28,259 | $ | 4,723 | $ | 22,120 | $ | 740 | $ | 55,842 | ||||||||||
| Liabilities at fair value: |
||||||||||||||||||||
| Derivatives |
||||||||||||||||||||
| Interest rate contracts |
$ | — | $ | 5 | $ | — | $ | — | $ | 5 | ||||||||||
| Foreign exchange contracts |
— | 34 | — | — | 34 | |||||||||||||||
| Total liabilities at fair value |
$ | — | $ | 39 | $ | — | $ | — | $ | 39 | ||||||||||
Reconciliation of Level 3 assets and liabilities measured and reported at fair value:
The following is a reconciliation of the beginning and ending balances for assets and liabilities measured and reported at fair value using Level 3 inputs at December 31, 2025 (in millions):
| Balance at |
Transfers into Level 3 |
Transfers out of Level 3 |
Total gains included in |
Total gains & (losses) |
Purchases | Issuances | Sales | Settlements | Ending Balance at 12/31/2025 |
|||||||||||||||||||||||||||||||
| Issuer Credit Obligations |
$ | — | $ | 7 | a | $ | (3 | )b | $ | (3 | ) | $ | (1 | ) | $ | — | $ | — | $ | — | $ | — | $ | — | ||||||||||||||||
| Asset-Backed Securities |
— | 4 | a | — | — | — | — | — | (1 | ) | 3 | |||||||||||||||||||||||||||||
| Common stock |
486 | — | (9 | )b | 34 | (31 | ) | 1,191 | — | (1,232 | ) | — | 439 | |||||||||||||||||||||||||||
| Preferred stock |
61 | — | — | 2 | (12 | ) | — | — | (3 | ) | — | 48 | ||||||||||||||||||||||||||||
| Separate account assets |
21,573 | — | — | 97 | 37 | 1,717 | — | (943 | ) | (411 | ) | 22,070 | ||||||||||||||||||||||||||||
| Total |
$ | 22,120 | $ | 11 | $ | (12 | ) | $ | 130 | $ | (7 | ) | $ | 2,908 | $ | — | $ | (2,178 | ) | $ | (412 | ) | $ | 22,560 | ||||||||||||||||
| (a) | The Company transferred bonds into Level 3 that were measured and reported at fair value. |
| (b) | The Company transferred bonds and common stocks into Level 3 that were measured and reported at fair value. |
| B-106 | Statement of Additional Information ∎ Teachers Insurance and Annuity Association of America |
Table of Contents
| continued |
The following is a reconciliation of the beginning and ending balances for assets and liabilities measured and reported at fair value using Level 3 inputs at December 31, 2024 (in millions):
| Beginning 1/1/2024 |
Transfers into Level 3 |
Transfers out of Level 3 |
Total gains included in |
Total gains (losses) included in Surplus |
Purchases | Issuances | Sales | Settlements | Ending Balance at 12/31/2024 |
|||||||||||||||||||||||||||||||
| Issuer Credit Obligations |
$ | — | $ | — | $ | — | $ | (4 | ) | $ | 3 | $ | — | $ | 1 | $ | — | $ | — | $ | — | |||||||||||||||||||
| Common stock |
505 | — | — | 26 | (25 | ) | 2,210 | — | (2,230 | ) | — | 486 | ||||||||||||||||||||||||||||
| Preferred stock |
74 | 9a | — | (7 | ) | (4 | ) | — | — | (11 | ) | — | 61 | |||||||||||||||||||||||||||
| Separate account assets |
24,290 | — | — | (356 | ) | (1,394 | ) | 774 | — | (1,679 | ) | (62 | ) | 21,573 | ||||||||||||||||||||||||||
| Total |
$ | 24,869 | $ | 9 | $ | — | $ | (341 | ) | $ | (1,420 | ) | $ | 2,984 | $ | 1 | $ | (3,920 | ) | $ | (62 | ) | $ | 22,120 | ||||||||||||||||
| (a) | The Company transferred Preferred stock into Level 3 that is measured and reported at fair value. |
The Company’s policy is to recognize transfers into and out of Level 3 at the actual date of the event or change in circumstances that caused the transfer.
Quantitative information regarding level 3 fair value measurements
The following table provides quantitative information on significant unobservable inputs (Level 3) used in the fair value measurement of assets that are measured and reported at fair value at December 31, 2025 (in millions):
| Financial Instrument | Fair Value |
Valuation Techniques | Significant Unobservable Inputs |
Range of Inputs | Weighted Average |
|||||||||
| ABS |
||||||||||||||
| Residential mortgage-backed securities (“RMBS”) |
$ | 3 | Discounted cash Flow | Discount rate | 6.3% | 6.3 | % | |||||||
| Equity securities: |
||||||||||||||
| Common stock |
$ | 439 | Market comparable | Earnings before interest, taxes, depreciation and amortization (“EBITDA”) multiple | 6.50x–14.00x | 9.93x | ||||||||
| Equity method | Company Financials | 1.0x | 1.0x | |||||||||||
| Market comparable | Revenue Multiple | 8.4x | 8.4x | |||||||||||
| Preferred stock |
$ | 48 | Market comparable | EBITDA multiple | 13.5x | 13.5x | ||||||||
| Market comparable | Price-to-book multiple | 2.5x | 2.5x | |||||||||||
| Market comparable | Market Yield | 12.6% | 12.6 | % | ||||||||||
| Separate account assets: |
||||||||||||||
| Real estate properties and real estate joint ventures |
$ | 20,760 | ||||||||||||
| Office properties |
Income approach—discounted cash flow | Discount rate | 6.8%–11.0% | 8.5 | % | |||||||||
| Terminal capitalization rate | 5.5%–10.3% | 6.9 | % | |||||||||||
| Income approach—direct capitalization | Overall capitalization rate | 5.0%–12.5% | 6.9 | % | ||||||||||
| Industrial properties |
Income approach—discounted cash flow | Discount rate | 6.5%–8.1% | 7.2 | % | |||||||||
| Terminal capitalization rate | 5.2%–6.8% | 5.6 | % | |||||||||||
| Income approach—direct capitalization | Overall capitalization rate | 3.8%–6.3% | 5.2 | % | ||||||||||
| Residential properties |
Income approach—discounted cash flow | Discount rate | 6.5%–9.3% | 7.0 | % | |||||||||
| Terminal capitalization rate | 5.0%–7.8% | 5.5 | % | |||||||||||
| Income approach—direct capitalization | Overall capitalization rate | 4.8%–7.0% | 5.0 | % | ||||||||||
| Retail properties |
Income approach—discounted cash flow | Discount rate | 6.5%–12.0% | 7.4 | % | |||||||||
| Terminal capitalization rate | 5.5%–9.5% | 6.3 | % | |||||||||||
| Income approach—direct capitalization | Overall capitalization rate | 5.0%–9.0% | 6.0 | % | ||||||||||
| Hotel properties |
Income approach—discounted cash flow | Discount rate | 10.0% | 10.0 | % | |||||||||
| Terminal capitalization rate | 8.0% | 8.0 | % | |||||||||||
| Income approach—direct capitalization | Overall capitalization rate | 7.8% | 7.8 | % | ||||||||||
| Land |
Sales Comparison Approach | Price per projected unit | $55–$140 | $ | 101 | |||||||||
| Teachers Insurance and Annuity Association of America ∎ Statement of Additional Information | B-107 |
Table of Contents
| Notes to statutory–basis financial statements |
Teachers Insurance and Annuity Association of America
December 31, 2025
Separate account real estate assets include the values of the related mortgage loans payable in the table below at December 31, 2025 (in millions):
| Financial Instrument | Fair Value |
Valuation Techniques | Significant Unobservable Inputs |
Range of Inputs | Weighted Average |
|||||||||
| Mortgage loans payable |
$ | (830 | ) | |||||||||||
| Office properties |
Discounted cash flow | Loan-to-value ratio | 42.4%–80% | 71.4 | % | |||||||||
| Equivalency rate | 5.8%–6.7% | 6.5 | % | |||||||||||
| Loan-to-value ratio | 42.4%–80% | 71.4 | % | |||||||||||
| Net present value | Weighted average cost of capital risk premium multiple | 1.1x–1.9x | 1.7x | |||||||||||
| Industrial properties |
Discounted cash flow | Loan-to-value ratio | 30.3%–40.6% | 35.1 | % | |||||||||
| Equivalency rate | 5.4%–5.9% | 5.6 | % | |||||||||||
| Loan-to-value ratio | 30.3%–40.6% | 35.1 | % | |||||||||||
| Net present value | Weighted average cost of capital risk premium multiple | 1.1x–1.1x | 1.1x | |||||||||||
| Residential properties |
Discounted cash flow | Loan-to-value ratio | 44.8%–72.8% | 56.3 | % | |||||||||
| Equivalency rate | 4.7%–6% | 5.2 | % | |||||||||||
| Loan-to-value ratio | 44.8%–72.8% | 56.3 | % | |||||||||||
| Net present value | Weighted average cost of capital risk premium multiple | 1.2x–1.5x | 1.3x | |||||||||||
| Retail properties |
Discounted cash flow | Loan-to-value ratio | 48.7%–75.4% | 53.9 | % | |||||||||
| Equivalency rate | 5.5%–7.3% | 6.3 | % | |||||||||||
| Loan-to-value ratio | 48.7%–75.4% | 53.9 | % | |||||||||||
| Net present value | Weighted average cost of capital risk premium multiple | 1.2x–1.6x | 1.3x | |||||||||||
Separate account real estate assets include the values of the related loan receivable in the table below at December 31, 2025 (in millions):
| Financial Instrument | Fair Value |
Valuation Techniques | Significant Unobservable Inputs |
Range of Inputs | Weighted Average |
|||||||||
| Loan receivable |
$ | 1,067 | ||||||||||||
| Office properties |
Discounted cash flow | Loan-to-value ratio | 55.0%–73.3% | 63.6 | % | |||||||||
| Equivalency rate | 6.2%–9.3% | 6.7 | % | |||||||||||
| Industrial properties |
Discounted cash flow | Loan-to-value ratio | 51.6%–68.8% | 55.9 | % | |||||||||
| Equivalency rate | 5.3%–8.3% | 6.0 | % | |||||||||||
| Residential properties |
Discounted cash flow | Loan-to-value ratio | 58.3%–61.7% | 60.6 | % | |||||||||
| Equivalency rate | 7.0%–8.3% | 7.4 | % | |||||||||||
Separate account real estate assets include the values of the real estate operating business in the table below at December 31, 2025 (in millions):
| Financial Instrument | Fair Value |
Valuation Techniques | Significant Unobservable Inputs |
Range of Inputs | Weighted Average |
|||||||||
| Real estate operating business |
$ | 1,073 | ||||||||||||
| Discounted cash flow | Discount rate | 13.0% | 13.0 | % | ||||||||||
| Terminal growth rate | 11.4% | 11.4 | % | |||||||||||
| Market approach | EBITDA multiple | 30.3x | 30.3x | |||||||||||
| Terminal EBITDA Multiple | 20.0x | 20.0x | ||||||||||||
Additional qualitative information on fair valuation process
The Company has various processes and controls in place to ensure that fair value is reasonably estimated. The procedures and framework for fair value methodologies are approved by the TIAA Valuation Committee. The valuation teams are responsible for the determination of fair value in accordance with the procedures and framework approved by the TIAA Valuation Committee.
The valuation teams (1) compare price changes between periods to current market conditions, (2) compare trade prices of securities to fair value estimates, (3) compare prices from multiple pricing sources, and (4) perform ongoing vendor due diligence
| B-108 | Statement of Additional Information ∎ Teachers Insurance and Annuity Association of America |
Table of Contents
| continued |
to confirm that independent pricing services use market-based parameters for valuation. Internal and vendor valuation methodologies are reviewed on an ongoing basis and revised as necessary based on changing market conditions to ensure values represent a reasonable exit price.
Markets in which the Company’s fixed income securities trade are monitored by surveying the Company’s traders. The valuation teams determine if liquidity is active enough to support a Level 2 classification. Use of independent non-binding broker quotations may indicate a lack of liquidity or the general lack of transparency in the process to develop these price estimates, causing them to be considered Level 3.
Level 3 equity investments generally include private equity co-investments along with general and limited partnership interests. Values are derived by the general partners. The partners generally fair value these instruments based on projected net earnings, earnings before interest, taxes depreciation and amortization, discounted cash flow, public or private market transactions, or valuations of comparable companies. When using market comparables, certain adjustments may be made for differences between the reference comparable and the investment, such as liquidity. Investments may also be valued at cost for a period of time after an acquisition, as the best indication of fair value.
With respect to real property investments in the TIAA Real Estate Account (“REA”), each property is appraised, and each mortgage loan is valued, at least once every calendar quarter. Each property is appraised by an independent, third party appraiser, reviewed by the Company’s internal appraisal staff and as applicable, the REA’s independent fiduciary. Any differences in the conclusions of the Company’s internal appraisal staff and the independent appraiser are reviewed by the independent fiduciary, who will make a final determination. The independent fiduciary was appointed by a special subcommittee of the Investment Committee of TIAA Board of Trustees to, among other things, oversee the appraisal process. The independent fiduciary must approve all independent appraisers used by the REA.
Mortgage loans payable are valued internally by the valuation teams, and reviewed by the REA’s independent fiduciary, at least quarterly based on market factors, such as market interest rates and spreads for comparable loans, the performance of the underlying collateral (such as the loan-to-value ratio and the cash flow of the underlying collateral), the liquidity for mortgage loans of similar characteristics, the maturity date of the loan, the return demands of the market.
The loans receivable are valued internally by the valuation teams, and reviewed by the REA’s independent fiduciary, at least quarterly based on market factors, such as market interest rates and spreads for comparable loans, the liquidity for loans of similar characteristics, the performance of the underlying collateral (such as the loan-to-value ratio and the cash flow of the underlying collateral) and the credit quality of the counterparty. The Real Estate Account continues to use the revised value after valuation adjustments for the loan receivable to calculate the Account’s daily NAV until the next valuation review.
| Teachers Insurance and Annuity Association of America ∎ Statement of Additional Information | B-109 |
Table of Contents
| Notes to statutory–basis financial statements |
Teachers Insurance and Annuity Association of America
December 31, 2025
Note 11—restricted assets
The following tables provide information on the amounts and nature of assets pledged to others as collateral or otherwise restricted by the Company as of December 31, (in millions):
| 2025 | ||||||||||||||||||||||||||||||||||||||||||||
| 1 | 2 | 3 | 4 | 5 | 6 | 7 | 8 | 9 | 10 | 11 | ||||||||||||||||||||||||||||||||||
| Restricted Asset Category | Total General Account (G/A) |
G/A Supporting (S/A) Activity |
Total Restricted |
S/A Assets Supporting G/A Activity |
Total (1 plus 3) |
Total From Prior Year |
Increase/ (5 minus 6) |
Total Non admitted Restricted |
Total Admitted Restricted (5 minus 8) |
Gross Restricted to Total |
Admitted Restricted to Total Admitted Assets |
|||||||||||||||||||||||||||||||||
| Collateral held under security lending agreements |
$ | 2,474 | $ | — | $ | 4 | $ | — | $ | 2,478 | $ | 1,375 | $ | 1,103 | $ | — | $ | 2,478 | 0.64 | % | 0.65 | % | ||||||||||||||||||||||
| Subject to reverse repurchase agreements |
23 | — | 265 | — | 288 | — | 288 | — | 288 | 0.07 | % | 0.08 | % | |||||||||||||||||||||||||||||||
| FHLB capital stock |
375 | — | — | — | 375 | 373 | 2 | — | 375 | 0.10 | % | 0.10 | % | |||||||||||||||||||||||||||||||
| On deposit with states |
19 | — | — | — | 19 | 19 | — | — | 19 | — | % | — | % | |||||||||||||||||||||||||||||||
| Pledged as collateral to FHLB (including assets backing funding agreements) |
8,804 | — | — | — | 8,804 | 9,108 | (304 | ) | — | 8,804 | 2.28 | % | 2.31 | % | ||||||||||||||||||||||||||||||
| Pledged as collateral not captured in other categories |
2,061 | — | — | — | 2,061 | 1,186 | 875 | — | 2,061 | 0.53 | % | 0.54 | % | |||||||||||||||||||||||||||||||
| Other restricted assets |
— | — | 26 | — | 26 | 48 | (22 | ) | — | 26 | 0.01 | % | 0.01 | % | ||||||||||||||||||||||||||||||
| Collateral assets received and on balance sheet |
612 | — | — | — | 612 | 1,570 | (958 | ) | — | 612 | 0.16 | % | 0.16 | % | ||||||||||||||||||||||||||||||
| Assets held under modco reinsurance agreements |
251 | — | 155 | — | 406 | 379 | 27 | — | 406 | 0.11 | % | 0.11 | % | |||||||||||||||||||||||||||||||
| Total restricted assets |
$ | 14,619 | $ | — | $ | 450 | $ | — | $ | 15,069 | $ | 14,058 | $ | 1,011 | $ | — | $ | 15,069 | 3.91 | % | 3.96 | % | ||||||||||||||||||||||
| 2024 | ||||||||||||||||||||||||||||||||||||||||||||
| 1 | 2 | 3 | 4 | 5 | 6 | 7 | 8 | 9 | 10 | 11 | ||||||||||||||||||||||||||||||||||
| Restricted Asset Category | Total General Account (G/A) |
G/A Supporting Separate Account (S/A) Activity |
Total S/A Restricted |
S/A Assets Supporting G/A Activity |
Total (1 plus 3) |
Total From Prior Year |
Increase/ (5 minus 6) |
Total Non admitted Restricted |
Total Admitted Restricted (5 minus 8) |
Gross to Total Assets |
Admitted Restricted to Total Admitted Assets |
|||||||||||||||||||||||||||||||||
| Collateral held under security lending agreements |
$ | 1,373 | $ | — | $ | 2 | $ | — | $ | 1,375 | $ | 652 | $ | 723 | $ | — | $ | 1,375 | 0.37 | % | 0.37 | % | ||||||||||||||||||||||
| FHLB capital stock |
373 | — | — | — | 373 | 367 | 6 | — | 373 | 0.10 | % | 0.10 | % | |||||||||||||||||||||||||||||||
| On deposit with states |
19 | — | — | — | 19 | 19 | — | — | 19 | 0.01 | % | — | % | |||||||||||||||||||||||||||||||
| Pledged as collateral to |
||||||||||||||||||||||||||||||||||||||||||||
| FHLB (Including assets backing funding agreements) |
9,108 | — | — | — | 9,108 | 8,729 | 379 | — | 9,108 | 2.44 | % | 2.48 | % | |||||||||||||||||||||||||||||||
| Pledged as collateral not captured in other categories |
1,186 | — | — | — | 1,186 | 231 | 955 | — | 1,186 | 0.32 | % | 0.32 | % | |||||||||||||||||||||||||||||||
| Other restricted assets |
— | — | 48 | — | 48 | 37 | 11 | — | 48 | 0.01 | % | 0.01 | % | |||||||||||||||||||||||||||||||
| Collateral assets received and on balance sheet |
1,570 | — | — | — | 1,570 | 1,039 | 531 | — | 1,570 | 0.42 | % | 0.43 | % | |||||||||||||||||||||||||||||||
| Assets held under modco reinsurance agreements |
246 | — | 133 | — | 379 | 357 | 22 | — | 379 | 0.10 | % | 0.10 | % | |||||||||||||||||||||||||||||||
| Total restricted assets |
$ | 13,875 | $ | — | $ | 183 | $ | — | $ | 14,058 | $ | 11,431 | $ | 2,627 | $ | — | $ | 14,058 | 3.77 | % | 3.81 | % | ||||||||||||||||||||||
As of December 31, 2025, there were no reconciling differences between the Restricted Assets footnote and the General Interrogatories. For the prior year ended December 31, 2024, the General Interrogatories category ‘Pledged as collateral not captured in other categories’ included $1,570 million of cash collateral that counterparties pledged to the Company. This amount is separately disclosed in collateral assets received and on balance sheet within the table above.
The pledged as collateral not captured in other categories primarily represents derivative collateral the Company has pledged.
The other restricted assets represents real estate deposits held within separate accounts.
| B-110 | Statement of Additional Information ∎ Teachers Insurance and Annuity Association of America |
Table of Contents
| continued |
The following tables provide the collateral received and assets held under Modco reinsurance agreements reflected as assets by the Company and the recognized obligation to return collateral assets as of December 31, (in millions):
| 2025 | ||||||||||||||||||||||||
| Assets |
Book/ Collateral |
BACV Modco |
Fair Value Collateral |
Fair Value Modco |
% of BACV to (Admitted and Nonadmitted) |
% of BACV to Total Assets |
||||||||||||||||||
| General Account: |
||||||||||||||||||||||||
| Cash, Cash Equivalents and Short-Term |
||||||||||||||||||||||||
| Investments |
$ | 612 | $ | — | $ | 612 | $ | — | 0.187 | % | 0.190 | % | ||||||||||||
| ICO |
— | 245 | — | 212 | 0.075 | % | 0.076 | % | ||||||||||||||||
| ABS |
4 | — | 4 | 0.001 | % | 0.001 | % | |||||||||||||||||
| Preferred stocks |
2 | — | 1 | 0.001 | % | 0.001 | % | |||||||||||||||||
| Securities lending collateral assets |
2,474 | — | 2,474 | — | 0.755 | % | 0.768 | % | ||||||||||||||||
| Total Assets |
$ | 3,086 | $ | 251 | $ | 3,086 | $ | 217 | 1.019 | % | 1.036 | % | ||||||||||||
| Separate Account: |
||||||||||||||||||||||||
| Common stocks |
$ | — | $ | 155 | $ | — | $ | 155 | 0.267 | % | 0.267 | % | ||||||||||||
| Securities lending collateral assets |
4 | — | 4 | — | 0.007 | % | 0.007 | % | ||||||||||||||||
| Total Assets |
$ | 4 | $ | 155 | $ | 4 | $ | 155 | 0.274 | % | 0.274 | % | ||||||||||||
| 2025 | ||||||||
| Amount | % of Total Liabilities |
|||||||
| Recognized Obligation to Return Collateral Asset (General Account) |
$ | 3,086 | 1.10 | % | ||||
| Recognized Obligation to Return Collateral Asset (Separate Account) |
$ | 4 | 0.01 | % | ||||
| Recognized Obligation for Modco assets (General Account) |
$ | 251 | 0.09 | % | ||||
| Recognized Obligation for Modco assets (Separate Account) |
$ | 155 | 0.27 | % | ||||
|
|
|
2024 |
|
|
||||||||||||||||||||
| Assets | BACV | BACV Modco |
Fair Value Collateral |
Fair Value Modco |
% of BACV to (Admitted and Nonadmitted) |
% of BACV to Total Assets |
||||||||||||||||||
| General Account: |
||||||||||||||||||||||||
| Cash, Cash Equivalents and Short-Term |
||||||||||||||||||||||||
| Investments |
$ | 1,570 | $ | 10 | $ | 1,570 | $ | 10 | 0.51 | % | 0.52 | % | ||||||||||||
| ICO |
— | 230 | — | 188 | — | % | — | % | ||||||||||||||||
| ABS |
4 | — | 4 | — | % | — | % | |||||||||||||||||
| Preferred Stocks |
2 | — | 1 | — | % | — | % | |||||||||||||||||
| Securities lending collateral assets |
1,373 | — | 1,373 | — | 0.45 | % | 0.46 | % | ||||||||||||||||
| Total Assets |
$ | 2,943 | $ | 246 | $ | 2,943 | $ | 203 | 0.96 | % | 0.98 | % | ||||||||||||
| Separate Account: |
||||||||||||||||||||||||
| Common stocks |
$ | — | $ | 133 | $ | — | $ | 133 | 0.25 | % | 0.25 | % | ||||||||||||
| Securities lending collateral assets |
2 | — | 2 | — | — | % | — | % | ||||||||||||||||
| Total Assets |
$ | 2 | $ | 133 | $ | 2 | $ | 133 | 0.25 | % | 0.25 | % | ||||||||||||
| 2024 | ||||||||
| Amount | % of Total Liabilities |
|||||||
| Recognized Obligation to Return Collateral Assets (General Account) |
$ | 2,943 | 1.13 | % | ||||
| Recognized Obligation to Return Collateral Asset (Separate Account) |
$ | 2 | — | % | ||||
| Recognized Obligation for Modco assets (General Account) |
$ | 246 | 0.09 | % | ||||
| Recognized Obligation for Modco assets (Separate Account) |
$ | 133 | 0.26 | % | ||||
| Teachers Insurance and Annuity Association of America ∎ Statement of Additional Information | B-111 |
Table of Contents
| Notes to statutory–basis financial statements |
Teachers Insurance and Annuity Association of America
December 31, 2025
For the years ended December 31, 2025 and 2024, no investments held under Modco reinsurance agreements were related to or affiliated with the reinsurer.
None of the assets held as collateral or under Modco reinsurance agreements were pledged for another purpose.
The Company receives primarily cash collateral for derivatives. The Company reinvests the cash collateral or uses the cash for general corporate purposes.
Note 12—derivative financial instruments
The Company uses derivative instruments for economic hedging and asset replication purposes. The Company does not engage in derivative financial instrument transactions for speculative purposes. The Company does not enter into derivative financial instruments with financing premiums.
Counterparty and Credit Risk: Derivative financial instruments used by the Company may be exchange-traded or contracted in the over-the-counter market (“OTC”). The Company’s OTC derivative transactions are cleared and settled through central clearing counterparties (“OTC-cleared”) or through bilateral contracts with other counterparties (“OTC-bilateral”). Should an OTC-bilateral counterparty fail to perform its obligations under contractual terms, the Company may be exposed to credit-related losses. The current credit exposure of the Company’s derivatives is limited to the net positive fair value of derivatives at the reporting date, after taking into consideration the existence of netting agreements and any collateral received. All of the credit exposure for the Company from OTC-bilateral contracts is with investment grade counterparties. The Company also monitors its counterparty credit quality on an ongoing basis.
The Company currently has International Swaps and Derivatives Association (“ISDA”) master swap agreements in place with each derivative counterparty relating to OTC transactions. In addition to the ISDA agreement, Credit Support Annexes (“CSA”), which are bilateral collateral agreements, are put in place with a majority of the Company’s derivative OTC-bilateral counterparties. The CSAs allow the Company’s mark-to-market exposure to a counterparty to be collateralized by the posting of cash or highly liquid U.S. government securities. The Company also exchanges cash and securities margin for derivatives traded through a central clearinghouse. Due to the level of material swap exposure, the Company also entered Uncleared Margin Rules (“UMR”) agreements with certain non-clearinghouse counterparties to adhere to Initial Margin (“IM”) obligations for uncleared swap transactions. As of December 31, 2025 and 2024, counterparties pledged the following cash and initial margins to the Company (in millions):
| December 31, | ||||||||
| 2025 | 2024 | |||||||
| Cash collateral and margin |
$ | 612 | $ | 1,570 | ||||
| Securities collateral and margin |
$ | 548 | $ | 398 | ||||
The Company must also post collateral or margin to the extent its net position with a given counterparty or clearinghouse is at a loss relative to the counterparty. As of December 31, 2025 and 2024, the Company pledged the following collateral and initial margins to its counterparties (in millions):
| December 31, | ||||||||
| 2025 | 2024 | |||||||
| Cash collateral and margin |
$ | 5 | $ | 5 | ||||
| Securities collateral and margin |
$ | 1,990 | $ | 1,113 | ||||
The amount of accounting loss the Company will incur if any party to the derivative contract fails completely to perform according to the terms of the contract and the collateral or other security, if any, for the amount due proved to be of no value to the Company is equal to the gross asset value and accrued interest receivable of all derivative contracts which, as of December 31, 2025 and 2024, were $1,605 million and $2,066 million, respectively.
Certain of the Company’s master swap agreements governing its derivative instruments contain provisions that require the Company to maintain a minimum credit rating from two of the major credit rating agencies. If the Company’s credit rating falls below the specified minimum, each of the counterparties to agreements with such requirements could terminate all outstanding derivative transactions between such counterparty and the Company. The termination requires immediate payment of amounts expected to approximate the net liability positions of such transactions with such counterparty. The aggregate fair value of all derivative instruments with credit-risk-related contingent features in a liability position on December 31, 2025 and 2024 were $1,125 million and $235 million, respectively, for which the Company posted collateral of $1,235 million and $244 million, respectively, through the normal course of business.
| B-112 | Statement of Additional Information ∎ Teachers Insurance and Annuity Association of America |
Table of Contents
| continued |
Derivative Types: The Company utilizes the following types of derivative financial instruments and strategies within its portfolio:
Interest Rate Swap Contracts: The Company enters into interest rate swap contracts to economically hedge against the effect of interest rate fluctuations on certain variable interest rate bonds and other commitments. The Company also uses interest rate swap contracts in certain replication synthetic asset transactions. (“RSAT”). RSATs are derivative transactions (the derivative component) established concurrently with other investments (the cash component) in order to “replicate” the investment characteristics of another permissible instrument (the reference entity). The Company does not apply hedge accounting for these derivatives instruments.
Foreign Currency Swap Contracts: The Company enters into foreign currency swap contracts and forward foreign currency swap contracts to exchange fixed and variable amounts of foreign currency at specified future dates and at specified rates (in U.S. dollars) as a cash flow hedge to manage currency risks on investments denominated in foreign currencies. The Company applies hedge accounting to certain of these derivatives instruments and fair value accounting to the majority of these derivatives instruments.
Foreign Currency Forward Contracts: The Company enters into foreign currency forward contracts to exchange foreign currency at specified future dates and at specified rates (in U.S. dollars) to manage currency risks on investments denominated in foreign currencies. The Company does not apply hedge accounting for these derivatives instruments.
Purchased Credit Default Swap Contracts: The Company purchases credit default swaps to hedge against unexpected credit events on selective investments held in the Company’s investment portfolio. The Company pays a periodic fee in exchange for the right to put the underlying investment back to the counterparty at par upon a credit event by the underlying referenced issuer. Credit events are typically defined as bankruptcy, failure to pay, or certain types of restructuring. The Company does not apply hedge accounting for these derivatives instruments.
Written Credit Default Swaps used in Replication Transactions: Credit default swaps are used by the Company in conjunction with long-term bonds as RSAT. The Company sells credit default swaps on single name corporate or sovereign credits, credit indices, or credit index tranches and provides credit default protection to the buyer. Events or circumstances that would require the Company to perform under a written credit default swap may include, but are not limited to, bankruptcy, failure to pay, debt moratorium, debt repudiation, debt restructuring, or default. The Company does not apply hedge accounting for these derivatives instruments.
Asset Swap Contracts: The Company enters into asset swap contracts to hedge against inflation risk associated with its TIPS. The Company also uses asset swap contracts in certain RSATs. For hedges of its TIPS, the Company pays all cash flows received from the TIPS security to the counterparty in exchange for fixed interest rate coupon payments. The Company applies hedge accounting for asset swaps used in hedging transactions, and does not apply hedge accounting for asset swaps used in RSATs.
Total Return Swap Contracts: The Company enters into total return swap contracts in conjunction with long-term bonds as part of its RSAT strategy. The Company does not apply hedge accounting for these derivatives instruments.
Bond Forward Contracts: The Company enters into forward bond contracts to purchase an identified bond at a specified price on a future date to economically hedge against the effect of interest rate fluctuations. The Company applies hedge accounting for these derivative instruments. The Company also uses bond forward contracts as part of its RSAT strategy. The Company does not apply hedge accounting for these derivatives instruments.
Swaption Contracts: The Company enters into swaption contracts as part of its RSAT strategy. The purchased swaption provides the Company with the option, but not the obligation, to enter into the interest rate swap agreement at predetermined terms. The written swaption grants the counterparty the right, but not the obligation, to enter into the interest rate swap at the predetermined terms. The swaption contracts help manage duration risk and provide flexibility in the Company’s asset-liability management program. The Company does not apply hedge accounting for these derivative instruments.
| Teachers Insurance and Annuity Association of America ∎ Statement of Additional Information | B-113 |
Table of Contents
| Notes to statutory–basis financial statements |
Teachers Insurance and Annuity Association of America
December 31, 2025
The table below illustrates the change in net unrealized capital gains and losses and realized capital gains and losses from derivative instruments. Instruments utilizing hedge accounting treatment are shown as qualifying hedge relationships. Instruments that utilize fair value accounting are shown as non-qualifying hedge relationships. Derivatives used in replication strategies are shown as derivatives used for other than hedging purposes (in millions):
| December 31, 2025 | December 31, 2024 | December 31, 2023 | ||||||||||||||||||||||
| Qualifying hedge relationships | Change in Net Unrealized Capital Gain (Loss) |
Net Realized Capital Gain (Loss) |
Change in Net Unrealized Capital Gain (Loss) |
Net Realized Capital Gain (Loss) |
Change in Net Unrealized Capital Gain (Loss) |
Net Realized Capital Gain (Loss) |
||||||||||||||||||
| Foreign currency swap |
$ | (519 | ) | $ | 23 | $ | 246 | $ | 2 | $ | (101 | ) | $ | (3 | ) | |||||||||
| Total qualifying hedge relationships |
$ | (519 | ) | $ | 23 | $ | 246 | $ | 2 | $ | (101 | ) | $ | (3 | ) | |||||||||
| Non-qualifying hedge relationships | ||||||||||||||||||||||||
| Foreign currency swaps |
$ | (495 | ) | $ | 10 | $ | 195 | $ | (7 | ) | $ | (417 | ) | $ | 85 | |||||||||
| Foreign currency forwards |
(459 | ) | (136 | ) | 444 | 2 | (147 | ) | 28 | |||||||||||||||
| Interest rate swaps |
3 | — | (1 | ) | — | 86 | (172 | ) | ||||||||||||||||
| Total non-qualifying hedge relationships |
$ | (951 | ) | $ | (126 | ) | $ | 638 | $ | (5 | ) | $ | (478 | ) | $ | (59 | ) | |||||||
| Derivatives used for other than hedging purposes |
$ | — | $ | (49 | ) | $ | — | $ | (105 | ) | $ | — | $ | 19 | ||||||||||
| Total derivatives |
$ | (1,470 | ) | $ | (152 | ) | $ | 884 | $ | (108 | ) | $ | (579 | ) | $ | (43 | ) | |||||||
Events or circumstances that would require the Company to perform under a written credit derivative position may include, but are not limited to, bankruptcy, failure to pay, debt moratorium, debt repudiation, restructuring of debt and acceleration, or default. The maximum potential amount of future payments (undiscounted) the Company could be required to make under the credit derivative is represented by the notional amount of the contract. Should a credit event occur, the amounts owed to a counterparty by the Company may be subject to recovery provisions that include, but are not limited to:
| 1. | Notional amount payment by the Company to Counterparty and/or delivery of physical security by Counterparty to the Company. |
| 2. | Notional amount payment by the Company to Counterparty net of contractual recovery fee. |
| 3. | Notional amount payment by the Company to Counterparty net of auction determined recovery fee. |
The Company will record an other-than-temporary impairment loss on a derivative position if an existing condition or set of circumstances indicates there is a limited ability to recover an unrealized loss.
The Company enters into replication transactions whereby credit default swaps have been written by the Company on credit indices, credit index tranches, or single name corporate or sovereign credits. Credit index positions represent replications where credit default swaps have been written by the Company on the Dow Jones North American Investment Grade Series of indexes (“DJ.NA.IG”). Each index is comprised of 125 liquid investment grade credits domiciled in North America and represents a broad exposure to the investment grade corporate market. Index positions also represent replications where credit default swaps have been written by the Company on the Dow Jones North American High Yield Series of indexes (“DJ.NA.HY”). Each index is comprised of 100 high yield credits domiciled in North America and represents a broad exposure to the high yield corporate market.
The Company writes contracts on the “Senior” tranche of the Dow Jones North American Investment Grade Index Series, whereby the Company is obligated to perform should the default rates of each index fall between 7%-15%. The Company also writes contracts on the “Super Mezzanine” and “Super Senior” tranches of the Dow Jones North American High Yield Index Series, whereby the Company is obligated to perform should the default rates of each index fall between 25%-35% and 35%-100%, respectively. The maximum potential amount of future payments (undiscounted) the Company could be required to make under these positions is represented by the notional amount of the contracts.
| B-114 | Statement of Additional Information ∎ Teachers Insurance and Annuity Association of America |
Table of Contents
| continued |
Information related to the credit quality of replication positions involving credit default swaps appears below. The values below are listed in order of their NAIC credit designation, with a designation of 1 having the highest credit quality based on the underlying asset referenced by the credit default swap (in millions):
| December 31, 2025 | December 31, 2024 | |||||||||||||||||||||||||||
| Referenced Credit Obligation | CDS Notional Amount |
CDS Estimated Fair Value |
Weighted Years to |
CDS Notional Amount |
CDS Estimated Fair Value |
Weighted Average Years to Maturity |
||||||||||||||||||||||
| RSAT NAIC Designation |
||||||||||||||||||||||||||||
| 1 Highest quality |
Single name credit default swaps | $ | — | $ | — | — | $ | — | $ | — | — | |||||||||||||||||
| Credit default swaps on indices | 12,799 | 1,055 | 4 | 12,327 | 948 | 4 | ||||||||||||||||||||||
| Subtotal | 12,799 | 1,055 | 4 | 12,327 | 948 | 4 | ||||||||||||||||||||||
| 2 High quality |
Single name credit default swaps | — | — | — | — | — | — | |||||||||||||||||||||
| Credit default swaps on indices | 100 | 2 | 3 | 150 | 3 | 4 | ||||||||||||||||||||||
| Subtotal | 100 | 2 | 3 | 150 | 3 | 4 | ||||||||||||||||||||||
| 3 Medium quality |
Single name credit default swaps | — | — | — | — | — | — | |||||||||||||||||||||
| Credit default swaps on indices | — | — | — | — | — | — | ||||||||||||||||||||||
| Subtotal | — | — | — | — | — | — | ||||||||||||||||||||||
| Total |
$ | 12,899 | $ | 1,057 | 4 | $ | 12,477 | $ | 951 | 4 | ||||||||||||||||||
The table on the following page illustrates derivative asset and liability positions held by the Company, including notional amounts, carrying values and estimated fair values. Instruments utilizing hedge accounting treatment are shown as qualifying hedge relationships. Hedging instruments that utilize fair value accounting are shown as non-qualifying hedge relationships. Derivatives used in replication strategies are shown as derivatives used for other than hedging purposes.
| Summary of Derivative Positions | ||||||||||||||||||||||||
| (in millions) | ||||||||||||||||||||||||
| December 31, 2025 | December 31, 2024 | |||||||||||||||||||||||
| Qualifying hedge relationships | Notional | Carrying Value |
Estimated FV |
Notional | Carrying Value |
Estimated FV |
||||||||||||||||||
| Asset swaps |
||||||||||||||||||||||||
| Assets |
$ | 1,210 | $ | — | $ | (267 | ) | $ | 1,210 | $ | — | $ | (258 | ) | ||||||||||
| Liabilities |
— | — | — | — | — | — | ||||||||||||||||||
| Effective foreign currency swaps |
||||||||||||||||||||||||
| Assets |
1,763 | 178 | 262 | 4,634 | 432 | 428 | ||||||||||||||||||
| Liabilities |
4,793 | (287 | ) | (176 | ) | 556 | (22 | ) | (9 | ) | ||||||||||||||
| Bond Forwards |
||||||||||||||||||||||||
| Assets |
5,000 | — | (251 | ) | — | — | — | |||||||||||||||||
| Liabilities |
— | — | — | — | — | — | ||||||||||||||||||
| Total qualifying hedge relationships |
$ | 12,766 | $ | (109 | ) | $ | (432 | ) | $ | 6,400 | $ | 410 | $ | 161 | ||||||||||
| Non-qualifying hedge relationships |
||||||||||||||||||||||||
| Interest rate swaps |
||||||||||||||||||||||||
| Assets |
$ | — | $ | — | $ | — | $ | — | $ | — | $ | — | ||||||||||||
| Liabilities |
61 | (3 | ) | (3 | ) | 116 | (5 | ) | (5 | ) | ||||||||||||||
| Foreign currency swaps |
||||||||||||||||||||||||
| Assets |
2,462 | 224 | 224 | 5,569 | 488 | 488 | ||||||||||||||||||
| Liabilities |
4,131 | (259 | ) | (259 | ) | 1,140 | (33 | ) | (33 | ) | ||||||||||||||
| Foreign currency forwards |
||||||||||||||||||||||||
| Assets |
254 | 9 | 9 | 6,381 | 291 | 291 | ||||||||||||||||||
| Liabilities |
6,276 | (178 | ) | (178 | ) | 10 | (1 | ) | (1 | ) | ||||||||||||||
| Purchased credit default swaps |
||||||||||||||||||||||||
| Assets |
— | — | — | — | — | — | ||||||||||||||||||
| Liabilities |
10 | — | — | — | — | — | ||||||||||||||||||
| Total non-qualifying hedge relationships |
$ | 13,194 | $ | (207 | ) | $ | (207 | ) | $ | 13,216 | $ | 740 | $ | 740 | ||||||||||
| Teachers Insurance And Annuity Association Of America ∎ Statement of Additional Information | B-115 |
Table of Contents
| Notes to statutory–basis financial statements |
Teachers Insurance and Annuity Association of America
December 31, 2025
| Summary of Derivative Positions | ||||||||||||||||||||||||
| (in millions) | ||||||||||||||||||||||||
| December 31, 2025 | December 31, 2024 | |||||||||||||||||||||||
| Derivatives used for other than hedging purposes | Notional | Carrying Value |
Estimated FV |
Notional | Carrying Value |
Estimated FV |
||||||||||||||||||
| Written credit default swaps |
||||||||||||||||||||||||
| Assets |
$ | 11,284 | $ | 940 | $ | 1,026 | $ | 8,912 | $ | 718 | $ | 876 | ||||||||||||
| Liabilities |
1,615 | (7 | ) | 31 | 3,565 | (37 | ) | 75 | ||||||||||||||||
| Asset swaps and total return swaps |
||||||||||||||||||||||||
| Assets |
684 | — | (8 | ) | 835 | — | (7 | ) | ||||||||||||||||
| Liabilities |
— | — | — | — | — | — | ||||||||||||||||||
| Bond Forwards |
||||||||||||||||||||||||
| Assets |
14,200 | — | (857 | ) | 9,175 | — | (879 | ) | ||||||||||||||||
| Liabilities |
— | — | — | — | — | — | ||||||||||||||||||
| Interest Rate Swaps |
||||||||||||||||||||||||
| Assets |
4,650 | — | (123 | ) | 50 | — | (9 | ) | ||||||||||||||||
| Liabilities |
— | — | — | — | — | — | ||||||||||||||||||
| Swaptions |
||||||||||||||||||||||||
| Assets |
$ | 3,000 | $ | 97 | $ | 64 | — | — | — | |||||||||||||||
| Liabilities |
$ | 3,000 | $ | (97 | ) | $ | (118 | ) | — | — | — | |||||||||||||
| Total derivatives used for other than hedging purposes |
$ | 38,433 | $ | 933 | $ | 15 | $ | 22,537 | $ | 681 | $ | 56 | ||||||||||||
| Total derivatives |
$ | 64,393 | $ | 617 | $ | (624 | ) | $ | 42,153 | $ | 1,831 | $ | 957 | |||||||||||
For the year ended December 31, 2025 and 2024, the average fair value of derivatives used for other than hedging purposes, was $119 million and $452 million.
Note 13—separate accounts
The TIAA Separate Account VA-1 (“VA-1”) is a segregated investment account established on February 16, 1994 under the insurance laws of the State of New York for the purpose of issuing and funding after-tax variable annuity contracts for employees of non-profit institutions organized in the United States, including governmental institutions. VA-1 is registered with the Securities and Exchange Commission, (the “Commission”) effective November 1, 1994 as an open-end, diversified management investment company under the Investment Company Act of 1940. VA-1 consists of a single investment portfolio, the Stock Index Account (“SIA”). The SIA was established on October 3, 1994 and invests in a diversified portfolio of equity securities selected to track the overall market for common stocks publicly traded in the United States.
The TIAA Real Estate Account (“REA” or “VA-2”) is a segregated investment account organized on February 22, 1995, under the insurance laws of the State of New York for the purpose of providing an investment option to TIAA’s pension customers to direct investments to an investment vehicle that invests primarily in real estate. VA-2 is registered with the Commission under the Securities Act of 1933 effective October 2, 1995. VA-2’s target is to invest between 75% and 85% of its assets directly in real estate or in real estate-related investments, with the remainder of its assets invested in publicly-traded securities and other instruments easily converted to cash to maintain adequate liquidity. During 2025, REA’s liquid assets have comprised less than 10% of its net assets, primarily due to continued elevated owner withdrawals driven by unfavorable market trends in the U.S. commercial real estate market, with elevated interest rates negatively impacting property values.
The TIAA Separate Account VA-3 (“VA-3”) is a segregated investment account organized on May 17, 2006 under the laws of the State of New York for the purposes of funding individual and group variable annuities for retirement plans of employees of colleges, universities, other educational and research organizations, and other governmental and non-profit institutions. VA-3 is registered with the Commission as an investment company under the Investment Company Act of 1940, effective September 29, 2006, and operates as a unit investment trust.
TIAA Separate Account VA-5, formerly known as TIAA-CREF Life Separate Account VA-1, was established on July 27, 1998 under New York Law to fund individual non-qualified variable annuities. VA-5 is registered with the Commission as a unit investment trust under the Investment Company Act of 1940. The assets of this account are carried at market value.
The TIAA Stable Value Separate Account (“TSV”) is an insulated, non-unitized separate account established on March 31, 2010 qualifying under New York Insurance Law 4240(a)(5)(ii). The separate account supports a flexible premium group deferred fixed annuity contract intended to be offered to employer sponsored retirement plans. The assets of this account are carried at book value.
| B-116 | Statement of Additional Information ∎ Teachers Insurance and Annuity Association of America |
Table of Contents
| continued |
TIAA Separate Account VLI-1, formerly known as TIAA-CREF Life Separate Account VLI-1, is a unit investment trust and was organized on May 23, 2001, and established under New York Law for the purpose of issuing and funding flexible premium variable universal life insurance policies and is registered with the SEC. The assets of this account are carried at market value.
TIAA Separate Account VLI-2, formerly known as TIAA-CREF Life Separate Account VLI-2, is a unit investment trust and was organized on February 15, 2012, and established under New York Law for the purpose of issuing and funding group and individual variable life insurance policies and is registered with the SEC. The assets of this account are carried at market value.
TIAA Separate Account MVA-1, formerly known as TIAA-CREF Life Separate Account MVA-1, was established on July 23, 2008 under New York Law as a non-unitized Separate Account that will support flexible premium deferred fixed annuity contracts subject to withdrawal charges and a market value adjustment feature. The assets of this account are carried at market value. The contract supported by this separate account, TIAA Investment Horizon Annuity, is registered with the SEC.
In accordance with the domiciliary state procedures for approving items within the separate accounts, the separate accounts classification of the following items are supported by a specific state statute:
| Product Identification | Product Classification | State Statute Reference | ||||
| TIAA Separate Account VA-1 |
Variable Annuity | Section 4240 of the New York Insurance Law | ||||
| TIAA Real Estate Account VA-2 |
Variable Annuity | Section 4240 of the New York Insurance Law | ||||
| TIAA Separate Account VA-3 |
Variable Annuity | Section 4240 of the New York Insurance Law | ||||
| TIAA Separate Account VA-5 |
Variable Annuity | Section 4240 of the New York Insurance Law | ||||
| TIAA Stable Value |
Group Deferred Fixed Annuity | Section 4240(a)(5)(ii) of the New York Insurance Law | ||||
| TIAA Separate Account VLI-1 |
Variable Life | Section 4240 of the New York Insurance Law | ||||
| TIAA Separate Account VLI-2 |
Variable Life | Section 4240 of the New York Insurance Law | ||||
| TIAA Separate Account MVA-1 |
Fixed Annuity | Section 4240 of the New York Insurance Law | ||||
In accordance with the provisions of the separate account products, some assets are considered legally insulated whereas others are not legally insulated from the general account. The legal insulation of the separate account assets prevents such assets from being generally available to satisfy claims resulting from the General Account.
The Company’s separate account statement includes legally and not legally insulated assets as of December 31 attributed to the following products (in millions):
| 2025 | 2024 | |||||||||||||||||||||||
| Separate Account Assets | Separate Account Assets | |||||||||||||||||||||||
| Product | Legally Insulated | Not Legally Insulated | Legally Insulated | Not Legally Insulated | ||||||||||||||||||||
| TIAA Real Estate Account VA-2 |
$ | 24,762 | $ | — | $ | 23,656 | $ | — | ||||||||||||||||
| TIAA Separate Account VA-3 |
23,266 | — | 20,447 | — | ||||||||||||||||||||
| TIAA Separate Account VA-1 |
1,376 | — | 1,316 | — | ||||||||||||||||||||
| TIAA Stable Value |
3,405 | — | 3,086 | — | ||||||||||||||||||||
| TIAA Separate Account VLI-1 |
629 | — | 546 | — | ||||||||||||||||||||
| TIAA Separate Account VLI-2 |
366 | — | 315 | — | ||||||||||||||||||||
| TIAA Separate Account VA-5 |
4,301 | — | 3,900 | — | ||||||||||||||||||||
| TIAA Separate Account MVA-1 |
— | 28 | — | 28 | ||||||||||||||||||||
| Total |
$ | 58,105 | $ | 28 | $ | 53,266 | $ | 28 | ||||||||||||||||
In accordance with the products recorded within the separate accounts, some separate account liabilities are guaranteed by the General Account. In accordance with the guarantees provided, if the investment proceeds are insufficient to cover the rate of return guaranteed for the product, the policyholder proceeds will be remitted by the General Account.
The General Account provides the REA with a liquidity guarantee to ensure it has funds available to meet participant transfer or cash withdrawal requests. When the REA cannot fund participant requests, the General Account will fund the requests by purchasing accumulation units (also referred to as “liquidity units”) in the REA. Under this agreement, the Company guarantees participants will be able to redeem their accumulation units at their accumulation unit value determined after the transfer or withdrawal request is received in good order. See Note 20 – Contingencies and Guarantees for additional disclosures on purchases of accumulation units in the REA.
| Teachers Insurance and Annuity Association of America ∎ Statement of Additional Information | B-117 |
Table of Contents
| Notes to statutory–basis financial statements |
Teachers Insurance and Annuity Association of America
December 31, 2025
Additional information regarding separate accounts of the Company is as follows for the years ended December 31, (in millions):
| 2025 | ||||||||||||||||||||
| Non-indexed Guarantee less than/equal to 4% |
Non- indexed Guarantee |
Non-guaranteed Separate Accounts |
Total | |||||||||||||||||
| Premiums, considerations or deposits |
$ | 798 | $ | — | $ | 4,938 | $ | 5,736 | ||||||||||||
| Reserves |
||||||||||||||||||||
| For accounts with assets at: |
||||||||||||||||||||
| Fair value |
$ | 9 | $ | 6 | $ | 51,815 | $ | 51,830 | ||||||||||||
| Amortized cost |
3,159 | — | — | 3,159 | ||||||||||||||||
| Total reserves |
$ | 3,168 | $ | 6 | $ | 51,815 | $ | 54,989 | ||||||||||||
| By withdrawal characteristics: |
||||||||||||||||||||
| Subject to discretionary withdrawal: |
||||||||||||||||||||
| With market value adjustment |
$ | 8 | $ | 6 | $ | — | $ | 14 | ||||||||||||
| At book value without market value adjustment and with current surrender charge of 5% or less* |
3,159 | — | — | 3,159 | ||||||||||||||||
| At fair value |
— | — | 51,815 | 51,815 | ||||||||||||||||
| Not subject to discretionary withdrawal |
1 | — | — | 1 | ||||||||||||||||
| Total reserves |
$ | 3,168 | $ | 6 | $ | 51,815 | $ | 54,989 | ||||||||||||
| * | Withdrawable at book value without adjustment or charge. |
| 2024 | ||||||||||||||||||||
| Non-indexed Guarantee less than/equal to 4% |
Non- indexed Guarantee |
Non-guaranteed Separate Accounts |
Total | |||||||||||||||||
| Premiums, considerations or deposits |
$ | 662 | $ | — | $ | 5,222 | $ | 5,884 | ||||||||||||
| Reserves |
||||||||||||||||||||
| For accounts with assets at: |
||||||||||||||||||||
| Fair value |
$ | 8 | $ | 5 | $ | 48,159 | $ | 48,172 | ||||||||||||
| Amortized cost |
2,895 | — | — | 2,895 | ||||||||||||||||
| Total reserves |
$ | 2,903 | $ | 5 | $ | 48,159 | $ | 51,067 | ||||||||||||
| By withdrawal characteristics: |
||||||||||||||||||||
| Subject to discretionary withdrawal: |
||||||||||||||||||||
| With market value adjustment |
$ | 8 | $ | 5 | $ | — | $ | 13 | ||||||||||||
| At book value without market value adjustment and with current surrender charge of 5% or less* |
2,895 | — | — | 2,895 | ||||||||||||||||
| At fair value |
— | — | 48,159 | 48,159 | ||||||||||||||||
| Not subject to discretionary withdrawal |
— | — | — | — | ||||||||||||||||
| Total reserves |
$ | 2,903 | $ | 5 | $ | 48,159 | $ | 51,067 | ||||||||||||
| * | Withdrawable at book value without adjustment or charge. |
| 2023 | ||||||||||||||||||||
| Non-indexed Guarantee less than/equal to 4% |
Non-indexed Guarantee more than 4% |
Non-guaranteed Separate Accounts |
Total | |||||||||||||||||
| Premiums, considerations or deposits |
$ | 548 | $ | — | $ | 3,871 | $ | 4,419 | ||||||||||||
| Reserves |
||||||||||||||||||||
| For accounts with assets at: |
||||||||||||||||||||
| Fair value |
$ | 13 | $ | 3 | $ | 46,830 | $ | 46,846 | ||||||||||||
| Amortized cost |
2,822 | — | — | 2,822 | ||||||||||||||||
| Total reserves |
$ | 2,835 | $ | 3 | $ | 46,830 | $ | 49,668 | ||||||||||||
| B-118 | Statement of Additional Information ∎ Teachers Insurance and Annuity Association of America |
Table of Contents
| continued |
| 2023 | ||||||||||||||||||||
| Non-indexed Guarantee less than/equal to 4% |
Non-indexed Guarantee more than 4% |
Non-guaranteed Separate Accounts |
Total | |||||||||||||||||
| By withdrawal characteristics: |
||||||||||||||||||||
| Subject to discretionary withdrawal: |
||||||||||||||||||||
| With market value adjustment |
$ | 12 | $ | 3 | $ | — | $ | 15 | ||||||||||||
| At book value without market value adjustment and with current surrender charge of 5% or less* |
2,822 | — | — | 2,822 | ||||||||||||||||
| At fair value |
— | . 46,830 | 46,830 | |||||||||||||||||
| Not subject to discretionary withdrawal |
1 | — | — | 1 | ||||||||||||||||
| Total reserves |
$ | 2,835 | $ | 3 | $ | 46,830 | $ | 49,668 | ||||||||||||
| * | Withdrawable at book value without adjustment or charge. |
The following is a reconciliation of transfers to (from) the Company to the separate accounts for the years ended December 31, (in millions):
| 2025 | 2024 | 2023 | ||||||||||
| Transfers reported in the Summary of Operations of the separate accounts statement: |
||||||||||||
| Transfers to separate accounts |
$ | 6,073 | $ | 6,247 | $ | 4,713 | ||||||
| Transfers from separate accounts |
(7,367 | ) | (7,153 | ) | (7,795 | ) | ||||||
| Reconciling adjustments: |
||||||||||||
| Fund transfer exchange gain (loss) |
— | — | — | |||||||||
| Transfers reported in the Summary of Operations of the Life, Accident & Health Annual Statement |
$ | (1,294 | ) | $ | (906 | ) | $ | (3,082 | ) | |||
Note 14—policy and contract reserves
Policy and contract reserves are determined in accordance with standard valuation methods approved by NYDFS and are computed in accordance with standard actuarial methodology. The reserves are based on assumptions for interest, mortality and other risks insured.
For annuities and supplementary contracts, policy and contract reserves are calculated using Commissioner’s Annuity Reserve Valuation Method (“CARVM”) in accordance with New York State Regulation 151, New York State Regulation 213, and VM-21 and VM-22 as applicable.
Reserves for all life insurance policies are calculated in accordance with New York State Regulation 147.
The Company has established policy reserves on deferred and payout annuity contracts issued January 1, 2001 and later that exceed the minimum amounts determined under Appendix A-820, “Minimum Life and Annuity Reserve Standards” of NAIC SAP. The excess above the minimum is as follows (in millions):
| December 31, 2025 | December 31, 2024 | |||||||
| Deferred and payout annuity contracts issued after 2000 |
$ | 4,469 | $ | 4,309 | ||||
The Company performed asset adequacy analysis in order to test the adequacy of its reserves in light of the assets supporting such reserves. This analysis reflected the requirements of the NYDFS and the NYDFS Special Considerations Letter, which specifies certain requirements related to reserves and asset adequacy analysis. The Company determined that its reserves are sufficient to meet its obligations for the years ending December 31, 2025 and 2024.
The Tabular Interest, Tabular Less Actual Reserve Released and Tabular Cost are determined by formulae as prescribed by the NAIC except for deferred annuities, for which tabular interest is determined from the basic data.
| Teachers Insurance and Annuity Association of America ∎ Statement of Additional Information | B-119 |
Table of Contents
| Notes to statutory–basis financial statements |
Teachers Insurance and Annuity Association of America
December 31, 2025
Withdrawal characteristics of individual annuity reserves, group annuity reserves, and deposit-type contract funds for the years ended December 31, are as follows (in millions):
| 2025 | ||||||||||||||||||||||||
| General Account |
Separate Account with Guarantees |
Separate Account Nonguaranteed |
Total | % of Total | ||||||||||||||||||||
| INDIVIDUAL ANNUITIES: |
||||||||||||||||||||||||
| Subject to Discretionary Withdrawal: |
||||||||||||||||||||||||
| With market value adjustment |
$ | — | $ | 14 | $ | — | $ | 14 | — | % | ||||||||||||||
| At fair value |
— | — | 27,271 | 27,271 | 14.3 | % | ||||||||||||||||||
| Total with market value adjustment or at fair value |
— | 14 | 27,271 | 27,285 | 14.3 | % | ||||||||||||||||||
| At book value without adjustment (minimal or no charge or adjustment) |
30,329 | — | — | 30,329 | 15.9 | % | ||||||||||||||||||
| Not subject to discretionary withdrawal |
133,228 | — | — | 133,228 | 69.8 | % | ||||||||||||||||||
| Total (direct + assumed) |
$ | 163,557 | $ | 14 | $ | 27,271 | $ | 190,842 | 100.0 | % | ||||||||||||||
| Reinsurance ceded |
— | — | — | — | ||||||||||||||||||||
| Total (net) |
$ | 163,557 | $ | 14 | $ | 27,271 | $ | 190,842 | ||||||||||||||||
| 2024 | ||||||||||||||||||||||||
| General Account |
Separate Account with Guarantees |
Separate Account Nonguaranteed |
Total | % of Total | ||||||||||||||||||||
| INDIVIDUAL ANNUITIES: |
||||||||||||||||||||||||
| Subject to Discretionary Withdrawal: |
||||||||||||||||||||||||
| With market value adjustment |
$ | — | $ | 14 | $ | — | $ | 14 | — | % | ||||||||||||||
| At fair value |
— | — | 25,795 | 25,795 | 13.6 | % | ||||||||||||||||||
| Total with market value adjustment or at fair value |
— | 14 | 25,795 | 25,809 | 13.6 | % | ||||||||||||||||||
| At book value without adjustment (minimal or no charge or adjustment) |
30,125 | — | — | 30,125 | 15.9 | % | ||||||||||||||||||
| Not subject to discretionary withdrawal |
133,856 | — | — | 133,856 | 70.5 | % | ||||||||||||||||||
| Total (direct + assumed) |
$ | 163,981 | $ | 14 | $ | 25,795 | $ | 189,790 | 100.0 | % | ||||||||||||||
| Reinsurance ceded |
— | — | — | — | ||||||||||||||||||||
| Total (net) |
$ | 163,981 | $ | 14 | $ | 25,795 | $ | 189,790 | ||||||||||||||||
| 2025 | ||||||||||||||||||||||||
| General Account |
Separate Account with Guarantees |
Separate Account Nonguaranteed |
Total | % of Total | ||||||||||||||||||||
| GROUP ANNUITIES: |
||||||||||||||||||||||||
| Subject to Discretionary Withdrawal: |
||||||||||||||||||||||||
| With market value adjustment |
$ | — | $ | — | $ | — | $ | — | — | % | ||||||||||||||
| At fair value |
— | — | 23,462 | 23,462 | 22.8 | % | ||||||||||||||||||
| Total with market value adjustment or at fair value |
— | — | 23,462 | 23,462 | 22.8 | % | ||||||||||||||||||
| At book value without adjustment (minimal or no charge or adjustment) |
45,067 | 3,151 | — | 48,218 | 46.9 | % | ||||||||||||||||||
| Not subject to discretionary withdrawal |
31,178 | — | — | 31,178 | 30.3 | % | ||||||||||||||||||
| Total (direct + assumed) |
$ | 76,245 | $ | 3,151 | $ | 23,462 | $ | 102,858 | 100.0 | % | ||||||||||||||
| Reinsurance ceded |
— | — | — | — | ||||||||||||||||||||
| Total (net) |
$ | 76,245 | $ | 3,151 | $ | 23,462 | $ | 102,858 | ||||||||||||||||
| 2024 | ||||||||||||||||||||||||
| General Account |
Separate Account with Guarantees |
Separate Account Nonguaranteed |
Total | % of Total | ||||||||||||||||||||
| GROUP ANNUITIES: |
||||||||||||||||||||||||
| Subject to Discretionary Withdrawal: |
||||||||||||||||||||||||
| With market value adjustment |
$ | — | $ | — | $ | — | $ | — | — | % | ||||||||||||||
| At fair value |
— | — | 21,425 | 21,425 | 22.6 | % | ||||||||||||||||||
| Total with market value adjustment or at fair value |
— | — | 21,425 | 21,425 | 22.6 | % | ||||||||||||||||||
| B-120 | Statement of Additional Information ∎ Teachers Insurance and Annuity Association of America |
Table of Contents
| continued |
| 2024 | ||||||||||||||||||||||||
| General Account |
Separate Account with Guarantees |
Separate Account Nonguaranteed |
Total | % of Total | ||||||||||||||||||||
| At book value without adjustment (minimal or no charge or adjustment) |
41,356 | 2,888 | — | 44,244 | 46.6 | % | ||||||||||||||||||
| Not subject to discretionary withdrawal |
29,255 | — | — | 29,255 | 30.8 | % | ||||||||||||||||||
| Total (direct + assumed) |
$ | 70,611 | $ | 2,888 | $ | 21,425 | $ | 94,924 | 100.0 | % | ||||||||||||||
| Reinsurance ceded |
— | — | — | — | ||||||||||||||||||||
| Total (net) |
$ | 70,611 | $ | 2,888 | $ | 21,425 | $ | 94,924 | ||||||||||||||||
| 2025 |
|
|||||||||||||||||||||||
| General Account |
Separate Account with Guarantees |
Separate Account Nonguaranteed |
Total | % of Total | ||||||||||||||||||||
| DEPOSIT-TYPE CONTRACTS: |
||||||||||||||||||||||||
| Subject to Discretionary Withdrawal: |
||||||||||||||||||||||||
| With market value adjustment |
$ | — | $ | — | $ | — | $ | — | — | % | ||||||||||||||
| At fair value |
— | — | 88 | 88 | 0.5 | % | ||||||||||||||||||
| Total with market value adjustment or at fair value |
— | — | 88 | 88 | 0.5 | % | ||||||||||||||||||
| At book value without adjustment (minimal or no charge or adjustment) |
11,337 | 7 | — | 11,344 | 59.3 | % | ||||||||||||||||||
| Not subject to discretionary withdrawal |
7,687 | — | — | 7,687 | 40.2 | % | ||||||||||||||||||
| Total (direct + assumed) |
$ | 19,024 | $ | 7 | $ | 88 | $ | 19,119 | 100.0 | % | ||||||||||||||
| Reinsurance ceded |
— | — | — | — | ||||||||||||||||||||
| Total (net) |
$ | 19,024 | $ | 7 | $ | 88 | $ | 19,119 | ||||||||||||||||
| 2024 |
|
|||||||||||||||||||||||
| General Account |
Separate Account with Guarantees |
Separate Account Nonguaranteed |
Total | % of Total | ||||||||||||||||||||
| DEPOSIT-TYPE CONTRACTS: |
||||||||||||||||||||||||
| Subject to Discretionary Withdrawal: |
||||||||||||||||||||||||
| With market value adjustment |
$ | — | $ | — | $ | — | $ | — | — | % | ||||||||||||||
| At fair value |
— | — | 79 | 79 | 0.4 | % | ||||||||||||||||||
| Total with market value adjustment or at fair value |
— | — | 79 | 79 | 0.4 | % | ||||||||||||||||||
| At book value without adjustment (minimal or no charge or adjustment) |
10,682 | 7 | — | 10,689 | 58.2 | % | ||||||||||||||||||
| Not subject to discretionary withdrawal |
7,605 | — | — | 7,605 | 41.4 | % | ||||||||||||||||||
| Total (direct + assumed) |
$ | 18,287 | $ | 7 | $ | 79 | $ | 18,373 | 100.0 | % | ||||||||||||||
| Reinsurance ceded |
— | — | — | — | ||||||||||||||||||||
| Total (net) |
$ | 18,287 | $ | 7 | $ | 79 | $ | 18,373 | ||||||||||||||||
The following tables provide the life actuarial reserves by withdrawal characteristics for the years ended December 31, (in millions):
|
|
2024 |
|
||||||||||||||
| General Account | ||||||||||||||||
| Account Value |
Cash Value | Reserve | ||||||||||||||
| Subject to discretionary withdrawal, surrender values, or policy loans: |
||||||||||||||||
| Universal Life |
$ | 2,025 | $ | 2,025 | $ | 2,065 | ||||||||||
| Other Permanent Cash Value Life Insurance |
315 | 315 | 367 | |||||||||||||
| Variable Universal Life |
363 | 363 | 375 | |||||||||||||
| Not subject to discretionary withdrawal or no cash values: |
||||||||||||||||
| Term Policies with Cash Value |
— | — | 583 | |||||||||||||
| Disability—Active Lives |
— | — | 13 | |||||||||||||
| Disability—Disabled Lives |
— | — | 70 | |||||||||||||
| Miscellaneous Reserves |
— | — | 35 | |||||||||||||
| Total (direct + assumed) |
$ | 2,703 | $ | 2,703 | $ | 3,508 | ||||||||||
| Teachers Insurance and Annuity Association of America ∎ Statement of Additional Information | B-121 |
Table of Contents
| Notes to statutory–basis financial statements |
Teachers Insurance and Annuity Association of America
December 31, 2025
|
|
2024 |
|
||||||||||||||
| General Account | ||||||||||||||||
| Account Value |
Cash Value | Reserve | ||||||||||||||
| Reinsurance Ceded |
— | — | 406 | |||||||||||||
| Total (net) |
$ | 2,703 | $ | 2,703 | $ | 3,102 | ||||||||||
| Subject to discretionary withdrawal, surrender values, or policy loans: |
||||||||||||||||
| Universal Life |
$ | 2,008 | $ | 2,008 | $ | 2,043 | ||||||||||
| Other Permanent Cash Value Life Insurance |
315 | 315 | 370 | |||||||||||||
| Variable Universal Life |
364 | 363 | 375 | |||||||||||||
| Not subject to discretionary withdrawal or no cash values: |
||||||||||||||||
| Term Policies with Cash Value |
— | — | 604 | |||||||||||||
| Disability–Active Lives |
— | — | 14 | |||||||||||||
| Disability–Disabled Lives |
— | — | 73 | |||||||||||||
| Miscellaneous Reserves |
— | — | 38 | |||||||||||||
| Total (direct + assumed) |
$ | 2,687 | $ | 2,686 | $ | 3,517 | ||||||||||
| Reinsurance Ceded |
— | — | 418 | |||||||||||||
| Total (net) |
$ | 2,687 | $ | 2,686 | $ | 3,099 | ||||||||||
Note 15—management agreements
Under Cash Disbursement and Reimbursement Agreements, the Company serves as the common pay-agent for certain subsidiaries and affiliates. Under a management agreement, the Company provides administrative services to VA-1. The Company provided administrative services to TIAA, FSB (“the Bank”), a subsidiary of FSB, through July 30, 2023. Additionally, under a General Service and Facilities Agreement with Nuveen, LLC, the Company provides and receives general services at cost inclusive of charges for overhead.
As the common pay-agent, the Company allocated expenses of $2,765 million, $2,693 million and $2,522 million to its various subsidiaries and affiliates for the years ended December 31, 2025, 2024 and 2023, respectively. The expense allocation process determines the portion of the operating expenses attributable to each legal entity based on defined allocation methodologies. These methodologies represent either shared or direct costs depending on the nature of the service provided. At the completion of the allocation process all expenses are assigned to a legal entity.
Activities necessary for the operation of the College Retirement Equities Fund (“CREF”), a companion organization of TIAA, are provided at-cost by the Company and two of its subsidiaries, TIAA-CREF Investment Management, LLC (“TCIM”) and TIAA-CREF Individual and Institutional Services, LLC (“TC Services”). Such services are provided in accordance with an Administrative Service Agreement between CREF and the Company, an Investment Management Agreement between CREF and TCIM, and a Principal Underwriting and Distribution Services Agreement between CREF and TC Services (collectively the “CREF Agreements”). The Company is the common pay-agent for CREF and TC Services. The Company collects the distribution expense reimbursements from CREF and then remits those payments to TC Services. The administration and investment expenses incurred by the Company are included in operating expenses and offset against the related expense reimbursements received from CREF and Nuveen Services, respectively. The expense reimbursements under the CREF Agreements and the equivalent expenses, amounted to approximately $488 million, $578 million, and $577 million for the years ended December 31, 2025, 2024 and 2023, respectively.
TC Services maintains a Distribution Agreement with the Company under which TC Services is the principal underwriter and distributor for variable annuity contracts issued by the Company. Such activities performed by TC Services are reimbursed at cost. The Company paid $14 million, $13 million, and $10 million for the years ended December 31, 2025, 2024, and 2023, respectively for these services. TC Services also maintains a Distribution Agreement with the Company under which TC Services is the distributor for proprietary and non-proprietary mutual funds, whereby the Company does not provide cost reimbursements to TC Services.
The Company had a General Service Agreement through July 30, 2023, whereby the Company provided general administrative services such as technology, marketing, finance, corporate overhead and individual advisory services to the Bank. Expense allocations to the Bank were $44 million for the year ended December 31, 2023.
Teachers Advisors, LLC (“Advisors”) provides investment advisory services for VA-1, certain proprietary funds and other separately managed portfolios in accordance with investment management agreements. Nuveen Securities, LLC (“Securities”), an indirect subsidiary of Nuveen, LLC, distributes registered securities for certain proprietary funds and non-proprietary mutual funds.
| B-122 | Statement of Additional Information ∎ Teachers Insurance and Annuity Association of America |
Table of Contents
| continued |
The Company has Investment Management Agreements with Advisors and Nuveen Alternatives Advisors, LLC, wholly owned subsidiaries of Nuveen, LLC, and Churchill Asset Management, a majority owned subsidiary of Nuveen, LLC, to manage, at a negotiated fee, investments held within the Company’s General Account including investments owned by investment subsidiaries of the Company. As of June 30, 2023, a portion of the Investment Management Agreement between the Company and Nuveen Alternative Advisors, LLC was permanently assigned to Churchill Asset Management. The Company paid $151 million, $153 million, and $155 million to Advisors, and $277 million, $289 million, and $316 million to Nuveen Alternatives Advisors, LLC, for the years ended December 31, 2025, 2024, and 2023, respectively. The Company paid $115 million, $126 million and $46 million to Churchill Asset Management for the years ended December 31, 2025, 2024 and 2023 respectively.
The Company has an Omnibus Service Agreement with Nuveen, LLC, pursuant to which Nuveen, LLC directly or through its subsidiaries agreed to provide services complementary to investment management to the Company at cost, inclusive of charges for overhead. The Company paid $7 million to Nuveen, LLC for the years ended December 31, 2025, 2024 and 2023 respectively.
The Company has a sublease agreement for certain leases and leasehold improvements with Nuveen Services, LLC. The Company makes the applicable lease payments on behalf of Nuveen Services, LLC and then allocates those costs. Under the sublease agreement, the Company allocated $12 million, $14 million and $15 million to Nuveen Services, LLC for the years ended December 31, 2025, 2024, and 2023, respectively.
All services necessary for the operation of the REA are provided at-cost by the Company and TC Services. The Company provides investment management and administrative services for the REA in accordance with an Investment Management and Administrative Agreement. Distribution services for the REA are provided in accordance with a Distribution Agreement among TC Services, the Company and the REA (collectively the “Agreements”). The Company and TC Services receive payments from the REA on a daily basis according to formulae established annually and adjusted periodically for performance of these Agreements. The daily fee is based on an estimate of the at-cost expenses necessary to operate the REA and is based on projected REA expense and asset levels, with the objective of keeping the fees as close as possible to actual expenses attributable to operating the REA. At the end of each quarter, any differences between the daily fees paid and actual expenses for the quarter are added to or deducted from REA’s fee in equal daily installments over the remaining days in the immediately following quarter. Reimbursements collected under the Agreements amounted to approximately $135 million, $161 million, and $170 million for the periods ended December 31, 2025, 2024 and 2023, respectively.
The Company provides certain separate account guarantees, including a liquidity guarantee to REA, and is compensated for these guarantees. See Note 20 Contingencies and Guarantees for additional information on separate account guarantees.
The Company had a Service Agreement with the Bank through July 30, 2023, whereby the Bank provided general services in support of the Company’s and its subsidiaries’ activities at cost inclusive of charges for overhead. The Company paid $1 million to the Bank for the year ended December 31, 2023.
The Company has a Cash Disbursement and Reimbursement Agreement with Nuveen Investments, an indirect subsidiary of Nuveen, LLC, whereby the Company provides cash disbursements and related services at cost. The Company allocated $138 million, $101 million, and $105 million to Nuveen Investments for the years ended December 31, 2025, 2024, and 2023, respectively.
The Company has a Cash Disbursement and Reimbursement Agreement with TIAA Kaspick, LLC (“Kaspick”), an indirect subsidiary of TIAA, whereby the Company provides cash disbursements and related services at cost. The Company allocated $39 million, $42 million, and $40 million to Kaspick for the years ended December 31, 2025, 2024, and 2023, respectively.
The Company has a Cash Disbursement and Reimbursement Agreement with TIAA-CREF Tuition Financing, Inc. (“TFI”), a subsidiary of the Company, whereby the Company provides cash disbursements and related services at cost. The Company allocated $108 million, $100 million, and $87 million to TFI for the years ended December 31, 2025, 2024, and 2023, respectively.
Services for certain funding agreements for qualified state tuition programs for which TFI is the program manager, are provided to the Company by TFI pursuant to a service agreement between the Company and TFI. The Company paid $29 million, $27 million, and $33 million for the years ended December 31, 2025, 2024, and 2023, respectively for these services.
The Company has a Service Agreement with TIAA Global Business Services (India) Private Limited (“TIAA India”), an indirect wholly-owned subsidiary of the Company, whereby TIAA India provides information technology and non-technology services for the Company and its affiliates. The Company paid $150 million, $170 million, and $143 million to TIAA India for the years ended December 31, 2025, 2024, and 2023, respectively.
The Company has a Technology Support and Services Agreement with MyVest Corporation (“MyVest”), a wholly-owned subsidiary of the Company, whereby MyVest provides certain wealth management software and services solutions to the Company. The
| Teachers Insurance and Annuity Association of America ∎ Statement of Additional Information | B-123 |
Table of Contents
| Notes to statutory–basis financial statements |
Teachers Insurance and Annuity Association of America
December 31, 2025
Company paid $31 million and $37 million to MyVest for the years ended December 31, 2024 and 2023, respectively. The Company agrees to provide MyVest administrative services for use in its day to day operations. The Company allocated administrative service expenses of $7 million, $2 million, and $3 million for each of the years ended December 31, 2025, 2024, and 2023, respectively. Effective April 30, 2025, MyVest entered into a Transition Services Agreement assigning all MyVest contracts, including the Technology Support and Services Agreement, to a third party. In pursuant to the agreement, the third party is entitled to all wealth management platform services revenue, excluding platform development, for the year ended December 31, 2025. For the period from January 1, 2025, through April 30, 2025, the Company paid MyVest $10 million which was subsequently paid to the third party. For the period from May 1, 2025 through December 31, 2025, the Company made payments directly to the third party. For the year ended December 31, 2025, the Company paid $5 million to MyVest related to platform development.
The Bank provided custody and trustee services to the Company through July 30, 2023. The Company paid $4 million to the Bank for the year ended December 31, 2023, for these services. As of July 31, 2023, these services are provided by the Trust pursuant to a general services agreement. The Company paid $7 million, $7 million and $2 million to the Trust during the years ended December 31, 2025, 2024 and 2023, respectively.
The Company has a service and subcontracting agreement with TIAA Shared Services, LLC (“TSS”), a wholly-owned subsidiary of the Company. Under the agreement, TSS serves as an internal administrative service provider for the Company as well as for CREF and the Company’s affiliates with existing administrative services agreements with the Company. The Company pays TSS compensation it receives (and TSS reimburses the Company for disbursements it makes) relating to the provision of administrative services for the Company. The Company also reimburses TSS at cost for administrative services provided in support of the Company’s insurance business and the fulfillment of its contractual obligation to provide such services to CREF and the Company’s affiliates. The Company also provides to TSS any services necessary to conduct its operations, and TSS reimburses the Company at cost for these services. TSS reimbursed the Company $707 million, $666 million, and $612 million for the years ended December 31, 2025, 2024, and 2023, respectively.
Note 16—federal income taxes
By charter, the Company is a stock life insurance company operating on a non-profit basis. However, the Company has been fully subject to federal income taxation as a stock life insurance company since January 1, 1998.
The application of SSAP No. 101 Income Taxes requires a company to evaluate the recoverability of DTAs and to establish a valuation allowance if necessary to reduce the DTA to an amount which is more likely than not to be realized. Based on the weight of all available evidence, the Company has not recorded a valuation allowance on DTAs at December 31, 2025 or December 31, 2024.
Components of the net deferred tax asset/(liability) are as follows (in millions):
| 12/31/2025 | 12/31/2024 | Change | ||||||||||||||||||||||||||||||||||||||
| (1) Ordinary |
(2) Capital |
(3) (Col 1+2) Total |
(4) Ordinary |
(5) Capital |
(6) (Col 4+5) Total |
(7) (Col 1–4) Ordinary |
(8) (Col 2–5) Capital |
(9) (Col 7+8) Total |
||||||||||||||||||||||||||||||||
| a) Gross Deferred Tax Assets |
$ | 5,798 | $ | 3,421 | $ | 9,219 | $ | 5,572 | $ | 2,995 | $ | 8,567 | $ | 226 | $ | 426 | $ | 652 | ||||||||||||||||||||||
| b) Statutory Valuation Allowance Adjustments |
— | — | — | — | — | — | — | — | — | |||||||||||||||||||||||||||||||
| c) Adjusted Gross Deferred Tax Assets (a–b) |
5,798 | 3,421 | 9,219 | 5,572 | 2,995 | 8,567 | 226 | 426 | 652 | |||||||||||||||||||||||||||||||
| d) Deferred Tax Assets Non-admitted |
1,053 | 2,240 | 3,293 | 1,196 | 2,054 | 3,250 | (143 | ) | 186 | 43 | ||||||||||||||||||||||||||||||
| e) Subtotal Net Admitted Deferred Tax Asset (c-d) |
4,745 | 1,181 | 5,926 | 4,376 | 941 | 5,317 | 369 | 240 | 609 | |||||||||||||||||||||||||||||||
| f) Deferred Tax Liabilities |
3,062 | 1,081 | 4,143 | 2,621 | 897 | 3,518 | 441 | 184 | 625 | |||||||||||||||||||||||||||||||
| g) Net Admitted Deferred Tax Assets/(Net Deferred Tax Liability) (e–f) |
$ | 1,683 | $ | 100 | $ | 1,783 | $ | 1,755 | $ | 44 | $ | 1,799 | $ | (72 | ) | $ | 56 | $ | (16 | ) | ||||||||||||||||||||
| B-124 | Statement of Additional Information ∎ Teachers Insurance and Annuity Association of America |
Table of Contents
| continued |
| 12/31/2025 | 12/31/2024 | Change | ||||||||||||||||||||||||||||||||||||||
| (1) Ordinary |
(2) Capital |
(3) (Col 1+2) Total |
(4) Ordinary |
(5) Capital |
(6) (Col 4+5) Total |
(7) (Col 1–4) Ordinary |
(8) (Col 2–5) Capital |
(9) (Col 7+8) Total |
||||||||||||||||||||||||||||||||
| Admission Calculation Components SSAP No. 101 |
||||||||||||||||||||||||||||||||||||||||
| a) Federal Income Taxes Paid In Prior Years Recoverable Through Loss Carrybacks |
$ | — | $ | — | $ | — | $ | — | $ | — | $ | — | $ | — | $ | — | $ | — | ||||||||||||||||||||||
| b) Adjusted Gross DTA Expected To Be Realized (Excluding The Amount of DTA From (a) above After Application of the Threshold Limitation.(The Lesser of (b)1 and (b)2 Below) |
1,683 | 100 | 1,783 | 1,755 | 44 | 1,799 | (72 | ) | 56 | (16 | ) | |||||||||||||||||||||||||||||
| 1. Adjusted Gross DTA Expected to be Realized Following the Balance Sheet Date |
1,683 | 100 | 1,783 | 1,755 | 44 | 1,799 | (72 | ) | 56 | (16 | ) | |||||||||||||||||||||||||||||
| 2. Adjusted Gross DTA Allowed per Limitation Threshold |
XXX | XXX | 5,979 | XXX | XXX | 6,006 | XXX | XXX | (27 | ) | ||||||||||||||||||||||||||||||
| c) Adjusted Gross DTA (Excluding The Amount Of DTA From (a) and (b) above) Offset by Gross DTL |
3,062 | 1,081 | 4,143 | 2,621 | 897 | 3,518 | 441 | 184 | 625 | |||||||||||||||||||||||||||||||
| d) DTA Admitted as the result of application of SSAP No. 101. Total ((a)+(b)+(c)) |
$ | 4,745 | $ | 1,181 | $ | 5,926 | $ | 4,376 | $ | 941 | $ | 5,317 | $ | 369 | $ | 240 | $ | 609 | ||||||||||||||||||||||
| 2025 | 2024 | |||||||||||
| Ratio percentage used to determine recovery |
964 | % | 935 | % | ||||||||
| Amount of adjusted capital and surplus used to determine the threshold limitation in (b)2 above (in millions) |
$ | 39,861 | $ | 40,043 | ||||||||
| 12/31/2025 | 12/31/2024 | Change | ||||||||||||||||||||||
| (1) Ordinary |
(2) Capital |
(3) Ordinary |
(4) Capital |
(5) (Col 1–3) |
(6) (Col 2–4) Capital |
|||||||||||||||||||
| Impact of Tax Planning Strategies: (in millions) |
||||||||||||||||||||||||
| Determination of adjusted gross DTAs and net admitted DTAs, by tax character as a percentage |
||||||||||||||||||||||||
| Adjusted Gross DTAs Amount From Above |
$ | 5,798 | $ | 3,421 | $ | 5,572 | $ | 2,995 | $ | 226 | $ | 426 | ||||||||||||
| Percentage Of Adjusted Gross DTAs By Tax Character Attributable To The Impact Of Tax Planning Strategies |
— | % | — | % | — | % | — | % | — | % | — | % | ||||||||||||
| Net Admitted Adjusted Gross DTAs Amount From Above |
$ | 4,745 | $ | 1,181 | $ | 4,376 | $ | 941 | $ | 369 | $ | 240 | ||||||||||||
| Percentage Of Net Admitted Adjusted Gross DTAs By Tax Character Admitted Because Of The Impact Of Tax Planning Strategies |
7.73 | % | — | % | 12.48 | % | — | % | (4.75 | )% | — | % | ||||||||||||
The Company supports the admittance of $367 million of DTA with $1,594 million of tax planning strategies. The Company does not have tax planning strategies that include the use of reinsurance.
The Company has no temporary differences for which DTLs are not recognized.
Income taxes incurred consist of the following major components as of December 31, (in millions):
| 2025 | 2024 | 2023 | ||||||||||
| Current Income Tax: |
||||||||||||
| Federal income tax expense (benefit) |
$ | (304 | ) | $ | (535 | ) | $ | (569 | ) | |||
| Foreign taxes |
— | 1 | — | |||||||||
| Subtotal |
$ | (304 | ) | $ | (534 | ) | $ | (569 | ) | |||
| Federal income taxes expense on net capital gains |
176 | 135 | (56 | ) | ||||||||
| Generation/(utilization) of loss carry-forwards |
128 | 413 | 630 | |||||||||
| Intercompany tax sharing expense/(benefit) |
3 | (126 | ) | (6 | ) | |||||||
| Other |
— | — | — | |||||||||
|
|
|
|||||||||||
| Federal and foreign income tax expense / (benefit) |
$ | 3 | $ | (112 | ) | $ | (1 | ) | ||||
|
|
|
|||||||||||
| Teachers Insurance and Annuity Association of America ∎ Statement of Additional Information | B-125 |
Table of Contents
| Notes to statutory–basis financial statements |
Teachers Insurance and Annuity Association of America
December 31, 2025
| 2025 | 2024 | 2023 | ||||||||||
| 12/31/2025 | 12/31/2024 | Change | ||||||||||
| Deferred Tax Assets: |
||||||||||||
| Ordinary: |
||||||||||||
| Policyholder reserves |
$ | 23 | $ | 23 | $ | — | ||||||
| Investments |
417 | 387 | 30 | |||||||||
| Policyholder dividends accrual |
486 | 485 | 1 | |||||||||
| Fixed assets |
258 | 248 | 10 | |||||||||
| Compensation and benefits accrual |
514 | 482 | 32 | |||||||||
| Net operating loss carry-forward |
1,443 | 1,264 | 179 | |||||||||
| Other (including items < 5% of total ordinary tax assets) |
855 | 733 | 122 | |||||||||
| Intangible assets – business in force and software |
1,802 | 1,950 | (148 | ) | ||||||||
| Subtotal |
$ | 5,798 | $ | 5,572 | $ | 226 | ||||||
| Statutory valuation allowance adjustment |
$ — | $ | — | $ | — | |||||||
| Non-admitted |
1,053 | 1,196 | (143 | ) | ||||||||
| Admitted ordinary deferred tax assets |
$ | 4,745 | $ | 4,376 | $ | 369 | ||||||
| Capital: |
||||||||||||
| Investments |
$ | 3,412 | $ | 2,971 | $ | 441 | ||||||
| Real estate |
9 | 24 | (15 | ) | ||||||||
| Subtotal |
$ | 3,421 | $ | 2,995 | $ | 426 | ||||||
| Statutory valuation allowance adjustment |
$ | — | $ | — | $ | — | ||||||
| Non-admitted |
2,240 | 2,054 | 186 | |||||||||
| Admitted capital deferred tax assets |
1,181 | 941 | 240 | |||||||||
| Admitted deferred tax assets |
$ | 5,926 | $ | 5,317 | $ | 609 | ||||||
| 12/31/2025 | 12/31/2024 | Change | ||||||||||
| Deferred Tax Liabilities: |
||||||||||||
| Ordinary: |
||||||||||||
| Investments |
$ | 3,055 | $ | 2,563 | $ | 492 | ||||||
| Reserves transition adjustment |
1 | 53 | (52 | ) | ||||||||
| Other (including items < 5% of total ordinary tax liabilities) |
6 | 5 | 1 | |||||||||
| Subtotal |
$ | 3,062 | $ | 2,621 | $ | 441 | ||||||
| Capital: |
||||||||||||
| Investments |
$ | 1,081 | $ | 897 | $ | 184 | ||||||
| Subtotal |
$ | 1,081 | $ | 897 | $ | 184 | ||||||
| Deferred tax liabilities |
$ | 4,143 | $ | 3,518 | $ | 625 | ||||||
| Net Deferred Tax: |
||||||||||||
| Assets/Liabilities |
$ | 1,783 | $ | 1,799 | $ | (16 | ) | |||||
The provision for federal and foreign income taxes incurred differs from the amount obtained by applying the statutory federal income tax rate to income before income taxes. The significant items causing this difference at December 31, 2025 are as follows (in millions):
| Description | Tax Effect | Effective Tax Rate |
||||||
| Provision computed at statutory rate |
$ | (74 | ) | 21.00 | % | |||
| Dividends received deduction |
(115 | ) | 32.49 | |||||
| Transfer pricing adjustment |
22 | (6.30 | ) | |||||
| Amortization of interest maintenance reserve |
(32 | ) | 9.01 | |||||
| Statutory impairment of affiliated common stock |
22 | (6.19 | ) | |||||
| Other permanent differences |
2 | (0.51 | ) | |||||
| Prior year true-ups (TIAA & Subs) |
(80 | ) | 22.60 | |||||
| Prior year true-ups (TIAA & Subs)—tax credits |
(1 | ) | 0.32 | |||||
| Current year tax credit activity |
47 | (13.21 | ) | |||||
| B-126 | Statement of Additional Information ∎ Teachers Insurance and Annuity Association of America |
Table of Contents
| continued |
| Description | Tax Effect | Effective Tax Rate |
||||||
| Current year non-admitted assets |
(20 | ) | 5.61 | |||||
| Other |
(5 | ) | 1.38 | |||||
| Total statutory income taxes |
$ | (234 | ) | 66.20 | % | |||
| Federal and foreign income tax expense (benefit)—Ordinary |
3 | (0.86 | ) | |||||
| Federal and foreign income tax expense (benefit)—Capital |
— | — | ||||||
| Change in net deferred income tax charge (benefit) |
(237 | ) | 67.06 | |||||
| Total statutory income taxes |
$ | (234 | ) | 66.20 | % | |||
As of December 31, 2025, the Company had the following net operating loss carry forwards (in millions):
| Year Incurred | Net Operating Losses | Year of Expiration | ||||||
| 2017 |
$ | 150 | 2032 | |||||
| 2022 |
1,736 | Indefinite | ||||||
| 2023 |
2,569 | Indefinite | ||||||
| 2024 |
1,849 | Indefinite | ||||||
| 2025 |
568 | Indefinite | ||||||
| Total |
$ | 6,872 | ||||||
As of December 31, 2025, the Company had the following foreign tax credit carry forwards (in millions):
| Year Incurred | Foreign Tax Credit | Year of Expiration | ||||||
| 2018 |
$ | 3 | 2028 | |||||
| 2019 |
3 | 2029 | ||||||
| 2020 |
1 | 2030 | ||||||
| 2021 |
2 | 2031 | ||||||
| 2022 |
42 | 2032 | ||||||
| 2023 |
37 | 2033 | ||||||
| Total |
$ | 88 | ||||||
As of December 31, 2025, the Company has no taxes available for recoupment in the event of future losses.
At December 31, 2025, the Company had no net capital loss carry forwards.
At December 31, 2025, the Company has general business credits of $132 million generated during the years 2006 to 2024 and expiring between 2026 to 2044.
The Company does not have any protective tax deposits on deposit with the Internal Revenue Service under IRC Section 6603.
Beginning in 1998, the Company filed a consolidated federal income tax return with its includable affiliates (the “consolidating companies”). The consolidating companies participate in tax-sharing agreements. Under the general agreement, which applies to all of the below listed entities except those denoted with an asterisk (*), current federal income tax expense (benefit) is computed on a separate return basis and provides that members shall make payments or receive reimbursements to the extent their income (loss) contributes to or reduces consolidated federal tax expense. The consolidating companies are reimbursed for net operating losses or other tax attributes they have generated when utilized in the consolidated return.
1) 730 Texas Forest Holdings, Inc.
2) Brooklyn Artificial Intelligence, Inc
3) MyVest Corporation
4) NIS/R&T, Inc.*
5) Nuveen Holdings, Inc.*
6) Nuveen Holdings 1, Inc.*
7) Nuveen Investments, Inc.*
8) Nuveen Investments Holdings, Inc.*
9) Nuveen Securities, LLC*
10) T-C SP, Inc.
| Teachers Insurance and Annuity Association of America ∎ Statement of Additional Information | B-127 |
Table of Contents
| Notes to statutory–basis financial statements |
Teachers Insurance and Annuity Association of America
December 31, 2025
11) TIAA Board of Governors
12) TIAA-CREF Tuition Financing, Inc.
13) TIAA Trust, N.A.
The companies denoted with an asterisk above (collectively, “Nuveen subgroup”), are subject to a separate tax sharing agreement, under which current federal income tax expense (benefit) is computed on a separate subgroup return basis. Under the Agreement, Nuveen Holdings 1, Inc. makes payments to TIAA for amounts equal to the federal income payments that the Nuveen subgroup would be obliged to pay the federal government if the Nuveen subgroup had actually filed a separate consolidated tax return. Nuveen Holdings 1, Inc. is reimbursed for the subgroup losses to the extent that the subgroup tax return reflects a tax benefit that the Nuveen subgroup could have carried back to a prior consolidated return year.
Amounts receivable (payable) from the Company’s subsidiaries for federal income taxes are $4 million and $2 million at December 31, 2025 and 2024, respectively.
The Company’s tax years 2018 through 2020 are currently under examination by the Internal Revenue Service (“IRS”), and tax years 2021 through 2024 are open to examination.
The Inflation Reduction Act (“Act”) was enacted on August 16, 2022. The Act included a new corporate alternative minimum tax (“CAMT”) which is a 15 percent tax on an applicable corporation’s adjusted financial statement income for the tax year, reduced by corporate alternative minimum foreign tax credits. The tax is effective for tax years beginning after 2022 for applicable corporations.
Pursuant to guidance released by the Statutory Accounting Principles Working Group (“SAPWG”) within INT 23-03, the Company has determined as of the reporting date that it will not be an applicable entity and will not be liable for CAMT for the years ended December 31, 2025, 2024, and 2023.
The One Big Beautiful Bill Act (the “Act”) was signed into law by the President on July 4, 2025. The Act changes existing United States tax law and includes numerous provisions that will affect a wide range of businesses and industries. The Act also includes reform of the existing US international tax system. Management has evaluated the impact of the Act and has concluded to have no material impact to the financial statements.
Note 17—repurchase and securities lending programs
Repurchase Program
The Company has a repurchase program to sell and repurchase securities for the purposes of providing additional liquidity. For repurchase agreements, the Company’s policy requires a minimum of 95% of the fair value of securities transferred under repurchase agreements to be maintained as collateral.
The Company has procedures in place to monitor the value of the collateral held and the fair value of the securities transferred under the agreements. If at any time the value of the collateral received from the counterparty falls below 95% of the fair value of the securities transferred, the Company is entitled to receive additional collateral from its counterparty. The Company monitors the estimated fair value of the securities sold under the agreements on a daily basis with additional collateral sent/obtained as necessary. If the counterparty were to default on its obligation to return the securities sold under the agreement on the repurchase date, the Company has the right to retain the collateral.
During the years ended December 31, 2025 and 2024, the Company engaged in certain repurchase transactions as cash taker. These transactions were “bilateral” in nature and the Company did not engage in any “Tri-party” repurchase transactions during the year. Additionally, there were no securities sold during the years ended December 31, 2025 and 2024 that resulted in default.
As of December 31, 2025 and 2024, the Company had no outstanding repurchase agreements.
Reverse Repurchase Program
The Company enters into tri-party reverse repurchase agreements to purchase and resell short-term securities. The Company receives securities as collateral, having a fair value at least equal to 102% of the purchase price paid by the Company for the securities. If at anytime the fair value of the collateral is less than 100% of the purchase price paid by the Company, the counterparty shall be obligated to deliver additional collateral, the fair value of which, together with fair value of all collateral then held in connection with the transaction, at least equals 102% of the purchase price of the transferred securities. The Company is not permitted to sell or repledge these securities. The collateral is not recorded on the Company’s financial statements. However, if the counterparty defaults, the Company would then exercise its right with respect to the collateral, including a sale of the collateral.
| B-128 | Statement of Additional Information ∎ Teachers Insurance and Annuity Association of America |
Table of Contents
| continued |
The Company records the amount paid for these securities purchased under agreements to resell in short-term investments. At December 31st, 2025, the Company held $23 million in short-term investments for reverse repurchase agreements.
Securities Lending Program
The Company has a securities lending program whereby it may lend securities to qualified institutional borrowers to earn additional income. The Company receives collateral (in the form of cash) against the loaned securities and maintains collateral in an amount not less than 102% of the market value of loaned securities during the period of the loan; any additional collateral required due to changes in security values is delivered to the Company the next business day. Cash collateral received by the Company will generally be invested in high-quality short-term instruments or bank deposits.
As of December 31, 2025, the estimated fair value of the Company’s securities on loan under the program was $2,422 million. The estimated fair value of collateral held by the Company for the securities on loan as of December 31, 2025, was reported in “Securities lending collateral assets” with an offsetting collateral liability of $2,474 million included in “Payable for collateral for securities loaned”. This collateral received is cash and has not been sold or re-pledged as of December 31, 2025.
Of the cash collateral received from the program, $2,474 million is held as cash or reinvested in overnight, government backed, repurchase agreements as of December 31, 2025. Thus, the collateral remains liquid and could be returned in the event of a collateral call. The amortized cost and fair value of the reinvested cash collateral by the maturity date of the invested asset is as follows as of December 31, 2025 (in millions):
| Amortized Cost | Fair Value | |||||||
| Open |
$ | 2,474 | $ | 2,474 | ||||
| Total collateral reinvested |
$ | 2,474 | $ | 2,474 | ||||
As of December 31, 2024 the estimated fair value of the Company’s securities on loan under the program was $1,342 million. The estimated fair value of collateral held by the Company for the securities on loan as of December 31, 2024, was reported in “Securities lending collateral assets” with an offsetting collateral liability of $1,373 million included in “Payable for collateral for securities loaned.” This collateral received was cash and had not been sold or re-pledged as of December 31, 2024.
Of the cash collateral received from the program, $1,373 million was held as cash or reinvested in overnight, government backed, repurchase agreements as of December 31, 2024. Thus, the collateral remains liquid and could be returned in the event of a collateral call. The amortized cost and fair value of the reinvested cash collateral by the maturity date of the invested asset is as follows as of December 31, 2024 (in millions):
| Amortized Cost | Fair Value | |||||||
| Open |
$ | 1,373 | $ | 1,373 | ||||
| Total collateral reinvested |
$ | 1,373 | $ | 1,373 | ||||
Note 18—federal home loan bank of new york membership and borrowings
The Company is a member of the FHLBNY. Through its membership, the Company has the ability to conduct business activity (“advances”) with the FHLBNY. It is part of the Company’s strategy to utilize these funds to provide additional liquidity to supplement existing sources. The Company is required to pledge collateral to the FHLBNY in the form of eligible securities for all advances received. The Company considers the amount of collateral pledged to the FHLBNY as the amount encumbered by advances from the FHLBNY at a point in time. The Company has determined the estimated maximum borrowing capacity as about $19,018 million. The Company calculated this amount using 5% of total net admitted assets at the current reporting date.
The following table shows the FHLBNY capital stock held in the General Account as of December 31, (in millions):
| 2025 | 2024 | |||
| Membership stock - class A |
$— | $— | ||
| Membership stock - class B |
50 | 50 | ||
| Activity stock |
325 | 323 | ||
| Excess stock |
— | — | ||
| Total |
$375 | $373 | ||
| Teachers Insurance and Annuity Association of America ∎ Statement of Additional Information | B-129 |
Table of Contents
| Notes to statutory–basis financial statements |
Teachers Insurance and Annuity Association of America
December 31, 2025
There were no FHLBNY capital stock held in separate accounts as of December 31, 2025 and 2024.
Membership stock at December 31, 2025 and 2024, is not eligible for redemption.
The Company had $7,119 million and $7,078 million in funding agreements, $7,119 million and $7,078 million in funding agreement reserves established, and $110 million and $100 million in debt outstanding at December 31, 2025 and December 31, 2024, respectively. The Company does not have any prepayment obligations for these funding agreement arrangements.
The following table shows the maximum collateral pledged to FHLBNY in the General Account during the year ending December 31, (in millions):
| 2025 | 2024 | |||||||||||||||||||||||||||||||
| Fair Value |
Carrying Value |
Amount Borrowed |
Fair Value |
Carrying Value |
Amount Borrowed Maximum |
|||||||||||||||||||||||||||
| Total |
$ | 8,948 | $ | 9,742 | $ | 8,009 | $ | 9,347 | $ | 10,362 | $ | 8,280 | ||||||||||||||||||||
There was no collateral pledged to FHLBNY in the separate accounts during the years ended December 31, 2025 and 2024.
The following table shows the maximum borrowing from FHLBNY in the General Account during the year ending December 31, (in millions):
| 2025 | 2024 | |||||||||||||||
| Debt |
$ | 890 | $ | 1,785 | ||||||||||||
| Funding agreements |
7,119 | 6,496 | ||||||||||||||
| Total |
$ | 8,009 | $ | 8,281 | ||||||||||||
There were no borrowings from FHLBNY in the separate accounts during the year ended December 31, 2025 and 2024.
The following table shows the collateral pledged to FHLB in the General Account as of December 31, 2025 and 2024 (in millions):
| 2025 | 2024 | |||||||||||||||||||||||||||||||
| Fair Value |
Carrying Value |
Aggregate Total Borrowing |
Fair Value |
Carrying Value |
Aggregate Total Borrowing |
|||||||||||||||||||||||||||
| Total |
$ | 8,077 | $ | 8,804 | $ | 7,229 | $ | 8,213 | $ | 9,108 | $ | 7,178 | ||||||||||||||||||||
There was no collateral pledged to FHLB in the separate account as of December 31, 2025 and 2024.
Note 19—capital and contingency reserves and shareholders’ dividends restrictions
The portion of contingency reserves increased or (reduced) by each item below for the years ended December 31 are as follows (in millions):
| 2025 | 2024 | 2023 | ||||||||||
| Net income (loss) |
$ | (162 | ) | $ | (1,214 | ) | $ | (731 | ) | |||
| Change in net unrealized capital gains (losses), net of taxes |
867 | 73 | 230 | |||||||||
| Change in asset valuation reserve |
(186 | ) | 701 | (226 | ) | |||||||
| Change in net deferred income tax |
237 | 385 | 609 | |||||||||
| Change in non-admitted assets |
(152 | ) | (622 | ) | (468 | ) | ||||||
| Surplus (contributed to) withdrawn from Separate Accounts |
— | (294 | ) | (618 | ) | |||||||
| Change in surplus of separate accounts |
34 | 260 | 594 | |||||||||
| Change in surplus notes |
— | (349 | ) | — | ||||||||
| Change in post-retirement benefit liability |
(9 | ) | (6 | ) | (4 | ) | ||||||
| Change in liability for reinsurance of unauthorized companies |
(6 | ) | — | 1 | ||||||||
| B-130 | Statement of Additional Information ∎ Teachers Insurance and Annuity Association of America |
Table of Contents
| continued |
As of December 31, 2025 and 2024, the portion of contingency reserves represented by cumulative net unrealized gains was $4,566 million and $3,586 million, gross of deferred taxes, respectively.
Capital: The Company has 2,500 shares of Class A common stock authorized, issued and outstanding. All of the outstanding common stock of the Company is held by the TIAA Board of Governors, a not-for-profit corporation created for the purpose of holding the common stock of the Company. By charter, the Company operates without profit to its sole shareholder.
Surplus Notes: The following table provides information related to the Company’s outstanding surplus notes as of December 31, 2025 (in millions):
| Date Issued | Interest Rate |
Original Issue Amount of Note |
Carrying Value of Note Prior Year |
Carrying Value of Note Current Year |
Current Year Interest Expense Recognized |
Life-To-Date Interest Expense Recognized |
Life-To-Date Principal Paid |
Date of Maturity | ||||||||||||||||||||||||
| 12/16/2009 |
6.850 | % | $ | 2,000 | $ | 1,049 | $ | 1,049 | $ | 72 | $ | 1,151 | $ | 950 | 12/16/2039 | |||||||||||||||||
| 09/18/2014 |
4.900 | % | 1,650 | 1,649 | 1,649 | 81 | 889 | — | 09/15/2044 | |||||||||||||||||||||||
| 05/08/2017 |
4.270 | % | 2,000 | 1,995 | 1,995 | 85 | 727 | — | 05/15/2047 | |||||||||||||||||||||||
| 05/07/2020 |
3.300 | % | 1,250 | 1,249 | 1,249 | 41 | 228 | — | 05/15/2050 | |||||||||||||||||||||||
| Total |
$ | 6,900 | $ | 5,942 | $ | 5,942 | $ | 279 | $ | 2,995 | $ | 950 | ||||||||||||||||||||
In 2024, the Company called a $350 million fixed to floating surplus note that was issued on September 18, 2014. It bore interest at a fixed annual rate of 4.375% until September 15, 2024, at which time it converted to a floating rate and became callable. The interest expense in 2024 associated with this surplus note was $16 million.
For the years ended December 31, 2025 and 2024, the Company did not have any related parties as holders of surplus notes or unapproved interest or principal. There were no amounts of current year interest offset or principal paid and the notes were not contractually linked. Surplus note payments are not subject to administrative offsetting and proceeds were not used to purchase assets directly from the holder of the note.
The instruments listed in the above table, are unsecured debt obligations of the type generally referred to as “surplus notes” and are issued in accordance with Section 1307 of the New York Insurance Law. The surplus notes are subordinated in right of payment to all present and future indebtedness, policy claims and other creditor claims of the Company and rank pari passu with any future surplus notes of the Company and with any other similarly subordinated obligations.
The notes were issued in transactions pursuant to Rule 144A under the Securities Act of 1933, as amended, and the notes are evidenced by one or more global notes deposited with a custodian for, and registered in the name of a nominee of, The Depository Trust Company.
No subsidiary or affiliate of the Company is an obligor or guarantor of the notes, which are solely obligations of the Company. No affiliates of the Company hold any portion of the notes.
The notes are unsecured and subordinated to all present and future indebtedness, policy claims and other creditor claims of the Company. Under New York Insurance Law, the notes are not part of the legal liabilities of the Company. The notes are not scheduled to repay any principal prior to maturity. Each payment of interest and principal may be made only with the prior approval of the Superintendent and only out of the Company’s surplus funds, which the Superintendent of the Department determines to be available for such payments under New York Insurance Law. In addition, provided that approval is granted by the Superintendent of the Department, the notes may be redeemed at the option of the Company at any time at the “make-whole” redemption price equal to the greater of the principal amount of the notes to be redeemed, or the sum of the present values of the remaining scheduled interest and principal payments, excluding accrued interest as of the redemption date, discounted to the redemption date on a semi-annual basis at the adjusted Treasury rate plus a pre-defined spread, plus in each case, accrued and unpaid interest payments on the notes to be redeemed to the redemption date.
Dividend Restrictions: The Company is subject to stockholder dividend restrictions under the New York Insurance Law. However, all of the outstanding common stock of the Company is collectively held by TIAA Board of Governors, a non-profit corporation created to hold the stock of the Company, and therefore the Company does not make stockholder dividend payments.
20—contingencies and guarantees
Subsidiary and Affiliate Guarantees:
The Company has unconditionally guaranteed $1,000 million in 4.0% senior unsecured notes issued by Nuveen, LLC due in 2028. The Company agrees to cause any such payment to be made punctually when and as the same shall become due and payable, whether at maturity, upon acceleration, redemption, repayment or otherwise, and as if such payment were made by Nuveen, LLC. The guarantee is made to/on behalf of a wholly-owned subsidiary, and as such the liability is excluded from recognition. The
| Teachers Insurance and Annuity Association of America ∎ Statement of Additional Information | B-131 |
Table of Contents
| Notes to statutory–basis financial statements |
Teachers Insurance and Annuity Association of America
December 31, 2025
maximum potential amount of future payments the Company could be required to make under the guarantee as of December 31, 2025, is $1,120 million, which includes the future undiscounted interest payments. Should action under the guarantee be required, the Company would contribute cash to Nuveen, LLC, to fund the obligation, thereby increasing the Company’s investment in Nuveen, LLC, as reported in other invested assets. Based on Nuveen, LLC’s financial position and operations, the Company views the risk of performance under this guarantee as remote.
Additionally, the Company has the following agreements and lines of credit with subsidiaries, affiliates, and other related parties:
The Company also provides a $1,000 million uncommitted line of credit to certain accounts of CREF, a companion organization of TIAA. Loans under this revolving credit facility are for a maximum of 60 days and are made solely at the discretion of the Company to fund shareholder redemption requests or other temporary or emergency needs of CREF. As of December 31, 2025, there were no balances outstanding. It is the intent of the Company and CREF to use this facility as a supplemental liquidity facility, which would only be used after CREF has exhausted the availability of the current $500 million committed credit facility maintained with a group of banks.
The Company guarantees that CREF transfers to the Company for the immediate purchase of lifetime payout annuities will produce guaranteed payments that will never be less than the amounts calculated at the stipulated interest rate and mortality defined in the applicable CREF contract.
The Company provides a $100 million unsecured 364-day revolving line of credit arrangement with the Trust. $100 million of this facility is maintained on a committed basis with an expiration date of June 29, 2026. As of December 31, 2025, there were no balances outstanding.
The Company provides a $5 million unsecured 364-day revolving line of credit arrangement with MyVest, Inc. This line has an expiration date of December 30, 2026. As of December 31, 2025, $5 million was outstanding.
The Company provides a $250 million committed 364-day revolving line of credit arrangement with Nuveen, LLC. This line has an expiration date of December 17, 2026. As of December 31, 2025, there were no balances outstanding.
The Company also provides a $200 million unsecured revolving line of credit arrangement with T-C S-T REIT LLC. This line of credit has an open ended expiration date and is effective until terminated. As of December 31, 2025, there were no balances outstanding.
Separate Account Guarantees: The Company provides mortality and expense guarantees to VA-1, for which it is compensated. The Company guarantees, at death, the total death benefit payable from the fixed and variable accounts will be at least a return of total premiums paid less any previous withdrawals. The Company also guarantees expense charges to VA-1 participants will never rise above the maximum amount stipulated in the contract.
The Company provides mortality, expense, and liquidity guarantees to REA and is compensated for these guarantees. The Company guarantees once REA contract owners begin receiving lifetime annuity income benefits, monthly payments will never be reduced as a result of adverse mortality experience. The Company also guarantees expense charges to REA contract owners will never rise above the maximum amount stipulated in the contract. The Company provides REA with a liquidity guarantee to ensure it has funds available to meet contract owner transfer or cash withdrawal requests. If REA cannot fund contract owner requests, TIAA’s general account will fund them by purchasing accumulation units in the REA. Under this agreement, TIAA guarantees that contract owners will be able to redeem their accumulation units at the accumulation unit value next determined after the transfer or withdrawal request is received in good order.
Pursuant to the liquidity guarantee obligation, the TIAA General Account has purchased 1,851 thousand liquidity units issued by the REA for a total of $911 million since the guarantee was activated in 2023 and continues to hold these liquidity units as of December 31, 2025. No liquidity units were purchased in 2025. The fair value of these liquidity units was $887 million as of December 31, 2025. liquidity units owned by TIAA are valued in the same manner as units owned by individual REA contract owners on a fair value basis and will fluctuate in value.
Because TIAA’s ability to purchase and sell liquidity units raises certain technical issues under the Employee Retirement Income Security Act of 1974, as amended (“ERISA”), TIAA applied for and received a prohibited transaction exemption from the U.S. Department of Labor in 1996 (“PTE 96-76”). In connection with the exemption, TIAA has appointed an independent fiduciary for the REA. The independent fiduciary reviews and approves the valuation of units in the REA as well as the account’s investment guidelines and monitoring whether its investments comply with those guidelines. In addition, the independent fiduciary has certain responsibilities with respect to the REA whenever TIAA is required to purchase and own liquidity units in the Account in connection with operation of the REA’s liquidity guarantee. The independent fiduciary is vested with oversight and approval over any redemption of TIAA’s liquidity units (including setting the “trigger point” or maximum amount of liquidity units that can be acquired by TIAA), acting in the best interests of REA contract owners. To the extent liquidity units are held by the TIAA General Account, the independent fiduciary reserves the right to authorize or direct the redemption of all or a portion of liquidity units at any time, including when the trigger point is reached. Upon termination and liquidation of the REA (wind-up), any liquidity units held by TIAA will be the last units redeemed, unless the independent fiduciary directs otherwise.
| B-132 | Statement of Additional Information ∎ Teachers Insurance and Annuity Association of America |
Table of Contents
| continued |
The Company provides mortality and expense guarantees to VA-3 and is compensated for these guarantees. The Company guarantees once VA-3 participants begin receiving lifetime annuity income benefits, monthly payments will never be reduced as a result of adverse mortality experience. The Company also guarantees expense charges to VA-3 participants will never rise above the maximum amount stipulated in the contract.
Other Contingencies:
In the ordinary conduct of certain of its investment activities, the Company provides standard indemnities covering a variety of potential exposures. For instance, the Company provides indemnifications in connection with site access agreements relating to due diligence review for real estate acquisitions, and the Company provides indemnification to underwriters in connection with the issuance of securities by or on behalf of the Company or its subsidiaries. It is the Company management’s opinion that the fair value of such indemnifications are negligible and do not materially affect the Company’s financial position, results of operations or liquidity.
Other contingent liabilities arising from litigation and other matters over and above amounts already provided for in the financial statements or disclosed elsewhere in these notes are not considered material in relation to the Company’s financial position or the results of its operations.
The Company receives and responds to subpoenas, examinations, or other inquiries from state and federal regulators, including state insurance commissioners; state attorneys general and other state governmental authorities; the SEC; federal governmental authorities; and the Financial Industry Regulatory Authority (“FINRA”), seeking a broad range of information. The Company cooperates in connection with these inquiries and believes the ultimate liability that could result from litigation and proceedings would not have a material adverse effect on the Company’s financial position.
Note 21—subsequent events
In preparing these financial statements, the Company has evaluated events and transactions for potential recognition or disclosure through March 11, 2026, the date the financial statements were available to be issued.
On February 12, 2026, Nuveen and Schroders, a leading provider of active asset management, advisory and wealth management services agreed to the terms of a board recommended cash acquisition (“the Transaction”) by Nuveen for the entire issued and to-be-issued share capital of Schroders. The Transaction is currently expected to become effective and close during Q4 2026, subject to the satisfaction or waiver of certain conditions, including the approval by Schroders shareholders and relevant antitrust and regulatory authorities.
| Teachers Insurance and Annuity Association of America ∎ Statement of Additional Information | B-133 |
Table of Contents
| A10896 (05/26) | ||||
Table of Contents
PART C – OTHER INFORMATION
Item 27. Exhibits
C-1
Table of Contents
C-2
Table of Contents
C-3
Table of Contents
| (p) |
Powers of Attorney. | |
| (A) |
Trustees’ Powers of Attorney (Incorporated by reference to the initial Registration Statement on Form N-4, dated December 31, 2025 (File No. 333-292533)). | |
| * | Filed herewith |
Item 28 Directors and Officers of the Insurance Company
| Name and Principal Business Address* | Positions and Offices with Insurance Company | |
| James R. Chambers | Trustee and Chairman | |
| Priya Abani | Trustee | |
| Samuel R. Bright | Trustee | |
| Jason E. Brown | Trustee | |
| Jeffrey R. Brown | Trustee | |
| Angel Cabrera Michael R. Fanning |
Trustee Trustee | |
| Lisa W. Hess | Trustee | |
| Edward M. Hundert, M.D. | Trustee | |
| Gina L. Loften | Trustee | |
| Ramona E. Romero | Trustee | |
| Kim M. Sharan | Trustee | |
| La June Montgomery Tabron | Trustee | |
| Thasunda Brown Duckett | President and Chief Executive Officer and Trustee | |
| Mike Cowell | Senior Executive Vice President, Chief Risk and Compliance Officer | |
| Bret Hester | Senior Executive Vice President, Chief Legal Officer | |
| Sastry V. Durvasula | Senior Executive Vice President, Chief Operating, Information & Digital Officer | |
| W. Dave Dowrich | Senior Executive Vice President and Chief Financial Officer | |
| Claire V. Borelli | Senior Executive Vice President and Chief People Officer | |
| Derek B. Dorn | Senior Managing Director, Corporate Secretary & General Counsel | |
| Keith Floman | Senior Vice President and Chief Actuary | |
| Christopher Baraks | Senior Vice President, Chief Accounting Officer and Corporate Controller | |
| Richard S. Biegen | Senior Managing Director, Chief Compliance Officer of the Separate Account | |
| Colbert G. Narcisse | Chief Product Officer, Head of Insurance Solutions and New Markets |
| * | The principal business address for each officer and director is TIAA, 730 Third Avenue, New York, New York 10017-3206 |
C-4
Table of Contents
Item 29. Persons Controlled by or under Common Control with the Depositor or Registrant
The following chart indicates subsidiaries of Teachers Insurance and Annuity Association of America. These subsidiaries are included in the consolidated financial statements of Teachers Insurance and Annuity Association of America.
All Teachers Insurance and Annuity Association of America subsidiary companies are Delaware corporations, except as indicated.
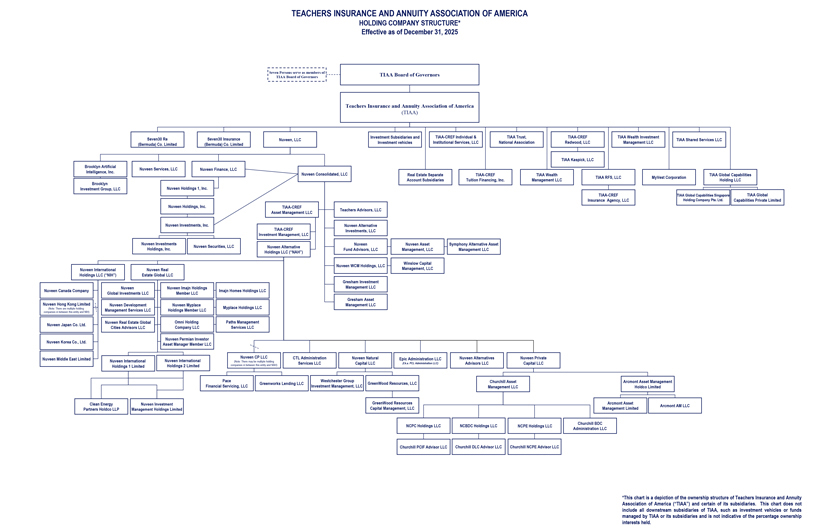
This chart is a representation of the organizational structure of TIAA and does not detail each subsidiary of TIAA. For a complete list of subsidiaries, please refer to the attachment.
C-5
Table of Contents
Exhibit A*
| Entity Name | Jurisdiction of Formation |
Entity Classification |
Owner Name | Owner Type | Ownership % | Business Purpose | ||||||
| Anglo Sino Henderson Investment Consultancy (Beijing) Co Ltd | China | Operating Subsidiary | Nuveen Group Holdings Limited | Shareholder | 100 | To provide investment consulting services. | ||||||
| Arcmont AM LLC | DE | Operating Subsidiary | Arcmont Asset Management Holdco Limited | Member | 100 | To engage in financial services. | ||||||
| Arcmont Asset Management (Sweden) AB | Sweden | Operating Subsidiary | Arcmont Asset Management Holdco Limited | Shareholder | 100 | To provide marketing and investment services. | ||||||
| Arcmont Asset Management France SAS | France | Operating Subsidiary | Arcmont Asset Management Holdco Limited | Shareholder | 100 | To engage in financial services. | ||||||
| Arcmont Asset Management Germany Gmbh | Germany | Operating Subsidiary | Arcmont Asset Management Holdco Limited | Shareholder | 100 | To engage in financial services. | ||||||
| Arcmont Asset Management Limited | United Kingdom | Operating Subsidiary | Arcmont Asset Management Holdco Limited | Shareholder | 100 | To act as a holding company. | ||||||
| Brooklyn Artificial Intelligence, Inc. | DE | Operating Subsidiary | Nuveen, LLC | Shareholder | 100 | To serve as a platform that manufactures custom, direct indexing products. | ||||||
| Brooklyn Investment Group, LLC | DE | Operating Subsidiary | Brooklyn Artificial Intelligence, Inc. | Member | 100 | To serve as a registered investment adviser. | ||||||
| CAM HR Resources LLC | DE | Operating Subsidiary | Churchill Asset Management LLC | Managing Member | 99 | To act as an employing entity. | ||||||
| CAM HR Resources LLC | DE | Operating Subsidiary | CAM HR Holdco LLC | Member | 1 | To act as an employing entity. | ||||||
| Churchill Agency Services LLC | DE | Operating Subsidiary | Churchill Asset Management LLC | Member | 100 | To act as administrative and collateral agent in connection with certain investments | ||||||
| Churchill Asset Management LLC | DE | Operating Subsidiary | Nuveen Private Capital LLC | Member | 100 | To act as a registered investment adviser for senior loan investments. | ||||||
| Churchill BDC Administration LLC | DE | Operating Subsidiary | Churchill Asset Management LLC | Member | 100 | To act as administrator company. | ||||||
| Churchill DLC Advisor LLC | DE | Operating Subsidiary | NCBDC Holdings LLC | Member | 100 | To hold investments in connection with a fund. | ||||||
| Clean Energy Partners CEP 2012 Limited | United Kingdom | Operating Subsidiary | Glennmont Asset Management Limited | Shareholder | 100 | To provide investment management services. | ||||||
| Clean Energy Partners CEP Services Limited | United Kingdom | Operating Subsidiary | Glennmont Asset Management Limited | Shareholder | 100 | To provide investment management services. | ||||||
| Glennmont Asset Management Limited | United Kingdom | Operating Subsidiary | Clean Energy Partners HoldCo LLP | Shareholder | 100 | To provide investment management services. | ||||||
| Glennmont Partners I Limited | United Kingdom | Operating Subsidiary | Clean Energy Partners CEP 2012 Limited | Shareholder | 100 | To provide investment management services. | ||||||
| GreenWood Resources Capital Management, LLC | DE | Operating Subsidiary | Greenwood Resources, LLC | Member | 100 | To act as a registered investment advisor and provide investment management services. | ||||||
| Greenwood Resources Poland sp. z o.o | Poland | Operating Subsidiary | Greenwood Resources Forest Management, LLC | Shareholder | 100 | To provide property management services. | ||||||
| Greenwood Resources, LLC | DE | Operating Subsidiary | Nuveen Natural Capital, LLC | Member | 100 | To act as an advisor and manager of timber and related investments. | ||||||
| Greenworks Lending LLC | DE | Operating Subsidiary | Nuveen CP LLC | Member | 100 | To act as originator of commercial property-assessed clean energy (“CPACE”) loans. | ||||||
| Gresham Investment Management LLC | DE | Operating Subsidiary | Nuveen Consolidated, LLC | Managing Member | 79.8 | To act as a registered investment advisor, commodity pool operator, and commodity trading advisor, provide investment advisory and management services. | ||||||
C-6
Table of Contents
| GWR Uruguay S.A. | Uruguay | Operating Subsidiary | Greenwood Resources Forest Management, LLC | Shareholder | 100 | To act as a property manager. | ||||||
| McIntyre Labor Services, LLC | CA | Operating Subsidiary | Monterey Pacific, LLC | Member | 100 | To hold and manage investments. | ||||||
| Monterey Pacific, LLC | DE | Operating Subsidiary | Westchester Group Investment Management, LLC | Member | 100 | To hold and manage investments. | ||||||
| MyVest Corporation | DE | Operating Subsidiary | Teachers Insurance and Annuity Association of America | Shareholder | 100 | To provide digital financial account management services. | ||||||
| NCBDC Holdings LLC | DE | Operating Subsidiary | Churchill Asset Management LLC | Managing Member | 85 | To hold investments in connection with a fund. | ||||||
| Nuveen Administration Limited | United Kingdom | Operating Subsidiary | Nuveen Investment Management Holdings Limited | Shareholder | 100 | To provide administrative services and act as employer. | ||||||
| Nuveen Alternatives Advisors LLC | DE | Operating Subsidiary | Nuveen Alternative Holdings LLC | Member | 100 | To provide advisory services for alternative investments. | ||||||
| Nuveen Alternatives Europe S.à r.l. | Luxembourg | Operating Subsidiary | Nuveen Europe Holdings Limited | Member | 100 | To act as a fund manager and management company. | ||||||
| Nuveen Alternatives Services LLC | DE | Operating Subsidiary | Nuveen Alternative Holdings LLC | Member | 100 | To provide administrative services. | ||||||
| Nuveen Asset Management Europe S.à r.l. | Luxembourg | Operating Subsidiary | Nuveen Europe Holdings Limited | Member | 100 | To hold or distribute investments. | ||||||
| Nuveen Asset Management, LLC | DE | Operating Subsidiary | Nuveen Fund Advisors, LLC | Managing Member | 100 | To act as a registered investment adviser. | ||||||
| Nuveen Australia Limited | Australia | Operating Subsidiary | Nuveen Group Holdings Limited | Shareholder | 100 | To provide real estate advisory and management services. | ||||||
| Nuveen Canada Company | Canada | Operating Subsidiary | Nuveen International Holdings LLC | Shareholder | 100 | To provide sales and marketing services. | ||||||
| Nuveen Consulting (Shanghai) Co., Ltd. | China | Operating Subsidiary | Nuveen Group Holdings Limited | Shareholder | 100 | To provide investment consulting services. | ||||||
| Nuveen Corporate Secretarial Services Limited | United Kingdom | Operating Subsidiary | Nuveen Group Holdings Limited | Shareholder | 100 | To provide administrative services. | ||||||
| Nuveen Development Management Services LLC | DE | Operating Subsidiary | Nuveen Real Estate Global LLC | Member | 100 | To provide construction and development management services. | ||||||
| Nuveen France SAS | France | Operating Subsidiary | Nuveen Group Holdings Limited | Shareholder | 100 | To provide real estate advisory services | ||||||
| Nuveen Fund Advisors, LLC | DE | Operating Subsidiary | Nuveen Consolidated, LLC | Member | 100 | To act as a registered commodity pool operator. | ||||||
| Nuveen Fund Management (Jersey) Limited | Jersey | Operating Subsidiary | Nuveen Europe Holdings Limited | Shareholder | 100 | To manage real estate funds. | ||||||
| Nuveen Hong Kong Limited | Hong Kong | Operating Subsidiary | TGAM HK HC LLC | Shareholder | 100 | To serve as a regulated entity. | ||||||
| Nuveen Industrial Development Management Services LLC | DE | Operating Subsidiary | Nuveen Development Management Services LLC | Member | 100 | To provide development management, construction management and related services. | ||||||
| Nuveen Investment Management Holdings Limited | United Kingdom | Operating Subsidiary | Nuveen International Holdings 3 Limited | Shareholder | 99.6 | To act as the holding company for legal entities. | ||||||
| Nuveen Investment Management Holdings Limited | United Kingdom | Operating Subsidiary | Nuveen International Holdings 1 Limited | Shareholder | 0.4 | To act as the holding company for the legal entities. | ||||||
C-7
Table of Contents
| Nuveen Investment Management International Limited | United Kingdom | Operating Subsidiary | Nuveen FCACO Limited | Shareholder | 100 | To manage real estate funds. | ||||||
| Nuveen Italy S.r.l. | Italy | Operating Subsidiary | Nuveen Group Holdings Limited | Shareholder | 100 | To manage real estate investments. | ||||||
| NUVEEN JAPAN CO., LTD | Japan | Operating Subsidiary | Nuveen International Holdings LLC | Shareholder | 100 | To provide investment management and related services. | ||||||
| Nuveen Management AIFM Limited | United Kingdom | Operating Subsidiary | Nuveen Europe Holdings Limited | Shareholder | 100 | To act as an asset manager. | ||||||
| Nuveen Management Austria GMBH | Austria | Operating Subsidiary | Nuveen Group Holdings Limited | Shareholder | 100 | To manage real estate funds. | ||||||
| Nuveen Management Company (Luxembourg) No 1 S.à r.l. | Luxembourg | Operating Subsidiary | Nuveen Europe Holdings Limited | Shareholder | 94.4 | To manage real estate funds. | ||||||
| Nuveen Management Finland OY | Finland | Operating Subsidiary | Nuveen Group Holdings Limited | Shareholder | 100 | To act as an employing entity. | ||||||
| Nuveen Mob Development Management Services LLC | DE | Operating Subsidiary | Nuveen Development Management Services LLC | Member | 100 | To provide development management, construction management, and other services. | ||||||
| Nuveen Natural Capital Chile SpA | Chile | Operating Subsidiary | Westchester Group Investment Management, LLC | Shareholder | 100 | To facilitate management operations. | ||||||
| Nuveen Natural Capital LATAM Gestao De Ativos Ltda | Brazil | Operating Subsidiary | Westchester Group Investment Management, LLC | Shareholder | 100 | To manage fund entities. | ||||||
| Nuveen Natural Capital Limited | United Kingdom | Operating Subsidiary | Westchester Group Investment Management, LLC | Shareholder | 100 | To manage fund entities. | ||||||
| Nuveen Natural Capital S.r.l. | Romania | Operating Subsidiary | Nuveen Natural Capital Limited | Shareholder | 100 | To manage fund entities. | ||||||
| Nuveen Natural Capital sp. z o.o | Poland | Operating Subsidiary | Nuveen Natural Capital Limited | Shareholder | 100 | To manage fund entities. | ||||||
| Nuveen Opportunistic Strategies LLC | DE | Operating Subsidiary | Teachers Insurance and Annuity Association of America | Member | 99.99 | To hold investments. | ||||||
| Nuveen Opportunistic Strategies LLC | DE | Operating Subsidiary | Teachers Advisors, LLC | Member | 0.01 | To hold investments. | ||||||
| Nuveen Property Management (Jersey) Limited | Jersey | Operating Subsidiary | Nuveen Europe Holdings Limited | Shareholder | 100 | To manage real estate funds. | ||||||
| Nuveen Real Estate Global Cities Advisors, LLC | DE | Operating Subsidiary | Nuveen Real Estate Global LLC | Member | 100 | To manage and advise legal entities. | ||||||
| Nuveen Services, LLC | DE | Operating Subsidiary | Nuveen, LLC | Member | 100 | To act as an employing entity. | ||||||
| Nuveen Singapore Private Limited | Singapore | Operating Subsidiary | Nuveen Group Holdings Limited | Shareholder | 100 | To act as a real estate investment advisor. | ||||||
| Pace Financial Servicing, LLC | DE | Operating Subsidiary | Nuveen CP LLC | Member | 100 | To service activities related to CPACE loans. | ||||||
| Paths Building Services LLC | DE | Operating Subsidiary | Paths Management Services LLC | Member | 100 | To act as an employing entity. | ||||||
| Paths Construction LLC | DE | Operating Subsidiary | Omni Holding Company LLC | Member | 100 | To serve as construction management operating company. | ||||||
| Paths Development LLC | DE | Operating Subsidiary | Omni Holding Company LLC | Member | 100 | To serve as a development operating company. | ||||||
C-8
Table of Contents
| Paths Management Services LLC | DE | Operating Subsidiary | Omni Holding Company LLC | Member | 100 | To manage and operate real property. | ||||||
| Paths RMS LLC | DE | Operating Subsidiary | Omni Holding Company LLC | Member | 100 | To serve as maintenance operating company. | ||||||
| Permian Investor Asset Manager LLC | DE | Operating Subsidiary | Nuveen Permian Investor Asset Manager Member LLC | Member | 50 | To hold real estate. | ||||||
| Plata Wine Partners, LLC | CA | Operating Subsidiary | The Plata Wine Partners Trust | Member | 87 | To hold and manage investments. | ||||||
| Private Debt carried Interest General Partner II S.à r.l. | Luxembourg | Operating Subsidiary | Arcmont Asset Management Holdco Limited | Shareholder | 100 | To provide financial services. | ||||||
| Reliant Safety LLC | DE | Operating Subsidiary | Omni Holding Company LLC | Member | 100 | To serve as safety operating company. | ||||||
| Santa Barbara Asset Management, LLC | DE | Operating Subsidiary | Nuveen Investments, Inc. | Member | 100 | To provide investment management services. | ||||||
| Seven30 Insurance (Bermuda) Co. Limited | Bermuda | Operating Subsidiary | Teachers Insurance and Annuity Association of America | Member | 100 | To act as the issuer of corporate self Insurance. | ||||||
| Seven30 Re (Bermuda) Co. Limited | Bermuda | Operating Subsidiary | Teachers Insurance and Annuity Association of America | Shareholder | 100 | To serve as reinsurance company. | ||||||
| Symphony Alternative Asset Management LLC | DE | Operating Subsidiary | Nuveen Asset Management, LLC | Sole Member | 100 | To act as an asset manager of CLO products. | ||||||
| Teachers Advisors, LLC | DE | Operating Subsidiary | Nuveen Consolidated, LLC | Managing Member | 100 | To act as a registered investment advisor to provide investment management services. | ||||||
| TIAA Global Capabilities Private Limited | India | Operating Subsidiary | TIAA Global Capabilities Holding LLC | Shareholder | 1 | To provide certain information technology related and other support services | ||||||
| TIAA Global Capabilities Private Limited | India | Operating Subsidiary | TIAA Global Capabilities Singapore Holding Company Pte. Ltd. | Shareholder | 99 | To provide certain information technology and other support services. | ||||||
| TIAA Kaspick, LLC | DE | Operating Subsidiary | TIAA-CREF Redwood, LLC | Member | 100 | To act as a registered investment adviser and provide investment advice and gift administration services to charitable organizations and other non-profit institutions. | ||||||
| TIAA Trust, National Association | NC | Operating Subsidiary | Teachers Insurance and Annuity Association of America | Shareholder | 99.995 | To act as asset manager and support business lines. | ||||||
| TIAA-CREF Individual & Institutional Services, LLC | DE | Operating Subsidiary | Teachers Insurance and Annuity Association of America | Member | 100 | To act as a registered broker-dealer and investment advisor and to provide distribution and related services. | ||||||
| TIAA-CREF Insurance Agency, LLC | DE | Operating Subsidiary | TIAA RFS, LLC | Managing Member | 100 | To offer insurance services and products. | ||||||
| TIAA-CREF Investment Management, LLC | DE | Operating Subsidiary | TIAA-CREF Asset Management LLC | Member | 100 | To act as a registered investment advisor and provide investment management services. | ||||||
| TIAA-CREF Tuition Financing, Inc. | DE | Operating Subsidiary | Teachers Insurance and Annuity Association of America | Shareholder | 100 | To administer and provide program management services on behalf of state entities to qualified tuition programs. | ||||||
| Westchester Group Farm Management, LLC | IL | Operating Subsidiary | Westchester Group Investment Management, LLC | Member | 100 | To hold and manage investments. | ||||||
| Westchester Group Investment Management, LLC | DE | Operating Subsidiary | Nuveen Natural Capital, LLC | Member | 100 | To hold and manage investments. | ||||||
| Westchester Group Real Estate, LLC | IL | Operating Subsidiary | Westchester Group Investment Management, LLC | Member | 100 | To provide brokerage services related to agricultural investments. | ||||||
| Westchester NGFF Investment, LLC | DE | Operating Subsidiary | Westchester Group Investment Management, LLC | Shareholder | 100 | To hold and manage investments. | ||||||
C-9
Table of Contents
| Winslow Capital Management, LLC | DE | Operating Subsidiary | Nuveen WCM Holdings, LLC | Member | 100 | To act as a registered investment adviser. | ||||||
| * | Note: TIAA has control of the subsidiaries included in this filing (each, a “Subsidiary”) through: (i) direct or indirect ownership of a majority of the voting securities of the Subsidiary; (ii) TIAA, or a subsidiary of TIAA, acting as asset manager or manager of the Subsidiary (or in a similar role); or (iii) corporate governance provisions present in the Subsidiary’s constituent documents. |
Item 30. Indemnification
Trustees, officers, and employees of TIAA may be indemnified against liabilities and expenses incurred in such capacity pursuant to Article Six of TIAA’s bylaws (see Exhibit 6(B)). Article Six provides that, to the extent permitted by law, TIAA will indemnify any person made or threatened to be made a party to any action, suit or proceeding by reason of the fact that such person is or was a trustee, officer, or employee of TIAA or, while a trustee, officer, or employee of TIAA, served any other organization in any capacity at TIAA’s request. To the extent permitted by law, such indemnification could include judgments, fines, amounts paid in settlement, and expenses, including attorney’s fees. TIAA has in effect an insurance policy that will indemnify its trustees, officers, and employees for liabilities arising from certain forms of conduct.
Insofar as indemnification for liabilities arising under the Securities Act of 1933 may be permitted to officers and directors of the Depositor, pursuant to the foregoing provision or otherwise, the Depositor has been advised that in the opinion of the Securities and Exchange Commission such indemnification is against public policy as expressed in that Act and is therefore unenforceable. In the event that a claim for indemnification against such liabilities (other than the payment by the Depositor of expenses incurred or paid by a director or officer in connection with the successful defense of any action, suit or proceeding) is asserted by a director or officer in connection with the securities being registered, the Depositor will, unless in the opinion of its counsel the matter has been settled by controlling precedent, submit to a court of appropriate jurisdiction the question whether such indemnification by it is against public policy as expressed in that Act and will be governed by the final adjudication of such issue.
C-10
Table of Contents
Item 31. Principal Underwriters
(a) TIAA-CREF Individual & Institutional Services, LLC acts as principal underwriter for Registrant, College Retirement Equities Fund, TIAA Real Estate Account, TIAA Separate Accounts VLI-1 and VLI-2, TIAA Separate Account VA-5, and TIAA Separate Account VA-3.
(b) Management
| Name and Principal Business Address* | Positions and Offices with Underwriter | |
| Ross Abbott | Manager, Chief Operating Officer | |
| Raymond Bellucci | Manager, Senior Managing Director | |
| Julian D’Ambrosi | Manager, Chairman, Chief Executive Officer, President | |
| James Deats | Manager | |
| Derek Heaslip | Manager | |
| Benjamin Lewis | Manager | |
| Niladri Mukherjee | Manager | |
| Shankar Saravanan | Manager | |
| Christopher Stickrod | Manager | |
| Christopher A. Baraks | Vice President | |
| Helen Barnhill | Director, Chief Legal Officer, Assistant Secretary | |
| Christopher Beam | Assistant Treasurer | |
| Troy Burk | Chief Anti-Money Laundering & Sanctions Officer | |
| Christopher J. Heald | Treasurer | |
| Lisa Humphries | Chief Conflict of Interest Officer | |
| Jennifer Mangano | Chief Financial Officer | |
| Jessica Martin | Chief Risk Officer | |
| Eloho Ovhori | Director | |
| Scott Weinstein | Senior Managing Director, Chief Compliance Officer | |
| Jeanne Zelnick | Secretary | |
| * | The address of each Manager and Officer is c/o TIAA-CREF Individual & Institutional Services, LLC, 730 Third Avenue, New York, NY 10017-3206 |
(c) Not applicable.
Item 32. Location of Accounts and Records
All accounts, books and other documents required to be maintained by Section 31(a) of the 1940 Act and the rules promulgated there under are maintained at the Registrant’s home office, 730 Third Avenue, New York, New York 10017, and at other offices of the Registrant located at 8500 Andrew Carnegie Boulevard, Charlotte, North Carolina 28262. In addition, certain duplicated records are maintained at Iron Mountain 22 Kimberly Road East Brunswick, NJ 08816, 64 Leone Lane, Chester, New York, 10918, 11333 East 53 Street, Denver, CO 80239, State Street Bank and Trust Company 801 Pennsylvania, Kansas City, MO 64105; JPMorgan Chase Bank, 4 Chase Metrotech Center Brooklyn, NY 11245 and McCamish Systems LLC, Storage of Documents: Iron Mountain, 660 Distribution Drive, Atlanta, GA 30336, Storage of Electronic Data: Quality Technology Services, 300 Satellite Blvd, Suwanee, GA 30024.
Item 33. Management Services
Not applicable.
C-11
Table of Contents
Item 34. Fee Representation
Teachers Insurance and Annuity Association of America. (“TIAA”) hereby represents that the fees and charges deducted under the Contracts, in the aggregate, are reasonable in relation to the services rendered, the expenses to be incurred, and the risks assumed by TIAA.
TIAA represents that the No-Action Letters issued by the Staff of the Division of Investment Management on November 28, 1988 to the American Council of Life Insurance and August 30, 2012 to ING Life Insurance Company are being relied upon, and that the terms of those No-Action positions have been complied with.
C-12
Table of Contents
SIGNATURES
Pursuant to the requirements of the Securities Act of 1933 and the Investment Company Act of 1940, the Teachers Insurance and Annuity Association of America certifies that it meets all of the requirements for effectiveness of this registration statement under rule 485(b) under the Securities Act and has duly caused this registration statement to be signed on its behalf by the undersigned, duly authorized, in the City of New York, and State of New York on the 28th of April, 2026.
| TIAA SEPARATE ACCOUNT VA-5 | ||
| By: | Teachers Insurance and Annuity Association of America (Registrant) | |
| By: | /s/ Colbert Narcisse | |
| Name: Colbert Narcisse | ||
| Title: Chief Product Officer, Head of Insurance Solutions and New Markets | ||
| TEACHERS INSURANCE AND ANNUITY ASSOCIATION OF AMERICA (Depositor) | ||
| By: | /s/ Colbert Narcisse | |
| Name: Colbert Narcisse | ||
| Title: Chief Product Officer, Head of Insurance Solutions and New Markets | ||
Pursuant to the requirements of the Securities Act of 1933, this registration statement has been signed below by the following persons on April 28, 2026 in the capacities and on the dates indicated.
C-16
Table of Contents
| Signature |
Title | |
| /s/ Colbert Narcisse Colbert Narcisse |
Chief Product Officer, Head of Insurance Solutions and New Markets | |
| /s/ Christopher Baraks |
Senior Vice President and Chief Accounting Officer and Corporate | |
| Christopher Baraks | Controller, TIAA (Principal Financial Officer and Principal Accounting Officer) | |
| SIGNATURE OF TRUSTEE | SIGNATURE OF TRUSTEE | |
| * |
* | |
| Priya Abani | Edward M. Hundert | |
| * |
* | |
| Samuel R. Bright | Gina L. Loften | |
| * |
* | |
| Jason E. Brown | Ramona E. Romero | |
| * |
* | |
| Jeffrey R. Brown | Kim M. Sharan | |
| * |
* | |
| Angel Cabrera | La June Montgomery Tabron | |
| * |
||
| James R. Chambers | ||
| * |
||
| Thasunda Brown Duckett | ||
| * |
||
| Michael R. Fanning | ||
| * |
||
| Lisa W. Hess | ||
| /s/ Deirdre Hykal | ||
| Deirdre Hykal Attorney-in-fact | ||
| * | Signed by Deirdre Hykal as attorney-in-fact pursuant to powers of attorney effective as of December 10 - 11, 2025. |
C-17
Table of Contents
Exhibit Index
| (k) | Legal Opinion. | |
| (A) Opinion and consent of Dierdre Hykal, Esquire | ||
| (I) | Other Consents. | |
| (A) Consent of Carlton Fields, P.A. | ||
| (B) Consent of PricewaterhouseCoopers LLP, Independent Registered Public Accounting Firm. | ||
| (j) | Other Material Contracts | |
| (J) Merger Endorsement. | ||