Performance Management - Government Money Market Funds-Capital Class
Jan. 31, 2026
The following information provides some indication of the risks of investing in the Fund by showing changes in the Fund’s performance from year to year. Past performance is no guarantee of future results. Current month-end performance is available on the Fund’s website at allspringglobal.com. To obtain a current 7-day yield for the Fund call toll-free 1-800-222-8222.
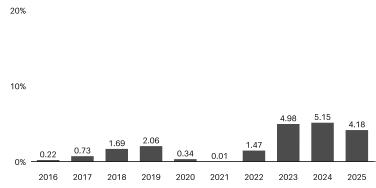
Highest Quarter:
December 31, 2023
December 31, 2023
+1.32%
Lowest Quarter:
March 31, 2021
March 31, 2021
0.00%
Year-to-date total return as of March 31, 2026 is +0.88
|
Average Annual Total Returns for the periods ended 12/31/20251
|
||||
|
|
INCEPTION DATE OF SHARE CLASS
|
1 YEAR
|
5 YEAR
|
10 YEAR
|
|
Capital Class
|
4/30/2026
|
4.18%
|
3.14%
|
2.07%
|
The following information provides some indication of the risks of investing in the Fund by showing changes in the Fund’s performance from year to year. Past performance is no guarantee of future results. Current month-end performance is available on the Fund’s website at allspringglobal.com. To obtain a current 7-day yield for the Fund call toll-free 1-800-222-8222.

Highest Quarter:
December 31, 2023
December 31, 2023
+1.32%
Lowest Quarter:
March 31, 2021
March 31, 2021
0.00%
Year-to-date total return as of March 31, 2026 is +0.88
|
Average Annual Total Returns for the periods ended 12/31/20251
|
||||
|
|
INCEPTION DATE OF SHARE CLASS
|
1 YEAR
|
5 YEAR
|
10 YEAR
|
|
Capital Class
|
4/30/2026
|
4.16%
|
3.13%
|
2.06%
|
The following information provides some indication of the risks of investing in the Fund by showing changes in the Fund’s performance from year to year. Past performance is no guarantee of future results. Current month-end performance is available on the Fund’s website at allspringglobal.com. To obtain a current 7-day yield for the Fund call toll-free 1-800-222-8222.

Highest Quarter:
December 31, 2023
December 31, 2023
+1.33%
Lowest Quarter:
March 31, 2021
March 31, 2021
0.00%
Year-to-date total return as of March 31, 2026 is +0.87%
|
Average Annual Total Returns for the periods ended 12/31/20251
|
||||
|
|
INCEPTION DATE OF SHARE CLASS
|
1 YEAR
|
5 YEAR
|
10 YEAR
|
|
Capital Class
|
4/30/2026
|
4.16%
|
3.11%
|
2.04%
|
| [1] |
|
||
| [2] |
|
||
| [3] |
|