Pay vs Performance Disclosure - USD ($)
Dec. 31, 2025
Dec. 31, 2024
Dec. 31, 2023
PAY VERSUS PERFORMANCE
In 2022, the SEC released its final rules requiring that the “pay versus performance” disclosure codified in the Dodd-Frank Act of 2010 be provided by companies filing proxy and information statements regarding executive compensation. The rules require a disclosure of “compensation actually paid” to the principal executive officer (“PEO”) and named executive officers (“NEOs”) other than the PEO, as well certain other required disclosure. Compensation “actually paid” has a specific formula set forth in the rules.
The following table sets forth such pay versus performance information:
Year | Summary Compensation Table Total for PEO(1) | Compensation Actually Paid to PEO(4) | Average Summary Compensation Table for Non-PEO NEOs(1) | Average Compensation Actually Paid to Non-PEO NEOs(4) | Total Shareholder Return of Fixed $100 Investment(2) | Net Income (Loss)(3) | ||||||||||||
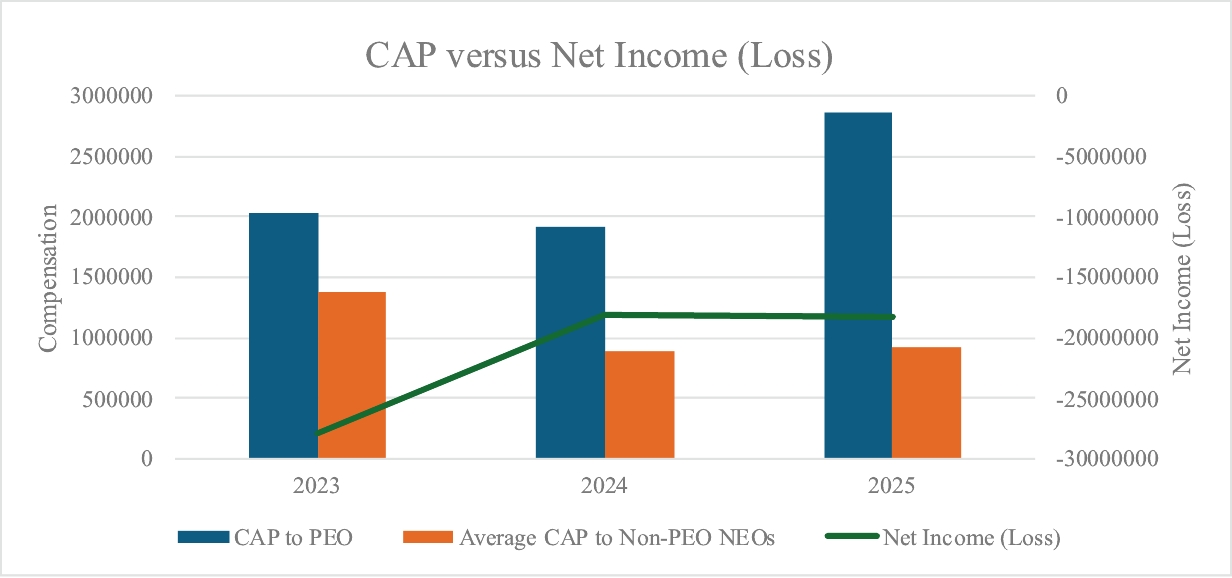
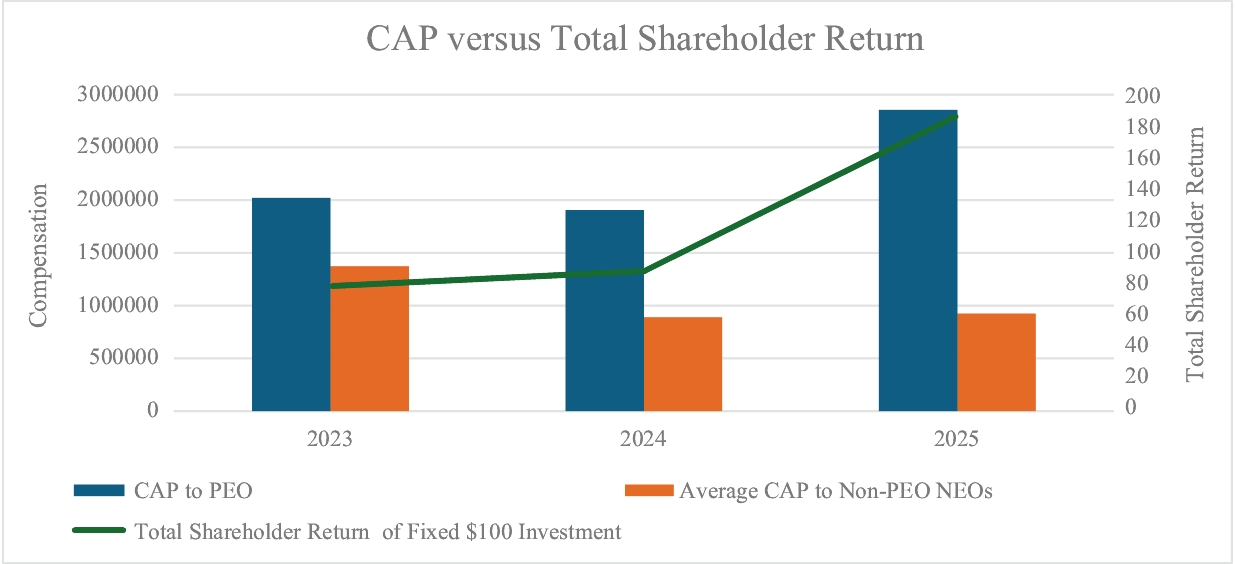
2025 | $2,571,777 | $2,857,038 | $842,092 | $924,033 | $187.74 | $(18,225,000) | ||||||||||||
2024 | $1,795,746 | $1,906,614 | $832,088 | $890,040 | $88.30 | $(18,175,000) | ||||||||||||
2023 | $2,099,250 | $2,022,706 | $1,420,834 | $1,372,990 | $78.74 | $(27,871,000) | ||||||||||||
(1) | PEO for 2025, 2024, and 2023: Kendall Larsen. |
Non-PEO NEOs for 2025, 2024 and 2023: Robert D. Short III, Ph.D., former Chief Scientist, and Katherine Allanson, Chief Financial Officer.
(2) | Total Shareholder Return (“TSR”) is cumulative for the measurement periods beginning on December 31, 2022 and ending on December 31, 2025, 2024, and 2023, calculated in accordance with Item 201(e) of Regulation S-K. |
(3) | Net Income (Loss) for each year as set forth in our Consolidated Statements of Operations in our Annual Report on Form 10-K for each applicable year. |
(4) | The following table sets forth a reconciliation of the total compensation reflected in the summary compensation table to the compensation actually paid to the PEO and non-PEO NEOs: |
2025 | 2024 | 2023 | ||||||||||||||||
Adjustments | PEO | Average Non-PEO NEOs | PEO | Average Non-PEO NEOs | PEO | Average Non-PEO NEOs | ||||||||||||
Total Compensation from Summary Compensation Table | $2,571,777 | $842,092 | $1,795,746 | $832,088 | $2,099,250 | $1,420,834 | ||||||||||||
Less: Current year stock and option award grants in Summary Compensation Table | $(1,011,000) | $(303,300) | $(295,000) | $(182,200) | $(27,024) | $(13,512) | ||||||||||||
Add fair value of unvested awards granted in current year | $632,740 | $189,822 | $392,500 | $235,500 | $17,654 | $8,817 | ||||||||||||
Change in fair value of unvested awards granted in prior years | $350,853 | $102,555 | $7,566 | $2,972 | $(37,762) | $(25,009) | ||||||||||||
Change in fair value of awards vesting in current year, granted in prior years | $312,667 | $92,864 | $5,802 | $1,680 | $(31,460) | $(19,166) | ||||||||||||
Add: fair value of awards granted in and vested in current year | $— | $— | $— | $— | $2,048 | $1,026 | ||||||||||||
$2,857,038 | $924,033 | $1,906,614 | $890,040 | $2,022,706 | $1,372,990 | |||||||||||||
(1) | PEO for 2025, 2024, and 2023: Kendall Larsen. |
Non-PEO NEOs for 2025, 2024 and 2023: Robert D. Short III, Ph.D., former Chief Scientist, and Katherine Allanson, Chief Financial Officer.
(4) | The following table sets forth a reconciliation of the total compensation reflected in the summary compensation table to the compensation actually paid to the PEO and non-PEO NEOs: |
2025 | 2024 | 2023 | ||||||||||||||||
Adjustments | PEO | Average Non-PEO NEOs | PEO | Average Non-PEO NEOs | PEO | Average Non-PEO NEOs | ||||||||||||
Total Compensation from Summary Compensation Table | $2,571,777 | $842,092 | $1,795,746 | $832,088 | $2,099,250 | $1,420,834 | ||||||||||||
Less: Current year stock and option award grants in Summary Compensation Table | $(1,011,000) | $(303,300) | $(295,000) | $(182,200) | $(27,024) | $(13,512) | ||||||||||||
Add fair value of unvested awards granted in current year | $632,740 | $189,822 | $392,500 | $235,500 | $17,654 | $8,817 | ||||||||||||
Change in fair value of unvested awards granted in prior years | $350,853 | $102,555 | $7,566 | $2,972 | $(37,762) | $(25,009) | ||||||||||||
Change in fair value of awards vesting in current year, granted in prior years | $312,667 | $92,864 | $5,802 | $1,680 | $(31,460) | $(19,166) | ||||||||||||
Add: fair value of awards granted in and vested in current year | $— | $— | $— | $— | $2,048 | $1,026 | ||||||||||||
$2,857,038 | $924,033 | $1,906,614 | $890,040 | $2,022,706 | $1,372,990 | |||||||||||||
Compensation Actually Paid versus Total Shareholder Return
The following chart sets forth the relationship between CAP to our PEO, the average of CAP to our Non-PEO NEOs, and our Total Shareholder Return during the three most recently completed fiscal years:
Compensation Actually Paid versus Net Income (Loss)
The following chart sets forth the relationship between Compensation Actually Paid (“CAP”) to our PEO, the average of CAP to our Non-PEO NEOs, and our Net Income (Loss) during the three most recently completed fiscal years: