The following bar chart and table provide an indication of the risks of investing in the Portfolio. The bar chart shows changes in the Portfolio’s performance from year to year for the past 10 years. The table compares the Portfolio’s average annual total returns to broad measure of market performance. These figures do not reflect charges assessed at the contract or separate account level. If any such charges were included, returns would be lower. The Portfolio’s past performance is not necessarily an indication of how the Portfolio will perform in the future.
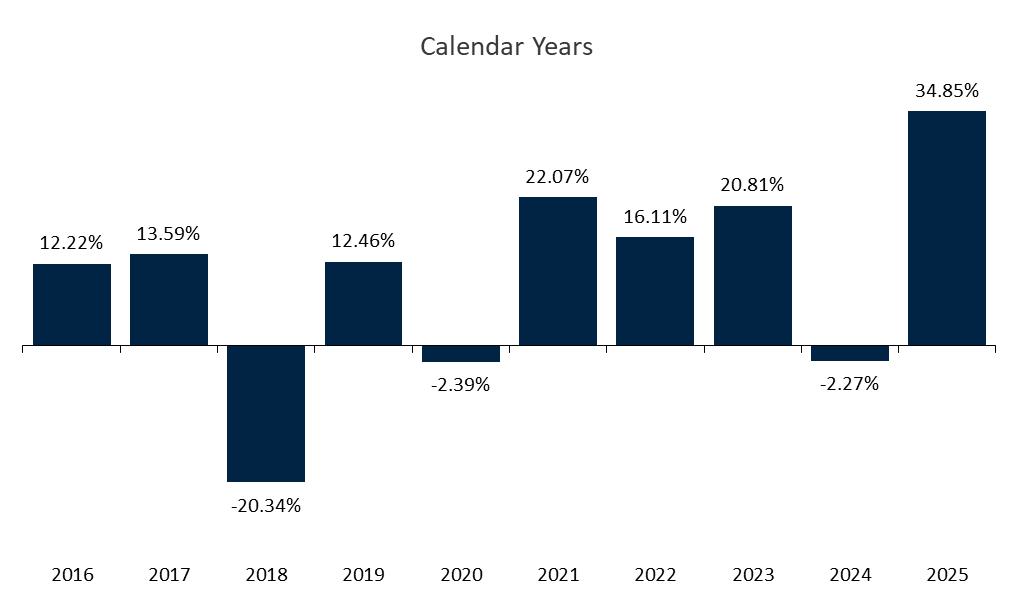
During the period shown in the above bar chart, the highest return for a quarter was 27.36% (quarter ended December 31, 2020) and the lowest return for a quarter was (40.25)% (quarter ended March 31, 2020).
|
Average Annual Total Returns for the periods ending 12/31/25 |
One Year | Five Years | Ten Years |
Since Inception (9/21/1999) |
||||||||||||
| Third Avenue Value Portfolio | 34.85 | % | 17.68 | % | 9.66 | % | 8.67 | % | ||||||||
| MSCI World Index (reflects no deductions for fees, expenses or taxes)1 | 21.60 | % | 12.66 | % | 12.74 | % | 7.41 | % | ||||||||
| 1 | An index is a hypothetical measure of performance based on the ups and downs in the values of securities representative of a particular market. The MSCI World Index is captures large and mid-cap representation across 23 Developed Markets countries. With 1,320 constituents, the MSCI World Index covers approximately 85% of the free float-adjusted market capitalization in each country. The MSCI World Index is not a security that can be purchased or sold, and its total returns are reflective of unmanaged portfolios. It is not possible to invest directly in an unmanaged index. |