Pure in Millions
PAY VERSUS PERFORMANCE
As required by Section 953(a) of the Dodd-Frank Wall Street Reform and Consumer Protection Act, and Item 402(v) of Regulation S-K, we are providing the following information about the relationship between “compensation actually paid” to our CEO and on average to our non-CEO NEOs during the specified years alongside total shareholder return and net income metrics, as well as a Company-selected measure of earnings before interest, taxes, depreciation and amortization (EBITDA). The Company selected this measure as the most important in linking compensation actually paid to our NEOs for 2025 to Company performance, as EBITDA was the predominate metric used in our 2025 short-term and long-term incentive programs. Compensation actually paid, as determined under SEC requirements, does not reflect the actual amount of compensation earned by or paid to our NEOs during a covered year. For further information concerning the Company’s pay-for-performance philosophy and how the Company aligns executive compensation with the Company’s performance, refer to the “Compensation Discussion and Analysis” section of this proxy statement.
|
Value of Initial Fixed $100 Investment Based On: |
||||||||||||||||||||||||||||
|
Year |
Summary Compensation Table Total For CEO(1) ($) |
Compensation Actually Paid to CEO(2) ($) |
Average Summary Compensation Table Total for Non-CEO NEOs(3) ($) |
Average Compensation Actually Paid To Non-CEO NEOs(2) ($) |
Company Total Shareholder Return(4) ($) |
Peer Group TSR(5) ($) |
Net Income (Loss) ($ millions) |
EBITDA(6) ($ millions) |
||||||||||||||||||||
|
2025 |
3,396,235 | 4,972,639 | 939,540 | 1,104,034 | 1,299 | 103 | 52.2 | 81.4 | ||||||||||||||||||||
|
2024 |
2,876,263 | 5,779,622 | 909,018 | 1,273,559 | 906 | 106 | 51.8 | 81.1 | ||||||||||||||||||||
|
2023 |
3,617,080 | 2,163,496 | 1,519,575 | 1,309,978 | 474 | 93 | 52.8 | 79.1 | ||||||||||||||||||||
|
2022 |
3,823,403 | 7,868,370 | 1,312,100 | 1,677,718 | 474 | 89 | 48.0 | 74.4 | ||||||||||||||||||||
|
2021 |
3,228,539 | 11,377,602 | 1,236,035 | 2,267,001 | 340 | 98 | 47.3 | 63.0 | ||||||||||||||||||||
|
(1) |
Ms. John served as the Company’s President and Chief Executive Officer for each year shown. Reported amounts reflect corrections made to 401(k) matching contributions in fiscal 2022 and fiscal 2023. |
| (2) |
Amounts reported in this column are based on total compensation reported for our CEO and average total compensation reported for our non-CEO NEOs in the Summary Compensation Table (“SCT”) for the indicated fiscal years and adjusted as shown in the table below to determine the compensation actually paid as calculated in accordance with the requirements of Item 402(v) of Regulation S-K. The fair value of equity awards was computed in accordance with the Company’s methodology used for financial reporting purposes. |
|
Position |
Year |
SCT Total Compensation (i) ($) |
Minus SCT Equity Awards Total (ii) ($) |
Plus Fair Value of Current Year Equity Awards Unvested at Year End (iii) (iv) ($) |
Plus Change in Fair Value of Unvested Prior Year Equity Awards (iv) (v) ($) |
Plus Change in Fair Value of Prior Year Equity Awards Vested in Current Year (vi) ($) |
Minus Change in Fair Value of Stock Awards Granted in Prior Years That Failed to Vest in Year |
Equals Compensation Actually Paid
($) |
|||||||||||||||||||||
|
2025 |
3,396,235 | 1,580,077 | 2,885,042 | 681,703 | (410,264 | ) | 4,972,639 | ||||||||||||||||||||||
|
2024 |
2,876,263 | 1,350,003 | 1,771,514 | 1,486,763 | 995,085 | 5,779,622 | |||||||||||||||||||||||
|
CEO |
2023 |
3,617,080 | 1,350,038 | 615,579 | (448,215 | ) | (270,909 | ) | 2,163,496 | ||||||||||||||||||||
|
2022 |
3,823,403 | 1,250,002 | 1,703,128 | 3,300,766 | 291,075 | 7,868,370 | |||||||||||||||||||||||
|
2021 |
3,228,539 | 812,505 | 2,628,961 | 5,455,036 | 877,571 | 11,377,602 | |||||||||||||||||||||||
|
2025 |
939,540 | 304,608 | 529,176 | 80,515 | (58,499 | ) | 82,091 | 1,104,034 | |||||||||||||||||||||
|
Non- |
2024 |
909,018 | 295,675 | 402,465 | 196,028 | 61,722 | 1,273,559 | ||||||||||||||||||||||
|
2023 |
1,519,575 | 300,044 | 176,379 | (60,177 | ) | (25,754 | ) | 1,309,978 | |||||||||||||||||||||
|
CEO |
2022 |
1,312,100 | 299,983 | 406,798 | 205,726 | 53,077 | 1,677,718 | ||||||||||||||||||||||
|
NEOs |
2021 |
1,236,035 | 150,001 | 315,475 | 526,052 | 339,439 | 2,267,001 | ||||||||||||||||||||||
|
(i) |
Includes dividends accrued on unvested time-based restricted stock awards. |
|
|
(ii) |
For the CEO, represents the total of the amounts reported in the “Stock Awards” column of the SCT and for the non-CEO NEOs, represents the average total of the amounts reported in the “Stock Awards” column of the SCT, as the grant date fair value of equity awards granted in the applicable year. |
|
|
(iii) |
For the CEO, represents the total fair value and for the non-CEO NEOs, represents the average total fair value as of the end of the applicable year of awards granted during the applicable year that remain unvested as of the end of the applicable fiscal year. |
|
|
(iv) |
Fair value of performance-based restricted stock with unsatisfied performance conditions as of the applicable measurement date also reflects the probable outcome of the applicable performance conditions as of that date. |
|
|
(v) |
Changes in fair value are measured by comparing fair value as of the end of the applicable year to the fair value as of the end of the prior year. |
|
|
(vi) |
Changes in fair value are measured by comparing fair value at vesting to the fair value as of the end of the prior year. |
|
(3) |
The non-CEO NEOs for fiscal 2025 were Messrs. Hurt, Todorovic, Fencl and Henderson, whose employment with the Company began on September 16, 2024. Mr. Fencl’s employment as an NEO of the Company terminated effective on August 4, 2025, and Mr. Fundler was employed as an NEO beginning August 4, 2025. The non-CEO NEOs for fiscal 2024, 2023, 2022,and 2021 were Mr. Hurt and Jennifer Kretchmar, whose employment with the Company terminated effective at the end of fiscal 2023. Reported amounts reflect corrections made to 401(k) matching contributions in fiscal 2022 and fiscal 2023. |
|
(4) |
Represents the cumulative total stockholder return (“TSR”) for an initial investment of $100 in the Company’s common stock over a five-year period beginning on February 1, 2021 and ending on February 1, 2026. |
|
(5) |
Represents the cumulative TSR of the Russell 2000 Consumer Discretionary Index, which is an industry line peer group reported in the performance graph included in the Company’s 2024 Annual Report on Form 10-K, over a five-year period beginning on February 1, 2021 and ending on February 1, 2026. |
|
(6) |
For additional information on EBITDA, see Appendix A. |
|
Position |
Year |
SCT Total Compensation (i) ($) |
Minus SCT Equity Awards Total (ii) ($) |
Plus Fair Value of Current Year Equity Awards Unvested at Year End (iii) (iv) ($) |
Plus Change in Fair Value of Unvested Prior Year Equity Awards (iv) (v) ($) |
Plus Change in Fair Value of Prior Year Equity Awards Vested in Current Year (vi) ($) |
Minus Change in Fair Value of Stock Awards Granted in Prior Years That Failed to Vest in Year |
Equals Compensation Actually Paid
($) |
|||||||||||||||||||||
|
2025 |
3,396,235 | 1,580,077 | 2,885,042 | 681,703 | (410,264 | ) | 4,972,639 | ||||||||||||||||||||||
|
2024 |
2,876,263 | 1,350,003 | 1,771,514 | 1,486,763 | 995,085 | 5,779,622 | |||||||||||||||||||||||
|
CEO |
2023 |
3,617,080 | 1,350,038 | 615,579 | (448,215 | ) | (270,909 | ) | 2,163,496 | ||||||||||||||||||||
|
2022 |
3,823,403 | 1,250,002 | 1,703,128 | 3,300,766 | 291,075 | 7,868,370 | |||||||||||||||||||||||
|
2021 |
3,228,539 | 812,505 | 2,628,961 | 5,455,036 | 877,571 | 11,377,602 | |||||||||||||||||||||||
|
2025 |
939,540 | 304,608 | 529,176 | 80,515 | (58,499 | ) | 82,091 | 1,104,034 | |||||||||||||||||||||
|
Non- |
2024 |
909,018 | 295,675 | 402,465 | 196,028 | 61,722 | 1,273,559 | ||||||||||||||||||||||
|
2023 |
1,519,575 | 300,044 | 176,379 | (60,177 | ) | (25,754 | ) | 1,309,978 | |||||||||||||||||||||
|
CEO |
2022 |
1,312,100 | 299,983 | 406,798 | 205,726 | 53,077 | 1,677,718 | ||||||||||||||||||||||
|
NEOs |
2021 |
1,236,035 | 150,001 | 315,475 | 526,052 | 339,439 | 2,267,001 | ||||||||||||||||||||||
|
(i) |
Includes dividends accrued on unvested time-based restricted stock awards. |
|
|
(ii) |
For the CEO, represents the total of the amounts reported in the “Stock Awards” column of the SCT and for the non-CEO NEOs, represents the average total of the amounts reported in the “Stock Awards” column of the SCT, as the grant date fair value of equity awards granted in the applicable year. |
|
|
(iii) |
For the CEO, represents the total fair value and for the non-CEO NEOs, represents the average total fair value as of the end of the applicable year of awards granted during the applicable year that remain unvested as of the end of the applicable fiscal year. |
|
|
(iv) |
Fair value of performance-based restricted stock with unsatisfied performance conditions as of the applicable measurement date also reflects the probable outcome of the applicable performance conditions as of that date. |
|
|
(v) |
Changes in fair value are measured by comparing fair value as of the end of the applicable year to the fair value as of the end of the prior year. |
|
|
(vi) |
Changes in fair value are measured by comparing fair value at vesting to the fair value as of the end of the prior year. |
|
(3) |
The non-CEO NEOs for fiscal 2025 were Messrs. Hurt, Todorovic, Fencl and Henderson, whose employment with the Company began on September 16, 2024. Mr. Fencl’s employment as an NEO of the Company terminated effective on August 4, 2025, and Mr. Fundler was employed as an NEO beginning August 4, 2025. The non-CEO NEOs for fiscal 2024, 2023, 2022,and 2021 were Mr. Hurt and Jennifer Kretchmar, whose employment with the Company terminated effective at the end of fiscal 2023. Reported amounts reflect corrections made to 401(k) matching contributions in fiscal 2022 and fiscal 2023. |
|
(4) |
Represents the cumulative total stockholder return (“TSR”) for an initial investment of $100 in the Company’s common stock over a five-year period beginning on February 1, 2021 and ending on February 1, 2026. |
|
(5) |
Represents the cumulative TSR of the Russell 2000 Consumer Discretionary Index, which is an industry line peer group reported in the performance graph included in the Company’s 2024 Annual Report on Form 10-K, over a five-year period beginning on February 1, 2021 and ending on February 1, 2026. |
|
(6) |
For additional information on EBITDA, see Appendix A. |
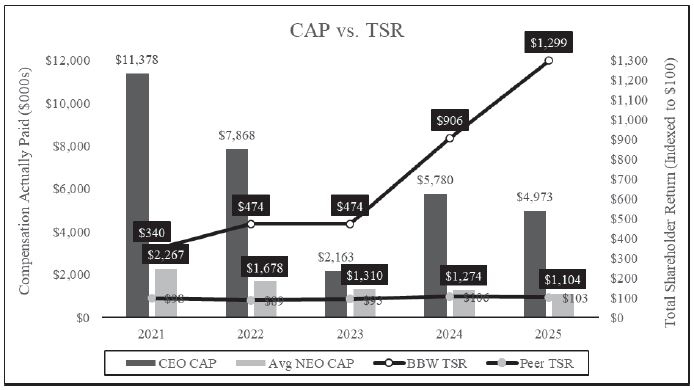
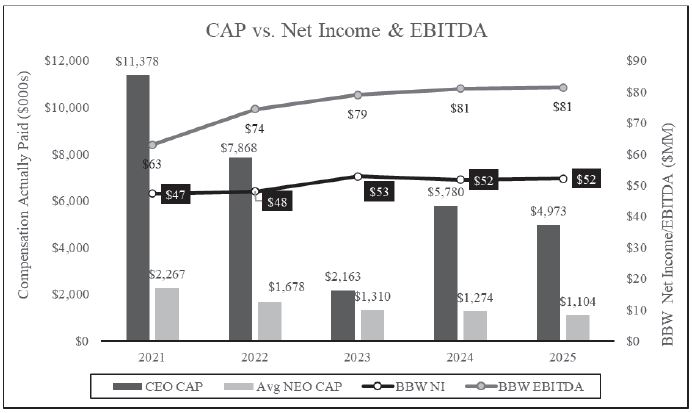
The charts below describe the relationship between compensation actually paid (“CAP”) to our CEO and to our non-CEO NEOs (as calculated above) and our TSR and financial performance as measured by our reported Net Income and EBITDA for the indicated years.
Most Important Performance Measures
In the Company’s assessment, the two items listed below represent the most important financial performance measures used by the Company to link compensation actually paid to our NEOs, for the most recently completed fiscal year, to Company performance. Please see the “Compensation Discussion and Analysis” section of this proxy statement for more information and Appendix A for an explanation of EBITDA.
|
EBITDA |
|
Total Revenues |