Pay vs Performance Disclosure - USD ($)
|
12 Months Ended |
Dec. 31, 2025 |
Dec. 31, 2024 |
Dec. 31, 2023 |
| Pay vs Performance Disclosure [Table] |
|
|
|
|
| Pay vs Performance [Table Text Block] |
|
| Year | |
Summary
Compensation Table Total for CEO 1 (1) (2) | | |
Compensation
Actually Paid to CEO 1(1) (3) | |
| Summary Compensation Table Total for CEO 2 (1)
(2)
|
|
|
Compensation Actually Paid to CEO 2 (1) (3)
|
|
|
Summary Compensation Table Total for CEO 3 (1)
(2)
|
|
|
Compensation Actually Paid to CEO 3 (1) (3)
|
|
|
Aggregate
Summary Compensation Table Total for Non-CEO NEOs (1) (2)
| | |
Aggregate
Compensation Actually Paid to Non-CEO NEOs(1) (3) | | |
Value
of initial fixed $100 investment based on total shareholder return (TSR) (4)
| | |
Net
Loss
(in thousands) (5) | |
| 2025 | |
$ | 470,785 | | |
$ | 50,536 | |
| $ |
66,250 |
|
|
$ |
66,250 |
|
|
$ |
847,436 |
|
|
$ |
847,436 |
|
|
$ | 784,968 | | |
$ | 504,968 | | |
$ | 0.06 | | |
$ | (2,998 | ) |
| 2024 | |
$ | - | | |
$ | - | |
| $ |
- |
|
|
$ |
- |
|
|
$ |
585,000 |
|
|
$ |
547,706 |
|
|
$ | 363,988 | | |
$ | 342,889 | | |
$ | 3.76 | | |
$ | (11,212 | ) |
| 2023 | |
$ | - | | |
$ | - | |
| $ |
- |
|
|
$ |
- |
|
|
$ |
661,049 |
|
|
$ |
65,807 |
|
|
$ | 833,233 | | |
$ | 172,676 | | |
$ | 26.69 | | |
$ | (22,555 | ) |
|
|
|
| Named Executive Officers, Footnote [Text Block] |
|
| (1) |
For
the year 2025, CEO 1 was Datuk Dr. Doris Wong Sing Ee, CEO 2 was
Mr. David Lazar and CEO 3 was Mr. Spiro Rombotis. For
years 2024 and 2023, the CEO was Spiro Rombotis. The Non-CEO named executive officers (the “NEOs”) were Mr. Kiu
Cu Seng for 2025, Mr. Paul McBarron for all years and Mark Kirschbaum, MD for 2024 and 2023.
|
|
|
|
| PEO Total Compensation Amount |
|
|
$ 585,000
|
$ 661,049
|
| PEO Actually Paid Compensation Amount |
|
|
547,706
|
65,807
|
| Adjustment To PEO Compensation, Footnote [Text Block] |
|
| (5) |
The
dollar amounts reported represent the amount of net loss reflected in the Company’s audited financial statements for the applicable
year. |
| | |
Fiscal Year 2025 | | |
Fiscal Year 2024 | | |
Fiscal Year 2023 | |
| | |
CEO 1 | | |
CEO 2 |
|
|
CEO 3 |
|
|
NON- CEO NEO’s | | |
CEO | | |
NON- CEO NEO’s | | |
CEO | | |
NON- CEO NEO’s | |
| SCT Total Compensation | |
| 470,785 | | |
|
66,250 |
|
|
|
847,436 |
|
|
| 784,968 | | |
| 585,000 | | |
| 363,988 | | |
| 661,049 | | |
| 833,233 | |
| Subtract Reported SCT Stock Option Award Value ($) | |
| (420,249 | ) | |
|
0 |
|
|
|
0 |
|
|
| (280,000 | ) | |
| 0 | | |
| 0 | | |
| (100,421 | ) | |
| (118,167 | ) |
| Add Year-end Fair Value of Unvested Awards Granted in the Applicable Fiscal Year ($) | |
| 0 | | |
|
0 |
|
|
|
0 |
|
|
| 0 | | |
| 0 | | |
| 0 | | |
| 21,961 | | |
| 26,051 | |
| Add Change in Fair Value of Awards Granted in Prior Years Outstanding and Unvested as of the Applicable Fiscal Year End ($) | |
| 0 | | |
|
0 |
|
|
|
0 |
|
|
| 0 | | |
| (21,986 | ) | |
| (13,042 | ) | |
| (164,307 | ) | |
| (172,971 | ) |
| Add Change in Fair Value of Awards Granted in Prior Years that Vested during the Applicable Year as of the Vesting Date | |
| 0 | | |
|
0 |
|
|
|
0 |
|
|
| 0 | | |
| (15,308 | ) | |
| (8,057 | ) | |
| (352,475 | ) | |
| (395,470 | ) |
| Total Compensation Actually Paid | |
| 50,536 | | |
|
66,250 |
|
|
|
847,436 |
|
|
| 504,968 | | |
| 547,706 | | |
| 342,889 | | |
| 65,807 | | |
| 172,676 | |
|
|
|
| Non-PEO NEO Average Total Compensation Amount |
[1] |
$ 784,968
|
363,988
|
833,233
|
| Non-PEO NEO Average Compensation Actually Paid Amount |
[2] |
$ 504,968
|
342,889
|
172,676
|
| Compensation Actually Paid vs. Total Shareholder Return [Text Block] |
|
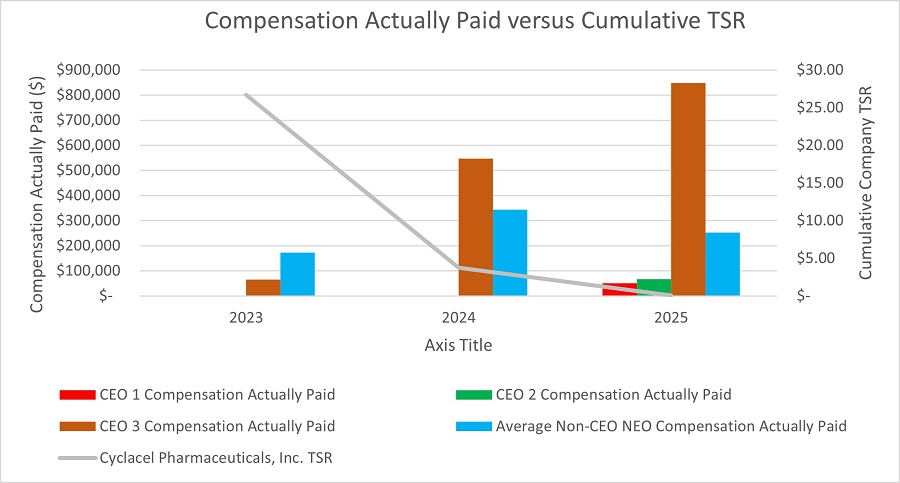
Relationship
Between CEO and Non-CEO NEO Compensation Actually Paid and Company Total Shareholder Return (“TSR”)
The
following chart sets forth the relationship between Compensation Actually Paid to our CEO, the average of Compensation Actually Paid
to our Non-CEO NEOs, and the Company’s cumulative TSR over the three most recently completed fiscal years.
|
|
|
| Compensation Actually Paid vs. Net Income [Text Block] |
|
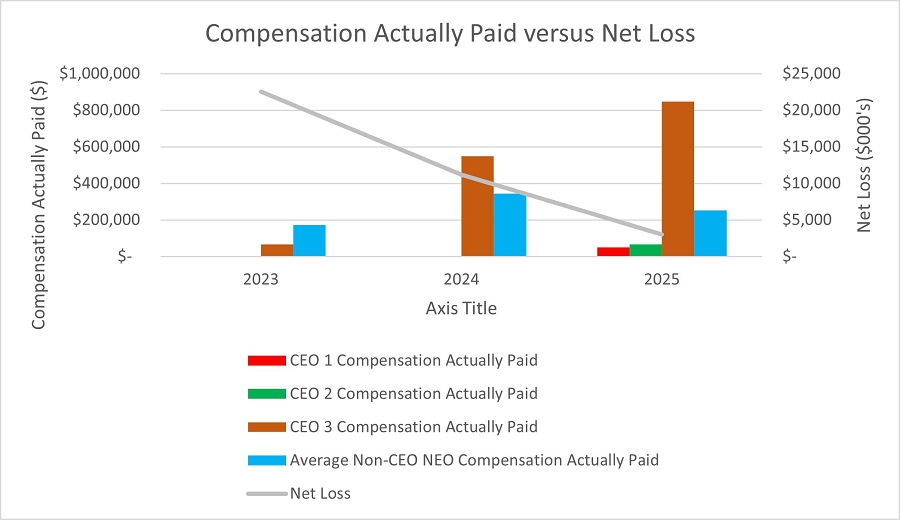
Relationship
Between CEO and Non-CEO NEO Compensation Actually Paid and Net Income (Loss)
The
following chart sets forth the relationship between Compensation Actually Paid to our CEO, the average of Compensation Actually Paid
to our Non-CEO NEOs, and our Net Income (Loss) during the three most recently completed fiscal years.
|
|
|
| Total Shareholder Return Amount |
[3] |
$ 0.06
|
3.76
|
26.69
|
| Net Income (Loss) Attributable to Parent |
[4] |
(2,998,000)
|
(11,212,000)
|
(22,555,000)
|
| Datuk Dr. Doris Wong Sing Ee [Member] |
|
|
|
|
| Pay vs Performance Disclosure [Table] |
|
|
|
|
| PEO Total Compensation Amount |
[1] |
470,785
|
|
|
| PEO Actually Paid Compensation Amount |
[2] |
50,536
|
|
|
| Datuk Dr. Doris Wong Sing Ee [Member] | Reported SCT Stock Option Award Value [Member] |
|
|
|
|
| Pay vs Performance Disclosure [Table] |
|
|
|
|
| Adjustment to Compensation Amount |
|
(420,249)
|
|
|
| Datuk Dr. Doris Wong Sing Ee [Member] | Year-end Fair Value of Unvested Awards Granted in the Applicable Fiscal Year [Member] |
|
|
|
|
| Pay vs Performance Disclosure [Table] |
|
|
|
|
| Adjustment to Compensation Amount |
|
0
|
|
|
| Datuk Dr. Doris Wong Sing Ee [Member] | Change in Fair Value of Awards Granted in Prior Years Outstanding and Unvested as of the Applicable Fiscal Year End [Member] |
|
|
|
|
| Pay vs Performance Disclosure [Table] |
|
|
|
|
| Adjustment to Compensation Amount |
|
0
|
|
|
| Datuk Dr. Doris Wong Sing Ee [Member] | Change in Fair Value of Awards Granted in Prior Years that Vested during the Applicable Year as of the Vesting Date [Member] |
|
|
|
|
| Pay vs Performance Disclosure [Table] |
|
|
|
|
| Adjustment to Compensation Amount |
|
0
|
|
|
| Mr. David Lazar [Member] |
|
|
|
|
| Pay vs Performance Disclosure [Table] |
|
|
|
|
| PEO Total Compensation Amount |
[1] |
66,250
|
|
|
| PEO Actually Paid Compensation Amount |
[2] |
66,250
|
|
|
| Mr. David Lazar [Member] | Reported SCT Stock Option Award Value [Member] |
|
|
|
|
| Pay vs Performance Disclosure [Table] |
|
|
|
|
| Adjustment to Compensation Amount |
|
0
|
|
|
| Mr. David Lazar [Member] | Year-end Fair Value of Unvested Awards Granted in the Applicable Fiscal Year [Member] |
|
|
|
|
| Pay vs Performance Disclosure [Table] |
|
|
|
|
| Adjustment to Compensation Amount |
|
0
|
|
|
| Mr. David Lazar [Member] | Change in Fair Value of Awards Granted in Prior Years Outstanding and Unvested as of the Applicable Fiscal Year End [Member] |
|
|
|
|
| Pay vs Performance Disclosure [Table] |
|
|
|
|
| Adjustment to Compensation Amount |
|
0
|
|
|
| Mr. David Lazar [Member] | Change in Fair Value of Awards Granted in Prior Years that Vested during the Applicable Year as of the Vesting Date [Member] |
|
|
|
|
| Pay vs Performance Disclosure [Table] |
|
|
|
|
| Adjustment to Compensation Amount |
|
0
|
|
|
| Mr. Spiro Rombotis [Member] |
|
|
|
|
| Pay vs Performance Disclosure [Table] |
|
|
|
|
| PEO Total Compensation Amount |
[1] |
847,436
|
585,000
|
661,049
|
| PEO Actually Paid Compensation Amount |
[2] |
847,436
|
547,706
|
65,807
|
| Mr. Spiro Rombotis [Member] | Reported SCT Stock Option Award Value [Member] |
|
|
|
|
| Pay vs Performance Disclosure [Table] |
|
|
|
|
| Adjustment to Compensation Amount |
|
0
|
|
|
| Mr. Spiro Rombotis [Member] | Year-end Fair Value of Unvested Awards Granted in the Applicable Fiscal Year [Member] |
|
|
|
|
| Pay vs Performance Disclosure [Table] |
|
|
|
|
| Adjustment to Compensation Amount |
|
0
|
|
|
| Mr. Spiro Rombotis [Member] | Change in Fair Value of Awards Granted in Prior Years Outstanding and Unvested as of the Applicable Fiscal Year End [Member] |
|
|
|
|
| Pay vs Performance Disclosure [Table] |
|
|
|
|
| Adjustment to Compensation Amount |
|
0
|
|
|
| Mr. Spiro Rombotis [Member] | Change in Fair Value of Awards Granted in Prior Years that Vested during the Applicable Year as of the Vesting Date [Member] |
|
|
|
|
| Pay vs Performance Disclosure [Table] |
|
|
|
|
| Adjustment to Compensation Amount |
|
$ 0
|
|
|
| PEO 1 [Member] |
|
|
|
|
| Pay vs Performance Disclosure [Table] |
|
|
|
|
| PEO Name |
|
Datuk Dr. Doris Wong Sing Ee
|
|
|
| PEO 2 [Member] |
|
|
|
|
| Pay vs Performance Disclosure [Table] |
|
|
|
|
| PEO Name |
|
Mr. David Lazar
|
|
|
| PEO 3 [Member] |
|
|
|
|
| Pay vs Performance Disclosure [Table] |
|
|
|
|
| PEO Name |
|
Mr. Spiro Rombotis
|
|
|
| Non-PEO NEO [Member] | Reported SCT Stock Option Award Value [Member] |
|
|
|
|
| Pay vs Performance Disclosure [Table] |
|
|
|
|
| Adjustment to Compensation Amount |
|
$ (280,000)
|
0
|
(118,167)
|
| Non-PEO NEO [Member] | Year-end Fair Value of Unvested Awards Granted in the Applicable Fiscal Year [Member] |
|
|
|
|
| Pay vs Performance Disclosure [Table] |
|
|
|
|
| Adjustment to Compensation Amount |
|
0
|
0
|
26,051
|
| Non-PEO NEO [Member] | Change in Fair Value of Awards Granted in Prior Years Outstanding and Unvested as of the Applicable Fiscal Year End [Member] |
|
|
|
|
| Pay vs Performance Disclosure [Table] |
|
|
|
|
| Adjustment to Compensation Amount |
|
0
|
(13,042)
|
(172,971)
|
| Non-PEO NEO [Member] | Change in Fair Value of Awards Granted in Prior Years that Vested during the Applicable Year as of the Vesting Date [Member] |
|
|
|
|
| Pay vs Performance Disclosure [Table] |
|
|
|
|
| Adjustment to Compensation Amount |
|
$ 0
|
(8,057)
|
(395,470)
|
| PEO [Member] | Reported SCT Stock Option Award Value [Member] |
|
|
|
|
| Pay vs Performance Disclosure [Table] |
|
|
|
|
| Adjustment to Compensation Amount |
|
|
0
|
(100,421)
|
| PEO [Member] | Year-end Fair Value of Unvested Awards Granted in the Applicable Fiscal Year [Member] |
|
|
|
|
| Pay vs Performance Disclosure [Table] |
|
|
|
|
| Adjustment to Compensation Amount |
|
|
0
|
21,961
|
| PEO [Member] | Change in Fair Value of Awards Granted in Prior Years Outstanding and Unvested as of the Applicable Fiscal Year End [Member] |
|
|
|
|
| Pay vs Performance Disclosure [Table] |
|
|
|
|
| Adjustment to Compensation Amount |
|
|
(21,986)
|
(164,307)
|
| PEO [Member] | Change in Fair Value of Awards Granted in Prior Years that Vested during the Applicable Year as of the Vesting Date [Member] |
|
|
|
|
| Pay vs Performance Disclosure [Table] |
|
|
|
|
| Adjustment to Compensation Amount |
|
|
$ (15,308)
|
$ (352,475)
|
|
|