Pay vs Performance Disclosure
number in Thousands
number in Thousands
Dec. 31, 2023
Sep. 07, 2023
Dec. 31, 2025
USD ($)
Dec. 31, 2024
USD ($)
Dec. 31, 2023
USD ($)
Dec. 31, 2022
USD ($)
Dec. 31, 2021
USD ($)
| Year | Summary Compensation Table Total Pay for CEO (1)(2) Bill Sibold | Summary Compensation Table Total Pay for CEO (1)(2) Paul A. Friedman, M.D. | CAP to CEO(3) Bill Sibold | CAP to CEO(3) Paul A. Friedman, M.D. | Average Summary Compensation Table Total Pay for Other NEOs(3) | Average CAP to Other NEOs(3) | Value of Initial Fixed $100 Investment Based on: | GAAP Net Income (Loss)(5) | Net Product Revenue(5) | |||||||||||||||||||||||
Company TSR(4) | Peer Group TSR(4) | |||||||||||||||||||||||||||||||
| 2025 | $19,206,341 | — | $84,097,793 | — | $6,552,974 | $16,559,703 | $524 | $125 | $(288,284) | $958,403 | ||||||||||||||||||||||
| 2024 | $12,214,250 | — | $30,732,575 | — | $5,472,667 | $4,316,451 | $278 | $93 | $(465,892) | $180,100 | ||||||||||||||||||||||
| 2023 | $32,268,400 | $9,563,286 | $42,282,414 | $2,371,068 | $5,592,269 | $(818,864) | $208 | $94 | $(373,630) | — | ||||||||||||||||||||||
| 2022 | — | $5,395,385 | — | $38,419,031 | $4,104,196 | $29,641,482 | $261 | $90 | $(295,250) | — | ||||||||||||||||||||||
| 2021 | — | $5,318,389 | — | $1,210,321 | $4,329,137 | $1,288,115 | $76 | $100 | $(241,846) | — | ||||||||||||||||||||||
CEO (Sibold)
| Year | SCT Total Comp | Minus SCT Equity Awards | Plus Year-End Fair Value of Equity Awards Granted During Year That Remained Unvested as of Last Day of Year | Plus Change in Fair Value from Last Day of Prior Year to Last Day of Year of Unvested Equity Awards | Plus Change in Fair Value from Last Day of Prior Year to Vesting Date of Unvested Equity Awards that Vested During Year | Equals CAP | ||||||||||||||
| 2025 | $19,206,341 | $(16,834,996) | $29,461,864 | $32,993,808 | $19,270,776 | $84,097,793 | ||||||||||||||
| 2024 | $12,214,250 | $(10,363,804) | $13,884,294 | $14,841,460 | $156,375 | $30,732,575 | ||||||||||||||
| 2023 | $32,268,400 | $(31,205,000) | $41,219,014 | $0 | $0 | $42,282,414 | ||||||||||||||
CEO (Friedman)
| Year | SCT Total Comp | Minus SCT Equity Awards | Plus Year-End Fair Value of Equity Awards Granted During Year That Remained Unvested as of Last Day of Year | Plus Change in Fair Value from Last Day of Prior Year to Last Day of Year of Unvested Equity Awards | Plus Change in Fair Value from Last Day of Prior Year to Vesting Date of Unvested Equity Awards that Vested During Year | Equals CAP | ||||||||||||||
| 2023 | $9,563,286 | $(7,999,867) | $6,170,442 | $(3,271,953) | $(2,090,840) | $2,371,068 | ||||||||||||||
| 2022 | $5,395,385 | $(4,239,900) | $18,078,963 | $9,291,946 | $9,892,637 | $38,419,031 | ||||||||||||||
| 2021 | $5,318,389 | $(4,267,500) | $2,696,917 | $(1,228,699) | $(1,308,786) | $1,210,321 | ||||||||||||||
Other NEOs (Average)
| Year | SCT Total Comp | Minus SCT Equity Awards | Plus Year-End Fair Value of Equity Awards Granted During Year That Remained Unvested as of Last Day of Year | Plus Change in Fair Value from Last Day of Prior Year to Last Day of Year of Unvested Equity Awards | Plus Fair Value at Vesting of Equity Awards Granted and Vested During Year | Plus Change in Fair Value from Last Day of Prior Year to Vesting Date of Unvested Equity Awards that Vested During Year | Minus Fair Value at Last Day of Prior Year of Equity Awards Granted in Prior Years that Failed to Meet Vesting Conditions During Year | Equals CAP | ||||||||||||||||||
| 2025 | $6,552,974 | $(5,420,752) | $9,907,224 | $5,006,942 | $0 | $513,315 | $0 | $16,559,703 | ||||||||||||||||||
| 2024 | $5,472,667 | $(4,487,648) | $4,283,685 | $518,348 | $111,503 | $(248,606) | $(1,333,498) | $4,316,451 | ||||||||||||||||||
| 2023 | $5,592,269 | $(4,509,651) | $3,004,087 | $(1,790,661) | $0 | $(2,199,912) | $(914,997) | $(818,864) | ||||||||||||||||||
| 2022 | $4,104,196 | $(3,292,689) | $14,322,661 | $8,017,461 | $0 | $6,489,853 | $0 | $29,641,482 | ||||||||||||||||||
| 2021 | $4,329,137 | $(3,558,540) | $1,814,098 | $(646,123) | $0 | $(650,457) | $0 | $1,288,115 | ||||||||||||||||||
The following graphs illustrate the relationship during 2021 to 2025 of the CAP to our CEO(s) and the average CAP to our other NEOs (each as set forth in the table above) to (i) our cumulative TSR and the cumulative TSR of the Nasdaq Biotechnology Index, (ii) our net loss calculated under GAAP and (iii) Net product revenue for 2025.
Compensation Actually Paid Versus Total Shareholder Return
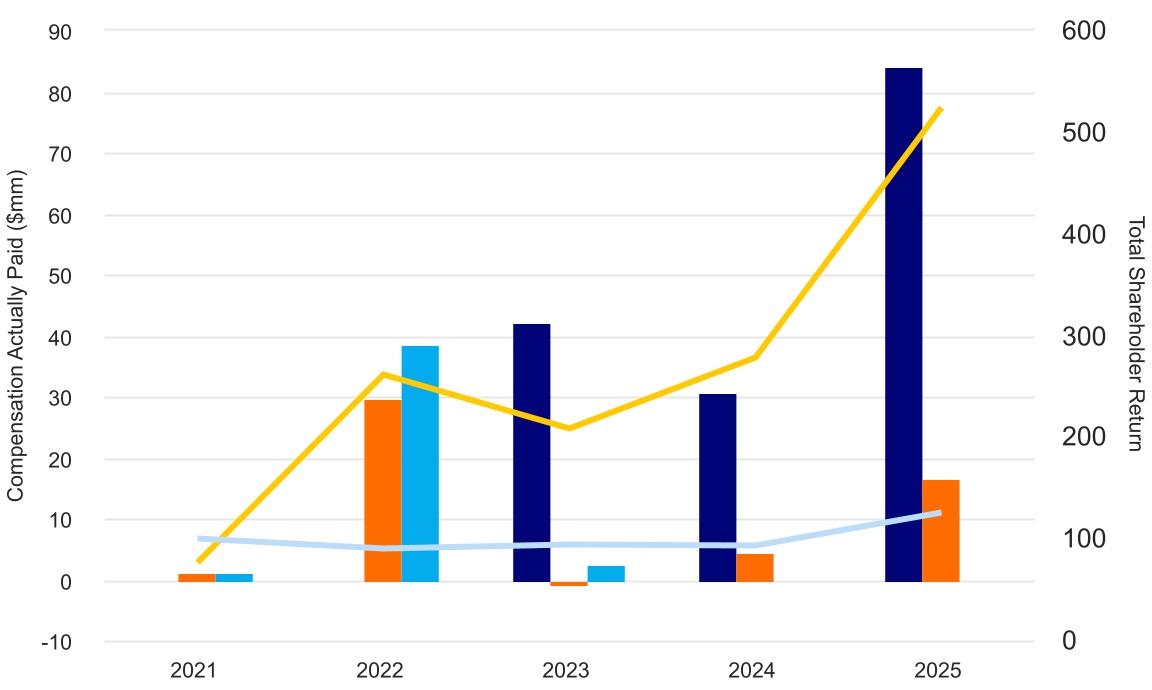
 | CAP - B. Sibold |  | CAP - NEOs |  | CAP - P. Friedman |  | MDGL TSR |  | Peer TSR | ||||||||||||||||||||
Compensation Actually Paid Versus Net Income
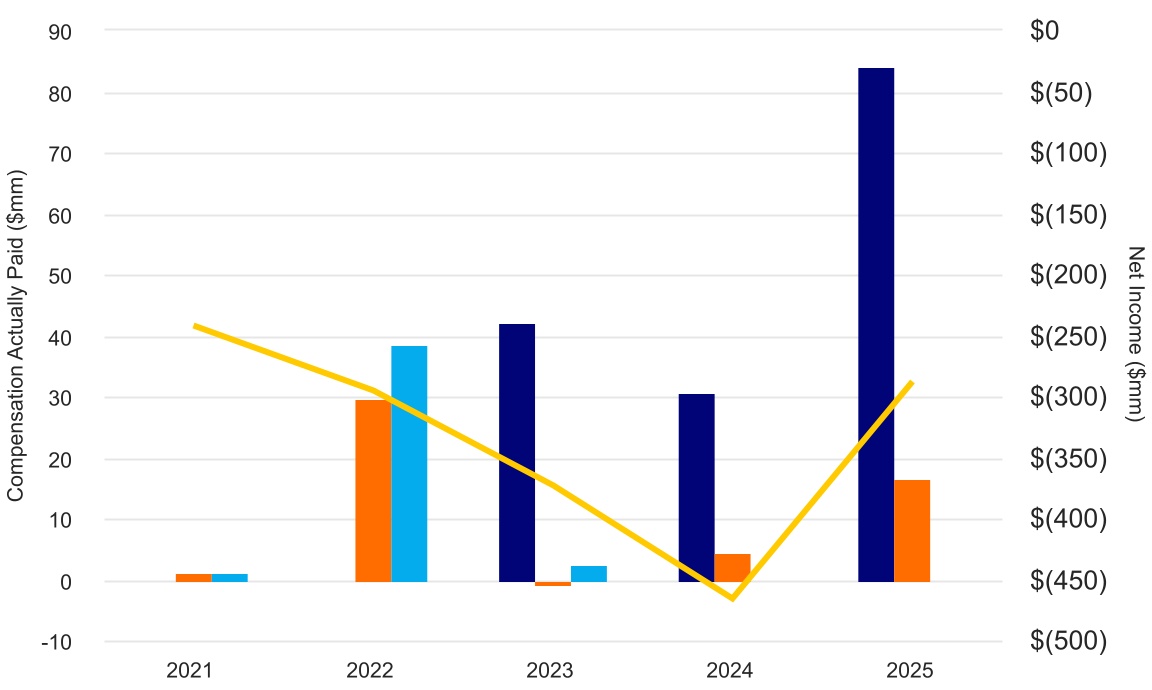
| CAP - B. Sibold | | CAP - NEOs | | CAP - P. Friedman | | MDGL Net Income | ||||||||||||||||
Compensation Actually Paid Versus Net Product Revenue
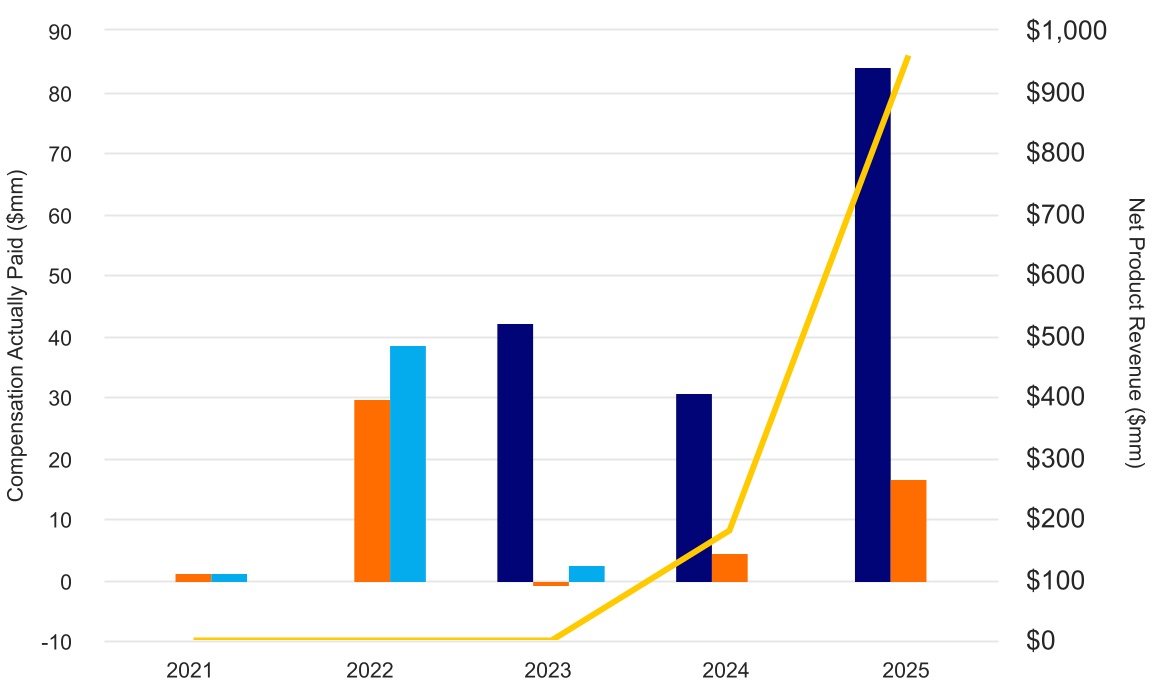
| CAP - B. Sibold | | CAP - NEOs | | CAP - P. Friedman | | Net Product Revenue | ||||||||||||||||
The following graphs illustrate the relationship during 2021 to 2025 of the CAP to our CEO(s) and the average CAP to our other NEOs (each as set forth in the table above) to (i) our cumulative TSR and the cumulative TSR of the Nasdaq Biotechnology Index, (ii) our net loss calculated under GAAP and (iii) Net product revenue for 2025.
Compensation Actually Paid Versus Total Shareholder Return
| CAP - B. Sibold | | CAP - NEOs | | CAP - P. Friedman | | MDGL TSR | | Peer TSR | ||||||||||||||||||||
The following table sets forth information concerning the compensation paid to our CEO and to our other NEOs compared to certain measures of Company performance for the years ended December 31, 2025, 2024, 2023, 2022, and 2021. The disclosure included in this section is prescribed by SEC rules and does not necessarily align with how we or the Compensation Committee view the link between our performance and our executives’ pay. For a discussion of how we view our executive compensation structure, including alignment with performance, see the CD&A beginning on page 34 in this proxy statement. The use of the term “compensation actually paid” (or “CAP”) is required by the SEC’s rules. CAP has been prepared in accordance with Item 402(v) of Regulation S-K under the Securities Exchange Act of 1934, as amended (the “Exchange Act”), and does not reflect value actually realized by the executives in the periods presented.
As described in greater detail in the CD&A section of this proxy statement, our executive compensation programs reflect a pay-for-performance philosophy. Our compensation programs incorporate goals to link pay and performance in alignment with our business strategies and the interests of our stockholders. For 2025, net product revenue was a financial measure used in our annual incentive cash compensation program. Net product revenue was not considered prior to 2024 because we were not a revenue generating organization until we commenced commercialization activities in April 2024 and we did not have any product revenue in the years prior to 2024.
The values reflected in this column reflect the “Total” compensation set forth in the Summary Compensation Table (for purposes of this Pay Versus Performance section, “SCT”) on page 47 of this proxy statement. See the footnotes to the SCT for further detail regarding the amounts in this column.(3)CAP is defined by the SEC and is computed in accordance with SEC rules by subtracting the amounts in the “Stock Awards” (as applicable) and “Option Awards” column of the SCT for each year from the “Total” column of the SCT and then: (i) adding the fair value as of the end of the reported year of all awards granted during the reporting year that are outstanding and unvested as of the end of the reporting year; (ii) adding the amount equal to the change as of the end of the reporting year (from the end of the prior year) in fair value (whether positive or negative) of any awards granted in any prior year that are outstanding and unvested as of the end of the reporting year; (iii) adding, for awards that are granted and vest in the reporting year, the fair value as of the vesting date; (iv) adding the amount equal to the change as of the vesting date (from the end of the prior fiscal year) in fair value (whether positive or negative) of any awards granted in any prior year for which all applicable vesting conditions were satisfied at the end of or during the reporting year; and (v) subtracting, for any awards granted in any prior year that are forfeited during the reporting year, the amount equal to the fair value at the end of the prior year. Valuation assumptions used to calculate fair values did not materially differ from those used to calculate fair values at the time of grant as reflected in the SCT. The following tables reflect the adjustments made to SCT total compensation to compute CAP for our CEO and average CAP for our other NEOs.
Amounts in thousands.Compensation for our NEOs is determined based on a variety of factors, as further discussed in the CD&A section of this proxy statement. The tabular list of financial performance measures included and defined below is used by the Company to link CAP to Company performance. We did not use any other financial performance metrics to directly link CAP to Company performance in 2025.