Exhibit 99.1
| Investor Overview Q1 2026 April 2026 |

| 2 Forward-looking statements This document includes forward-looking statements within the meaning of Section 27A of the Securities Act of 1933, as amended, and Section 21E of the Securities Exchange Act of 1934, as amended, including statements relating to our full year 2026 expectations of gross capex, interest expense, pension income, adjusted effective tax rate, and diluted share count, and future financial targets of North American LTL revenue CAGR, adjusted EBITDA CAGR, adjusted operating ratio improvement, and capex as a percentage of revenue. All statements other than statements of historical fact are, or may be deemed to be, forward-looking statements. In some cases, forward-looking statements can be identified by the use of forward-looking terms such as “anticipate,” “estimate,” “believe,” “continue,” “could,” “intend,” “may,” “plan,” “potential,” “predict,” “should,” “will,” “expect,” “objective,” “projection,” “forecast,” “goal,” “guidance,” “outlook,” “effort,” “target,” “trajectory” or the negative of these terms or other comparable terms. These forward-looking statements are based on certain assumptions and analyses made by us in light of our experience and our perception of historical trends, current conditions and expected future developments, as well as other factors we believe are appropriate in the circumstances. These forward-looking statements are subject to known and unknown risks, uncertainties and assumptions that may cause actual results, levels of activity, performance or achievements to be materially different from any future results, levels of activity, performance or achievements expressed or implied by such forward-looking statements. Factors that might cause or contribute to a material difference include the risks discussed in our filings with the SEC, and the following: the effects of business, economic, political, legal, and regulatory impacts or conflicts upon our operations; supply chain disruptions and shortages, strains on production or extraction of raw materials, cost inflation and labor and equipment shortages; our ability to align our investments in capital assets, including equipment, service centers, and warehouses to our customers’ demands; our ability to implement our cost and revenue initiatives and realize growth and expansion as a result of those initiatives; our ability to improve pricing growth; the effectiveness of our action plan, and other management actions, to improve our North American LTL business; our ability to continue insourcing linehaul in ways that enhance our network efficiency and productivity; the anticipated impact of a freight market recovery on our business; our ability to capture profitable share gains, facilitate yield growth, and improve margins during an upcycle; our ability to benefit from a sale, spin-off or other divestiture of one or more business units or to successfully integrate and realize anticipated synergies, cost savings and profit opportunities from acquired companies; goodwill impairment; issues related to compliance with data protection laws, competition laws, and intellectual property laws; fluctuations in currency exchange rates, fuel prices and fuel surcharges; our ability to develop and implement proprietary technology and suitable information technology systems that contribute to cost and productivity improvements; the impact of potential cyber-attacks and information technology or data security breaches or failures; our ability to repurchase shares on favorable terms; our indebtedness; our ability to raise debt and equity capital; fluctuations in interest rates; seasonal fluctuations; our ability to maintain positive relationships with our network of third-party transportation providers; our ability to attract and retain management talent and key employees including qualified drivers; labor matters; litigation; and competition. All forward-looking statements set forth in this document are qualified by these cautionary statements and there can be no assurance that the actual results or developments anticipated by us will be realized or, even if substantially realized, that they will have the expected consequences to or effects on us or our business or operations. Forward-looking statements set forth in this document speak only as of the date hereof, and we do not undertake any obligation to update forward-looking statements except to the extent required by law. Non-GAAP financial measures This presentation contains non-GAAP financial measures. For a description of these non-GAAP financial measures, including reconciliations to the most comparable measure under GAAP, see the Appendix to this presentation. |
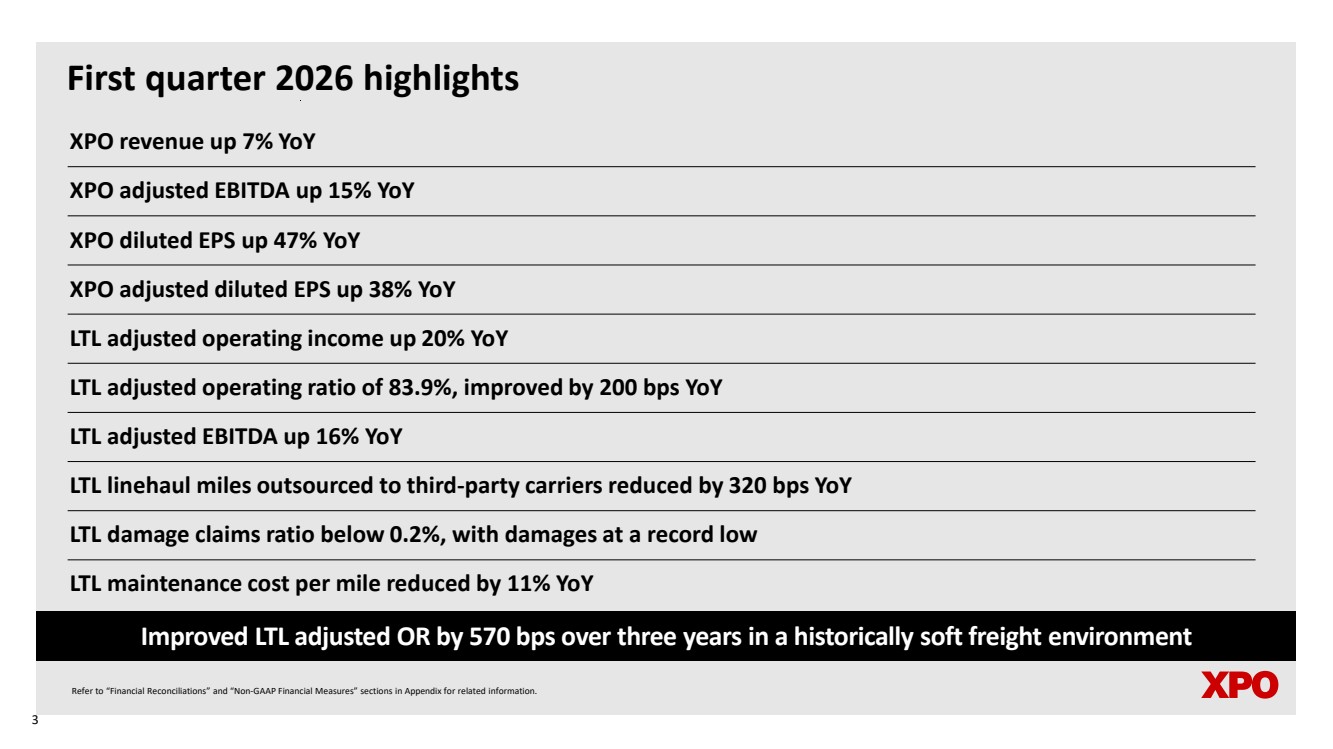
| First quarter 2026 highlights XPO revenue up 7% YoY XPO adjusted EBITDA up 15% YoY XPO diluted EPS up 47% YoY XPO adjusted diluted EPS up 38% YoY LTL adjusted operating income up 20% YoY LTL adjusted operating ratio of 83.9%, improved by 200 bps YoY LTL adjusted EBITDA up 16% YoY LTL linehaul miles outsourced to third-party carriers reduced by 320 bps YoY LTL damage claims ratio below 0.2%, with damages at a record low LTL maintenance cost per mile reduced by 11% YoY Improved LTL adjusted OR by 570 bps over three years in a historically soft freight environment Refer to “Financial Reconciliations” and “Non-GAAP Financial Measures” sections in Appendix for related information. 3 |
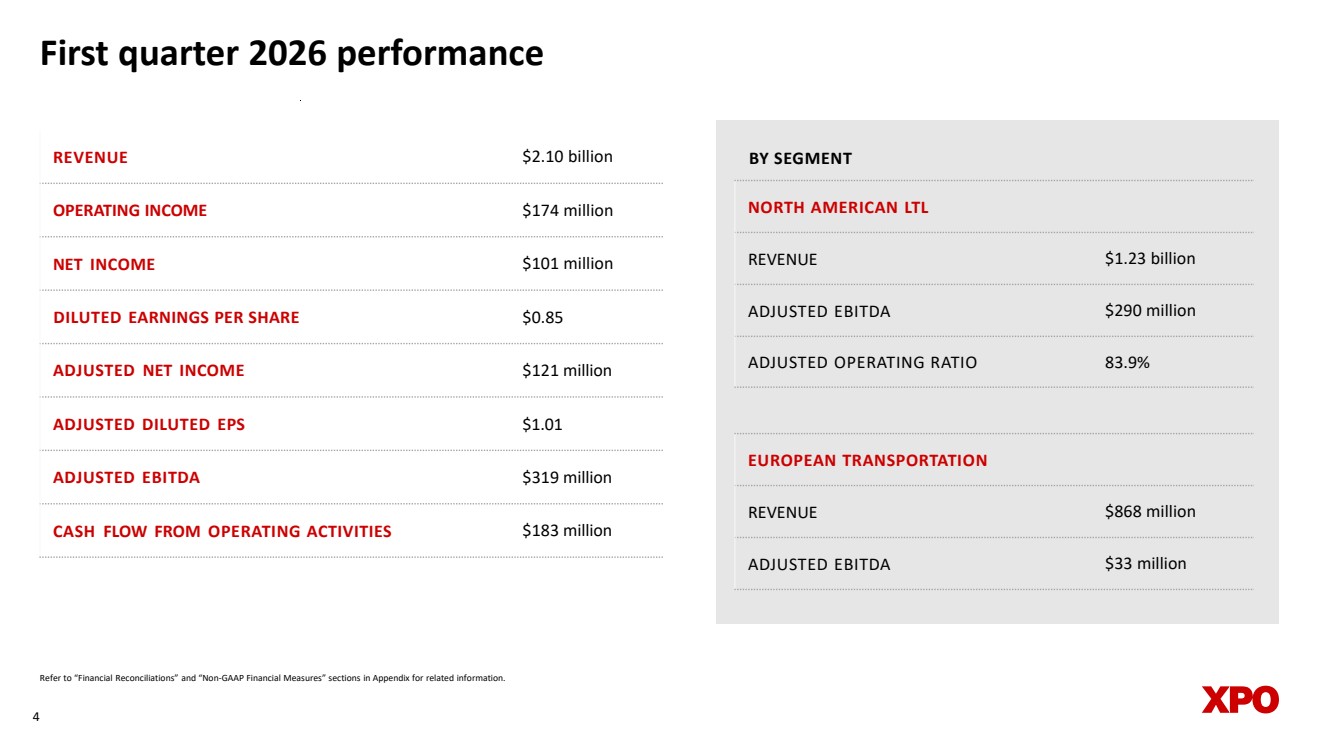
| 4 First quarter 2026 performance REVENUE $2.10 billion OPERATING INCOME $174 million NET INCOME $101 million DILUTED EARNINGS PER SHARE $0.85 ADJUSTED NET INCOME $121 million ADJUSTED DILUTED EPS $1.01 ADJUSTED EBITDA $319 million CASH FLOW FROM OPERATING ACTIVITIES $183 million NORTH AMERICAN LTL REVENUE $1.23 billion ADJUSTED EBITDA $290 million ADJUSTED OPERATING RATIO 83.9% Refer to “Financial Reconciliations” and “Non-GAAP Financial Measures” sections in Appendix for related information. EUROPEAN TRANSPORTATION REVENUE $868 million ADJUSTED EBITDA $33 million BY SEGMENT |
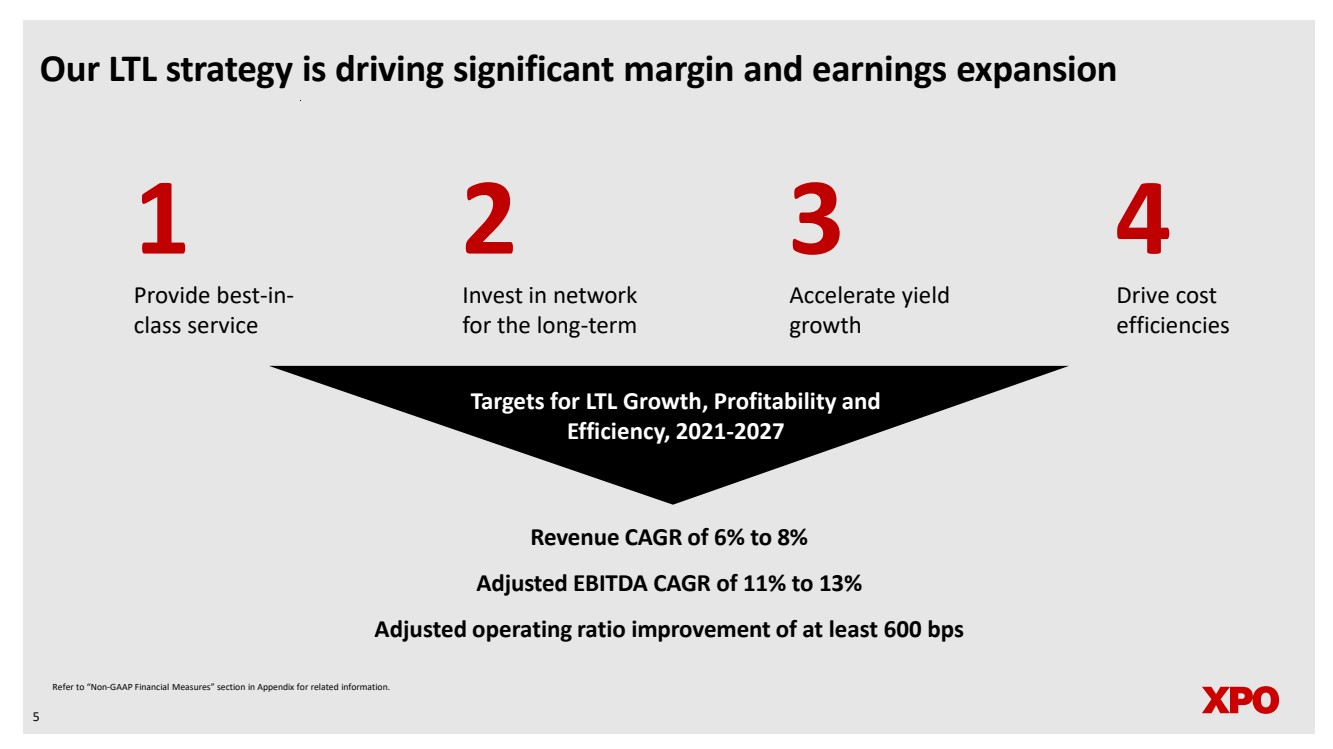
| Our LTL strategy is driving significant margin and earnings expansion 5 Provide best-in-class service 2 3 4 Invest in network for the long-term Accelerate yield growth Drive cost efficiencies Targets for LTL Growth, Profitability and Efficiency, 2021-2027 1 Revenue CAGR of 6% to 8% Adjusted EBITDA CAGR of 11% to 13% Adjusted operating ratio improvement of at least 600 bps Refer to “Non-GAAP Financial Measures” section in Appendix for related information. |
| Strong position in North American LTL 6 |

| A leading carrier in a compelling industry • $52 billion bedrock industry for the US economy, with over 75% share held by top 10 LTL players • Diverse demand across verticals, with secular growth drivers • Attractive pricing environment, with positive YoY industry pricing for over a decade • Strong service quality is key gating factor for yield growth and margin expansion • Industry service center capacity has declined over the past decade 5% CAGR: North American LTL industry revenue Sources: Third-party research; company filings. Note: Revenue CAGR for periods 2009–2025; industry size and market share data for 2025. 7 |

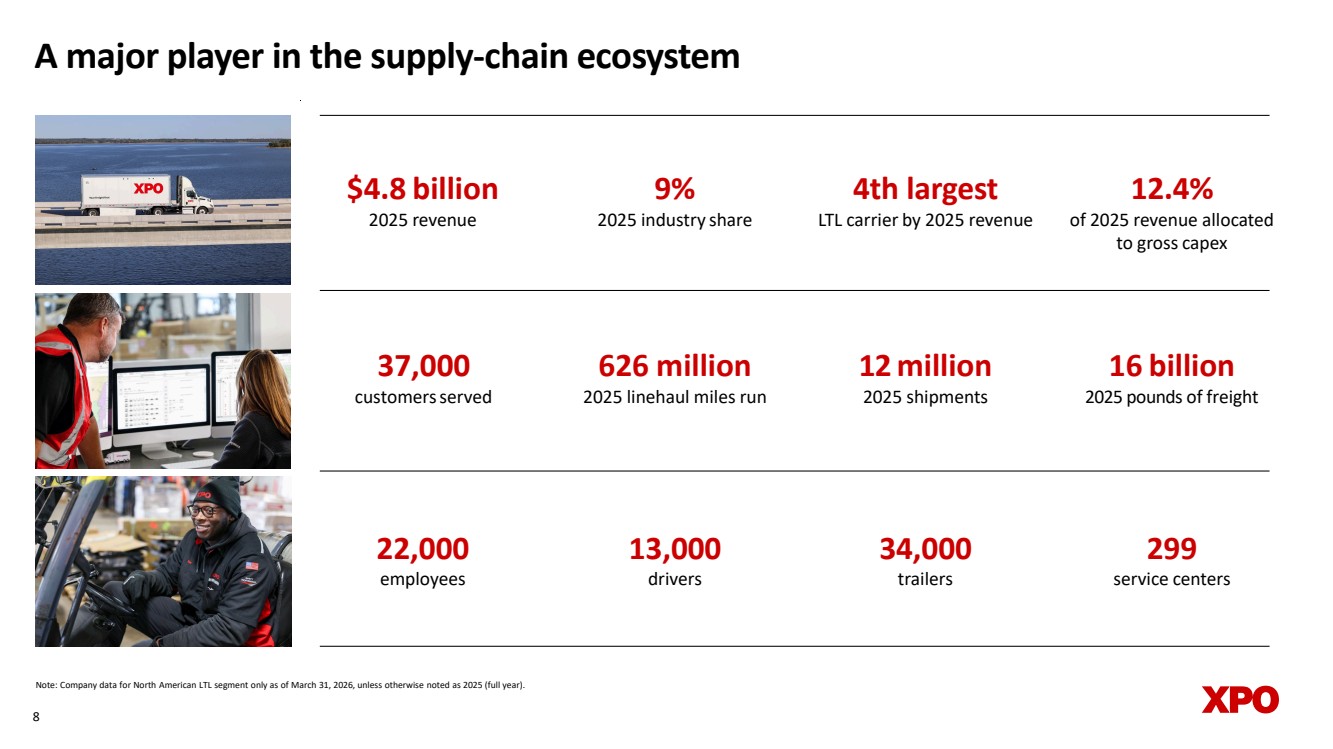
| A major player in the supply-chain ecosystem Note: Company data for North American LTL segment only as of March 31, 2026, unless otherwise noted as 2025 (full year). 4th largest LTL carrier by 2025 revenue 12.4% of 2025 revenue allocated to gross capex 12 million 2025 shipments 37,000 customersserved $4.8 billion 2025 revenue 9% 2025 industry share 8 13,000 drivers 34,000 trailers 16 billion 2025 pounds of freight 626 million 2025 linehaul miles run 22,000 employees 299 service centers |
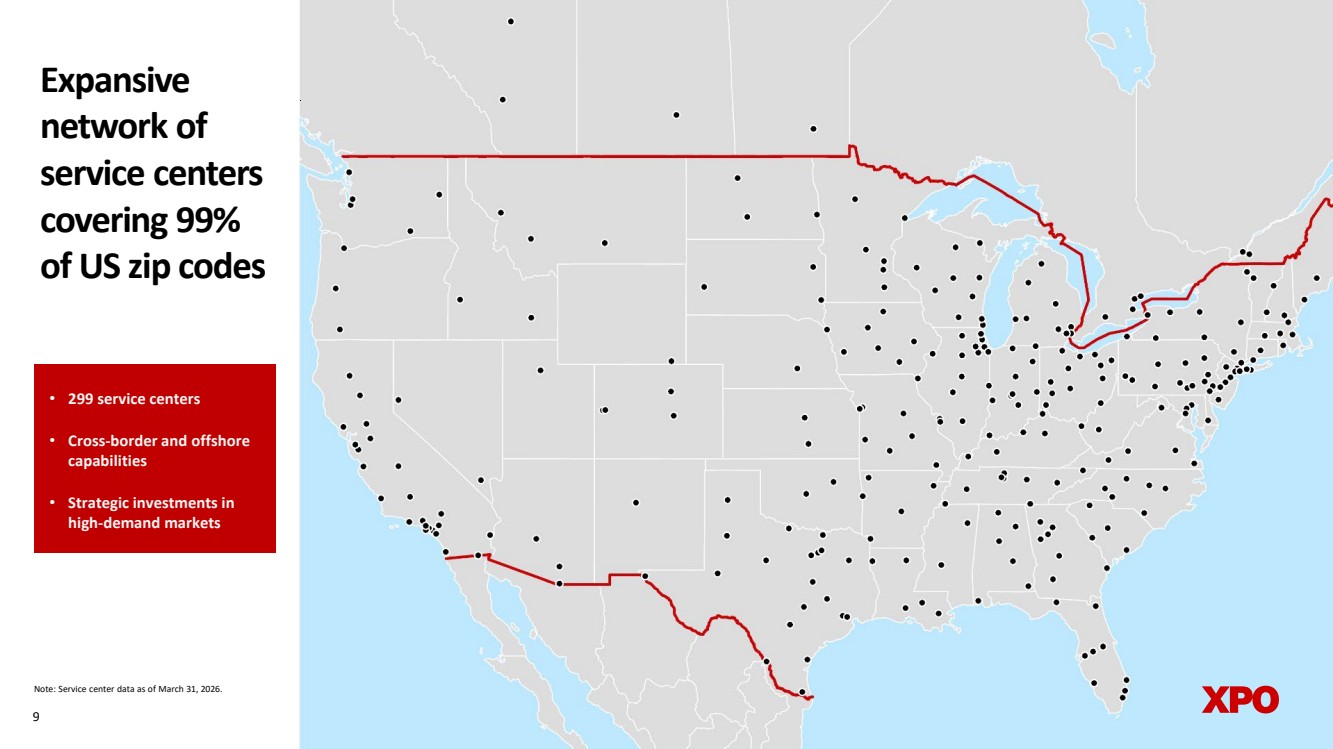
| 9 • 299 service centers • Cross-border and offshore capabilities • Strategic investments in high-demand markets Note: Service center data as of March 31, 2026. Expansive network of service centers covering 99% of US zip codes |
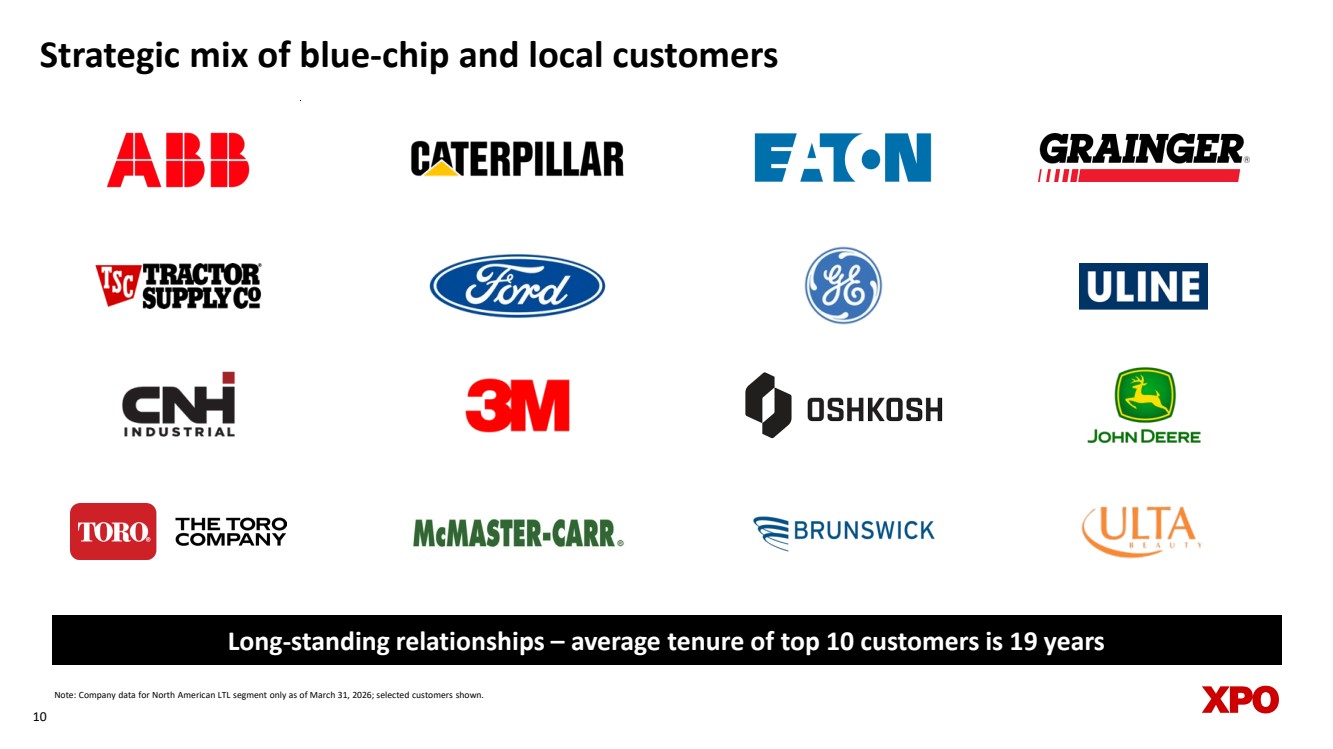
| Strategic mix of blue-chip and local customers 10 Note: Company data for North American LTL segment only as of March 31, 2026; selected customers shown. Long-standing relationships – average tenure of top 10 customers is 19 years |
| LTL growth plan and levers 11 |
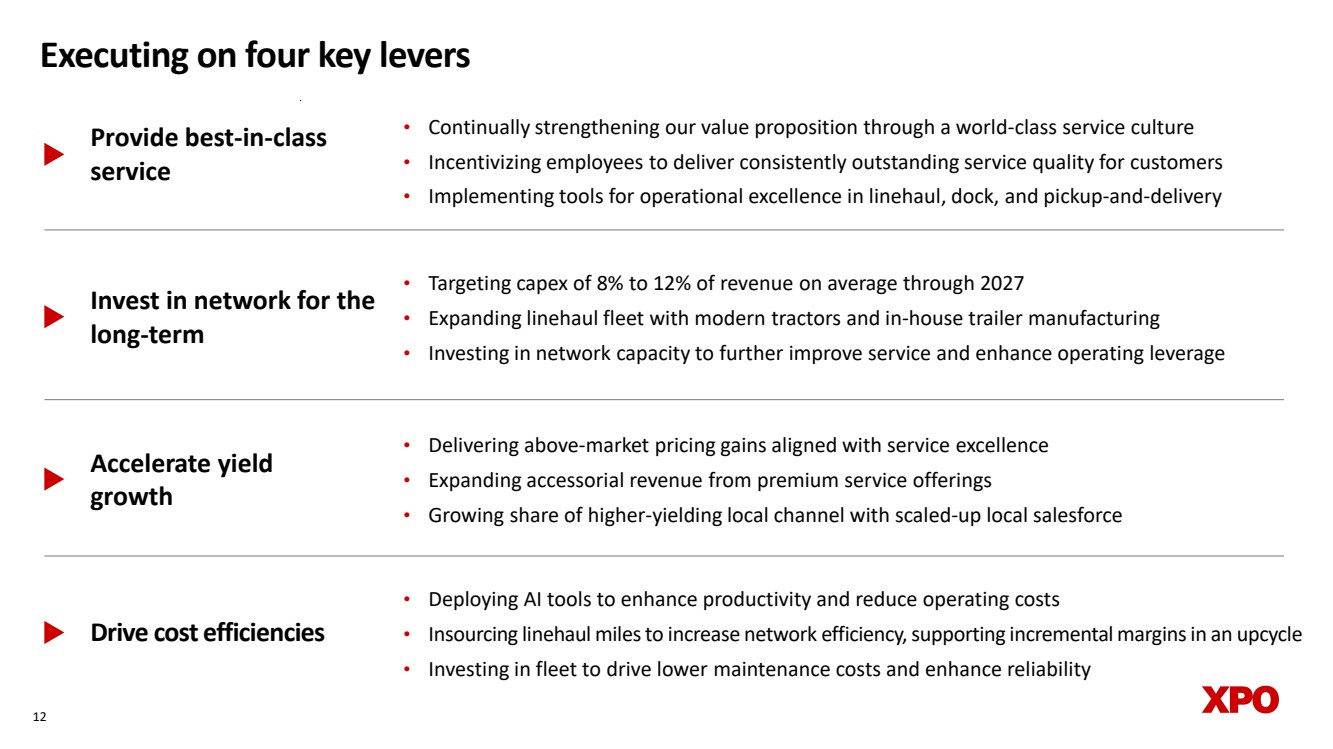
| Provide best-in-class service Accelerate yield growth Drive cost efficiencies • Delivering above-market pricing gains aligned with service excellence • Expanding accessorial revenue from premium service offerings • Growing share of higher-yielding local channel with scaled-up local salesforce • Deploying AI tools to enhance productivity and reduce operating costs • Insourcing linehaul miles to increase network efficiency, supporting incremental margins in an upcycle • Investing in fleet to drive lower maintenance costs and enhance reliability 12 Executing on four key levers • Continually strengthening our value proposition through a world-class service culture • Incentivizing employees to deliver consistently outstanding service quality for customers • Implementing tools for operational excellence in linehaul, dock, and pickup-and-delivery Invest in network for the long-term • Targeting capex of 8% to 12% of revenue on average through 2027 • Expanding linehaul fleet with modern tractors and in-house trailer manufacturing • Investing in network capacity to further improve service and enhance operating leverage |
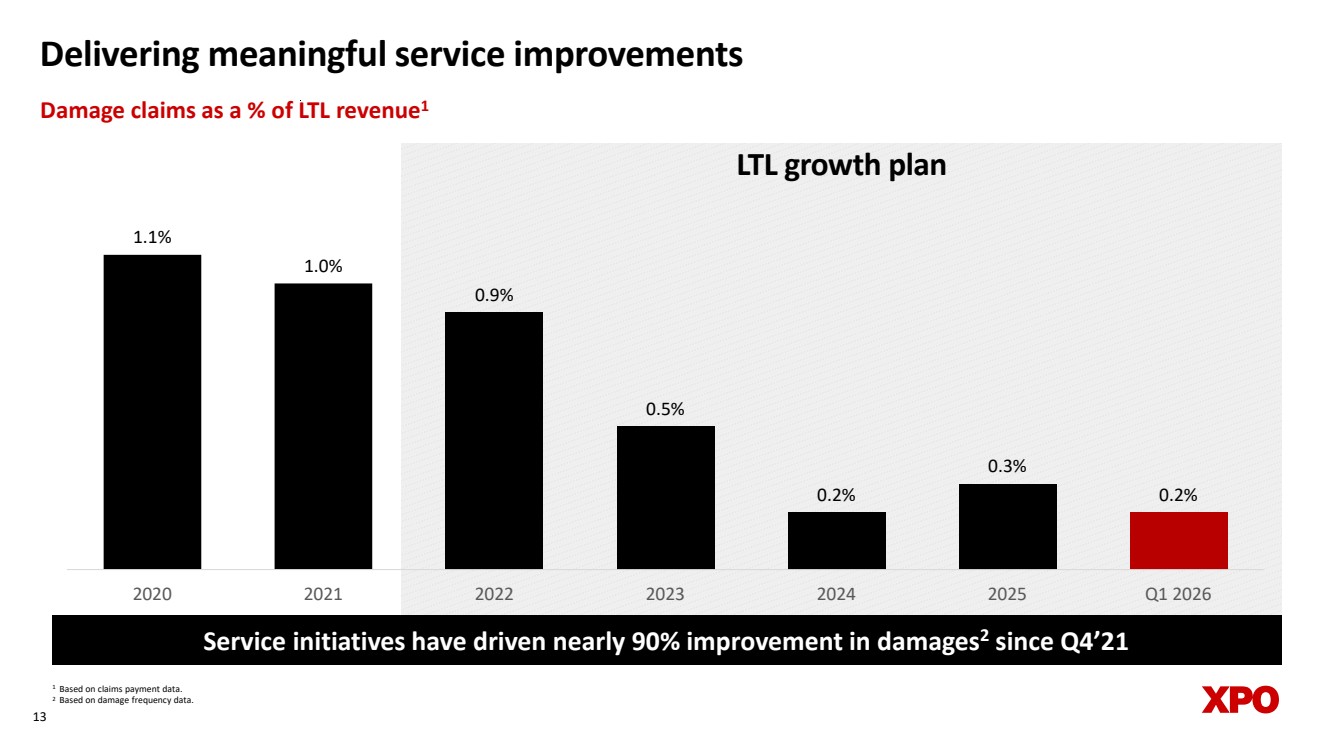
| 1 Based on claims payment data. 2 Based on damage frequency data. 13 Service initiatives have driven nearly 90% improvement in damages2 since Q4’21 Delivering meaningful service improvements Damage claims as a % of LTL revenue1 LTL growth plan 1.1% 1.0% 0.9% 0.5% 0.2% 0.3% 0.2% 2020 2021 2022 2023 2024 2025 Q1 2026 |
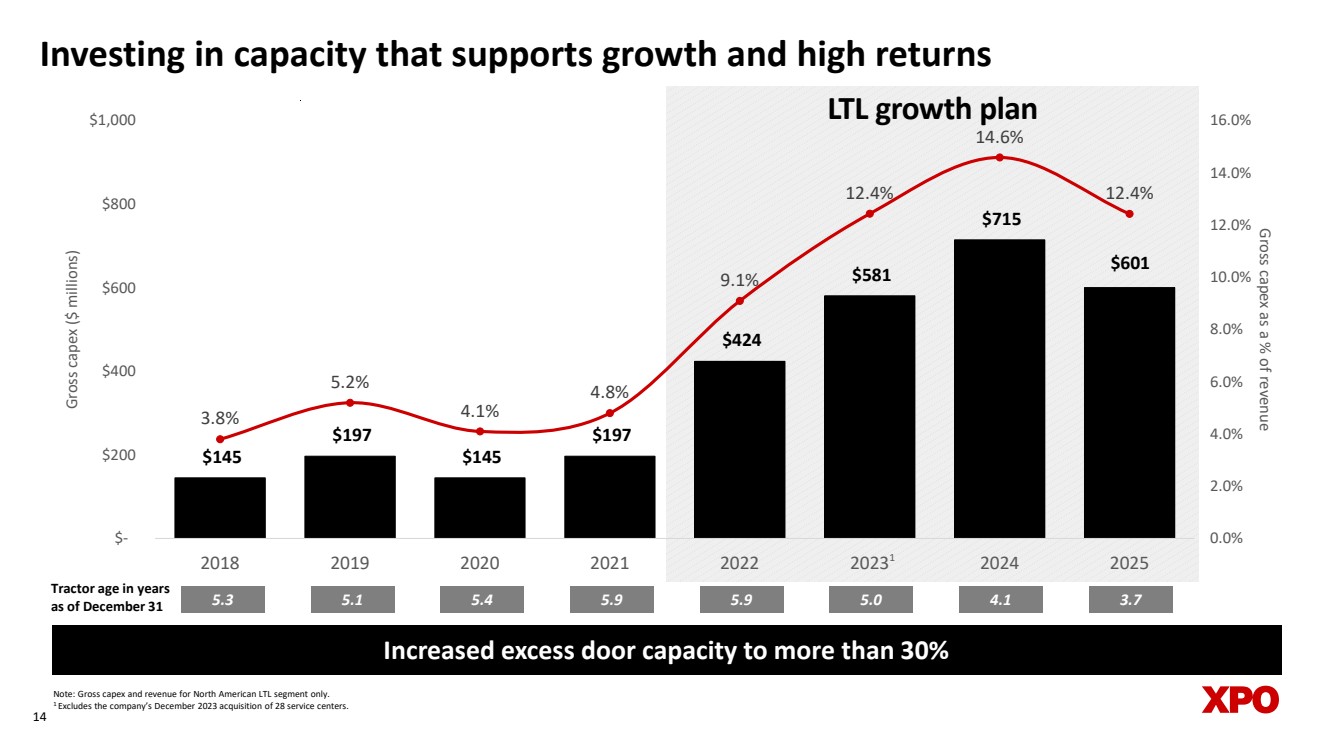
| Investing in capacity that supports growth and high returns 14 Tractor age in years as of December 31 5.3 5.1 5.4 5.9 5.9 Note: Gross capex and revenue for North American LTL segment only. 1 Excludes the company’s December 2023 acquisition of 28 service centers. 5.0 1 Increased excess door capacity to more than 30% 4.1 LTL growth plan $601 $145 $197 $145 $197 $424 $581 $715 3.8% 5.2% 4.1% 4.8% 9.1% 12.4% 14.6% 12.4% 0.0% 2.0% 4.0% 6.0% 8.0% 10.0% 12.0% 14.0% 16.0% $- $200 $400 $600 $800 $1,000 2018 2019 2020 2021 2022 2023 2024 2025 Gross capex as a % of revenue Gross capex ($ millions) 3.7 |
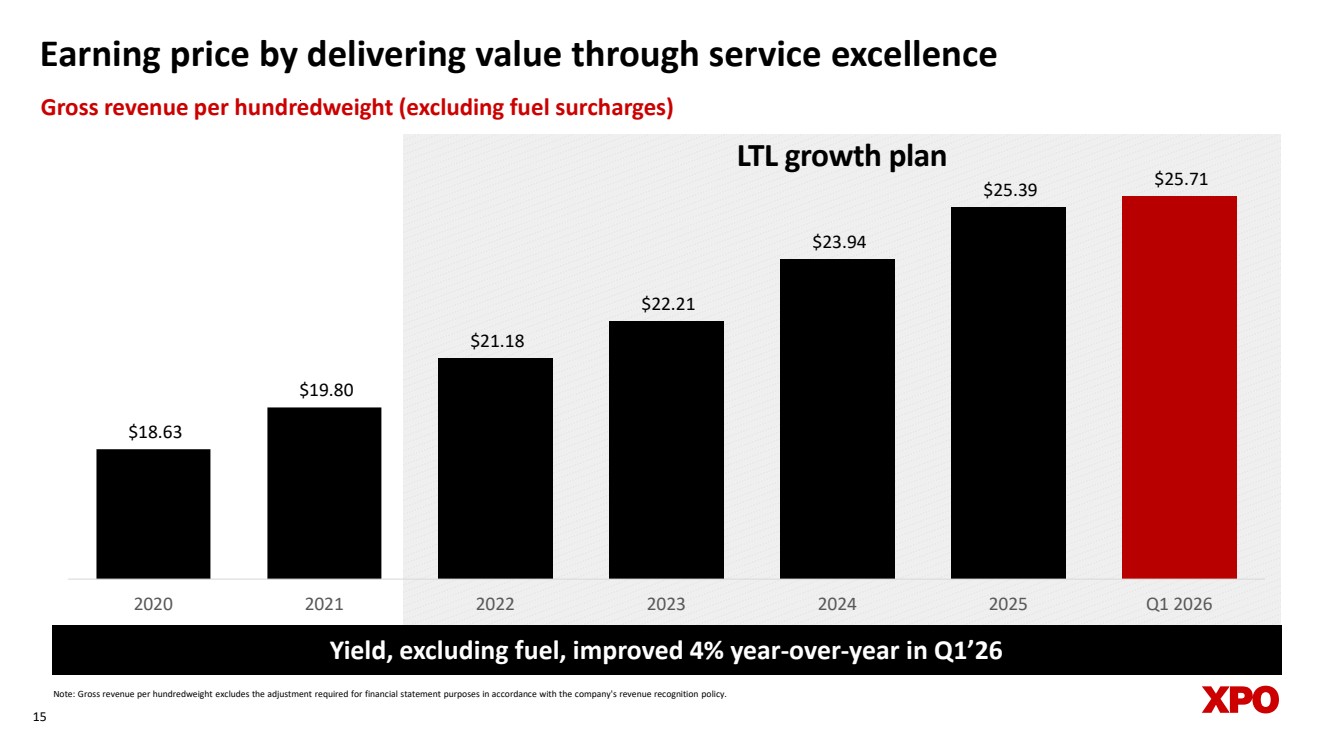
| Earning price by delivering value through service excellence 15 Note: Gross revenue per hundredweight excludes the adjustment required for financial statement purposes in accordance with the company's revenue recognition policy. Yield, excluding fuel, improved 4% year-over-year in Q1’26 Gross revenue per hundredweight (excluding fuel surcharges) LTL growth plan $18.63 $19.80 $21.18 $22.21 $23.94 $25.39 $25.71 2020 2021 2022 2023 2024 2025 Q1 2026 |
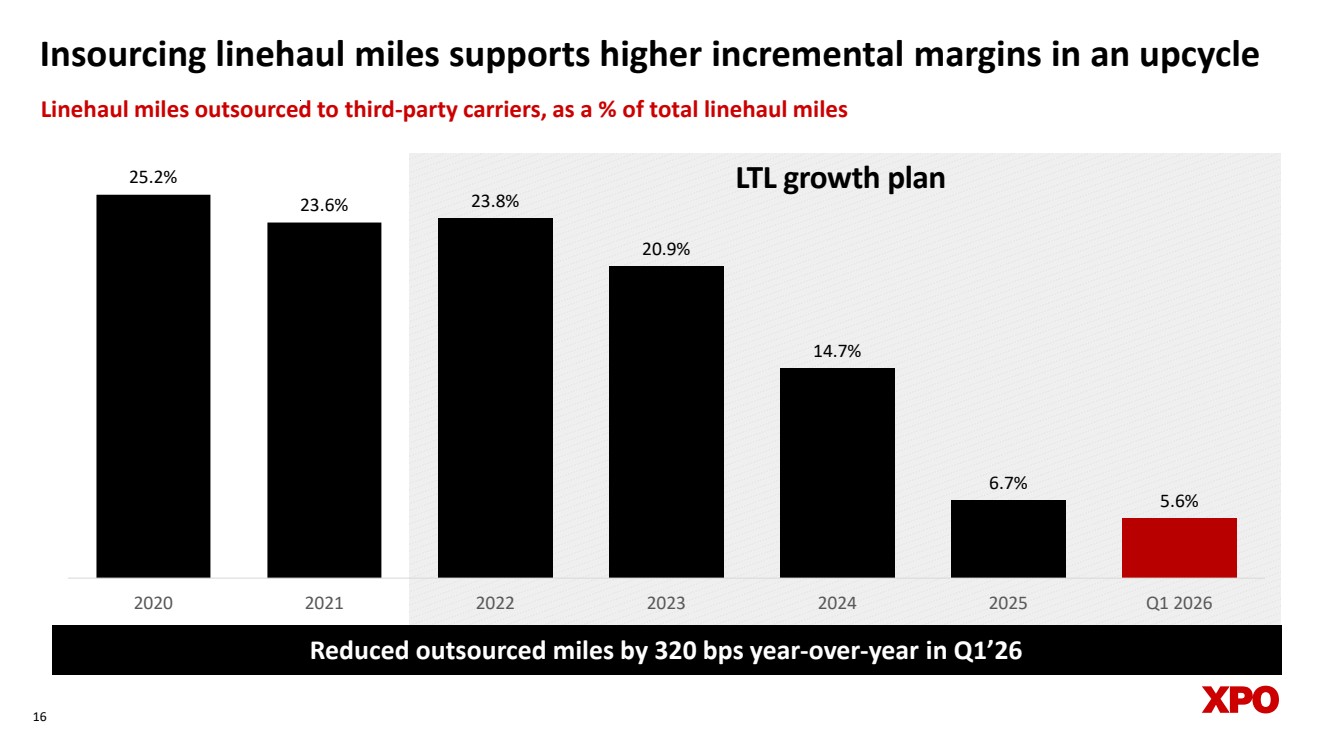
| Insourcing linehaul miles supports higher incremental margins in an upcycle 16 Reduced outsourced miles by 320 bps year-over-year in Q1’26 Linehaul miles outsourced to third-party carriers, as a % of total linehaul miles 25.2% LTL growth plan 23.6% 23.8% 20.9% 14.7% 6.7% 5.6% 2020 2021 2022 2023 2024 2025 Q1 2026 |
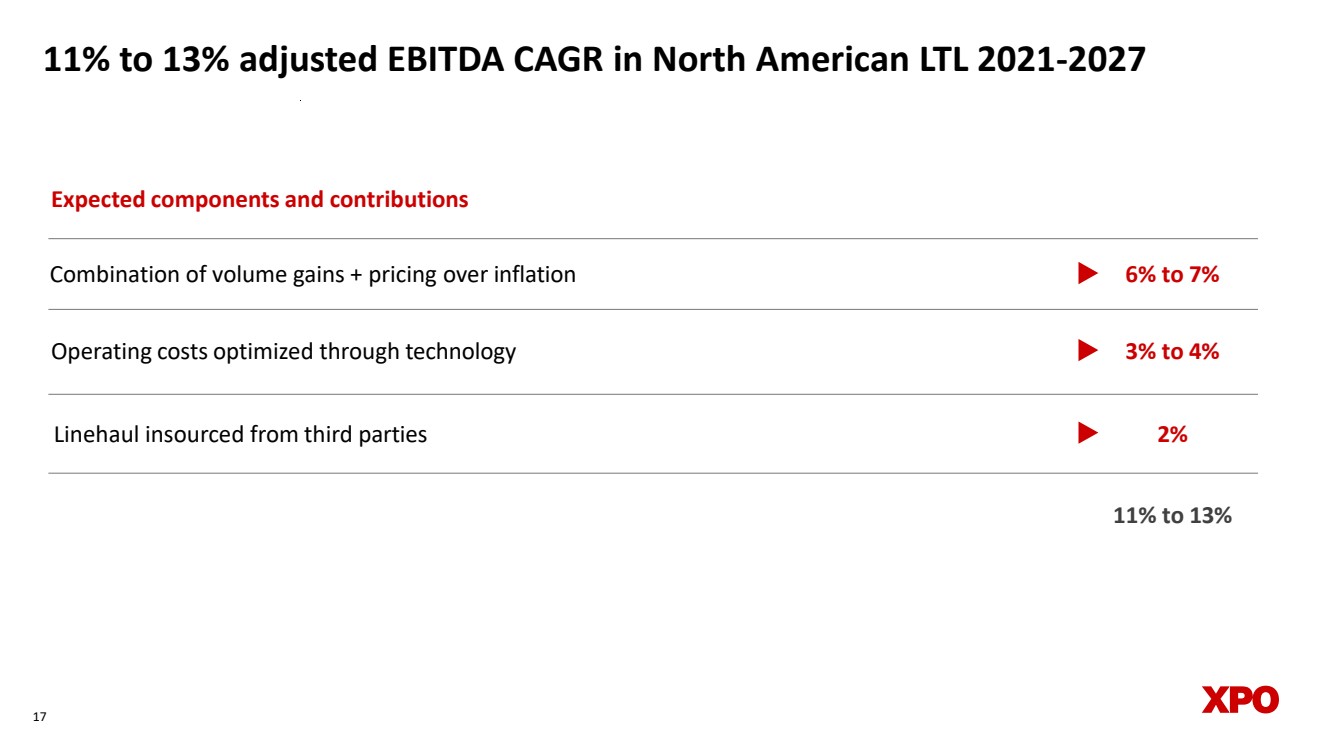
| 17 11% to 13% adjusted EBITDA CAGR in North American LTL 2021-2027 Combination of volume gains + pricing over inflation 6% to 7% 3% to 4% 2% Operating costs optimized through technology Linehaul insourced from third parties Expected components and contributions 11% to 13% |
| Appendix 18 |

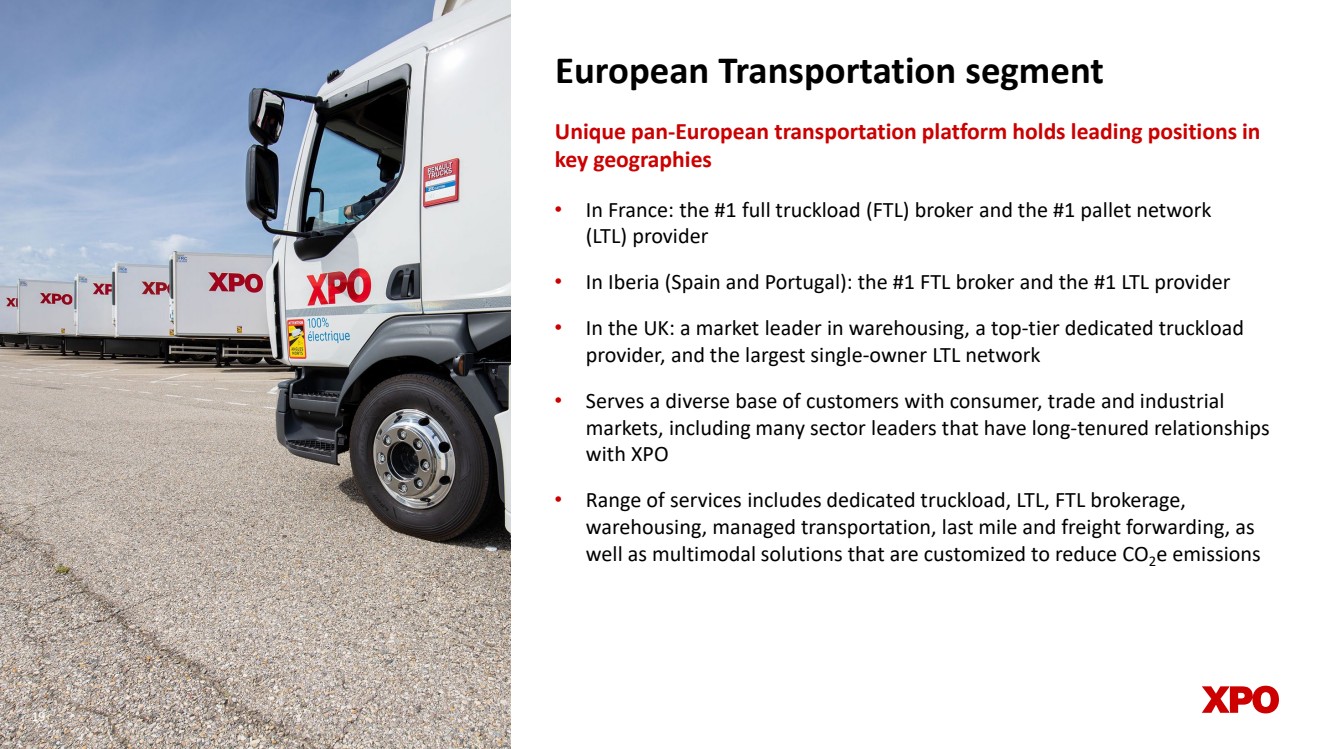
| European Transportation segment • In France: the #1 full truckload (FTL) broker and the #1 pallet network (LTL) provider • In Iberia (Spain and Portugal): the #1 FTL broker and the #1 LTL provider • In the UK: a market leader in warehousing, a top-tier dedicated truckload provider, and the largest single-owner LTL network • Serves a diverse base of customers with consumer, trade and industrial markets, including many sector leaders that have long-tenured relationships with XPO • Range of services includes dedicated truckload, LTL, FTL brokerage, warehousing, managed transportation, last mile and freight forwarding, as well as multimodal solutions that are customized to reduce CO2e emissions Unique pan-European transportation platform holds leading positions in key geographies 1919 |
| 20 For the full year 2026, the company expects: • Total company gross capex of $500 million to $600 million • Interest expense of $205 million to $215 million • Pension income of approximately $14 million • Adjusted effective tax rate of 23% to 24% • Diluted share count of approximately 118 million 2026 planning assumptions Refer to “Non-GAAP Financial Measures” on page 25 of this document. |
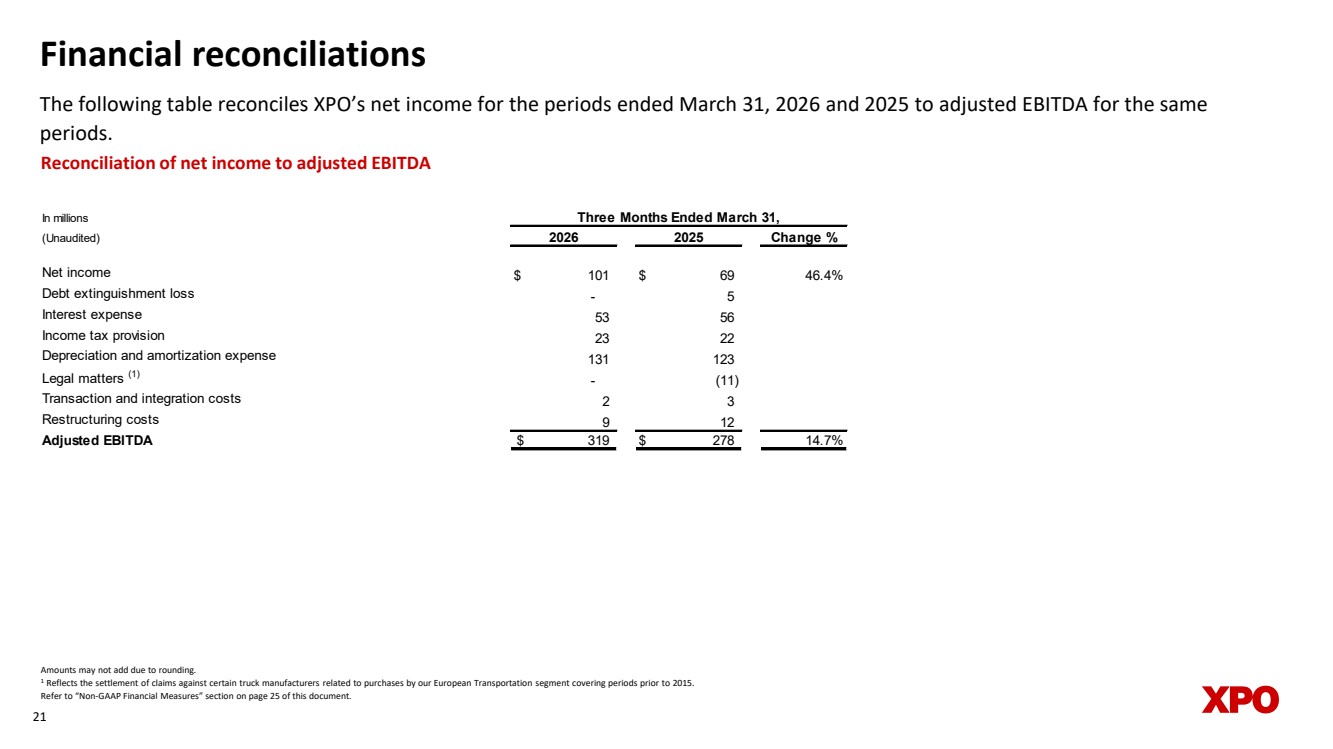
| Financial reconciliations The following table reconciles XPO’s net income for the periods ended March 31, 2026 and 2025 to adjusted EBITDA for the same periods. 21 Reconciliation of net income to adjusted EBITDA Amounts may not add due to rounding. 1 Reflects the settlement of claims against certain truck manufacturers related to purchases by our European Transportation segment covering periods prior to 2015. Refer to “Non-GAAP Financial Measures” section on page 25 of this document. In millions (Unaudited) Change % Net income $ 101 $ 69 46.4% Debt extinguishment loss - 5 Interest expense 53 56 Income tax provision 23 22 Depreciation and amortization expense 131 123 Legal matters (1) - (11) Transaction and integration costs 2 3 Restructuring costs 9 12 Adjusted EBITDA $ 319 $ 278 14.7% Three Months Ended March 31, 2026 2025 |
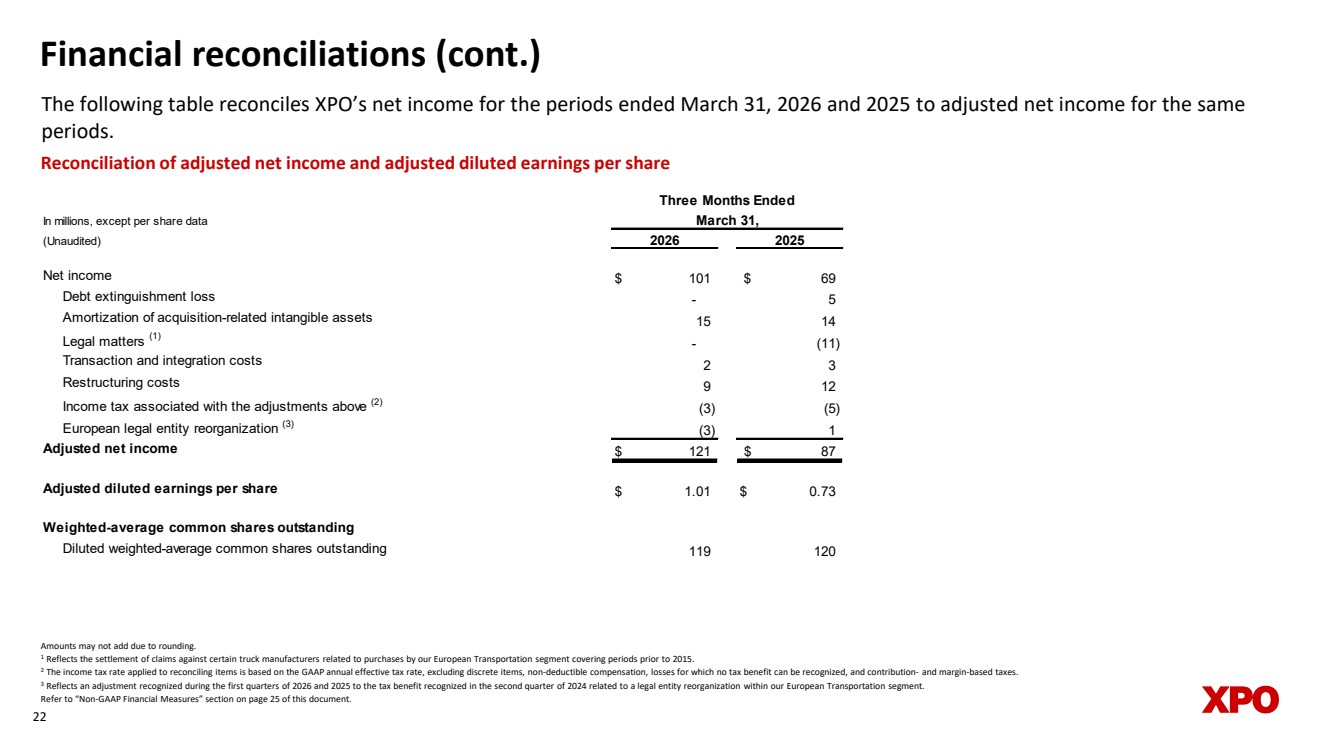
| Financial reconciliations (cont.) The following table reconciles XPO’s net income for the periods ended March 31, 2026 and 2025 to adjusted net income for the same periods. 22 Amounts may not add due to rounding. 1 Reflects the settlement of claims against certain truck manufacturers related to purchases by our European Transportation segment covering periods prior to 2015. 2 The income tax rate applied to reconciling items is based on the GAAP annual effective tax rate, excluding discrete items, non-deductible compensation, losses for which no tax benefit can be recognized, and contribution- and margin-based taxes. 3 Reflects an adjustment recognized during the first quarters of 2026 and 2025 to the tax benefit recognized in the second quarter of 2024 related to a legal entity reorganization within our European Transportation segment. Refer to “Non-GAAP Financial Measures” section on page 25 of this document. Reconciliation of adjusted net income and adjusted diluted earnings per share In millions, except per share data (Unaudited) Net income $ 101 $ 69 Debt extinguishment loss - 5 Amortization of acquisition-related intangible assets 15 14 Legal matters (1) - (11) Transaction and integration costs 2 3 Restructuring costs 9 12 Income tax associated with the adjustments above (2) (3) (5) European legal entity reorganization (3) (3) 1 Adjusted net income $ 121 $ 87 Adjusted diluted earnings per share $ 1.01 $ 0.73 Weighted-average common shares outstanding Diluted weighted-average common shares outstanding 119 120 2026 2025 Three Months Ended March 31, |
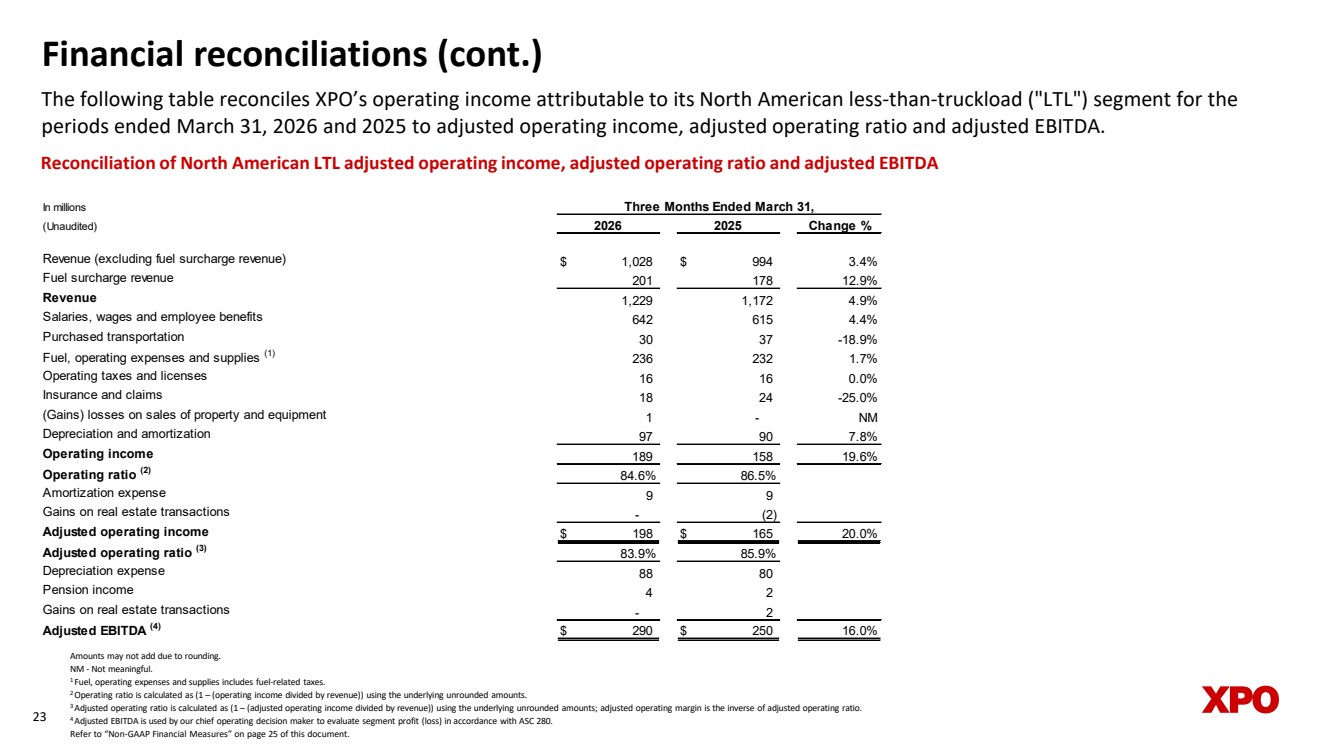
| Financial reconciliations (cont.) The following table reconciles XPO’s operating income attributable to its North American less-than-truckload ("LTL") segment for the periods ended March 31, 2026 and 2025 to adjusted operating income, adjusted operating ratio and adjusted EBITDA. 23 Reconciliation of North American LTL adjusted operating income, adjusted operating ratio and adjusted EBITDA Amounts may not add due to rounding. NM - Not meaningful. 1 Fuel, operating expenses and supplies includes fuel-related taxes. 2 Operating ratio is calculated as (1 – (operating income divided by revenue)) using the underlying unrounded amounts. 3 Adjusted operating ratio is calculated as (1 – (adjusted operating income divided by revenue)) using the underlying unrounded amounts; adjusted operating margin is the inverse of adjusted operating ratio. 4 Adjusted EBITDA is used by our chief operating decision maker to evaluate segment profit (loss) in accordance with ASC 280. Refer to “Non-GAAP Financial Measures” on page 25 of this document. In millions (Unaudited) Change % Revenue (excluding fuel surcharge revenue) $ 1,028 $ 994 3.4% Fuel surcharge revenue 201 178 12.9% Revenue 1,229 1,172 4.9% Salaries, wages and employee benefits 642 615 4.4% Purchased transportation 30 37 -18.9% Fuel, operating expenses and supplies (1) 236 232 1.7% Operating taxes and licenses 16 16 0.0% Insurance and claims 18 24 -25.0% (Gains) losses on sales of property and equipment 1 - NM Depreciation and amortization 97 90 7.8% Operating income 189 158 19.6% Operating ratio (2) 84.6% 86.5% Amortization expense 9 9 Gains on real estate transactions - (2) Adjusted operating income $ 198 $ 165 20.0% Adjusted operating ratio (3) 83.9% 85.9% Depreciation expense 88 80 Pension income 4 2 Gains on real estate transactions - 2 Adjusted EBITDA (4) $ 290 $ 250 16.0% 2026 2025 Three Months Ended March 31, |
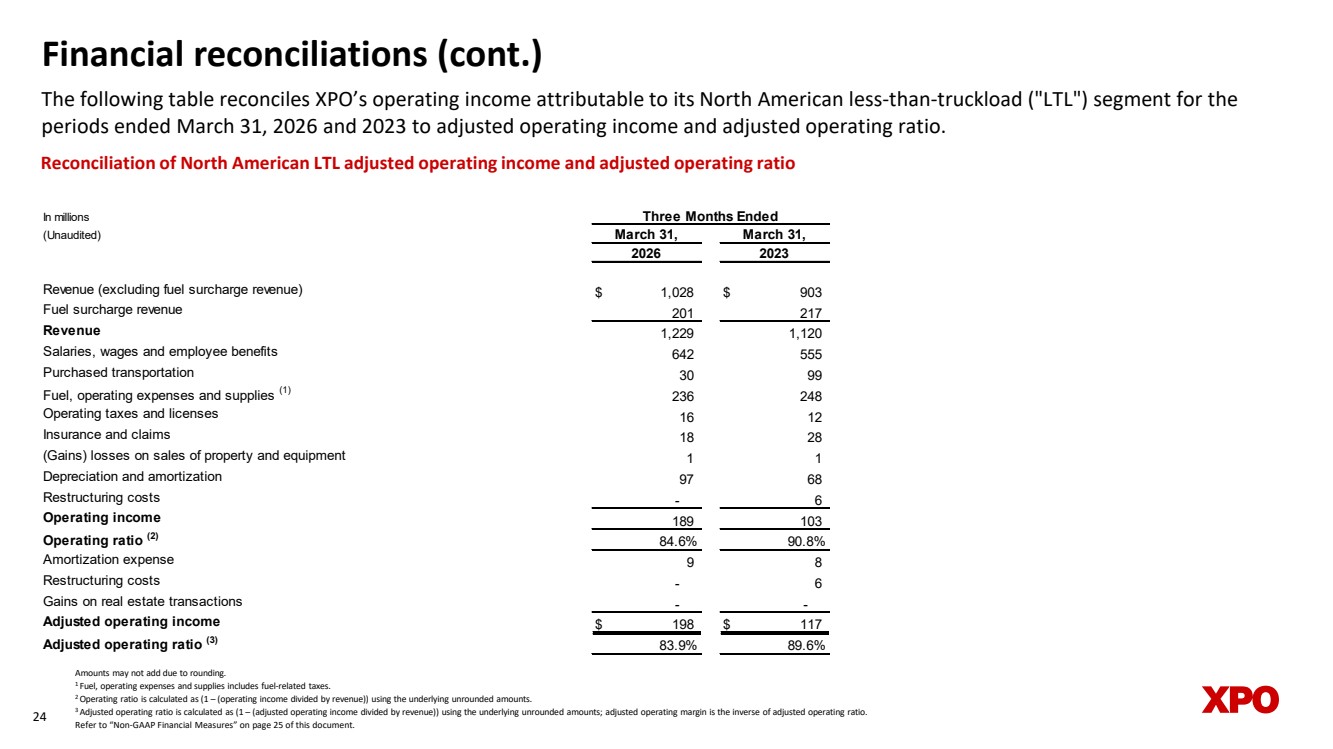
| Financial reconciliations (cont.) The following table reconciles XPO’s operating income attributable to its North American less-than-truckload ("LTL") segment for the periods ended March 31, 2026 and 2023 to adjusted operating income and adjusted operating ratio. 24 Reconciliation of North American LTL adjusted operating income and adjusted operating ratio Amounts may not add due to rounding. 1 Fuel, operating expenses and supplies includes fuel-related taxes. 2 Operating ratio is calculated as (1 – (operating income divided by revenue)) using the underlying unrounded amounts. 3 Adjusted operating ratio is calculated as (1 – (adjusted operating income divided by revenue)) using the underlying unrounded amounts; adjusted operating margin is the inverse of adjusted operating ratio. Refer to “Non-GAAP Financial Measures” on page 25 of this document. In millions (Unaudited) Revenue (excluding fuel surcharge revenue) $ 1,028 $ 903 Fuel surcharge revenue 201 217 Revenue 1,229 1,120 Salaries, wages and employee benefits 642 555 Purchased transportation 30 99 Fuel, operating expenses and supplies (1) 236 248 Operating taxes and licenses 16 12 Insurance and claims 18 28 (Gains) losses on sales of property and equipment 1 1 Depreciation and amortization 97 68 Restructuring costs - 6 Operating income 189 103 Operating ratio (2) 84.6% 90.8% Amortization expense 9 8 Restructuring costs - 6 Gains on real estate transactions - - Adjusted operating income $ 198 $ 117 Adjusted operating ratio (3) 83.9% 89.6% March 31, Three Months Ended March 31, 2026 2023 |
| Non-GAAP financial measures Asrequired by the rules of the Securities and Exchange Commission (“SEC”), we provide reconciliations of the non-GAAP financial measures contained in this document to the most directly comparable measures under GAAP, which are set forth in the financialtables attachedto this document. This document contains the following non-GAAP financial measures: adjusted earnings before interest, taxes, depreciation and amortization (“adjusted EBITDA”) on a consolidated basis; adjusted net income; adjusted diluted earnings per share ("adjustedEPS"); adjusted operating income for ourNorth American Less-Than-Truckloadsegment; adjusted operating ratio for ourNorth American Less-Than-Truckload segment; and adjustedeffective tax rate. We believe that the above adjusted financial measures facilitate analysis of our ongoing business operations because they exclude items that may not be reflective of, or are unrelated to, XPO and its business segments’ core operating performance, and may assist investors with comparisons to prior periods and assessing trendsin our underlying businesses. Other companies may calculate these non-GAAP financial measures differently, and therefore our measures may not be comparable to similarly titledmeasures of other companies. These non-GAAPfinancialmeasuresshould only be used assupplementalmeasures of our operating performance. Adjusted EBITDA, adjusted net income, adjusted EPS, adjusted operating income and adjusted operating ratio include adjustmentsfor transaction and integration costs, as well asrestructuring costs, and other adjustments asset forth in the attached tables. Transaction and integration adjustments are generally incremental coststhat result from an actual or planned acquisition, divestiture orspin-off and may include transaction costs, consulting fees,stock-based compensation, retention awards, internal salaries and wages (to the extent the individuals are assigned full-time to integration and transformation activities) and certain costsrelated to integrating and converging IT systems. Restructuring costs primarily relate to severance costs associated with business optimization initiatives. Management uses these non-GAAP financial measures in making financial, operating and planning decisions and evaluating XPO’s and each business segment’s ongoing performance. We believe that adjusted EBITDA improves comparability from period to period by removing the impact of our capital structure (interest and financing expenses), asset base (depreciation and amortization), tax impacts and other adjustments as set out in the attached tables that management has determined are not reflective of core operating activities and thereby assist investors with assessing trends in our underlying businesses. We believe that adjusted net income and adjusted EPS improve the comparability of our operating results from period to period by removing the impact of certain costs and gains that management has determined are not reflective of our core operating activities, including amortization of acquisition-related intangible assets, transaction and integration costs,restructuring costs and other adjustments asset out in the attached tables. We believe that adjusted operating income and adjusted operating ratio improve the comparability of our operating resultsfrom period to period by removing the impact of certain transaction and integration costs and restructuring costs, as well as amortization expense and other adjustments asset out in the attached tables.We believe that adjustedeffective tax rate improves comparabilityof our effective tax rate, by excluding the tax effect ofspecial items. With respect to ourtargetsfor: (i)the North American less-than-truckload segment’s adjusted EBITDA CAGR and adjusted operating ratio forthe six-year period 2021 through 2027 and (ii) the 2026 adjusted effective tax rate, a reconciliation of these non-GAAP measures to the corresponding GAAP measures is not available without unreasonable effort due to the variability and complexity of the reconciling items described above that we exclude from these non-GAAP target measures. The variability of these items may have a significant impact on our future GAAP financial results and, as a result, we are unable to prepare the forward-looking statement of income and statement of cash flowsin accordance with GAAP that would be required to produce such a reconciliation. 25 |