Pay vs Performance Disclosure - USD ($)
|
12 Months Ended |
Dec. 31, 2025 |
Dec. 31, 2024 |
Dec. 31, 2023 |
Dec. 31, 2022 |
Dec. 31, 2021 |
| Pay vs Performance Disclosure |
|
|
|
|
|
| Pay vs Performance Disclosure, Table |
| | | | | | | | | | | | | | | | | | | | | | | | | | | | | | | | | | | | | Pay vs Performance Tabular Disclosure (1) | | Summary Compensation
Table Total
for First PEO | | Summary Compensation
Table Total
for Second PEO | | Summary Compensation
Table Total
for Third PEO | | Compensation Actually Paid for First PEO(2) | | Compensation Actually Paid for Second PEO(2) | | Compensation Actually Paid for Third PEO(2) | | 2025 | — | | | $ | 5,316,939 | | | $ | 4,400,159 | | | — | | | $ | (5,700,843) | | | $ | 4,958,872 | | | 2024 | — | | | $ | 4,858,660 | | | — | | | — | | | $ | 9,500,719 | | | — | | | 2023 | — | | | $ | 4,564,374 | | | — | | | — | | | $ | 1,876,064 | | | — | | | 2022 | $ | 4,737,281 | | | $ | 3,818,318 | | | — | | | $ | (4,461,442) | | | $ | 4,168,890 | | | — | | | 2021 | $ | 5,088,592 | | | — | | | — | | | $ | 7,696,296 | | | — | | | — | |
| | | | | | | | | | | | | | | | | | | | | | | | | | | | | | | | | | | | | Pay vs Performance Tabular Disclosure (1) | | | | | | Value of Fixed $100 Investment Based On: | | | | | | Average Summary Compensation Table Total for Non-PEO NEOs | | Average Compensation Actually Paid for Non-PEO NEOs(3) | | Globus Medical Total Shareholder Return (4) | | S&P 500 Health Care Equipment Index Total Shareholder Return (4) | | Net Income | | Revenue (GAAP)(5) | | 2025 | $ | 2,655,423 | | | $ | 2,532,131 | | | $ | 134 | | | $ | 127 | | | $ | 537,868,000 | | | $ | 2,938,931,000 | | | 2024 | $ | 2,350,567 | | | $ | 4,425,474 | | | $ | 127 | | | $ | 117 | | | $ | 102,984,000 | | | $ | 2,519,355,000 | | | 2023 | $ | 2,308,364 | | | $ | 749,611 | | | $ | 82 | | | $ | 106 | | | $ | 122,873,000 | | | $ | 1,568,476,000 | | | 2022 | $ | 1,750,743 | | | $ | 2,203,657 | | | $ | 114 | | | $ | 97 | | | $ | 190,169,000 | | | $ | 1,022,843,000 | | | 2021 | $ | 1,606,690 | | | $ | 2,403,858 | | | $ | 111 | | | $ | 119 | | | $ | 149,191,000 | | | $ | 958,102,000 | |
|
|
|
|
|
| Company Selected Measure Name |
Revenue
|
|
|
|
|
| Named Executive Officers, Footnote |
The Company’s PEO for 2021 through April 2022 was David Demski (“First PEO”). In April 2022, Daniel Scavilla (“Second PEO”) succeeded David Demski as the Company’s principal executive officer and remained the PEO until July 2025.In July, Keith Pfeil (Third PEO) succeeded Daniel Scavilla as the Company’s principal executive officer. The Company’s non-PEO NEOs for 2021 were David Paul, Daniel Scavilla, Keith Pfeil, and Kelly Huller. The Company’s non-PEO NEOs for 2022, 2023, and 2024, were David Paul, Keith Pfeil, and Kelly Huller. The Company’s non-PEO NEOs for 2025, were David Paul, Kelly Huller, and Kyle Kline.
|
|
|
|
|
| Peer Group Issuers, Footnote |
For purposes of calculating peer group total shareholder return (“TSR”), the S&P 500 Health Care Equipment Index was utilized pursuant to Item 201(e) of Regulation S-K and as is reflected in our Annual Report on Form 10-K for the fiscal year ended December 31, 2025. In accordance with applicable SEC rules, peer group TSR was calculated on a market capitalization weighted basis according to the respective issuers’ stock market capitalization at the beginning of each period for which a return is indicated. TSR for both the Company and the peer group is based on an initial $100 investment, measured on a cumulative basis from the market close on December 31, 2020, through and including the end of the fiscal year for which TSR is being presented in the table.
|
|
|
|
|
| Adjustment To PEO Compensation, Footnote |
| | | | | | | | | | | | | | | | | | | | | | | | | | | | | | | | | | | | | | | | | | | PEO Compensation Actually Paid Detail | | David Demski (First PEO) | | Daniel Scavilla (Second PEO) | | Keith Pfeil (Third PEO) | | Compensation Element | 2021 | | 2022 | | 2022 | | 2023 | | 2024 | | 2025 | | 2025 | | Summary Compensation Table (SCT) Reported Total Compensation | $ | 5,088,592 | | | $ | 4,737,281 | | | $ | 3,818,318 | | | $ | 4,564,374 | | | $ | 4,858,660 | | | $ | 5,316,939 | | | $ | 4,400,159 | | | Aggregate SCT Reported Equity Compensation (-) | $ | (3,397,855) | | | $ | (3,043,385) | | | $ | (2,447,972) | | | $ | (2,896,394) | | | $ | (2,936,885) | | | $ | (5,006,644) | | | $ | (2,982,347) | | | Year-End Fair Value of Awards Granted During the FY & Outstanding (+) | 4,865,705 | | | — | | | $ | 2,948,098 | | | $ | 1,887,506 | | | $ | 5,652,965 | | | — | | | $ | 3,792,429 | | | Year-Over-Year Change in Fair Value of Awards Granted During Previous FYs & Outstanding (+/-) | $ | 438,419 | | | — | | | $ | 66,569 | | | $ | (992,001) | | | $ | 1,504,125 | | | — | | | $ | 51,812 | | | Year-Over-Year Change in Fair Value of Awards Granted During Previous FYs & Vesting During Covered FY (+/-) | $ | 701,435 | | | $ | (118,092) | | | $ | (216,123) | | | $ | (687,421) | | | $ | 421,854 | | | $ | (287,394) | | | $ | (303,181) | | Prior FYE Value of Awards Determined to Fail to Meet Vesting Conditions During Covered FY (-) (a)(b) | — | | | $ | (6,037,246) | | | — | | | — | | | — | | | $ | (5,723,744) | | | — | | | Compensation Actually Paid Determination | $ | 7,696,296 | | | $ | (4,461,442) | | | $ | 4,168,890 | | | $ | 1,876,064 | | | $ | 9,500,719 | | | $ | (5,700,843) | | | $ | 4,958,872 | |
(a)Reflects unvested stock option awards canceled in connection with the First PEO’s formal resignation as an employee of the Company (effective June 2022). (b)Reflects unvested stock option awards canceled in connection with the Second PEO’s formal resignation as an employee of the Company (effective July 2025).
|
|
|
|
|
| Non-PEO NEO Average Total Compensation Amount |
$ 2,655,423
|
$ 2,350,567
|
$ 2,308,364
|
$ 1,750,743
|
$ 1,606,690
|
| Non-PEO NEO Average Compensation Actually Paid Amount |
$ 2,532,131
|
4,425,474
|
749,611
|
2,203,657
|
2,403,858
|
| Adjustment to Non-PEO NEO Compensation Footnote |
| | | | | | | | | | | | | | | | | | | | | | | | | | | | | | | Average Non-PEO NEO Compensation Actually Paid Detail | | Compensation Element | 2021 | | 2022 | | 2023 | | 2024 | | 2025 | | Summary Compensation Table (SCT) Reported Total Compensation | $ | 1,606,690 | | | $ | 1,750,743 | | | $ | 2,308,364 | | | $ | 2,350,567 | | | $ | 2,655,423 | | | Aggregate SCT Reported Equity Compensation (-) | $ | (1,067,898) | | | $ | (980,646) | | | $ | (1,368,655) | | | $ | (1,223,702) | | | $ | (1,625,185) | | | Year-End Fair Value of Awards Granted During the FY & Outstanding (+) | $ | 1,529,222 | | | $ | 1,545,476 | | | $ | 879,502 | | | $ | 2,355,402 | | | $ | 1,708,946 | | | Year-Over-Year Change in Fair Value of Awards Granted During Previous FYs & Outstanding (+/-) | $ | 178,265 | | | $ | 66,843 | | | $ | (615,227) | | | $ | 700,008 | | | $ | 44,070 | | | Year-Over-Year Change in Fair Value of Awards Granted During Previous FYs & Vesting During Covered FY (+/-) | $ | 157,579 | | | $ | (178,759) | | | $ | (454,373) | | | $ | 243,199 | | | $ | (251,123) | | | Prior FYE Value of Awards Determined to Fail to Meet Vesting Conditions During Covered FY (-) | — | | | — | | | — | | | — | | | — | | | Compensation Actually Paid Determination | $ | 2,403,858 | | | $ | 2,203,657 | | | $ | 749,611 | | | $ | 4,425,474 | | | $ | 2,532,131 | |
|
|
|
|
|
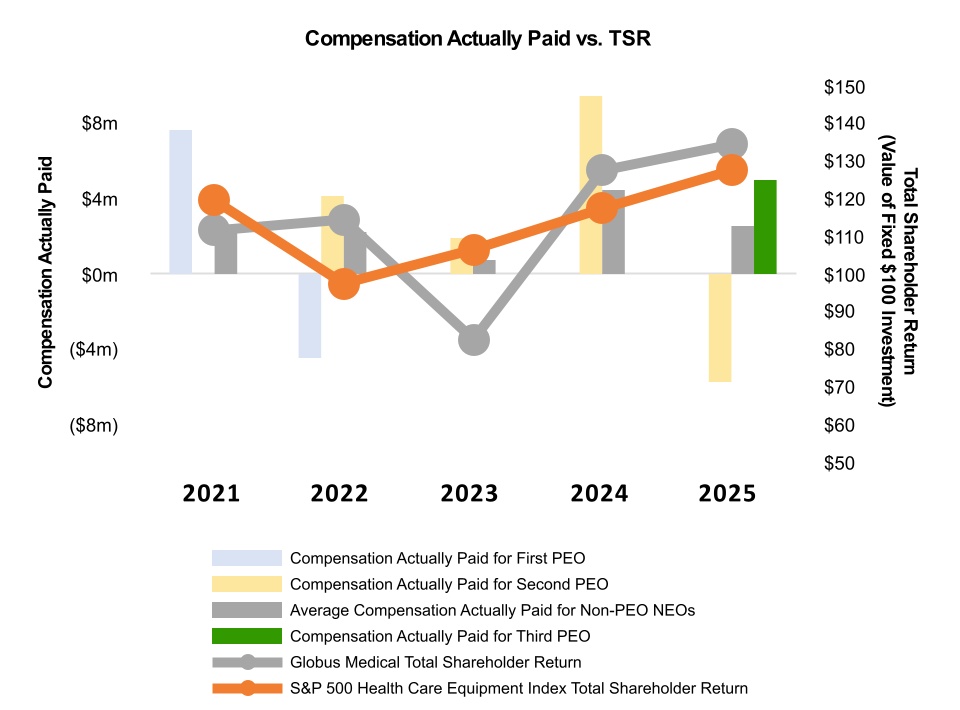
| Compensation Actually Paid vs. Total Shareholder Return |
The correlation between CAP and TSR demonstrates that NEO pay outcomes generally moved directionally with stockholder value creation throughout the measurement period. However, such alignment was impacted by leadership changes, which caused CAP to vary significantly across the three PEOs. For example, the First PEO’s negative CAP in 2022 ($4.5 million) and the Third PEO’s negative CAP in 2025 ($5.7 million) both reflect transition and forfeiture impacts. Notably, the Company outperformed the S&P 500 Health Care Equipment Index in the fiscal years ended December 31, 2022, 2024, and 2025.
|
|
|
|
|
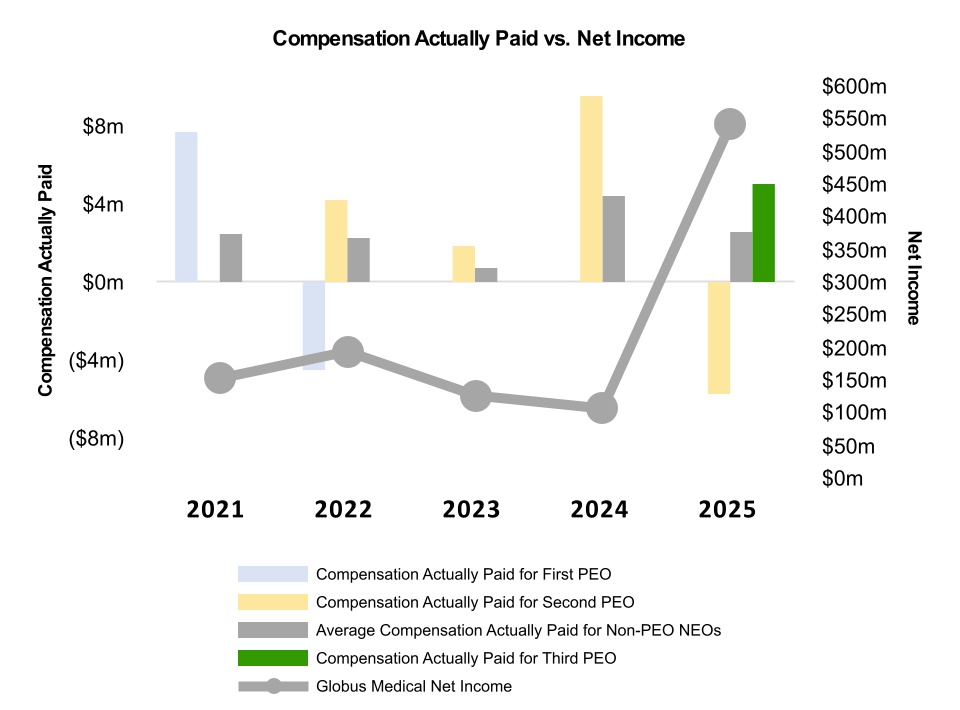
| Compensation Actually Paid vs. Net Income |
SEC rules require net income to be presented as a performance measure in the Pay Versus Performance table above. As illustrated in the table, changes in CAP for our PEO and non-PEO NEOs are not totally aligned with performance on net income as a financial performance measure. The relationship between CAP and net income, instead, reflects the multi-faceted nature of our performance assessment, with CAP influenced by both operational performance and market-based factors
|
|
|
|
|
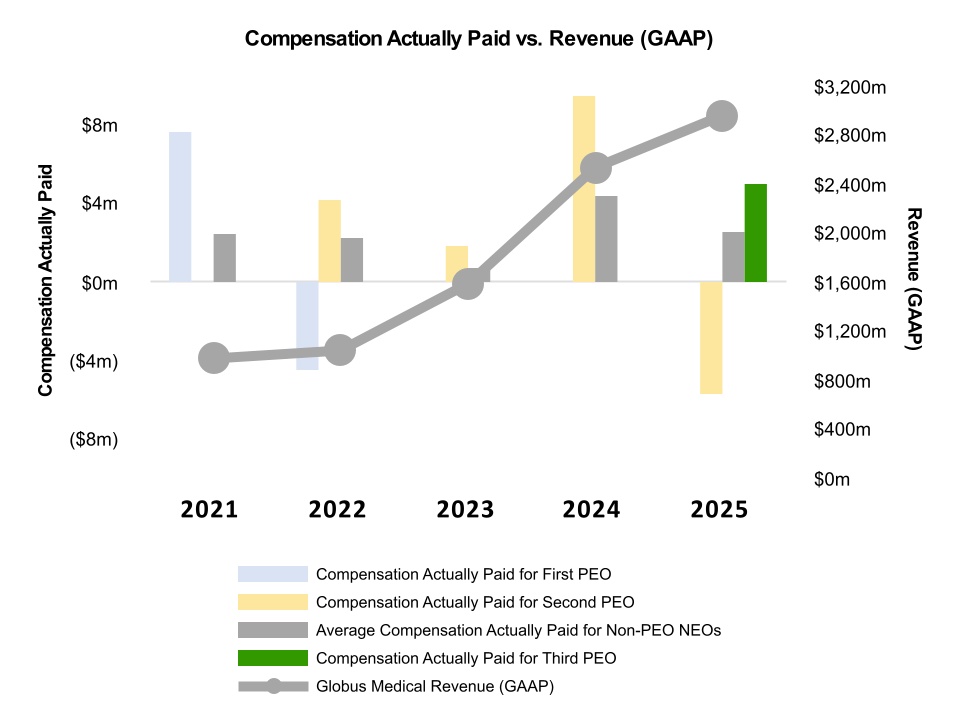
| Compensation Actually Paid vs. Company Selected Measure |
The relationship between CAP and revenue demonstrates the impact of leadership transitions on pay outcomes despite strong operational growth throughout the measurement period. While all of our NEOs’ annual incentive cash bonuses were earned based on total Company revenue achievement, as noted above, leadership transitions significantly impacted CAP outcomes. However, during periods of stable leadership, such as the Second PEO’s tenure during 2023 and 2024, PEO CAP and non-PEO CAP both reflect strong correlation with revenue performance.
|
|
|
|
|
| Total Shareholder Return Amount |
$ 134
|
127
|
82
|
114
|
111
|
| Peer Group Total Shareholder Return Amount |
127
|
117
|
106
|
97
|
119
|
| Net Income (Loss) |
$ 537,868,000
|
$ 102,984,000
|
$ 122,873,000
|
$ 190,169,000
|
$ 149,191,000
|
| Company Selected Measure Amount |
2,938,931,000
|
2,519,355,000
|
1,568,476,000
|
1,022,843,000
|
958,102,000
|
| Additional 402(v) Disclosure |
The following table and related disclosure below are provided in compliance with the requirements of Item 402(v) of Regulation S-K to summarize information regarding the relationship between “Compensation Actually Paid” (“CAP”) (as calculated under applicable SEC rules), for our Principal Executive Officer (“PEO”) and our non-PEO named executive officers (“NEOs”), on an average basis, and the Company’s financial performance for 2025, 2024, 2023, 2022, and 2021. The methodology for calculating amounts presented in the columns “Compensation Actually Paid for PEO” and “Average Compensation Actually Paid for Non-PEO NEOs,” including details regarding the amounts that were deducted from, and added to, the Summary Compensation Table totals to arrive at the values presented for CAP, are provided in the footnotes to the table. The calculations and analysis below do not necessarily reflect our approach to aligning executive compensation with performance. For information concerning the Company’s compensation philosophy and how the Company aligns executive compensation with financial performance, refer to the Compensation Discussion and Analysis of this Proxy Statement. The dollar amounts reported in these columns represent the amount of CAP to the First PEO, Second PEO, and Third PEO, as applicable, in 2021, 2022, 2023, 2024, and 2025, as computed in accordance with Item 402(v) of Regulation S-K. Equity compensation fair value was calculated based on assumptions determined in accordance with FASB ASC Topic 718.The dollar amounts reported in this column represent the average amount of CAP to the non-PEO NEOs in 2021, 2022, 2023, 2024, and 2025, as computed in accordance with Item 402(v) of Regulation S-K. Equity compensation fair value was calculated based on assumptions determined in accordance with FASB ASC Topic 718.We identified revenue as our Company-Selected Measure that represents, in our view, the most important measure used to link CAP to performance for 2025.The Compensation Committee reviews a variety of Company-wide and individual factors to link executive compensation with Company and executive performance. To promote strong pay-for-performance orientation when setting executive pay levels, the Compensation Committee considers the Company’s absolute and relative total shareholder return, short- and long-term business outlook, including net income and revenue, and the broader market environment. The following section provides a description of the relationships between the Company’s TSR to a peer comparator index, as well as CAP relative to the Company’s TSR, net income, and revenue over the last five completed fiscal years.
|
|
|
|
|
| Daniel T. Scavilla [Member] |
|
|
|
|
|
| Pay vs Performance Disclosure |
|
|
|
|
|
| PEO Total Compensation Amount |
$ 5,316,939
|
$ 4,858,660
|
$ 4,564,374
|
$ 3,818,318
|
|
| PEO Actually Paid Compensation Amount |
$ (5,700,843)
|
$ 9,500,719
|
$ 1,876,064
|
$ 4,168,890
|
|
| PEO Name |
Daniel Scavilla
|
Daniel Scavilla
|
Daniel Scavilla
|
Daniel Scavilla
|
|
| Keith W. Pfeil [Member] |
|
|
|
|
|
| Pay vs Performance Disclosure |
|
|
|
|
|
| PEO Total Compensation Amount |
$ 4,400,159
|
|
|
|
|
| PEO Actually Paid Compensation Amount |
$ 4,958,872
|
|
|
|
|
| PEO Name |
Keith Pfeil
|
|
|
|
|
| David M. Demski [Member] |
|
|
|
|
|
| Pay vs Performance Disclosure |
|
|
|
|
|
| PEO Total Compensation Amount |
|
|
|
$ 4,737,281
|
$ 5,088,592
|
| PEO Actually Paid Compensation Amount |
|
|
|
$ (4,461,442)
|
$ 7,696,296
|
| PEO Name |
|
|
|
David Demski
|
David Demski
|
| PEO | Daniel T. Scavilla [Member] | Aggregate Grant Date Fair Value of Equity Award Amounts Reported in Summary Compensation Table |
|
|
|
|
|
| Pay vs Performance Disclosure |
|
|
|
|
|
| Adjustment to Compensation, Amount |
$ (5,006,644)
|
$ (2,936,885)
|
$ (2,896,394)
|
$ (2,447,972)
|
|
| PEO | Daniel T. Scavilla [Member] | Year-end Fair Value of Equity Awards Granted in Covered Year that are Outstanding and Unvested |
|
|
|
|
|
| Pay vs Performance Disclosure |
|
|
|
|
|
| Adjustment to Compensation, Amount |
0
|
5,652,965
|
1,887,506
|
2,948,098
|
|
| PEO | Daniel T. Scavilla [Member] | Year-over-Year Change in Fair Value of Equity Awards Granted in Prior Years That are Outstanding and Unvested |
|
|
|
|
|
| Pay vs Performance Disclosure |
|
|
|
|
|
| Adjustment to Compensation, Amount |
0
|
1,504,125
|
(992,001)
|
66,569
|
|
| PEO | Daniel T. Scavilla [Member] | Change in Fair Value as of Vesting Date of Prior Year Equity Awards Vested in Covered Year |
|
|
|
|
|
| Pay vs Performance Disclosure |
|
|
|
|
|
| Adjustment to Compensation, Amount |
(287,394)
|
421,854
|
(687,421)
|
(216,123)
|
|
| PEO | Daniel T. Scavilla [Member] | Prior Year End Fair Value of Equity Awards Granted in Any Prior Year that Fail to Meet Applicable Vesting Conditions During Covered Year |
|
|
|
|
|
| Pay vs Performance Disclosure |
|
|
|
|
|
| Adjustment to Compensation, Amount |
(5,723,744)
|
0
|
0
|
0
|
|
| PEO | Keith W. Pfeil [Member] | Aggregate Grant Date Fair Value of Equity Award Amounts Reported in Summary Compensation Table |
|
|
|
|
|
| Pay vs Performance Disclosure |
|
|
|
|
|
| Adjustment to Compensation, Amount |
(2,982,347)
|
|
|
|
|
| PEO | Keith W. Pfeil [Member] | Year-end Fair Value of Equity Awards Granted in Covered Year that are Outstanding and Unvested |
|
|
|
|
|
| Pay vs Performance Disclosure |
|
|
|
|
|
| Adjustment to Compensation, Amount |
3,792,429
|
|
|
|
|
| PEO | Keith W. Pfeil [Member] | Year-over-Year Change in Fair Value of Equity Awards Granted in Prior Years That are Outstanding and Unvested |
|
|
|
|
|
| Pay vs Performance Disclosure |
|
|
|
|
|
| Adjustment to Compensation, Amount |
51,812
|
|
|
|
|
| PEO | Keith W. Pfeil [Member] | Change in Fair Value as of Vesting Date of Prior Year Equity Awards Vested in Covered Year |
|
|
|
|
|
| Pay vs Performance Disclosure |
|
|
|
|
|
| Adjustment to Compensation, Amount |
(303,181)
|
|
|
|
|
| PEO | Keith W. Pfeil [Member] | Prior Year End Fair Value of Equity Awards Granted in Any Prior Year that Fail to Meet Applicable Vesting Conditions During Covered Year |
|
|
|
|
|
| Pay vs Performance Disclosure |
|
|
|
|
|
| Adjustment to Compensation, Amount |
0
|
|
|
|
|
| PEO | David M. Demski [Member] | Aggregate Grant Date Fair Value of Equity Award Amounts Reported in Summary Compensation Table |
|
|
|
|
|
| Pay vs Performance Disclosure |
|
|
|
|
|
| Adjustment to Compensation, Amount |
|
|
|
(3,043,385)
|
$ (3,397,855)
|
| PEO | David M. Demski [Member] | Year-end Fair Value of Equity Awards Granted in Covered Year that are Outstanding and Unvested |
|
|
|
|
|
| Pay vs Performance Disclosure |
|
|
|
|
|
| Adjustment to Compensation, Amount |
|
|
|
0
|
4,865,705
|
| PEO | David M. Demski [Member] | Year-over-Year Change in Fair Value of Equity Awards Granted in Prior Years That are Outstanding and Unvested |
|
|
|
|
|
| Pay vs Performance Disclosure |
|
|
|
|
|
| Adjustment to Compensation, Amount |
|
|
|
0
|
438,419
|
| PEO | David M. Demski [Member] | Change in Fair Value as of Vesting Date of Prior Year Equity Awards Vested in Covered Year |
|
|
|
|
|
| Pay vs Performance Disclosure |
|
|
|
|
|
| Adjustment to Compensation, Amount |
|
|
|
(118,092)
|
701,435
|
| PEO | David M. Demski [Member] | Prior Year End Fair Value of Equity Awards Granted in Any Prior Year that Fail to Meet Applicable Vesting Conditions During Covered Year |
|
|
|
|
|
| Pay vs Performance Disclosure |
|
|
|
|
|
| Adjustment to Compensation, Amount |
|
|
|
(6,037,246)
|
0
|
| Non-PEO NEO | Aggregate Grant Date Fair Value of Equity Award Amounts Reported in Summary Compensation Table |
|
|
|
|
|
| Pay vs Performance Disclosure |
|
|
|
|
|
| Adjustment to Compensation, Amount |
(1,625,185)
|
(1,223,702)
|
(1,368,655)
|
(980,646)
|
(1,067,898)
|
| Non-PEO NEO | Year-end Fair Value of Equity Awards Granted in Covered Year that are Outstanding and Unvested |
|
|
|
|
|
| Pay vs Performance Disclosure |
|
|
|
|
|
| Adjustment to Compensation, Amount |
1,708,946
|
2,355,402
|
879,502
|
1,545,476
|
1,529,222
|
| Non-PEO NEO | Year-over-Year Change in Fair Value of Equity Awards Granted in Prior Years That are Outstanding and Unvested |
|
|
|
|
|
| Pay vs Performance Disclosure |
|
|
|
|
|
| Adjustment to Compensation, Amount |
44,070
|
700,008
|
(615,227)
|
66,843
|
178,265
|
| Non-PEO NEO | Change in Fair Value as of Vesting Date of Prior Year Equity Awards Vested in Covered Year |
|
|
|
|
|
| Pay vs Performance Disclosure |
|
|
|
|
|
| Adjustment to Compensation, Amount |
(251,123)
|
243,199
|
(454,373)
|
(178,759)
|
157,579
|
| Non-PEO NEO | Prior Year End Fair Value of Equity Awards Granted in Any Prior Year that Fail to Meet Applicable Vesting Conditions During Covered Year |
|
|
|
|
|
| Pay vs Performance Disclosure |
|
|
|
|
|
| Adjustment to Compensation, Amount |
$ 0
|
$ 0
|
$ 0
|
$ 0
|
$ 0
|