Pay vs Performance Disclosure
|
12 Months Ended |
|
Dec. 31, 2025
USD ($)
|
|---|
| Pay vs Performance Disclosure |
|
| Pay vs Performance Disclosure, Table |
| | | | | | | | | | | | | | | | | | | | | | | | | | | | Year | Summary Compensation Table Total for PEO1 ($) | Compensation Actually Paid to PEO1, 2, 3 ($) | Average Summary Compensation Table Total for Non-PEO NEOs1 ($) | Average Compensation Actually Paid to Non-PEO NEOs1,2,3 ($) | Value of Initial Fixed $100 Investment based on:4 | Net Income ($ Millions)⁵ | Company Selected Measure: Adjusted EBITDA6 ($ Millions) | Total Shareholder Return (“TSR”)
($) | Peer Group TSR
($) | | 2025 | $9,120,366 | $31,697,764 | $1,724,360 | $5,657,049 | $81.99 | $95.53 | $98.5 | $436.5 | | | | | | | | | |
|
| Company Selected Measure Name |
Adjusted EBITDA
|
| Named Executive Officers, Footnote |
Michael D. Schoeb served as the Company’s PEO for 2025. The Company’s Non-PEO NEOs for 2025 were Dean Nolden, Jan Vleugels, Joseph Hainline, Bob Calver, and Cody Masluk.
|
| Peer Group Issuers, Footnote |
The Peer Group TSR set forth in this table utilizes the S&P 1500 Household Durables Sub-Industry Index, which we also utilize in the stock performance graph required by Item 201(e) of Regulation S-K included in our Annual Report for the year ended December 31, 2025. The comparison assumes $100 was invested on the IPO date of October 9, 2025, through the end of the listed year in the Company and in the S&P 1500 Household Durables Sub-Industry Index, respectively. Historical stock performance is not necessarily indicative of future stock performance.
|
| PEO Total Compensation Amount |
$ 9,120,366
|
| PEO Actually Paid Compensation Amount |
$ 31,697,764
|
| Adjustment To PEO Compensation, Footnote |
Compensation Actually Paid reflects the exclusions and inclusions of certain amounts for the PEO and the Non-PEO NEOs as set forth below. Equity values are calculated in accordance with FASB ASC Topic 718. Amounts in the Exclusion of Stock Awards and Option Awards column are the totals from the Stock Awards and Option Awards columns set forth in the Summary Compensation Table. The amounts in the Inclusion of Equity Values in the tables above are derived from the amounts set forth in the following table: | | | | | | | | | | | | | | | | Year | Summary Compensation Table Total for PEO ($) | Exclusion of Stock Awards and Option Awards for PEO ($) | Inclusion of Equity Values for PEO ($) | Compensation Actually Paid to PEO ($) | | 2025 | $9,120,366 | (6,815,448) | 29,392,846 | 31,697,764 |
The amounts in the Inclusion of Equity Values in the tables above are derived from the amounts set forth in the following tables: | | | | | | | | | | | | | | | | | | | | | | | | | Year | Year-End Fair Value of Equity Awards Granted During Year That Remained Unvested as of Last Day of Year for PEO ($) | Change in Fair Value from Last Day of Prior Year to Last Day of Year of Unvested Equity Awards for PEO ($) | Vesting-Date Fair Value of Equity Awards Granted During Year that Vested During Year for PEO ($) | Change in Fair Value from Last Day of Prior Year to Vesting Date of Unvested Equity Awards that Vested During Year for PEO ($) | Fair Value at Last Day of Prior Year of Equity Awards Forfeited During Year for PEO ($) | Value of Dividends or Other Earnings Paid on Equity Awards Not Otherwise Included for PEO ($) | Total - Inclusion of Equity Values for PEO ($) | | 2025 | 5,549,994 | — | — | 23,842,852 | — | — | 29,392,846 |
|
| Non-PEO NEO Average Total Compensation Amount |
$ 1,724,360
|
| Non-PEO NEO Average Compensation Actually Paid Amount |
$ 5,657,049
|
| Adjustment to Non-PEO NEO Compensation Footnote |
Compensation Actually Paid reflects the exclusions and inclusions of certain amounts for the PEO and the Non-PEO NEOs as set forth below. Equity values are calculated in accordance with FASB ASC Topic 718. Amounts in the Exclusion of Stock Awards and Option Awards column are the totals from the Stock Awards and Option Awards columns set forth in the Summary Compensation Table. The amounts in the Inclusion of Equity Values in the tables above are derived from the amounts set forth in the following table: | | | | | | | | | | | | | | | | Year | Average Summary Compensation Table Total for Non-PEO NEOs ($) | Average Exclusion of Stock Awards and Option Awards for Non-PEO NEOs ($) | Average Inclusion of Equity Values for Non-PEO NEOs ($) | Average Compensation Actually Paid to Non-PEO NEOs ($) | | 2025 | 1,724,360 | (1,074,852) | 5,007,541 | 5,657,049 |
The amounts in the Inclusion of Equity Values in the tables above are derived from the amounts set forth in the following tables: | | | | | | | | | | | | | | | | | | | | | | | | | Year | Average Year-End Fair Value of Equity Awards Granted During Year That Remained Unvested as of Last Day of Year for Non-PEO NEOs ($) | Average Change in Fair Value from Last Day of Prior Year to Last Day of Year of Unvested Equity Awards for Non-PEO NEOs ($) | Average Vesting-Date Fair Value of Equity Awards Granted During Year that Vested During Year for Non-PEO NEOs ($) | Average Change in Fair Value from Last Day of Prior Year to Vesting Date of Unvested Equity Awards that Vested During Year for Non-PEO NEOs ($) | Average Fair Value at Last Day of Prior Year of Equity Awards Forfeited During Year for Non-PEO NEOs ($) | Average Value of Dividends or Other Earnings Paid on Equity Awards Not Otherwise Included for Non-PEO NEOs ($) | Total - Average Inclusion of Equity Values for Non-PEO NEOs ($) | | 2025 | 596,391 | 113,261 | 876,036 | 3,421,853 | — | — | 5,007,541 |
|
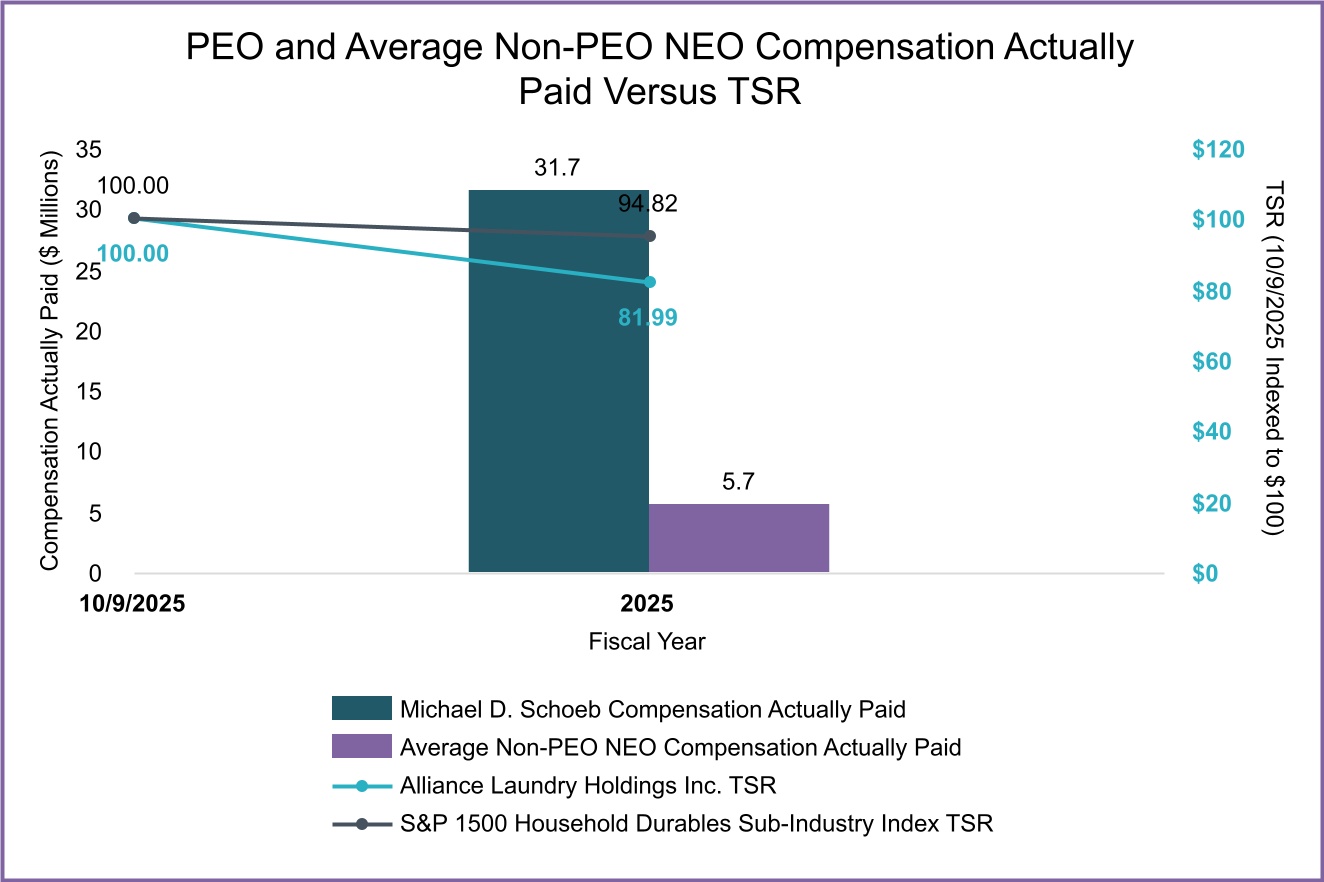
| Compensation Actually Paid vs. Total Shareholder Return |
The following chart sets forth the relationships between Compensation Actually Paid to our PEO, the average of Compensation Actually Paid to our Non-PEO NEO’s, the cumulative TSR from our IPO date of October 9, 2025 through the end of the most recent fiscal year for the Company, and the S&P 1500 Household Durables Sub-Industry Index over the same period.
|
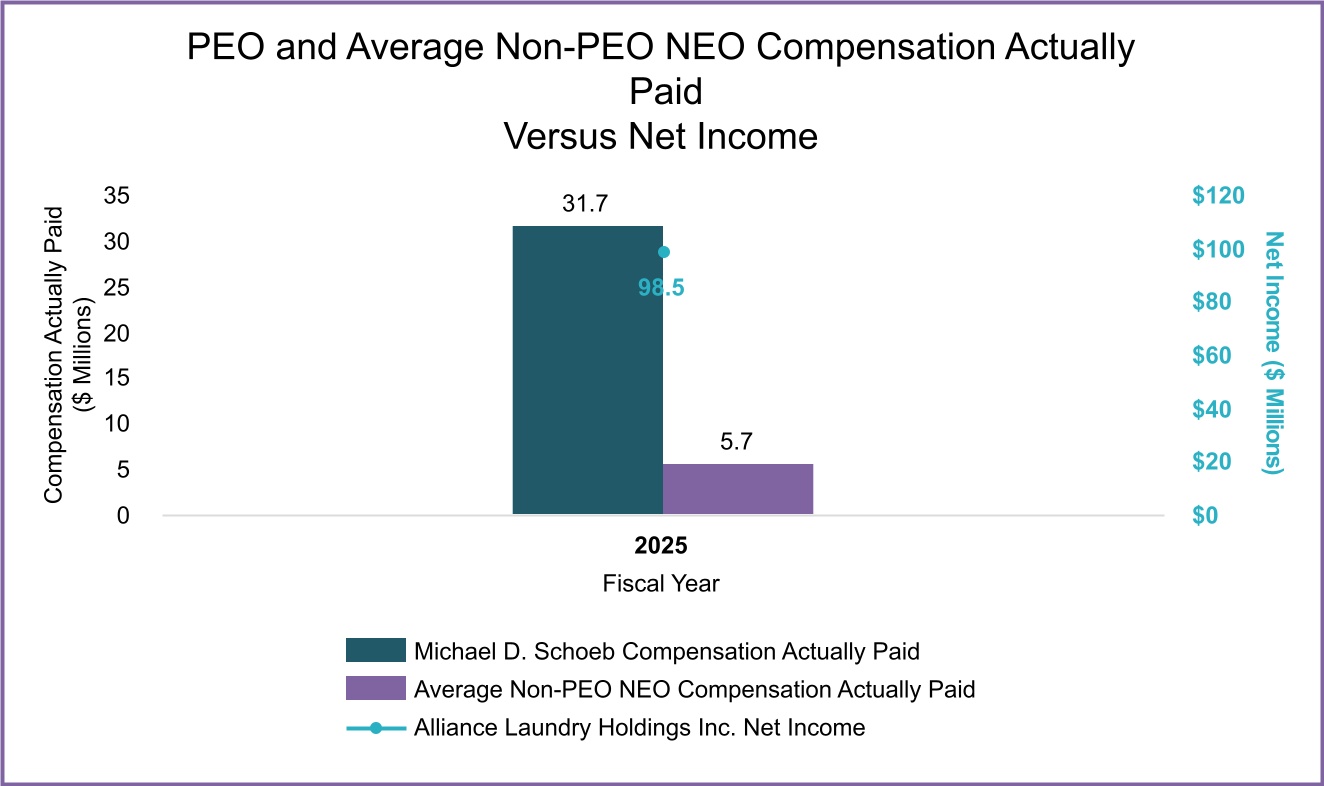
| Compensation Actually Paid vs. Net Income |
The following chart sets forth the relationship between Compensation Actually Paid to our PEO, the average of Compensation Actually Paid to our Non-PEO NEOs, and our net income during the most recently completed fiscal year.
|
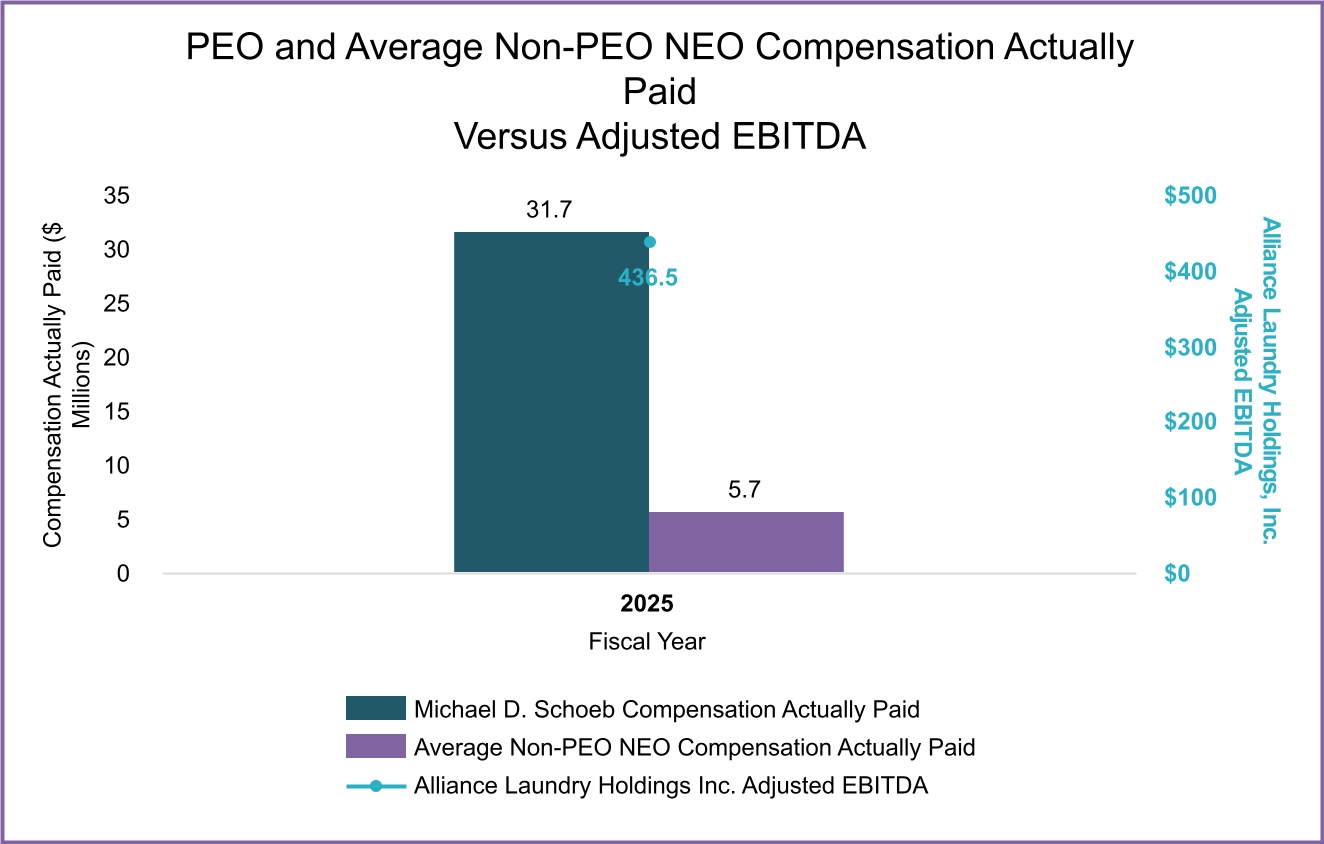
| Compensation Actually Paid vs. Company Selected Measure |
The following chart sets forth the relationship between Compensation Actually Paid to our PEO, the average of Compensation Actually Paid to our Non-PEO NEOs, and our Adjusted EBITDA during the most recently completed fiscal year.
|
| Total Shareholder Return Vs Peer Group |
The following chart sets forth the relationships between Compensation Actually Paid to our PEO, the average of Compensation Actually Paid to our Non-PEO NEO’s, the cumulative TSR from our IPO date of October 9, 2025 through the end of the most recent fiscal year for the Company, and the S&P 1500 Household Durables Sub-Industry Index over the same period.
|
| Total Shareholder Return Amount |
$ 81.99
|
| Peer Group Total Shareholder Return Amount |
95.53
|
| Net Income (Loss) |
$ 98,500,000
|
| Company Selected Measure Amount |
436,500,000
|
| PEO Name |
Michael D. Schoeb
|
| Additional 402(v) Disclosure |
Amounts reported in this column have been calculated in accordance with Item 402(v) of Regulations S-K and do not reflect compensation actually earned, realized, or received by the Company’s NEOs. These amounts reflect the Summary Compensation Table Total with certain adjustments as described in footnote 3 below.Our Net Income is measured from January 1, 2025.
|
| Measure:: 1 |
|
| Pay vs Performance Disclosure |
|
| Name |
Adjusted EBITDA
|
| Non-GAAP Measure Description |
The Compensation Committee determined Adjusted EBITDA to be the most important financial performance measure used to link Company performance to Compensation Actually Paid to our PEOs and Non-PEO NEOs. For additional details regarding how this measure is calculated from the nearest GAAP counterpart in the Company’s audited financial statements and a reconciliation to the nearest GAAP counterpart, please see “Non-GAAP Financial Measures” in Item 7 of Part II of our Annual Report on Form 10-K for the fiscal year ended December 31, 2025. Adjusted EBITDA is measured from January 1, 2025.
|
| PEO | Aggregate Grant Date Fair Value of Equity Award Amounts Reported in Summary Compensation Table |
|
| Pay vs Performance Disclosure |
|
| Adjustment to Compensation, Amount |
$ (6,815,448)
|
| PEO | Equity Awards Adjustments, Excluding Value Reported in Compensation Table |
|
| Pay vs Performance Disclosure |
|
| Adjustment to Compensation, Amount |
29,392,846
|
| PEO | Year-end Fair Value of Equity Awards Granted in Covered Year that are Outstanding and Unvested |
|
| Pay vs Performance Disclosure |
|
| Adjustment to Compensation, Amount |
5,549,994
|
| PEO | Year-over-Year Change in Fair Value of Equity Awards Granted in Prior Years That are Outstanding and Unvested |
|
| Pay vs Performance Disclosure |
|
| Adjustment to Compensation, Amount |
0
|
| PEO | Vesting Date Fair Value of Equity Awards Granted and Vested in Covered Year |
|
| Pay vs Performance Disclosure |
|
| Adjustment to Compensation, Amount |
0
|
| PEO | Change in Fair Value as of Vesting Date of Prior Year Equity Awards Vested in Covered Year |
|
| Pay vs Performance Disclosure |
|
| Adjustment to Compensation, Amount |
23,842,852
|
| PEO | Prior Year End Fair Value of Equity Awards Granted in Any Prior Year that Fail to Meet Applicable Vesting Conditions During Covered Year |
|
| Pay vs Performance Disclosure |
|
| Adjustment to Compensation, Amount |
0
|
| PEO | Dividends or Other Earnings Paid on Equity Awards not Otherwise Reflected in Total Compensation for Covered Year |
|
| Pay vs Performance Disclosure |
|
| Adjustment to Compensation, Amount |
0
|
| Non-PEO NEO | Aggregate Grant Date Fair Value of Equity Award Amounts Reported in Summary Compensation Table |
|
| Pay vs Performance Disclosure |
|
| Adjustment to Compensation, Amount |
(1,074,852)
|
| Non-PEO NEO | Equity Awards Adjustments, Excluding Value Reported in Compensation Table |
|
| Pay vs Performance Disclosure |
|
| Adjustment to Compensation, Amount |
5,007,541
|
| Non-PEO NEO | Year-end Fair Value of Equity Awards Granted in Covered Year that are Outstanding and Unvested |
|
| Pay vs Performance Disclosure |
|
| Adjustment to Compensation, Amount |
596,391
|
| Non-PEO NEO | Year-over-Year Change in Fair Value of Equity Awards Granted in Prior Years That are Outstanding and Unvested |
|
| Pay vs Performance Disclosure |
|
| Adjustment to Compensation, Amount |
113,261
|
| Non-PEO NEO | Vesting Date Fair Value of Equity Awards Granted and Vested in Covered Year |
|
| Pay vs Performance Disclosure |
|
| Adjustment to Compensation, Amount |
876,036
|
| Non-PEO NEO | Change in Fair Value as of Vesting Date of Prior Year Equity Awards Vested in Covered Year |
|
| Pay vs Performance Disclosure |
|
| Adjustment to Compensation, Amount |
3,421,853
|
| Non-PEO NEO | Prior Year End Fair Value of Equity Awards Granted in Any Prior Year that Fail to Meet Applicable Vesting Conditions During Covered Year |
|
| Pay vs Performance Disclosure |
|
| Adjustment to Compensation, Amount |
0
|
| Non-PEO NEO | Dividends or Other Earnings Paid on Equity Awards not Otherwise Reflected in Total Compensation for Covered Year |
|
| Pay vs Performance Disclosure |
|
| Adjustment to Compensation, Amount |
$ 0
|