Pay vs Performance Disclosure - USD ($)
|
12 Months Ended |
Dec. 31, 2025 |
Dec. 31, 2024 |
Dec. 31, 2023 |
Dec. 31, 2022 |
Dec. 31, 2021 |
| Pay vs Performance Disclosure |
|
|
|
|
|
| Pay vs Performance Disclosure, Table |
| | | | | | | | | | | | | | | | | | | | | | | | | | | | | | | | | | | | | | | | | | | | | | | | | | | | | | | | | | | | | Value of Initial Fixed
$100 Investment Based on: | | | | | Year
(a) | | Summary
Compensation
Table Total for
PEO ($)
(b) | | Compensation
Actually Paid
to PEO ($) (1)(2)
(c) | | Average
Summary
Compensation
Table Total
for Non-PEO
NEOs ($)
(d) | | Average
Compensation Actually Paid
to Non-PEO
NEOs ($) (1)(2)
(e) | | ImmunityBio
Total
Shareholder
Return ($) (3)
(f) | | Peer Group
Total
Shareholder
Return ($) (4)
(g) | | Net Loss
($M)
(h) | | Revenue
($M)
(i) | | | | | | | | | | | | | | | | | | 2025 | | 12,716,953 | | | 6,222,909 | | | 5,761,037 | | | 2,920,536 | | | 14.85 | | | 119.92 | | | (351.5) | | | 113.3 | | 2024 | | 10,954,875 | | | 4,065,929 | | | 5,801,150 | | | 2,319,758 | | | 19.20 | | | 90.58 | | | (413.6) | | | 14.7 | | 2023 | | 1,156,903 | | | 262,372 | | | 961,711 | | | 622,399 | | | 37.66 | | | 91.84 | | | (583.9) | | | 0.6 | | 2022 | | 4,008,507 | | | 2,751,454 | | | 2,724,907 | | | 2,481,143 | | | 38.03 | | | 88.53 | | | (417.3) | | | 0.2 | | 2021 | | 29,016,727 | | | 10,356,288 | | | 2,888,272 | | | 1,170,403 | | | 45.61 | | | 99.37 | | | (349.8) | | | 0.9 | |
|
|
|
|
|
| Named Executive Officers, Footnote |
As the valuation methods for “compensation actually paid” required by the SEC differ from those required in the Summary Compensation Table (SCT), the table below provides a reconciliation of the SCT amounts to the Compensation Actually Paid (CAP) amounts in the Pay Versus Performance table for Mr. Adcock and the average SCT and CAP amounts for our other NEOs for each of the last five years. The other Non-PEO NEOs for 2025 include Mr. Sachs, Dr. Soon-Shiong, and Ms. Lauer. The other Non-PEO NEOs for each of 2024, 2023, 2022, and 2021 include Mr. Sachs and Dr. Soon-Shiong.
|
|
|
|
|
| PEO Total Compensation Amount |
$ 12,716,953
|
$ 10,954,875
|
$ 1,156,903
|
$ 4,008,507
|
$ 29,016,727
|
| PEO Actually Paid Compensation Amount |
$ 6,222,909
|
4,065,929
|
262,372
|
2,751,454
|
10,356,288
|
| Adjustment To PEO Compensation, Footnote |
As the valuation methods for “compensation actually paid” required by the SEC differ from those required in the Summary Compensation Table (SCT), the table below provides a reconciliation of the SCT amounts to the Compensation Actually Paid (CAP) amounts in the Pay Versus Performance table for Mr. Adcock and the average SCT and CAP amounts for our other NEOs for each of the last five years. The other Non-PEO NEOs for 2025 include Mr. Sachs, Dr. Soon-Shiong, and Ms. Lauer. The other Non-PEO NEOs for each of 2024, 2023, 2022, and 2021 include Mr. Sachs and Dr. Soon-Shiong. Summary Compensation Table to Compensation Actually Paid Reconciliation Table | | | | | | | | | | | | | | | | | | | | | | | | | | | | | | | | | | | | | | | | | | | | | | | | | | | | | | | Required Adjustments to Summary Compensation Table Totals to Determine “Compensation Actually Paid” | | | | | | | Summary
Compensation
Table Total ($) | | Summary
Compensation
Table Value
of Stock
Awards ($) | | Summary
Compensation
Table Value
of Option
Awards ($) | | Fair Value
as of Year
End of
Equity
Awards
Granted
During the
Year ($) | | Year-Over-Year
Increase
(Decrease) in
Fair Value as
of Year End
of Unvested
Awards
Granted in
Prior Years ($) | | Increase
(Decrease)
From Prior
Year End
in Fair
Value of
Awards That
Vested
During the
Year ($) | | Compensation
Actually
Paid ($) | | | Year | | (a) | | (b) | | (c) | | (d) | | (e) | | (f) | | (g)=(a)-(b)-(c)
+(d)+(e)+(f) | | | | | | | | | | | | | | | | | | Richard
Adcock | | 2025 | | 12,716,953 | | | 2,787,828 | | | 8,353,406 | | | 4,780,201 | | | (626,555) | | | 493,544 | | | 6,222,909 | | Average
of Other
NEOs | | 2025 | | 5,761,037 | | | 1,226,643 | | | 3,675,499 | | | 2,103,288 | | | (216,284) | | | 174,637 | | | 2,920,536 | |
|
|
|
|
|
| Non-PEO NEO Average Total Compensation Amount |
$ 5,761,037
|
5,801,150
|
961,711
|
2,724,907
|
2,888,272
|
| Non-PEO NEO Average Compensation Actually Paid Amount |
$ 2,920,536
|
2,319,758
|
622,399
|
2,481,143
|
1,170,403
|
| Adjustment to Non-PEO NEO Compensation Footnote |
As the valuation methods for “compensation actually paid” required by the SEC differ from those required in the Summary Compensation Table (SCT), the table below provides a reconciliation of the SCT amounts to the Compensation Actually Paid (CAP) amounts in the Pay Versus Performance table for Mr. Adcock and the average SCT and CAP amounts for our other NEOs for each of the last five years. The other Non-PEO NEOs for 2025 include Mr. Sachs, Dr. Soon-Shiong, and Ms. Lauer. The other Non-PEO NEOs for each of 2024, 2023, 2022, and 2021 include Mr. Sachs and Dr. Soon-Shiong. Summary Compensation Table to Compensation Actually Paid Reconciliation Table | | | | | | | | | | | | | | | | | | | | | | | | | | | | | | | | | | | | | | | | | | | | | | | | | | | | | | | Required Adjustments to Summary Compensation Table Totals to Determine “Compensation Actually Paid” | | | | | | | Summary
Compensation
Table Total ($) | | Summary
Compensation
Table Value
of Stock
Awards ($) | | Summary
Compensation
Table Value
of Option
Awards ($) | | Fair Value
as of Year
End of
Equity
Awards
Granted
During the
Year ($) | | Year-Over-Year
Increase
(Decrease) in
Fair Value as
of Year End
of Unvested
Awards
Granted in
Prior Years ($) | | Increase
(Decrease)
From Prior
Year End
in Fair
Value of
Awards That
Vested
During the
Year ($) | | Compensation
Actually
Paid ($) | | | Year | | (a) | | (b) | | (c) | | (d) | | (e) | | (f) | | (g)=(a)-(b)-(c)
+(d)+(e)+(f) | | | | | | | | | | | | | | | | | | Richard
Adcock | | 2025 | | 12,716,953 | | | 2,787,828 | | | 8,353,406 | | | 4,780,201 | | | (626,555) | | | 493,544 | | | 6,222,909 | | Average
of Other
NEOs | | 2025 | | 5,761,037 | | | 1,226,643 | | | 3,675,499 | | | 2,103,288 | | | (216,284) | | | 174,637 | | | 2,920,536 | |
|
|
|
|
|
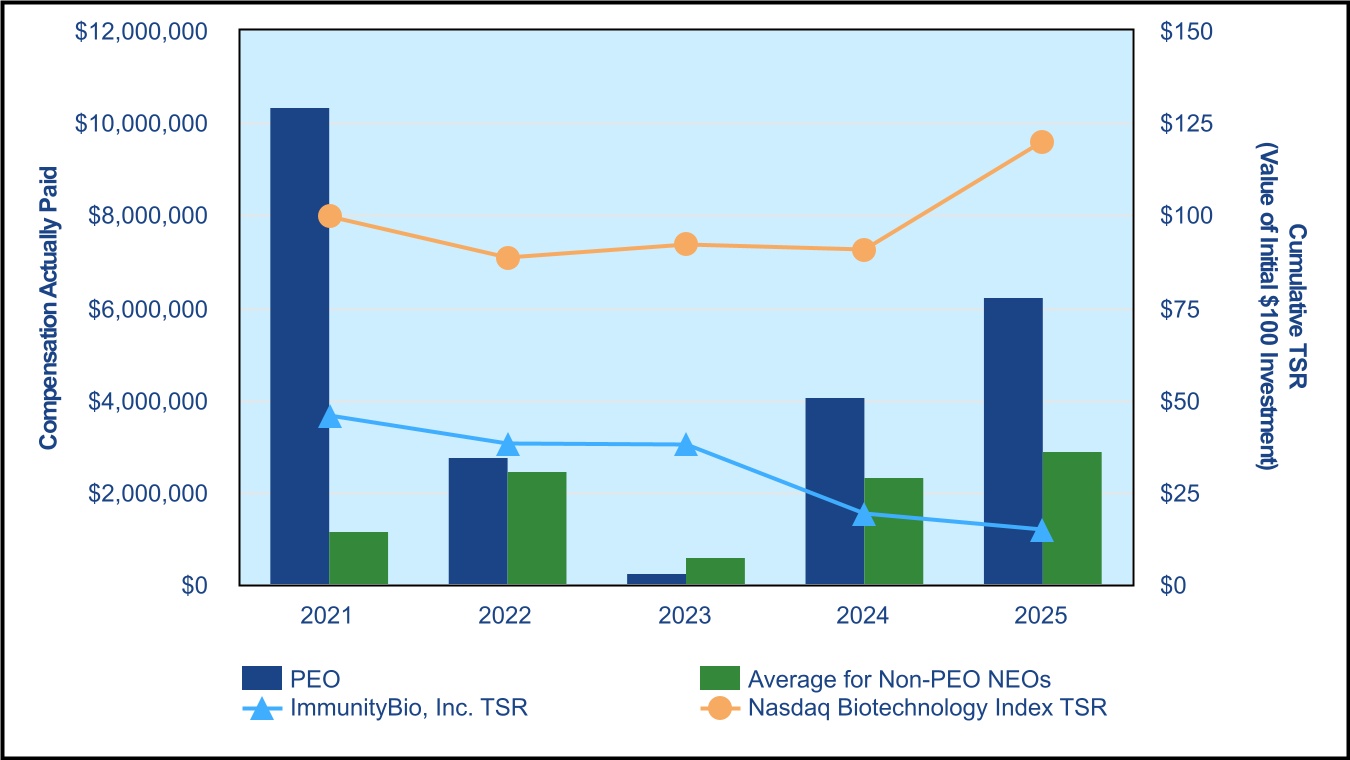
| Compensation Actually Paid vs. Total Shareholder Return |
Compensation Actually Paid Compared to Total Shareholder Return
|
|
|
|
|
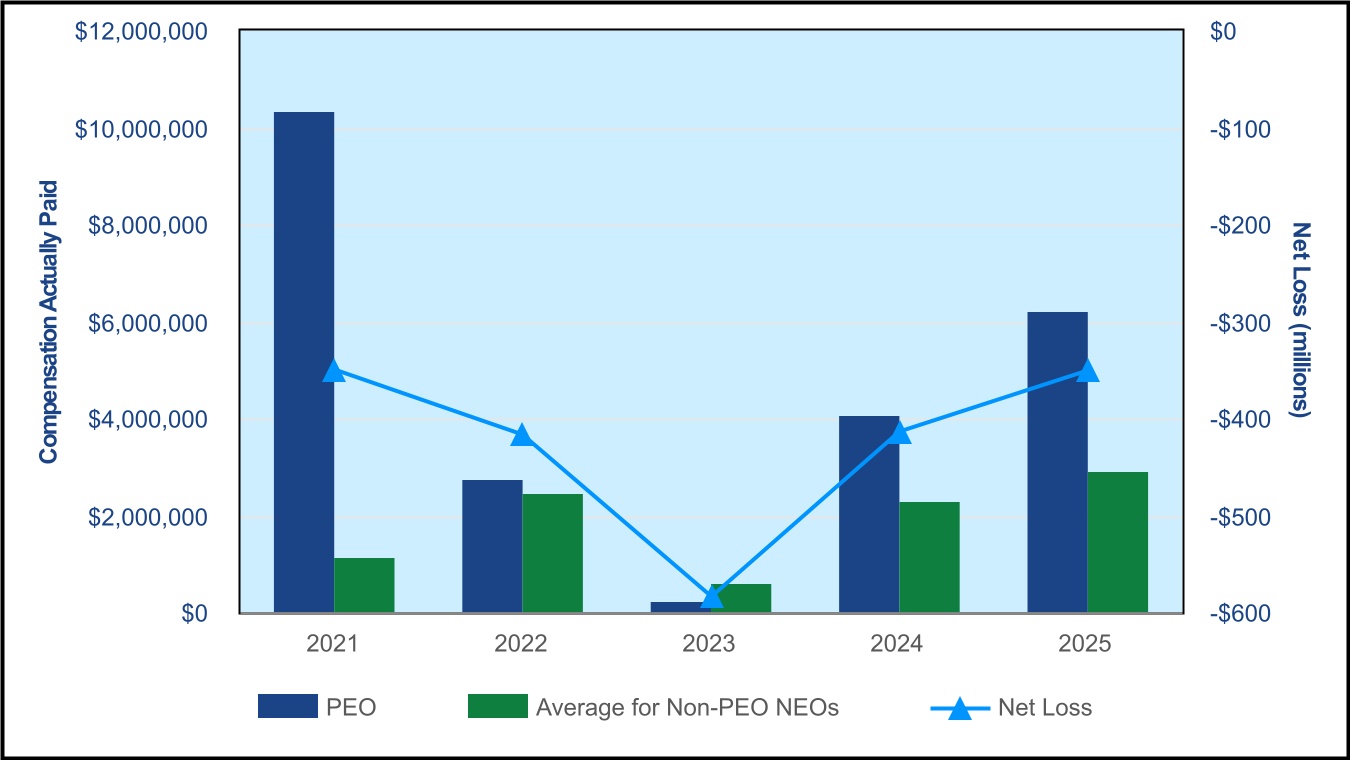
| Compensation Actually Paid vs. Net Income |
Compensation Actually Paid Compared to Net Loss
|
|
|
|
|
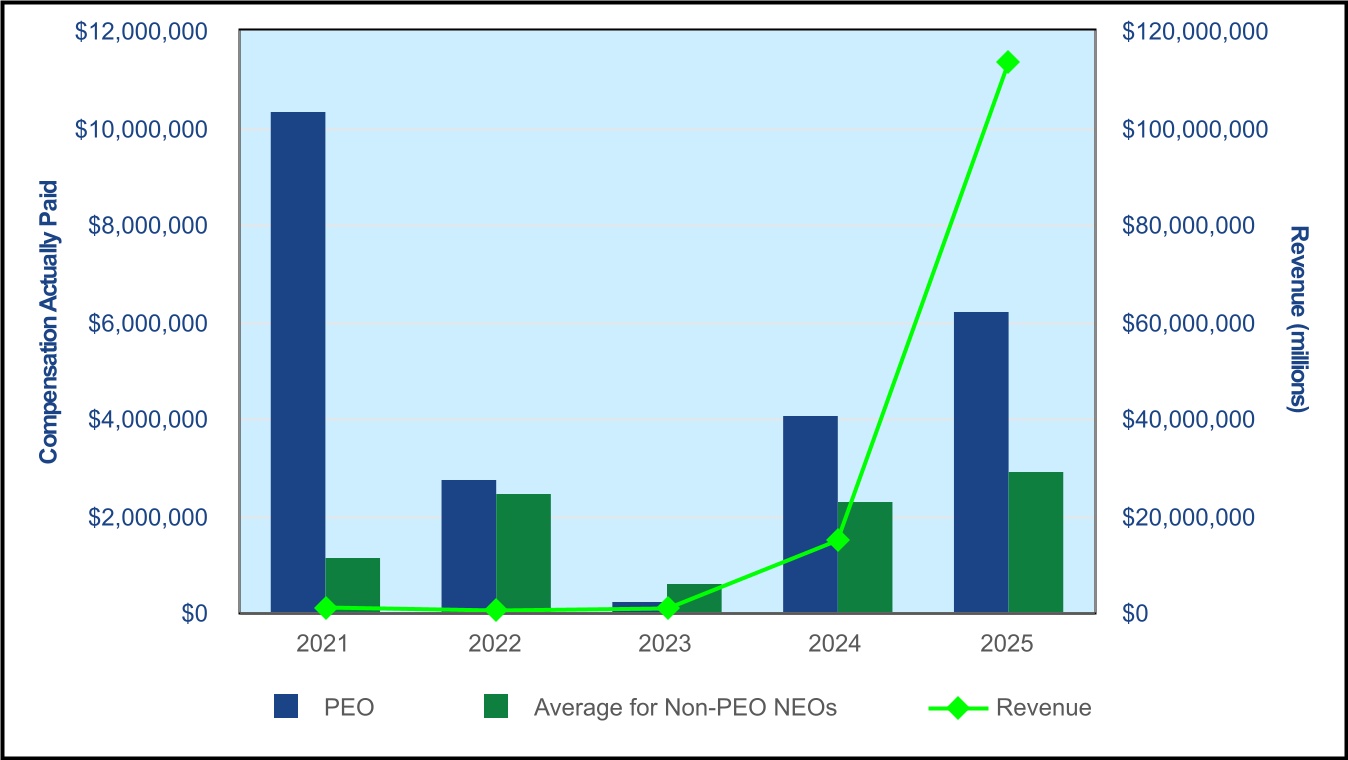
| Compensation Actually Paid vs. Company Selected Measure |
Compensation Actually Paid Compared to Revenue
|
|
|
|
|
| Total Shareholder Return Vs Peer Group |
Compensation Actually Paid Compared to Total Shareholder Return
|
|
|
|
|
| Tabular List, Table |
Pursuant to Item 402(v) of Regulation S-K, the Compensation Committee identified the following Financial and Commercial performance measures used in our STIP and LTIP programs as representing the performance measures used to link “compensation actually paid” in 2025 to the company’s performance: •Revenue •Adjusted EBITDA •Clinical Development Goals (1) _______________ (1)The Clinical Development goals are an operational metric, not a financial performance measure.
|
|
|
|
|
| Total Shareholder Return Amount |
$ 14.85
|
19.20
|
37.66
|
38.03
|
45.61
|
| Peer Group Total Shareholder Return Amount |
119.92
|
90.58
|
91.84
|
88.53
|
99.37
|
| Net Income (Loss) |
$ (351,500,000)
|
$ (413,600,000)
|
$ (583,900,000)
|
$ (417,300,000)
|
$ (349,800,000)
|
| Company Selected Measure Amount |
113,300,000
|
14,700,000
|
600,000
|
200,000
|
900,000
|
| PEO Name |
Richard Adcock
|
|
|
|
|
| Additional 402(v) Disclosure |
The fair value or change in fair value, as applicable, of equity awards was determined in accordance with ASC 718 by reference to (1) for RSU awards, the closing price of our common stock on the applicable measurement date and (2) for option awards, a Black-Scholes valuation model with updated assumptions for time to expiration, closing price of our common stock, volatility, and risk-free rate as of the applicable measurement date. (3)Pursuant to SEC rules, TSR reflects an initial investment of $100 in the company’s common stock on December 31, 2021. Cumulative TSR is calculated by dividing the sum of the cumulative amount of dividends for the measurement period (December 31, 2021 – December 31, 2025), assuming dividend reinvestment, and the difference between the share price at the end and the beginning of the measurement period by the share price at the beginning of the measurement period. The company has never paid cash dividends on its common stock. (4)Peer Group TSR reflects an initial investment of $100 in the Nasdaq Biotechnology Index on December 31, 2021, which is the same index we used in the Stock Performance Graph in our Annual Report. Cumulative TSR is calculated by dividing the sum of the cumulative amount of dividends for the measurement period (December 31, 2021 – December 31, 2025), assuming dividend reinvestment, and the difference between the share price at the end and the beginning of the measurement period by the share price at the beginning of the measurement period.
|
|
|
|
|
| Measure:: 1 |
|
|
|
|
|
| Pay vs Performance Disclosure |
|
|
|
|
|
| Name |
Revenue
|
|
|
|
|
| Measure:: 2 |
|
|
|
|
|
| Pay vs Performance Disclosure |
|
|
|
|
|
| Name |
Adjusted EBITDA
|
|
|
|
|
| Measure:: 3 |
|
|
|
|
|
| Pay vs Performance Disclosure |
|
|
|
|
|
| Name |
Clinical Development Goals
|
|
|
|
|
| PEO | Year-end Fair Value of Equity Awards Granted in Covered Year that are Outstanding and Unvested |
|
|
|
|
|
| Pay vs Performance Disclosure |
|
|
|
|
|
| Adjustment to Compensation, Amount |
$ 4,780,201
|
|
|
|
|
| PEO | Year-over-Year Change in Fair Value of Equity Awards Granted in Prior Years That are Outstanding and Unvested |
|
|
|
|
|
| Pay vs Performance Disclosure |
|
|
|
|
|
| Adjustment to Compensation, Amount |
(626,555)
|
|
|
|
|
| PEO | Change in Fair Value as of Vesting Date of Prior Year Equity Awards Vested in Covered Year |
|
|
|
|
|
| Pay vs Performance Disclosure |
|
|
|
|
|
| Adjustment to Compensation, Amount |
493,544
|
|
|
|
|
| PEO | Summary Compensation Table Value of Stock Awards [Member] |
|
|
|
|
|
| Pay vs Performance Disclosure |
|
|
|
|
|
| Adjustment to Compensation, Amount |
(2,787,828)
|
|
|
|
|
| PEO | Summary Compensation Table Value of Option Awards [Member] |
|
|
|
|
|
| Pay vs Performance Disclosure |
|
|
|
|
|
| Adjustment to Compensation, Amount |
(8,353,406)
|
|
|
|
|
| Non-PEO NEO | Year-end Fair Value of Equity Awards Granted in Covered Year that are Outstanding and Unvested |
|
|
|
|
|
| Pay vs Performance Disclosure |
|
|
|
|
|
| Adjustment to Compensation, Amount |
2,103,288
|
|
|
|
|
| Non-PEO NEO | Year-over-Year Change in Fair Value of Equity Awards Granted in Prior Years That are Outstanding and Unvested |
|
|
|
|
|
| Pay vs Performance Disclosure |
|
|
|
|
|
| Adjustment to Compensation, Amount |
(216,284)
|
|
|
|
|
| Non-PEO NEO | Change in Fair Value as of Vesting Date of Prior Year Equity Awards Vested in Covered Year |
|
|
|
|
|
| Pay vs Performance Disclosure |
|
|
|
|
|
| Adjustment to Compensation, Amount |
174,637
|
|
|
|
|
| Non-PEO NEO | Summary Compensation Table Value of Stock Awards [Member] |
|
|
|
|
|
| Pay vs Performance Disclosure |
|
|
|
|
|
| Adjustment to Compensation, Amount |
(1,226,643)
|
|
|
|
|
| Non-PEO NEO | Summary Compensation Table Value of Option Awards [Member] |
|
|
|
|
|
| Pay vs Performance Disclosure |
|
|
|
|
|
| Adjustment to Compensation, Amount |
$ (3,675,499)
|
|
|
|
|