Pay vs Performance Disclosure - USD ($)
Dec. 31, 2025
Dec. 31, 2024
Dec. 31, 2023
Dec. 31, 2022
Dec. 31, 2021
Pay Versus Performance
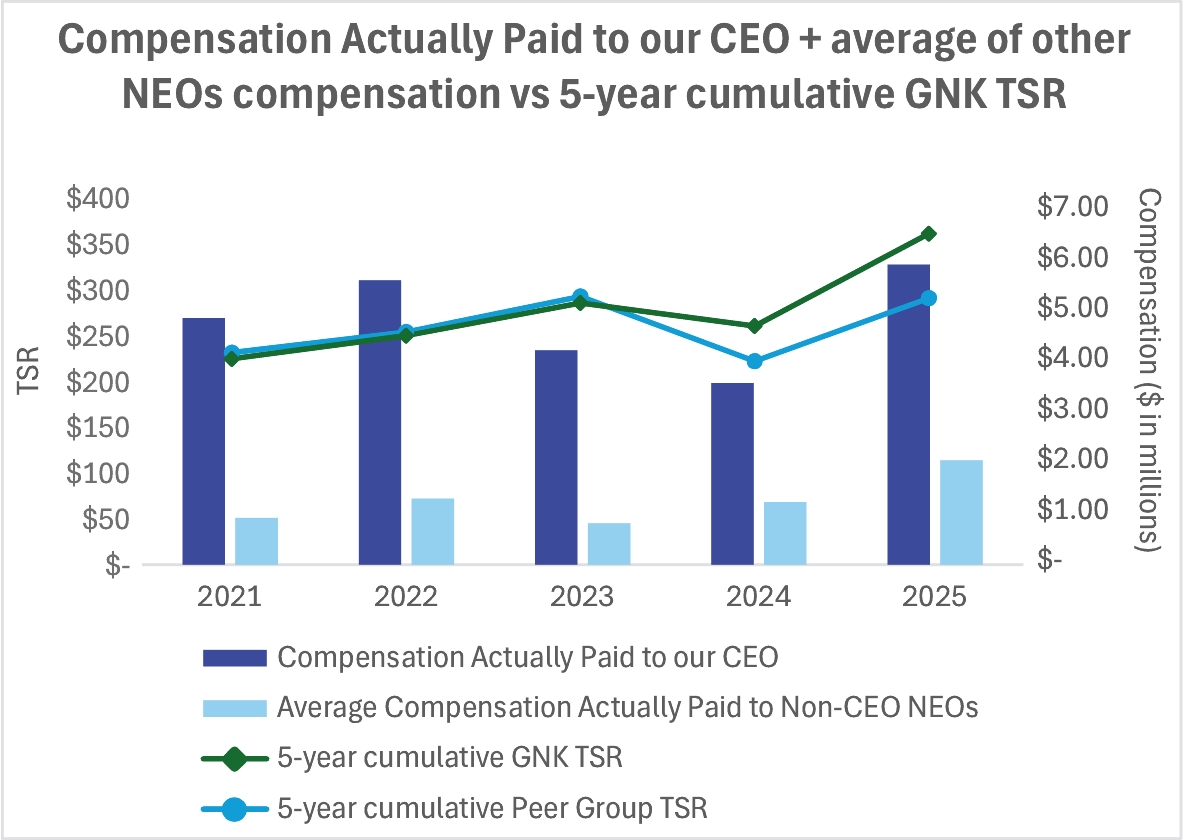
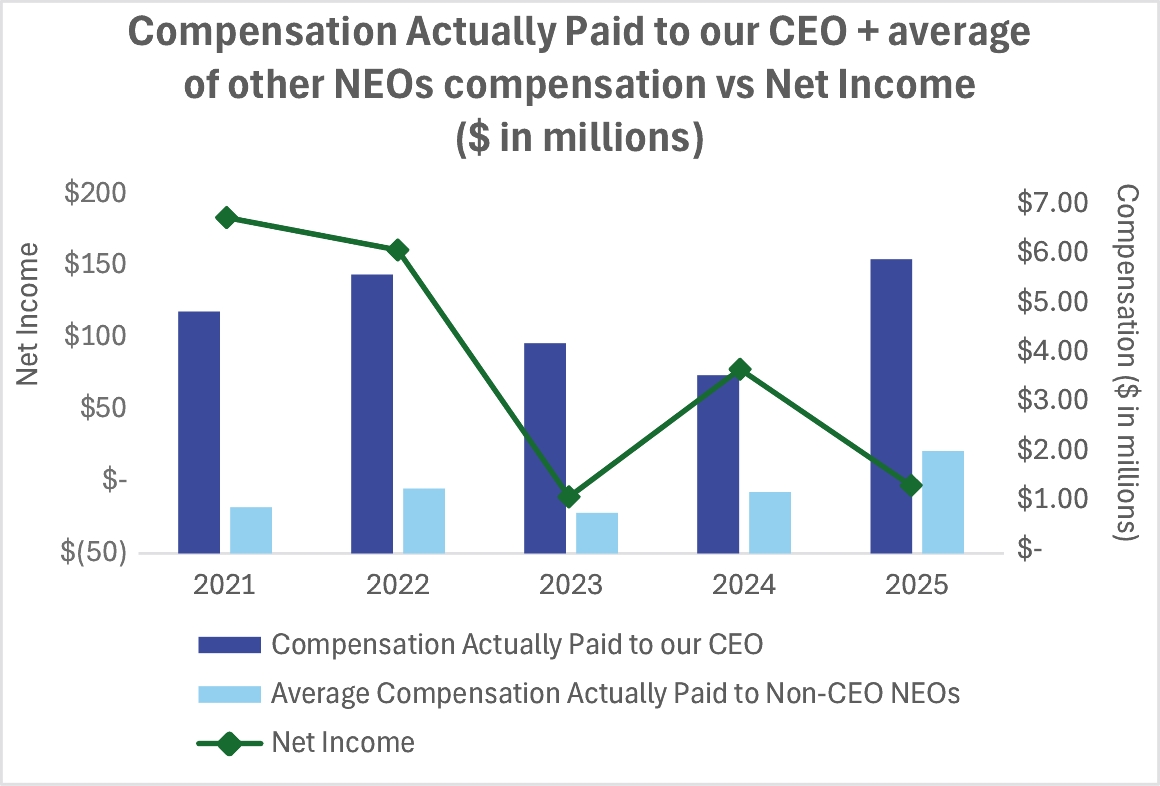
In accordance with SEC rules, we prepared the analysis set forth below of the relationship between the compensation actually paid to our CEO and other named executive officers and certain financial performance measures over the last five fiscal years.
Pay Versus Performance Disclosure Table
Year | Summary Compen- sation Table Total for CEO ($)(1) | Compensation Actually Paid to CEO ($)(2) | Average Summary Compen- sation Table Total for Non-CEO NEOs(3) | Average Compen- sation Actually Paid to Non-CEO NEOs ($)(4) | Value of Initial Fixed $100 Investment Based on: | Net Income (millions) ($) | Adjusted EBITDA (millions) ($)(6) | |||||||||||||||||
Total Shareholder Return ($) | Peer Group Total Shareholder Return ($)(5) | |||||||||||||||||||||||
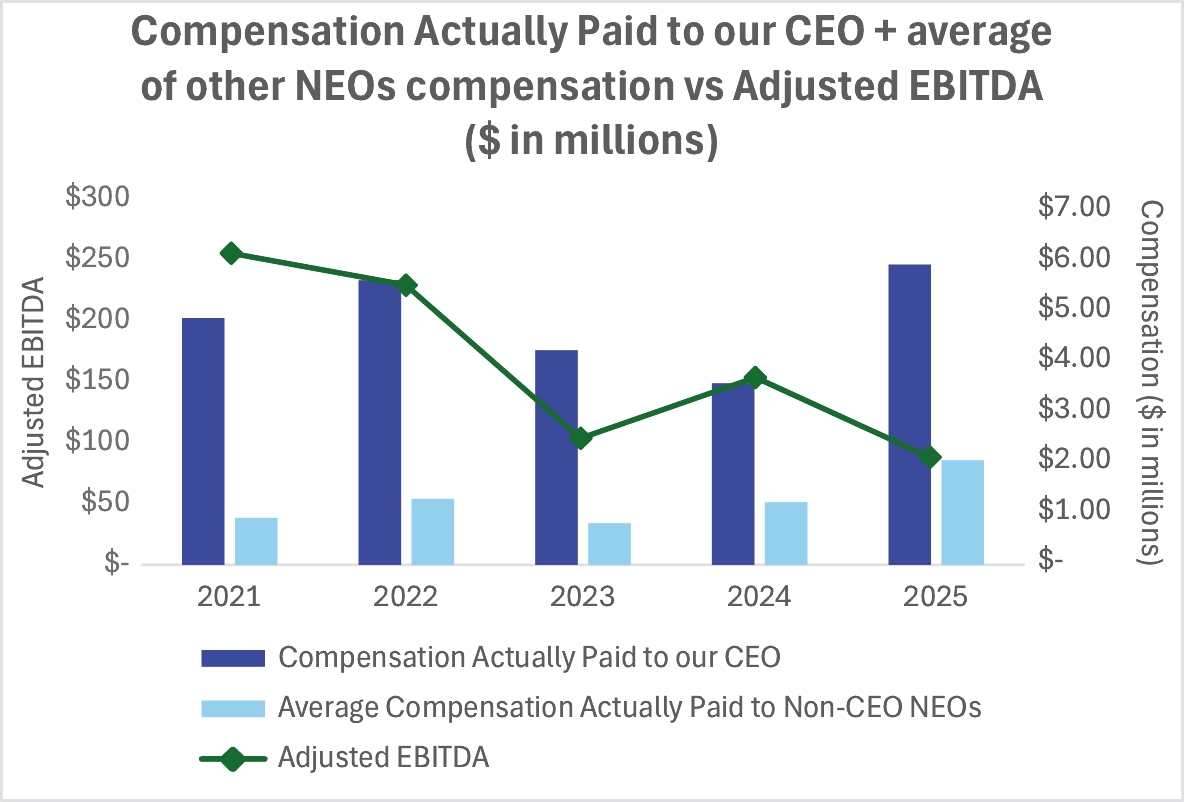
2025 | $3,965,933 | $5,945,310 | $1,475,420 | $2,070,101 | $358 | $288 | ($4.5) | $85.9 | ||||||||||||||||
2024 | $3,966,753 | $3,599,569 | $1,373,241 | $1,243,930 | $258 | $219 | $76.5 | $151.2 | ||||||||||||||||
2023 | $3,166,744 | $4,254,860 | $820,010 | $822,207 | $283 | $290 | ($12.4) | $101.5 | ||||||||||||||||
2022 | $4,906,384 | $5,644,810 | $1,256,393 | $1,308,060 | $247 | $251 | $159.4 | $226.8 | ||||||||||||||||
2021 | $2,593,200 | $4,886,997 | $701,533 | $927,498 | $222 | $229 | $182.0 | $252.9 | ||||||||||||||||
(1) | The dollar amounts reported in this column are the amounts of total compensation reported for Mr. Wobensmith, our Chief Executive Officer and President, for each corresponding year in the “Total” column of the Summary Compensation Table (“SCT”). |
(2) | The dollar amounts reported in this column represent the amount of “Compensation Actually Paid” to Mr. Wobensmith as computed in accordance with Item 402(v) of Regulation S-K. The dollar amounts do not reflect the actual amount of compensation earned by or paid to Mr. Wobensmith during the applicable year. In accordance with the requirements of Item 402(v) of Regulation S-K, the dollar amounts in this column were calculated as follows: |
Adjustments to Determine Compensation Actually Paid for CEO | 2025 | 2024 | 2023 | 2022 | 2021 | ||||||||||
SCT Total for CEO | $3,965,933 | $3,966,753 | $3,166,744 | $4,906,384 | $2,593,200 | ||||||||||
Deduction for Amounts Reported under the “Stock Awards” Column in the SCT | ($2,065,433) | (1,890,703) | (1,412,044) | (3,149,984) | (600,000) | ||||||||||
Deduction for Amounts Reported under the “Option Awards” Column in the SCT | — | — | — | — | (300,000) | ||||||||||
Increase for Fair Value of Awards Granted during year that Remain Unvested as of Year End | $2,613,275 | $1,372,485 | 1,376,554 | 2,827,991 | 1,141,870 | ||||||||||
Increase/deduction for Change in Fair Value from prior Year End to current Year End of Awards Granted Prior to year that were Outstanding and Unvested as of Year end | $1,011,084 | (593,272) | 277,223 | (50,922) | 1,537,011 | ||||||||||
Increase/deduction for Change in Fair Value from Prior Year End to Vesting Date of Awards Granted Prior to year that Vested during year | $161,443 | 287,510 | 630,984 | 727,009 | 471,054 | ||||||||||
Plus: Value of Dividends or Other Earnings Paid on Equity Awards Not Otherwise Reflected in Total Compensation | $259,007 | 456,796 | 215,399 | 384,332 | 43,862 | ||||||||||
Compensation Actually Paid to CEO | $5,945,310 | $3,599,569 | $4,254,860 | $5,644,810 | $4,886,997 | ||||||||||
(3) | The dollar amounts reported in this column represent the average of the amounts reported for our named executive officers as a group (excluding Mr. Wobensmith) in the “Total” column of the SCT in each applicable year. Our named executive officers other than Mr. Wobensmith consist of Messrs. Allen, Adamo and Christensen for 2025 and 2024; Messrs. Allen, Adamo, Christensen, Zafolias, and Hughes for 2023; and Messrs. Adamo, Zafolias, and Hughes for 2022 and 2021. |
(4) | The dollar amounts reported in this column represent the average amount of “compensation actually paid” to the named executive officers as a group (excluding Mr. Wobensmith), as computed in accordance with Item 402(v) of Regulation S-K. The dollar amounts do not reflect the actual average amount of compensation earned by or paid to the named executive officers as a group (excluding Mr. Wobensmith) during the applicable year. In accordance with the requirements of Item 402(v) of Regulation S-K, the dollar amounts in this column were calculated as follows, using the same methodology described above in Note 2: |
Adjustments to Determine Compensation Actually Paid for Non-CEO NEOs | 2025 | 2024 | 2023 | 2022 | 2021 | ||||||||||
Average SCT Total for Non-CEO NEOs | $1,475,420 | $1,373,241 | $820,010 | $1,256,393 | $701,533 | ||||||||||
Deduction for Amounts Reported under the “Stock Awards” Column in the SCT | ($732,920) | (584,191) | (279,261) | (683,327) | (67,778) | ||||||||||
Deduction for Amounts Reported under the “Option Awards” Column in the SCT | — | — | — | — | (33,889) | ||||||||||
Increase for Fair Value of Awards Granted during year that Remain Unvested as of Year End | $924,570 | 427,375 | 275,884 | 624,353 | 128,988 | ||||||||||
Increase/deduction for Change in Fair Value from prior Year End to current Year End of Awards Granted Prior to year that were Outstanding and Unvested as of Year End | $269,774 | (167,048) | 36,187 | (13,231) | 151,827 | ||||||||||
Increase/deduction for Change in Fair Value from Prior Year-End to Vesting Date of Awards Granted Prior to year that Vested during year | $53,697 | 63,390 | 88,301 | 67,587 | 42,198 | ||||||||||
Deduction for Fair Value as of the Prior Fiscal Year End of Equity Awards Granted in Prior Fiscal Years that Failed to Meet Vesting Conditions in the Fiscal Year | — | — | (151,520) | — | — | ||||||||||
Plus: Value of Dividends or Other Earnings Paid on Equity Awards Not Otherwise Reflected in Total Compensation | $79,560 | 131,163 | 32,607 | 56,283 | 4,618 | ||||||||||
Average Compensation Actually Paid to Non-CEO NEOs | $2,070,101 | $1,243,930 | $822,207 | $1,308,060 | $927,498 | ||||||||||
(5) | The peer group used for this purpose is the same as the peer group we use in our annual report to comply with Item 201(e) of Regulation S-K and consists of Star Bulk Carriers Corp., Diana Shipping Inc., Safe Bulkers, Inc., Pacific Basin Shipping Limited, Pangaea Logistics Solutions Ltd., Seanergy Maritime Holdings Corp. and Thorensen Thai Agencies Plc. Eagle Bulk Shipping was removed from this peer group as it ceased to be a publicly traded company in April 2024, and Belships ASA and Golden Ocean Group Limited were removed from this peer group because they were acquired by other companies and ceased to be publicly traded companies in 2025. |
(6) | We have determined that Adjusted EBITDA is the financial performance measure that, in our assessment, represents the most important performance measure (that is not otherwise required to be disclosed in the table) used to link compensation actually paid to our named executives, for the most recently completed fiscal year, to company performance. This measure is used to determine 60% of the 2025 payouts under our 2025 Annual Bonus Program. For a reconciliation of Adjusted EBITDA to Net Income, please see Appendix B. |
(1) | The dollar amounts reported in this column are the amounts of total compensation reported for Mr. Wobensmith, our Chief Executive Officer and President, for each corresponding year in the “Total” column of the Summary Compensation Table (“SCT”). |
(3) | The dollar amounts reported in this column represent the average of the amounts reported for our named executive officers as a group (excluding Mr. Wobensmith) in the “Total” column of the SCT in each applicable year. Our named executive officers other than Mr. Wobensmith consist of Messrs. Allen, Adamo and Christensen for 2025 and 2024; Messrs. Allen, Adamo, Christensen, Zafolias, and Hughes for 2023; and Messrs. Adamo, Zafolias, and Hughes for 2022 and 2021. |
(5) | The peer group used for this purpose is the same as the peer group we use in our annual report to comply with Item 201(e) of Regulation S-K and consists of Star Bulk Carriers Corp., Diana Shipping Inc., Safe Bulkers, Inc., Pacific Basin Shipping Limited, Pangaea Logistics Solutions Ltd., Seanergy Maritime Holdings Corp. and Thorensen Thai Agencies Plc. Eagle Bulk Shipping was removed from this peer group as it ceased to be a publicly traded company in April 2024, and Belships ASA and Golden Ocean Group Limited were removed from this peer group because they were acquired by other companies and ceased to be publicly traded companies in 2025. |
(5) | The peer group used for this purpose is the same as the peer group we use in our annual report to comply with Item 201(e) of Regulation S-K and consists of Star Bulk Carriers Corp., Diana Shipping Inc., Safe Bulkers, Inc., Pacific Basin Shipping Limited, Pangaea Logistics Solutions Ltd., Seanergy Maritime Holdings Corp. and Thorensen Thai Agencies Plc. Eagle Bulk Shipping was removed from this peer group as it ceased to be a publicly traded company in April 2024, and Belships ASA and Golden Ocean Group Limited were removed from this peer group because they were acquired by other companies and ceased to be publicly traded companies in 2025. |
(2) | The dollar amounts reported in this column represent the amount of “Compensation Actually Paid” to Mr. Wobensmith as computed in accordance with Item 402(v) of Regulation S-K. The dollar amounts do not reflect the actual amount of compensation earned by or paid to Mr. Wobensmith during the applicable year. In accordance with the requirements of Item 402(v) of Regulation S-K, the dollar amounts in this column were calculated as follows: |
Adjustments to Determine Compensation Actually Paid for CEO | 2025 | 2024 | 2023 | 2022 | 2021 | ||||||||||
SCT Total for CEO | $3,965,933 | $3,966,753 | $3,166,744 | $4,906,384 | $2,593,200 | ||||||||||
Deduction for Amounts Reported under the “Stock Awards” Column in the SCT | ($2,065,433) | (1,890,703) | (1,412,044) | (3,149,984) | (600,000) | ||||||||||
Deduction for Amounts Reported under the “Option Awards” Column in the SCT | — | — | — | — | (300,000) | ||||||||||
Increase for Fair Value of Awards Granted during year that Remain Unvested as of Year End | $2,613,275 | $1,372,485 | 1,376,554 | 2,827,991 | 1,141,870 | ||||||||||
Increase/deduction for Change in Fair Value from prior Year End to current Year End of Awards Granted Prior to year that were Outstanding and Unvested as of Year end | $1,011,084 | (593,272) | 277,223 | (50,922) | 1,537,011 | ||||||||||
Increase/deduction for Change in Fair Value from Prior Year End to Vesting Date of Awards Granted Prior to year that Vested during year | $161,443 | 287,510 | 630,984 | 727,009 | 471,054 | ||||||||||
Plus: Value of Dividends or Other Earnings Paid on Equity Awards Not Otherwise Reflected in Total Compensation | $259,007 | 456,796 | 215,399 | 384,332 | 43,862 | ||||||||||
Compensation Actually Paid to CEO | $5,945,310 | $3,599,569 | $4,254,860 | $5,644,810 | $4,886,997 | ||||||||||
(4) | The dollar amounts reported in this column represent the average amount of “compensation actually paid” to the named executive officers as a group (excluding Mr. Wobensmith), as computed in accordance with Item 402(v) of Regulation S-K. The dollar amounts do not reflect the actual average amount of compensation earned by or paid to the named executive officers as a group (excluding Mr. Wobensmith) during the applicable year. In accordance with the requirements of Item 402(v) of Regulation S-K, the dollar amounts in this column were calculated as follows, using the same methodology described above in Note 2: |
Adjustments to Determine Compensation Actually Paid for Non-CEO NEOs | 2025 | 2024 | 2023 | 2022 | 2021 | ||||||||||
Average SCT Total for Non-CEO NEOs | $1,475,420 | $1,373,241 | $820,010 | $1,256,393 | $701,533 | ||||||||||
Deduction for Amounts Reported under the “Stock Awards” Column in the SCT | ($732,920) | (584,191) | (279,261) | (683,327) | (67,778) | ||||||||||
Deduction for Amounts Reported under the “Option Awards” Column in the SCT | — | — | — | — | (33,889) | ||||||||||
Increase for Fair Value of Awards Granted during year that Remain Unvested as of Year End | $924,570 | 427,375 | 275,884 | 624,353 | 128,988 | ||||||||||
Increase/deduction for Change in Fair Value from prior Year End to current Year End of Awards Granted Prior to year that were Outstanding and Unvested as of Year End | $269,774 | (167,048) | 36,187 | (13,231) | 151,827 | ||||||||||
Increase/deduction for Change in Fair Value from Prior Year-End to Vesting Date of Awards Granted Prior to year that Vested during year | $53,697 | 63,390 | 88,301 | 67,587 | 42,198 | ||||||||||
Deduction for Fair Value as of the Prior Fiscal Year End of Equity Awards Granted in Prior Fiscal Years that Failed to Meet Vesting Conditions in the Fiscal Year | — | — | (151,520) | — | — | ||||||||||
Plus: Value of Dividends or Other Earnings Paid on Equity Awards Not Otherwise Reflected in Total Compensation | $79,560 | 131,163 | 32,607 | 56,283 | 4,618 | ||||||||||
Average Compensation Actually Paid to Non-CEO NEOs | $2,070,101 | $1,243,930 | $822,207 | $1,308,060 | $927,498 | ||||||||||
Most Important Performance Measures
The following is a list of five financial performance measures that, in our assessment, represent the most important performance measures we used to link compensation for our named executives in 2025 to Company performance:
Adjusted EBITDA | TCE vs. Benchmark | Relative TSR% | Return on Invested Capital | ||||||
Cost vs. Budget | |||||||||
For a further description of these performance measures, please see Appendix B.
(6) | We have determined that Adjusted EBITDA is the financial performance measure that, in our assessment, represents the most important performance measure (that is not otherwise required to be disclosed in the table) used to link compensation actually paid to our named executives, for the most recently completed fiscal year, to company performance. This measure is used to determine 60% of the 2025 payouts under our 2025 Annual Bonus Program. For a reconciliation of Adjusted EBITDA to Net Income, please see Appendix B. |