Pay vs Performance Disclosure - USD ($)
|
12 Months Ended |
Dec. 31, 2025 |
Dec. 31, 2024 |
Dec. 31, 2023 |
| Pay vs Performance Disclosure |
|
|
|
| Pay vs Performance Disclosure, Table |
| | | | | | | | | | | | | | | | | | | | | | | | | | | | | | | | | | | | | | | | Year | | Summary Compensation Table Total for PEO(1) | | Compensation Actually Paid to PEO(2) | | Average Summary Compensation Table Total for Non-PEO NEOs(1) | | Average Compensation Actually Paid to Non-PEO NEOs(2) | | Value of Initial $100 Fixed Investment Based on Total Shareholder Return(3) | | Net Income(4) | | 2025 | | $ | 2,645,442 | | | $ | 3,315,080 | | | $ | 816,633 | | | $ | 944,449 | | | $ | 95.24 | | | $ | 13,188,000 | | | 2024 | | 1,262,464 | | | 945,928 | | | 575,135 | | | 527,028 | | | 69.45 | | | 8,473,000 | | | 2023 | | 1,308,579 | | | (696,252) | | | 641,775 | | | 160,632 | | | 70.44 | | | 5,225,000 | |
|
|
|
| Named Executive Officers, Footnote |
The dollar amounts reported in this column are the amounts of total compensation reported for the PEO and non-PEO NEOs for each corresponding year in the “Total” column of the Summary Compensation Table. Please refer to “Executive Compensation—Summary Compensation Table” for further detail. For the fiscal years 2024 and 2025, Scott C. Wylie was our PEO and Julie A. Courkamp and Matthew C. Cassell were our non-PEO NEOs. For the fiscal year 2023, Scott C. Wylie was our PEO and Julie A. Courkamp and John E. Sawyer were our non-PEO NEOs. Mr. Sawyer resigned from the Company effective March 5, 2024.
|
|
|
| PEO Total Compensation Amount |
$ 2,645,442
|
$ 1,262,464
|
$ 1,308,579
|
| PEO Actually Paid Compensation Amount |
$ 3,315,080
|
945,928
|
(696,252)
|
| Adjustment To PEO Compensation, Footnote |
The amounts shown for Compensation Actually Paid have been calculated in accordance with Item 402(v) of Regulation S-K and do not reflect compensation actually earned, realized, or received by First Western Financial Inc’s NEOs. Equity awards held by the NEOs in each of fiscal years 2025, 2024, and 2023, include stock options, Time Vested Units, and Performance Based Units. The fair value of Performance Based Units as of the end of each applicable fiscal year was determined based on the maximum issuable shares at the then-current threshold amount, as described in the Shareholders’ Equity footnote in the accompanying notes to the consolidated financial statements included in the corresponding fiscal year's Annual Report on Form 10-K. These amounts reflect the Summary Compensation Table totals with certain adjustments, as follows: | | | | | | | | | | | | | | | | | | | | | | | | | | | | | | | | | | | | | | | | | 2025 | | 2024 | | 2023 | | | PEO | | Average for Non-PEO NEOs | | PEO | | Average for Non-PEO NEOs | | PEO | | Average for Non-PEO NEOs | | Summary Compensation Table Total | | $ | 2,645,442 | | | $ | 816,633 | | | $ | 1,262,464 | | | $ | 575,135 | | | $ | 1,308,579 | | | $ | 641,775 | | | Decrease for amounts reported under the Stock Awards column in the Summary Compensation Table | | (1,641,443) | | | (323,921) | | | (399,986) | | | (142,482) | | | (399,989) | | | (174,985) | | | Addition of fair value at year-end of equity awards granted during the year that remain unvested as of year-end | | 2,133,781 | | | 416,359 | | | 461,341 | | | 164,337 | | | 234,529 | | | 102,600 | | | Change in fair value from prior period year-end to vesting date of equity awards granted in prior years that vested during the year | | 53,026 | | | 16,854 | | | (33,401) | | | (13,641) | | | (232,401) | | | (66,132) | | | Change in fair value at year-end of equity awards granted in prior years that remain unvested as of year-end | | 355,492 | | | 105,218 | | | (105,008) | | | (15,439) | | | (1,606,970) | | | (342,626) | | | Change in fair value at year-end of equity awards granted in prior years that failed to meet their performance conditions or were not exercised and expired | | (231,218) | | | (86,694) | | | (239,482) | | | (40,882) | | | — | | | — | | | Compensation Actually Paid | | $ | 3,315,080 | | | $ | 944,449 | | | $ | 945,928 | | | $ | 527,028 | | | $ | (696,252) | | | $ | 160,632 | |
|
|
|
| Non-PEO NEO Average Total Compensation Amount |
$ 816,633
|
575,135
|
641,775
|
| Non-PEO NEO Average Compensation Actually Paid Amount |
$ 944,449
|
527,028
|
160,632
|
| Adjustment to Non-PEO NEO Compensation Footnote |
The amounts shown for Compensation Actually Paid have been calculated in accordance with Item 402(v) of Regulation S-K and do not reflect compensation actually earned, realized, or received by First Western Financial Inc’s NEOs. Equity awards held by the NEOs in each of fiscal years 2025, 2024, and 2023, include stock options, Time Vested Units, and Performance Based Units. The fair value of Performance Based Units as of the end of each applicable fiscal year was determined based on the maximum issuable shares at the then-current threshold amount, as described in the Shareholders’ Equity footnote in the accompanying notes to the consolidated financial statements included in the corresponding fiscal year's Annual Report on Form 10-K. These amounts reflect the Summary Compensation Table totals with certain adjustments, as follows: | | | | | | | | | | | | | | | | | | | | | | | | | | | | | | | | | | | | | | | | | 2025 | | 2024 | | 2023 | | | PEO | | Average for Non-PEO NEOs | | PEO | | Average for Non-PEO NEOs | | PEO | | Average for Non-PEO NEOs | | Summary Compensation Table Total | | $ | 2,645,442 | | | $ | 816,633 | | | $ | 1,262,464 | | | $ | 575,135 | | | $ | 1,308,579 | | | $ | 641,775 | | | Decrease for amounts reported under the Stock Awards column in the Summary Compensation Table | | (1,641,443) | | | (323,921) | | | (399,986) | | | (142,482) | | | (399,989) | | | (174,985) | | | Addition of fair value at year-end of equity awards granted during the year that remain unvested as of year-end | | 2,133,781 | | | 416,359 | | | 461,341 | | | 164,337 | | | 234,529 | | | 102,600 | | | Change in fair value from prior period year-end to vesting date of equity awards granted in prior years that vested during the year | | 53,026 | | | 16,854 | | | (33,401) | | | (13,641) | | | (232,401) | | | (66,132) | | | Change in fair value at year-end of equity awards granted in prior years that remain unvested as of year-end | | 355,492 | | | 105,218 | | | (105,008) | | | (15,439) | | | (1,606,970) | | | (342,626) | | | Change in fair value at year-end of equity awards granted in prior years that failed to meet their performance conditions or were not exercised and expired | | (231,218) | | | (86,694) | | | (239,482) | | | (40,882) | | | — | | | — | | | Compensation Actually Paid | | $ | 3,315,080 | | | $ | 944,449 | | | $ | 945,928 | | | $ | 527,028 | | | $ | (696,252) | | | $ | 160,632 | |
|
|
|
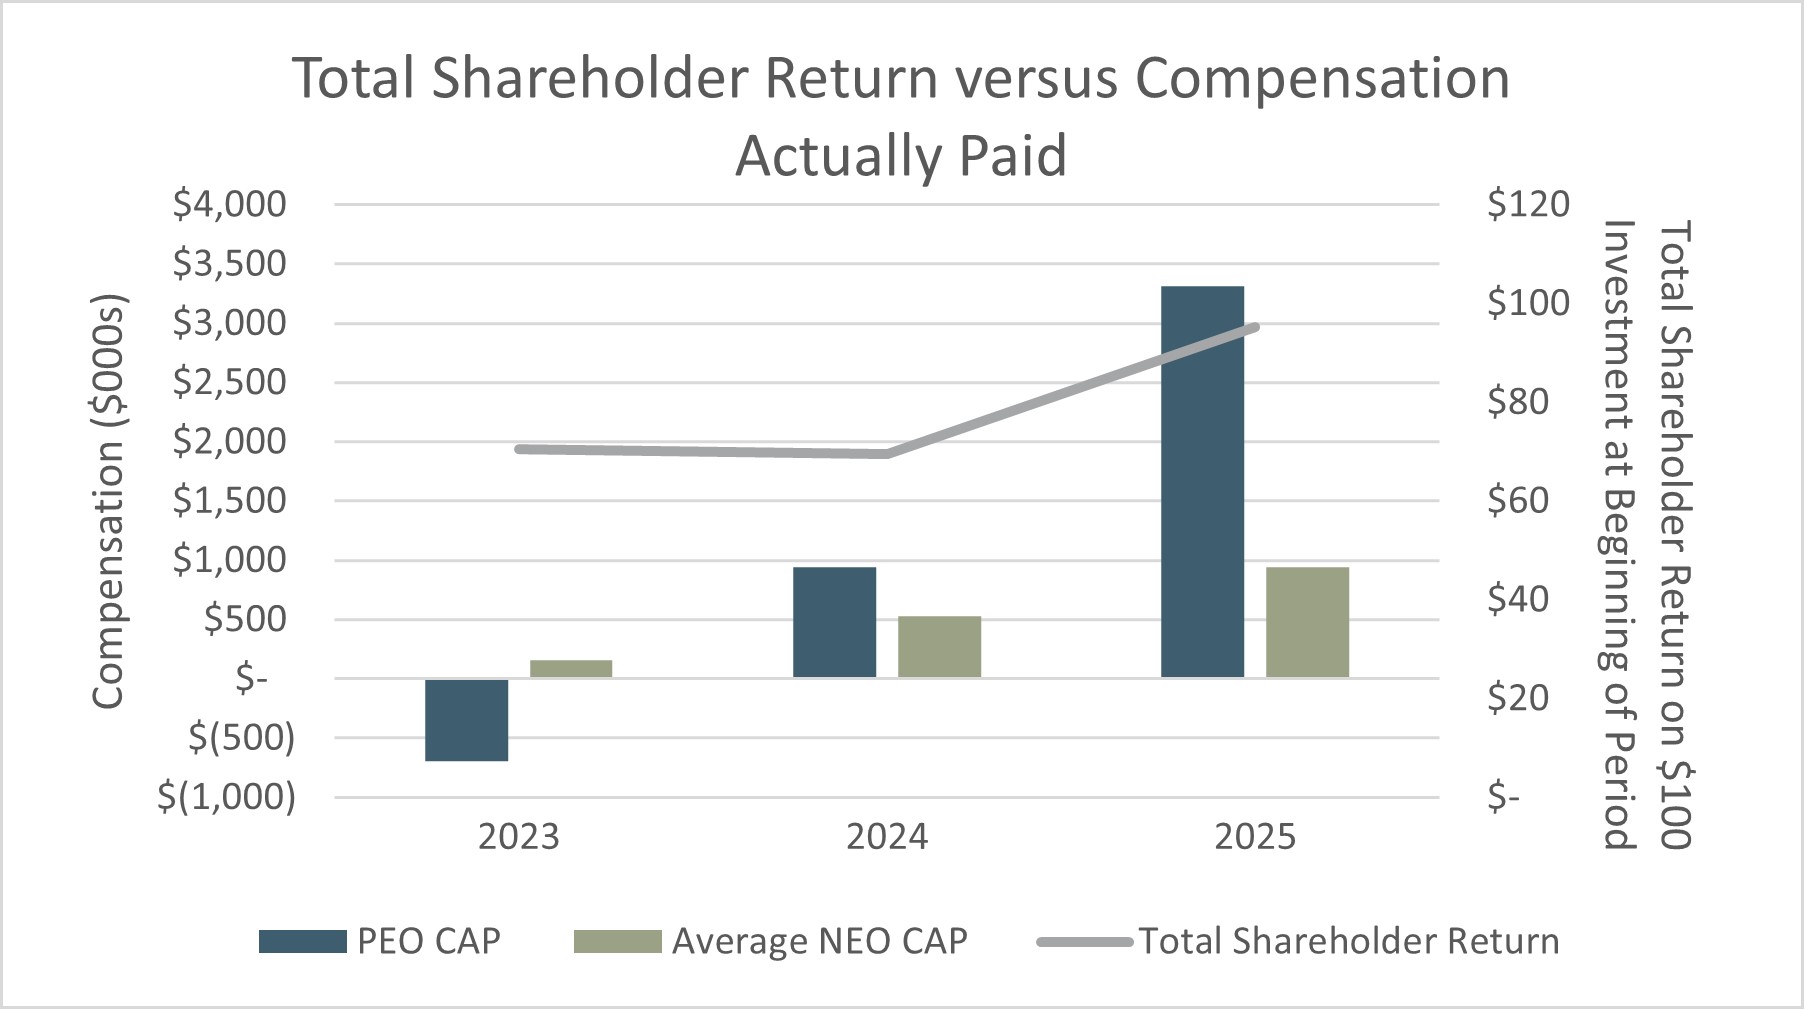
| Compensation Actually Paid vs. Total Shareholder Return |
|
|
|
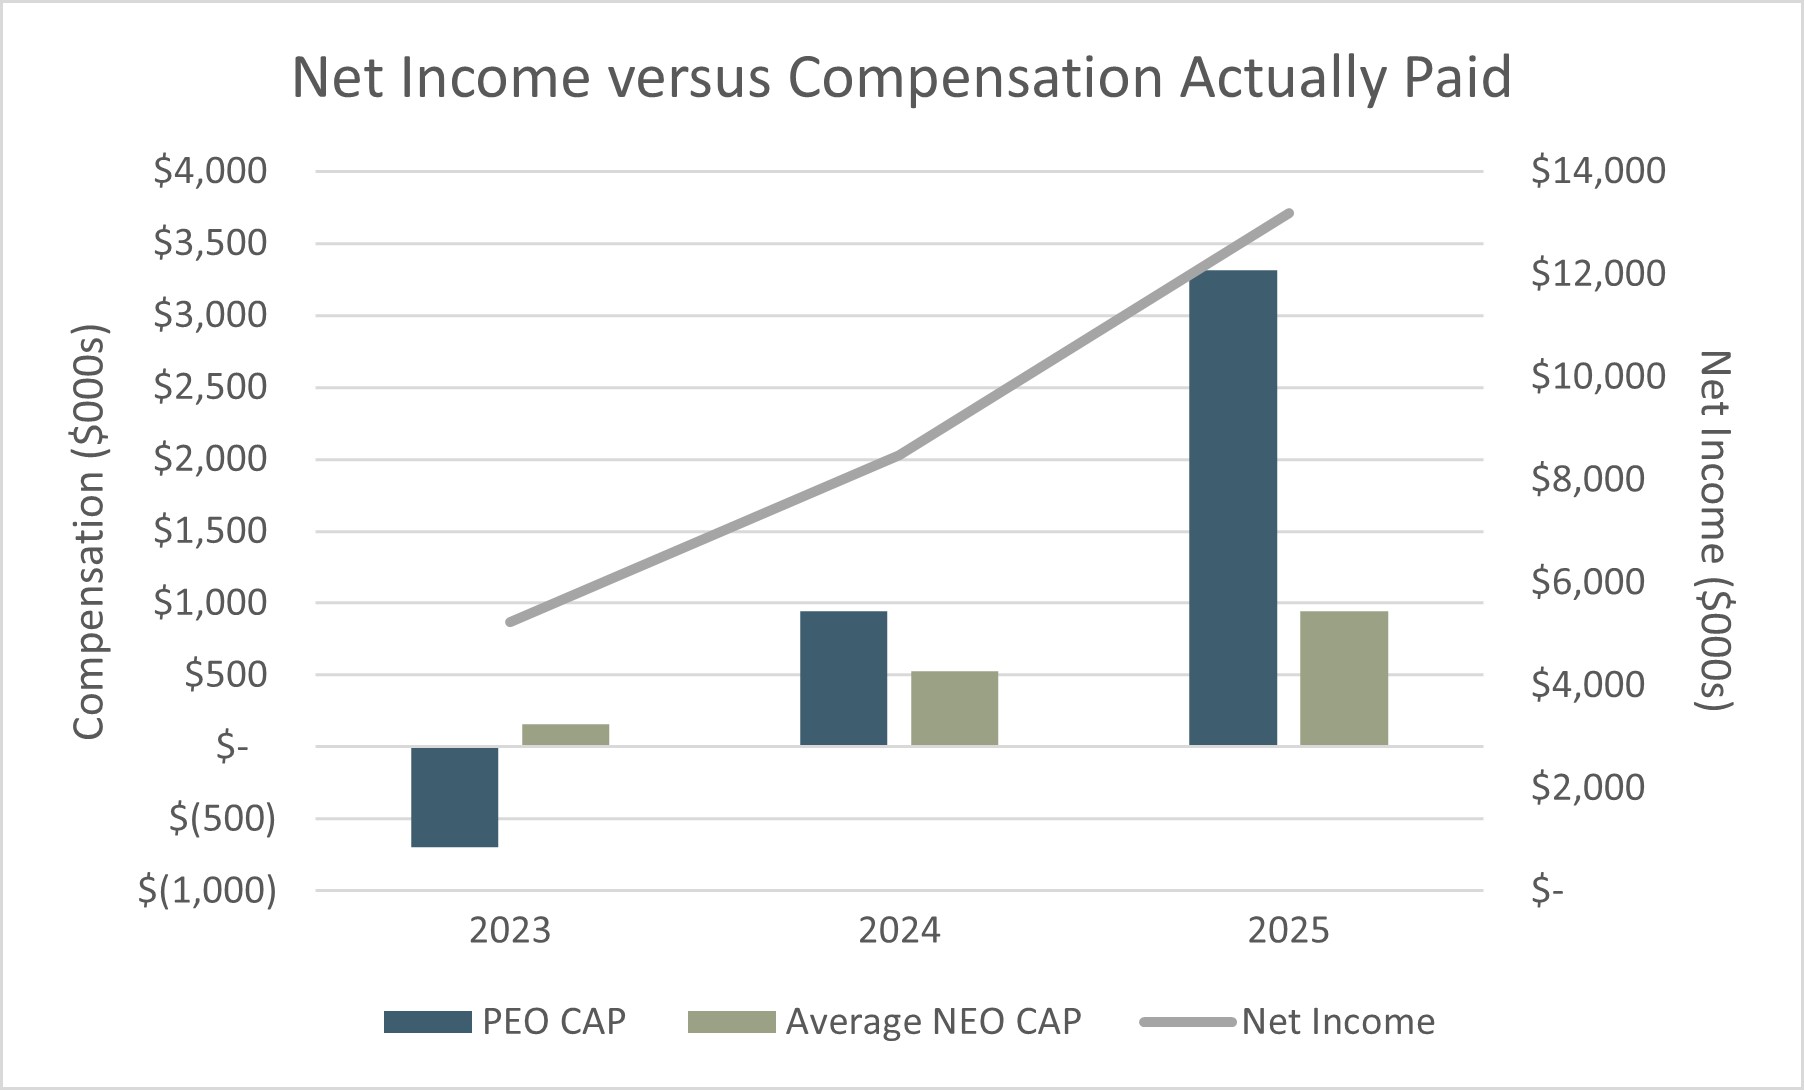
| Compensation Actually Paid vs. Net Income |
|
|
|
| Total Shareholder Return Amount |
$ 95.24
|
69.45
|
70.44
|
| Net Income (Loss) |
$ 13,188,000
|
8,473,000
|
5,225,000
|
| PEO Name |
Scott C. Wylie
|
|
|
| Additional 402(v) Disclosure |
As required by Section 953(a) of the Dodd-Frank Wall Street Reform and Consumer Protection Act (“Dodd-Frank Act”) and Item 402(v) of Regulation S-K, we are providing the following information about the relationship between executive compensation actually paid to our named executive officers and our financial performance. Total Shareholder Return assumes $100 invested on December 31, 2022.Net Income is computed in accordance with U.S. generally accepted accounting principles. The following charts illustrate the relationship between the compensation actually paid to our named executive officers, calculated in accordance with Item 402(v) of Regulation S-K, and First Western's total shareholder returns on a cumulative basis, assuming an investment of $100 on December 31, 2022, and net income over the three most recently completed fiscal years:
|
|
|
| PEO | Aggregate Grant Date Fair Value of Equity Award Amounts Reported in Summary Compensation Table |
|
|
|
| Pay vs Performance Disclosure |
|
|
|
| Adjustment to Compensation, Amount |
$ (1,641,443)
|
(399,986)
|
(399,989)
|
| PEO | Year-end Fair Value of Equity Awards Granted in Covered Year that are Outstanding and Unvested |
|
|
|
| Pay vs Performance Disclosure |
|
|
|
| Adjustment to Compensation, Amount |
2,133,781
|
461,341
|
234,529
|
| PEO | Year-over-Year Change in Fair Value of Equity Awards Granted in Prior Years That are Outstanding and Unvested |
|
|
|
| Pay vs Performance Disclosure |
|
|
|
| Adjustment to Compensation, Amount |
355,492
|
(105,008)
|
(1,606,970)
|
| PEO | Change in Fair Value as of Vesting Date of Prior Year Equity Awards Vested in Covered Year |
|
|
|
| Pay vs Performance Disclosure |
|
|
|
| Adjustment to Compensation, Amount |
53,026
|
(33,401)
|
(232,401)
|
| PEO | Prior Year End Fair Value of Equity Awards Granted in Any Prior Year that Fail to Meet Applicable Vesting Conditions During Covered Year |
|
|
|
| Pay vs Performance Disclosure |
|
|
|
| Adjustment to Compensation, Amount |
(231,218)
|
(239,482)
|
0
|
| Non-PEO NEO | Aggregate Grant Date Fair Value of Equity Award Amounts Reported in Summary Compensation Table |
|
|
|
| Pay vs Performance Disclosure |
|
|
|
| Adjustment to Compensation, Amount |
(323,921)
|
(142,482)
|
(174,985)
|
| Non-PEO NEO | Year-end Fair Value of Equity Awards Granted in Covered Year that are Outstanding and Unvested |
|
|
|
| Pay vs Performance Disclosure |
|
|
|
| Adjustment to Compensation, Amount |
416,359
|
164,337
|
102,600
|
| Non-PEO NEO | Year-over-Year Change in Fair Value of Equity Awards Granted in Prior Years That are Outstanding and Unvested |
|
|
|
| Pay vs Performance Disclosure |
|
|
|
| Adjustment to Compensation, Amount |
105,218
|
(15,439)
|
(342,626)
|
| Non-PEO NEO | Change in Fair Value as of Vesting Date of Prior Year Equity Awards Vested in Covered Year |
|
|
|
| Pay vs Performance Disclosure |
|
|
|
| Adjustment to Compensation, Amount |
16,854
|
(13,641)
|
(66,132)
|
| Non-PEO NEO | Prior Year End Fair Value of Equity Awards Granted in Any Prior Year that Fail to Meet Applicable Vesting Conditions During Covered Year |
|
|
|
| Pay vs Performance Disclosure |
|
|
|
| Adjustment to Compensation, Amount |
$ (86,694)
|
$ (40,882)
|
$ 0
|