Pay vs Performance Disclosure - USD ($)
Dec. 31, 2025
Dec. 31, 2024
Dec. 31, 2023
Dec. 31, 2022
Dec. 31, 2021
| Year | Summary Compensation Table Total for Principal Executive Officer (PEO)(1)(2) | Compensation Actually Paid to PEO(3) | Average Summary Compensation Table Total for Non-PEO NEOs(1)(2) | Average Compensation Actually Paid to Non-PEO NEOs(3) | Value of Initial Fixed $100 Investment Based On: | Net Income (Loss) (millions)(6) | Total Net Product Sales (millions)(7) | |||||||||||||||||||||||||||||||||||||||||||
| Total Stockholder Return(4) | Peer Group Total Stockholder Return(5) | |||||||||||||||||||||||||||||||||||||||||||||||||
| 2025 | $ | 3,851,468 | $ | 7,631,936 | $ | 1,439,407 | $ | 2,422,752 | $ | 67 | $ | 120 | $ | (220.5) | $ | 216.1 | ||||||||||||||||||||||||||||||||||
| 2024 | 3,896,241 | 4,344,635 | 1,346,371 | 1,465,190 | 36 | 91 | (18.9) | 198.8 | ||||||||||||||||||||||||||||||||||||||||||
| 2023 | 3,720,215 | 1,783,986 | 1,363,243 | 788,310 | 32 | 92 | 2.5 | 192.6 | ||||||||||||||||||||||||||||||||||||||||||
| 2022 | 4,269,410 | 859,606 | 1,508,434 | 340,324 | 56 | 89 | 6.3 | 254.4 | ||||||||||||||||||||||||||||||||||||||||||
| 2021 | 6,194,157 | 5,604,622 | 1,963,831 | 2,037,543 | 119 | 99 | 33.2 | 268.7 | ||||||||||||||||||||||||||||||||||||||||||
| Year | Summary Compensation Table Total | (Minus) Grant Date Fair Value of Stock Option and Stock Awards Granted in Fiscal Year | Plus Fair Value at Fiscal Year-End of Outstanding and Unvested Stock Option and Stock Awards Granted in Fiscal Year | Plus/(Minus) Change in Fair Value of Outstanding and Unvested Stock Option and Stock Awards Granted in Prior Fiscal Years | Plus Fair Value at Vesting of Stock Option and Stock Awards Granted in Fiscal Year that Vested During Fiscal Year | Plus/(Minus) Change in Fair Value as of Vesting Date of Stock Option and Stock Awards Granted in Prior Years for which Applicable Vesting Conditions Were Satisfied During Fiscal Year | (Minus) Fair Value as of Prior Fiscal Year-End of Stock Option and Stock Awards Granted in Prior Fiscal Years that Failed to Meet Applicable Vesting Conditions During Fiscal Year | Equals Compensation Actually Paid | ||||||||||||||||||||||||||||||||||||||||||
| ($)(1) | ($)(2) | ($)(3) | ($)(4) | ($)(5) | ($)(6) | ($)(7) | ($) | |||||||||||||||||||||||||||||||||||||||||||
| Dr. Mihael H. Polymeropoulos | ||||||||||||||||||||||||||||||||||||||||||||||||||
| 2025 | $ | 3,851,468 | $ | (2,007,000) | $ | 3,969,000 | $ | 1,860,123 | $ | — | $ | (41,655) | $ | — | $ | 7,631,936 | ||||||||||||||||||||||||||||||||||
| 2024 | 3,896,241 | (1,971,000) | 2,155,500 | 150,953 | — | 112,941 | — | 4,344,635 | ||||||||||||||||||||||||||||||||||||||||||
| 2023 | 3,720,215 | (1,799,375) | 1,035,913 | (923,158) | — | (249,609) | — | 1,783,986 | ||||||||||||||||||||||||||||||||||||||||||
| 2022 | 4,269,410 | (2,757,740) | 1,733,481 | (1,730,772) | — | (654,773) | — | 859,606 | ||||||||||||||||||||||||||||||||||||||||||
| 2021 | 6,194,157 | (4,792,295) | 3,260,927 | 351,870 | — | 589,963 | — | 5,604,622 | ||||||||||||||||||||||||||||||||||||||||||
| Average Other NEOs | ||||||||||||||||||||||||||||||||||||||||||||||||||
| 2025 | $ | 1,439,407 | $ | (557,500) | $ | 1,102,500 | $ | 449,856 | $ | — | $ | (11,511) | $ | — | $ | 2,422,752 | ||||||||||||||||||||||||||||||||||
| 2024 | 1,346,371 | (446,432) | 488,221 | 42,512 | — | 34,518 | — | 1,465,190 | ||||||||||||||||||||||||||||||||||||||||||
| 2023 | 1,363,243 | (509,148) | 293,167 | (273,247) | — | (85,705) | — | 788,310 | ||||||||||||||||||||||||||||||||||||||||||
| 2022 | 1,508,434 | (780,486) | 490,676 | (616,032) | — | (262,268) | — | 340,324 | ||||||||||||||||||||||||||||||||||||||||||
| 2021 | 1,963,831 | (1,285,018) | 874,904 | 187,328 | — | 296,498 | — | 2,037,543 | ||||||||||||||||||||||||||||||||||||||||||
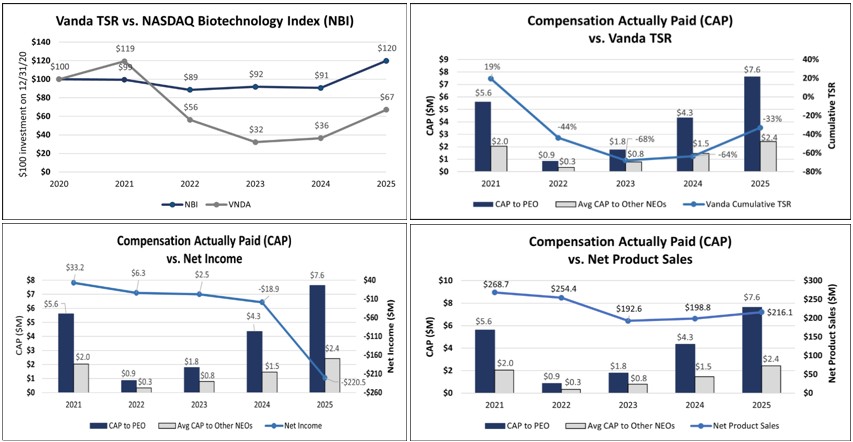
As described in more detail in the section Compensation Discussion and Analysis, the Company’s executive compensation program reflects a variable pay-for-performance philosophy. While the Company utilizes key performance measures to align executive compensation with Company performance, the Company generally seeks to incentivize long-term performance and therefore does not specifically align the Company’s performance measures with compensation that is actually paid (as computed in accordance with Item 402(v) of Regulation S-K) for a particular year. We believe the compensation actually paid in each of the years reported above and over the five-year cumulative period are reflective of the leverage of our executive compensation program towards variable pay elements as the compensation actually paid fluctuated year-over-year, primarily due to the result of our stock performance and our varying levels of achievement against pre-established performance goals under our incentive programs. As such, the CEO and non-CEO “compensation actually paid” each year were aligned with our TSR performance and increased when our TSR performance increased but declined when our TSR performance declined. In accordance with Item 402(v) of Regulation S-K, the Company is providing the following graphics of the relationships related to information presented in the Pay versus Performance table. These charts show, for the past five years, the relationship of the Company’s TSR relative to its peers as well as the relationship between the CEO and non-CEO compensation actually paid and (i) the Company’s TSR; (ii) the Company’s net income; and (iii) the Company’s total net product sales, which includes Fanapt®, HETLIOZ® and PONVORY® net product sales.
As described in more detail in the section Compensation Discussion and Analysis, the Company’s executive compensation program reflects a variable pay-for-performance philosophy. While the Company utilizes key performance measures to align executive compensation with Company performance, the Company generally seeks to incentivize long-term performance and therefore does not specifically align the Company’s performance measures with compensation that is actually paid (as computed in accordance with Item 402(v) of Regulation S-K) for a particular year. We believe the compensation actually paid in each of the years reported above and over the five-year cumulative period are reflective of the leverage of our executive compensation program towards variable pay elements as the compensation actually paid fluctuated year-over-year, primarily due to the result of our stock performance and our varying levels of achievement against pre-established performance goals under our incentive programs. As such, the CEO and non-CEO “compensation actually paid” each year were aligned with our TSR performance and increased when our TSR performance increased but declined when our TSR performance declined. In accordance with Item 402(v) of Regulation S-K, the Company is providing the following graphics of the relationships related to information presented in the Pay versus Performance table. These charts show, for the past five years, the relationship of the Company’s TSR relative to its peers as well as the relationship between the CEO and non-CEO compensation actually paid and (i) the Company’s TSR; (ii) the Company’s net income; and (iii) the Company’s total net product sales, which includes Fanapt®, HETLIOZ® and PONVORY® net product sales.
As described in more detail in the section Compensation Discussion and Analysis, the Company’s executive compensation program reflects a variable pay-for-performance philosophy. While the Company utilizes key performance measures to align executive compensation with Company performance, the Company generally seeks to incentivize long-term performance and therefore does not specifically align the Company’s performance measures with compensation that is actually paid (as computed in accordance with Item 402(v) of Regulation S-K) for a particular year. We believe the compensation actually paid in each of the years reported above and over the five-year cumulative period are reflective of the leverage of our executive compensation program towards variable pay elements as the compensation actually paid fluctuated year-over-year, primarily due to the result of our stock performance and our varying levels of achievement against pre-established performance goals under our incentive programs. As such, the CEO and non-CEO “compensation actually paid” each year were aligned with our TSR performance and increased when our TSR performance increased but declined when our TSR performance declined. In accordance with Item 402(v) of Regulation S-K, the Company is providing the following graphics of the relationships related to information presented in the Pay versus Performance table. These charts show, for the past five years, the relationship of the Company’s TSR relative to its peers as well as the relationship between the CEO and non-CEO compensation actually paid and (i) the Company’s TSR; (ii) the Company’s net income; and (iii) the Company’s total net product sales, which includes Fanapt®, HETLIOZ® and PONVORY® net product sales.
As described in more detail in the section Compensation Discussion and Analysis, the Company’s executive compensation program reflects a variable pay-for-performance philosophy. While the Company utilizes key performance measures to align executive compensation with Company performance, the Company generally seeks to incentivize long-term performance and therefore does not specifically align the Company’s performance measures with compensation that is actually paid (as computed in accordance with Item 402(v) of Regulation S-K) for a particular year. We believe the compensation actually paid in each of the years reported above and over the five-year cumulative period are reflective of the leverage of our executive compensation program towards variable pay elements as the compensation actually paid fluctuated year-over-year, primarily due to the result of our stock performance and our varying levels of achievement against pre-established performance goals under our incentive programs. As such, the CEO and non-CEO “compensation actually paid” each year were aligned with our TSR performance and increased when our TSR performance increased but declined when our TSR performance declined. In accordance with Item 402(v) of Regulation S-K, the Company is providing the following graphics of the relationships related to information presented in the Pay versus Performance table. These charts show, for the past five years, the relationship of the Company’s TSR relative to its peers as well as the relationship between the CEO and non-CEO compensation actually paid and (i) the Company’s TSR; (ii) the Company’s net income; and (iii) the Company’s total net product sales, which includes Fanapt®, HETLIOZ® and PONVORY® net product sales.
As required by Section 953(a) of the Dodd-Frank Wall Street Reform and Consumer Protection Act, and Item 402(v) of Regulation S-K, we are providing the following information about the relationship between executive compensation actually paid, as calculated per SEC disclosure rules, and certain financial performance measures with respect to the Company. Compensation actually paid, as calculated per SEC disclosure rules, differs from the total compensation reported in the Summary Compensation Table in the applicable year due to the impact of changes in our stock price as well as the achievement of the underlying vesting conditions with respect to our equity awards, while compensation reported in the Summary Compensation Table calculates equity awards based on the grant date fair value of such equity awards and does not include any adjustments for failure to achieve the underlying vesting conditions or changes in our stock price. In addition, the Summary Compensation Table total for a given year captures compensation with respect to equity awards granted during such year, while the compensation actually paid captures compensation associated with fluctuations in the value of prior year equity grants. For further information concerning the Company’s variable pay-for-performance philosophy and how the Company aligns executive compensation with the Company’s performance, refer to Compensation Discussion and Analysis.
Amounts reported in this column represent (i) the total compensation reported in the Summary Compensation Table for Dr. Polymeropoulos and (ii) the average of the total compensation reported in the Summary Compensation Table for the applicable year for the Company’s NEOs reported for such year other than Dr. Polymeropoulos.To calculate compensation actually paid, adjustments were made to the amounts reported in the Summary Compensation Table for the applicable year. A reconciliation of the adjustments for Dr. Polymeropoulos and for the average of the other NEOs is set forth following the footnotes to this table. Pursuant to rules of the SEC, the comparison assumes $100 was invested on December 31, 2020 in our common stock. Historic stock price performance is not necessarily indicative of future stock price performance. The dollar amounts reported represent the amount of net income reflected in the Company’s audited financial statements for the applicable year.The performance measures set forth in the table are based on the total net product sales of the three product categories that currently comprise our commercial portfolio: (i) Fanapt® oral tablets for the treatment of bipolar I disorder and schizophrenia, (ii) HETLIOZ® capsules for the treatment of Non-24-Hour Sleep-Wake Disorder (Non-24) and HETLIOZ® capsules and oral suspension (HETLIOZ LQ®) for the treatment of nighttime sleep disturbances in SMS and (iii) PONVORY® for the treatment of RMS, to include clinically isolated syndrome, relapsing-remitting disease and active secondary progressive disease, in adults. Given the importance of Fanapt®, HETLIOZ® and PONVORY® to our business, as discussed further above, the Company has determined that total net product sales, which includes Fanapt®, HETLIOZ® and PONVORY® net product sales, is the financial performance measure that, in the Company’s assessment, represents the most important performance measures used by the Company to link compensation actually paid to the Company’s NEOs to Company performance. Represents Total Compensation as reported in the Summary Compensation Table for the indicated fiscal year. With respect to the Average Other NEOs, amounts shown represent averages of the other NEOs.(2)Represents the grant date fair value of the stock option and stock awards granted during the indicated fiscal year, computed in accordance with the methodology used for financial reporting purposes.
(3)Represents the fair value as of the indicated fiscal year-end of the outstanding and unvested stock option and stock awards granted during such fiscal year, computed in accordance with the methodology used for financial reporting purposes.
(4)Represents the change in fair value during the indicated fiscal year of the outstanding and unvested stock option and stock awards held by the applicable NEO as of the last day of the indicated fiscal year, computed in accordance with the methodology used for financial reporting purposes.
(5)Represents the fair value at vesting of the stock option and stock awards that were granted and vested during the indicated fiscal year, computed in accordance with the methodology used for financial reporting purposes.
(6)Represents the change in fair value, measured from the prior fiscal year-end to the vesting date, of each stock option and stock award that was granted in a prior fiscal year and which vested during the indicated fiscal year, computed in accordance with the methodology used for financial reporting purposes.
(7)Represents the fair value as of the last day of the prior fiscal year of the stock option and stock awards that were granted in a prior fiscal year and which failed to meet the applicable vesting conditions in the indicated fiscal year, computed in accordance with the methodology used for financial reporting purposes.
As described in greater detail in Compensation Discussion and Analysis, the Company’s executive compensation program reflects a variable pay-for-performance philosophy. The metrics that the Company uses for both our long-term and short-term incentive awards are selected based on an objective of incentivizing our NEOs to increase the value of our enterprise for our stockholders. The most important financial performance measure used by the Company to link executive compensation actually paid to the Company’s NEOs, for the most recently completed fiscal year, to the Company’s performance is total net product sales, which includes Fanapt®, HETLIOZ® and PONVORY® net product sales.