Pay vs. Performance
The disclosure included in this section is prescribed by SEC rules and does not necessarily align with how the Company or the CC view the link between the Company’s performance and NEO pay. For additional information about our pay-for-performance philosophy and how we align NEO compensation with Company performance, refer to the “Compensation Discussion and Analysis” section above.
Required Tabular Disclosure of Pay Versus Performance
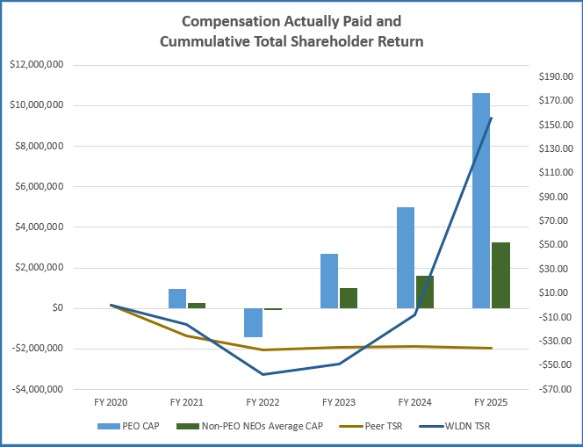
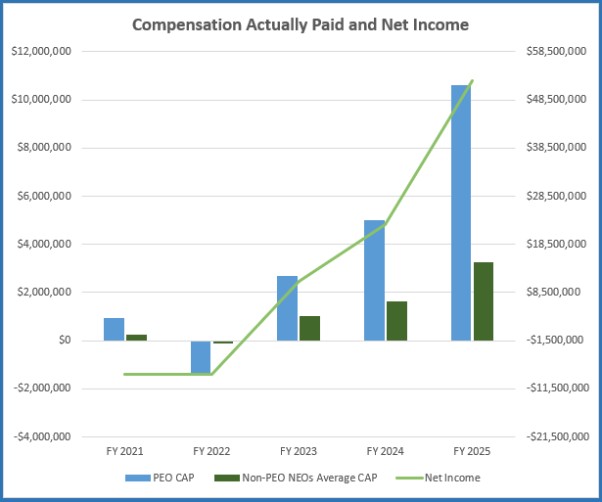
The following table provides information regarding the relationship between “compensation actually paid” to our Principal Executive Officer (“PEO”), and average compensation actually paid to our other NEOs, and certain financial performance of the Company. The amounts set forth below under the headings “Compensation Actually Paid to PEO” and “Average Compensation Actually Paid to Non-PEO NEOs” have been calculated in a manner consistent with Item 402(v) of Regulation S-K. Use of the term “compensation actually paid” is required by the SEC’s rules and as a result of the calculation methodology required by the SEC, such amounts differ from compensation actually received by the individuals and the compensation decisions described in the “Compensation Discussion and Analysis” section above.
Value of Initial Fixed $100 Investment Based on | ||||||||||||||||||||||||
Year | | Summary Compensation Table Total | | Compensation Actually Paid | | Average Summary Compensation Table Total for non-PEO NEOs(3) | | Average | | Total Shareholder Return(4) | | Peer Group | | Net Income | | Company Selected Measure - Adjusted EBITDA(5) | ||||||||
2025 | $ | 3,637,831 | $ | 10,622,314 | $ | 1,386,483 | $ | 3,246,193 | $ | 155.65 | $ | (35.61) | $ | 52,557,000 | $ | 79,538,000 | ||||||||
2024 | $ | 2,400,089 | $ | 4,997,113 | $ | 916,296 | $ | 1,621,300 | $ | (7.92) | $ | (34.13) | $ | 22,570,000 | $ | 56,751,000 | ||||||||
2023 | $ | 1,577,003 | $ | 2,679,260 | $ | 744,688 | $ | 1,022,936 | $ | (48.45) | $ | (34.61) | $ | 10,926,000 | $ | 45,695,000 | ||||||||
2022 | $ | 2,086,033 | $ | (1,401,302) | $ | 895,360 | $ | (95,303) | $ | (57.20) | $ | (37.15) | $ | (8,448,000) | $ | 23,276,000 | ||||||||
2021 | $ | 2,990,848 | $ | 959,656 | $ | 757,809 | $ | 270,012 | $ | (15.59) | $ | (25.15) | $ | (8,417,000) | $ | 27,526,000 | ||||||||
(1) | Mr. Bieber was our principal executive officer for the year 2025 and 2024. Dr. Brisbin was our principal executive officer for the years 2023, 2022, and 2021. |
(2) | Amounts presented under “Compensation Actually Paid” do not reflect actual amounts of compensation paid to the PEO and other Non-PEO NEOs; rather, “Compensation Actually Paid” amounts are calculated in accordance with Item 402(v) of Regulation S-K. The following table presents the detail of amounts deducted and added to the Summary Compensation Table total to calculate “Compensation Actually Paid”. There are no adjustments for pension or dividend payments as the Company does not have supplemental executive retirement plans and does not pay dividends. The valuation assumptions used to calculate fair values of equity awards did not materially differ from those disclosed at the time of grant. |
2025 | ||||||
| PEO | | Average of | |||
Total Compensation as reported on Summary Compensation Table | $ | 3,637,831 | $ | 1,386,483 | ||
Subtract pension values reported in Summary Compensation Table | $ | — | $ | — | ||
Subtract the fair value of stock awards reported in Summary Compensation Table | $ | (1,827,320) | $ | (438,557) | ||
Add pension value attributable to current year’s service and any change in pension value attributable to plan amendments made in the current year | $ | — | $ | — | ||
Add fair value as of end of covered year of equity awards granted in covered year that are unvested and outstanding at end of covered year | $ | 4,693,040 | $ | 1,126,330 | ||
Add dividends paid on unvested shares/share units | $ | — | $ | — | ||
Add change in fair value from end of prior year to end of covered year for equity awards granted in prior years that were outstanding and unvested at end of covered year | $ | 2,511,600 | $ | 809,923 | ||
Add equity awards that are granted and vest in the covered year, the fair value as of the vesting date | $ | — | $ | — | ||
Add change in fair value from end of prior year to vesting date for equity awards granted in prior years that vested during covered year | $ | 1,607,163 | $ | 362,014 | ||
Subtract equity awards granted in prior years that are forfeited in covered year, the fair value of such equity awards as of the end of the prior year | $ | — | $ | — | ||
Compensation Actually Paid | $ | 10,622,314 | $ | 3,246,193 | ||
(3) | In 2025 and 2024, our other NEOs consisted of Creighton K. Early, Chief Financial Officer, and Micah H. Chen, General Counsel. In 2023 and 2022, our other NEOs consisted of Michael A. Bieber, President, Creighton K. Early, Chief Financial Officer, Micah H. Chen, General Counsel, and Paul Whitelaw, former Senior Vice President, Business Development. In 2021, our other NEOs consisted of Michael A. Bieber, President, Creighton K. Early, Chief Financial Officer, Stacy B. McLaughlin, former Chief Financial Officer, Micah H. Chen, General Counsel, and Paul Whitelaw, former Senior Vice President, Business Development.. |
(4) | Total shareholder return assumes that $100 was invested on the measurement date in Willdan Group, Inc. common stock and the peer group as set forth below. This shareholder return assumes reinvestment of all dividends. As part of our independent compensation consultant study, our peer group is analyzed and updated to (i) replace peers that have have been acquired and (ii) ensure the companies in our peer group continue to be comparable in size, business profile, and other factors, in order to be appropriate for the compensation decision-making process. |
(5) | The Company has determined that adjusted EBITDA from operations is the financial performance measure that, in the Company’s assessment, represents the most important performance measure (that is not otherwise required to be disclosed in the table) used by the Company to link compensation actually paid to the Company’s NEOs for the most recently completed fiscal year. Adjusted EBITDA is a non-GAAP measure and it means the Company’s net income (loss) as determined in accordance with GAAP, plus (1) interest expense, (2) income tax expense (benefit), (3) stock-based compensation, (4) interest accretion, (5) depreciation and amortization, (6) (gain) loss on sale of equipment, and (7) plus or minus the effect of any extraordinary item or extraordinary transaction. See Appendix B for the Company’s reconciliation of Net Income to Adjusted EBITDA. |
(1) | Mr. Bieber was our principal executive officer for the year 2025 and 2024. Dr. Brisbin was our principal executive officer for the years 2023, 2022, and 2021. |
(3) | In 2025 and 2024, our other NEOs consisted of Creighton K. Early, Chief Financial Officer, and Micah H. Chen, General Counsel. In 2023 and 2022, our other NEOs consisted of Michael A. Bieber, President, Creighton K. Early, Chief Financial Officer, Micah H. Chen, General Counsel, and Paul Whitelaw, former Senior Vice President, Business Development. In 2021, our other NEOs consisted of Michael A. Bieber, President, Creighton K. Early, Chief Financial Officer, Stacy B. McLaughlin, former Chief Financial Officer, Micah H. Chen, General Counsel, and Paul Whitelaw, former Senior Vice President, Business Development.. |
(4) | Total shareholder return assumes that $100 was invested on the measurement date in Willdan Group, Inc. common stock and the peer group as set forth below. This shareholder return assumes reinvestment of all dividends. As part of our independent compensation consultant study, our peer group is analyzed and updated to (i) replace peers that have have been acquired and (ii) ensure the companies in our peer group continue to be comparable in size, business profile, and other factors, in order to be appropriate for the compensation decision-making process. |
(2) | Amounts presented under “Compensation Actually Paid” do not reflect actual amounts of compensation paid to the PEO and other Non-PEO NEOs; rather, “Compensation Actually Paid” amounts are calculated in accordance with Item 402(v) of Regulation S-K. The following table presents the detail of amounts deducted and added to the Summary Compensation Table total to calculate “Compensation Actually Paid”. There are no adjustments for pension or dividend payments as the Company does not have supplemental executive retirement plans and does not pay dividends. The valuation assumptions used to calculate fair values of equity awards did not materially differ from those disclosed at the time of grant. |
2025 | ||||||
| PEO | | Average of | |||
Total Compensation as reported on Summary Compensation Table | $ | 3,637,831 | $ | 1,386,483 | ||
Subtract pension values reported in Summary Compensation Table | $ | — | $ | — | ||
Subtract the fair value of stock awards reported in Summary Compensation Table | $ | (1,827,320) | $ | (438,557) | ||
Add pension value attributable to current year’s service and any change in pension value attributable to plan amendments made in the current year | $ | — | $ | — | ||
Add fair value as of end of covered year of equity awards granted in covered year that are unvested and outstanding at end of covered year | $ | 4,693,040 | $ | 1,126,330 | ||
Add dividends paid on unvested shares/share units | $ | — | $ | — | ||
Add change in fair value from end of prior year to end of covered year for equity awards granted in prior years that were outstanding and unvested at end of covered year | $ | 2,511,600 | $ | 809,923 | ||
Add equity awards that are granted and vest in the covered year, the fair value as of the vesting date | $ | — | $ | — | ||
Add change in fair value from end of prior year to vesting date for equity awards granted in prior years that vested during covered year | $ | 1,607,163 | $ | 362,014 | ||
Subtract equity awards granted in prior years that are forfeited in covered year, the fair value of such equity awards as of the end of the prior year | $ | — | $ | — | ||
Compensation Actually Paid | $ | 10,622,314 | $ | 3,246,193 | ||
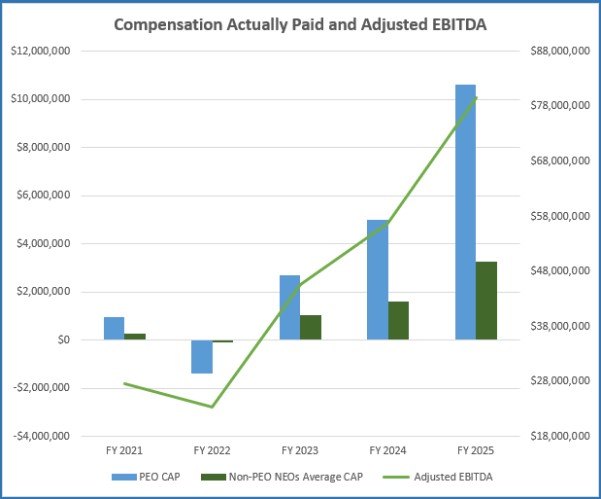
As described in detail in the CD&A, the Company’s executive compensation program consists of several compensation elements reflecting the Company’s pay-for-performance philosophy. The most important financial performance measures used to link compensation actually paid to the Company’s NEOs with the Company’s performance for 2025 are as follows:
§ Adjusted EBITDA
§ Adjusted Diluted Earnings per Share
§ Net Revenue
§ Relative Total Shareholder Return
(5) | The Company has determined that adjusted EBITDA from operations is the financial performance measure that, in the Company’s assessment, represents the most important performance measure (that is not otherwise required to be disclosed in the table) used by the Company to link compensation actually paid to the Company’s NEOs for the most recently completed fiscal year. Adjusted EBITDA is a non-GAAP measure and it means the Company’s net income (loss) as determined in accordance with GAAP, plus (1) interest expense, (2) income tax expense (benefit), (3) stock-based compensation, (4) interest accretion, (5) depreciation and amortization, (6) (gain) loss on sale of equipment, and (7) plus or minus the effect of any extraordinary item or extraordinary transaction. See Appendix B for the Company’s reconciliation of Net Income to Adjusted EBITDA. |