Average | ||||||||||||
Summary | Average | Value of | ||||||||||
Summary | Compensation | compensation | initial fixed | |||||||||
Compensation | Compensation | Table Total | Actual Paid to | $100 | ||||||||
Table Total | Actually paid | for Non-PEO | Non-PEO | Investment | Net Loss | |||||||
for PEO(1)(2) | to PEO(3) | NEOs(4)(5) | NEOs(6) | Based on TSR | (in thousands) | |||||||
Year | | ($) | | ($) | | ($) | | ($) | | ($) | | ($) |
2025 | 1,327,195 | 1,372,644 | 821,360 | 841,838 | 120.87 | (74,898) | ||||||
2024 | 1,010,565 | 876,272 | 727,047 | 652,772 | 100.00 | (53,189) | ||||||
2023 | 1,133,845 | 1,264,503 | 726,784 | 814,529 | 133.91 | (30,656) |
| (1) | The principal executive officer (the “PEO”) was Mr. Cash in 2023, 2024, and 2025. Mr. Cash was our CEO for most of 2025 prior to his retirement in late 2025. Mr. Gili assumed the CEO position at that time. |
| (2) | Reflects the total compensation reported in the Summary Compensation Table for Mr. Cash in 2023, 2024, and 2025. |
| (3) | Represents the total compensation reported in the Summary Compensation Table adjusted in accordance with Item 402(v) of Regulation S-K. The adjustments are described more fully in the following table. |
| (4) | The Non-PEO NEOs were Mr. Gili, Mr. Hatten, and Mr. Smith in 2023, 2024, and 2025. |
| (5) | Reflects the average total compensation reported in the Summary Compensation Table for Messrs. Gili, Hatten and Smith for 2023, 2024, and 2025. |
| (6) | Represents the average total compensation reported in the Summary Compensation Table adjusted in accordance with Item 402(v) of Regulation S-K. The adjustments are described more fully in the following table. |
Summary Compensation Table Adjustments to Arrive at Compensation Actually Paid
The table below provides the adjustments to the Summary Compensation Table amounts shown in the previous table to arrive at the compensation actually paid to the PEO and the average compensation actually paid to the non-PEO NEOs.
2025 | 2024 | 2023 | |||||||||||
| | Non-PEO | | | Non-PEO | | | Non-PEO | | ||||
PEO | NEO | PEO | NEO | PEO | NEO | ||||||||
Totals(1) | Averages(2) | Totals(1) | Averages(2) | Totals(1) | Averages(2) | ||||||||
Description | | ($) | | ($) | | ($) | | ($) | | ($) | | ($) | |
Summary compensation table Total compensation(3) | 1,327,195 | 821,360 | 1,010,565 | 727,047 | 1,133,845 | 726,784 | |||||||
Subtract summary compensation table Stock awards(3) | (94,074) | (66,962) | (76,067) | (44,941) | (71,214) | (40,958) | |||||||
Subtract summary compensation table Option awards(3) | (186,689) | (169,378) | (158,620) | (93,712) | (160,041) | (92,050) | |||||||
Add fair value of awards granted during the covered year that are unvested at year end, determined as of covered year end(4) | 255,431 | 223,695 | 209,165 | 123,574 | 230,146 | 132,371 | |||||||
Add change in fair value of awards granted in prior years that are unvested as of covered year end, determined based on the change in fair value from prior year end to covered year end(5) | 50,828 | 20,019 | (84,774) | (42,311) | 89,836 | 42,021 | |||||||
Add change in fair value of awards granted in prior years that vest in the covered year, determined based on the change in fair value from prior year end to covered year vesting date(6) | 19,953 | 13,104 | (23,997) | (16,885) | 41,931 | 46,361 | |||||||
Compensation actually paid | 1,372,644 | 841,838 | 876,272 | 652,772 | 1,264,503 | 814,529 | |||||||
| (1) | The PEO was Mr. Cash in 2023, 2024, and 2025. Mr. Cash was our CEO for most of 2025 prior to his retirement in late 2025. Mr. Gili assumed the CEO position at that time. |
| (2) | The Non-PEO NEOs were Mr. Gili, Mr. Hatten, and Mr. Smith in 2023, 2024, and 2025. |
| (3) | Reflects the total compensation, stock awards, and option awards reported in the Summary Compensation Table for the PEO and average compensation, stock awards, and option awards reported in the Summary Compensation Table for the non-PEO NEOs. |
| (4) | Reflects the fair value of the awards granted during the covered year that were unvested at the covered year end. The fair values were determined as of December 31 of each respective covered year. |
| (5) | Reflects the change in the fair value of the awards granted prior to the covered year that were unvested as of the covered year end. The change in the fair value of the awards was determined based on the change in the fair value from December 31 of each respective prior year end to December 31 of each respective covered year. |
| (6) | Reflects the change in the fair value of the awards granted prior to the covered year that vested in the covered year. The change in the fair value of the awards was determined based on the change in the fair value from December 31 of each respective prior year end to the vesting date of the awards in the respective covered year. |
Per SEC rules, CAP was calculated by adjusting the Summary Compensation Table total and average compensation in the covered year as described in the above Summary Compensation Table Adjustments to Arrive at Compensation Actually Paid table. Changes in the market price of our Common Shares following the grant date of an award can significantly influence the CAP calculations.
The following table is intended to assist in understanding the CAP changes in the above tables:
| 2023 | | 2024 | | 2025 | |
Canadian dollar share price used for CAP and TSR calculations(1) | 2.02 | 1.64 | 1.88 |
| (1) | The Company’s stock and option awards are priced in Canadian dollars in accordance with the terms of the Amended and Restated Stock Option and RSU&EI Plans. All award adjustments in the Summary Compensation Table Adjustments to Arrive at Compensation Actually Paid table above are initially calculated in Canadian dollars and then converted to U.S. dollars using exchange rates in effect for the respective periods. |
The change in the market price of our Common Shares can greatly impact CAP calculations. Our share price decreased from Canadian $2.02 in 2023 to Canadian $1.64 in 2024 and increased to Canadian $1.88 in 2025. These changes significantly influenced the 2024 and 2025 CAP adjustments noted in the preceding Summary Compensation Table Adjustments to Arrive at Compensation Actually Paid.
| (1) | The principal executive officer (the “PEO”) was Mr. Cash in 2023, 2024, and 2025. Mr. Cash was our CEO for most of 2025 prior to his retirement in late 2025. Mr. Gili assumed the CEO position at that time. |
The table below provides the adjustments to the Summary Compensation Table amounts shown in the previous table to arrive at the compensation actually paid to the PEO and the average compensation actually paid to the non-PEO NEOs.
2025 | 2024 | 2023 | |||||||||||
| | Non-PEO | | | Non-PEO | | | Non-PEO | | ||||
PEO | NEO | PEO | NEO | PEO | NEO | ||||||||
Totals(1) | Averages(2) | Totals(1) | Averages(2) | Totals(1) | Averages(2) | ||||||||
Description | | ($) | | ($) | | ($) | | ($) | | ($) | | ($) | |
Summary compensation table Total compensation(3) | 1,327,195 | 821,360 | 1,010,565 | 727,047 | 1,133,845 | 726,784 | |||||||
Subtract summary compensation table Stock awards(3) | (94,074) | (66,962) | (76,067) | (44,941) | (71,214) | (40,958) | |||||||
Subtract summary compensation table Option awards(3) | (186,689) | (169,378) | (158,620) | (93,712) | (160,041) | (92,050) | |||||||
Add fair value of awards granted during the covered year that are unvested at year end, determined as of covered year end(4) | 255,431 | 223,695 | 209,165 | 123,574 | 230,146 | 132,371 | |||||||
Add change in fair value of awards granted in prior years that are unvested as of covered year end, determined based on the change in fair value from prior year end to covered year end(5) | 50,828 | 20,019 | (84,774) | (42,311) | 89,836 | 42,021 | |||||||
Add change in fair value of awards granted in prior years that vest in the covered year, determined based on the change in fair value from prior year end to covered year vesting date(6) | 19,953 | 13,104 | (23,997) | (16,885) | 41,931 | 46,361 | |||||||
Compensation actually paid | 1,372,644 | 841,838 | 876,272 | 652,772 | 1,264,503 | 814,529 | |||||||
| (1) | The PEO was Mr. Cash in 2023, 2024, and 2025. Mr. Cash was our CEO for most of 2025 prior to his retirement in late 2025. Mr. Gili assumed the CEO position at that time. |
| (2) | The Non-PEO NEOs were Mr. Gili, Mr. Hatten, and Mr. Smith in 2023, 2024, and 2025. |
| (3) | Reflects the total compensation, stock awards, and option awards reported in the Summary Compensation Table for the PEO and average compensation, stock awards, and option awards reported in the Summary Compensation Table for the non-PEO NEOs. |
| (4) | Reflects the fair value of the awards granted during the covered year that were unvested at the covered year end. The fair values were determined as of December 31 of each respective covered year. |
| (5) | Reflects the change in the fair value of the awards granted prior to the covered year that were unvested as of the covered year end. The change in the fair value of the awards was determined based on the change in the fair value from December 31 of each respective prior year end to December 31 of each respective covered year. |
| (6) | Reflects the change in the fair value of the awards granted prior to the covered year that vested in the covered year. The change in the fair value of the awards was determined based on the change in the fair value from December 31 of each respective prior year end to the vesting date of the awards in the respective covered year. |
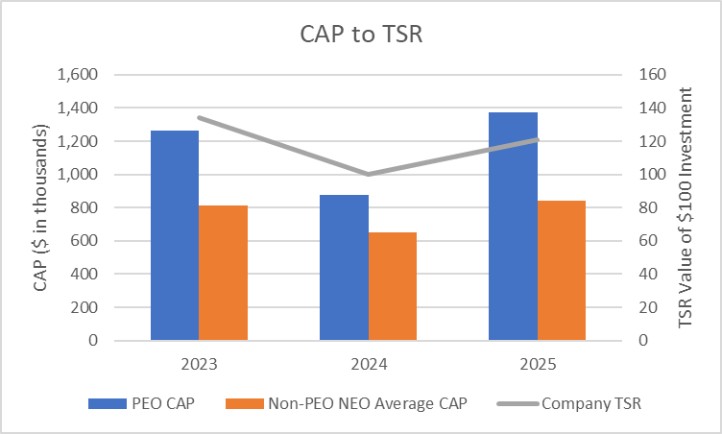
The following chart shows the relationship between CAP and the Company’s TSR for the covered periods.
The following chart shows the relationship between CAP and the Company’s net loss for the covered periods.
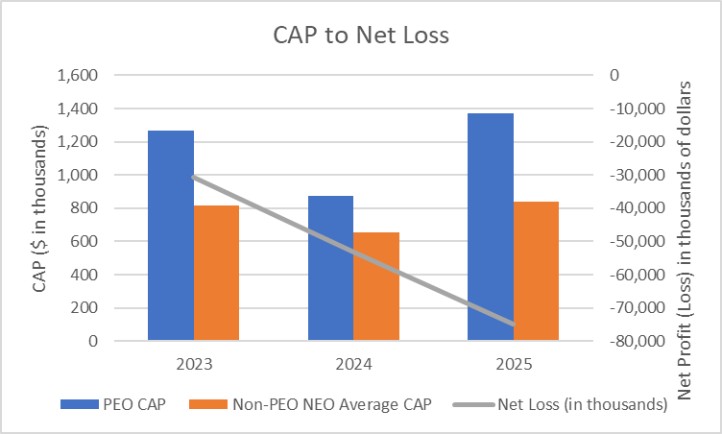
Our net loss increased from $30.7 million in 2023, to $53.2 million in 2024, and to $74.9 million in 2025. After not being in commercial production for several years in response to depressed uranium prices, we initiated production activities at Lost Creek in 2023 in response to a recovering uranium market and significantly increased development expenditures, which led to increased losses. In 2024 and 2025, ramp up and optimization activities continued at Lost Creek while we initiated and continued construction and development at Shirley Basin. Because we initiated production at Lost Creek in 2023 and incurred significant expenditures for development costs at both Lost Creek and Shirley Basin in 2024 and 2025, our net loss does not necessarily align with how the Company or our Compensation Committee views the link between the Company’s performance and executive pay. Therefore, we do not rely on the relationship of net income to executive compensation, nor directly target it as an incentive, in our compensation program.
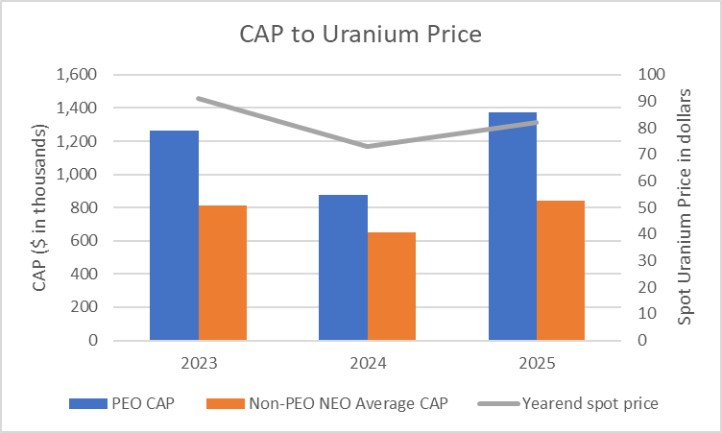
However, our business and industry are heavily dependent upon the market price for uranium, which performed similarly to our share price performance, as shown in the following chart.