Pay vs Performance Disclosure
|
12 Months Ended |
24 Months Ended |
36 Months Ended |
|
Dec. 31, 2025
USD ($)
|
Dec. 31, 2024
USD ($)
|
Dec. 31, 2023
USD ($)
|
Dec. 31, 2022
USD ($)
|
Dec. 31, 2021
USD ($)
|
Dec. 31, 2025 |
Dec. 31, 2023 |
| Pay vs Performance Disclosure |
|
|
|
|
|
|
|
| Pay vs Performance Disclosure, Table |
| | | | | | | | | | | | | | | | | | | | | | | | | | | | Year | Summary Compensation Table Total for PEO(1) | Compensation Actually Paid to PEO(1)(2) | Average Summary Compensation Table Total for Non-PEO NEOs(3) | Average Compensation Actually Paid to Non-PEO NEOs(2)(3) | Value of Initial Fixed $100 Investment Based On: | Net Income (in ‘000s) | Growth in Fully Diluted Book Value per Share(5) | | Total Shareholder Return | Peer Group Total Shareholder Return(4) | | | | | | | | | | | | | | | | | | | (a) | (b) | (c) | (d) | (e) | (f) | (g) | (h) | (i) | 2025 | $3,314,610 | $2,825,712 | $1,299,725 | $1,307,161 | $199.45 | $234.32 | $74,832 | 13.8 | % | 2024 | $2,323,230 | $2,909,730 | $931,178 | $1,074,927 | $191.52 | $212.86 | $42,816 | 7.2 | % | 2023 | $5,910,846 | $7,286,491 | $993,261 | $1,030,197 | $156.22 | $157.12 | $86,830 | 16.8 | % | 2022 | $2,744,811 | $3,050,956 | $841,738 | $912,266 | $111.49 | $141.79 | $25,342 | 2.4 | % | 2021 | $3,114,210 | $2,974,247 | $1,173,382 | $1,175,567 | $107.25 | $119.28 | $17,578 | 4.2 | % |
|
|
|
|
|
|
|
| Company Selected Measure Name |
Growth in Fully Diluted Book Value per Share
|
|
|
|
|
|
|
| Named Executive Officers, Footnote |
Simon Burton was the PEO in 2021, 2022, and 2023. Greg Richardson is the PEO for 2024 and 2025.For 2021, the non-PEO NEOs are Laura Accurso, Tom Curnock, Neil Greenspan, and Patrick O’Brien. For 2022, the non-PEO NEOs are Tom Curnock, Neil Greenspan, Patrick O’Brien, and Faramarz Romer. For 2023, the non-PEO NEOs are David Sigmon, Tom Curnock, Neil Greenspan, Patrick O’Brien, and Faramarz Romer. For 2024, the non-PEO NEOs are David Sigmon, Tom Curnock, Patrick O’Brien, and Faramarz Romer. For 2025, the non-PEO NEOs are Tom Curnock, Patrick O’Brien, Brian O’Reilly and Faramarz Romer.
|
|
|
|
|
|
|
| Peer Group Issuers, Footnote |
The peer group shown is the S&P 500 Property & Casualty Insurance Index, which is included in the performance graph of our 10-K filing.
|
|
|
|
|
|
|
| PEO Total Compensation Amount |
$ 3,314,610
|
$ 2,323,230
|
$ 5,910,846
|
$ 2,744,811
|
$ 3,114,210
|
|
|
| PEO Actually Paid Compensation Amount |
$ 2,825,712
|
2,909,730
|
7,286,491
|
3,050,956
|
2,974,247
|
|
|
| Adjustment To PEO Compensation, Footnote |
| | | | | | | | | | | | | | | | | | | | | | | | | | | | | | | | | | Year | Executive(s) | Summary Compensation Table Total ($) | Subtract Stock Awards ($) | Add Year-End Fair Value of Equity Awards Granted in the Year that are Outstanding and Unvested ($) | Add Vest Date Fair Value of Equity Awards Granted in the Year that Vest in the Same Year ($) | Add Amount Equal to Change as of the End of Fiscal Year from End of Prior Fiscal Year in Fair Value of Awards Granted in any Prior Fiscal Year that are Outstanding and Unvested Equity Awards ($) | Add Amount Equal to Change as of the Vesting Date from the End of Prior Fiscal Year in Fair Value of Equity Awards Granted in Prior Years that Vested in the Year ($) | Subtract Fair Value as of the End of the Prior Year of any Equity Awards Granted in a Prior Year that Failed to Meet Vesting Conditions in the Year ($) | Total Equity Award Adjustments ($) | CAP ($) | | | | | | | | | | | | | | | | | | | | | | | 2025 | PEO | 3,314,610 | | (1,200,000) | | 884,102 | | — | | (162,000) | | (11,000) | | — | | (488,898) | | 2,825,712 | | | Other NEOs | 1,299,725 | | (329,538) | | 242,788 | | — | | 150,399 | | (19,033) | | — | | 7,436 | | 1,307,161 | | 2024 | PEO | 2,323,230 | | (1,077,500) | | 1,664,000 | | — | | — | | — | | — | | 586,500 | | 2,909,730 | | | Other NEOs | 931,178 | | (271,847) | | 321,171 | | — | | 87,279 | | 7,147 | | — | | 143,749 | | 1,074,927 | | 2023 | PEO | 5,910,846 | | (1,600,000) | | 1,855,025 | | — | | 1,110,221 | | 10,400 | | — | | 1,375,645 | | 7,286,491 | | | Other NEOs | 993,261 | | (213,991) | | 248,514 | | — | | 132,246 | | 38,146 | | (167,980) | | 36,936 | | 1,030,197 | | 2022 | PEO | 2,744,811 | | (1,600,000) | | 1,912,023 | | — | | 6,123 | | (12,000) | | — | | 306,145 | | 3,050,956 | | | Other NEOs | 841,738 | | (322,702) | | 385,634 | | — | | 18,349 | | (10,752) | | — | | 70,528 | | 912,266 | | 2021 | PEO | 3,114,210 | | (1,200,000) | | 1,024,837 | | — | | (9,600) | | 44,800 | | — | | (139,963) | | 2,974,247 | | | Other NEOs | 1,173,382 | | (270,000) | | 230,586 | | — | | 26,759 | | 14,839 | | — | | 2,185 | | 1,175,567 | | | | | | | | | | | | |
|
|
|
|
|
|
|
| Non-PEO NEO Average Total Compensation Amount |
$ 1,299,725
|
931,178
|
993,261
|
841,738
|
1,173,382
|
|
|
| Non-PEO NEO Average Compensation Actually Paid Amount |
$ 1,307,161
|
1,074,927
|
1,030,197
|
912,266
|
1,175,567
|
|
|
| Adjustment to Non-PEO NEO Compensation Footnote |
| | | | | | | | | | | | | | | | | | | | | | | | | | | | | | | | | | Year | Executive(s) | Summary Compensation Table Total ($) | Subtract Stock Awards ($) | Add Year-End Fair Value of Equity Awards Granted in the Year that are Outstanding and Unvested ($) | Add Vest Date Fair Value of Equity Awards Granted in the Year that Vest in the Same Year ($) | Add Amount Equal to Change as of the End of Fiscal Year from End of Prior Fiscal Year in Fair Value of Awards Granted in any Prior Fiscal Year that are Outstanding and Unvested Equity Awards ($) | Add Amount Equal to Change as of the Vesting Date from the End of Prior Fiscal Year in Fair Value of Equity Awards Granted in Prior Years that Vested in the Year ($) | Subtract Fair Value as of the End of the Prior Year of any Equity Awards Granted in a Prior Year that Failed to Meet Vesting Conditions in the Year ($) | Total Equity Award Adjustments ($) | CAP ($) | | | | | | | | | | | | | | | | | | | | | | | 2025 | PEO | 3,314,610 | | (1,200,000) | | 884,102 | | — | | (162,000) | | (11,000) | | — | | (488,898) | | 2,825,712 | | | Other NEOs | 1,299,725 | | (329,538) | | 242,788 | | — | | 150,399 | | (19,033) | | — | | 7,436 | | 1,307,161 | | 2024 | PEO | 2,323,230 | | (1,077,500) | | 1,664,000 | | — | | — | | — | | — | | 586,500 | | 2,909,730 | | | Other NEOs | 931,178 | | (271,847) | | 321,171 | | — | | 87,279 | | 7,147 | | — | | 143,749 | | 1,074,927 | | 2023 | PEO | 5,910,846 | | (1,600,000) | | 1,855,025 | | — | | 1,110,221 | | 10,400 | | — | | 1,375,645 | | 7,286,491 | | | Other NEOs | 993,261 | | (213,991) | | 248,514 | | — | | 132,246 | | 38,146 | | (167,980) | | 36,936 | | 1,030,197 | | 2022 | PEO | 2,744,811 | | (1,600,000) | | 1,912,023 | | — | | 6,123 | | (12,000) | | — | | 306,145 | | 3,050,956 | | | Other NEOs | 841,738 | | (322,702) | | 385,634 | | — | | 18,349 | | (10,752) | | — | | 70,528 | | 912,266 | | 2021 | PEO | 3,114,210 | | (1,200,000) | | 1,024,837 | | — | | (9,600) | | 44,800 | | — | | (139,963) | | 2,974,247 | | | Other NEOs | 1,173,382 | | (270,000) | | 230,586 | | — | | 26,759 | | 14,839 | | — | | 2,185 | | 1,175,567 | | | | | | | | | | | | |
|
|
|
|
|
|
|
| Compensation Actually Paid vs. Total Shareholder Return |
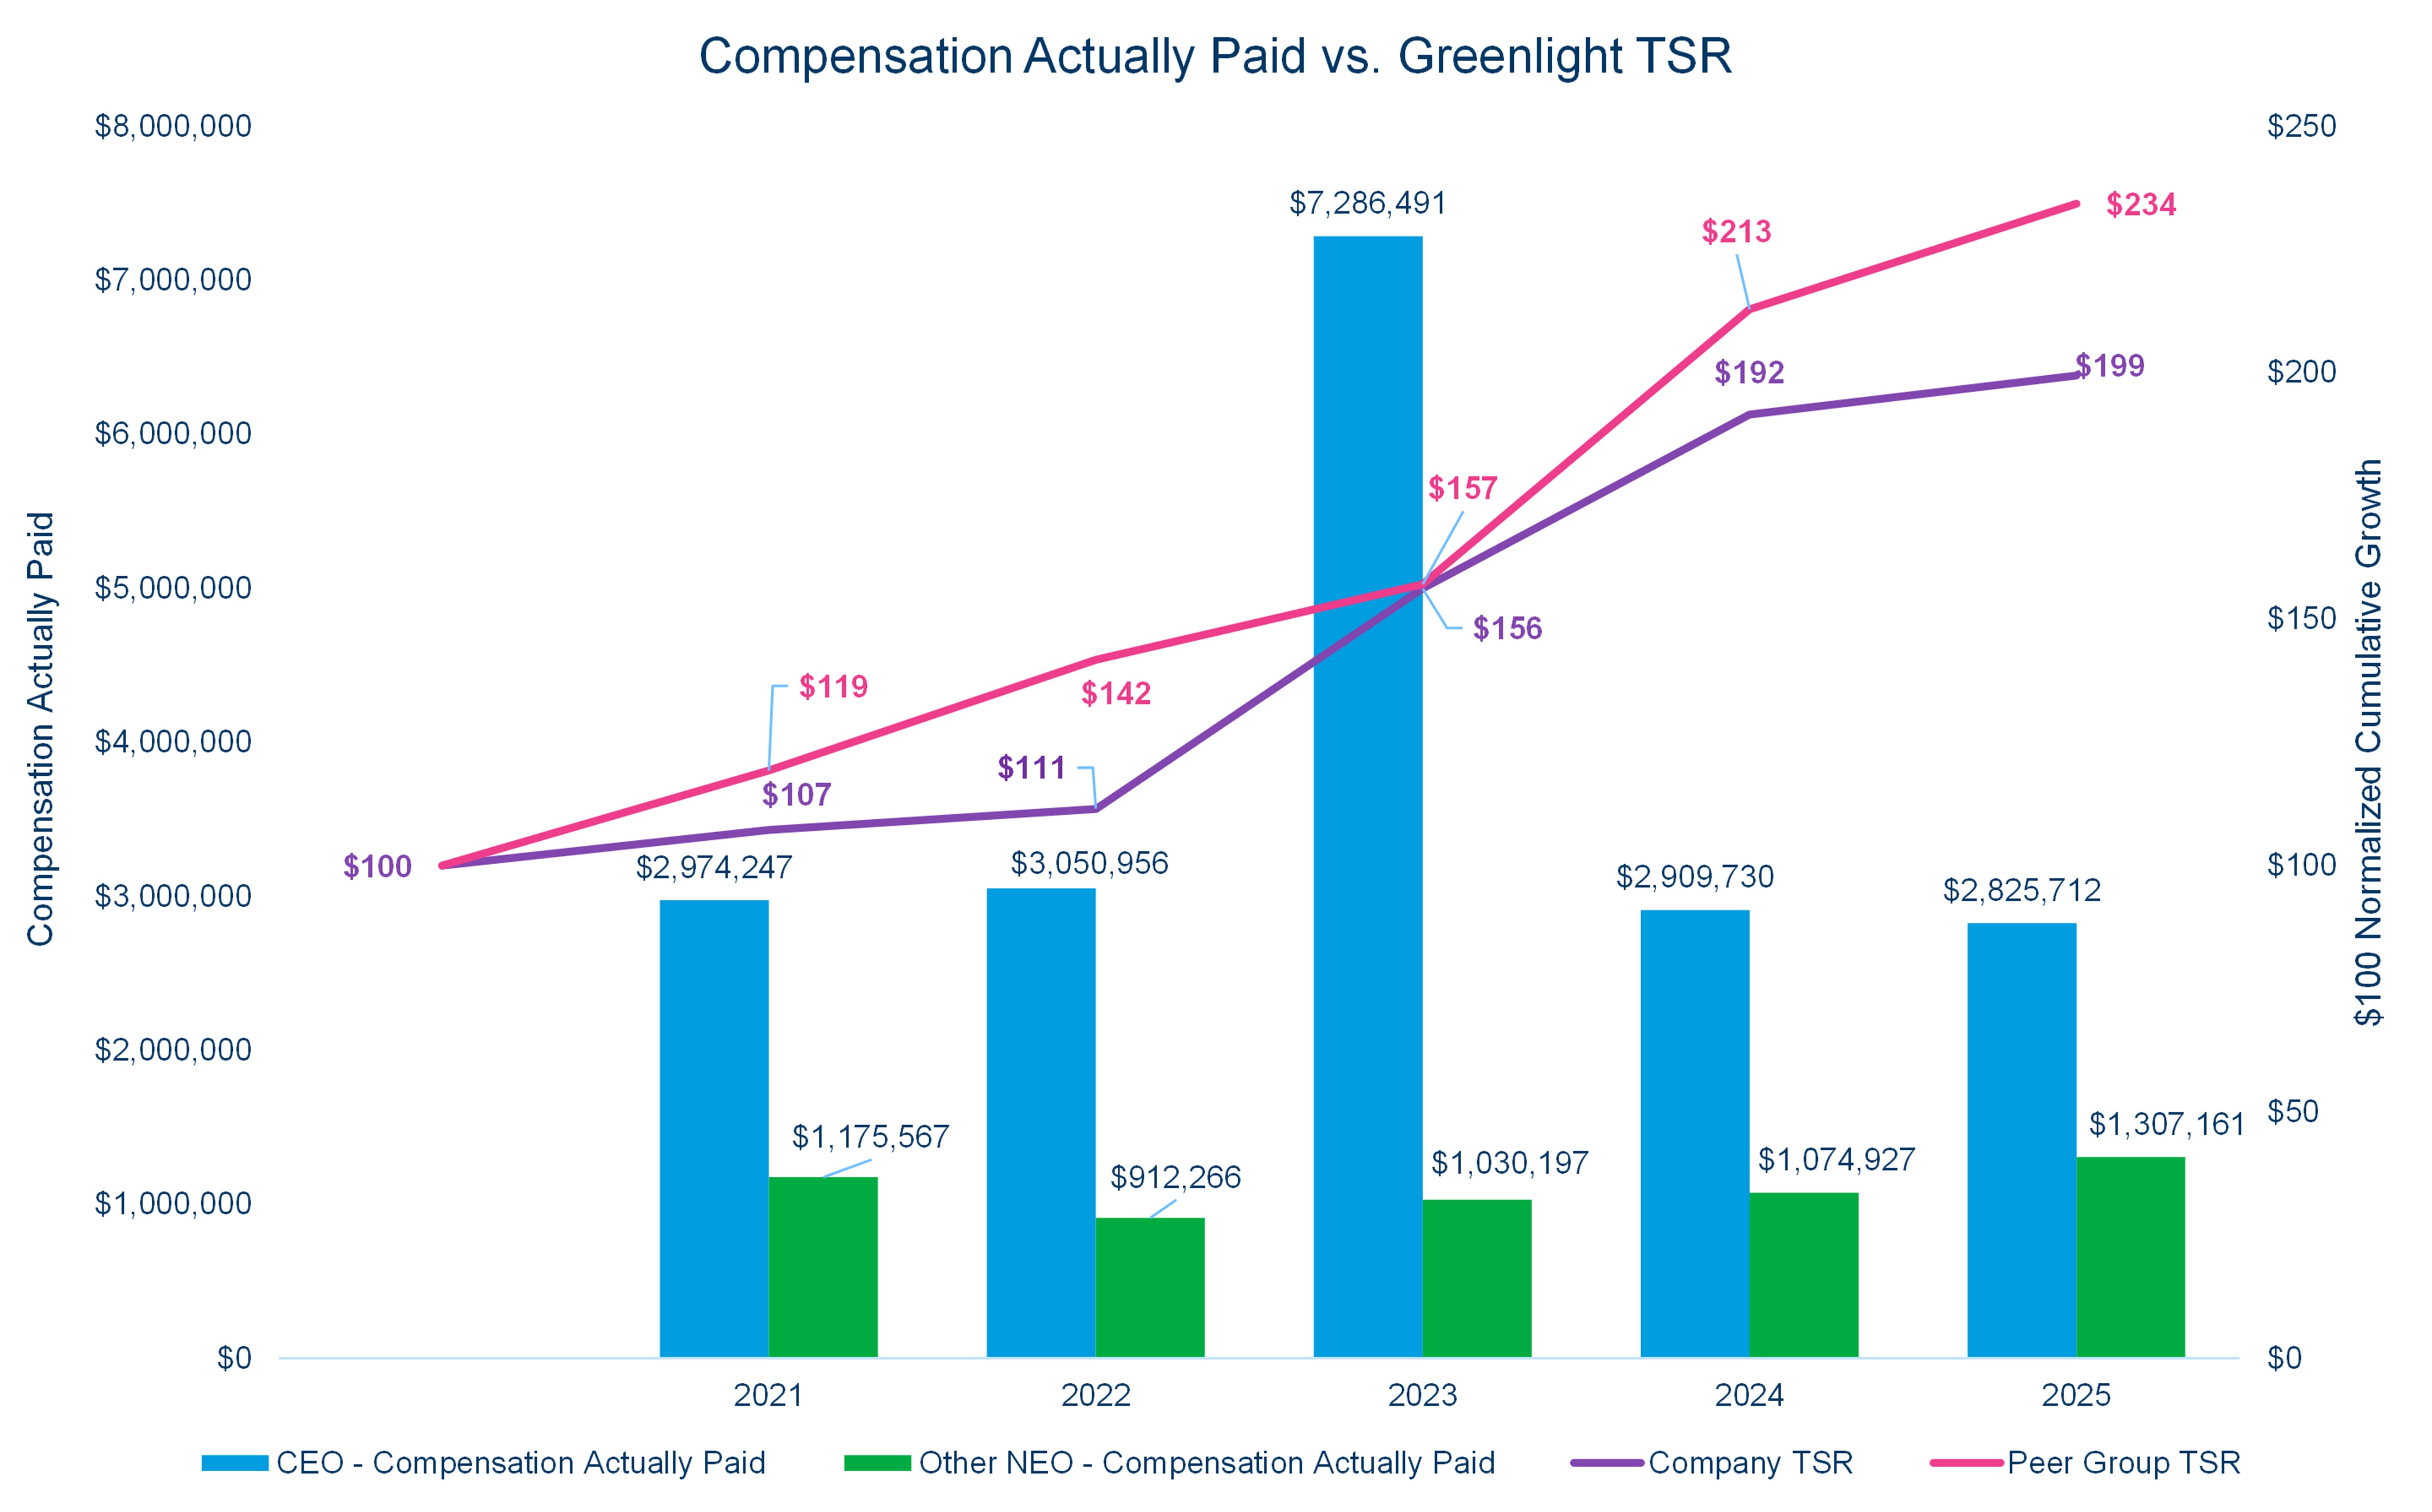
The charts below show, for the past five years, the relationship of TSR relative to the Peer Group TSR, as well as the relationships between PEO and non-PEO NEO average CAP and (i) TSR and (ii) net income, and (iii) our company-selected measure, Fully Diluted Book Value Per Share.
*For the 2023 CAP reported in these graphs of $7,286,491 to our former CEO, Simon Burton, this figure includes Mr. Burton’s one-time cash severance payment. This contributed to the 2023 CEO CAP being significantly higher than other years.
|
|
|
|
|
|
|
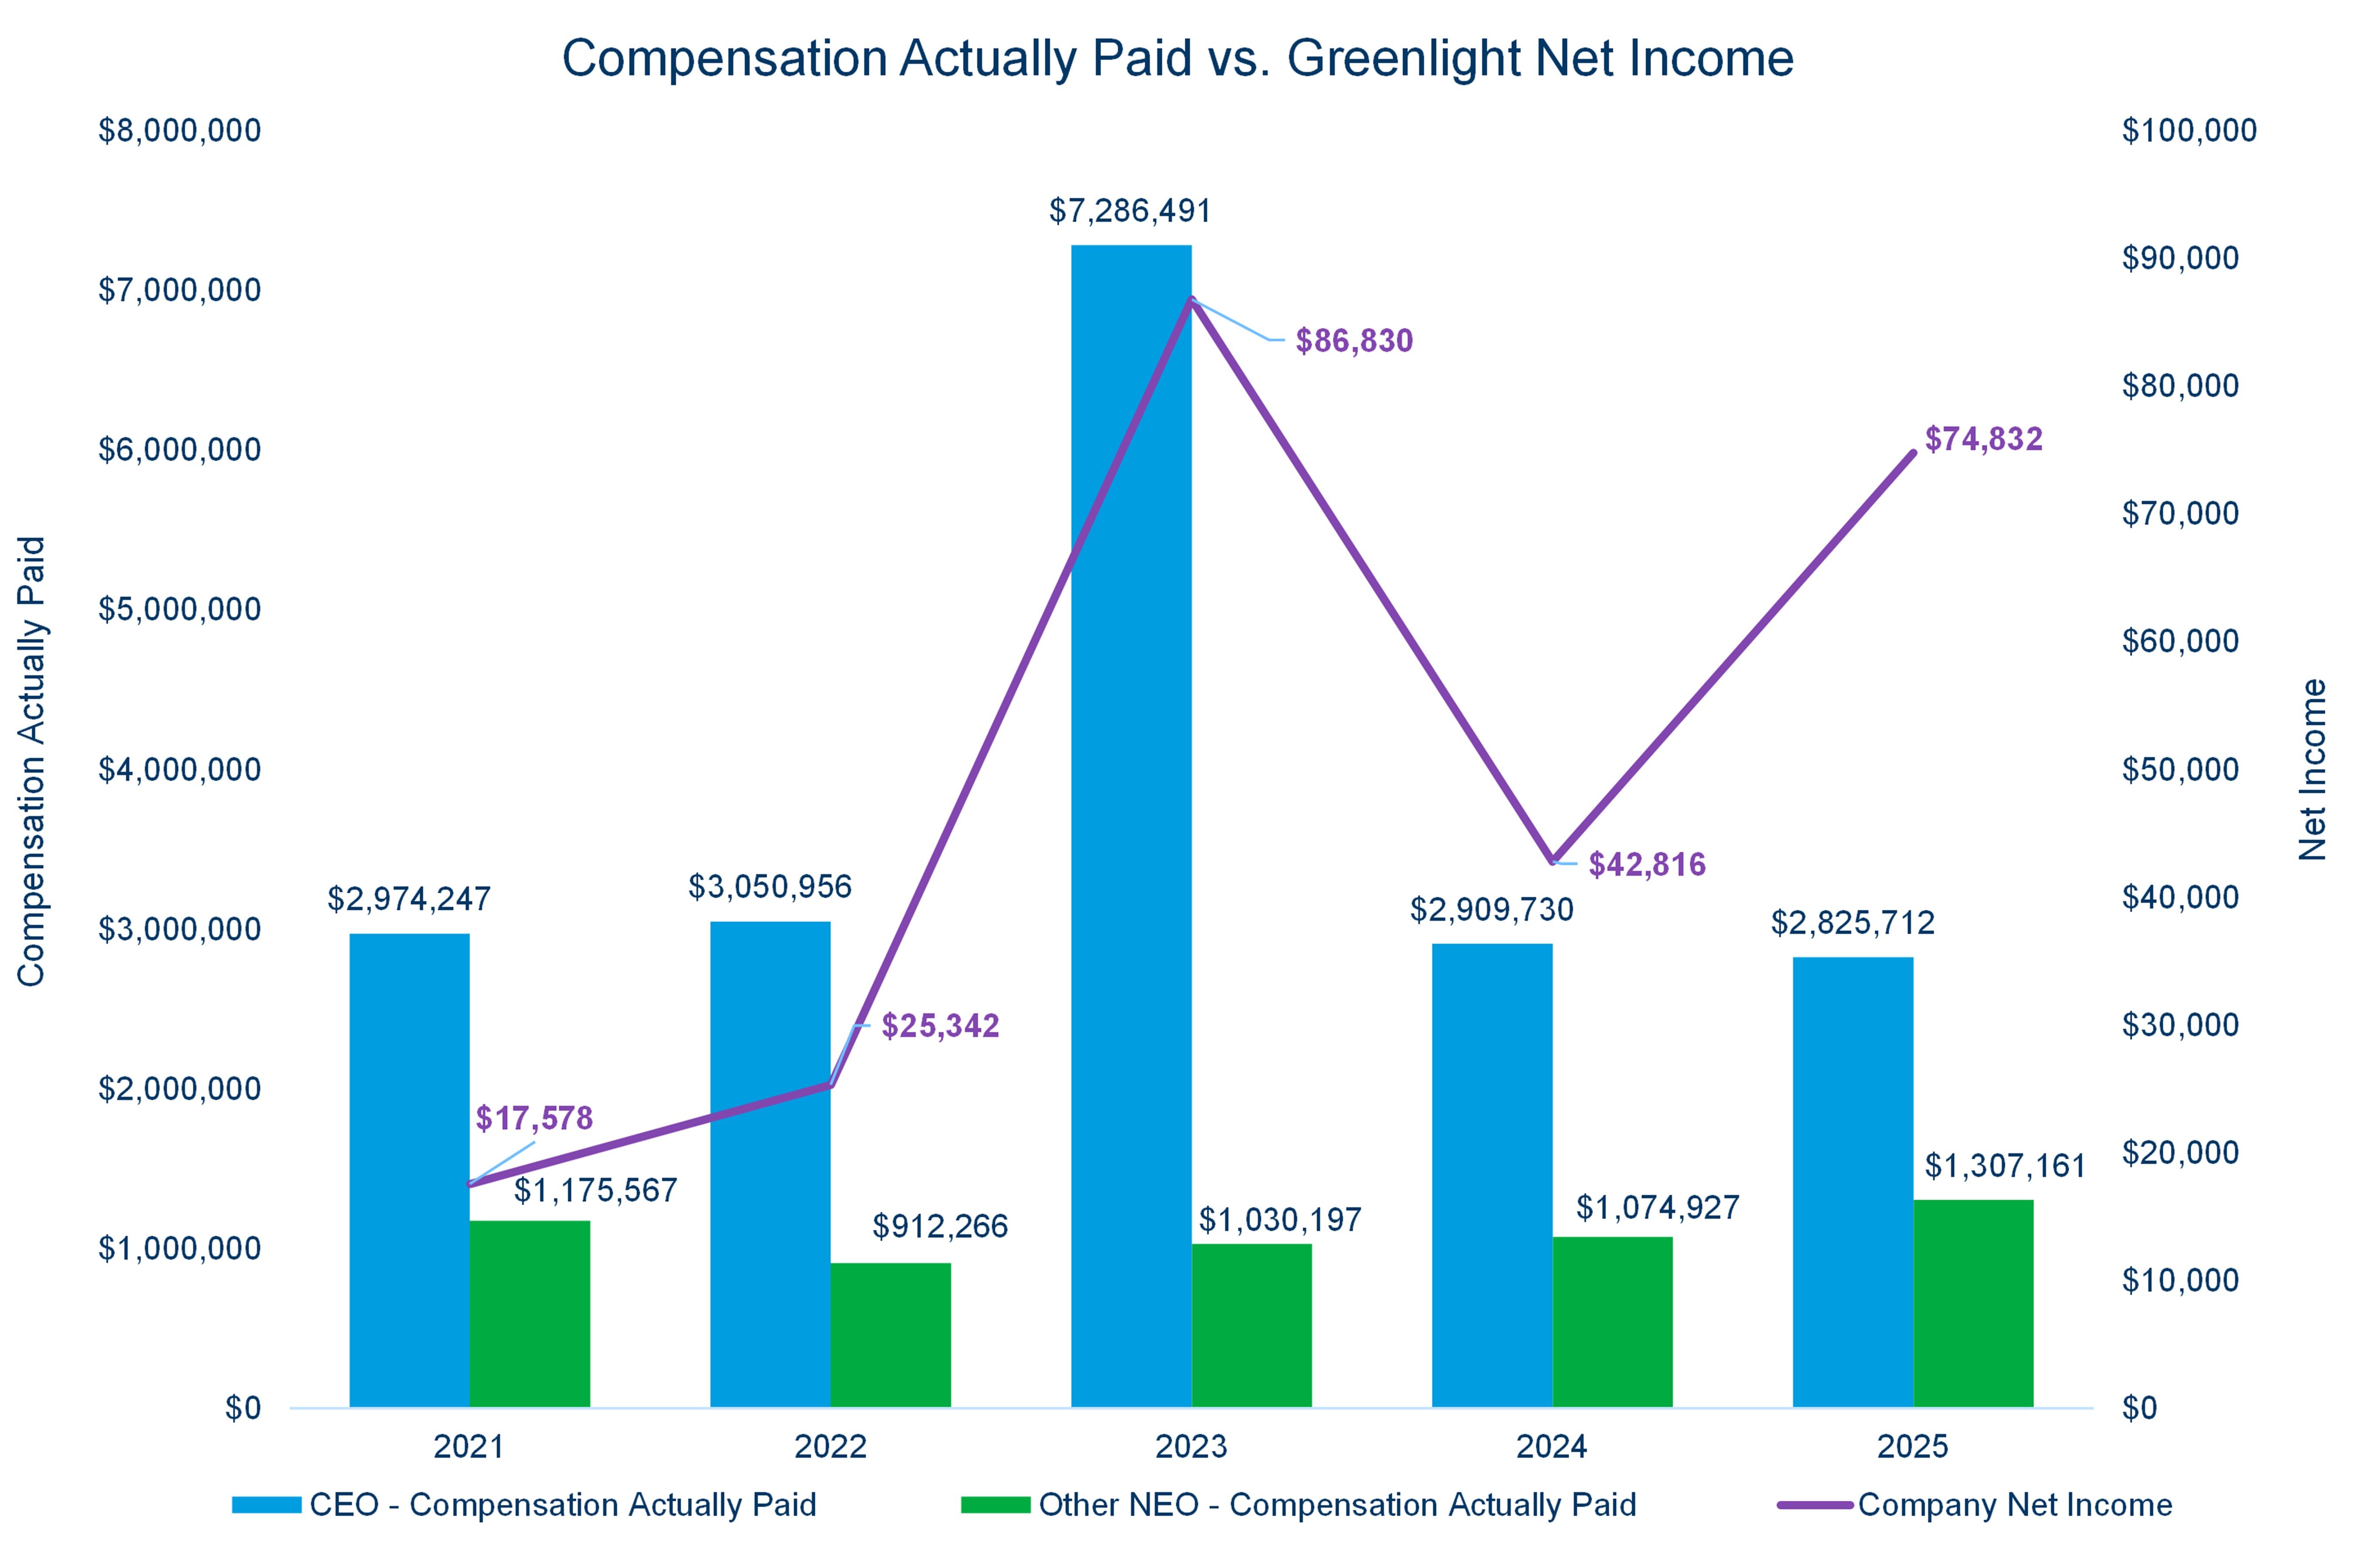
| Compensation Actually Paid vs. Net Income |
|
|
|
|
|
|
|
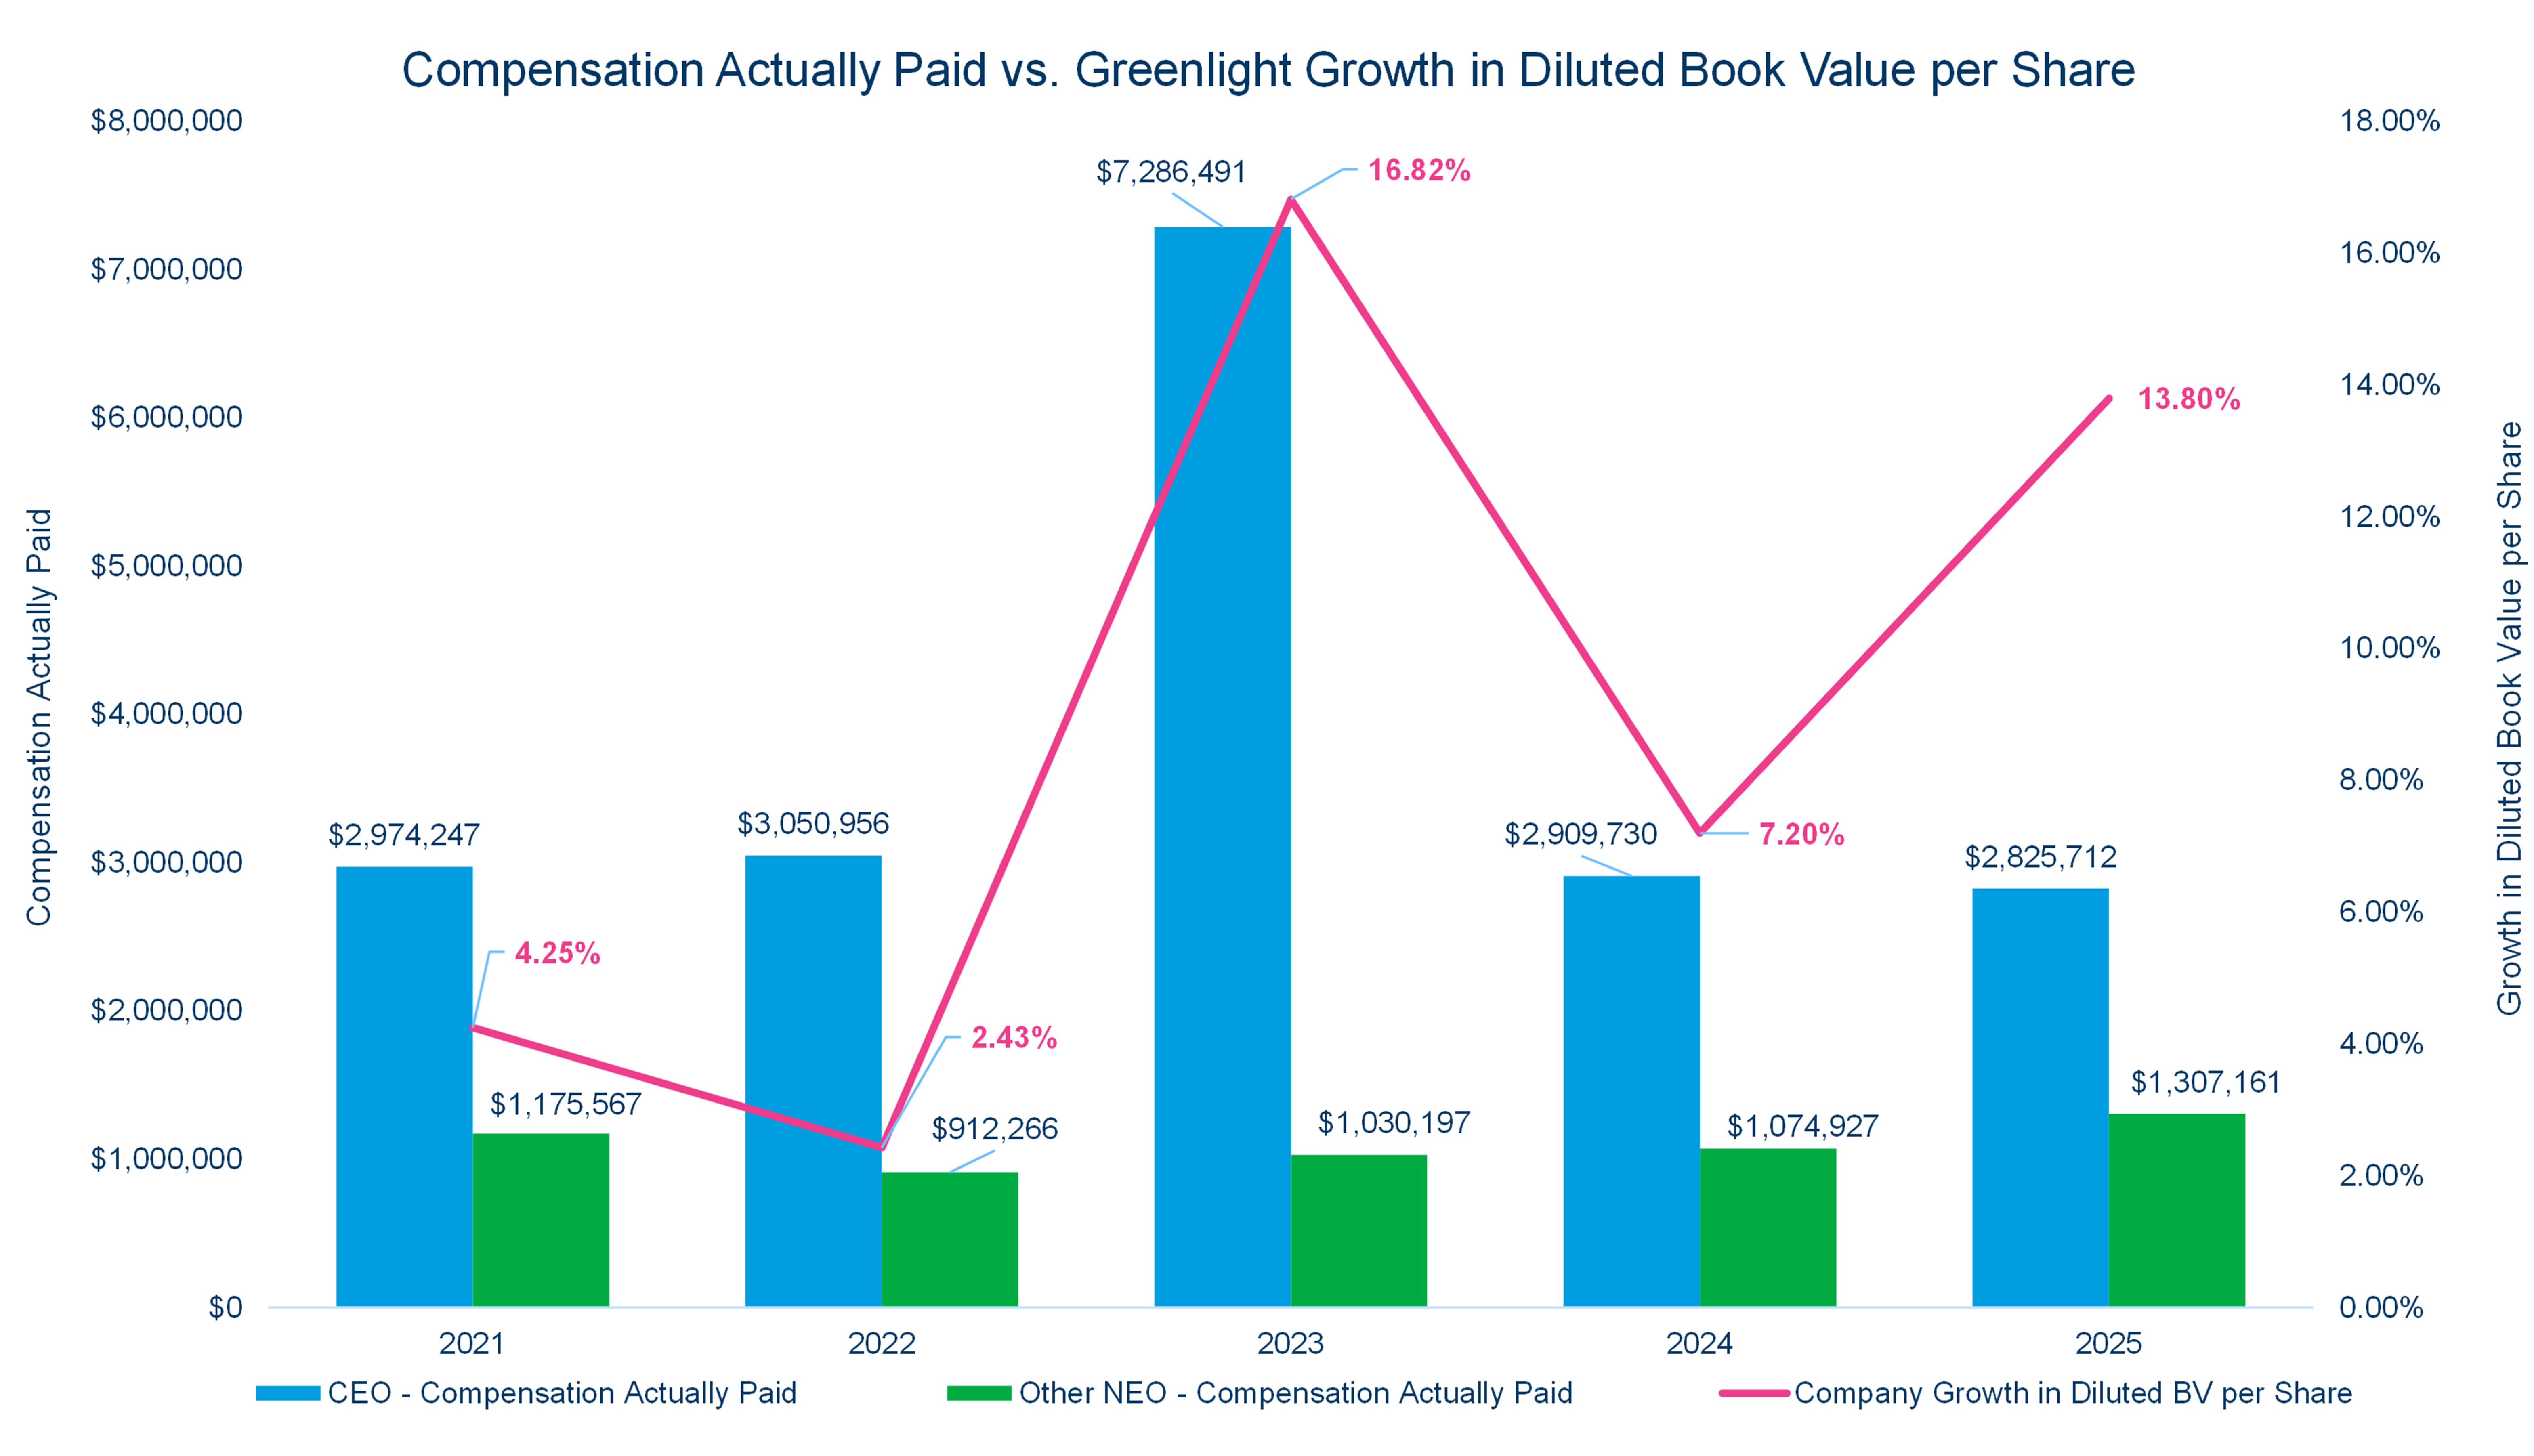
| Compensation Actually Paid vs. Company Selected Measure |
|
|
|
|
|
|
|
| Total Shareholder Return Vs Peer Group |
The charts below show, for the past five years, the relationship of TSR relative to the Peer Group TSR, as well as the relationships between PEO and non-PEO NEO average CAP and (i) TSR and (ii) net income, and (iii) our company-selected measure, Fully Diluted Book Value Per Share.
*For the 2023 CAP reported in these graphs of $7,286,491 to our former CEO, Simon Burton, this figure includes Mr. Burton’s one-time cash severance payment. This contributed to the 2023 CEO CAP being significantly higher than other years.
|
|
|
|
|
|
|
| Tabular List, Table |
| | | | Most Important Performance Measures | | | Growth in Fully Diluted Book Value Per Share | | Underwriting Combined Ratio | | Adjusted Operating Profit |
|
|
|
|
|
|
|
| Total Shareholder Return Amount |
$ 199.45
|
191.52
|
156.22
|
111.49
|
107.25
|
|
|
| Peer Group Total Shareholder Return Amount |
234.32
|
212.86
|
157.12
|
141.79
|
119.28
|
|
|
| Net Income (Loss) |
$ 74,832,000
|
$ 42,816,000
|
$ 86,830,000
|
$ 25,342,000
|
$ 17,578,000
|
|
|
| Company Selected Measure Amount |
0.138
|
0.072
|
0.168
|
0.024
|
0.042
|
|
|
| PEO Name |
|
|
|
|
|
Greg Richardson
|
Simon Burton
|
| Additional 402(v) Disclosure |
See the chart on the next page for the reconciliation of Summary Compensation Table compensation to Compensation Actually Paid.
|
|
|
|
|
|
|
| Measure:: 1 |
|
|
|
|
|
|
|
| Pay vs Performance Disclosure |
|
|
|
|
|
|
|
| Name |
Growth in Fully Diluted Book Value Per Share
|
|
|
|
|
|
|
| Non-GAAP Measure Description |
The Company has identified Growth in Fully Diluted Book Value per Share as the company-selected measure for the pay-versus-performance disclosure, as it represents the most important financial performance measure used to link compensation actually paid to the CEO and Other NEOs in 2025 to the Company's performance. Fully Diluted Book Value per Share is a non-GAAP measure. Please refer to Annex 1 for definitions of non-GAAP measures.
|
|
|
|
|
|
|
| Measure:: 2 |
|
|
|
|
|
|
|
| Pay vs Performance Disclosure |
|
|
|
|
|
|
|
| Name |
Underwriting Combined Ratio
|
|
|
|
|
|
|
| Measure:: 3 |
|
|
|
|
|
|
|
| Pay vs Performance Disclosure |
|
|
|
|
|
|
|
| Name |
Adjusted Operating Profit
|
|
|
|
|
|
|
| PEO | Equity Awards Adjustments |
|
|
|
|
|
|
|
| Pay vs Performance Disclosure |
|
|
|
|
|
|
|
| Adjustment to Compensation, Amount |
$ (488,898)
|
$ 586,500
|
$ 1,375,645
|
$ 306,145
|
$ (139,963)
|
|
|
| PEO | Aggregate Grant Date Fair Value of Equity Award Amounts Reported in Summary Compensation Table |
|
|
|
|
|
|
|
| Pay vs Performance Disclosure |
|
|
|
|
|
|
|
| Adjustment to Compensation, Amount |
(1,200,000)
|
(1,077,500)
|
(1,600,000)
|
(1,600,000)
|
(1,200,000)
|
|
|
| PEO | Year-end Fair Value of Equity Awards Granted in Covered Year that are Outstanding and Unvested |
|
|
|
|
|
|
|
| Pay vs Performance Disclosure |
|
|
|
|
|
|
|
| Adjustment to Compensation, Amount |
884,102
|
1,664,000
|
1,855,025
|
1,912,023
|
1,024,837
|
|
|
| PEO | Year-over-Year Change in Fair Value of Equity Awards Granted in Prior Years That are Outstanding and Unvested |
|
|
|
|
|
|
|
| Pay vs Performance Disclosure |
|
|
|
|
|
|
|
| Adjustment to Compensation, Amount |
(162,000)
|
0
|
1,110,221
|
6,123
|
(9,600)
|
|
|
| PEO | Vesting Date Fair Value of Equity Awards Granted and Vested in Covered Year |
|
|
|
|
|
|
|
| Pay vs Performance Disclosure |
|
|
|
|
|
|
|
| Adjustment to Compensation, Amount |
0
|
0
|
0
|
0
|
0
|
|
|
| PEO | Change in Fair Value as of Vesting Date of Prior Year Equity Awards Vested in Covered Year |
|
|
|
|
|
|
|
| Pay vs Performance Disclosure |
|
|
|
|
|
|
|
| Adjustment to Compensation, Amount |
(11,000)
|
0
|
10,400
|
(12,000)
|
44,800
|
|
|
| PEO | Prior Year End Fair Value of Equity Awards Granted in Any Prior Year that Fail to Meet Applicable Vesting Conditions During Covered Year |
|
|
|
|
|
|
|
| Pay vs Performance Disclosure |
|
|
|
|
|
|
|
| Adjustment to Compensation, Amount |
0
|
0
|
0
|
0
|
0
|
|
|
| Non-PEO NEO | Equity Awards Adjustments |
|
|
|
|
|
|
|
| Pay vs Performance Disclosure |
|
|
|
|
|
|
|
| Adjustment to Compensation, Amount |
7,436
|
143,749
|
36,936
|
70,528
|
2,185
|
|
|
| Non-PEO NEO | Aggregate Grant Date Fair Value of Equity Award Amounts Reported in Summary Compensation Table |
|
|
|
|
|
|
|
| Pay vs Performance Disclosure |
|
|
|
|
|
|
|
| Adjustment to Compensation, Amount |
(329,538)
|
(271,847)
|
(213,991)
|
(322,702)
|
(270,000)
|
|
|
| Non-PEO NEO | Year-end Fair Value of Equity Awards Granted in Covered Year that are Outstanding and Unvested |
|
|
|
|
|
|
|
| Pay vs Performance Disclosure |
|
|
|
|
|
|
|
| Adjustment to Compensation, Amount |
242,788
|
321,171
|
248,514
|
385,634
|
230,586
|
|
|
| Non-PEO NEO | Year-over-Year Change in Fair Value of Equity Awards Granted in Prior Years That are Outstanding and Unvested |
|
|
|
|
|
|
|
| Pay vs Performance Disclosure |
|
|
|
|
|
|
|
| Adjustment to Compensation, Amount |
150,399
|
87,279
|
132,246
|
18,349
|
26,759
|
|
|
| Non-PEO NEO | Vesting Date Fair Value of Equity Awards Granted and Vested in Covered Year |
|
|
|
|
|
|
|
| Pay vs Performance Disclosure |
|
|
|
|
|
|
|
| Adjustment to Compensation, Amount |
0
|
0
|
0
|
0
|
0
|
|
|
| Non-PEO NEO | Change in Fair Value as of Vesting Date of Prior Year Equity Awards Vested in Covered Year |
|
|
|
|
|
|
|
| Pay vs Performance Disclosure |
|
|
|
|
|
|
|
| Adjustment to Compensation, Amount |
(19,033)
|
7,147
|
38,146
|
(10,752)
|
14,839
|
|
|
| Non-PEO NEO | Prior Year End Fair Value of Equity Awards Granted in Any Prior Year that Fail to Meet Applicable Vesting Conditions During Covered Year |
|
|
|
|
|
|
|
| Pay vs Performance Disclosure |
|
|
|
|
|
|
|
| Adjustment to Compensation, Amount |
$ 0
|
$ 0
|
$ (167,980)
|
$ 0
|
$ 0
|
|
|