Pay vs Performance Disclosure - USD ($)
|
12 Months Ended |
Dec. 31, 2025 |
Dec. 31, 2024 |
Dec. 31, 2023 |
| Pay vs Performance Disclosure [Table] |
|
|
|
|
| Pay vs Performance [Table Text Block] |
|
| Year (1) | |
($) (1) | | |
($)(1)(2) | | |
NEOs ($)(1) | | |
NEOs ($)(1)(2) | | |
(TSR) ($)(1)(3) | | |
(Loss) ($)(1) | |
| | |
Summary Compensation Table For PEO | | |
Compensation Actually Paid to PEO | | |
Average Summary Compensation Table Total for Non-PEO | | |
Average Compensation Actually Paid to Non-PEO | | |
Value of initial fixed $100 investment based on total Shareholder Return | | |
Net Income | |
| Year (1) | |
($) | | |
($)(2) | | |
NEOs ($) | | |
NEOs ($)(2) | | |
(TSR) ($)(3) | | |
(Loss) ($) | |
| | |
| | |
| | |
| | |
| | |
| | |
| |
| 2025 | |
| 2,040,212 | | |
| 1,702,077 | | |
| 2,115,731 | | |
| 1,185,588 | | |
| 82.67 | | |
| (36,068,870 | ) |
| 2024 | |
| 2,787,084 | | |
| 1,340,312 | | |
| 1,868,240 | | |
| 1,128,151 | | |
| 88.12 | | |
| (45,729,224 | ) |
| 2023 | |
| 1,653,624 | | |
| 1,653,624 | | |
| 2,285,388 | | |
| 3,007,515 | | |
| 319.31 | | |
| 20,617,903 | |
|
|
|
| Named Executive Officers, Footnote [Text Block] |
|
| (1) |
For
each of the years presented above, our PEO was Kevin Brian Cox, Chief Executive Officer. In 2025 and 2024, our non-PEO’s were
Tony Evers, former Chief Financial Officer and Derron Winfrey, President of Sales and Operations. In 2023, our non-PEO’s were
Tony Evers, former Chief Financial Officer, and David Ansani, former Chief Administrative Officer. |
|
|
|
| Total Compensation per Summary Compensation Table (“SCT”) |
[1] |
$ 2,040,212
|
$ 2,787,084
|
$ 1,653,624
|
| “Compensation Actually Paid” for Year Shown” |
[1],[2] |
1,702,077
|
1,340,312
|
1,653,624
|
| Non-PEO NEO Average Total Compensation Amount |
[1] |
2,115,731
|
1,868,240
|
2,285,388
|
| Non-PEO NEO Average Compensation Actually Paid Amount |
[1],[2] |
$ 1,185,588
|
1,128,151
|
3,007,515
|
| Adjustment to Non-PEO NEO Compensation Footnote [Text Block] |
|
| | |
PEO
($) | | |
NEOs
($) | | |
PEO
($) | | |
NEOs
($) | | |
PEO
($) | | |
NEOs
($) | |
| | |
Reconciliation
of Compensation Actually Paid | |
| | |
2025 | | |
2024 | | |
2023 | |
| | |
| | |
Average
of | | |
| | |
Average
of | | |
| | |
Average
of | |
| | |
| | |
Non-PEO | | |
| | |
Non-PEO | | |
| | |
Non-PEO | |
| | |
PEO
($) | | |
NEOs
($) | | |
PEO
($) | | |
NEOs
($) | | |
PEO
($) | | |
NEOs
($) | |
| | |
| | |
| | |
| | |
| | |
| | |
| |
| Total
Compensation per Summary Compensation Table (“SCT”) | |
| 2,040,212 | | |
| 2,115,731 | | |
| 2,787,084 | | |
| 1,868,240 | | |
| 1,653,624 | | |
| 2,285,388 | |
| | |
| | | |
| | | |
| | | |
| | | |
| | | |
| | |
| Less:
Value of Stock Grants reported in SCT | |
| - | | |
| (479,077 | ) | |
| (1,069,168 | ) | |
| (855,334 | ) | |
| - | | |
| (3,114,000 | ) |
| | |
| | | |
| | | |
| | | |
| | | |
| | | |
| | |
| Less:
Value of Stock Option Grants reported in SCT | |
| (338,135) | | |
| (214,151 | ) | |
| (377,604 | ) | |
| (239,149 | | |
| - | | |
| - | |
| | |
| | | |
| | | |
| | | |
| | | |
| | | |
| | |
| Plus:
Year-End Value of Stock Grants Awarded in Fiscal Year that are Unvested and Outstanding | |
| - | | |
| - | | |
| - | | |
| 356,000 | | |
| - | | |
| 3,870,000 | |
| | |
| | | |
| | | |
| | | |
| | | |
| | | |
| | |
| Plus:
Change in Fair Value of Prior Year Awards that are Unvested and Outstanding | |
| - | | |
| - | | |
| - | | |
| - | | |
| - | | |
| (26,251 | ) |
| | |
| | | |
| | | |
| | | |
| | | |
| | | |
| | |
| Plus:
Change in Fair Value of Prior Year Awards that are Vested in Current Year | |
| - | | |
| - | | |
| - | | |
| (1,606 | ) | |
| - | | |
| (7,622 | ) |
| | |
| | | |
| | | |
| | | |
| | | |
| | | |
| | |
| “Compensation
Actually Paid” for Year Shown” (1) | |
| 1,702,077 | | |
| 1,422,503 | | |
| 1,340,312 | | |
| 1,128,151 | | |
| 1,653,624 | | |
| 3,007,515 | |
| (1) |
Column
totals may be impacted by rounding |
|
|
|
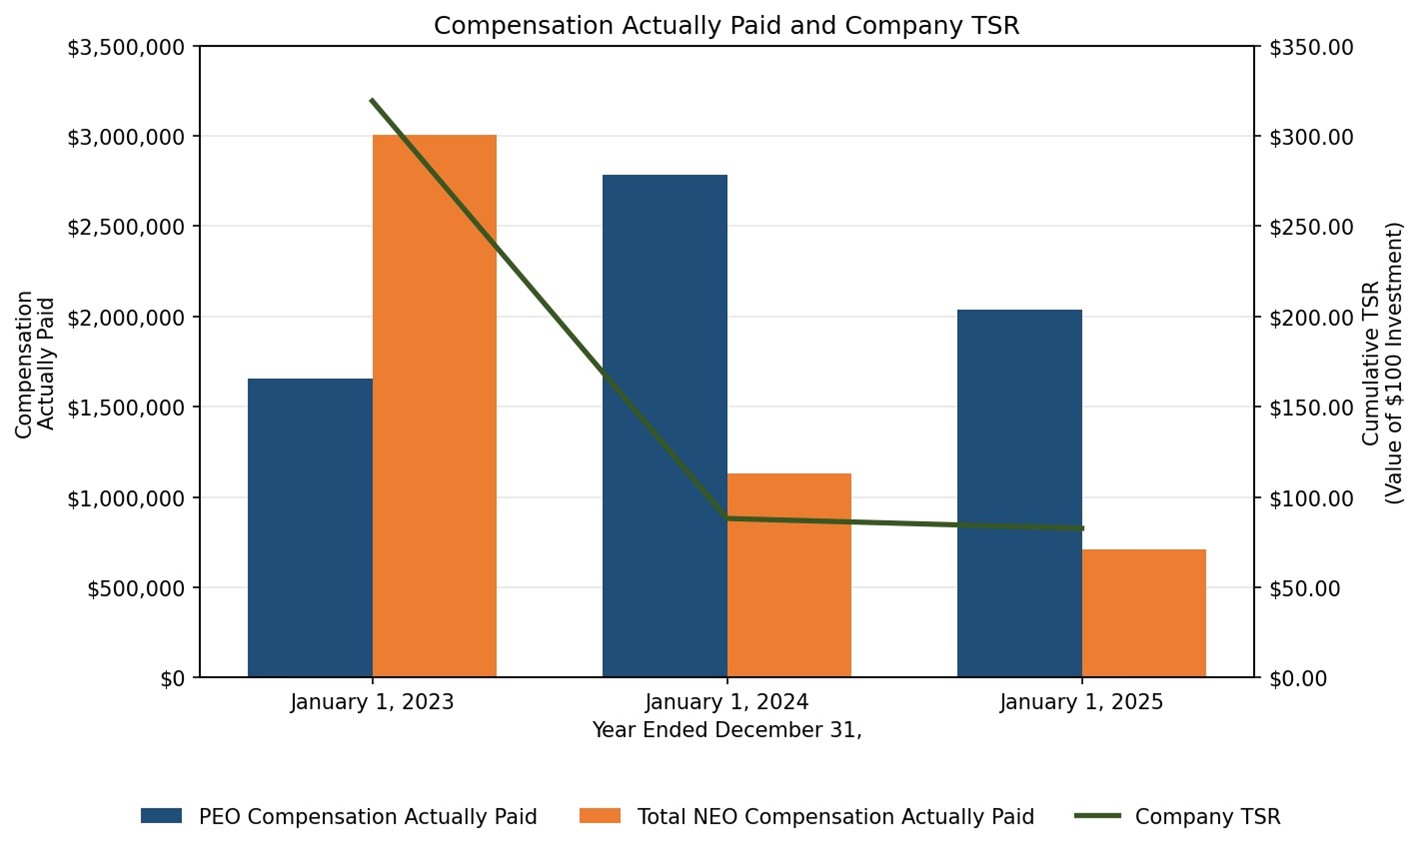
| Compensation Actually Paid vs. Total Shareholder Return |
|
CAP
vs. Total Shareholder Return (TSR)
|
|
|
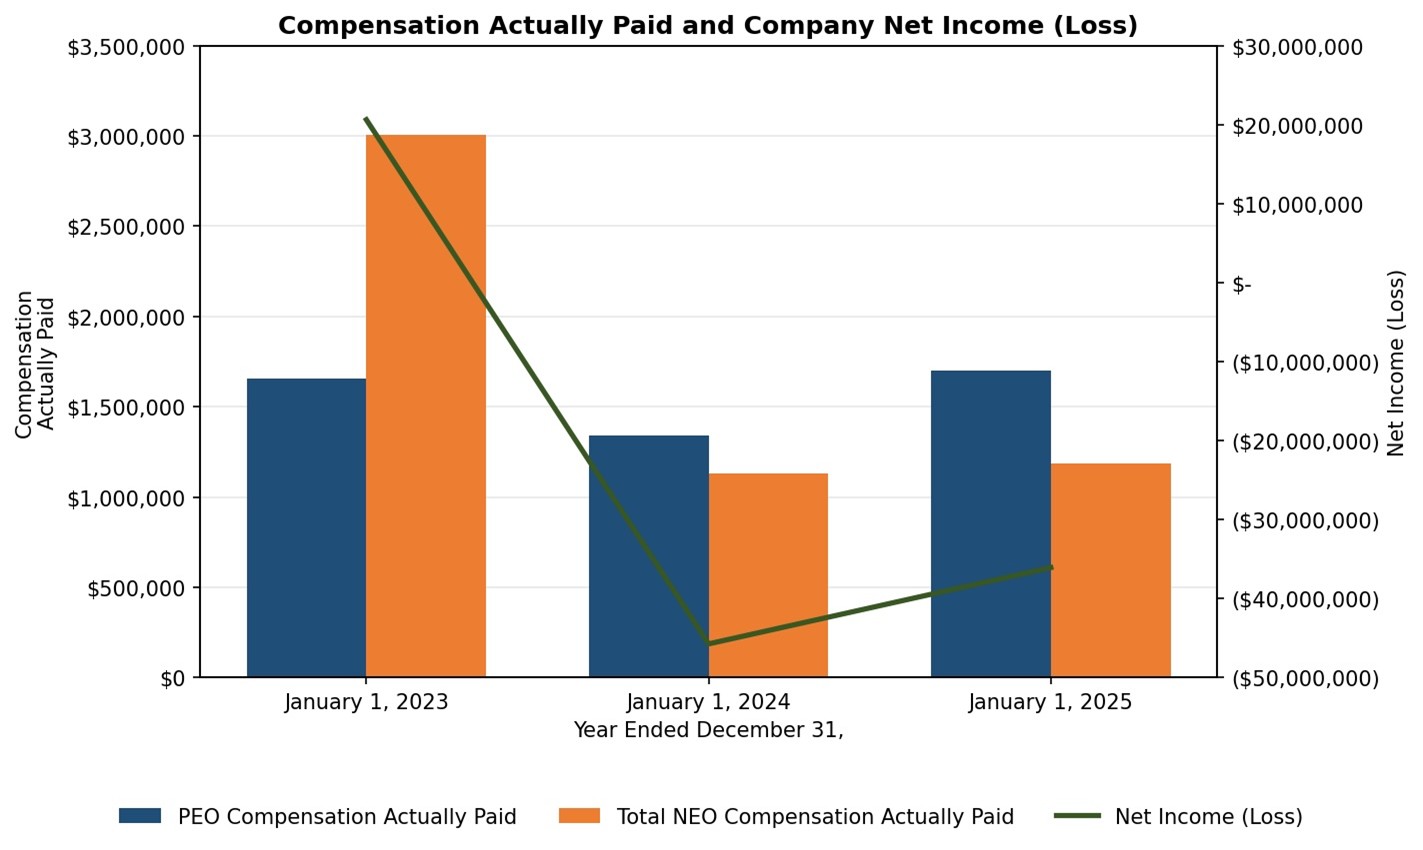
| Compensation Actually Paid vs. Net Income |
|
CAP vs. Net Income (Loss)
|
|
|
| Total Shareholder Return Amount |
[1],[3] |
$ 82.67
|
88.12
|
319.31
|
| Net Income (Loss) Attributable to Parent |
[1] |
$ (36,068,870)
|
$ (45,729,224)
|
$ 20,617,903
|
| PEO Name |
|
Kevin Brian Cox
|
Kevin Brian Cox
|
Kevin Brian Cox
|
| PEO [Member] |
|
|
|
|
| Pay vs Performance Disclosure [Table] |
|
|
|
|
| Total Compensation per Summary Compensation Table (“SCT”) |
|
$ 2,040,212
|
$ 2,787,084
|
$ 1,653,624
|
| “Compensation Actually Paid” for Year Shown” |
[4] |
1,702,077
|
1,340,312
|
1,653,624
|
| PEO [Member] | Value of Stock Grants Reported in SCT [Member] |
|
|
|
|
| Pay vs Performance Disclosure [Table] |
|
|
|
|
| Plus: Change in Fair Value of Prior Year Awards that are Vested in Current Year |
|
|
(1,069,168)
|
|
| PEO [Member] | Value of Stock Option Grants Reported in SCT [Member] |
|
|
|
|
| Pay vs Performance Disclosure [Table] |
|
|
|
|
| Plus: Change in Fair Value of Prior Year Awards that are Vested in Current Year |
|
(338,135)
|
(377,604)
|
|
| PEO [Member] | Year-End Value of Stock Grants Awarded in Fiscal Year that are Unvested and Outstanding [Member] |
|
|
|
|
| Pay vs Performance Disclosure [Table] |
|
|
|
|
| Plus: Change in Fair Value of Prior Year Awards that are Vested in Current Year |
|
|
|
|
| PEO [Member] | Change in Fair Value of Prior Year Awards that are Unvested and Outstanding [Member] |
|
|
|
|
| Pay vs Performance Disclosure [Table] |
|
|
|
|
| Plus: Change in Fair Value of Prior Year Awards that are Vested in Current Year |
|
|
|
|
| PEO [Member] | Change in Fair Value of Prior Year Awards that are Vested in Current Year [Member] |
|
|
|
|
| Pay vs Performance Disclosure [Table] |
|
|
|
|
| Plus: Change in Fair Value of Prior Year Awards that are Vested in Current Year |
|
|
|
|
| Non-PEO NEO [Member] |
|
|
|
|
| Pay vs Performance Disclosure [Table] |
|
|
|
|
| Total Compensation per Summary Compensation Table (“SCT”) |
|
2,115,731
|
1,868,240
|
2,285,388
|
| “Compensation Actually Paid” for Year Shown” |
[4] |
1,422,503
|
1,128,151
|
3,007,515
|
| Non-PEO NEO [Member] | Value of Stock Grants Reported in SCT [Member] |
|
|
|
|
| Pay vs Performance Disclosure [Table] |
|
|
|
|
| Plus: Change in Fair Value of Prior Year Awards that are Vested in Current Year |
|
(479,077)
|
(855,334)
|
(3,114,000)
|
| Non-PEO NEO [Member] | Value of Stock Option Grants Reported in SCT [Member] |
|
|
|
|
| Pay vs Performance Disclosure [Table] |
|
|
|
|
| Plus: Change in Fair Value of Prior Year Awards that are Vested in Current Year |
|
(214,151)
|
(239,149)
|
|
| Non-PEO NEO [Member] | Year-End Value of Stock Grants Awarded in Fiscal Year that are Unvested and Outstanding [Member] |
|
|
|
|
| Pay vs Performance Disclosure [Table] |
|
|
|
|
| Plus: Change in Fair Value of Prior Year Awards that are Vested in Current Year |
|
|
356,000
|
3,870,000
|
| Non-PEO NEO [Member] | Change in Fair Value of Prior Year Awards that are Unvested and Outstanding [Member] |
|
|
|
|
| Pay vs Performance Disclosure [Table] |
|
|
|
|
| Plus: Change in Fair Value of Prior Year Awards that are Vested in Current Year |
|
|
|
(26,251)
|
| Non-PEO NEO [Member] | Change in Fair Value of Prior Year Awards that are Vested in Current Year [Member] |
|
|
|
|
| Pay vs Performance Disclosure [Table] |
|
|
|
|
| Plus: Change in Fair Value of Prior Year Awards that are Vested in Current Year |
|
|
$ (1,606)
|
$ (7,622)
|
|
|