Pay vs Performance Disclosure - USD ($)
|
12 Months Ended |
Dec. 31, 2025 |
Dec. 31, 2024 |
Dec. 31, 2023 |
| Pay vs Performance Disclosure |
|
|
|
| Pay vs Performance Disclosure, Table |
| | | | | | | | | | | | | | | | | | | | | | Year | Summary Compensation Table Total for PEO (1) | Compensation Actually Paid to PEO (2) | Average Summary Compensation Table Total for Non-PEO Named Executive Officers (3) | Average Compensation Actually Paid to Non-PEO Named Executive Officers (2) | Value of Initial Fixed $100 Investment Based on Total Shareholder Return (4) | Net Loss (in millions) (5) | | | (a) | (b) | (c) | (d) | (e) | (f) | (g) | | 2025 | $801,081 | $585,885 | $546,858 | $465,019 | $19.33 | $(13.40) | | 2024 | $898,382 | $754,030 | $455,766 | $414,748 | $31.33 | $(4.05) | | 2023 | $1,222,108 | $450,419 | $751,591 | $471,033 | $37.23 | $(30.16) |
|
|
|
| Named Executive Officers, Footnote |
The amounts reported in column (b) are the amounts of total compensation reported for Sabrina Martucci Johnson for each corresponding year in the "Total" column of the SCT.The amounts reported in column (d) represent the average of the amounts reported for our Non-PEO NEOs as a group in the “Total” column of the SCT in each applicable year. Our Non-PEO NEOs for purposes of calculating the average amounts for 2025, 2024 and 2023 were: (i) for 2025, MarDee Haring-Layton; (ii) for 2024, Ms. Haring-Layton and Lisa Walters-Hoffert, our former Chief Financial Officer; and (iii) for 2023, Ms. Walters-Hoffert and John Fair, our former Chief Commercial Officer.
|
|
|
| PEO Total Compensation Amount |
$ 801,081
|
$ 898,382
|
$ 1,222,108
|
| PEO Actually Paid Compensation Amount |
$ 585,885
|
754,030
|
450,419
|
| Adjustment To PEO Compensation, Footnote |
The amounts reported in column (c) and (e) represent the amount of CAP for Ms. Johnson and the average amount of CAP for the Non-PEO NEOs, respectively, as computed in accordance with Item 402(v) of Regulation S-K. The amounts do not reflect the actual amount of compensation earned by or paid to Ms. Johnson or to the Non-PEO NEOs as a group, respectively, during the applicable year. In accordance with the requirements of Item 402(v) of Regulation S-K, the following adjustments were made to the total compensation reported for Ms. Johnson in the SCT and to the average total compensation reported for the Non-PEO NEOs in the SCT for each year to determine the CAP: | | | | | | | | | | | | | | | | | | | | | 2025 | | | | | | CEO | | Average Non-CEO NEOs | | | | | | | | | | Total Compensation from SCT | $801,081 | | $546,858 | | | | | | | | | Deduct: Option Award Value Reported in SCT for the Covered FY* | (268,356) | | | (179,758) | | | | | | | | | | Add: Year End Fair Value of Equity Awards Granted During the Covered FY that Remain Outstanding and Unvested as of Last Day of the Covered FY | 89,995 | | | 68,781 | | | | | | | | | | Add (Deduct): Year over Year Change in Fair Value of Outstanding and Unvested Equity Awards | (56,237) | | | (17,538) | | | | | | | | | | Add: Fair Value as of Vesting Date of Equity Awards Granted and Vested in the FY | 39,667 | | | 50,908 | | | | | | | | | | Add (Deduct): Year over Year Change in Fair Value of Equity Awards Granted in Prior FY that Vested in the FY | (20,265) | | | (4,232) | | | | | | | | | | Deduct: Fair Value at the End of the Prior FY of Equity Awards that Failed to Meet Vesting Conditions in the FY | — | | | — | | | | | | | | | | | | | | | | | | | | | | | Compensation Actually Paid (as defined by SEC rule) | $585,885 | | $465,019 | | | | | | | | | | *The amounts reflect the aggregate grant-date fair value reported in the "Option Awards" column in the SCT for the applicable year. | | | | |
|
|
|
| Non-PEO NEO Average Total Compensation Amount |
$ 546,858
|
455,766
|
751,591
|
| Non-PEO NEO Average Compensation Actually Paid Amount |
$ 465,019
|
414,748
|
471,033
|
| Adjustment to Non-PEO NEO Compensation Footnote |
The amounts reported in column (c) and (e) represent the amount of CAP for Ms. Johnson and the average amount of CAP for the Non-PEO NEOs, respectively, as computed in accordance with Item 402(v) of Regulation S-K. The amounts do not reflect the actual amount of compensation earned by or paid to Ms. Johnson or to the Non-PEO NEOs as a group, respectively, during the applicable year. In accordance with the requirements of Item 402(v) of Regulation S-K, the following adjustments were made to the total compensation reported for Ms. Johnson in the SCT and to the average total compensation reported for the Non-PEO NEOs in the SCT for each year to determine the CAP: | | | | | | | | | | | | | | | | | | | | | 2025 | | | | | | CEO | | Average Non-CEO NEOs | | | | | | | | | | Total Compensation from SCT | $801,081 | | $546,858 | | | | | | | | | Deduct: Option Award Value Reported in SCT for the Covered FY* | (268,356) | | | (179,758) | | | | | | | | | | Add: Year End Fair Value of Equity Awards Granted During the Covered FY that Remain Outstanding and Unvested as of Last Day of the Covered FY | 89,995 | | | 68,781 | | | | | | | | | | Add (Deduct): Year over Year Change in Fair Value of Outstanding and Unvested Equity Awards | (56,237) | | | (17,538) | | | | | | | | | | Add: Fair Value as of Vesting Date of Equity Awards Granted and Vested in the FY | 39,667 | | | 50,908 | | | | | | | | | | Add (Deduct): Year over Year Change in Fair Value of Equity Awards Granted in Prior FY that Vested in the FY | (20,265) | | | (4,232) | | | | | | | | | | Deduct: Fair Value at the End of the Prior FY of Equity Awards that Failed to Meet Vesting Conditions in the FY | — | | | — | | | | | | | | | | | | | | | | | | | | | | | Compensation Actually Paid (as defined by SEC rule) | $585,885 | | $465,019 | | | | | | | | | | *The amounts reflect the aggregate grant-date fair value reported in the "Option Awards" column in the SCT for the applicable year. | | | | |
|
|
|
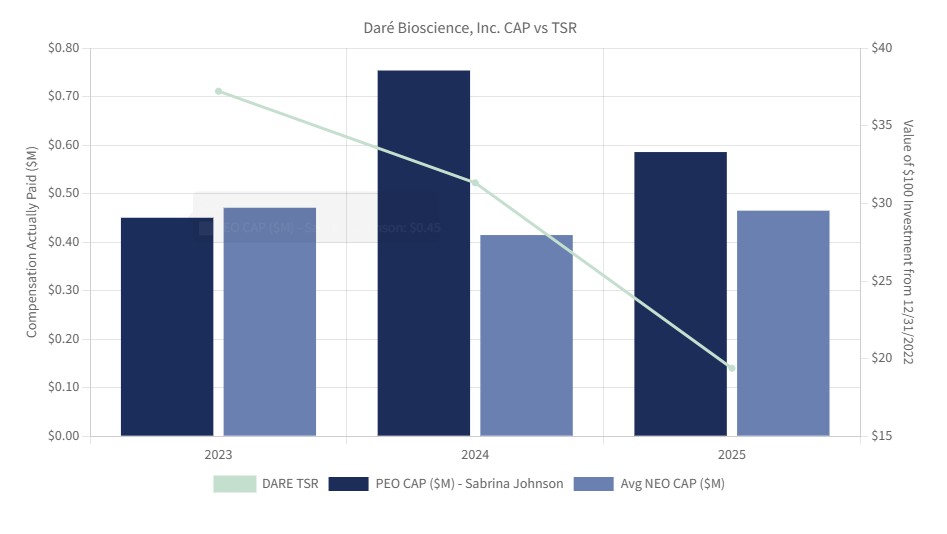
| Compensation Actually Paid vs. Total Shareholder Return |
As required by Item 402(v) of Regulation S-K, we are providing the following graphs to illustrate the relationship between the pay and performance figures that are included in the pay versus performance tabular disclosure above. As noted above, CAP for purposes of the tabular disclosure and the following graphs were calculated in accordance with SEC rules and do not fully represent the actual final amount of compensation earned by or actually paid to our named executive officers during the applicable FYs.
|
|
|
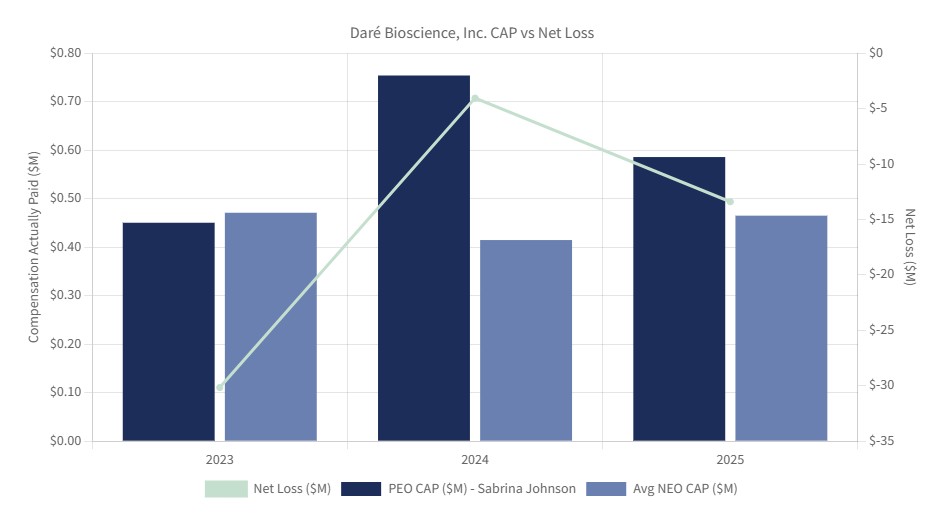
| Compensation Actually Paid vs. Net Income |
As required by Item 402(v) of Regulation S-K, we are providing the following graphs to illustrate the relationship between the pay and performance figures that are included in the pay versus performance tabular disclosure above. As noted above, CAP for purposes of the tabular disclosure and the following graphs were calculated in accordance with SEC rules and do not fully represent the actual final amount of compensation earned by or actually paid to our named executive officers during the applicable FYs.
|
|
|
| Total Shareholder Return Amount |
$ 19.33
|
31.33
|
37.23
|
| Net Income (Loss) |
$ (13,400,000)
|
$ (4,050,000.00)
|
$ (30,160,000)
|
| PEO Name |
Sabrina Martucci Johnson
|
|
|
| Additional 402(v) Disclosure |
The amounts reported in column (f) reflect the cumulative total shareholder return (“TSR”) of our common stock for the measurement periods beginning on December 31, 2022 and ending on December 31, 2025, calculated in accordance with Item 201(e) of Regulation S-K.The amounts reported in column (g) represent net income (loss) reflected in our audited financial statements for the applicable FY.
|
|
|
| PEO | Aggregate Grant Date Fair Value of Equity Award Amounts Reported in Summary Compensation Table |
|
|
|
| Pay vs Performance Disclosure |
|
|
|
| Adjustment to Compensation, Amount |
$ (268,356)
|
|
|
| PEO | Year-end Fair Value of Equity Awards Granted in Covered Year that are Outstanding and Unvested |
|
|
|
| Pay vs Performance Disclosure |
|
|
|
| Adjustment to Compensation, Amount |
89,995
|
|
|
| PEO | Year-over-Year Change in Fair Value of Equity Awards Granted in Prior Years That are Outstanding and Unvested |
|
|
|
| Pay vs Performance Disclosure |
|
|
|
| Adjustment to Compensation, Amount |
(56,237)
|
|
|
| PEO | Vesting Date Fair Value of Equity Awards Granted and Vested in Covered Year |
|
|
|
| Pay vs Performance Disclosure |
|
|
|
| Adjustment to Compensation, Amount |
39,667
|
|
|
| PEO | Change in Fair Value as of Vesting Date of Prior Year Equity Awards Vested in Covered Year |
|
|
|
| Pay vs Performance Disclosure |
|
|
|
| Adjustment to Compensation, Amount |
(20,265)
|
|
|
| PEO | Prior Year End Fair Value of Equity Awards Granted in Any Prior Year that Fail to Meet Applicable Vesting Conditions During Covered Year |
|
|
|
| Pay vs Performance Disclosure |
|
|
|
| Adjustment to Compensation, Amount |
0
|
|
|
| Non-PEO NEO | Aggregate Grant Date Fair Value of Equity Award Amounts Reported in Summary Compensation Table |
|
|
|
| Pay vs Performance Disclosure |
|
|
|
| Adjustment to Compensation, Amount |
(179,758)
|
|
|
| Non-PEO NEO | Year-end Fair Value of Equity Awards Granted in Covered Year that are Outstanding and Unvested |
|
|
|
| Pay vs Performance Disclosure |
|
|
|
| Adjustment to Compensation, Amount |
68,781
|
|
|
| Non-PEO NEO | Year-over-Year Change in Fair Value of Equity Awards Granted in Prior Years That are Outstanding and Unvested |
|
|
|
| Pay vs Performance Disclosure |
|
|
|
| Adjustment to Compensation, Amount |
(17,538)
|
|
|
| Non-PEO NEO | Vesting Date Fair Value of Equity Awards Granted and Vested in Covered Year |
|
|
|
| Pay vs Performance Disclosure |
|
|
|
| Adjustment to Compensation, Amount |
50,908
|
|
|
| Non-PEO NEO | Change in Fair Value as of Vesting Date of Prior Year Equity Awards Vested in Covered Year |
|
|
|
| Pay vs Performance Disclosure |
|
|
|
| Adjustment to Compensation, Amount |
(4,232)
|
|
|
| Non-PEO NEO | Prior Year End Fair Value of Equity Awards Granted in Any Prior Year that Fail to Meet Applicable Vesting Conditions During Covered Year |
|
|
|
| Pay vs Performance Disclosure |
|
|
|
| Adjustment to Compensation, Amount |
$ 0
|
|
|