Pay vs Performance Disclosure - USD ($)
Dec. 31, 2025
Dec. 31, 2024
Dec. 31, 2023
Dec. 31, 2022
Dec. 31, 2021
Dec. 31, 2020
Pay versus Performance
As required by Section 953(a) of the Dodd-Frank Wall Street Reform and Consumer Protection Act and Item 402(v) of Regulation
S-K,
we are providing the following information regarding the “compensation actually paid” (as defined in Item 402(v) of Regulation S-K,
the “CAP”) to the Principal Executive Officer or “PEO” (Mr. Michael P. Doss) and to the Non-PEO
NEOs (on an average basis), as well as certain performance metrics applicable to the Company. Note that the Compensation and Management Development Committee did not consider the measures set forth below when making its compensation decisions for the years shown below, and that the Peer Group used in calculating the Peer Group Total Shareholder Return measure set forth below is the group of companies that make up the Dow Jones U.S. Container Packaging Index used in the Total Return to Stockholders graph in the Company’s Annual Report on Form 10-K,
so it is not exactly the same Peer Group used by the Compensation and Management Development Committee in its process to determine executive compensation. 2025 Pay Versus Performance Table
Year |
Summary Compensation Table Total Compensation for PEO (1) |
Compensation Actually Paid to PEO (2) |
Average Summary Compensation Table Total Compensation for Non-PEO NEOs (3) |
Average Compensation Actually Paid to Non-PEO NEOs (4) |
Value of Initial Fixed $100 Investment based on Company Total Shareholder Return |
Value of Initial Fixed $100 Investment based on Peer Group Total Shareholder Return |
Net Income (in millions) |
Adjusted EBITDA (in millions) | ||||||||||||||||
2025 |
$ 9,104,747 | ($6,313,159 | ) | $2,045,596 | ($955,787 | ) | $96.66 | $99.86 | $444 | $1,395 | ||||||||||||||
2024 |
$ 9,407,955 | $17,901,034 | $2,559,819 | $4,397,170 | 177.28 | 136.68 | $658 | $1,682 | ||||||||||||||||
2023 |
$11,937,503 | $19,418,337 | $3,156,562 | $4,447,314 | 158.66 | 118.91 | $723 | $1,876 | ||||||||||||||||
2022 |
$11,644,401 | $19,745,603 | $3,401,061 | $4,830,700 | 140.89 | 110.49 | $522 | $1,600 | ||||||||||||||||
2021 |
$ 7,309,269 | $11,860,514 | $2,040,539 | $2,934,498 | 121.60 | 134.41 | $204 | $1,056 | ||||||||||||||||
2020 |
$ 8,009,101 | $10,059,859 | $2,217,803 | $2,624,259 | 103.95 | 121.14 | $167 | $1,070 | ||||||||||||||||
| (1) | The amounts shown in this column are the “Total” compensation amounts reported in the Summary Compensation Table (“SCT”) for the Company’s PEO for each corresponding year. |
| (2) | The amounts shown in this column represent the CAP paid to the Company’s PEO for each corresponding year. |
The adjustments made to the PEO’s total compensation as set forth in the SCT to determine the CAP are set forth below. |
Year |
||||||||||||||||||||
| |
2025 |
2024 |
2023 |
2022 |
2021 |
|||||||||||||||
Total Compensation Reported in SCT |
$ | 9,104,747 | $ | 9,407,955 | $ | 11,937,503 | $ | 11,644,401 | $ | 7,309,269 | ||||||||||
Less Change in Pension Value and Non-Qualified Deferred Compensation Earnings Reported in SCT |
$ | 85,167 | – | $ | 70,380 | – | – | |||||||||||||
Less: Fair Value of Stock Awards Granted during Year at Date of Grant Reported in SCT |
$ | 7,495,753 | $ | 7,158,044 | $ | 7,291,291 | $ | 6,756,267 | $ | 5,006,859 | ||||||||||
Plus: Pension Value attributable to Service and Changes in Value due to Plan Amendments made during the Year |
– | – | – | – | – | |||||||||||||||
Plus: Fair Value of Equity Compensation Granted during Year at FYE |
$ | 3,553,355 | $ | 8,103,613 | $ | 7,656,892 | $ | 7,871,034 | $ | 6,086,639 | ||||||||||
Plus: Change in Fair Value of Equity Compensation from the end of the Prior Year to Vesting Date for Stock Awards Made in Prior Years that Vested during Year Shown |
($ | 16,018 | ) | $ | 89,124 | $ | 655,973 | $ | 400,333 | $ | (313,875 | ) | ||||||||
Plus: Change in Fair Value of Equity Compensation from the end of the Prior Year to the end of the Year Shown for Stock Awards that were unvested at FYE |
($ | 11,374,323 | ) | $ | 7,458,386 | $ | 6,529,640 | $ | 6,586,102 | $ | 3,785,341 | |||||||||
Plus: Dividends or Other Earnings paid on Stock Awards in the Year Shown prior to the Vesting Date not otherwise included in Total Compensation |
– | – | – | – | – | |||||||||||||||
Compensation Actually Paid |
($ | 6,313,159 | ) | $ | 17,901,034 | $ | 19,418,337 | $ | 19,745,603 | $ | 11,860,514 | |||||||||
| (3) | The amounts shown in this column are the average of the “Total” compensation amounts reported in the SCT for each of the Non-PEO NEOs for each corresponding year. The Non-PEO NEOs included in the calculation for 2025 are Charles D. Lischer, Stephen R. Scherger, Michael J. Farrell, Lauren S. Tashma, Joseph P. Yost and Maggie K. Bidlingmaier. The Non-PEO NEOS included in the calculation for the years 2022—2024 are Stephen R. Scherger, Maggie K. Bidlingmaier, Lauren S. Tashma and Joseph P. Yost. The Non-PEO NEOs included in the calculation for 2021 are Stephen R. Scherger, Michael J. Farrell, Lauren S. Tashma and Joseph P. Yost. |
| (4) | The amounts shown in this column represent the average CAP paid to the Company’s Non-PEO NEOs for each corresponding year. |
The adjustments made to the
Non-PEO
NEOs’ total compensation as set forth in the SCT to determine the average CAP are set forth below. Year |
||||||||||||||||||||
2025 |
2024 |
2023 |
2022 |
2021 |
||||||||||||||||
Average Total Compensation Reported in SCT |
2,045,596 | $ | 2,559,819 | $ | 3,156,562 | $ | 3,401,061 | $ | 2,040,539 | |||||||||||
Less: Average Change in Pension Value and Non-Qualified Deferred Compensation Earnings Reported in SCT |
5,339 | – | $ | 6,433 | – | – | ||||||||||||||
Less: Average Fair Value of Stock Awards Granted during Year at Date of Grant Reported in SCT |
1,354,489 | $ | 1,491,456 | $ | 1,404,227 | $ | 1,674,232 | $ | 1,044,128 | |||||||||||
Plus: Average Pension Value attributable to Service and Changes in Value due to Plan Amendments made during the Year |
– | – | – | – | – | |||||||||||||||
Plus: Average Fair Value of Equity Compensation Granted during Year at FYE |
394,680 | $ | 1,688,475 | $ | 1,474,638 | $ | 1,942,288 | $ | 1,253,564 | |||||||||||
Plus: Average Change in Fair Value of Equity Compensation from the end of the Prior Year to Vesting Date for Stock Awards Made in Prior Years that Vested during Year Shown |
5,154 | $ | 147,817 | $ | 109,054 | $ | 73,532 | $ | (57,105 | ) | ||||||||||
Plus: Average Change in Fair Value of Equity Compensation from the end of the Prior Year to the end of the Year Shown for Stock Awards that were unvested at FYE |
(2,046,729 | ) | $ | 1,492,515 | $ | 1,117,720 | $ | 1,088,051 | $ | 741,628 | ||||||||||
Plus: Average Dividends or Other Earnings paid on Stock Awards in the Year Shown prior to the Vesting Date not otherwise included in Total Compensation |
– | $ | 0 | $ | 0 | $ | 0 | $ | 0 | |||||||||||
Compensation Actually Paid |
(955,787 | ) | $ | 4,397,170 | $ | 4,447,314 | $ | 4,830,700 | $ | 2,934,498 | ||||||||||
Non-PEO
NEOs for each corresponding year. The Non-PEO
NEOs included in the calculation for 2025 are Charles D. Lischer, Stephen R. Scherger, Michael J. Farrell, Lauren S. Tashma, Joseph P. Yost and Maggie K. Bidlingmaier. The Non-PEO
NEOS included in the calculation for the years 2022—2024 are Stephen R. Scherger, Maggie K. Bidlingmaier, Lauren S. Tashma and Joseph P. Yost. The Non-PEO
NEOs included in the calculation for 2021 are Stephen R. Scherger, Michael J. Farrell, Lauren S. Tashma and Joseph P. Yost.
| (2) | The amounts shown in this column represent the CAP paid to the Company’s PEO for each corresponding year. |
The adjustments made to the PEO’s total compensation as set forth in the SCT to determine the CAP are set forth below. |
Year |
||||||||||||||||||||
| |
2025 |
2024 |
2023 |
2022 |
2021 |
|||||||||||||||
Total Compensation Reported in SCT |
$ | 9,104,747 | $ | 9,407,955 | $ | 11,937,503 | $ | 11,644,401 | $ | 7,309,269 | ||||||||||
Less Change in Pension Value and Non-Qualified Deferred Compensation Earnings Reported in SCT |
$ | 85,167 | – | $ | 70,380 | – | – | |||||||||||||
Less: Fair Value of Stock Awards Granted during Year at Date of Grant Reported in SCT |
$ | 7,495,753 | $ | 7,158,044 | $ | 7,291,291 | $ | 6,756,267 | $ | 5,006,859 | ||||||||||
Plus: Pension Value attributable to Service and Changes in Value due to Plan Amendments made during the Year |
– | – | – | – | – | |||||||||||||||
Plus: Fair Value of Equity Compensation Granted during Year at FYE |
$ | 3,553,355 | $ | 8,103,613 | $ | 7,656,892 | $ | 7,871,034 | $ | 6,086,639 | ||||||||||
Plus: Change in Fair Value of Equity Compensation from the end of the Prior Year to Vesting Date for Stock Awards Made in Prior Years that Vested during Year Shown |
($ | 16,018 | ) | $ | 89,124 | $ | 655,973 | $ | 400,333 | $ | (313,875 | ) | ||||||||
Plus: Change in Fair Value of Equity Compensation from the end of the Prior Year to the end of the Year Shown for Stock Awards that were unvested at FYE |
($ | 11,374,323 | ) | $ | 7,458,386 | $ | 6,529,640 | $ | 6,586,102 | $ | 3,785,341 | |||||||||
Plus: Dividends or Other Earnings paid on Stock Awards in the Year Shown prior to the Vesting Date not otherwise included in Total Compensation |
– | – | – | – | – | |||||||||||||||
Compensation Actually Paid |
($ | 6,313,159 | ) | $ | 17,901,034 | $ | 19,418,337 | $ | 19,745,603 | $ | 11,860,514 | |||||||||
| (4) | The amounts shown in this column represent the average CAP paid to the Company’s Non-PEO NEOs for each corresponding year. |
The adjustments made to the
Non-PEO
NEOs’ total compensation as set forth in the SCT to determine the average CAP are set forth below. Year |
||||||||||||||||||||
2025 |
2024 |
2023 |
2022 |
2021 |
||||||||||||||||
Average Total Compensation Reported in SCT |
2,045,596 | $ | 2,559,819 | $ | 3,156,562 | $ | 3,401,061 | $ | 2,040,539 | |||||||||||
Less: Average Change in Pension Value and Non-Qualified Deferred Compensation Earnings Reported in SCT |
5,339 | – | $ | 6,433 | – | – | ||||||||||||||
Less: Average Fair Value of Stock Awards Granted during Year at Date of Grant Reported in SCT |
1,354,489 | $ | 1,491,456 | $ | 1,404,227 | $ | 1,674,232 | $ | 1,044,128 | |||||||||||
Plus: Average Pension Value attributable to Service and Changes in Value due to Plan Amendments made during the Year |
– | – | – | – | – | |||||||||||||||
Plus: Average Fair Value of Equity Compensation Granted during Year at FYE |
394,680 | $ | 1,688,475 | $ | 1,474,638 | $ | 1,942,288 | $ | 1,253,564 | |||||||||||
Plus: Average Change in Fair Value of Equity Compensation from the end of the Prior Year to Vesting Date for Stock Awards Made in Prior Years that Vested during Year Shown |
5,154 | $ | 147,817 | $ | 109,054 | $ | 73,532 | $ | (57,105 | ) | ||||||||||
Plus: Average Change in Fair Value of Equity Compensation from the end of the Prior Year to the end of the Year Shown for Stock Awards that were unvested at FYE |
(2,046,729 | ) | $ | 1,492,515 | $ | 1,117,720 | $ | 1,088,051 | $ | 741,628 | ||||||||||
Plus: Average Dividends or Other Earnings paid on Stock Awards in the Year Shown prior to the Vesting Date not otherwise included in Total Compensation |
– | $ | 0 | $ | 0 | $ | 0 | $ | 0 | |||||||||||
Compensation Actually Paid |
(955,787 | ) | $ | 4,397,170 | $ | 4,447,314 | $ | 4,830,700 | $ | 2,934,498 | ||||||||||
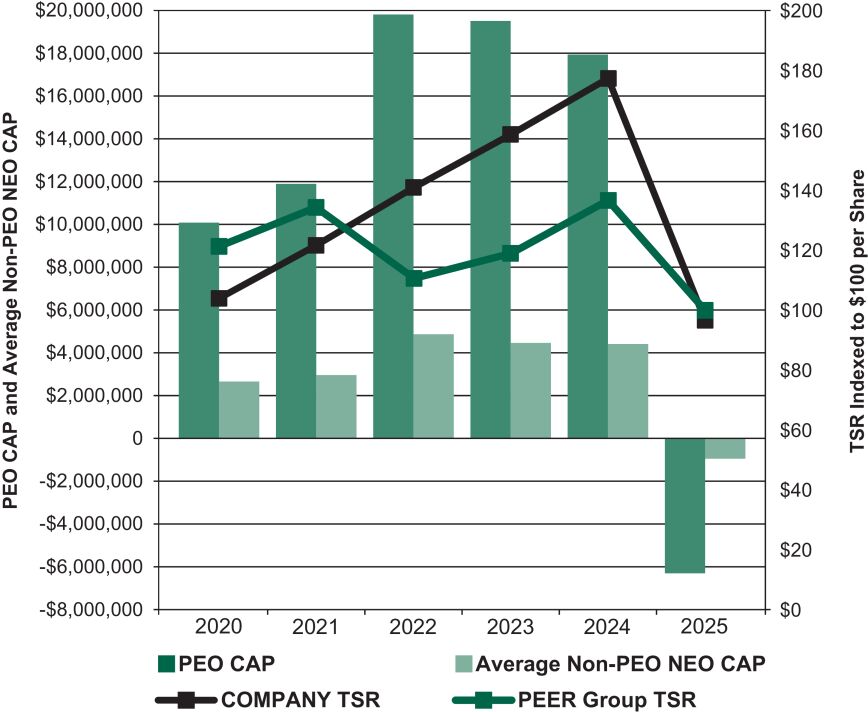
PEO CAP and Average
Non-PEO
NEO CAP vs. Company TSR and Peer Group TSR
PEO and Average
Non-PEO
NEO CAP vs Net Income and Adjusted EBITDA
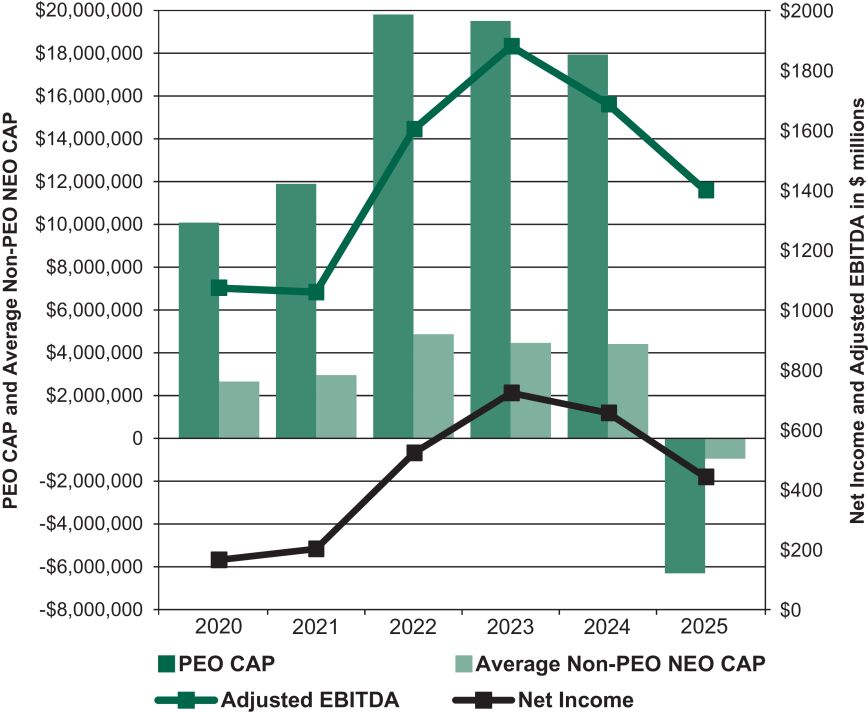
PEO and Average
Non-PEO
NEO CAP vs Net Income and Adjusted EBITDA
PEO CAP and Average
Non-PEO
NEO CAP vs. Company TSR and Peer Group TSR
Pay Versus Performance – Tabular List of Performance Measures
We believe that the most important measures of the Company’s financial performance are:
Adjusted EBITDA
Cash Flow Before Debt Reduction
Return on Invested Capital
Net Organic Sales Growth
These measures are used to determine payouts under our short-term cash incentive plan and our long-term equity incentive plan and collectively provide a holistic view of the Company’s financial condition.