As filed with the Securities and Exchange Commission on April 27, 2026.
Registration Nos. 333-146374
811-22127
811-22127
UNITED STATES
SECURITIES AND EXCHANGE COMMISSION
SECURITIES AND EXCHANGE COMMISSION
WASHINGTON, DC 20549
Form N-1A
REGISTRATION STATEMENT
REGISTRATION STATEMENT
UNDER
THE SECURITIES ACT OF 1933
☒
Pre-Effective Amendment No.
☐
Post-Effective Amendment No. 104
☒
and/or
REGISTRATION STATEMENT
UNDER
THE INVESTMENT COMPANY ACT OF 1940
☒
Amendment No. 105
☒
(Check Appropriate Box or Boxes)
(Exact Name of Registrant as Specified in Charter)
290 Congress Street, Boston, Massachusetts 02210
(Address of Principal Executive Offices) (Zip Code)
(Address of Principal Executive Offices) (Zip Code)
Registrant’s Telephone Number, Including Area Code: (800) 345-6611
| Michael G. Clarke c/o Columbia Management Investment Advisers, LLC 290 Congress Street Boston, Massachusetts 02210 |
Ryan C. Larrenaga, Esq. c/o Columbia Management Investment Advisers, LLC 290 Congress Street Boston, Massachusetts 02210 |
(Name and Address of Agents for Service)
Approximate Date of Proposed Public Offering:
It is proposed that this filing will become effective (check appropriate box)
☐ Immediately upon filing pursuant to paragraph (b)
☒ On May 1, 2026 pursuant to paragraph (b)
☐ 60 days after filing pursuant to paragraph (a)(1)
☐ On (date) pursuant to paragraph (a)(1)
☐ 75 days after filing pursuant to paragraph (a)(2)
☐ On (date) pursuant to paragraph (a)(2) of rule 485.
If appropriate, check the following box:
☐ This post-effective amendment designates a new effective date for a previously filed post-effective amendment.
This Post-Effective Amendment relates solely to the Registrant’s Columbia Variable Portfolio – Commodity Strategy Fund, Columbia Variable Portfolio - Emerging Markets Bond Fund, Columbia Variable Portfolio – High Yield Bond Fund, Columbia Variable Portfolio – Large Cap Index Fund, Columbia Variable Portfolio – Select Corporate Income Fund (prior to May 1, 2026, known as Columbia Variable Portfolio - Corporate Bond Fund), Columbia Variable Portfolio – Select Mid Cap Growth Fund, Columbia Variable Portfolio – Select Mid Cap Value Fund, Columbia Variable Portfolio – Select Short Corporate Income Fund (prior to May 1, 2026, known as Columbia Variable Portfolio - Limited Duration Credit Fund), CTIVP® – CenterSquare Real Estate Fund, CTIVP® – Victory Sycamore Established Value Fund, CTIVP® – Westfield Mid Cap Growth Fund, CTIVP® –
Westfield Select Large Cap Growth Fund, Variable Portfolio – Partners Core Bond Fund, and Variable Portfolio – Partners Core Equity Fund series. Information contained in the Registrant’s Registration Statement relating to any other series of the Registrant is neither amended nor superseded hereby.

Columbia Variable Portfolio – Commodity Strategy Fund
Prospectus
The Securities and Exchange Commission (SEC) and the Commodity Futures Trading Commission (CFTC) have not approved or disapproved these securities or passed upon the adequacy of this prospectus. Any representation to the contrary is a criminal offense.

Columbia Variable Portfolio - Commodity Strategy Fund
Table of Contents
| 3 | |
| 3 | |
| 3 | |
| 4 | |
| 5 | |
| 12 | |
| 13 | |
| 13 | |
| 13 | |
| 13 | |
| 14 | |
| 14 | |
| 14 | |
| 16 | |
| 25 | |
| 29 | |
| 31 | |
| 32 | |
| 33 | |
| 34 | |
| 34 | |
| 34 | |
| 35 | |
| 37 | |
| 42 | |
| 42 | |
| 42 | |
| 45 |
2
Prospectus 2026
Columbia Variable Portfolio - Commodity Strategy Fund
Summary of the Fund
Investment Objective
Columbia Variable Portfolio – Commodity Strategy Fund (the Fund) seeks to provide shareholders with total return.
Fees and Expenses of the Fund
This table describes the fees and expenses that you may pay as an investor in the Fund. The table does not reflect any fees or expenses imposed by your Contract or Qualified Plan, which are disclosed in your separate Contract prospectus or Qualified Plan disclosure documents. If the additional fees or expenses were reflected, the expenses set forth below would be higher.
Annual Fund Operating Expenses (expenses that you pay each year as a percentage of the value of your investment) | ||
| |
Class 1 |
Class 2 |
| Management fees |
% |
% |
| Distribution and/or service (12b-1) fees |
% |
% |
| Other expenses |
% |
% |
| Total annual Fund operating expenses(a) |
% |
% |
| Less: Fee waivers and/or expense reimbursements(b) |
( %) |
( %) |
| Total annual Fund operating expenses after fee waivers and/or expense reimbursements |
% |
% |
(a)
(b)
Example
The following example is intended to help you compare the cost of investing in the Fund with the cost of investing in other mutual funds. The example illustrates the hypothetical expenses that you would incur over the time periods indicated, and assumes that:
■
you invest $10,000 in the applicable class of Fund shares for the periods indicated,
■
your investment has a 5% return each year, and
■
the Fund’s total annual operating expenses remain the same as shown in the Annual Fund Operating Expenses table above.
The example does not reflect any fees and expenses that apply to your Contract or Qualified Plan. Inclusion of these charges would increase expenses for all periods shown.
Since the waivers and/or reimbursements shown in the Annual Fund Operating Expenses table above expire as indicated in the preceding table, they are only reflected in the 1 year example and the first year of the other examples. Although your actual costs may be higher or lower, based on the assumptions listed above, your costs would be:
| |
1 year |
3 years |
5 years |
10 years |
| Class 1 (whether or not shares are redeemed) |
$ |
$ |
$ |
$ |
| Class 2 (whether or not shares are redeemed) |
$ |
$ |
$ |
$ |
Prospectus 2026
3
Columbia Variable Portfolio - Commodity Strategy Fund
Summary of the Fund (continued)
Portfolio Turnover
The Fund may pay transaction costs, such as commissions, when it buys and sells securities (or “turns over” its portfolio). A higher portfolio turnover rate may indicate higher transaction costs. These costs, which are not reflected in annual fund operating expenses or in the example, affect the Fund’s performance. During the most recent fiscal year, the Fund’s portfolio turnover rate was 92 % of the average value of its portfolio.
Principal Investment Strategies
Under normal circumstances, the Fund seeks to maintain substantial economic exposure to the performance of the commodities markets. The Fund invests, directly or indirectly, in a portfolio of commodity-linked investments, such as commodity-linked futures, structured notes and/or swaps, that are designed to provide long and short exposures to the investment return of assets that trade in the commodities markets, without investing directly in physical commodities. A substantial portion of the Fund’s net assets will also be invested in a portfolio of fixed income securities rated investment-grade or, if unrated, deemed of comparable quality, which will consist primarily of: (i) U.S. Government securities (including U.S. Government agency securities), corporate debt securities, mortgage-backed securities and/or asset-backed securities; and/or (ii) shares of an affiliated money market fund. In addition to investing in these holdings for their income-producing potential, these holdings will be designated by the Fund, as necessary, to serve as collateral with respect to the Fund’s commodity-linked investments.
The Fund primarily expects to gain exposure to the commodities markets by investing up to 25% of its total assets in a wholly-owned subsidiary of the Fund organized as a company under the laws of the Cayman Islands (the Subsidiary). The Subsidiary’s commodity-linked investments are expected to produce leveraged exposure to the performance of the commodities markets. It is expected that the gross notional value of the Fund’s (including the Subsidiary’s) commodity-linked investments will be equivalent to at least 90% of the Fund’s net assets. Like the Fund, the Subsidiary will not invest directly in physical commodities. The Subsidiary also invests in investment-grade fixed income securities and shares of an affiliated money market fund for investment purposes or to serve as collateral for its commodity-linked investments. The Fund’s investment in the Subsidiary permits it to gain exposure to the commodities markets in a potentially tax-efficient manner. The Subsidiary has the same investment objective as the Fund and, like the Fund, is managed by Columbia Management Investment Advisers, LLC (Columbia Management or the Investment Manager).
The Fund may invest in derivatives, including futures contracts (including commodity-linked futures and interest rate futures), options contracts (including options on futures contracts), structured investments (including commodity-linked structured notes) and swaps (including commodity-linked swaps) to increase, modify, reduce or short commodity market positions or exposures. Actual exposures will vary over time based on factors such as market movements and assessments of market conditions by the Fund's portfolio managers. The Fund may engage in derivative transactions on both U.S. and foreign exchanges or in the "over-the-counter" (OTC) market. The Fund may at times emphasize one or more sectors in selecting its investments, including the agricultural, energy and precious metals sectors.
The Fund may invest in privately placed and other securities or instruments that are purchased and sold pursuant to Rule 144A or other exemptions under the Securities Act of 1933, as amended, subject to certain regulatory restrictions.
In constructing the Fund’s fixed-income portfolio, the Investment Manager seeks to identify a portfolio of investment-grade fixed income securities, generally with a dollar-weighted average portfolio duration of 1 year or less.
The Fund’s investment strategy may involve the frequent trading of portfolio securities. Additionally, the Fund’s strategy of investing in derivative instruments and instruments with a maturity of one year or less at the time of acquisition, will also contribute to frequent portfolio trading and high portfolio turnover (typically greater than 300% per year).
4
Prospectus 2026
Columbia Variable Portfolio - Commodity Strategy Fund
Summary of the Fund (continued)
Principal Risks
An investment in the Fund involves risks, including Commodity-related Investment Risk, Derivatives Risk, Market Risk, Mortgage- and Other Asset-Backed Securities Risk, and Sector Risk, among others. Descriptions of these and other principal risks of investing in the Fund as well as those associated with the Fund’s investment in the Subsidiary are provided below. There is no assurance that the Fund will achieve its investment objective and you may lose money . The value of the Fund’s holdings may decline, and the Fund’s net asset value (NAV) and share price may go down. An investment in the Fund is not a bank deposit and is not insured or guaranteed by the Federal Deposit Insurance Corporation or any other government agency. (References in this section to “the Fund” also include the Subsidiary, which shares the same risks as the Fund.) The significance of any specific risk to an investment in the Fund will vary over time depending on the composition of the Fund's portfolio, market conditions, and other factors. You should read all of the risk information below carefully, because any one or more of these risks may result in losses to the Fund.
Active Management Risk. Due to its active management, the Fund could underperform its benchmark index and/or other funds with similar investment objectives and/or strategies.
Commodity Futures Trading Commission (CFTC) Regulatory Risk. The Fund does not qualify for an exemption from registration as a “commodity pool” under rules of the Commodity Exchange Act (the CEA). Accordingly, the Fund is a commodity pool under the CEA and the Investment Manager is registered as a “commodity pool operator” under the CEA. The Fund is subject to dual regulation by the SEC and the CFTC. Compliance with the CFTC’s regulatory requirements could increase Fund expenses, adversely affecting the Fund’s total return.
Commodity-related Investment Risk. The value of commodities investments will generally be affected by overall market movements and factors specific to a particular industry or commodity, which may include demand for the commodity, weather, embargoes, tariffs, and economic health, political, international, regulatory and other developments. Exposure to commodities and commodities markets may subject the value of the Fund’s investments to greater volatility than other types of investments. Commodities investments may also subject the Fund to counterparty risk and liquidity risk. The Fund may make commodity-related investments through one or more wholly-owned subsidiaries organized outside the U.S. that are generally not subject to U.S. laws (including securities laws) and their protections.
Commodity-related Tax Risk. The Fund intends to qualify for treatment as a regulated investment company under the Internal Revenue Code of 1986, as amended. The Fund’s investments in commodities or commodity-related investments can be limited by the Fund’s intention to qualify as a regulated investment company and can limit the Fund’s ability to so qualify.
Counterparty Risk. Counterparty risk is the risk that a counterparty to a transaction in a financial instrument held by the Fund or by a special purpose or structured vehicle invested in by the Fund may become insolvent or otherwise fail to perform its obligations. As a result, the Fund may obtain no or limited recovery of its investment, and any recovery may be significantly delayed.
Credit Risk. Credit risk is the risk that the value of debt instruments may decline if the issuer thereof defaults or otherwise becomes unable or unwilling, or is perceived to be unable or unwilling, to honor its financial obligations, such as making payments to the Fund when due. Credit rating agencies, such as S&P Global Ratings, Moody’s Investors Service, Inc. (Moody’s Ratings), Fitch Ratings, Inc. (Fitch), Morningstar DBRS (DBRS) and Kroll Bond Rating Agency, LLC (KBRA), assign credit ratings to certain debt instruments to indicate their credit risk. A rating downgrade by such agencies can negatively impact the value of such instruments. Lower-rated or unrated instruments held by the Fund may present increased credit risk as compared to higher-rated instruments. Non-investment grade debt instruments may be subject to greater price fluctuations and are more likely to experience a default than investment grade debt instruments and therefore may expose the Fund to increased credit risk. If the Fund purchases unrated instruments, or if the ratings of instruments held by the Fund are lowered after purchase, the Fund will depend on analysis of credit risk more heavily than usual.
Prospectus 2026
5
Columbia Variable Portfolio - Commodity Strategy Fund
Summary of the Fund (continued)
Derivatives Risk. Derivatives may involve significant risks. Derivatives are financial instruments with a value in relation to, or derived from, the value of an underlying asset(s) or other reference, such as an index, rate or other economic indicator (each an underlying reference). Derivatives may include those that are privately placed or otherwise exempt from SEC registration, including certain Rule 144A eligible securities. Derivatives could result in Fund losses if the underlying reference does not perform as anticipated. Use of derivatives is a highly specialized activity that can involve investment techniques, risks, and tax planning different from those associated with more traditional investment instruments. The Fund’s derivatives strategy may not be successful, and use of certain derivatives could result in substantial, potentially unlimited, losses to the Fund regardless of the Fund’s actual investment. A relatively small movement in the price, rate or other economic indicator associated with the underlying reference may result in substantial losses for the Fund. Derivatives may be more volatile than other types of investments. The value of derivatives may be influenced by a variety of factors, including national and international political and economic developments. Potential changes to the regulation of the derivatives markets may make derivatives more costly, may limit the market for derivatives, or may otherwise adversely affect the value or performance of derivatives. Derivatives can increase the Fund’s risk exposure to underlying references and their attendant risks, such as credit risk, market risk, foreign currency risk and interest rate risk, while potentially exposing the Fund to correlation risk, counterparty risk, hedging risk, inflation risk, leverage risk, liquidity risk, pricing risk and volatility risk.
Derivatives Risk – Futures Contracts Risk. A futures contract is an exchange-traded derivative transaction between two parties in which a buyer (holding the “long” position) agrees to pay a fixed price (or rate) at a specified future date for delivery of an underlying reference from a seller (holding the “short” position). The seller hopes that the market price on the delivery date is less than the agreed upon price, while the buyer hopes for the contrary. Certain futures contract markets are highly volatile, and futures contracts may be illiquid. Futures exchanges may limit fluctuations in futures contract prices by imposing a maximum permissible daily price movement. The Fund may be disadvantaged if it is prohibited from executing a trade outside the daily permissible price movement. At or prior to maturity of a futures contract, the Fund may enter into an offsetting contract and may incur a loss to the extent there has been adverse movement in futures contract prices. The liquidity of the futures markets depends on participants entering into offsetting transactions rather than making or taking delivery. To the extent participants make or take delivery, liquidity in the futures market could be reduced. Because of the low margin deposits normally required in futures trading, it is possible that the Fund may employ a high degree of leverage in the portfolio. As a result, a relatively small price movement in a futures contract may result in substantial losses to the Fund, exceeding the amount of the margin paid. For certain types of futures contracts, losses are potentially unlimited. Futures markets are highly volatile, and the use of futures may increase the volatility of the Fund’s NAV. Futures contracts executed (if any) on foreign exchanges may not provide the same protection as U.S. exchanges. Futures contracts can increase the Fund’s risk exposure to underlying references and their attendant risks, such as credit risk, market risk, foreign currency risk and interest rate risk, while potentially exposing the Fund to correlation risk, counterparty risk, hedging risk, inflation risk, leverage risk, liquidity risk, pricing risk and volatility risk.
Derivatives Risk – Options Risk. Options are derivatives that give the purchaser the option to buy (call) or sell (put) an underlying reference from or to a counterparty at a specified price (the strike price) on or before an expiration date. When writing options, the Fund is exposed to the risk that it may be required to buy or sell the underlying reference at a disadvantageous price on or before the expiration date. Options may involve economic leverage, which could result in greater volatility in price movement. The Fund's losses could be significant and are potentially unlimited for certain types of options. Options may be traded on a securities exchange or in the over-the-counter market. At or prior to maturity of an options contract, the Fund may enter into an offsetting contract and may incur a loss to the extent there has been adverse movement in options prices. Options can increase the Fund’s risk exposure to underlying references and their attendant risks, such as credit risk, market risk, foreign currency risk and interest rate risk, while potentially exposing the Fund to correlation risk, counterparty risk, hedging risk, inflation risk, leverage risk, liquidity risk, pricing risk and volatility risk.
Derivatives Risk – Structured Investments Risk. Structured investments are over-the-counter derivatives that provide principal and/or interest payments based on the value of an underlying reference(s). Structured investments may lack a liquid secondary market, and their prices or value can be volatile, which could result in significant losses
6
Prospectus 2026
Columbia Variable Portfolio - Commodity Strategy Fund
Summary of the Fund (continued)
for the Fund. Structured investments may create economic leverage which may increase the volatility of the value of the investment. Structured investments can increase the Fund’s risk exposure to underlying references and their attendant risks, such as credit risk, market risk, foreign currency risk and interest rate risk, while potentially exposing the Fund to correlation risk, counterparty risk, hedging risk, inflation risk, leverage risk, liquidity risk, pricing risk and volatility risk.
Derivatives Risk – Swaps Risk. In a typical swap transaction, two parties agree to exchange the return earned on a specified underlying reference for a fixed return or the return from another underlying reference during a specified period of time. Swaps may be difficult to value and may be illiquid. Swaps could result in Fund losses if the underlying asset or reference does not perform as anticipated. Swaps create significant investment leverage such that a relatively small price movement in a swap may result in immediate and substantial losses to the Fund. The Fund may only close out a swap with its particular counterparty and may only transfer a position with the consent of that counterparty. Certain swaps, such as short swap transactions and total return swaps, have the potential for unlimited losses, regardless of the size of the initial position. Swaps can increase the Fund’s risk exposure to underlying references and their attendant risks, such as credit risk, market risk, foreign currency risk and interest rate risk, while potentially exposing the Fund to correlation risk, counterparty risk, hedging risk, inflation risk, leverage risk, liquidity risk, pricing risk and volatility risk.
Fixed Income Instruments Risk. The Fund is subject to the general risks and considerations associated with investing in debt securities, including the risk that issuers will fail to make timely payments of principal or interest or default altogether. Lower-rated securities in which the Fund may invest may be more volatile and may decline more in price in response to negative issuer developments or general economic news than higher rated securities. In addition, as interest rates rise, the Fund’s investments typically will lose value.
Frequent Trading Risk. The portfolio managers may actively and frequently trade investments in the Fund's portfolio to carry out its investment strategies. Frequent trading can also mean higher brokerage and other transaction costs, which could reduce the Fund's return. The trading costs associated with portfolio turnover may adversely affect the Fund’s performance.
Interest Rate Risk. Interest rate risk is the risk of losses attributable to changes in interest rates. In general, if interest rates rise, the values of debt instruments tend to fall, and if interest rates fall, the values of debt instruments tend to rise. Changes in the value of a debt instrument usually will not affect the amount of income the Fund receives from it but will generally affect the value of your investment in the Fund. Changes in interest rates may also affect the liquidity of the Fund’s investments in debt instruments. In general, the longer the maturity or duration of a debt instrument, the greater its sensitivity to changes in interest rates. For example, a three-year duration means a bond is expected to decrease in value by 3% if interest rates rise 1% and increase in value by 3% if interest rates fall 1%. Interest rate declines also may increase prepayments of debt obligations, which, in turn, would increase prepayment risk. The Fund is subject to the risk that the income generated by its investments may not keep pace with inflation. Actions by governments and central banking authorities can result in increases or decreases in interest rates. Higher periods of inflation could lead such authorities to raise interest rates. Such actions may negatively affect the value of debt instruments held by the Fund, resulting in a negative impact on the Fund's performance and NAV. Any interest rate increases could cause the value of the Fund’s investments in debt instruments to decrease. Rising interest rates may prompt redemptions from the Fund, which may force the Fund to sell investments at a time when it is not advantageous to do so, which could result in losses.
Investing in Wholly-Owned Subsidiary Risk. By investing in a Subsidiary, the Fund is indirectly exposed to the risks associated with the Subsidiary’s investments. The Fund’s Principal Risks may also apply to a Subsidiary in which the Fund invests (which are described in this prospectus). There can be no assurance that the investment objective of a Subsidiary will be achieved. Changes in the laws of the United States and/or the Cayman Islands, under which the Fund and any Subsidiary in which it invests, respectively, are organized, could result in the inability of the Fund and/or the Subsidiary to operate as described in this prospectus and the Fund’s Statement of Additional Information (SAI) and could adversely affect the Fund and its shareholders.
Prospectus 2026
7
Columbia Variable Portfolio - Commodity Strategy Fund
Summary of the Fund (continued)
Issuer Risk. An issuer in which the Fund invests or to which it has exposure may perform poorly or below expectations, and the value of its securities may therefore decline, which may negatively affect the Fund’s performance. Underperformance of an issuer may be caused by poor management decisions, competitive pressures, breakthroughs in technology, reliance on suppliers, labor problems or shortages, corporate restructurings, fraudulent disclosures, natural disasters, military confrontations and actions, war, other conflicts, terrorism, disease/virus outbreaks, epidemics or other events, conditions and factors which may impair the value of your investment in the Fund.
Large Purchases and Redemptions of Fund Shares Risk. The timing and magnitude of Fund share purchases and redemptions, including by large Fund shareholders transacting in large amounts of Fund shares, could prevent the Fund from being fully invested, or require the Fund to sell portfolio securities at unfavorable prices or hold ready reserves of uninvested cash in amounts larger than might otherwise be the case to meet shareholder redemptions. Thus, large Fund share purchases and redemptions could adversely impact the Fund’s performance. Such Fund share activity may also increase the Fund’s transaction costs, which would also detract from Fund performance, while also having potentially negative tax consequences for investors. The Fund, because of a large redemption, may be forced to sell its liquid or more liquid positions, resulting in the Fund holding a higher percentage of less liquid or illiquid securities (i.e., investments that a Fund reasonably expects cannot be sold or disposed of in current market conditions in seven calendar days or less without the sale or disposition significantly changing the market value of the instrument). Because the expenses and costs of the Fund are shared by its investors, large redemptions in the Fund could result in decreased economies of scale and increased operating expenses for non-redeeming Fund shareholders. In addition, in the event of a Fund proxy proposal, one or more large investor(s) could dictate with its/their vote the results of the proposal, which may have a less favorable impact on minority-stake shareholders.
Leverage Risk. Leverage occurs when the Fund increases its assets available for investment using borrowings, derivatives, or similar instruments or techniques. Use of leverage can produce volatility and may exaggerate changes in the NAV of Fund shares and in the return on the Fund’s portfolio, which may increase the risk that the Fund will lose more than it has invested. If the Fund uses leverage, through the purchase of particular instruments such as derivatives, the Fund may experience capital losses that exceed the net assets of the Fund. Leverage can create an interest expense that may lower the Fund's overall returns. Leverage presents the opportunity for increased net income and capital gains, but may also exaggerate the Fund’s volatility and risk of loss. There can be no guarantee that a leveraging strategy will be successful.
Liquidity Risk. Liquidity risk is the risk associated with any event, circumstance, or characteristic of an investment or market that negatively impacts the Fund’s ability to sell, or realize the proceeds from the sale of, an investment at a desirable time or price. Liquidity risk may arise because of, for example, a lack of marketability of the investment, which means that when seeking to sell its portfolio investments, the Fund could find that selling is more difficult than anticipated, especially during times of high market volatility. Decreases in the number of financial institutions, including banks and broker-dealers, willing to make markets (match up sellers and buyers) in the Fund’s investments or decreases in their capacity or willingness to trade such investments may increase the Fund’s exposure to this risk. The debt market has experienced considerable growth, and financial institutions making markets in instruments purchased and sold by the Fund (e.g., bond dealers) have been subject to increased regulation. The impact of that growth and regulation on the ability and willingness of financial institutions to engage in trading or “making a market” in such instruments remains unsettled. Certain types of investments, such as lower-rated securities or those that are purchased and sold in over-the-counter markets, may be especially subject to liquidity risk. Securities or other assets in which the Fund invests may be traded in the over-the-counter market rather than on an exchange and therefore may be more difficult to purchase or sell at a fair price, which may have a negative impact on the Fund’s performance. Market participants attempting to sell the same or a similar instrument at the same time as the Fund could exacerbate the Fund’s exposure to liquidity risk. The Fund may have to accept a lower selling price for the holding, sell other liquid or more liquid investments that it might otherwise prefer to hold (thereby increasing the proportion of the Fund’s investments in less liquid or illiquid securities), or forego another more appealing investment opportunity. The liquidity of Fund investments may change significantly over time and certain investments that were liquid when purchased by the Fund may later become illiquid, particularly in times of overall economic distress. Changing regulatory, market or other conditions or environments (for example, the interest rate or
8
Prospectus 2026
Columbia Variable Portfolio - Commodity Strategy Fund
Summary of the Fund (continued)
credit environments) may also adversely affect the liquidity and the price of the Fund's investments. Judgment plays a larger role in valuing illiquid or less liquid investments as compared to valuing liquid or more liquid investments. Price volatility may be higher for illiquid or less liquid investments as a result of, for example, the relatively less frequent pricing of such securities (as compared to liquid or more liquid investments). Generally, the less liquid the market at the time the Fund sells a portfolio investment, the greater the risk of loss or decline of value to the Fund. Overall market liquidity and other factors can lead to an increase in redemptions, which may negatively impact Fund performance and NAV, including, for example, if the Fund is forced to sell investments in a down market.
Market Risk. The Fund may incur losses due to declines in the value of one or more securities in which it invests. These declines may be due to factors affecting a particular issuer, or the result of, among other things, political, regulatory, market, economic or social developments affecting the relevant market(s) more generally. In addition, turbulence in financial markets and reduced liquidity in equity, credit and/or fixed income markets may negatively affect many issuers, which could adversely affect the Fund’s ability to price or value hard-to-value assets in thinly traded and closed markets and could cause significant redemptions and operational challenges. Global economies and financial markets are increasingly interconnected, and conditions and events in one country, region or financial market may adversely impact issuers in a different country, region or financial market. These risks may be magnified if certain events or developments adversely interrupt the global supply chain; in these and other circumstances, such risks might affect companies worldwide. As a result, local, regional or global events such as terrorism, war, other conflicts, natural disasters, disease/virus outbreaks and epidemics or other public health issues, recessions, depressions or other events – or the potential for such events – could have a significant negative impact on global economic and market conditions. In general, commodity investments tend to have greater price volatility than debt securities. In addition, commodity prices may be sensitive to rising interest rates, as the cost of capital rises and borrowing costs increase.
Money Market Fund Investment Risk. An investment in a money market fund is not a bank deposit and is not insured or guaranteed by any bank, the Federal Deposit Insurance Corporation (FDIC) or any other government agency. Certain money market funds float their NAV while others seek to preserve the value of investments at a stable NAV (typically, $1.00 per share). An investment in a money market fund, even an investment in a fund seeking to maintain a stable NAV per share, is not guaranteed and it is possible for the Fund to lose money by investing in these and other types of money market funds. Certain money market funds (including the Fund’s cash sweep vehicle) are subject to mandatory liquidity fees if daily net redemptions exceed 5% of their net assets and may also impose a discretionary liquidity fee of up to 2% on redemptions if that fee is determined to be in the best interests of the money market fund. Such fees, if imposed, will reduce the amount the Fund receives on redemptions. In addition to the fees and expenses that the Fund directly bears, the Fund indirectly bears the fees and expenses of any money market funds in which it invests, including affiliated money market funds. By investing in a money market fund, the Fund will be exposed to the investment risks of the money market fund in direct proportion to such investment. To the extent the Fund invests in instruments such as derivatives, the Fund may hold investments, which may be significant, in money market fund shares to cover its obligations resulting from the Fund's investments in such instruments. Money market funds and the securities they invest in are subject to comprehensive regulations. The enactment of new legislation or regulations, as well as changes in interpretation and enforcement of current laws, may affect the manner of operation, performance and/or yield of money market funds.
Mortgage- and Other Asset-Backed Securities Risk. The value of any mortgage-backed and other asset-backed securities including collateralized debt obligations and collateralized loan obligations, if any, held by the Fund may be affected by, among other things, changes or perceived changes in: interest rates; factors concerning the interests in and structure of the issuer or the originator of the mortgages or other assets; the creditworthiness of the entities that provide any supporting letters of credit, surety bonds or other credit enhancements; or the market's assessment of the quality of underlying assets. Payment of principal and interest on some mortgage-backed securities (but not the market value of the securities themselves) may be guaranteed by the full faith and credit of a particular U.S. Government agency, authority, enterprise or instrumentality, and some, but not all, are also insured or guaranteed by the U.S. Government. Mortgage-backed securities issued by non-governmental issuers (such as commercial banks, savings and loan institutions, private mortgage insurance companies, mortgage bankers and other secondary market issuers) may entail greater risk than obligations guaranteed by the U.S. Government. Mortgage- and other
Prospectus 2026
9
Columbia Variable Portfolio - Commodity Strategy Fund
Summary of the Fund (continued)
asset-backed securities are subject to liquidity risk and prepayment risk. A decline or flattening of housing values may cause delinquencies in mortgages underlying mortgage-backed securities and thereby adversely affect the ability of the mortgage-backed securities issuer to make principal and/or interest payments to mortgage-backed securities holders, including the Fund. Rising or high interest rates tend to extend the duration of mortgage- and other asset-backed securities, making their prices more volatile and more sensitive to changes in interest rates.
Prepayment and Extension Risk. Prepayment and extension risk is the risk that a bond or other security or investment might, in the case of prepayment risk, be called or otherwise converted, prepaid or redeemed before maturity and, in the case of extension risk, that the investment might not be called as expected. In the case of prepayment risk, if the investment is converted, prepaid or redeemed before maturity, the portfolio managers may not be able to invest the proceeds in other investments providing as high a level of income, resulting in a reduced yield to the Fund. As interest rates decrease or spreads narrow on such investments, the likelihood of prepayment increases. Conversely, extension risk is the risk that an unexpected rise in interest rates will extend the life of an investment beyond the prepayment time. If the Fund’s investments are locked in at a lower interest rate for a longer period of time, the portfolio managers may be unable to capitalize on investments with higher interest rates or wider spreads.
Reinvestment Risk. Reinvestment risk arises when the Fund is unable to reinvest income or principal at the same or at least the same return it is currently earning.
Rule 144A and Other Exempted Securities Risk. The Fund may invest in privately placed and other securities or instruments exempt from SEC registration (collectively “private placements”), subject to certain regulatory restrictions. In the U.S. market, private placements are typically sold only to qualified institutional buyers, or qualified purchasers, as applicable. An insufficient number of buyers interested in purchasing private placements at a particular time could adversely affect the marketability of such investments and the Fund might be unable to dispose of them promptly or at reasonable prices, subjecting the Fund to liquidity risk. The Fund’s holdings of private placements may increase the level of Fund illiquidity if eligible buyers are unable or unwilling to purchase them at a particular time. Issuers of Rule 144A eligible securities are required to furnish information to potential investors upon request. However, the required disclosure is much less extensive than that required of public companies and is not publicly available since the offering information is not filed with the SEC. Further, issuers of Rule 144A eligible securities can require recipients of the offering information (such as the Fund) to agree contractually to keep the information confidential, which could also adversely affect the Fund’s ability to dispose of the security.
Sector Risk. At times, the Fund may have a significant portion of its assets exposed to one or more economic sectors, including the agricultural, energy and precious metals sectors. The Fund’s exposures to these sectors may be affected by economic, regulatory, political or market events or conditions, which may make the Fund vulnerable to unfavorable developments in these economic sectors.
■
Agricultural Sector. The Fund is vulnerable to the particular risks that may affect the agricultural sector. The agricultural (e.g., grain) sector may be adversely affected by changes or trends in commodity prices and labor costs, which may be influenced by unpredictable factors. The agricultural sector is subject to government subsidy policies and environmental, health and safety laws and regulations and changes to these policies, laws and regulations may have a material adverse effect on this sector. Adverse weather conditions and various geopolitical events also may adversely affect this sector.
■
Energy Sector. The Fund is vulnerable to the particular risks that may affect the energy sector. The energy sector is subject to certain risks, including legislative or regulatory changes, adverse market conditions and increased competition. Performance of commodities in the energy sector may be affected by factors including, among others, fluctuations in energy prices, energy fuel supply and demand factors, energy conservation, the success of exploration projects, local and international policies, and events occurring in nature. For instance, natural events (such as earthquakes, hurricanes or fires in prime natural resources areas) and political events (such as government instability or military confrontations and actions) can affect the value of commodities in the energy sector. Other risks may include liabilities for environmental damage and general civil liabilities, depletion of
10
Prospectus 2026
Columbia Variable Portfolio - Commodity Strategy Fund
Summary of the Fund (continued)
resources, and mandated expenditures for safety and pollution control. The energy sector may also be affected by economic cycles, rising interest rates, high inflation, technical progress, labor relations, legislative or regulatory changes, local and international policies, and adverse market conditions.
■
Precious Metals Sector. The Fund is vulnerable to the particular risks that may affect the precious metals sector. The precious metals sector is subject to certain risks, including that prices of precious metals are significantly affected by exchange rates, import controls, increased competition, environmental policies, consumer demand, and events occurring in nature. For instance, natural events (such as earthquakes, hurricanes or fires in prime natural resource areas) and political events (such as government instability or military confrontations and actions) can affect the value of precious metals. The value of precious metals may be affected by factors including, among others, economic downturns, leading to poor investment returns or losses. Other risks may include liabilities for environmental damage and general civil liabilities, depletion of resources, and mandated expenditures for safety and pollution control. The precious metals sector may also be affected by economic cycles, rising interest rates, high inflation, technical progress, labor relations, legislative or regulatory changes, local and international policies, and adverse market conditions. In addition, prices of, and thus the Fund’s exposure to, precious metals are considered speculative and are affected by a variety of worldwide and economic, financial and political factors. Prices of precious metals may fluctuate sharply.
Short Positions Risk. The Fund may establish short positions which introduce more risk to the Fund than long positions (where the Fund owns the instrument or other asset) because the maximum sustainable loss on an instrument or other asset purchased (held long) is limited to the amount paid for the instrument or other asset plus the transaction costs, whereas there is no maximum price of the shorted instrument or other asset when purchased in the open market. Therefore, in theory, short positions have unlimited risk. The Fund’s use of short positions in effect “leverages” the Fund. Leverage potentially exposes the Fund to greater risks of loss due to unanticipated market movements, which may magnify losses and increase the volatility of returns. To the extent the Fund takes a short position in a derivative instrument or other asset, this involves the risk of a potentially unlimited increase in the value of the underlying instrument or other asset. Short positions also involve transaction and other costs that will reduce potential Fund gains and increase potential Fund losses.
Tax Risk. To qualify for treatment as a regulated investment company, the Fund must meet certain requirements regarding the source of its income. The Fund's investments can be limited by the Fund's intention to qualify as a regulated investment company and can limit the Fund's ability to so qualify. The tax treatment of certain investments and of the income and gain therefrom under the qualifying income test applicable to regulated investment companies is uncertain, and an adverse determination or future guidance by the Internal Revenue Service (the IRS) may affect the Fund's ability to qualify for treatment as a regulated investment company, including on a retroactive basis. If the Fund were to fail to qualify as a regulated investment company, or if it were ineligible to or otherwise could not cure such failure, the Fund would be ineligible (including retroactively) for the favorable tax treatment afforded to regulated investment companies for one or more years, which would adversely affect the value of your investment in the Fund. The Fund intends to invest a portion of its assets in the Subsidiary. The Fund and the Subsidiary currently take steps to, and will continue to take steps to, ensure that the Fund's income in respect of the Subsidiary will constitute qualifying income. Failure to do so could affect the ability of the Fund to qualify for treatment as a regulated investment company. If a net loss is realized by the Subsidiary, such loss is not generally available to offset the income of the Fund. Also, net losses realized by the Subsidiary cannot be carried forward to offset income of the Subsidiary in future years.
Unrated Securities Risk. The Fund may purchase unrated securities which are not rated by a rating agency. Unrated securities may be less liquid than comparable rated securities and involve the risk that the Investment Manager may not accurately evaluate the security’s comparative credit rating. Analysis of creditworthiness of issuers of high yield securities may be more complex than for issuers of higher-quality debt securities. To the extent that the Fund purchases unrated securities, the Fund’s success in achieving its investment objective may depend more heavily on the Investment Manager’s creditworthiness analysis than if the Fund invested exclusively in rated securities.
Prospectus 2026
11
Columbia Variable Portfolio - Commodity Strategy Fund
Summary of the Fund (continued)
U.S. Government Obligations Risk. While U.S. Treasury obligations are backed by the “full faith and credit” of the U.S. Government, such securities are nonetheless subject to credit risk (i.e., the risk that the U.S. Government may be, or be perceived to be, unable or unwilling to honor its financial obligations, such as making payments). Securities issued or guaranteed by federal agencies or authorities and U.S. Government-sponsored instrumentalities or enterprises may or may not be backed by the full faith and credit of the U.S. Government.
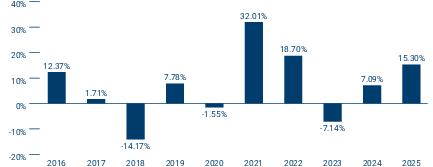
Performance Information
The following bar chart and table show you how the Fund has performed in the past, and can help you understand the risks of investing in the Fund. The bar chart shows how the Fund’s Class 2 share performance has varied for each full calendar year shown. The table below the bar chart compares the Fund’s returns for the periods shown with a broad measure of market performance, as well as another measure of performance for markets in which the Fund may invest.
Except for differences in annual returns resulting from differences in expenses (where applicable), the share classes of the Fund would have substantially similar annual returns because all share classes of the Fund invest in the same portfolio of securities.
The returns shown do not reflect any fees and expenses imposed under your Contract or Qualified Plan and would be lower if they did.
Year by Year Total Return (%) as of December 31 Each Year |
Best and Worst Quarterly Returns During the Period Shown in the Bar Chart | ||
 |
|
|
|
| |
|
- | |
12
Prospectus 2026
Columbia Variable Portfolio - Commodity Strategy Fund
Summary of the Fund (continued)
Average Annual Total Returns (for periods ended December 31, 2025)
| |
Share Class Inception Date |
1 Year |
5 Years |
10 Years |
| Class 1 |
|
|
|
|
| Class 2 |
|
|
|
|
| Bloomberg Commodity Index Total Return (reflects no deductions for fees, expenses or taxes) |
|
|
|
|
| MSCI ACWI Index (Net) (reflects reinvested dividends net of withholding taxes but reflects no deductions for fees, expenses or other taxes) |
|
|
|
|
Fund Management
Investment Manager: Columbia Management Investment Advisers, LLC
| Commodity Strategies Portfolio Management |
Title |
Role with Fund |
Managed Fund Since |
| Marc Khalamayzer, CFA |
Senior Portfolio Manager and Director of Multi-Asset Research |
Commodity Strategies Co-Portfolio Manager |
2019 |
| Matthew Ferrelli, CFA |
Senior Portfolio Manager |
Commodity Strategies Co-Portfolio Manager |
2019 |
| Cash/Liquidity Strategies Portfolio Management |
Title |
Role with Fund |
Managed Fund Since |
| Ronald Stahl, CFA |
Senior Portfolio Manager and Head of Short Duration and Stable Value |
Cash/Liquidity Strategies Co-Portfolio Manager |
2021 |
| Gregory Liechty |
Senior Portfolio Manager |
Cash/Liquidity Strategies Co-Portfolio Manager |
2021 |
| John Dempsey, CFA |
Senior Portfolio Manager |
Cash/Liquidity Strategies Co-Portfolio Manager |
2021 |
Purchase and Sale of Fund Shares
The Fund is available for purchase through Contracts offered by the separate accounts of participating insurance companies or Qualified Plans or by other eligible investors authorized by Columbia Management Investment Distributors, Inc. (the Distributor). Shares of the Fund may not be purchased or sold by individual owners of Contracts or Qualified Plans. If you are a Contract holder or Qualified Plan participant, please refer to your separate Contract prospectus or Qualified Plan disclosure documents for information about minimum investment requirements and how to purchase and redeem shares of the Fund on days the Fund is open for business.
Tax Information
The Fund normally distributes its net investment income and net realized capital gains, if any, to its shareholders, which are generally the participating insurance companies and Qualified Plans investing in the Fund through separate accounts. These distributions may not be taxable to you as the holder of a Contract or a participant in a Qualified Plan. Please consult the prospectus or other information provided to you by your participating insurance company and/or Qualified Plan regarding the U.S. federal income taxation of your contract, policy and/or plan.
Payments to Broker-Dealers and Other Financial Intermediaries
If you make allocations to the Fund, the Fund, its Distributor or other related companies may pay participating insurance companies or other financial intermediaries for the allocation (sale) of Fund shares and related services in connection with such allocations to the Fund. These payments may create a conflict of interest by influencing the participating insurance company, other financial intermediary or your salesperson to recommend an allocation to the Fund over another fund or other investment option. Ask your financial advisor or salesperson or visit your financial intermediary’s website for more information.
Prospectus 2026
13
Columbia Variable Portfolio - Commodity Strategy Fund
More Information About the Fund
Investment Objective
Columbia Variable Portfolio – Commodity Strategy Fund (the Fund) seeks to provide shareholders with total return. The Fund’s investment objective is not a fundamental policy and may be changed by the Fund’s Board of Trustees without shareholder approval as long as shareholders are given 60 days’ advance written notice of the change. Because any investment involves risk, there is no assurance the Fund’s investment objective will be achieved.
Principal Investment Strategies
Under normal circumstances, the Fund seeks to maintain substantial economic exposure to the performance of the commodities markets. The Fund invests, directly or indirectly, in a portfolio of commodity-linked investments, such as commodity-linked futures, structured notes and/or swaps, that are designed to provide long and short exposures to the investment return of assets that trade in the commodities markets, without investing directly in physical commodities. A substantial portion of the Fund’s net assets will also be invested in a portfolio of fixed income securities rated investment-grade or, if unrated, deemed of comparable quality, which will consist primarily of: (i) U.S. Government securities (including U.S. Government agency securities), corporate debt securities, mortgage-backed securities and/or asset-backed securities; and/or (ii) shares of an affiliated money market fund. In addition to investing in these holdings for their income-producing potential, these holdings will be designated by the Fund, as necessary, to serve as collateral with respect to the Fund’s commodity-linked investments.
The Fund primarily expects to gain exposure to the commodities markets by investing up to 25% of its total assets in a wholly-owned subsidiary of the Fund organized as a company under the laws of the Cayman Islands (the Subsidiary). The Subsidiary’s commodity-linked investments are expected to produce leveraged exposure to the performance of the commodities markets. It is expected that the gross notional value of the Fund’s (including the Subsidiary’s) commodity-linked investments will be equivalent to at least 90% of the Fund’s net assets. Like the Fund, the Subsidiary will not invest directly in physical commodities. The Subsidiary also invests in investment-grade fixed income securities and shares of an affiliated money market fund for investment purposes or to serve as collateral for its commodity-linked investments. The Fund’s investment in the Subsidiary permits it to gain exposure to the commodities markets in a potentially tax-efficient manner. The Subsidiary has the same investment objective as the Fund and, like the Fund, is managed by Columbia Management Investment Advisers, LLC (Columbia Management or the Investment Manager).
The Fund (primarily through the Subsidiary) is expected to invest significantly in commodity-linked futures contracts, including long and/or short positions on such futures contracts, in furtherance of its investment objective. Futures contracts are standardized, exchange-traded contracts that provide for the sale or purchase of a specified financial instrument, asset (e.g., commodity) or currency at a future time at a specified price. The value of a futures contract tends to increase and decrease in tandem with the value of the underlying instrument. Depending on the terms of the particular contract, futures contracts are settled through either physical delivery of the underlying instrument on the settlement date or by payment of a cash settlement amount on the settlement date. In particular, commodity futures contracts normally specify a certain date for the delivery of the underlying physical commodity. In order to avoid the delivery process and maintain a long futures position, the Fund and the Subsidiary will typically replace futures contracts as they approach expiration by contracts that have a later expiration. This process is known as “rolling” a futures position. As a result, the Fund and the Subsidiary do not expect to engage in physical settlement of commodities futures.
The Fund and the Subsidiary may also utilize commodity-linked structured notes to gain exposure to commodities markets.
The Fund and the Subsidiary typically have the right to “put” (or sell) a commodity-linked structured note to the issuer at any time, at a price that is calculated based on the price movement of the underlying variable. Commodity-linked structured notes have characteristics of both a debt security and a commodity-linked derivative. Typically, commodity-linked structured notes are issued by a bank or other financial institution or a commodity producer at a specified face value (for example $100 or $1,000). They usually pay interest at a fixed or floating rate until they mature, which is normally in 12 to 18 months. At maturity, the Fund or the Subsidiary, as the case may be, receives a payment that is calculated based on the price increase or decrease of an underlying commodity-related variable and
14
Prospectus 2026
Columbia Variable Portfolio - Commodity Strategy Fund
More Information About the Fund (continued)
may be based on a multiple of the price movement of that variable. The underlying commodity-related variable may be a physical commodity (such as heating oil, livestock, or agricultural products), a commodity futures or option contract, a commodity index (such as the S&P GSCI), or some other readily measurable variable that reflects changes in the value of particular commodities or the commodities markets. A typical commodity-linked structured note also provides that the issuer will automatically repurchase the note from the Fund or the Subsidiary, as the case may be, if the value of the note decreases to a specified level based on the price of the underlying variable.
The Fund and the Subsidiary may also invest in commodity-linked swaps. Commodity-linked swaps are two party contracts in which the parties agree to exchange the return or interest rate on one instrument for the return of a particular commodity, commodity index or commodities futures or options contract. The payment streams are calculated by reference to an agreed upon notional amount.
Derivatives, including those described above, along with interest rate futures and options contracts (including options on futures contracts), may also be utilized to increase, modify, reduce or short commodity market positions or exposures. Actual exposures will vary over time based on factors such as market movements and assessments of market conditions by the Fund’s portfolio managers. The Fund may engage in derivative transactions on both U.S. and foreign exchanges or in the “over-the-counter” (OTC) market. The Fund may at times emphasize one or more sectors in selecting its investments, including the agricultural, energy and precious metals sectors.
The Fund may invest in privately placed and other securities or instruments that are purchased and sold pursuant to Rule 144A or other exemptions under the Securities Act of 1933, as amended, subject to certain regulatory restrictions.
The Fund’s investment strategy may involve the frequent trading of portfolio securities. Additionally, the Fund’s strategy of investing in derivative instruments and instruments with a maturity of one year or less at the time of acquisition, will also contribute to frequent portfolio trading and high portfolio turnover (typically greater than 300% per year).
Investment Process
In constructing the Fund’s exposure to commodities markets, the Investment Manager seeks to exploit temporary market inefficiencies or other events and identify investment opportunities across a broad spectrum of the commodities markets through the use of both macroeconomic assessments of commodity sectors (such as industrial metals sector, precious metals sector, energy sector and agriculture sector) and fundamental analyses of individual commodities (such as aluminum, zinc, silver, platinum, crude oil, natural gas, corn, cocoa, etc.). In analyzing conditions for investment in particular sectors and applying macroeconomic analysis, the Fund’s portfolio managers will rely on economic research, investment themes and sector weighting and asset allocation considerations. The portfolio managers’ views of individual commodities are driven by market information (i.e., relative value) and fundamental inputs (e.g., short-term shifts in supply and demand, weather conditions for particular agricultural commodities), technical inputs (e.g., volatility, market trends), seasonal inputs (e.g., seasonal period performance), and structural and liquidity inputs (e.g., heavy shorting in market against a particular commodity). The portfolio managers will then implement their approach by constructing a portfolio that is generally allocated among a variety of commodity sectors. The portfolio managers will consider which type of commodity-linked investment is best suited to provide the desired exposure to the commodities markets at a given point in time and the extent to which investments should be made directly or indirectly through the Subsidiary.
In constructing the Fund’s fixed-income portfolio, the Investment Manager seeks to identify a portfolio of investment-grade fixed income securities, generally with a dollar-weighted average portfolio duration of 1 year or less. Duration measures the sensitivity of bond prices to changes in interest rates. The longer the duration of a bond, the more sensitive it will be to changes in interest rates. For example, a three-year duration means a bond is expected to decrease in value by 3% if interest rates rise 1% and increase in value by 3% if interest rates fall 1%. In pursuing the Fund’s investment objective, the Investment Manager has considerable flexibility in deciding which investments it buys, holds or sells on a day-to-day basis.
Prospectus 2026
15
Columbia Variable Portfolio - Commodity Strategy Fund
More Information About the Fund (continued)
The Investment Manager actively manages the Fund’s and the Subsidiary’s exposure to commodities markets and will rebalance commodity sector positions and weightings when there are perceived opportunities in other sectors or in other individual commodities.
Principal Risks
An investment in the Fund involves risks, including Commodity-related Investment Risk, Derivatives Risk, Market Risk, Mortgage- and Other Asset-Backed Securities Risk, and Sector Risk, among others. Descriptions of these and other principal risks of investing in the Fund as well as those associated with the Fund’s investment in the Subsidiary are provided below. There is no assurance that the Fund will achieve its investment objective and you may lose money. The value of the Fund’s holdings may decline, and the Fund’s net asset value (NAV) and share price may go down. An investment in the Fund is not a bank deposit and is not insured or guaranteed by the Federal Deposit Insurance Corporation or any other government agency. (References in this section to “the Fund” also include the Subsidiary, which shares the same risks as the Fund.) The significance of any specific risk to an investment in the Fund will vary over time depending on the composition of the Fund's portfolio, market conditions, and other factors. You should read all of the risk information below carefully, because any one or more of these risks may result in losses to the Fund.
Active Management Risk. The Fund is actively managed and its performance therefore will reflect, in part, the ability of the portfolio managers to make investment decisions that seek to achieve the Fund’s investment objective. Due to its active management, the Fund could underperform its benchmark index and/or other funds with similar investment objectives and/or strategies.
Commodity Futures Trading Commission (CFTC) Regulatory Risk. The Fund does not qualify for an exemption from registration as a “commodity pool” under rules of the Commodity Exchange Act (the CEA). Accordingly, the Fund is a commodity pool under the CEA and the Investment Manager is registered as a “commodity pool operator” under the CEA. The Fund is subject to dual regulation by the SEC and the CFTC. Compliance with the CFTC’s regulatory requirements could increase Fund expenses, adversely affecting the Fund’s total return.
Commodity-related Investment Risk. The value of commodities investments will generally be affected by overall market movements and factors specific to a particular industry or commodity, which may include demand for the commodity, weather, embargoes, tariffs, and economic health, political, international, regulatory and other developments. Economic and other events (whether real or perceived) can reduce the demand for commodities, which may, in turn, reduce market prices and cause the value of Fund shares to fall. The frequency and magnitude of such changes cannot be predicted. Exposure to commodities and commodities markets may subject the value of the Fund's investments (and therefore the Fund) to greater volatility than other types of investments. No, or limited, active trading market may exist for certain commodities investments, which may impair the ability to sell or to realize the full value of such investments in the event of the need to liquidate such investments. In addition, adverse market conditions may impair the liquidity of actively traded commodities investments thereby subjecting the Fund to increased liquidity risk (the risk that it may not be possible for the Fund to liquidate the instrument at an advantageous time or price). Certain types of commodities instruments are subject to the risk that the counterparty to the transaction may not perform or be unable to perform in accordance with the terms of the instrument. The Fund may make commodity-related investments through one or more wholly-owned subsidiaries organized outside the U.S. that are generally not subject to U.S. laws (including securities laws) and their protections. However, any such subsidiary is wholly owned and controlled by the Fund, making it unlikely that the subsidiary will take action contrary to the interests of the Fund and its shareholders. Further, any such subsidiaries will be subject to the laws of a foreign jurisdiction, and can be adversely affected by developments in that jurisdiction.
Commodity-related Tax Risk. The Fund intends to qualify for treatment as a regulated investment company under the Internal Revenue Code of 1986, as amended. The Fund’s investments in commodities or commodity-related investments can be limited by the Fund’s intention to qualify as a regulated investment company and can limit the Fund’s ability to so qualify.
16
Prospectus 2026
Columbia Variable Portfolio - Commodity Strategy Fund
More Information About the Fund (continued)
Counterparty Risk. The risk exists that a counterparty to a transaction in a financial instrument held by the Fund or by a special purpose or structured vehicle in which the Fund invests may become insolvent or otherwise fail to perform its obligations, including making payments to the Fund, due to financial difficulties. The Fund may obtain no or limited recovery in a bankruptcy or other reorganizational proceedings, and any recovery may be significantly delayed. Transactions that the Fund enters into may involve counterparties in the financials sector and, as a result, events affecting the financials sector may cause the Fund’s NAV to fluctuate.
Credit Risk. Credit risk is the risk that the value of debt instruments may decline if the issuer thereof defaults or otherwise becomes unable or unwilling, or is perceived to be unable or unwilling, to honor its financial obligations, such as making payments to the Fund when due. Various factors could affect the actual or perceived willingness or ability of the issuer to make timely interest or principal payments, including changes in the financial condition of the issuer or in general economic conditions. Credit rating agencies, such as S&P Global Ratings, Moody’s Ratings, Fitch, DBRS and KBRA, assign credit ratings to certain debt instruments to indicate their credit risk. A rating downgrade by such agencies can negatively impact the value of such instruments. Lower-rated or unrated instruments held by the Fund may present increased credit risk as compared to higher-rated instruments. Non-investment grade debt instruments may be subject to greater price fluctuations and are more likely to experience a default than investment grade debt instruments and therefore may expose the Fund to increased credit risk. If the Fund purchases unrated instruments, or if the ratings of instruments held by the Fund are lowered after purchase, the Fund will depend on analysis of credit risk more heavily than usual.
Derivatives Risk. Derivatives may involve significant risks. Derivatives are financial instruments, traded on an exchange or in the over-the-counter (OTC) markets, with a value in relation to, or derived from, the value of an underlying asset(s) (such as a security, commodity or currency) or other reference, such as an index, rate or other economic indicator (each an underlying reference). Derivatives may include those that are privately placed or otherwise exempt from SEC registration, including certain Rule 144A eligible securities. Derivatives could result in Fund losses if the underlying reference does not perform as anticipated. Use of derivatives is a highly specialized activity that can involve investment techniques, risks, and tax planning different from those associated with more traditional investment instruments. The Fund’s derivatives strategy may not be successful, and use of certain derivatives could result in substantial, potentially unlimited, losses to the Fund regardless of the Fund’s actual investment. A relatively small movement in the price, rate or other economic indicator associated with the underlying reference may result in substantial losses for the Fund. Derivatives may be more volatile than other types of investments. Derivatives can increase the Fund’s risk exposure to underlying references and their attendant risks, including the risk of an adverse credit event associated with the underlying reference (credit risk), the risk of an adverse movement in the value, price or rate of the underlying reference (market risk), the risk of an adverse movement in the value of underlying currencies (foreign currency risk) and the risk of an adverse movement in underlying interest rates (interest rate risk). Derivatives may expose the Fund to additional risks, including the risk of loss due to a derivative position that is imperfectly correlated with the underlying reference it is intended to hedge or replicate (correlation risk), the risk that a counterparty will fail to perform as agreed (counterparty risk), the risk that a hedging strategy may fail to mitigate losses, and may offset gains (hedging risk), the risk that the return on an investment may not keep pace with inflation (inflation risk), the risk that losses may be greater than the amount invested (leverage risk), the risk that the Fund may be unable to sell an investment at an advantageous time or price (liquidity risk), the risk that the investment may be difficult to value (pricing risk), and the risk that the price or value of the investment fluctuates significantly over short periods of time (volatility risk). The value of derivatives may be influenced by a variety of factors, including national and international political and economic developments. Potential changes to the regulation of the derivatives markets may make derivatives more costly, may limit the market for derivatives, or may otherwise adversely affect the value or performance of derivatives.
Derivatives Risk – Futures Contracts Risk. A futures contract is an exchange-traded derivative transaction between two parties in which a buyer (holding the “long” position) agrees to pay a fixed price (or rate) at a specified future date for delivery of an underlying reference from a seller (holding the “short” position). The seller hopes that the market price on the delivery date is less than the agreed upon price, while the buyer hopes for the contrary. Certain futures contract markets are highly volatile, and futures contracts may be illiquid. Futures exchanges may limit fluctuations in futures contract prices by imposing a maximum permissible daily price movement. The Fund may be
Prospectus 2026
17
Columbia Variable Portfolio - Commodity Strategy Fund
More Information About the Fund (continued)
disadvantaged if it is prohibited from executing a trade outside the daily permissible price movement. At or prior to maturity of a futures contract, the Fund may enter into an offsetting contract and may incur a loss to the extent there has been adverse movement in futures contract prices. The liquidity of the futures markets depends on participants entering into offsetting transactions rather than making or taking delivery. To the extent participants make or take delivery, liquidity in the futures market could be reduced. Positions in futures contracts may be closed out only on the exchange on which they were entered into or through a linked exchange, and no secondary market exists for such contracts. Futures positions are marked to market each day, and variation margin payment must be paid to or by the Fund. Because of the low margin deposits normally required in futures trading, it is possible that the Fund may employ a high degree of leverage in the portfolio. As a result, a relatively small price movement in a futures contract may result in substantial losses to the Fund, exceeding the amount of the margin paid. For certain types of futures contracts, losses are potentially unlimited. Futures markets are highly volatile, and the use of futures may increase the volatility of the Fund’s NAV. Futures contracts executed (if any) on foreign exchanges may not provide the same protection as U.S. exchanges. Futures contracts can increase the Fund’s risk exposure to underlying references and their attendant risks, such as credit risk, market risk, foreign currency risk and interest rate risk, while potentially exposing the Fund to correlation risk, counterparty risk, hedging risk, inflation risk, leverage risk, liquidity risk, pricing risk and volatility risk.
■
A commodity-linked future is a derivative that is an agreement to buy or sell one or more commodities (such as crude oil, gasoline and natural gas), basket of commodities or indices of commodity futures at a specific date in the future at a specific price.
■
An interest rate future is a derivative that is an agreement whereby the buyer and seller agree to the future delivery of an interest-bearing instrument on a specific date at a pre-determined price. Examples include Treasury-bill futures, Treasury-bond futures and Eurodollar futures.
Derivatives Risk – Options Risk. Options are derivatives that give the purchaser the option to buy (call) or sell (put) an underlying reference from or to a counterparty at a specified price (the strike price) on or before an expiration date. The Fund may purchase or write (i.e., sell) put and call options on an underlying reference it is otherwise permitted to invest in. When writing options, the Fund is exposed to the risk that it may be required to buy or sell the underlying reference at a disadvantageous price on or before the expiration date. If the Fund sells a put option, the Fund may be required to buy the underlying reference at a strike price that is above market price, resulting in a loss. If the Fund sells a call option, the Fund may be required to sell the underlying reference at a strike price that is below market price, resulting in a loss. If the Fund sells a call option that is not covered (it does not own the underlying reference), the Fund's losses are potentially unlimited. Options may involve economic leverage, which could result in greater volatility in price movement. Options may be traded on a securities exchange or in the over-the-counter market. At or prior to maturity of an options contract, the Fund may enter into an offsetting contract and may incur a loss to the extent there has been adverse movement in options prices. Options can increase the Fund’s risk exposure to underlying references and their attendant risks, such as credit risk, market risk, foreign currency risk and interest rate risk, while potentially exposing the Fund to correlation risk, counterparty risk, hedging risk, inflation risk, leverage risk, liquidity risk, pricing risk and volatility risk.
Derivatives Risk – Structured Investments Risk. Structured investments are over-the-counter derivatives that provide principal and/or interest payments based on the value of an underlying reference(s). Structured investments typically provide interest income, thereby offering a potential yield advantage over investing directly in an underlying reference. Structured investments may lack a liquid secondary market, and their prices or value can be volatile, which could result in significant losses for the Fund. In some cases, depending on its terms, a structured investment may provide that principal and/or interest payments may be adjusted below zero resulting in a potential loss of principal and/or interest payments. Additionally, the particular terms of a structured investment may create economic leverage by requiring payment by the issuer of an amount that is a multiple of the price change of the underlying reference. Economic leverage will increase the volatility of structured investment prices and could result in increased losses for the Fund. The Fund’s use of structured instruments may not work as intended. If structured investments are used to reduce the duration of the Fund’s portfolio, this may limit the Fund’s return when having a longer duration would be beneficial (for instance, when interest rates decline). Structured investments can increase the Fund’s risk
18
Prospectus 2026
Columbia Variable Portfolio - Commodity Strategy Fund
More Information About the Fund (continued)
exposure to underlying references and their attendant risks, such as credit risk, market risk, foreign currency risk and interest rate risk, while potentially exposing the Fund to correlation risk, counterparty risk, hedging risk, inflation risk, leverage risk, liquidity risk, pricing risk and volatility risk.
■
A commodity-linked structured note is a derivative (structured investment) that has principal and/or interest payments based on the market price of one or more particular commodities (such as crude oil, gasoline and natural gas), a basket of commodities, indices of commodity futures or other economic variable. If payment of interest on a commodity-linked structured note is linked to the value of a particular commodity, basket of commodities, commodity index or other economic variable, the Fund might receive lower interest payments (or not receive any of the interest due) on its investments if there is a loss of value in the underlying reference. Further, to the extent that the amount of principal to be repaid upon maturity is linked to the value of a particular commodity, basket of commodities, commodity index or other economic variable, the Fund might not receive a portion (or any) of the principal at maturity of the investment or upon earlier exchange. At any time, the risk of loss associated with a particular structured note in the Fund’s portfolio may be significantly higher than the value of the note. A liquid secondary market may not exist for the commodity-linked structured notes held in the Fund’s portfolio, which may make it difficult for the notes to be sold at a price acceptable to the portfolio managers or for the Fund to accurately value them.
Derivatives Risk – Swaps Risk. In a typical swap transaction, two parties agree to exchange the return earned on a specified underlying reference for a fixed return or the return from another underlying reference during a specified period of time. Swaps may be difficult to value and may be illiquid. Swaps could result in Fund losses if the underlying asset or reference does not perform as anticipated. Swaps create significant investment leverage such that a relatively small price movement in a swap may result in immediate and substantial losses to the Fund. The Fund may only close out a swap with its particular counterparty and may only transfer a position with the consent of that counterparty. Certain swaps, such as short swap transactions and total return swaps, have the potential for unlimited losses, regardless of the size of the initial position. Swaps can increase the Fund’s risk exposure to underlying references and their attendant risks, such as credit risk, market risk, foreign currency risk and interest rate risk, while potentially exposing the Fund to correlation risk, counterparty risk, hedging risk, inflation risk, leverage risk, liquidity risk, pricing risk and volatility risk.
■
A commodity-linked swap is a derivative (swap) that is an agreement where the underlying reference is the market price of one or more particular commodities (such as crude oil, gasoline and natural gas), basket of commodities or indices of commodity futures.
Fixed Income Instruments Risk. The Fund is subject to the general risks and considerations associated with investing in debt securities, including the risk that issuers will fail to make timely payments of principal or interest or default altogether. Typically, shorter-term bonds are less volatile than longer-term bonds; however, longer-term bonds typically offer higher yields and more stable interest income than shorter-term bonds due to their longer term and extended fixed payment schedule. Lower-rated securities in which the Fund may invest may be more volatile and may decline more in price in response to negative issuer developments or general economic news than higher rated securities. In addition, as interest rates rise, the Fund’s investments typically will lose value.
Frequent Trading Risk. The portfolio managers may actively and frequently trade investments in the Fund's portfolio to carry out its investment strategies. Frequent trading can also mean higher brokerage and other transaction costs, which could reduce the Fund's return. The trading costs associated with portfolio turnover may adversely affect the Fund’s performance.
Interest Rate Risk. Interest rate risk is the risk of losses attributable to changes in interest rates. In general, if interest rates rise, the values of debt instruments tend to fall, and if interest rates fall, the values of debt instruments tend to rise. Changes in the value of a debt instrument usually will not affect the amount of income the Fund receives from it but will generally affect the value of your investment in the Fund. Changes in interest rates may also affect the liquidity of the Fund’s investments in debt instruments. In general, the longer the maturity or duration of a debt instrument, the greater its sensitivity to changes in interest rates. For example, a three-year duration means a bond is expected to decrease in value by 3% if interest rates rise 1% and increase in value by 3% if interest rates fall 1%. Interest rate declines also may increase prepayments of debt obligations, which, in turn, would increase prepayment
Prospectus 2026
19
Columbia Variable Portfolio - Commodity Strategy Fund
More Information About the Fund (continued)
risk (the risk that the Fund will have to reinvest the money received in securities that have lower yields). The Fund is subject to the risk that the income generated by its investments may not keep pace with inflation. Actions by governments and central banking authorities can result in increases or decreases in interest rates. Higher periods of inflation could lead such authorities to raise interest rates. Such actions may negatively affect the value of debt instruments held by the Fund, resulting in a negative impact on the Fund's performance and NAV. Any interest rate increases could cause the value of the Fund’s investments in debt instruments to decrease. Rising interest rates may prompt redemptions from the Fund, which may force the Fund to sell investments at a time when it is not advantageous to do so, which could result in losses.
Investing in Wholly-Owned Subsidiary Risk. By investing in a Subsidiary, the Fund is indirectly exposed to the risks associated with the Subsidiary’s investments. The Fund’s Principal Risks may also apply to a Subsidiary in which the Fund invests (which are described in this prospectus). There can be no assurance that the investment objective of a Subsidiary will be achieved. No Subsidiary is registered under the 1940 Act and, except as otherwise noted in this prospectus, no Subsidiary is subject to the investor protections of the 1940 Act. However, the Fund wholly owns and controls any Subsidiary in which it invests, and the Fund and any Subsidiary in which it invests are managed by Columbia Management, making it unlikely that a Subsidiary will take action contrary to the interests of the Fund and its shareholders. The Fund’s Board has oversight responsibility for the investment activities of the Fund, including its investment in any Subsidiary, and the Fund’s role as sole shareholder of the Subsidiary. In managing a Subsidiary’s investment portfolio, Columbia Management, or the Subsidiary’s subadviser (if any), will manage the Subsidiary’s portfolio in accordance with the Fund’s investment policies and restrictions. Changes in the laws of the United States and/or the Cayman Islands, under which the Fund and any Subsidiary in which it invests, respectively, are organized, could result in the inability of the Fund and/or the Subsidiary to operate as described in this prospectus and the Statement of Additional Information and could adversely affect the Fund and its shareholders. For example, the Cayman Islands currently does not impose any income, corporate or capital gains tax, estate duty, inheritance tax, gift tax or withholding tax on any Subsidiary. If Cayman Islands law is changed and a Subsidiary is required to pay Cayman Island taxes, the investment returns of the Fund would likely decrease.
Issuer Risk. An issuer in which the Fund invests or to which it has exposure may perform poorly or below expectations, and the value of its securities may therefore decline, which may negatively affect the Fund’s performance. Underperformance of an issuer may be caused by poor management decisions, competitive pressures, breakthroughs in technology, reliance on suppliers, labor problems or shortages, corporate restructurings, fraudulent disclosures, natural disasters, military confrontations and actions, war, other conflicts, terrorism, disease/virus outbreaks, epidemics or other events, conditions and factors which may impair the value of your investment in the Fund.
Large Purchases and Redemptions of Fund Shares Risk. The timing and magnitude of Fund share purchases and redemptions, including by large Fund shareholders transacting in large amounts of Fund shares, could prevent the Fund from being fully invested, or require the Fund to sell portfolio securities at unfavorable prices or hold ready reserves of uninvested cash in amounts larger than might otherwise be the case to meet shareholder redemptions. Thus, large Fund share purchases and redemptions could adversely impact the Fund’s performance. Such Fund share activity may also increase the Fund’s transaction costs, which would also detract from Fund performance, while also having potentially negative tax consequences for investors. The Fund, because of a large redemption, may be forced to sell its liquid or more liquid positions, resulting in the Fund holding a higher percentage of less liquid or illiquid securities (i.e., investments that a Fund reasonably expects cannot be sold or disposed of in current market conditions in seven calendar days or less without the sale or disposition significantly changing the market value of the instrument). Because the expenses and costs of the Fund are shared by its investors, large redemptions in the Fund could result in decreased economies of scale and increased operating expenses for non-redeeming Fund shareholders. In addition, in the event of a Fund proxy proposal, one or more large investor(s) could dictate with its/their vote the results of the proposal, which may have a less favorable impact on minority-stake shareholders.
Leverage Risk. Leverage occurs when the Fund increases its assets available for investment using borrowings, derivatives, or similar instruments or techniques. Use of leverage can produce volatility and may exaggerate changes in the Fund’s NAV and in the return on the Fund’s portfolio, which may increase the risk that the Fund will lose more than it has invested. The use of leverage may cause the Fund to liquidate portfolio positions when it may not be
20
Prospectus 2026
Columbia Variable Portfolio - Commodity Strategy Fund
More Information About the Fund (continued)
advantageous to do so to satisfy its obligations or to meet any applicable regulatory limits. Futures contracts, options on futures contracts, forward contracts and other derivatives can allow the Fund to obtain large investment exposures in return for meeting relatively small margin requirements. As a result, investments in those transactions may be highly leveraged. If the Fund uses leverage, through the purchase of particular instruments such as derivatives, the Fund may experience capital losses that exceed the net assets of the Fund. Leverage can create an interest expense that may lower the Fund's overall returns. Leverage presents the opportunity for increased net income and capital gains, but may also exaggerate the Fund's volatility and risk of loss. There can be no guarantee that a leveraging strategy will be successful.
Liquidity Risk. Liquidity risk is the risk associated with any event, circumstance, or characteristic of an investment or market that negatively impacts the Fund’s ability to sell, or realize the proceeds from the sale of, an investment at a desirable time or price. Liquidity risk may arise because of, for example, a lack of marketability of the investment, which means that when seeking to sell its portfolio investments, the Fund could find that selling is more difficult than anticipated, especially during times of high market volatility. Decreases in the number of financial institutions, including banks and broker-dealers, willing to make markets (match up sellers and buyers) in the Fund’s investments or decreases in their capacity or willingness to trade such investments may increase the Fund’s exposure to this risk. The debt market has experienced considerable growth, and financial institutions making markets in instruments purchased and sold by the Fund (e.g., bond dealers) have been subject to increased regulation. The impact of that growth and regulation on the ability and willingness of financial institutions to engage in trading or “making a market” in such instruments remains unsettled. Certain types of investments, such as lower-rated securities or those that are purchased and sold in over-the-counter markets, may be especially subject to liquidity risk. Securities or other assets in which the Fund invests may be traded in the over-the-counter market rather than on an exchange and therefore may be more difficult to purchase or sell at a fair price, which may have a negative impact on the Fund’s performance. Market participants attempting to sell the same or a similar instrument at the same time as the Fund could exacerbate the Fund’s exposure to liquidity risk. The Fund may have to accept a lower selling price for the holding, sell other liquid or more liquid investments that it might otherwise prefer to hold (thereby increasing the proportion of the Fund’s investments in less liquid or illiquid securities), or forego another more appealing investment opportunity. The liquidity of Fund investments may change significantly over time and certain investments that were liquid when purchased by the Fund may later become illiquid, particularly in times of overall economic distress. Changing regulatory, market or other conditions or environments (for example, the interest rate or credit environments) may also adversely affect the liquidity and the price of the Fund's investments. Judgment plays a larger role in valuing illiquid or less liquid investments as compared to valuing liquid or more liquid investments. Price volatility may be higher for illiquid or less liquid investments as a result of, for example, the relatively less frequent pricing of such securities (as compared to liquid or more liquid investments). Generally, the less liquid the market at the time the Fund sells a portfolio investment, the greater the risk of loss or decline of value to the Fund. Overall market liquidity and other factors can lead to an increase in redemptions, which may negatively impact Fund performance and NAV, including, for example, if the Fund is forced to sell investments in a down market.
Market Risk. The Fund may incur losses due to declines in the value of one or more securities in which it invests. These declines may be due to factors affecting a particular issuer, or the result of, among other things, political, regulatory, market, economic or social developments affecting the relevant market(s) more generally. In addition, turbulence in financial markets and reduced liquidity in equity, credit and/or fixed income markets may negatively affect many issuers, which could adversely affect the Fund’s ability to price or value hard-to-value assets in thinly traded and closed markets and could cause significant redemptions and operational challenges. Global economies and financial markets are increasingly interconnected, and conditions and events in one country, region or financial market may adversely impact issuers in a different country, region or financial market. These risks may be magnified if certain events or developments adversely interrupt the global supply chain; in these and other circumstances, such risks might affect companies worldwide. As a result, local, regional or global events such as terrorism, war, other conflicts, natural disasters, disease/virus outbreaks and epidemics or other public health issues, recessions, depressions or other events – or the potential for such events – could have a significant negative impact on global economic and market conditions. In general, commodity investments tend to have greater price volatility than debt securities. In addition, commodity prices may be sensitive to rising interest rates, as the cost of capital rises and borrowing costs increase.
Prospectus 2026
21
Columbia Variable Portfolio - Commodity Strategy Fund
More Information About the Fund (continued)
The large-scale invasion of Ukraine by Russia in February 2022 has resulted in sanctions and market disruptions, including declines in regional and global stock markets, unusual volatility in global commodity markets and significant devaluations of Russian currency. In addition, the Iranian conflict that commenced in February 2026 may result in similar, and potentially more severe, disruptions. Escalation of hostilities in the Middle East region could disrupt energy production or transportation, including through key shipping routes, which may lead to increased volatility in energy and other commodity prices. The extent and duration of these conflicts are impossible to predict but could continue to be significant. Market disruption caused by these conflicts, and any countermeasures or responses thereto (including international sanctions, a downgrade in a country’s credit rating, purchasing and financing restrictions, boycotts, tariffs, changes in consumer or purchaser preferences, cyberattacks and espionage) could continue to have severe adverse impacts on regional and/or global securities and commodities markets, including markets for oil and natural gas. These impacts may include reduced market liquidity, distress in credit markets, further disruption of global supply chains, increased risk of inflation, and limited access to investments in certain international markets and/or issuers. These developments and other related events could negatively impact Fund performance.
Money Market Fund Investment Risk. An investment in a money market fund is not a bank deposit and is not insured or guaranteed by any bank, the FDIC or any other government agency. Certain money market funds float their NAV while others seek to preserve the value of investments at a stable NAV (typically $1.00 per share). An investment in a money market fund, even an investment in a fund seeking to maintain a stable NAV per share, is not guaranteed and it is possible for the Fund to lose money by investing in these and other types of money market funds. Certain money market funds (including the Fund’s cash sweep vehicle) must impose a mandatory liquidity fee on redemptions if daily net redemptions exceed 5% of their net assets and certain money market funds (including the Fund’s cash sweep vehicle) may impose a discretionary liquidity fee of up to 2% on redemptions if that fee is determined to be in the best interests of the money market fund. The amount of any mandatory liquidity fee will represent a good faith estimate of the costs of liquidating a pro rata portion of each of the money market fund’s portfolio holdings to meet the redemptions, or 1% of the value of the shares redeemed if such an amount cannot be estimated. Such fees, if imposed, will reduce the amount the Fund receives on redemptions. In addition to the fees and expenses that the Fund directly bears, the Fund indirectly bears the fees and expenses of any money market funds in which it invests, including affiliated money market funds. To the extent these fees and expenses, along with the fees and expenses of any other funds in which the Fund may invest, are expected to equal or exceed 0.01% of the Fund’s average daily net assets, they will be reflected in the Annual Fund Operating Expenses set forth in the table under Fees and Expenses of the Fund. By investing in a money market fund, the Fund will be exposed to the investment risks of the money market fund in direct proportion to such investment. The money market fund may not achieve its investment objective. The Fund, through its investment in the money market fund, may not achieve its investment objective. To the extent the Fund invests in instruments such as derivatives, the Fund may hold investments, which may be significant, in money market fund shares to cover its obligations resulting from the Fund's investments in such instruments. Money market funds and the securities they invest in are subject to comprehensive regulations. The enactment of new legislation or regulations, as well as changes in interpretation and enforcement of current laws, may affect the manner of operation, performance and/or yield of money market funds.
Mortgage- and Other Asset-Backed Securities Risk. The value of any mortgage-backed and other asset-backed securities including collateralized debt obligations and collateralized loan obligations, if any, held by the Fund may be affected by, among other things, changes or perceived changes in: interest rates; factors concerning the interests in and structure of the issuer or the originator of the mortgages or other assets; the creditworthiness of the entities that provide any supporting letters of credit, surety bonds or other credit enhancements; or the market's assessment of the quality of underlying assets. Mortgage-backed securities represent interests in, or are backed by, pools of mortgages from which payments of interest and principal (net of fees paid to the issuer or guarantor of the securities) are distributed to the holders of the mortgage-backed securities. Other types of asset-backed securities typically represent interests in, or are backed by, pools of receivables such as credit, automobile, student and home equity loans. Mortgage- and other asset-backed securities can have a fixed or an adjustable rate. Mortgage- and other asset-backed securities are subject to liquidity risk (the risk that it may not be possible for the Fund to liquidate the instrument at an advantageous time or price) and prepayment risk (the risk that the underlying mortgage or other asset may be refinanced or prepaid prior to maturity during periods of declining or low interest rates, causing the
22
Prospectus 2026
Columbia Variable Portfolio - Commodity Strategy Fund
More Information About the Fund (continued)
Fund to have to reinvest the money received in securities that have lower yields). In addition, the impact of prepayments on the value of mortgage- and other asset-backed securities may be difficult to predict and may result in greater volatility. A decline or flattening of housing values may cause delinquencies in mortgages underlying mortgage-backed securities and thereby adversely affect the ability of the mortgage-backed securities issuer to make principal and/or interest payments to mortgage-backed securities holders, including the Fund. Rising or high interest rates tend to extend the duration of mortgage- and other asset-backed securities, making them more volatile and more sensitive to changes in interest rates. Payment of principal and interest on some mortgage-backed securities (but not the market value of the securities themselves) may be guaranteed (i) by the full faith and credit of the U.S. Government (in the case of securities guaranteed by the Government National Mortgage Association) or (ii) by its agencies, authorities, enterprises or instrumentalities (in the case of securities guaranteed by the Federal National Mortgage Association (FNMA) or the Federal Home Loan Mortgage Corporation (FHLMC)), which are not insured or guaranteed by the U.S. Government (although FNMA and FHLMC may be able to access capital from the U.S. Treasury to meet their obligations under such securities). Mortgage-backed securities issued by non-governmental issuers (such as commercial banks, savings and loan institutions, private mortgage insurance companies, mortgage bankers and other secondary market issuers) may be supported by various credit enhancements, such as pool insurance, guarantees issued by governmental entities, letters of credit from a bank or senior/subordinated structures, and may entail greater risk than obligations guaranteed by the U.S. Government, whether or not such obligations are guaranteed by the private issuer.
Prepayment and Extension Risk. Prepayment and extension risk is the risk that a bond or other security or investment might, in the case of prepayment risk, be called or otherwise converted, prepaid or redeemed before maturity and, in the case of extension risk, that the investment might not be called as expected. In the case of prepayment risk, if the investment is converted, prepaid or redeemed before maturity, the portfolio managers may not be able to invest the proceeds in other investments providing as high a level of income, resulting in a reduced yield to the Fund. As interest rates decrease or spreads narrow on such investments, the likelihood of prepayment increases. Conversely, extension risk is the risk that an unexpected rise in interest rates will extend the life of an investment beyond the prepayment time. If the Fund's investments are locked in at a lower interest rate for a longer period of time, the portfolio managers may be unable to capitalize on investments with higher interest rates or wider spreads.
Reinvestment Risk. Reinvestment risk arises when the Fund is unable to reinvest income or principal at the same or at least the same return it is currently earning.
Rule 144A and Other Exempted Securities Risk. The Fund may invest in privately placed and other securities or instruments exempt from SEC registration (collectively “private placements”), subject to certain regulatory restrictions. In the U.S. market, private placements are typically sold only to qualified institutional buyers, or qualified purchasers, as applicable. An insufficient number of buyers interested in purchasing private placements at a particular time could adversely affect the marketability of such investments and the Fund might be unable to dispose of them promptly or at reasonable prices, subjecting the Fund to liquidity risk (the risk that it may not be possible for the Fund to liquidate the instrument at an advantageous time or price). The Fund’s holdings of private placements may increase the level of Fund illiquidity if eligible buyers are unable or unwilling to purchase them at a particular time. The Fund may also have to bear the expense of registering the securities for resale and the risk of substantial delays in effecting the registration. Additionally, the purchase price and subsequent valuation of private placements typically reflect a discount, which may be significant, from the market price of comparable securities for which a more liquid market exists. Issuers of Rule 144A eligible securities are required to furnish information to potential investors upon request. However, the required disclosure is much less extensive than that required of public companies and is not publicly available since the offering information is not filed with the SEC. Further, issuers of Rule 144A eligible securities can require recipients of the offering information (such as the Fund) to agree contractually to keep the information confidential, which could also adversely affect the Fund’s ability to dispose of the security.
Prospectus 2026
23
Columbia Variable Portfolio - Commodity Strategy Fund
More Information About the Fund (continued)
Sector Risk. At times, the Fund may have a significant portion of its assets exposed to one or more economic sectors, including the agricultural, energy and precious metals sectors. The Fund’s exposures to these sectors may be affected by economic, regulatory, political or market events or conditions, which may make the Fund vulnerable to unfavorable developments in these economic sectors.
■
Agricultural Sector. The Fund is vulnerable to the particular risks that may affect the agricultural sector. The agricultural (e.g., grain) sector may be adversely affected by changes or trends in commodity prices and labor costs, which may be influenced by unpredictable factors. Increased competition and changes in consumer tastes and spending can also influence the demand for agricultural and livestock products, affecting the price of such commodities. The agricultural sector is subject to government subsidy policies and environmental, health and safety laws and regulations. Any changes to these policies, laws and regulations, or the imposition of tariffs or other trade restraints, may have a material adverse effect on this sector. Adverse weather conditions (such as floods or droughts), natural disasters and other factors, such as disease outbreaks, war or other conflict, also may adversely affect this sector.
■
Energy Sector. The Fund is vulnerable to the particular risks that may affect the energy sector. The energy sector is subject to certain risks, including legislative or regulatory changes, adverse market conditions and increased competition. Performance of commodities in the energy sector may be affected by factors including, among others, fluctuations in energy prices, energy fuel supply and demand factors, energy conservation, the success of exploration projects, local and international policies, and events occurring in nature. For instance, natural events (such as earthquakes, hurricanes or fires in prime natural resources areas) and political events (such as government instability or military confrontations and actions) can affect the value of commodities in the energy sector. Other risks may include liabilities for environmental damage and general civil liabilities, depletion of resources, and mandated expenditures for safety and pollution control. The energy sector may also be affected by economic cycles, rising interest rates, high inflation, technical progress, labor relations, legislative or regulatory changes, local and international policies, and adverse market conditions.
■
Precious Metals Sector. The Fund is vulnerable to the particular risks that may affect the precious metals sector. The precious metals sector is subject to certain risks, including that prices of precious metals are significantly affected by exchange rates, import controls, increased competition, environmental policies, consumer demand, and events occurring in nature. For instance, natural events (such as earthquakes, hurricanes or fires in prime natural resource areas) and political events (such as government instability or military confrontations and actions) can affect the value of precious metals. The value of precious metals may be affected by factors including, among others, economic downturns, leading to poor investment returns or losses. Other risks may include liabilities for environmental damage and general civil liabilities, depletion of resources, and mandated expenditures for safety and pollution control. The precious metals sector may also be affected by economic cycles, rising interest rates, high inflation, technical progress, labor relations, legislative or regulatory changes, local and international policies, and adverse market conditions. In addition, prices of, and thus the Fund’s exposure to, precious metals are considered speculative and are affected by a variety of worldwide and economic, financial and political factors. Prices of precious metals may fluctuate sharply.
Short Positions Risk. The Fund may establish short positions which introduce more risk to the Fund than long positions (where the Fund owns the instrument or other asset) because the maximum sustainable loss on an instrument or other asset purchased (held long) is limited to the amount paid for the instrument or other asset plus the transaction costs, whereas there is no maximum price of the shorted instrument or other asset when purchased in the open market. Therefore, in theory, short positions have unlimited risk. The Fund’s use of short positions in effect “leverages” the Fund. Leverage potentially exposes the Fund to greater risks of loss due to unanticipated market movements, which may magnify losses and increase the volatility of returns. To the extent the Fund takes a short position in a derivative instrument or other asset, this involves the risk of a potentially unlimited increase in the value of the underlying instrument or other asset. Short positions also involve transaction and other costs that will reduce potential Fund gains and increase potential Fund losses.
Tax Risk. To qualify as a regulated investment company, the Fund must derive at least 90% of its gross income for each taxable year from sources treated as “qualifying income” under the Internal Revenue Code of 1986, as amended, and meet certain asset diversification requirements, including that, at the end of each quarter of the
24
Prospectus 2026
Columbia Variable Portfolio - Commodity Strategy Fund
More Information About the Fund (continued)
Fund's taxable year, not more than 25% of the value of its total assets be invested including through corporations in which the Fund owns a 20% or greater voting stock interest in any single issuer. The Fund's investments can be limited by the Fund's intention to qualify as a regulated investment company and can limit the Fund's ability to so qualify. The tax treatment of certain of the Fund's investments and of the income and gain therefrom for these purposes is uncertain, and an adverse determination or future guidance by the IRS may affect the Fund's ability to qualify for treatment as a regulated investment company, including on a retroactive basis. If the Fund were to fail to qualify as a regulated investment company, or if it were ineligible to or otherwise could not cure such failure, the Fund would be ineligible (including retroactively) for the favorable tax treatment afforded to it as such for one or more years, which would adversely affect the value of your investment in the Fund. The Fund intends to invest a portion of its assets in the Subsidiary. The Fund and the Subsidiary currently take steps to, and will continue to take steps to, ensure that the Fund's income in respect of the Subsidiary will constitute qualifying income. Failure to do so could affect the ability of the Fund to qualify for treatment as a regulated investment company. If a net loss is realized by the Subsidiary, such loss is not generally available to offset the income of the Fund. Also, net losses realized by the Subsidiary cannot be carried forward to offset income of the Subsidiary in future years. Please refer to “Distributions and Taxes” in this prospectus or to “Taxation” in the SAI for additional information about the U.S. federal income tax treatment of the Fund.
Unrated Securities Risk. The Fund may purchase unrated securities which are not rated by a rating agency. Unrated securities may be less liquid than comparable rated securities and involve the risk that the Investment Manager may not accurately evaluate the security’s comparative credit rating. Analysis of creditworthiness of issuers of high yield securities may be more complex than for issuers of higher-quality debt securities. To the extent that the Fund purchases unrated securities, the Fund’s success in achieving its investment objective may depend more heavily on the Investment Manager’s creditworthiness analysis than if the Fund invested exclusively in rated securities.
U.S. Government Obligations Risk. While U.S. Treasury obligations are backed by the “full faith and credit” of the U.S. Government, such securities are nonetheless subject to credit risk (i.e., the risk that the U.S. Government may be, or may be perceived to be, unable or unwilling to honor its financial obligations, such as making payments). Securities issued or guaranteed by federal agencies or authorities and U.S. Government-sponsored instrumentalities or enterprises may or may not be backed by the full faith and credit of the U.S. Government. For example, securities issued by the Federal Home Loan Mortgage Corporation, the Federal National Mortgage Association and the Federal Home Loan Banks are neither insured nor guaranteed by the U.S. Government. These securities may be supported by the ability to borrow from the U.S. Treasury or only by the credit of the issuing agency, authority, instrumentality or enterprise and, as a result, are subject to greater credit risk than securities issued or guaranteed by the U.S. Treasury.
Additional Investment Strategies and Policies
This section describes certain investment strategies and policies that the Fund may utilize in pursuit of its investment objective and some additional factors and risks involved with investing in the Fund.
Investment Guidelines
As a general matter, and except as specifically described in the discussion of the Fund's principal investment strategies in this prospectus or as otherwise required by the Investment Company Act of 1940, as amended (the 1940 Act), the rules and regulations thereunder and any applicable exemptive relief, whenever an investment policy or limitation states a percentage of the Fund's assets that may be invested in any security or other asset or sets forth a policy regarding an investment standard, compliance with that percentage limitation or standard will be determined solely at the time of the Fund's investment in the security or asset.
Holding Other Kinds of Investments
The Fund may hold other investments that are not part of its principal investment strategies. These investments and their risks are described below and/or in the SAI. The Fund may choose not to invest in certain securities described in this prospectus and in the SAI, although it has the ability to do so. Information on the Fund’s holdings can be found in the Fund’s Form N-CSR or by visiting columbiathreadneedleus.com.
Prospectus 2026
25
Columbia Variable Portfolio - Commodity Strategy Fund
More Information About the Fund (continued)
Transactions in Derivatives
The Fund may enter into derivative transactions or otherwise have exposure to derivative transactions through underlying investments. Derivatives are financial contracts whose values are, for example, based on (or “derived” from) traditional securities (such as a stock or bond), assets (such as a commodity like gold or a foreign currency), reference rates (such as the Secured Overnight Financing Rate (commonly known as SOFR)) or market indices (such as the Standard & Poor’s 500® Index). The use of derivatives is a highly specialized activity which involves investment techniques and risks different from those associated with ordinary portfolio securities transactions. Derivatives involve special risks and may result in losses or may limit the Fund’s potential gain from favorable market movements. Derivative strategies often involve leverage, which may exaggerate a loss, potentially causing the Fund to lose more money than it would have lost had it invested in the underlying security or other asset directly. The values of derivatives may move in unexpected ways, especially in unusual market conditions, and may result in increased volatility in the value of the derivative and/or the Fund’s shares, among other consequences. Other risks arise from the Fund’s potential inability to terminate or to sell derivative positions. A liquid secondary market may not always exist for the Fund’s derivative positions at times when the Fund might wish to terminate or to sell such positions. Over-the-counter instruments (investments not traded on an exchange) may be illiquid, and transactions in derivatives traded in the over-the-counter market are subject to the risk that the other party will not meet its obligations. The use of derivatives also involves the risks of mispricing or improper valuation and that changes in the value of the derivative may not correlate perfectly with the underlying security, asset, reference rate or index. The Fund also may not be able to find a suitable derivative transaction counterparty, and thus may be unable to engage in derivative transactions when it is deemed favorable to do so, or at all. The U.S. government and the European Union (and some other jurisdictions) have enacted regulations and similar requirements that prescribe clearing, margin, reporting and registration requirements for participants in the derivatives market. These requirements are evolving and their ultimate impact on the Fund remains unclear, but such impact could include restricting and/or imposing significant costs or other burdens upon the Fund’s participation in derivatives transactions. Additionally, regulations governing the use of derivatives by registered investment companies, such as the Fund, require, among other things, that a fund that invests in derivative instruments beyond a specified limited amount apply a value-at-risk-based limit to its portfolio and establish a comprehensive derivatives risk management program. As of the date of this prospectus, the Fund is required to maintain a comprehensive derivatives risk management program. For more information on the risks of derivative investments and strategies, see the SAI.
Affiliated Fund Investing
The Investment Manager or an affiliate serves as investment adviser to funds using the Columbia brand (Columbia Funds), including those that are structured as “fund-of-funds”, and provides asset-allocation services to (i) shareholders by investing in shares of other Columbia Funds, which may include the Fund (collectively referred to in this section as Underlying Funds), and (ii) discretionary managed accounts (collectively referred to as affiliated products) that invest exclusively in Underlying Funds. These affiliated products, individually or collectively, may own a significant percentage of the outstanding shares of one or more Underlying Funds, and the Investment Manager seeks to balance potential conflicts of interest between the affiliated products and the Underlying Funds in which they invest. The affiliated products’ investment in the Underlying Funds may have the effect of creating economies of scale, possibly resulting in lower expense ratios for the Underlying Funds, because the affiliated products may own substantial portions of the shares of Underlying Funds. However, redemption of Underlying Fund shares by one or more affiliated products could cause the expense ratio of an Underlying Fund to increase, as its fixed costs would be spread over a smaller asset base. Because of large positions of certain affiliated products, the Underlying Funds may experience relatively large inflows and outflows of cash due to affiliated products’ purchases and sales of Underlying Fund shares. Although the Investment Manager or its affiliate may seek to minimize the impact of these transactions where possible, for example, by structuring them over a reasonable period of time or through other measures, Underlying Funds may experience increased expenses as they buy and sell portfolio securities to manage the cash flow effect related to these transactions. Further, when the Investment Manager or its affiliate structures transactions over a reasonable period of time in order to manage the potential impact of the buy and sell decisions for the affiliated products, those affiliated products, including funds-of-funds, may pay more or less (for purchase activity), or receive more or less (for redemption activity), for shares of the Underlying Funds than if the transactions
26
Prospectus 2026
Columbia Variable Portfolio - Commodity Strategy Fund
More Information About the Fund (continued)
were executed in one transaction. In addition, substantial redemptions by affiliated products within a short period of time could require the Underlying Fund to liquidate positions more rapidly than would otherwise be desirable, which may have the effect of reducing or eliminating potential gain or causing it to realize a loss. In order to meet such redemptions, an Underlying Fund may be forced to sell its liquid (or more liquid) positions, leaving the Underlying Fund holding, post-redemption, a relatively larger position in illiquid investments (i.e., any investment that the Fund reasonably expects cannot be sold or disposed of in current market conditions in seven calendar days or less without the sale or disposition significantly changing the market value of the investment) or less liquid securities. Substantial redemptions may also adversely affect the ability of the Underlying Fund to implement its investment strategy. The Investment Manager or its affiliate also has a conflict of interest in determining the allocation of affiliated products’ assets among the Underlying Funds, as it earns different fees from the various Underlying Funds.
Investing in Money Market Funds
The Fund may invest cash in, or hold as collateral for certain investments, shares of registered or unregistered money market funds, including funds advised by the Investment Manager or its affiliates. These funds are not insured or guaranteed by the Federal Deposit Insurance Corporation (FDIC) or any other government agency. The Fund and its shareholders indirectly bear a portion of the expenses of any money market fund or other fund in which the Fund may invest.
Investing Defensively
The Fund may from time to time take temporary defensive investment positions that may be inconsistent with the Fund’s principal investment strategies in attempting to respond to adverse market, economic, political, social or other conditions, including, without limitation, investing some or all of its assets in money market instruments or shares of affiliated or unaffiliated money market funds or holding some or all of its assets in cash or cash equivalents. The Fund may take such defensive investment positions for as long a period as deemed necessary.
The Fund may not achieve its investment objective while it is investing defensively. Investing defensively may adversely affect Fund performance. During these times, the portfolio managers may make frequent portfolio holding changes, which could result in increased trading expenses and decreased Fund performance. See also Investing in Money Market Funds above for more information.
Other Strategic and Investment Measures
The Fund may also from time to time take temporary portfolio positions that may or may not be consistent with the Fund’s principal investment strategies in attempting to respond to adverse market, economic, political, social or other conditions, including, without limitation, investing in derivatives, such as forward contracts, futures contracts, options, structured investments and swaps, for various purposes, including among others, investing in particular derivatives in seeking to reduce investment exposures, or in seeking to achieve indirect investment exposures, to a sector, country, region or currency where the Investment Manager believes such positioning is appropriate. The Fund may take such portfolio positions for as long a period as deemed necessary. While the Fund is so positioned, derivatives could comprise a substantial portion of the Fund’s investments and the Fund may not achieve its investment objective. Investing in this manner may adversely affect Fund performance. During these times, the portfolio managers may make frequent portfolio holding changes, which could result in increased trading expenses and decreased Fund performance. For information on the risks of investing in derivatives, see Transactions in Derivatives above.
Portfolio Holdings Disclosure
The Board has adopted policies and procedures that govern the timing and circumstances of disclosure to shareholders and third parties of information regarding the securities owned by the Fund. A description of these policies and procedures is included in the SAI. Fund policy generally permits the disclosure of portfolio holdings information on the Fund's website (columbiathreadneedleus.com) only after a certain amount of time has passed, as described in the SAI.
Purchases and sales of portfolio securities can take place at any time, so the portfolio holdings information available on the Fund's website may not always be current.
Prospectus 2026
27
Columbia Variable Portfolio - Commodity Strategy Fund
More Information About the Fund (continued)
FUNDamentals
Portfolio Holdings Versus the Benchmarks
The Fund does not limit its investments to the securities within its benchmark(s), and accordingly the Fund's holdings may diverge from those of its benchmark(s). In addition, the Fund may invest in securities outside any industry and geographic sectors represented in its benchmark(s). The Fund's weightings in individual securities, and in industry or geographic sectors, may also vary considerably from those of its benchmark(s).
Cash Flows
The timing and magnitude of cash inflows from investors buying Fund shares could prevent the Fund from always being fully invested. Conversely, the timing and magnitude of cash outflows to shareholders redeeming Fund shares could require the Fund to sell portfolio securities at less than opportune times or to hold ready reserves of uninvested cash in amounts larger than might otherwise be the case to meet shareholder redemptions. Either situation could adversely impact the Fund’s performance.
Understanding Annual Fund Operating Expenses
The Fund’s annual operating expenses, as presented in the Annual Fund Operating Expenses table in the Fees and Expenses of the Fund section of this prospectus, generally are based on expenses incurred during the Fund’s most recently completed fiscal year, may vary by share class and are expressed as a percentage (expense ratio) of the Fund’s average net assets during that fiscal year. The expense ratios reflect the Fund’s fee arrangements as of the date of this prospectus and, unless indicated otherwise, are based on expenses incurred during the Fund’s most recent fiscal year. The Fund’s assets will fluctuate, but unless indicated otherwise in the Annual Fund Operating Expenses table, no adjustments have been or will be made to the expense ratios to reflect any differences in the Fund’s average net assets between the most recently completed fiscal year and the date of this prospectus or a later date. In general, the Fund’s expense ratios will increase as its net assets decrease, such that the Fund’s actual expense ratios may be higher than the expense ratios presented in the Annual Fund Operating Expenses table if assets fall. Any commitment by the Investment Manager and/or its affiliates to waive fees and/or cap (reimburse) expenses is expected, in part, to limit the impact of any increase in the Fund’s expense ratios that would otherwise result because of a decrease in the Fund’s assets in the current fiscal year. The Fund’s annual operating expenses are comprised of (i) investment management fees, (ii) distribution and/or service fees, and (iii) other expenses. Management fees do not vary by class, but distribution and/or service fees and other expenses may vary by class.
FUNDamentals
Other Expenses
“Other expenses” consist of the fees the Fund pays to its custodian, transfer agent, auditors, lawyers and trustees, costs relating to compliance and miscellaneous expenses. Generally, these expenses are allocated on a pro rata basis across all share classes. These fees include certain sub-transfer agency and shareholder servicing fees. For more information on these fees, see About Fund Shares and Transactions — Financial Intermediary Compensation.
28
Prospectus 2026
Columbia Variable Portfolio - Commodity Strategy Fund
More Information About the Fund (continued)
Fee Waiver/Expense Reimbursement Arrangements and Impact on Past Performance
The Investment Manager and certain of its affiliates have contractually agreed to waive fees and/or reimburse expenses (excluding certain fees and expenses described below) through April 30, 2027, unless sooner terminated at the sole discretion of the Fund's Board, so that the Fund’s net operating expenses, after giving effect to fees waived/expenses reimbursed and any balance credits and/or overdraft charges from the Fund’s custodian, do not exceed the annual rates of:
| Columbia Variable Portfolio – Commodity Strategy Fund | |
| Class 1 |
0.73% |
| Class 2 |
0.98% |
Under the agreement, the following fees and expenses are excluded from the Fund’s operating expenses when calculating the waiver/reimbursement commitment, and therefore will be paid by the Fund, if applicable: taxes (including foreign transaction taxes), expenses associated with investment in affiliated and non-affiliated pooled investment vehicles (including mutual funds and exchange-traded funds), transaction costs and brokerage commissions, costs related to any securities lending program, dividend expenses associated with securities sold short, inverse floater program fees and expenses, transaction charges and interest on borrowed money, interest, costs associated with shareholder meetings, infrequent and/or unusual expenses and any other expenses the exclusion of which is specifically approved by the Fund’s Board. This agreement may be modified or amended only with approval from all parties.
Effect of Fee Waivers and/or Expense Reimbursements on Past Performance. The Fund’s returns shown in the Performance Information section of this prospectus reflect the effect of any fee waivers and/or reimbursements of Fund expenses by the Investment Manager and/or any of its affiliates that were in place during the performance period shown. Without such fee waivers/expense reimbursements, the Fund’s returns might have been lower.
Obtaining Recent Net Asset Value Per Share
The price you pay or receive when you buy, sell or transfer shares is the Fund's next determined net asset value (or NAV) per share for a given share class. The Fund calculates the NAV per share for each class of shares of the Fund at the end of each business day, with the value of the Fund's shares based on the total value of all of the securities and other assets that it holds as of such specified time. For additional information on how the Fund calculates its NAV, see About Fund Shares and Transactions — Share Price Determination below.
You may obtain the current NAV of Fund shares at no cost by calling 800.345.6611 (follow the prompts or ask for a representative) or by sending an e-mail to serviceinquiries@columbiathreadneedle.com.
Primary Service Provider Contracts
The Fund enters into contractual arrangements (Service Provider Contracts) with various service providers, including, among others, the Investment Manager, the Distributor, Columbia Management Investment Services Corp. (the Transfer Agent) and the Fund’s custodian. The Fund’s Service Provider Contracts are solely among the parties thereto. Shareholders are not parties to, or intended to be third-party beneficiaries of, any Service Provider Contracts. Further, this prospectus, the SAI and any Service Provider Contracts are not intended to give rise to any agreement, duty, special relationship or other obligation between the Fund and any investor, or give rise to any contractual, tort or other rights in any individual shareholder, group of shareholders or other person, including any right to assert a fiduciary or other duty, enforce the Service Provider Contracts against the parties or to seek any remedy thereunder, either directly or on behalf of the Fund. Nothing in the previous sentence should be read to suggest any waiver of any rights under federal or state securities laws.
The Investment Manager, the Distributor, and the Transfer Agent are all affiliates of Ameriprise Financial, Inc. (Ameriprise Financial). They and their affiliates currently provide key services, including investment advisory, administration, distribution, shareholder servicing and transfer agency services, to the Fund and various other funds, including the Columbia Funds, and are paid for providing these services. These service relationships are described below.
Prospectus 2026
29
Columbia Variable Portfolio - Commodity Strategy Fund
More Information About the Fund (continued)
The Investment Manager
Columbia Management Investment Advisers, LLC is located at 290 Congress Street, Boston, MA 02210 and serves as investment adviser and administrator to the Columbia Funds. The Investment Manager is a registered investment adviser and a wholly-owned subsidiary of Ameriprise Financial. The Investment Manager’s management experience covers all major asset classes, including equity securities, debt instruments and money market instruments. In addition to serving as an investment adviser to traditional mutual funds, exchange-traded funds and closed-end funds, the Investment Manager acts as an investment adviser for itself, its affiliates, individuals, corporations, retirement plans, private investment companies and financial intermediaries.
Subject to oversight by the Board, the Investment Manager manages the day-to-day operations of the Fund, determining what securities and other investments the Fund should buy or sell and executing portfolio transactions. The Investment Manager may use the research and other capabilities of its affiliates and third parties in managing the Fund’s investments. The Investment Manager is also responsible for overseeing the administrative operations of the Fund, including the general supervision of the Fund’s operations, the coordination of the Fund’s other service providers and the provision of related clerical and administrative services.
The SEC has issued an order that permits the Investment Manager, subject to the approval of the Board, to appoint unaffiliated subadvisers by entering into subadvisory agreements with them, and to change in material respects the terms of those subadvisory agreements, including the fees paid thereunder, for the Fund without first obtaining shareholder approval, thereby avoiding the expense and delays typically associated with obtaining shareholder approval. The Fund furnishes shareholders with information about new subadvisers retained in reliance on the order within 90 days after hiring the subadviser. The Investment Manager and its affiliates may have other relationships, including significant financial relationships, with current or potential subadvisers or their affiliates, which may create certain conflicts of interest. When making recommendations to the Board to appoint or to change a subadviser, or to change the terms of a subadvisory agreement, the Investment Manager discloses to the Board the nature of any such material relationships. The SEC has issued a separate order that permits the Board to approve new subadvisory agreements or material changes to existing subadvisory agreements at a meeting that is not in person, provided that the Trustees are able to participate in the meeting using a means of communication that allows them to hear each other simultaneously during the meeting and other conditions of the order are satisfied. At present, the Investment Manager has not engaged any investment subadviser for the Fund.
The Fund pays the Investment Manager a fee for its management services, which include investment advisory services and administrative services. The fee is calculated as a percentage of the daily net assets of the Fund and is paid monthly. For the Fund’s most recent fiscal year, management services fees paid to the Investment Manager by the Fund amounted to 0.63% of average daily net assets of the Fund, before any applicable reimbursements.
A discussion regarding the basis for the Board’s approval of the renewal of the Fund's management agreement is available in the Fund’s Form N-CSR for the fiscal period ended June 30, 2025.
Portfolio Managers
Information about the portfolio managers primarily responsible for overseeing the Fund’s and the Subsidiary's investments is shown below. The SAI provides additional information about the portfolio managers, including information relating to compensation, other accounts managed by the portfolio managers, and ownership by the portfolio managers of Fund shares.
| Commodity Strategies Portfolio Management |
Title |
Role with Fund |
Managed Fund Since |
| Marc Khalamayzer, CFA |
Senior Portfolio Manager and Director of Multi-Asset Research |
Commodity Strategies Co-Portfolio Manager |
2019 |
| Matthew Ferrelli, CFA |
Senior Portfolio Manager |
Commodity Strategies Co-Portfolio Manager |
2019 |
30
Prospectus 2026
Columbia Variable Portfolio - Commodity Strategy Fund
More Information About the Fund (continued)
| Cash/Liquidity Strategies Portfolio Management |
Title |
Role with Fund |
Managed Fund Since |
| Ronald Stahl, CFA |
Senior Portfolio Manager and Head of Short Duration and Stable Value |
Cash/Liquidity Strategies Co-Portfolio Manager |
2021 |
| Gregory Liechty |
Senior Portfolio Manager |
Cash/Liquidity Strategies Co-Portfolio Manager |
2021 |
| John Dempsey, CFA |
Senior Portfolio Manager |
Cash/Liquidity Strategies Co-Portfolio Manager |
2021 |
Mr. Khalamayzer joined the Investment Manager in 2014 as an analyst for the Global Investment Solutions Group. Mr. Khalamayzer began his investment career in 2006 and earned a B.S. in economics-finance and an M.S. in finance from Bentley University.
Mr. Ferrelli joined the Investment Manager in 2017 as an analyst for the Global Asset Allocation team. Mr. Ferrelli began his investment career in 2005 and earned a B.A. from Boston College and an M.S. in finance from Suffolk University.
Mr. Stahl joined one of the Columbia Management legacy firms or acquired business lines in 1998. Mr. Stahl began his investment career in 1998 and earned a B.S. from Oregon State University and an M.B.A. from Portland State University.
Mr. Liechty joined one of the Columbia Management legacy firms or acquired business lines in 2005. Mr. Liechty began his investment career in 1995 and earned a B.A. and an M.B.A. from the University of North Florida.
Mr. Dempsey joined the Investment Manager in 2015 as a portfolio manager on the Short Duration & Stable Value Team. Mr. Dempsey began his investment career in 1998 and earned a B.S. from the University of Oregon.
The Distributor
Shares of the Fund are distributed by Columbia Management Investment Distributors, Inc., which is located at 290 Congress Street, Boston, MA 02210. The Distributor is a registered broker-dealer and an indirect, wholly-owned subsidiary of Ameriprise Financial. The Distributor and its affiliates may pay commissions, distribution and service fees and/or other compensation to entities, including Ameriprise Financial affiliates, for selling shares and providing services to investors.
The Transfer Agent
Columbia Management Investment Services Corp. is a registered transfer agent and wholly-owned subsidiary of Ameriprise Financial. The Transfer Agent is located at 290 Congress Street, Boston, MA 02210, and its responsibilities include processing purchases, redemptions and transfers of Fund shares, calculating and paying distributions, maintaining shareholder records, preparing account statements and providing customer service. The Transfer Agent has engaged SS&C GIDS, Inc. to provide various sub-transfer agency services. The Fund pays a service fee to participating insurance companies or other financial intermediaries that provide sub-recordkeeping and other services to Contract owners and the separate accounts. The Transfer Agent may retain as compensation for its services revenues for fees for wire, telephone and redemption orders, account transcripts due the Transfer Agent from Fund shareholders and interest (net of bank charges) earned with respect to balances in accounts the Transfer Agent maintains in connection with its services to the Fund.
Other Roles and Relationships of Ameriprise Financial and its Affiliates — Certain Conflicts of Interest
The Investment Manager, Distributor and Transfer Agent, all affiliates of Ameriprise Financial, provide various services to the Fund and other Columbia Funds for which they are compensated. Ameriprise Financial and its other affiliates may also provide other services to these funds and be compensated for them.
The Investment Manager and its affiliates may provide investment advisory and other services to other clients and customers substantially similar to those provided to the Columbia Funds. These activities, and other financial services activities of Ameriprise Financial and its affiliates, may present actual and potential conflicts of interest and introduce certain investment constraints.
Prospectus 2026
31
Columbia Variable Portfolio - Commodity Strategy Fund
More Information About the Fund (continued)
Ameriprise Financial is a major financial services company, engaged in a broad range of financial activities beyond the fund-related activities of the Investment Manager, including, among others, insurance, broker-dealer (sales and trading), asset management, banking and other financial activities. These additional activities may involve multiple advisory, financial, insurance and other interests in securities and other instruments, and in companies that issue securities and other instruments, that may be bought, sold or held by the Columbia Funds.
Conflicts of interest and limitations that could affect a Columbia Fund may arise from, for example, the following:
■
compensation and other benefits received by the Investment Manager and other Ameriprise Financial affiliates related to the management/administration of a Columbia Fund and the sale of its shares;
■
the allocation of, and competition for, investment opportunities among the Fund, other funds and accounts advised/managed by the Investment Manager and other Ameriprise Financial affiliates, or Ameriprise Financial itself and its affiliates;
■
separate and potentially divergent management of a Columbia Fund and other funds and accounts advised/managed by the Investment Manager and other Ameriprise Financial affiliates;
■
regulatory and other investment restrictions on investment activities of the Investment Manager and other Ameriprise Financial affiliates and accounts advised/managed by them;
■
insurance and other relationships of Ameriprise Financial affiliates with companies and other entities in which a Columbia Fund invests;
■
regulatory and other restrictions relating to the sharing of information between Ameriprise Financial and its affiliates, including the Investment Manager, and a Columbia Fund; and
■
insurance companies investing in the Fund may be affiliates of Ameriprise Financial; these affiliated insurance companies, individually and collectively, may hold through separate accounts a significant portion of the Fund's shares and may also invest in separate accounts managed by the Investment Manager that have the same or substantially similar investment objectives and strategies as the Fund.
The Investment Manager and Ameriprise Financial have adopted various policies and procedures that are intended to identify, monitor and address conflicts of interest. However, there is no assurance that these policies, procedures and disclosures will be effective.
Additional information about Ameriprise Financial and the types of conflicts of interest and other matters referenced above is set forth in the Investment Management and Other Services — Other Roles and Relationships of Ameriprise Financial and its Affiliates — Certain Conflicts of Interest section of the SAI. Investors in the Columbia Funds should carefully review these disclosures and consult with their financial advisor if they have any questions.
Certain Legal Matters
Ameriprise Financial and certain of its affiliates are involved, in the normal course of business, in legal proceedings that include regulatory inquiries, arbitration and litigation (including class actions) concerning matters arising in connection with the conduct of their activities as part of a diversified financial services firm. Ameriprise Financial believes that the Fund is not currently the subject of, and that neither Ameriprise Financial nor any of its affiliates are the subject of, any pending legal, arbitration or regulatory proceedings that are likely to have a material adverse effect on the Fund or the ability of Ameriprise Financial or its affiliates to perform under their contracts with the Fund. Information regarding certain pending and settled legal proceedings may be found in the Fund’s Form N-CSR and in the SAI. Additionally, Ameriprise Financial is required to make quarterly (10-Q), annual (10-K) and, as necessary, 8-K filings with the SEC on legal and regulatory matters that relate to Ameriprise Financial and its affiliates. Copies of these filings may be obtained by accessing the SEC website at sec.gov.
32
Prospectus 2026
Columbia Variable Portfolio - Commodity Strategy Fund
More Information About the Fund (continued)
About the Fund’s Wholly-Owned Subsidiary
The Subsidiary is an exempted company organized under the laws of the Cayman Islands. The Fund will invest in the Subsidiary in order to gain exposure to the commodities markets within the limitations of Subchapter M of the U.S. Internal Revenue Code of 1986, as amended, applicable to “regulated investment companies.” The Fund must invest no more than 25% of its total assets in the Subsidiary as of the end of each quarter of its taxable year.
The Subsidiary is overseen by its own board of directors. However, the Fund’s Board oversees investment activities of the Subsidiary generally as if the Subsidiary’s investments were held directly by the Fund. The Investment Manager is responsible for the Subsidiary’s day-to-day business pursuant to a separate management agreement, which includes investment advisory services and administrative services, between the Subsidiary and the Investment Manager. Under this agreement, the Investment Manager provides the Subsidiary with the same type of management services, under the same terms, as are provided to the Fund. The Subsidiary has entered into a separate contract for the provision of custody services with the same service provider who provides these services to the Fund. The Subsidiary will bear the fees and expenses incurred in connection with the management and custody services that it receives. The Fund expects that the expenses borne by the Subsidiary will not be material in relation to the value of the Fund’s assets.
In determining which investments should be bought and sold for the Subsidiary, and in adhering to the Fund’s compliance policies and procedures, the Investment Manager will treat the assets of the Subsidiary as if the assets were held directly by the Fund. The Investment Manager will, to the extent applicable, also treat the assets of the Subsidiary as if the assets were held directly by the Fund with respect to its adherence to the Fund’s investment policies and restrictions.
Please refer to the SAI for additional information about the organization and management of the Subsidiary.
Prospectus 2026
33
Columbia Variable Portfolio - Commodity Strategy Fund
About Fund Shares and Transactions
Description of the Share Classes
Share Class Features
The Fund offers the classes of shares set forth on the cover of this prospectus. Each share class has its own cost structure and other features. The following summarizes the primary features of the Class 1 and Class 2 shares.
| |
Class 1 Shares |
Class 2 Shares |
| Eligible Investors |
Shares of the Fund are available only to separate accounts of participating insurance companies as underlying investments for variable annuity contracts and/or variable life insurance policies (collectively, Contracts) or qualified pension and retirement plans (Qualified Plans) or other eligible investors authorized by the Distributor. | |
| Investment Limits |
none |
none |
| Conversion Features |
none |
none |
| Front-End Sales Charges |
none |
none |
| Contingent Deferred Sales Charges (CDSCs) |
none |
none |
| Maximum Distribution and/or Service Fees |
none |
0.25% |
FUNDamentals
Financial Intermediaries
The term “financial intermediary” refers to the insurance company that issued your contract, qualified pension or retirement plan sponsors or the financial intermediary that employs your financial advisor. Financial intermediaries also include broker-dealers and financial advisors as well as firms that employ broker-dealers and financial advisors, including, for example, brokerage firms, banks, investment advisers, third party administrators and other firms in the financial services industry, including Ameriprise Financial and its affiliates.
Distribution and/or Service Fees
Pursuant to Rule 12b-1 under the Investment Company Act of 1940, as amended (the 1940 Act), the Board has approved, and the Fund has adopted, a distribution plan which sets the distribution fees that are periodically deducted from the Fund’s assets for Class 2 shares. The distribution fee for Class 2 shares is 0.25%. These fees are calculated daily, may vary by share class and are intended to compensate the Distributor and/or financial intermediaries for selling shares of the Fund and/or providing services to investors. Because the fees are paid out of the Fund’s assets on an ongoing basis, they will increase the cost of your investment over time.
The Fund will pay these fees to the Distributor and/or to eligible financial intermediaries for as long as the distribution plan continues. The Fund may reduce or discontinue payments at any time.
The Fund pays a service fee to participating insurance companies or other financial intermediaries that provide sub-recordkeeping and other services to Contract owners, Qualified Plan participants and the separate accounts.
Financial Intermediary Compensation
The Distributor, the Investment Manager and their affiliates make payments, from their own resources, to financial intermediaries, primarily to affiliated and unaffiliated insurance companies, for marketing/sales support services relating to the Fund (Marketing Support Payments). Such payments are generally based upon one or more of the following factors: average net assets of the Columbia Funds sold by the Distributor attributable to that financial intermediary; gross sales of the Columbia Funds distributed by the Distributor attributable to that financial intermediary; or a negotiated lump sum payment. While the financial arrangements may vary for each financial intermediary, the Marketing Support Payments to any one financial intermediary are generally between 0.05% and 0.40% on an annual basis for payments based on average net assets of the Fund attributable to the financial intermediary, and between 0.05% and 0.25% on an annual basis for a financial intermediary receiving a payment based on gross sales of the Columbia Funds attributable to the financial intermediary.
34
Prospectus 2026
Columbia Variable Portfolio - Commodity Strategy Fund
About Fund Shares and Transactions (continued)
As employee compensation and business unit operating goals at all levels are generally tied to the success of Ameriprise Financial, employees of Ameriprise Financial and its affiliates, including employees of affiliated broker-dealers and insurance companies, are incented to include shares of the Columbia Funds in Contracts offered by affiliated insurance companies. Certain employees, directly or indirectly, receive higher compensation and other benefits as investment in the Columbia Funds increases. In addition, management, sales leaders and other employees may spend more of their time and resources promoting Ameriprise Financial and its subsidiary companies, including the Distributor and the Investment Manager, and the products they offer, including the Fund.
In addition, the Transfer Agent has certain arrangements in place to compensate financial intermediaries, primarily to affiliated and unaffiliated insurance companies, that hold Fund shares through networked and omnibus accounts, including omnibus retirement plans, for services that they provide to beneficial Fund shareholders (Shareholder Services). Shareholder Services and related fees vary by financial intermediary and may include sub-accounting, sub-transfer agency, participant recordkeeping, shareholder or participant reporting, shareholder or participant transaction processing, maintenance of shareholder records, preparation of account statements and provision of customer service, and are not intended to include services that are primarily intended to result in the sale of Fund shares. Payments for Shareholder Services generally are not expected, with certain limited exceptions, to exceed 0.40% of the average aggregate value of the Fund’s shares. Each Fund pays the Transfer Agent a service fee equal to the payments made by the Transfer Agent to participating insurance companies and other financial intermediaries that provide Shareholder Services up to the lesser of the amount charged by the financial intermediary or a contractual asset-based cap. Payments of amounts that exceed the amount paid by the Fund are borne by the Transfer Agent, the Investment Manager and/or their affiliates.
In addition to the payments described above, the Distributor, the Investment Manager and their affiliates typically make other payments or allow promotional incentives to certain broker-dealers to the extent permitted by SEC and Financial Industry Regulatory Authority (FINRA) rules and by other applicable laws and regulations.
Amounts paid by the Distributor, the Investment Manager and their affiliates are paid out of their own resources and do not increase the amount paid by you or the Fund. You can find further details in the SAI about the payments made by the Distributor, the Investment Manager and their affiliates, as well as a list of the financial intermediaries, including Ameriprise Financial affiliates, to which the Distributor, the Investment Manager or their affiliates have agreed to make Marketing Support Payments and fee payments for Shareholder Services.
Your financial intermediary may charge you fees and commissions in addition to those described in this prospectus. You should consult with your financial intermediary and review carefully any disclosure your financial intermediary provides regarding its services and compensation. Depending on the financial arrangement in place at any particular time, a financial intermediary and its financial advisors may have a conflict of interest or financial incentive with respect to recommendations regarding the Fund or any Contract or Qualified Plan that includes the Fund.
Share Price Determination
The price you pay or receive when you buy, sell or transfer shares is the Fund's next determined net asset value (or NAV) per share for a given share class. The Fund calculates the NAV per share for each class of shares of the Fund at the end of each business day, with the value of the Fund's shares based on the total value of all of the securities and other assets that it holds as of such specified time.
FUNDamentals
NAV Calculation
Each of the Fund's share classes calculates its NAV per share as follows:
NAV per share = (Value of assets of the share class) – (Liabilities of the share class)
Number of outstanding shares of the class
Number of outstanding shares of the class
Prospectus 2026
35
Columbia Variable Portfolio - Commodity Strategy Fund
About Fund Shares and Transactions (continued)
FUNDamentals
Business Days
A business day is any day that the New York Stock Exchange (NYSE) is open. A business day typically ends at the close of regular trading on the NYSE, usually at 4:00 p.m. Eastern time. If the NYSE is scheduled to close early, the business day will be considered to end as of the time of the NYSE’s scheduled close. The Fund will not treat an intraday unscheduled disruption in NYSE trading or an intraday unscheduled closing as a close of regular trading on the NYSE for these purposes and will price its shares as of the regularly scheduled closing time for that day (typically, 4:00 p.m. Eastern time). Nonetheless, the NAV of Fund shares may be determined at such other time or times (in addition to or in lieu of the time set forth above) as the Fund’s Board may approve or ratify. On holidays and other days when the NYSE is closed, the Fund’s NAV is not calculated and the Fund does not accept buy or sell orders. However, the value of the Fund’s assets may still be affected on such days to the extent that the Fund holds foreign securities that trade on days that foreign securities markets are open.
Equity securities listed on an exchange are typically valued at the closing price or last trade on their primary exchange at the close of business of the NYSE. Equity securities without a readily available closing price or that are not listed on any exchange are typically valued at the mean between the closing bid and asked prices. Other equity securities, debt securities and other assets are valued differently. For instance, bank loans trading in the secondary market are fair valued unless market quotations are readily available, fixed income investments maturing in 60 days or less are valued primarily using the amortized cost method, unless this methodology results in a valuation that does not approximate the market value of these securities, and those maturing in excess of 60 days are valued based on prices obtained from a pricing service, if available (which may represent market values or fair values). Investments in other open-end funds are valued at their published NAVs. The value of the Fund’s portfolio securities is determined in accordance with the valuation policy approved by the Board (the Valuation Policy). Pursuant to Rule 2a-5 under the 1940 Act, the Board has designated the Investment Manager as the Fund’s valuation designee. The Investment Manager, in turn, has authorized its valuation committee to make fair value determinations and to carry out supervisory and certain other functions relating to the valuation of Fund portfolio securities, pursuant to the Valuation Policy.
If a market price is not readily available or is deemed not to reflect market value for a portfolio security, the Investment Manager will determine the price based on a determination of the security's fair value pursuant to the Valuation Policy. In addition, the Investment Manager may use fair valuation techniques to price securities that trade on a foreign exchange when a significant event has occurred after the foreign exchange closes but before the time at which the Fund’s share price is calculated. Foreign exchanges typically close before the time at which Fund share prices are calculated, and may be closed altogether on days when the Fund is open. Such significant events affecting a foreign security may include, but are not limited to: (1) corporate actions, earnings announcements, litigation or other events impacting a single issuer; (2) governmental action that affects securities in one sector or country; (3) natural disasters or armed conflicts affecting a country or region; or (4) significant domestic or foreign market fluctuations. The Fund uses various criteria, including an evaluation of U.S. market moves after the close of foreign markets, in determining whether a foreign security's market price is readily available and reflective of market value and, if not, the fair value of the security.
Fair valuation may have the effect of reducing stale pricing arbitrage opportunities presented by the pricing of Fund shares. However, when the Investment Manager uses fair valuation to price equity securities, it may value those securities higher or lower than another fund or manager would. Also, fair valuation of Fund holdings may cause the Fund's performance to diverge to a greater degree from the performance of various benchmark indices used to compare the Fund's performance because indices generally do not use fair valuation techniques. Because of the judgment involved in fair valuation decisions, there can be no assurance that the value ascribed to a particular security is accurate. The Fund has retained one or more independent fair valuation pricing services to assist in the fair valuation process for foreign securities.
36
Prospectus 2026
Columbia Variable Portfolio - Commodity Strategy Fund
About Fund Shares and Transactions (continued)
Futures and options on futures are valued based upon the settlement price as determined by the principal exchange on which they are traded or, in the absence of a settlement price, at the mean of the closing bid and ask. Generally, over-the-counter derivatives, such as swaps and swaptions, are valued based on a price provided by an approved pricing service.
Shareholder Information
Each share class has its own cost structure and other features. Your product may not offer every share class. The Fund encourages you to consult with a financial advisor who can help you with your investment decisions and for more information about the share classes offered by the Fund and available under your product. Shares of the Fund are generally available for purchase only by participating insurance companies in connection with Contracts and Qualified Plan sponsors.
The Fund, the Distributor or the Transfer Agent may refuse any order to buy or transfer shares. If this happens, the Fund will return any money it received, but no interest will be paid on that money.
Shares of the Fund may not be purchased or sold directly by individual Contract owners or participants in a Qualified Plan. When you sell your shares through your Contract or Qualified Plan, the Fund is effectively buying them back. This is called a redemption. The right of redemption may be suspended or payment postponed whenever permitted by applicable laws and regulations, as described under Satisfying Fund Redemption Requests below.
Depending on the context, references to “you” or “your” herein refer either to the holder of a Contract, participant in a Qualified Plan or qualified institutional investor who may select Fund shares to fund his or her investment in the Contract or Qualified Plan or to the participating insurance company as the holder of Fund shares through one or more separate accounts or the Qualified Plan.
Satisfying Fund Redemption Requests
The Fund typically expects to send the redeeming participating insurance company or Qualified Plan sponsor payment for shares within two business days after your trade date. The Fund can suspend redemptions and/or delay payment of redemption proceeds for up to seven days. The Fund can also suspend redemptions and/or delay payment of redemption proceeds in excess of seven days under certain circumstances, including when the NYSE is closed or trading thereon is restricted or during emergency or other circumstances, including as determined by the SEC.
The Fund typically seeks to satisfy redemption requests from cash or cash equivalents held by the Fund, from the proceeds of orders to purchase Fund shares or from the proceeds of sales of Fund holdings effected in the normal course of managing the Fund. However, the Fund may have to sell Fund holdings, including in down markets, to meet heavier than usual redemption requests. For example, under stressed or abnormal market conditions or circumstances, including circumstances adversely affecting the liquidity of the Fund’s investments, the Fund may be more likely to be forced to sell Fund holdings to meet redemptions than under normal market circumstances. In these situations, the Fund’s portfolio managers may have to sell Fund holdings that would not otherwise be sold because, among other reasons, the current price to be received is less than the value of the holdings perceived by the Fund’s portfolio managers. The Fund may also, under certain circumstances (but more likely under stressed or abnormal market conditions or circumstances), borrow money under a credit facility to which the Fund and certain other Columbia Funds are parties or from other Columbia Funds under an interfund lending program (except for closed-end funds and money market funds, which are not eligible to borrow under the program). The Fund and the other Columbia Funds are limited as to the amount that each may individually and collectively borrow under the credit facility and the interfund lending program. As a result, borrowings available to the Fund under the credit facility and the interfund lending program might be insufficient, alone or in combination with the other strategies described herein, to satisfy Fund redemption requests. Please see About Fund Investments – Borrowings – Interfund Lending in the SAI for more information about the credit facility and interfund lending program. The Fund is also limited in the total amount it may borrow. The Fund may only borrow to the extent permitted by the 1940 Act, the rules and regulations thereunder, and any exemptive relief available to the Fund, which currently limit Fund borrowings to
Prospectus 2026
37
Columbia Variable Portfolio - Commodity Strategy Fund
About Fund Shares and Transactions (continued)
33 1/3% of total assets (including any amounts borrowed) less liabilities (other than borrowings), plus an additional 5% of its total assets for temporary purposes (to be repaid within 60 days without extension or renewal), in each case determined at the time the borrowing is made.
In addition, the Fund reserves the right to honor redemption orders in whole or in part with in-kind distributions of Fund portfolio securities instead of cash if the Investment Manager, in its sole discretion, determines it to be in the best interest of the remaining shareholders. Such in-kind distributions typically represent a pro-rata portion of Fund portfolio assets subject to adjustments (e.g., for non-transferable securities, round lots and derivatives). In the event the Fund distributes portfolio securities in kind, shareholders may incur brokerage and other transaction costs associated with converting the portfolio securities into cash. Also, the portfolio securities may increase or decrease in value after they are distributed but before they are converted into cash. For U.S. federal income tax purposes, redemptions paid in securities are generally treated the same as redemptions paid in cash. If, during any 90-day period, you redeem shares in an amount greater than $250,000 or 1% of the Fund’s net assets (whichever is less), and if the Investment Manager determines it to be feasible and appropriate, the Fund may pay the redemption amount above such threshold by an in-kind distribution of Fund portfolio securities. Although shares of the Fund may not be purchased or sold by individual owners of Contracts or Qualified Plans, this policy applies indirectly to Contract and Qualified Plan owners.
Potential Conflicts of Interest – Mixed and Shared Funding
The Fund is available for purchase only through Contracts offered by participating insurance companies, Qualified Plans and other qualified institutional investors authorized by the Distributor. Due to differences in tax treatment and other considerations, the interests of various Contract owners, and the interests of Qualified Plan participants, if any, may conflict. The Fund does not foresee any disadvantages to investors arising from these potential conflicts of interest at this time. Nevertheless, the Board of the Fund intends to monitor events to identify any material irreconcilable conflicts which may arise, and to determine what action, if any, should be taken in response to any conflicts. If such a conflict were to arise, one or more separate accounts might be required to withdraw its investments in the Fund or shares of another mutual fund may be substituted. This might force the Fund to sell securities at disadvantageous prices.
Order Processing
Orders to buy and sell shares of the Fund that are placed by your participating insurance company or Qualified Plan sponsor are processed on business days. Orders received in “good form” by the Transfer Agent or a financial intermediary, including your participating insurance company or Qualified Plan sponsor, before the end of a business day are priced at the NAV per share of the Fund's applicable share class on that day. Orders received after the end of a business day will receive the next business day’s NAV per share. An order is in “good form” if the Transfer Agent or your financial intermediary has all of the information and documentation it deems necessary to effect your order. The market value of the Fund’s investments may change between the time you submit your order and the time the Fund next calculates its NAV per share. The business day that applies to your order is also called the trade date.
There is no sales charge associated with the purchase of Fund shares, but there may be charges associated with your Contract or Qualified Plan. Any charges that apply to your Contract or Qualified Plan, and any charges that apply to separate accounts of participating insurance companies or Qualified Plans that may own shares directly, are described in your separate Contract prospectus or Qualified Plan disclosure documents.
You may transfer all or part of your investment in the Fund to one or more of the other investment options available under your Contract or Qualified Plan. You may provide instructions to sell any amount allocated to the Fund. Proceeds will be mailed within seven days after your surrender or withdrawal request is received in good form by an authorized agent. The amount you receive may be more or less than the amount you invested.
Please refer to your Contract prospectus or Qualified Plan disclosure documents, as applicable, for more information about transfers as well as surrenders and withdrawals.
38
Prospectus 2026
Columbia Variable Portfolio - Commodity Strategy Fund
About Fund Shares and Transactions (continued)
Information Sharing Agreements
As required by Rule 22c-2 under the 1940 Act, the Fund or certain of its service providers will enter into information sharing agreements with financial intermediaries, including participating life insurance companies and financial intermediaries that sponsor or offer retirement plans through which shares of the Fund are made available for purchase. Pursuant to Rule 22c-2, financial intermediaries are required, upon request, to: (i) provide shareholder account and transaction information; and (ii) execute instructions from the Fund to restrict or prohibit further purchases of Fund shares by shareholders who have been identified by the Fund as having engaged in transactions that violate the Fund's excessive trading policies and procedures.
Excessive Trading Practices Policy of Non-Money Market Funds
Right to Reject or Restrict Share Transaction Orders — The Fund is intended for investors with long-term investment purposes and is not intended as a vehicle for frequent trading activity (market timing) that is excessive. Investors should transact in Fund shares primarily for investment purposes. The Board has adopted excessive trading policies and procedures that are designed to deter excessive trading by investors (the Excessive Trading Policies and Procedures). The Fund discourages and does not accommodate excessive trading. Investments in a Fund by institutional investors in connection with redemptions in-kind are exempt from the Excessive Trading Policies and Procedures because they generally do not raise market timing or excessive trading concerns. Further discussion about the Fund’s use of redemptions in-kind is available under Satisfying Fund Redemption Requests.
The Fund reserves the right to reject, without any prior notice, any purchase or transfer order for any reason, and will not be liable for any loss resulting from rejected orders. For example, the Fund may in its sole discretion restrict or reject a purchase or transfer order even if the transaction is not subject to the specific limitation described below if the Fund or its agents determine that accepting the order could interfere with efficient management of the Fund's portfolio or is otherwise contrary to the Fund's best interests. The Excessive Trading Policies and Procedures apply equally to purchase or transfer transactions communicated directly to the Transfer Agent and to those received by financial intermediaries.
Specific Buying and Transferring Limitations — If the Fund detects that an investor has made two “material round trips” in any 28-day period, it will generally reject the investor's future purchase orders, including transfer buy orders, involving any Fund.
For these purposes, a “round trip” is a purchase or transfer into the Fund followed by a sale or transfer out of the Fund, or a sale or transfer out of the Fund followed by a purchase or transfer into the Fund. A “material” round trip is one that is deemed by the Fund to be material in terms of its amount or its potential detrimental impact on the Fund. Independent of this limit, the Fund may, in its sole discretion, reject future purchase orders by any person, group or account that appears to have engaged in any type of excessive trading activity.
These limits generally do not apply to automated transactions or transactions by registered investment companies in a “fund-of-funds” structure. These limits do not apply to payroll deduction contributions by retirement plan participants, transactions initiated by a retirement plan sponsor or certain other retirement plan transactions consisting of rollover transactions, loan repayments and disbursements, and required minimum distribution redemptions. They may be modified or rescinded for accounts held by certain retirement plans to conform to plan limits, for considerations relating to the Employee Retirement Income Security Act of 1974 or regulations of the Department of Labor, and for certain asset allocation or wrap programs. Accounts known to be under common ownership or control generally will be counted together, but accounts maintained or managed by a common intermediary generally will not be considered to be under common ownership or control. The Fund reserves the right to modify these restrictions at any time without prior notice to shareholders. In addition, the Fund may, in its sole discretion, reinstate trading privileges that have been revoked under the Fund's Excessive Trading Policies and Procedures.
Limitations on the Ability to Detect and Prevent Excessive Trading Practices — The Fund takes various steps designed to detect and prevent excessive trading, including daily review of available shareholder transaction information. However, the Fund receives buy, sell or transfer orders through financial intermediaries, and cannot always know of or reasonably detect excessive trading that may be facilitated by financial intermediaries or by the use of the
Prospectus 2026
39
Columbia Variable Portfolio - Commodity Strategy Fund
About Fund Shares and Transactions (continued)
omnibus account arrangements they offer. Omnibus account arrangements are common forms of holding shares of mutual funds, particularly among certain financial intermediaries such as broker-dealers, retirement plans and variable insurance products. These arrangements often permit financial intermediaries to aggregate their clients' transactions and accounts, and in these circumstances, the identities of the financial intermediary clients that beneficially own Fund shares are often not known to the Fund.
Some financial intermediaries apply their own restrictions or policies to their clients’ transactions and accounts, which may be more or less restrictive than those described here. This may impact the Fund's ability to curtail excessive trading, even where it is identified. For these and other reasons, it is possible that excessive trading may occur despite the Fund's efforts to detect and prevent it.
Although these restrictions and policies involve judgments that are inherently subjective and may involve some selectivity in their application, the Fund seeks to act in a manner that it believes is consistent with the best interests of Fund shareholders in making any such judgments.
Risks of Excessive Trading — Excessive trading creates certain risks to the Fund's long-term shareholders and may create the following adverse effects:
■
negative impact on the Fund's performance;
■
potential dilution of the value of the Fund's shares;
■
interference with the efficient management of the Fund's portfolio, such as the need to maintain undesirably large cash positions, the need to use its line of credit or the need to buy or sell securities it otherwise would not have bought or sold;
■
losses on the sale of investments resulting from the need to sell securities at less favorable prices; and
■
increased brokerage and administrative costs.
To the extent that the Fund invests significantly in foreign securities traded on markets that close before the Fund's valuation time, it may be particularly susceptible to dilution, which may be exacerbated as a result of excessive trading. Because events may occur after the close of foreign markets and before the Fund's valuation time that influence the value of foreign securities, investors may seek to trade Fund shares in an effort to benefit from their understanding of the value of foreign securities as of the Fund's valuation time. This is often referred to as price arbitrage. The Fund has adopted procedures designed to adjust closing market prices of foreign securities under certain circumstances to reflect what the Fund believes to be the fair value of those securities as of its valuation time. To the extent the adjustments do not work fully, investors engaging in price arbitrage may cause dilution in the value of the Fund's shares held by other shareholders.
Similarly, to the extent that the Fund invests significantly in thinly traded securities and other debt instruments that are rated below investment grade (commonly called “high-yield” or “junk” bonds), equity securities of small-capitalization companies, floating rate loans, or tax-exempt or other securities that may trade infrequently, because these securities are often traded infrequently, investors may seek to trade Fund shares in an effort to benefit from their understanding of the value of these securities as of the Fund's valuation time. This is also a type of price arbitrage. Any such frequent trading strategies may interfere with efficient management of the Fund's portfolio to a greater degree than would be the case for mutual funds that invest only, or significantly, in highly liquid securities, in part because the Fund may have difficulty selling these particular investments at advantageous times or prices to satisfy large and/or frequent sell orders. Any successful price arbitrage may also cause dilution in the value of Fund shares held by non-redeeming shareholders.
Excessive Trading Practices Policy of Columbia Variable Portfolio - Government Money Market Fund
A money market fund is designed to offer investors a liquid cash option that they may buy and sell as often as they wish. Accordingly, the Board has not adopted policies and procedures designed to discourage excessive or short-term trading of Columbia Variable Portfolio - Government Money Market Fund shares. However, since frequent purchases and sales of Columbia Variable Portfolio - Government Money Market Fund shares could in certain instances harm shareholders in various ways, including reducing the returns to long-term shareholders by increasing
40
Prospectus 2026
Columbia Variable Portfolio - Commodity Strategy Fund
About Fund Shares and Transactions (continued)
costs (such as spreads paid to dealers who trade money market instruments with Columbia Variable Portfolio - Government Money Market Fund) and disrupting portfolio management strategies, Columbia Variable Portfolio - Government Money Market Fund reserves the right, but has no obligation, to reject any purchase or transfer transaction at any time. Columbia Variable Portfolio - Government Money Market Fund has no limits on purchase or transfer transactions. In addition, Columbia Variable Portfolio - Government Money Market Fund reserves the right to impose or modify restrictions on purchases, transfers or trading of Fund shares at any time.
Prospectus 2026
41
Columbia Variable Portfolio - Commodity Strategy Fund
Distributions and Taxes
Distributions to Shareholders
A mutual fund can make money two ways:
■
It can earn income on its investments. Examples of fund income are interest paid on money market instruments and bonds, and dividends paid on common stocks.
■
A mutual fund can also have capital gains if the value of its investments increases. While a fund continues to hold an investment, any gain is generally unrealized. If the fund sells an investment, it generally will realize a capital gain if it sells that investment for a higher price than its adjusted cost basis, and will generally realize a capital loss if it sells that investment for a lower price than its adjusted cost basis. Capital gains and losses are either short-term or long-term, depending on whether the fund holds the securities for one year or less (short-term) or more than one year (long-term).
Mutual funds make payments of fund earnings to shareholders, distributing them among all shareholders of the fund. As a shareholder, you are entitled to your portion of a fund's distributed income, including capital gains. Reinvesting your distributions buys you more shares of a fund — which lets you take advantage of the potential for compound growth. Putting the money you earn back into your investment means it, in turn, may earn even more money (or be exposed to additional losses, if the fund earns a negative return). Over time, the power of compounding has the potential to significantly increase the value of your investment. There is no assurance, however, that you'll earn more money if you reinvest your distributions rather than receive them in cash.
The Fund intends to pay out, in the form of distributions to shareholders, a sufficient amount of its income and gains so that the Fund will qualify for treatment as a regulated investment company and generally will not have to pay any federal income or excise tax. The Fund generally intends to distribute any net realized capital gain (whether long-term or short-term gain) at least once a year. Normally, the Fund will declare and pay distributions of net investment income according to the following schedule:
| Declaration and Distribution Schedule | |
| Declarations |
Annually |
| Distributions |
Annually |
The Fund may declare or pay distributions of net investment income more frequently.
Different share classes of the Fund usually pay different net investment income distribution amounts, because each class has different expenses. Each time a distribution is made, the NAV per share of the share class is reduced by the amount of the distribution.
The Fund will automatically reinvest distributions in additional shares of the same share class of the Fund unless you inform us you want to receive your distributions to be paid in cash.
Taxes and Your Investment
Taxation of the Fund: The Fund has elected and intends to qualify and to be eligible for treatment each year as a regulated investment company. A regulated investment company generally is not subject to tax at the fund level on income and gains from investments that are distributed to shareholders. However, the Fund’s failure to qualify and be eligible for treatment as a regulated investment company would result in fund-level taxation, and consequently, a reduction in income available for distribution to you.
Taxation of Fund Shares: Shares of the Fund are only offered to separate accounts of participating insurance companies, Qualified Plans, and certain other eligible persons or plans permitted to hold shares of the Fund pursuant to the applicable U.S. Treasury Regulations without impairing the ability of participating insurance companies to satisfy the diversification requirements of Section 817(h) of the Internal Revenue Code of 1986, as amended. Each participating insurance company, including each participating insurance company that is an affiliate of the Investment Manager, includes in its taxable income any net investment income derived from the investment of assets held in its separate accounts because the insurance company is considered the owner of these assets under federal income tax law. The insurance company may claim certain tax benefits associated with this investment
42
Prospectus 2026
Columbia Variable Portfolio - Commodity Strategy Fund
Distributions and Taxes (continued)
income. These benefits, which may include foreign tax credits (which can reduce the insurance company’s U.S. taxes on foreign source income) and the corporate dividends-received deduction (which is a tax deduction for the insurance company attributable to certain dividends received from the Fund), are not passed on to Contract owners since the affiliated insurance company is the owner of the assets under federal tax law and is taxed on the investment income generated by the assets.
Taxation of Variable Annuity Contracts and Variable Life Insurance Policies: Your Contract may qualify for favorable tax treatment. Please refer to your Contract prospectus for more information about the tax implications of your investment in the Contract. As long as your Contract continues to qualify for such favorable tax treatment, you will not be taxed currently on your investment in the Fund through such Contract, even if the Fund makes distributions to the separate account and/or you change your investment options under the Contract. In order to qualify for such treatment, among other things, the separate accounts of participating insurance companies, which maintain and invest net proceeds from Contracts, must be “adequately diversified.” The Fund intends to operate in such a manner so that a separate account investing only in Fund shares on behalf of a holder of a Contract will be “adequately diversified.” If the Fund does not meet such requirements because its investments are not adequately diversified, your Contract could lose its favorable tax treatment, and income and gain allocable to your Contract could be taxable currently to you. This could also occur if Contract holders are found to have an impermissible level of control over the investments underlying their Contracts. You should consult with the participating insurance company that issued your Contract, plan sponsor, or other eligible investor through which your investment in the Fund is made regarding the U.S. federal income taxation of your investment.
FUNDamentals
Taxes
The information provided above is only a summary of how U.S. federal income taxes may affect your indirect investment in the Fund. It is not intended as a substitute for careful tax planning. Your investment in the Fund may have other tax implications. It does not apply to certain types of investors who may be subject to special rules, including foreign or tax-exempt investors or those holding Fund shares through a tax-advantaged account other than a Contract, such as a 401(k) plan or IRA. Please see the SAI for more detailed tax information. You should consult with your own tax advisor about the particular tax consequences to you of an investment in the Fund, including the effect of any foreign, state and local taxes, and the effect of possible changes in applicable tax laws.
Prospectus 2026
43
Columbia Variable Portfolio - Commodity Strategy Fund
Consolidated Financial Highlights
The financial highlights table is intended to help you understand the Fund’s financial performance for the past five fiscal years or, if shorter, the Fund’s period of operations. Certain information reflects financial results for a single Fund share. Per share net investment income (loss) amounts are calculated based on average shares outstanding during the period. The total return in the table represents the rate that an investor would have earned (or lost) on an investment in the Fund assuming all dividends and distributions had been reinvested. Total return does not reflect any fees and expenses imposed under your Contract and/or Qualified Plan, as applicable; such fees and expenses would reduce the total return for all periods shown. Total return and portfolio turnover are not annualized for periods of less than one year. The ratios of expenses and net investment income are annualized for periods of less than one year. The portfolio turnover rate is calculated without regard to purchase and sales transactions of short-term instruments and certain derivatives, if any. If such transactions were included, the Fund’s portfolio turnover rate may be higher. A zero balance may reflect an amount rounding to less than $0.01 or 0.01%. This information has been audited by PricewaterhouseCoopers LLP, an independent registered public accounting firm, whose report, along with the Fund’s financial statements, is included in the Fund’s Form N-CSR, which is available upon request.
Prospectus 2026
45
Columbia Variable Portfolio - Commodity Strategy Fund
Consolidated Financial Highlights (continued)
| |
Net asset value, beginning of period |
Net investment income (loss) |
Net realized and unrealized gain (loss) |
Increase from payment by affiliate |
Total from investment operations |
Distributions from net investment income |
Total distributions to shareholders |
| Class 1 | |||||||
| Year Ended 12/31/2025 |
$3.88 |
0.15 |
0.42 |
— |
0.57 |
(0.35) |
(0.35) |
| Year Ended 12/31/2024 |
$3.76 |
0.16 |
0.10 |
— |
0.26 |
(0.14) |
(0.14) |
| Year Ended 12/31/2023 |
$5.11 |
0.15 |
(0.44) |
0.00 |
(0.29) |
(1.06) |
(1.06) |
| Year Ended 12/31/2022 |
$5.73 |
0.04 |
1.10 |
— |
1.14 |
(1.76) |
(1.76) |
| Year Ended 12/31/2021 |
$4.33 |
(0.03) |
1.44 |
— |
1.41 |
(0.01) |
(0.01) |
| Class 2 | |||||||
| Year Ended 12/31/2025 |
$3.79 |
0.13 |
0.42 |
— |
0.55 |
(0.34) |
(0.34) |
| Year Ended 12/31/2024 |
$3.67 |
0.15 |
0.10 |
— |
0.25 |
(0.13) |
(0.13) |
| Year Ended 12/31/2023 |
$5.01 |
0.14 |
(0.44) |
0.00 |
(0.30) |
(1.04) |
(1.04) |
| Year Ended 12/31/2022 |
$5.65 |
0.03 |
1.08 |
— |
1.11 |
(1.75) |
(1.75) |
| Year Ended 12/31/2021 |
$4.28 |
(0.04) |
1.41 |
— |
1.37 |
— |
— |
| Notes to Consolidated Financial Highlights | |
| (a) |
In addition to the fees and expenses that the Fund bears directly, the Fund indirectly bears a pro rata share of the fees and expenses of any other funds in which it invests. Such indirect expenses are not included in the Fund's reported expense ratios. |
| (b) |
Total net expenses include the impact of certain fee waivers/expense reimbursements made by the Investment Manager and certain of its affiliates, if applicable. |
| (c) |
The Fund received a payment from an affiliate. Had the Fund not received this payment, the total return would have been lower by 0.01%. |
| (d) |
Ratios include interest on collateral expense. For the periods indicated below, if interest on collateral expense had been excluded, expenses would have been lower by: |
| Class |
12/31/2022 |
12/31/2021 |
| Class 1 |
0.01% |
0.01% |
| Class 2 |
less than 0.01% |
0.01% |
46
Prospectus 2026
Columbia Variable Portfolio - Commodity Strategy Fund
Consolidated Financial Highlights (continued)
| |
Net asset value, end of period |
Total return |
Total gross expense ratio to average net assets(a) |
Total net expense ratio to average net assets(a),(b) |
Net investment income (loss) ratio to average net assets |
Portfolio turnover |
Net assets, end of period (000's) |
| Class 1 | |||||||
| Year Ended 12/31/2025 |
$4.10 |
15.48% |
0.82% |
0.75% |
3.63% |
92% |
$60,336 |
| Year Ended 12/31/2024 |
$3.88 |
7.24% |
0.81% |
0.76% |
4.15% |
115% |
$61,730 |
| Year Ended 12/31/2023 |
$3.76 |
(6.82%)(c) |
0.78% |
0.75% |
3.47% |
111% |
$73,029 |
| Year Ended 12/31/2022 |
$5.11 |
19.09% |
0.75%(d) |
0.74%(d) |
0.58% |
93% |
$87,123 |
| Year Ended 12/31/2021 |
$5.73 |
32.63% |
0.76%(d) |
0.76%(d) |
(0.56%) |
101% |
$102,522 |
| Class 2 | |||||||
| Year Ended 12/31/2025 |
$4.00 |
15.30% |
1.07% |
1.00% |
3.38% |
92% |
$33,343 |
| Year Ended 12/31/2024 |
$3.79 |
7.09% |
1.06% |
1.01% |
3.89% |
115% |
$30,169 |
| Year Ended 12/31/2023 |
$3.67 |
(7.14%)(c) |
1.03% |
1.00% |
3.17% |
111% |
$31,596 |
| Year Ended 12/31/2022 |
$5.01 |
18.70% |
1.01%(d) |
0.99%(d) |
0.48% |
93% |
$50,602 |
| Year Ended 12/31/2021 |
$5.65 |
32.01% |
1.01%(d) |
1.01%(d) |
(0.80%) |
101% |
$28,996 |
Prospectus 2026
47
Columbia Variable Portfolio – Commodity Strategy Fund

For More Information
The Fund is generally available only to owners of Contracts issued by participating insurance companies and participants in Qualified Plans. Please refer to your Contract prospectus or Qualified Plan disclosure documents for information about how to buy, sell and transfer shares of the Fund.
Additional Information About the Fund
Additional information about the Fund’s investments is available in the Fund’s annual and semiannual reports to shareholders and in Form N-CSR. In the Fund’s annual report, you will find a discussion of the market conditions and investment strategies that significantly affected the Fund’s performance during its last fiscal year. In the Fund’s Form N-CSR, you will find the Fund’s annual and semiannual financial statements. The SAI also provides additional information about the Fund and its policies. The SAI, which has been filed with the SEC, is legally part of this prospectus (incorporated by reference). To obtain these documents free of charge, to request other information about the Fund and to make shareholder inquiries, please contact the Fund as follows:
By Mail: Columbia Management Investment Services Corp.
P.O. Box 219104
Kansas City, MO 64121-9104
P.O. Box 219104
Kansas City, MO 64121-9104
By Telephone: 800.345.6611
Online: columbiathreadneedleus.com
Reports and other information about the Fund are also available in the EDGAR Database on the SEC’s website at http://www.sec.gov. You can receive copies of this information, for a duplication fee, by electronic request at the following e-mail address: publicinfo@sec.gov.
The investment company registration number of Columbia Funds Variable Series Trust II, of which the Fund is a series, is 811-22127.
Columbia Threadneedle Investments (Columbia Threadneedle) is the global brand name of the Columbia and Threadneedle group of companies.
The Fund is distributed by Columbia Management Investment Distributors, Inc., 290 Congress Street, Boston, MA 02210.
The Fund is distributed by Columbia Management Investment Distributors, Inc., 290 Congress Street, Boston, MA 02210.
© 2026 Columbia Threadneedle. All rights reserved.
PRO7001_12_E01_(05/26)

Columbia Variable Portfolio – Select Corporate Income Fund
(formerly Columbia Variable Portfolio – Corporate Bond Fund)
Prospectus
May 1, 2026
As with all mutual funds, the Securities and Exchange Commission (SEC) has not approved or disapproved these securities or passed upon the adequacy of this prospectus. Any representation to the contrary is a criminal offense.

Columbia Variable Portfolio – Select Corporate Income Fund
Table of Contents
| 3 | |
| 3 | |
| 3 | |
| 4 | |
| 4 | |
| 8 | |
| 9 | |
| 9 | |
| 9 | |
| 10 | |
| 11 | |
| 11 | |
| 11 | |
| 11 | |
| 17 | |
| 20 | |
| 22 | |
| 23 | |
| 24 | |
| 24 | |
| 24 | |
| 25 | |
| 27 | |
| 32 | |
| 32 | |
| 32 | |
| 35 |
2
Prospectus 2026
Columbia Variable Portfolio – Select Corporate Income Fund
Summary of the Fund
Investment Objective
Columbia Variable Portfolio – Select Corporate Income Fund (the Fund) seeks to provide shareholders with high total return through income and growth of capital.
Fees and Expenses of the Fund
This table describes the fees and expenses that you may pay as an investor in the Fund. The table does not reflect any fees or expenses imposed by your Contract or Qualified Plan, which are disclosed in your separate Contract prospectus or Qualified Plan disclosure documents. If the additional fees or expenses were reflected, the expenses set forth below would be higher.
| Annual Fund Operating Expenses (expenses that you pay each year as a percentage of the value of your investment) | |||
| |
Class 1 |
Class 2 |
Class 3 |
| Management fees(a) |
% |
% |
% |
| Distribution and/or service (12b-1) fees |
% |
% |
% |
| Other expenses |
% |
% |
% |
| Total annual Fund operating expenses(b) |
% |
% |
% |
| Less: Fee waivers and/or expense reimbursements(c) |
( %) |
( %) |
( %) |
| Total annual Fund operating expenses after fee waivers and/or expense reimbursements |
% |
% |
% |
(a)
(b)
(c)
Example
The following example is intended to help you compare the cost of investing in the Fund with the cost of investing in other mutual funds. The example illustrates the hypothetical expenses that you would incur over the time periods indicated, and assumes that:
■
you invest $10,000 in the applicable class of Fund shares for the periods indicated,
■
your investment has a 5% return each year, and
■
the Fund’s total annual operating expenses remain the same as shown in the Annual Fund Operating Expenses table above.
The example does not reflect any fees and expenses that apply to your Contract or Qualified Plan. Inclusion of these charges would increase expenses for all periods shown.
Since the waivers and/or reimbursements shown in the Annual Fund Operating Expenses table above expire as indicated in the preceding table, they are only reflected in the 1 year example and the first year of the other examples. Although your actual costs may be higher or lower, based on the assumptions listed above, your costs would be:
| |
1 year |
3 years |
5 years |
10 years |
| Class 1 (whether or not shares are redeemed) |
$ |
$ |
$ |
$ |
| Class 2 (whether or not shares are redeemed) |
$ |
$ |
$ |
$ |
Prospectus 2026
3
Columbia Variable Portfolio – Select Corporate Income Fund
Summary of the Fund (continued)
| |
1 year |
3 years |
5 years |
10 years |
| Class 3 (whether or not shares are redeemed) |
$ |
$ |
$ |
$ |
Portfolio Turnover
The Fund may pay transaction costs, such as commissions, when it buys and sells securities (or “turns over” its portfolio). A higher portfolio turnover rate may indicate higher transaction costs. These costs, which are not reflected in annual fund operating expenses or in the example, affect the Fund’s performance. During the most recent fiscal year, the Fund’s portfolio turnover rate was 94 % of the average value of its portfolio.
Principal Investment Strategies
Under normal circumstances, the Fund invests at least 80% of its net assets (plus the amount of any borrowings for investment purposes) in corporate bonds. Corporate bonds are debt instruments or securities issued by corporations or other non-government entities. The Fund expects to invest primarily in investment grade securities. The Fund may invest up to 15% of its total assets in debt instruments that, at the time of purchase, are rated below investment grade or are unrated but determined to be of comparable quality (commonly referred to as “high-yield” investments or “junk” bonds). Under normal circumstances, the Fund’s average effective duration will be between three and ten years.
The Fund may purchase or sell securities on a when-issued, delayed delivery or forward commitment basis.
The Fund may invest in privately placed and other securities or instruments that are purchased and sold pursuant to Rule 144A or other exemptions under the Securities Act of 1933, as amended, subject to certain regulatory restrictions.
The Fund may invest in U.S. Government obligations, asset-backed securities and mortgage-backed securities. The Fund may at times emphasize one or more sectors in selecting its investments, including the financials sector.
Principal Risks
An investment in the Fund involves risks, including Interest Rate Risk, Credit Risk, Market Risk, and Changing Distribution Level Risk, among others. Descriptions of these and other principal risks of investing in the Fund are provided below. There is no assurance that the Fund will achieve its investment objective and you may lose money. The value of the Fund’s holdings may decline, and the Fund’s net asset value (NAV) and share price may go down. An investment in the Fund is not a bank deposit and is not insured or guaranteed by the Federal Deposit Insurance Corporation or any other government agency. The significance of any specific risk to an investment in the Fund will vary over time depending on the composition of the Fund's portfolio, market conditions, and other factors. You should read all of the risk information below carefully, because any one or more of these risks may result in losses to the Fund.
Active Management Risk. Due to its active management, the Fund could underperform its benchmark index and/or other funds with similar investment objectives and/or strategies.
Changing Distribution Level Risk. The Fund normally expects to receive income which may include interest, dividends and/or capital gains, depending upon its investments. The distribution amounts paid by the Fund will vary and generally depend on the amount of income the Fund earns (less expenses) on its portfolio holdings, and capital gains or losses it recognizes. A decline in the Fund’s income or net capital gains arising from its investments may reduce its distribution level.
Counterparty Risk. Counterparty risk is the risk that a counterparty to a transaction in a financial instrument held by the Fund or by a special purpose or structured vehicle invested in by the Fund may become insolvent or otherwise fail to perform its obligations. As a result, the Fund may obtain no or limited recovery of its investment, and any recovery may be significantly delayed.
Credit Risk. Credit risk is the risk that the value of debt instruments may decline if the issuer thereof defaults or otherwise becomes unable or unwilling, or is perceived to be unable or unwilling, to honor its financial obligations, such as making payments to the Fund when due. Credit rating agencies, such as S&P Global Ratings, Moody’s
4
Prospectus 2026
Columbia Variable Portfolio – Select Corporate Income Fund
Summary of the Fund (continued)
Investors Service, Inc. (Moody’s Ratings), Fitch Ratings, Inc. (Fitch), Morningstar DBRS (DBRS) and Kroll Bond Rating Agency, LLC (KBRA), assign credit ratings to certain debt instruments to indicate their credit risk. A rating downgrade by such agencies can negatively impact the value of such instruments. Lower-rated or unrated instruments held by the Fund may present increased credit risk as compared to higher-rated instruments. Non-investment grade debt instruments may be subject to greater price fluctuations and are more likely to experience a default than investment grade debt instruments and therefore may expose the Fund to increased credit risk. If the Fund purchases unrated instruments, or if the ratings of instruments held by the Fund are lowered after purchase, the Fund will depend on analysis of credit risk more heavily than usual.
Fixed Income Instruments Risk. The Fund is subject to the general risks and considerations associated with investing in debt securities, including the risk that issuers will fail to make timely payments of principal or interest or default altogether. Lower-rated securities in which the Fund may invest may be more volatile and may decline more in price in response to negative issuer developments or general economic news than higher rated securities. In addition, as interest rates rise, the Fund’s investments typically will lose value.
Forward Commitments on Mortgage-Backed Securities (including Dollar Rolls) Risk. When purchasing mortgage-backed securities in the “to be announced” (TBA) market (MBS TBAs), the seller agrees to deliver mortgage-backed securities for an agreed upon price on an agreed upon date, but may make no guarantee as to the specific securities to be delivered. In lieu of taking delivery of mortgage-backed securities, the Fund could enter into dollar rolls, which are transactions in which the Fund sells securities to a counterparty and simultaneously agrees to purchase those or similar securities in the future at a predetermined price. Dollar rolls involve the risk that the market value of the securities the Fund is obligated to repurchase may decline below the repurchase price, or that the counterparty may default on its obligations. These transactions may also increase the Fund’s portfolio turnover rate. If the Fund reinvests the proceeds of the security sold, the Fund will also be subject to the risk that the investments purchased with such proceeds will decline in value (a form of leverage risk). MBS TBAs and dollar rolls are subject to the risk that the counterparty to the transaction may not perform or be unable to perform in accordance with the terms of the instrument.
High-Yield Investments Risk. Securities and other debt instruments held by the Fund that are rated below investment grade (commonly called “high-yield” or “junk” bonds) and unrated debt instruments of comparable quality expose the Fund to a greater risk of loss of principal and income than a fund that invests solely or primarily in investment grade debt instruments. In addition, these investments have greater price fluctuations, are less liquid and are more likely to experience a default than higher-rated debt instruments. High-yield debt instruments are considered to be predominantly speculative with respect to the issuer’s capacity to pay interest and repay principal.
Interest Rate Risk. Interest rate risk is the risk of losses attributable to changes in interest rates. In general, if interest rates rise, the values of debt instruments tend to fall, and if interest rates fall, the values of debt instruments tend to rise. Changes in the value of a debt instrument usually will not affect the amount of income the Fund receives from it but will generally affect the value of your investment in the Fund. Changes in interest rates may also affect the liquidity of the Fund’s investments in debt instruments. In general, the longer the maturity or duration of a debt instrument, the greater its sensitivity to changes in interest rates. For example, a three-year duration means a bond is expected to decrease in value by 3% if interest rates rise 1% and increase in value by 3% if interest rates fall 1%. Interest rate declines also may increase prepayments of debt obligations, which, in turn, would increase prepayment risk. The Fund is subject to the risk that the income generated by its investments may not keep pace with inflation. Actions by governments and central banking authorities can result in increases or decreases in interest rates. Higher periods of inflation could lead such authorities to raise interest rates. Such actions may negatively affect the value of debt instruments held by the Fund, resulting in a negative impact on the Fund's performance and NAV. Any interest rate increases could cause the value of the Fund’s investments in debt instruments to decrease. Rising interest rates may prompt redemptions from the Fund, which may force the Fund to sell investments at a time when it is not advantageous to do so, which could result in losses.
Issuer Risk. An issuer in which the Fund invests or to which it has exposure may perform poorly or below expectations, and the value of its securities may therefore decline, which may negatively affect the Fund’s performance. Underperformance of an issuer may be caused by poor management decisions, competitive pressures,
Prospectus 2026
5
Columbia Variable Portfolio – Select Corporate Income Fund
Summary of the Fund (continued)
breakthroughs in technology, reliance on suppliers, labor problems or shortages, corporate restructurings, fraudulent disclosures, natural disasters, military confrontations and actions, war, other conflicts, terrorism, disease/virus outbreaks, epidemics or other events, conditions and factors which may impair the value of your investment in the Fund.
Liquidity Risk. Liquidity risk is the risk associated with any event, circumstance, or characteristic of an investment or market that negatively impacts the Fund’s ability to sell, or realize the proceeds from the sale of, an investment at a desirable time or price. Liquidity risk may arise because of, for example, a lack of marketability of the investment, which means that when seeking to sell its portfolio investments, the Fund could find that selling is more difficult than anticipated, especially during times of high market volatility. Decreases in the number of financial institutions, including banks and broker-dealers, willing to make markets (match up sellers and buyers) in the Fund’s investments or decreases in their capacity or willingness to trade such investments may increase the Fund’s exposure to this risk. The debt market has experienced considerable growth, and financial institutions making markets in instruments purchased and sold by the Fund (e.g., bond dealers) have been subject to increased regulation. The impact of that growth and regulation on the ability and willingness of financial institutions to engage in trading or “making a market” in such instruments remains unsettled. Certain types of investments, such as lower-rated securities or those that are purchased and sold in over-the-counter markets, may be especially subject to liquidity risk. Securities or other assets in which the Fund invests may be traded in the over-the-counter market rather than on an exchange and therefore may be more difficult to purchase or sell at a fair price, which may have a negative impact on the Fund’s performance. Market participants attempting to sell the same or a similar instrument at the same time as the Fund could exacerbate the Fund’s exposure to liquidity risk. The Fund may have to accept a lower selling price for the holding, sell other liquid or more liquid investments that it might otherwise prefer to hold (thereby increasing the proportion of the Fund’s investments in less liquid or illiquid securities), or forego another more appealing investment opportunity. The liquidity of Fund investments may change significantly over time and certain investments that were liquid when purchased by the Fund may later become illiquid, particularly in times of overall economic distress. Changing regulatory, market or other conditions or environments (for example, the interest rate or credit environments) may also adversely affect the liquidity and the price of the Fund's investments. Judgment plays a larger role in valuing illiquid or less liquid investments as compared to valuing liquid or more liquid investments. Price volatility may be higher for illiquid or less liquid investments as a result of, for example, the relatively less frequent pricing of such securities (as compared to liquid or more liquid investments). Generally, the less liquid the market at the time the Fund sells a portfolio investment, the greater the risk of loss or decline of value to the Fund. Overall market liquidity and other factors can lead to an increase in redemptions, which may negatively impact Fund performance and NAV, including, for example, if the Fund is forced to sell investments in a down market. Foreign securities can present enhanced liquidity risks, including as a result of less developed custody, settlement or other practices of foreign markets.
Market Risk. The Fund may incur losses due to declines in the value of one or more securities in which it invests. These declines may be due to factors affecting a particular issuer, or the result of, among other things, political, regulatory, market, economic or social developments affecting the relevant market(s) more generally. In addition, turbulence in financial markets and reduced liquidity in equity, credit and/or fixed income markets may negatively affect many issuers, which could adversely affect the Fund’s ability to price or value hard-to-value assets in thinly traded and closed markets and could cause significant redemptions and operational challenges. Global economies and financial markets are increasingly interconnected, and conditions and events in one country, region or financial market may adversely impact issuers in a different country, region or financial market. These risks may be magnified if certain events or developments adversely interrupt the global supply chain; in these and other circumstances, such risks might affect companies worldwide. As a result, local, regional or global events such as terrorism, war, other conflicts, natural disasters, disease/virus outbreaks and epidemics or other public health issues, recessions, depressions or other events – or the potential for such events – could have a significant negative impact on global economic and market conditions.
Mortgage- and Other Asset-Backed Securities Risk. The value of any mortgage-backed and other asset-backed securities including collateralized debt obligations and collateralized loan obligations, if any, held by the Fund may be affected by, among other things, changes or perceived changes in: interest rates; factors concerning the interests in
6
Prospectus 2026
Columbia Variable Portfolio – Select Corporate Income Fund
Summary of the Fund (continued)
and structure of the issuer or the originator of the mortgages or other assets; the creditworthiness of the entities that provide any supporting letters of credit, surety bonds or other credit enhancements; or the market's assessment of the quality of underlying assets. Payment of principal and interest on some mortgage-backed securities (but not the market value of the securities themselves) may be guaranteed by the full faith and credit of a particular U.S. Government agency, authority, enterprise or instrumentality, and some, but not all, are also insured or guaranteed by the U.S. Government. Mortgage-backed securities issued by non-governmental issuers (such as commercial banks, savings and loan institutions, private mortgage insurance companies, mortgage bankers and other secondary market issuers) may entail greater risk than obligations guaranteed by the U.S. Government. Mortgage- and other asset-backed securities are subject to liquidity risk and prepayment risk. A decline or flattening of housing values may cause delinquencies in mortgages underlying mortgage-backed securities and thereby adversely affect the ability of the mortgage-backed securities issuer to make principal and/or interest payments to mortgage-backed securities holders, including the Fund. Rising or high interest rates tend to extend the duration of mortgage- and other asset-backed securities, making their prices more volatile and more sensitive to changes in interest rates.
Prepayment and Extension Risk. Prepayment and extension risk is the risk that a bond or other security or investment might, in the case of prepayment risk, be called or otherwise converted, prepaid or redeemed before maturity and, in the case of extension risk, that the investment might not be called as expected. In the case of prepayment risk, if the investment is converted, prepaid or redeemed before maturity, the portfolio managers may not be able to invest the proceeds in other investments providing as high a level of income, resulting in a reduced yield to the Fund. As interest rates decrease or spreads narrow on such investments, the likelihood of prepayment increases. Conversely, extension risk is the risk that an unexpected rise in interest rates will extend the life of an investment beyond the prepayment time. If the Fund’s investments are locked in at a lower interest rate for a longer period of time, the portfolio managers may be unable to capitalize on investments with higher interest rates or wider spreads.
Reinvestment Risk. Reinvestment risk arises when the Fund is unable to reinvest income or principal at the same or at least the same return it is currently earning.
Rule 144A and Other Exempted Securities Risk. The Fund may invest in privately placed and other securities or instruments exempt from SEC registration (collectively “private placements”), subject to certain regulatory restrictions. In the U.S. market, private placements are typically sold only to qualified institutional buyers, or qualified purchasers, as applicable. An insufficient number of buyers interested in purchasing private placements at a particular time could adversely affect the marketability of such investments and the Fund might be unable to dispose of them promptly or at reasonable prices, subjecting the Fund to liquidity risk. The Fund’s holdings of private placements may increase the level of Fund illiquidity if eligible buyers are unable or unwilling to purchase them at a particular time. Issuers of Rule 144A eligible securities are required to furnish information to potential investors upon request. However, the required disclosure is much less extensive than that required of public companies and is not publicly available since the offering information is not filed with the SEC. Further, issuers of Rule 144A eligible securities can require recipients of the offering information (such as the Fund) to agree contractually to keep the information confidential, which could also adversely affect the Fund’s ability to dispose of the security.
Sector Risk. At times, the Fund may have a significant portion of its assets invested in securities of companies conducting business in a related group of industries within one or more economic sectors, including the financials sector. Companies in the same sector may be similarly affected by economic, regulatory, political or market events or conditions, which may make the Fund vulnerable to unfavorable developments in that group of industries or economic sector.
■
Financials Sector. The Fund is vulnerable to the particular risks that may affect companies in the financials sector. Companies in the financials sector are subject to certain risks, including the risk of regulatory change, decreased liquidity in credit markets and unstable interest rates. Such companies may have concentrated portfolios, such as a high level of loans to one or more industries or sectors, which makes them vulnerable to economic conditions that affect such industries or sectors. Performance of such companies may be affected by competitive pressures and exposure to investments, agreements and counterparties, including credit products that, under certain circumstances, may lead to losses (e.g., subprime loans). Companies in the financials sector are subject to
Prospectus 2026
7
Columbia Variable Portfolio – Select Corporate Income Fund
Summary of the Fund (continued)
extensive governmental regulation that may limit the amount and types of loans and other financial commitments they can make, and the interest rates and fees they may charge. In addition, profitability of such companies is largely dependent upon the availability and the cost of capital.
U.S. Government Obligations Risk. While U.S. Treasury obligations are backed by the “full faith and credit” of the U.S. Government, such securities are nonetheless subject to credit risk (i.e., the risk that the U.S. Government may be, or be perceived to be, unable or unwilling to honor its financial obligations, such as making payments). Securities issued or guaranteed by federal agencies or authorities and U.S. Government-sponsored instrumentalities or enterprises may or may not be backed by the full faith and credit of the U.S. Government.
Unrated Securities Risk. The Fund may purchase unrated securities which are not rated by a rating agency. Unrated securities may be less liquid than comparable rated securities and involve the risk that the Investment Manager may not accurately evaluate the security’s comparative credit rating. Analysis of creditworthiness of issuers of high yield securities may be more complex than for issuers of higher-quality debt securities. To the extent that the Fund purchases unrated securities, the Fund’s success in achieving its investment objective may depend more heavily on the Investment Manager’s creditworthiness analysis than if the Fund invested exclusively in rated securities.
When-Issued, Delayed Settlement and Forward Commitment Transactions, Including U.S. Treasury Floating Rate Notes Risk. When-issued, delayed delivery, and forward commitment transactions generally involve the purchase of a security with payment and delivery at some time in the future – i.e., beyond normal settlement. The Fund does not earn interest on such securities until settlement and bears the risk of market value fluctuations in between the purchase and settlement dates. Such transactions include floating rate obligations issued by the U.S. Treasury. Securities with floating or variable interest rates can be less sensitive to interest rate changes than securities with fixed interest rates, but may decline in value if their interest rates do not rise as much, or as quickly, as interest rates in general, and generally carry lower yields than fixed notes of the same maturity.
Performance Information
Except for differences in annual returns resulting from differences in expenses (where applicable), the share classes of the Fund would have substantially similar annual returns because all share classes of the Fund invest in the same portfolio of securities.
The returns shown do not reflect any fees and expenses imposed under your Contract or Qualified Plan and would be lower if they did.
The Fund’s performance prior to May 1, 2025 reflects returns achieved pursuant to different principal investment strategies. If the Fund’s current strategies had been in place for the prior periods, results shown may have been different.
8
Prospectus 2026
Columbia Variable Portfolio – Select Corporate Income Fund
Summary of the Fund (continued)
| Year by Year Total Return (%) as of December 31 Each Year |
Best and Worst Quarterly Returns During the Period Shown in the Bar Chart | ||
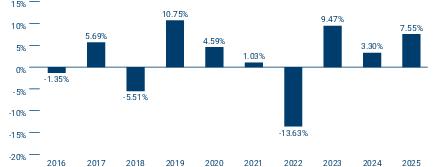 |
|
|
|
| |
|
- | |
Average Annual Total Returns (for periods ended December 31, 2025)
| |
Share Class Inception Date |
1 Year |
5 Years |
10 Years |
| Class 1 |
|
|
|
|
| Class 2 |
|
|
|
|
| Class 3 |
|
|
|
|
| Bloomberg U.S. Corporate Bond Index (reflects no deductions for fees, expenses or taxes) |
|
|
- |
|
| Bloomberg U.S. Aggregate Bond Index (reflects no deductions for fees, expenses or taxes) |
|
|
- |
|
Fund Management
Investment Manager: Columbia Management Investment Advisers, LLC
| Portfolio Management |
Title |
Role with Fund |
Managed Fund Since |
| Tom Murphy, CFA |
Vice President, Senior Portfolio Manager and Head of Investment Grade Credit |
Lead Portfolio Manager |
2025 |
| Royce D. Wilson, CFA |
Senior Portfolio Manager |
Portfolio Manager |
2025 |
| John Dawson, CFA |
Senior Portfolio Manager |
Portfolio Manager |
2025 |
Purchase and Sale of Fund Shares
The Fund is available for purchase through Contracts offered by the separate accounts of participating insurance companies or Qualified Plans or by other eligible investors authorized by Columbia Management Investment Distributors, Inc. (the Distributor). Shares of the Fund may not be purchased or sold by individual owners of Contracts or Qualified Plans. If you are a Contract holder or Qualified Plan participant, please refer to your separate Contract prospectus or Qualified Plan disclosure documents for information about minimum investment requirements and how to purchase and redeem shares of the Fund on days the Fund is open for business.
Tax Information
The Fund normally distributes its net investment income and net realized capital gains, if any, to its shareholders, which are generally the participating insurance companies and Qualified Plans investing in the Fund through separate accounts. These distributions may not be taxable to you as the holder of a Contract or a participant in a Qualified Plan. Please consult the prospectus or other information provided to you by your participating insurance company and/or Qualified Plan regarding the U.S. federal income taxation of your contract, policy and/or plan.
Prospectus 2026
9
Columbia Variable Portfolio – Select Corporate Income Fund
Summary of the Fund (continued)
Payments to Broker-Dealers and Other Financial Intermediaries
If you make allocations to the Fund, the Fund, its Distributor or other related companies may pay participating insurance companies or other financial intermediaries for the allocation (sale) of Fund shares and related services in connection with such allocations to the Fund. These payments may create a conflict of interest by influencing the participating insurance company, other financial intermediary or your salesperson to recommend an allocation to the Fund over another fund or other investment option. Ask your financial advisor or salesperson or visit your financial intermediary’s website for more information.
10
Prospectus 2026
Columbia Variable Portfolio – Select Corporate Income Fund
More Information About the Fund
Investment Objective
Columbia Variable Portfolio – Select Corporate Income Fund (the Fund) seeks to provide shareholders with high total return through income and growth of capital. Only shareholders can change the Fund’s investment objective. Because any investment involves risk, there is no assurance the Fund’s investment objective will be achieved.
Principal Investment Strategies
Under normal circumstances, the Fund invests at least 80% of its net assets (plus the amount of any borrowings for investment purposes) in corporate bonds. Corporate bonds are debt instruments or securities issued by corporations or other non-government entities. The Fund expects to invest primarily in investment grade securities. The Fund may invest up to 15% of its total assets in debt instruments that, at the time of purchase, are rated below investment grade or are unrated but determined to be of comparable quality (commonly referred to as “high-yield” investments or “junk” bonds). Under normal circumstances, the Fund’s average effective duration will be between three and ten years. Duration measures the sensitivity of bond prices to changes in interest rates. The longer the duration of a bond, the more sensitive it will be to changes in interest rates. For example, a three-year duration means a bond is expected to decrease in value by 3% if interest rates rise 1% and increase in value by 3% if interest rates fall 1%.
The Fund may purchase or sell securities on a when-issued, delayed delivery or forward commitment basis.
The Fund may invest in privately placed and other securities or instruments that are purchased and sold pursuant to Rule 144A or other exemptions under the Securities Act of 1933, as amended, subject to certain regulatory restrictions.
The Fund may invest in U.S. Government obligations, asset-backed securities and mortgage-backed securities. The Fund may at times emphasize one or more sectors in selecting its investments, including the financials sector.
Columbia Management Investment Advisers, LLC (the Investment Manager) evaluates a number of factors in identifying investment opportunities and constructing the Fund’s portfolio, including local, national and global economic conditions, market conditions, interest rate movements and other relevant factors in allocating the Fund’s assets among issuers, securities, maturities, credit qualities, and industry sectors, while also taking into consideration the creditworthiness of the issuer of the security and the various features of the security, such as its interest rate, yield, maturity, any call features and value relative to other securities. The Investment Manager, in connection with selecting individual investments for the Fund, evaluates a security based on its potential to generate income and/or capital appreciation. The Investment Manager emphasizes an independent, proprietary credit research and selection process of issuers of debt securities over other factors such as interest rate and duration positioning.
The Investment Manager may sell a security if the Investment Manager believes that there is deterioration in the issuer’s financial circumstances; that other investments are more attractive; if there is deterioration in a security’s credit rating; or for other reasons.
The Fund’s investment policy with respect to 80% of its net assets may be changed by the Fund’s Board of Trustees without shareholder approval as long as shareholders are given 60 days’ advance written notice of the change.
Principal Risks
An investment in the Fund involves risks, including Interest Rate Risk, Credit Risk, Market Risk, and Changing Distribution Level Risk, among others. Descriptions of these and other principal risks of investing in the Fund are provided below. There is no assurance that the Fund will achieve its investment objective and you may lose money. The value of the Fund’s holdings may decline, and the Fund’s net asset value (NAV) and share price may go down. An investment in the Fund is not a bank deposit and is not insured or guaranteed by the Federal Deposit Insurance Corporation or any other government agency. The significance of any specific risk to an investment in the Fund will vary over time depending on the composition of the Fund's portfolio, market conditions, and other factors. You should read all of the risk information below carefully, because any one or more of these risks may result in losses to the Fund.
Prospectus 2026
11
Columbia Variable Portfolio – Select Corporate Income Fund
More Information About the Fund (continued)
Active Management Risk. The Fund is actively managed and its performance therefore will reflect, in part, the ability of the portfolio managers to make investment decisions that seek to achieve the Fund’s investment objective. Due to its active management, the Fund could underperform its benchmark index and/or other funds with similar investment objectives and/or strategies.
Changing Distribution Level Risk. The Fund normally expects to receive income which may include interest, dividends and/or capital gains, depending upon its investments. The distribution amounts paid by the Fund will vary and generally depend on the amount of income the Fund earns (less expenses) on its portfolio holdings, and capital gains or losses it recognizes. A decline in the Fund’s income or net capital gains arising from its investments may reduce its distribution level.
Counterparty Risk. The risk exists that a counterparty to a transaction in a financial instrument held by the Fund or by a special purpose or structured vehicle in which the Fund invests may become insolvent or otherwise fail to perform its obligations, including making payments to the Fund, due to financial difficulties. The Fund may obtain no or limited recovery in a bankruptcy or other reorganizational proceedings, and any recovery may be significantly delayed. Transactions that the Fund enters into may involve counterparties in the financials sector and, as a result, events affecting the financials sector may cause the Fund’s NAV to fluctuate.
Credit Risk. Credit risk is the risk that the value of debt instruments may decline if the issuer thereof defaults or otherwise becomes unable or unwilling, or is perceived to be unable or unwilling, to honor its financial obligations, such as making payments to the Fund when due. Various factors could affect the actual or perceived willingness or ability of the issuer to make timely interest or principal payments, including changes in the financial condition of the issuer or in general economic conditions. Credit rating agencies, such as S&P Global Ratings, Moody’s Ratings, Fitch, DBRS and KBRA, assign credit ratings to certain debt instruments to indicate their credit risk. A rating downgrade by such agencies can negatively impact the value of such instruments. Lower-rated or unrated instruments held by the Fund may present increased credit risk as compared to higher-rated instruments. Non-investment grade debt instruments may be subject to greater price fluctuations and are more likely to experience a default than investment grade debt instruments and therefore may expose the Fund to increased credit risk. If the Fund purchases unrated instruments, or if the ratings of instruments held by the Fund are lowered after purchase, the Fund will depend on analysis of credit risk more heavily than usual.
Fixed Income Instruments Risk. The Fund is subject to the general risks and considerations associated with investing in debt securities, including the risk that issuers will fail to make timely payments of principal or interest or default altogether. Typically, shorter-term bonds are less volatile than longer-term bonds; however, longer-term bonds typically offer higher yields and more stable interest income than shorter-term bonds due to their longer term and extended fixed payment schedule. Lower-rated securities in which the Fund may invest may be more volatile and may decline more in price in response to negative issuer developments or general economic news than higher rated securities. In addition, as interest rates rise, the Fund’s investments typically will lose value.
Forward Commitments on Mortgage-Backed Securities (including Dollar Rolls) Risk. When purchasing mortgage-backed securities in the “to be announced” (TBA) market (MBS TBAs), the seller agrees to deliver mortgage-backed securities for an agreed upon price on an agreed upon date, but may make no guarantee as to the specific securities to be delivered. In lieu of taking delivery of mortgage-backed securities, the Fund could enter into dollar rolls, which are transactions in which the Fund sells securities to a counterparty and simultaneously agrees to purchase those or similar securities in the future at a predetermined price. Dollar rolls involve the risk that the market value of the securities the Fund is obligated to repurchase may decline below the repurchase price, or that the counterparty may default on its obligations. These transactions may also increase the Fund’s portfolio turnover rate. If the Fund reinvests the proceeds of the security sold, the Fund will also be subject to the risk that the investments purchased with such proceeds will decline in value (a form of leverage risk). MBS TBAs and dollar rolls are subject to the risk that the counterparty to the transaction may not perform or be unable to perform in accordance with the terms of the instrument.
High-Yield Investments Risk. Securities and other debt instruments held by the Fund that are rated below investment grade (commonly called “high-yield” or “junk” bonds) and unrated debt instruments of comparable quality tend to be more sensitive to credit risk than higher-rated debt instruments and may experience greater price
12
Prospectus 2026
Columbia Variable Portfolio – Select Corporate Income Fund
More Information About the Fund (continued)
fluctuations in response to perceived changes in the ability of the issuing entity or obligor to pay interest and principal when due than to changes in interest rates. These investments are generally more likely to experience a default than higher-rated debt instruments. High-yield debt instruments are considered to be predominantly speculative with respect to the issuer’s capacity to pay interest and repay principal. These debt instruments typically pay a premium – a higher interest rate or yield – because of the increased risk of loss, including default. High-yield debt instruments may require a greater degree of judgment to establish a price, may be difficult to sell at the time and price the Fund desires, may carry high transaction costs, and also are generally less liquid than higher-rated debt instruments. The ratings provided by third party rating agencies are based on analyses by these ratings agencies of the credit quality of the debt instruments and may not take into account every risk related to whether interest or principal will be timely repaid. In adverse economic and other circumstances, issuers of lower-rated debt instruments are more likely to have difficulty making principal and interest payments than issuers of higher-rated debt instruments.
Interest Rate Risk. Interest rate risk is the risk of losses attributable to changes in interest rates. In general, if interest rates rise, the values of debt instruments tend to fall, and if interest rates fall, the values of debt instruments tend to rise. Changes in the value of a debt instrument usually will not affect the amount of income the Fund receives from it but will generally affect the value of your investment in the Fund. Changes in interest rates may also affect the liquidity of the Fund’s investments in debt instruments. In general, the longer the maturity or duration of a debt instrument, the greater its sensitivity to changes in interest rates. For example, a three-year duration means a bond is expected to decrease in value by 3% if interest rates rise 1% and increase in value by 3% if interest rates fall 1%. Interest rate declines also may increase prepayments of debt obligations, which, in turn, would increase prepayment risk (the risk that the Fund will have to reinvest the money received in securities that have lower yields). The Fund is subject to the risk that the income generated by its investments may not keep pace with inflation. Actions by governments and central banking authorities can result in increases or decreases in interest rates. Higher periods of inflation could lead such authorities to raise interest rates. Such actions may negatively affect the value of debt instruments held by the Fund, resulting in a negative impact on the Fund's performance and NAV. Any interest rate increases could cause the value of the Fund’s investments in debt instruments to decrease. Rising interest rates may prompt redemptions from the Fund, which may force the Fund to sell investments at a time when it is not advantageous to do so, which could result in losses.
Issuer Risk. An issuer in which the Fund invests or to which it has exposure may perform poorly or below expectations, and the value of its securities may therefore decline, which may negatively affect the Fund’s performance. Underperformance of an issuer may be caused by poor management decisions, competitive pressures, breakthroughs in technology, reliance on suppliers, labor problems or shortages, corporate restructurings, fraudulent disclosures, natural disasters, military confrontations and actions, war, other conflicts, terrorism, disease/virus outbreaks, epidemics or other events, conditions and factors which may impair the value of your investment in the Fund.
Liquidity Risk. Liquidity risk is the risk associated with any event, circumstance, or characteristic of an investment or market that negatively impacts the Fund’s ability to sell, or realize the proceeds from the sale of, an investment at a desirable time or price. Liquidity risk may arise because of, for example, a lack of marketability of the investment, which means that when seeking to sell its portfolio investments, the Fund could find that selling is more difficult than anticipated, especially during times of high market volatility. Decreases in the number of financial institutions, including banks and broker-dealers, willing to make markets (match up sellers and buyers) in the Fund’s investments or decreases in their capacity or willingness to trade such investments may increase the Fund’s exposure to this risk. The debt market has experienced considerable growth, and financial institutions making markets in instruments purchased and sold by the Fund (e.g., bond dealers) have been subject to increased regulation. The impact of that growth and regulation on the ability and willingness of financial institutions to engage in trading or “making a market” in such instruments remains unsettled. Certain types of investments, such as lower-rated securities or those that are purchased and sold in over-the-counter markets, may be especially subject to liquidity risk. Securities or other assets in which the Fund invests may be traded in the over-the-counter market rather than on an exchange and therefore may be more difficult to purchase or sell at a fair price, which may have a negative impact on the Fund’s performance. Market participants attempting to sell the same or a similar instrument at the same time as the Fund
Prospectus 2026
13
Columbia Variable Portfolio – Select Corporate Income Fund
More Information About the Fund (continued)
could exacerbate the Fund’s exposure to liquidity risk. The Fund may have to accept a lower selling price for the holding, sell other liquid or more liquid investments that it might otherwise prefer to hold (thereby increasing the proportion of the Fund’s investments in less liquid or illiquid securities), or forego another more appealing investment opportunity. The liquidity of Fund investments may change significantly over time and certain investments that were liquid when purchased by the Fund may later become illiquid, particularly in times of overall economic distress. Changing regulatory, market or other conditions or environments (for example, the interest rate or credit environments) may also adversely affect the liquidity and the price of the Fund's investments. Judgment plays a larger role in valuing illiquid or less liquid investments as compared to valuing liquid or more liquid investments. Price volatility may be higher for illiquid or less liquid investments as a result of, for example, the relatively less frequent pricing of such securities (as compared to liquid or more liquid investments). Generally, the less liquid the market at the time the Fund sells a portfolio investment, the greater the risk of loss or decline of value to the Fund. Overall market liquidity and other factors can lead to an increase in redemptions, which may negatively impact Fund performance and NAV, including, for example, if the Fund is forced to sell investments in a down market. Foreign securities can present enhanced liquidity risks, including as a result of less developed custody, settlement or other practices of foreign markets.
Market Risk. The Fund may incur losses due to declines in the value of one or more securities in which it invests. These declines may be due to factors affecting a particular issuer, or the result of, among other things, political, regulatory, market, economic or social developments affecting the relevant market(s) more generally. In addition, turbulence in financial markets and reduced liquidity in equity, credit and/or fixed income markets may negatively affect many issuers, which could adversely affect the Fund’s ability to price or value hard-to-value assets in thinly traded and closed markets and could cause significant redemptions and operational challenges. Global economies and financial markets are increasingly interconnected, and conditions and events in one country, region or financial market may adversely impact issuers in a different country, region or financial market. These risks may be magnified if certain events or developments adversely interrupt the global supply chain; in these and other circumstances, such risks might affect companies worldwide. As a result, local, regional or global events such as terrorism, war, other conflicts, natural disasters, disease/virus outbreaks and epidemics or other public health issues, recessions, depressions or other events – or the potential for such events – could have a significant negative impact on global economic and market conditions.
The large-scale invasion of Ukraine by Russia in February 2022 has resulted in sanctions and market disruptions, including declines in regional and global stock markets, unusual volatility in global commodity markets and significant devaluations of Russian currency. In addition, the Iranian conflict that commenced in February 2026 may result in similar, and potentially more severe, disruptions. Escalation of hostilities in the Middle East region could disrupt energy production or transportation, including through key shipping routes, which may lead to increased volatility in energy and other commodity prices. The extent and duration of these conflicts are impossible to predict but could continue to be significant. Market disruption caused by these conflicts, and any countermeasures or responses thereto (including international sanctions, a downgrade in a country’s credit rating, purchasing and financing restrictions, boycotts, tariffs, changes in consumer or purchaser preferences, cyberattacks and espionage) could continue to have severe adverse impacts on regional and/or global securities and commodities markets, including markets for oil and natural gas. These impacts may include reduced market liquidity, distress in credit markets, further disruption of global supply chains, increased risk of inflation, and limited access to investments in certain international markets and/or issuers. These developments and other related events could negatively impact Fund performance.
Mortgage- and Other Asset-Backed Securities Risk. The value of any mortgage-backed and other asset-backed securities including collateralized debt obligations and collateralized loan obligations, if any, held by the Fund may be affected by, among other things, changes or perceived changes in: interest rates; factors concerning the interests in and structure of the issuer or the originator of the mortgages or other assets; the creditworthiness of the entities that provide any supporting letters of credit, surety bonds or other credit enhancements; or the market's assessment of the quality of underlying assets. Mortgage-backed securities represent interests in, or are backed by, pools of mortgages from which payments of interest and principal (net of fees paid to the issuer or guarantor of the securities) are distributed to the holders of the mortgage-backed securities. Other types of asset-backed securities
14
Prospectus 2026
Columbia Variable Portfolio – Select Corporate Income Fund
More Information About the Fund (continued)
typically represent interests in, or are backed by, pools of receivables such as credit, automobile, student and home equity loans. Mortgage- and other asset-backed securities can have a fixed or an adjustable rate. Mortgage- and other asset-backed securities are subject to liquidity risk (the risk that it may not be possible for the Fund to liquidate the instrument at an advantageous time or price) and prepayment risk (the risk that the underlying mortgage or other asset may be refinanced or prepaid prior to maturity during periods of declining or low interest rates, causing the Fund to have to reinvest the money received in securities that have lower yields). In addition, the impact of prepayments on the value of mortgage- and other asset-backed securities may be difficult to predict and may result in greater volatility. A decline or flattening of housing values may cause delinquencies in mortgages underlying mortgage-backed securities and thereby adversely affect the ability of the mortgage-backed securities issuer to make principal and/or interest payments to mortgage-backed securities holders, including the Fund. Rising or high interest rates tend to extend the duration of mortgage- and other asset-backed securities, making them more volatile and more sensitive to changes in interest rates. Payment of principal and interest on some mortgage-backed securities (but not the market value of the securities themselves) may be guaranteed (i) by the full faith and credit of the U.S. Government (in the case of securities guaranteed by the Government National Mortgage Association) or (ii) by its agencies, authorities, enterprises or instrumentalities (in the case of securities guaranteed by the Federal National Mortgage Association (FNMA) or the Federal Home Loan Mortgage Corporation (FHLMC)), which are not insured or guaranteed by the U.S. Government (although FNMA and FHLMC may be able to access capital from the U.S. Treasury to meet their obligations under such securities). Mortgage-backed securities issued by non-governmental issuers (such as commercial banks, savings and loan institutions, private mortgage insurance companies, mortgage bankers and other secondary market issuers) may be supported by various credit enhancements, such as pool insurance, guarantees issued by governmental entities, letters of credit from a bank or senior/subordinated structures, and may entail greater risk than obligations guaranteed by the U.S. Government, whether or not such obligations are guaranteed by the private issuer.
Prepayment and Extension Risk. Prepayment and extension risk is the risk that a bond or other security or investment might, in the case of prepayment risk, be called or otherwise converted, prepaid or redeemed before maturity and, in the case of extension risk, that the investment might not be called as expected. In the case of prepayment risk, if the investment is converted, prepaid or redeemed before maturity, the portfolio managers may not be able to invest the proceeds in other investments providing as high a level of income, resulting in a reduced yield to the Fund. As interest rates decrease or spreads narrow on such investments, the likelihood of prepayment increases. Conversely, extension risk is the risk that an unexpected rise in interest rates will extend the life of an investment beyond the prepayment time. If the Fund's investments are locked in at a lower interest rate for a longer period of time, the portfolio managers may be unable to capitalize on investments with higher interest rates or wider spreads.
Reinvestment Risk. Reinvestment risk arises when the Fund is unable to reinvest income or principal at the same or at least the same return it is currently earning.
Rule 144A and Other Exempted Securities Risk. The Fund may invest in privately placed and other securities or instruments exempt from SEC registration (collectively “private placements”), subject to certain regulatory restrictions. In the U.S. market, private placements are typically sold only to qualified institutional buyers, or qualified purchasers, as applicable. An insufficient number of buyers interested in purchasing private placements at a particular time could adversely affect the marketability of such investments and the Fund might be unable to dispose of them promptly or at reasonable prices, subjecting the Fund to liquidity risk (the risk that it may not be possible for the Fund to liquidate the instrument at an advantageous time or price). The Fund’s holdings of private placements may increase the level of Fund illiquidity if eligible buyers are unable or unwilling to purchase them at a particular time. The Fund may also have to bear the expense of registering the securities for resale and the risk of substantial delays in effecting the registration. Additionally, the purchase price and subsequent valuation of private placements typically reflect a discount, which may be significant, from the market price of comparable securities for which a more liquid market exists. Issuers of Rule 144A eligible securities are required to furnish information to potential investors upon request. However, the required disclosure is much less extensive than that required of public
Prospectus 2026
15
Columbia Variable Portfolio – Select Corporate Income Fund
More Information About the Fund (continued)
companies and is not publicly available since the offering information is not filed with the SEC. Further, issuers of Rule 144A eligible securities can require recipients of the offering information (such as the Fund) to agree contractually to keep the information confidential, which could also adversely affect the Fund’s ability to dispose of the security.
Sector Risk. At times, the Fund may have a significant portion of its assets invested in securities of companies conducting business in a related group of industries within one or more economic sectors, including the financials sector. Companies in the same sector may be similarly affected by economic, regulatory, political or market events or conditions, which may make the Fund vulnerable to unfavorable developments in that group of industries or economic sector.
■
Financials Sector. The Fund is vulnerable to the particular risks that may affect companies in the financials sector. Companies in the financials sector are subject to certain risks, including the risk of regulatory change, decreased liquidity in credit markets and unstable interest rates. Such companies may have concentrated portfolios, such as a high level of loans to one or more industries or sectors, which makes them vulnerable to economic conditions that affect such industries or sectors. Performance of such companies may be affected by competitive pressures and exposure to investments, agreements and counterparties, including credit products that, under certain circumstances, may lead to losses (e.g., subprime loans). Companies in the financials sector are subject to extensive governmental regulation that may limit the amount and types of loans and other financial commitments they can make, and the interest rates and fees they may charge. In addition, profitability of such companies is largely dependent upon the availability and the cost of capital.
U.S. Government Obligations Risk. While U.S. Treasury obligations are backed by the “full faith and credit” of the U.S. Government, such securities are nonetheless subject to credit risk (i.e., the risk that the U.S. Government may be, or may be perceived to be, unable or unwilling to honor its financial obligations, such as making payments). Securities issued or guaranteed by federal agencies or authorities and U.S. Government-sponsored instrumentalities or enterprises may or may not be backed by the full faith and credit of the U.S. Government. For example, securities issued by the Federal Home Loan Mortgage Corporation, the Federal National Mortgage Association and the Federal Home Loan Banks are neither insured nor guaranteed by the U.S. Government. These securities may be supported by the ability to borrow from the U.S. Treasury or only by the credit of the issuing agency, authority, instrumentality or enterprise and, as a result, are subject to greater credit risk than securities issued or guaranteed by the U.S. Treasury.
Unrated Securities Risk. The Fund may purchase unrated securities which are not rated by a rating agency. Unrated securities may be less liquid than comparable rated securities and involve the risk that the Investment Manager may not accurately evaluate the security’s comparative credit rating. Analysis of creditworthiness of issuers of high yield securities may be more complex than for issuers of higher-quality debt securities. To the extent that the Fund purchases unrated securities, the Fund’s success in achieving its investment objective may depend more heavily on the Investment Manager’s creditworthiness analysis than if the Fund invested exclusively in rated securities.
When-Issued, Delayed Settlement and Forward Commitment Transactions, Including U.S. Treasury Floating Rate Notes Risk. When-issued, delayed delivery, and forward commitment transactions generally involve the purchase of a security with payment and delivery at some time in the future – i.e., beyond normal settlement. The Fund does not earn interest on such securities until settlement and bears the risk of market value fluctuations in between the purchase and settlement dates. Such transactions include floating rate obligations issued by the U.S. Treasury. Securities with floating or variable interest rates can be less sensitive to interest rate changes than securities with fixed interest rates, but may decline in value if their interest rates do not rise as much, or as quickly, as interest rates in general. Conversely, floating rate securities will not generally increase in value if interest rates decline. A decline in interest rates may result in a reduction in income received from floating rate securities held by the Fund and may adversely affect the value of the Fund’s shares. Generally, floating rate securities carry lower yields than fixed notes of the same maturity. The interest rate for a floating rate note resets or adjusts periodically by reference to a benchmark interest rate. The impact of interest rate changes on floating rate investments is typically mitigated by the periodic interest rate reset of the investments. Securities with longer durations tend to be more sensitive to interest rate changes, usually making them more volatile than securities with shorter durations. The supply of floating rate notes issued by the U.S. Treasury will be limited. There is no guarantee or assurance that: the Fund will
16
Prospectus 2026
Columbia Variable Portfolio – Select Corporate Income Fund
More Information About the Fund (continued)
be able to invest in a desired amount of floating rate notes or be able to buy floating rate notes at a desirable price; floating rate notes will continue to be issued by the U.S. Treasury; or floating rate notes will be actively traded. Any or all of the foregoing, should they occur, would negatively impact the Fund.
Additional Investment Strategies and Policies
This section describes certain investment strategies and policies that the Fund may utilize in pursuit of its investment objective and some additional factors and risks involved with investing in the Fund.
Investment Guidelines
As a general matter, and except as specifically described in the discussion of the Fund's principal investment strategies in this prospectus or as otherwise required by the Investment Company Act of 1940, as amended (the 1940 Act), the rules and regulations thereunder and any applicable exemptive relief, whenever an investment policy or limitation states a percentage of the Fund's assets that may be invested in any security or other asset or sets forth a policy regarding an investment standard, compliance with that percentage limitation or standard will be determined solely at the time of the Fund's investment in the security or asset.
Holding Other Kinds of Investments
The Fund may hold other investments that are not part of its principal investment strategies. These investments and their risks are described below and/or in the Statement of Additional Information (SAI). The Fund may choose not to invest in certain securities described in this prospectus and in the SAI, although it has the ability to do so. Information on the Fund’s holdings can be found in the Fund’s Form N-CSR or by visiting columbiathreadneedleus.com.
Transactions in Derivatives
The Fund may enter into derivative transactions or otherwise have exposure to derivative transactions through underlying investments. Derivatives are financial contracts whose values are, for example, based on (or “derived” from) traditional securities (such as a stock or bond), assets (such as a commodity like gold or a foreign currency), reference rates (such as the Secured Overnight Financing Rate (commonly known as SOFR)) or market indices (such as the Standard & Poor’s 500® Index). The use of derivatives is a highly specialized activity which involves investment techniques and risks different from those associated with ordinary portfolio securities transactions. Derivatives involve special risks and may result in losses or may limit the Fund’s potential gain from favorable market movements. Derivative strategies often involve leverage, which may exaggerate a loss, potentially causing the Fund to lose more money than it would have lost had it invested in the underlying security or other asset directly. The values of derivatives may move in unexpected ways, especially in unusual market conditions, and may result in increased volatility in the value of the derivative and/or the Fund’s shares, among other consequences. Other risks arise from the Fund’s potential inability to terminate or to sell derivative positions. A liquid secondary market may not always exist for the Fund’s derivative positions at times when the Fund might wish to terminate or to sell such positions. Over-the-counter instruments (investments not traded on an exchange) may be illiquid, and transactions in derivatives traded in the over-the-counter market are subject to the risk that the other party will not meet its obligations. The use of derivatives also involves the risks of mispricing or improper valuation and that changes in the value of the derivative may not correlate perfectly with the underlying security, asset, reference rate or index. The Fund also may not be able to find a suitable derivative transaction counterparty, and thus may be unable to engage in derivative transactions when it is deemed favorable to do so, or at all. The U.S. government and the European Union (and some other jurisdictions) have enacted regulations and similar requirements that prescribe clearing, margin, reporting and registration requirements for participants in the derivatives market. These requirements are evolving and their ultimate impact on the Fund remains unclear, but such impact could include restricting and/or imposing significant costs or other burdens upon the Fund’s participation in derivatives transactions. Additionally, regulations governing the use of derivatives by registered investment companies, such as the Fund, require, among other things, that a fund that invests in derivative instruments beyond a specified limited amount apply a value-at-risk-based limit
Prospectus 2026
17
Columbia Variable Portfolio – Select Corporate Income Fund
More Information About the Fund (continued)
to its portfolio and establish a comprehensive derivatives risk management program. As of the date of this prospectus, the Fund is required to maintain a comprehensive derivatives risk management program. For more information on the risks of derivative investments and strategies, see the SAI.
Affiliated Fund Investing
The Investment Manager or an affiliate serves as investment adviser to funds using the Columbia brand (Columbia Funds), including those that are structured as “fund-of-funds”, and provides asset-allocation services to (i) shareholders by investing in shares of other Columbia Funds, which may include the Fund (collectively referred to in this section as Underlying Funds), and (ii) discretionary managed accounts (collectively referred to as affiliated products) that invest exclusively in Underlying Funds. These affiliated products, individually or collectively, may own a significant percentage of the outstanding shares of one or more Underlying Funds, and the Investment Manager seeks to balance potential conflicts of interest between the affiliated products and the Underlying Funds in which they invest. The affiliated products’ investment in the Underlying Funds may have the effect of creating economies of scale, possibly resulting in lower expense ratios for the Underlying Funds, because the affiliated products may own substantial portions of the shares of Underlying Funds. However, redemption of Underlying Fund shares by one or more affiliated products could cause the expense ratio of an Underlying Fund to increase, as its fixed costs would be spread over a smaller asset base. Because of large positions of certain affiliated products, the Underlying Funds may experience relatively large inflows and outflows of cash due to affiliated products’ purchases and sales of Underlying Fund shares. Although the Investment Manager or its affiliate may seek to minimize the impact of these transactions where possible, for example, by structuring them over a reasonable period of time or through other measures, Underlying Funds may experience increased expenses as they buy and sell portfolio securities to manage the cash flow effect related to these transactions. Further, when the Investment Manager or its affiliate structures transactions over a reasonable period of time in order to manage the potential impact of the buy and sell decisions for the affiliated products, those affiliated products, including funds-of-funds, may pay more or less (for purchase activity), or receive more or less (for redemption activity), for shares of the Underlying Funds than if the transactions were executed in one transaction. In addition, substantial redemptions by affiliated products within a short period of time could require the Underlying Fund to liquidate positions more rapidly than would otherwise be desirable, which may have the effect of reducing or eliminating potential gain or causing it to realize a loss. In order to meet such redemptions, an Underlying Fund may be forced to sell its liquid (or more liquid) positions, leaving the Underlying Fund holding, post-redemption, a relatively larger position in illiquid investments (i.e., any investment that the Fund reasonably expects cannot be sold or disposed of in current market conditions in seven calendar days or less without the sale or disposition significantly changing the market value of the investment) or less liquid securities. Substantial redemptions may also adversely affect the ability of the Underlying Fund to implement its investment strategy. The Investment Manager or its affiliate also has a conflict of interest in determining the allocation of affiliated products’ assets among the Underlying Funds, as it earns different fees from the various Underlying Funds.
Investing in Money Market Funds
The Fund may invest cash in, or hold as collateral for certain investments, shares of registered or unregistered money market funds, including funds advised by the Investment Manager or its affiliates. These funds are not insured or guaranteed by the Federal Deposit Insurance Corporation (FDIC) or any other government agency. The Fund and its shareholders indirectly bear a portion of the expenses of any money market fund or other fund in which the Fund may invest.
Investing Defensively
The Fund may from time to time take temporary defensive investment positions that may be inconsistent with the Fund’s principal investment strategies in attempting to respond to adverse market, economic, political, social or other conditions, including, without limitation, investing some or all of its assets in money market instruments or shares of affiliated or unaffiliated money market funds or holding some or all of its assets in cash or cash equivalents. The Fund may take such defensive investment positions for as long a period as deemed necessary.
18
Prospectus 2026
Columbia Variable Portfolio – Select Corporate Income Fund
More Information About the Fund (continued)
The Fund may not achieve its investment objective while it is investing defensively. Investing defensively may adversely affect Fund performance. During these times, the portfolio managers may make frequent portfolio holding changes, which could result in increased trading expenses and decreased Fund performance. See also Investing in Money Market Funds above for more information.
Other Strategic and Investment Measures
The Fund may also from time to time take temporary portfolio positions that may or may not be consistent with the Fund’s principal investment strategies in attempting to respond to adverse market, economic, political, social or other conditions, including, without limitation, investing in derivatives, such as forward contracts, futures contracts, options, structured investments and swaps, for various purposes, including among others, investing in particular derivatives in seeking to reduce investment exposures, or in seeking to achieve indirect investment exposures, to a sector, country, region or currency where the Investment Manager believes such positioning is appropriate. The Fund may take such portfolio positions for as long a period as deemed necessary. While the Fund is so positioned, derivatives could comprise a substantial portion of the Fund’s investments and the Fund may not achieve its investment objective. Investing in this manner may adversely affect Fund performance. During these times, the portfolio managers may make frequent portfolio holding changes, which could result in increased trading expenses and decreased Fund performance. For information on the risks of investing in derivatives, see Transactions in Derivatives above.
Portfolio Holdings Disclosure
The Board has adopted policies and procedures that govern the timing and circumstances of disclosure to shareholders and third parties of information regarding the securities owned by the Fund. A description of these policies and procedures is included in the SAI. Fund policy generally permits the disclosure of portfolio holdings information on the Fund's website (columbiathreadneedleus.com) only after a certain amount of time has passed, as described in the SAI.
Purchases and sales of portfolio securities can take place at any time, so the portfolio holdings information available on the Fund's website may not always be current.
FUNDamentals
Portfolio Holdings Versus the Benchmarks
The Fund does not limit its investments to the securities within its benchmark(s), and accordingly the Fund's holdings may diverge from those of its benchmark(s). In addition, the Fund may invest in securities outside any industry and geographic sectors represented in its benchmark(s). The Fund's weightings in individual securities, and in industry or geographic sectors, may also vary considerably from those of its benchmark(s).
Cash Flows
The timing and magnitude of cash inflows from investors buying Fund shares could prevent the Fund from always being fully invested. Conversely, the timing and magnitude of cash outflows to shareholders redeeming Fund shares could require the Fund to sell portfolio securities at less than opportune times or to hold ready reserves of uninvested cash in amounts larger than might otherwise be the case to meet shareholder redemptions. Either situation could adversely impact the Fund’s performance.
Understanding Annual Fund Operating Expenses
The Fund’s annual operating expenses, as presented in the Annual Fund Operating Expenses table in the Fees and Expenses of the Fund section of this prospectus, generally are based on expenses incurred during the Fund’s most recently completed fiscal year, may vary by share class and are expressed as a percentage (expense ratio) of the Fund’s average net assets during that fiscal year. The expense ratios reflect the Fund’s fee arrangements as of the date of this prospectus and, unless indicated otherwise, are based on expenses incurred during the Fund’s most recent fiscal year. The Fund’s assets will fluctuate, but unless indicated otherwise in the Annual Fund Operating
Prospectus 2026
19
Columbia Variable Portfolio – Select Corporate Income Fund
More Information About the Fund (continued)
Expenses table, no adjustments have been or will be made to the expense ratios to reflect any differences in the Fund’s average net assets between the most recently completed fiscal year and the date of this prospectus or a later date. In general, the Fund’s expense ratios will increase as its net assets decrease, such that the Fund’s actual expense ratios may be higher than the expense ratios presented in the Annual Fund Operating Expenses table if assets fall. Any commitment by the Investment Manager and/or its affiliates to waive fees and/or cap (reimburse) expenses is expected, in part, to limit the impact of any increase in the Fund’s expense ratios that would otherwise result because of a decrease in the Fund’s assets in the current fiscal year. The Fund’s annual operating expenses are comprised of (i) investment management fees, (ii) distribution and/or service fees, and (iii) other expenses. Management fees do not vary by class, but distribution and/or service fees and other expenses may vary by class.
FUNDamentals
Other Expenses
“Other expenses” consist of the fees the Fund pays to its custodian, transfer agent, auditors, lawyers and trustees, costs relating to compliance and miscellaneous expenses. Generally, these expenses are allocated on a pro rata basis across all share classes. These fees include certain sub-transfer agency and shareholder servicing fees. For more information on these fees, see About Fund Shares and Transactions — Financial Intermediary Compensation.
Fee Waiver/Expense Reimbursement Arrangements and Impact on Past Performance
The Investment Manager and certain of its affiliates have contractually agreed to waive fees and/or reimburse expenses (excluding certain fees and expenses described below) through April 30, 2027, unless sooner terminated at the sole discretion of the Fund's Board, so that the Fund’s net operating expenses, after giving effect to fees waived/expenses reimbursed and any balance credits and/or overdraft charges from the Fund’s custodian, do not exceed the annual rates of:
| Columbia Variable Portfolio – Select Corporate Income Fund | |
| Class 1 |
0.47% |
| Class 2 |
0.72% |
| Class 3 |
0.595% |
Under the agreement, the following fees and expenses are excluded from the Fund’s operating expenses when calculating the waiver/reimbursement commitment, and therefore will be paid by the Fund, if applicable: taxes (including foreign transaction taxes), expenses associated with investment in affiliated and non-affiliated pooled investment vehicles (including mutual funds and exchange-traded funds), transaction costs and brokerage commissions, costs related to any securities lending program, dividend expenses associated with securities sold short, inverse floater program fees and expenses, transaction charges and interest on borrowed money, interest, costs associated with shareholder meetings, infrequent and/or unusual expenses and any other expenses the exclusion of which is specifically approved by the Fund’s Board. This agreement may be modified or amended only with approval from all parties.
Effect of Fee Waivers and/or Expense Reimbursements on Past Performance. The Fund’s returns shown in the Performance Information section of this prospectus reflect the effect of any fee waivers and/or reimbursements of Fund expenses by the Investment Manager and/or any of its affiliates that were in place during the performance period shown. Without such fee waivers/expense reimbursements, the Fund’s returns might have been lower.
Primary Service Provider Contracts
The Fund enters into contractual arrangements (Service Provider Contracts) with various service providers, including, among others, the Investment Manager, the Distributor, Columbia Management Investment Services Corp. (the Transfer Agent) and the Fund’s custodian. The Fund’s Service Provider Contracts are solely among the parties thereto. Shareholders are not parties to, or intended to be third-party beneficiaries of, any Service Provider Contracts.
20
Prospectus 2026
Columbia Variable Portfolio – Select Corporate Income Fund
More Information About the Fund (continued)
Further, this prospectus, the SAI and any Service Provider Contracts are not intended to give rise to any agreement, duty, special relationship or other obligation between the Fund and any investor, or give rise to any contractual, tort or other rights in any individual shareholder, group of shareholders or other person, including any right to assert a fiduciary or other duty, enforce the Service Provider Contracts against the parties or to seek any remedy thereunder, either directly or on behalf of the Fund. Nothing in the previous sentence should be read to suggest any waiver of any rights under federal or state securities laws.
The Investment Manager, the Distributor, and the Transfer Agent are all affiliates of Ameriprise Financial, Inc. (Ameriprise Financial). They and their affiliates currently provide key services, including investment advisory, administration, distribution, shareholder servicing and transfer agency services, to the Fund and various other funds, including the Columbia Funds, and are paid for providing these services. These service relationships are described below.
The Investment Manager
Columbia Management Investment Advisers, LLC is located at 290 Congress Street, Boston, MA 02210 and serves as investment adviser and administrator to the Columbia Funds. The Investment Manager is a registered investment adviser and a wholly-owned subsidiary of Ameriprise Financial. The Investment Manager’s management experience covers all major asset classes, including equity securities, debt instruments and money market instruments. In addition to serving as an investment adviser to traditional mutual funds, exchange-traded funds and closed-end funds, the Investment Manager acts as an investment adviser for itself, its affiliates, individuals, corporations, retirement plans, private investment companies and financial intermediaries.
Subject to oversight by the Board, the Investment Manager manages the day-to-day operations of the Fund, determining what securities and other investments the Fund should buy or sell and executing portfolio transactions. The Investment Manager may use the research and other capabilities of its affiliates and third parties in managing the Fund’s investments. The Investment Manager is also responsible for overseeing the administrative operations of the Fund, including the general supervision of the Fund’s operations, the coordination of the Fund’s other service providers and the provision of related clerical and administrative services.
The SEC has issued an order that permits the Investment Manager, subject to the approval of the Board, to appoint unaffiliated subadvisers by entering into subadvisory agreements with them, and to change in material respects the terms of those subadvisory agreements, including the fees paid thereunder, for the Fund without first obtaining shareholder approval, thereby avoiding the expense and delays typically associated with obtaining shareholder approval. The Fund furnishes shareholders with information about new subadvisers retained in reliance on the order within 90 days after hiring the subadviser. The Investment Manager and its affiliates may have other relationships, including significant financial relationships, with current or potential subadvisers or their affiliates, which may create certain conflicts of interest. When making recommendations to the Board to appoint or to change a subadviser, or to change the terms of a subadvisory agreement, the Investment Manager discloses to the Board the nature of any such material relationships. The SEC has issued a separate order that permits the Board to approve new subadvisory agreements or material changes to existing subadvisory agreements at a meeting that is not in person, provided that the Trustees are able to participate in the meeting using a means of communication that allows them to hear each other simultaneously during the meeting and other conditions of the order are satisfied. At present, the Investment Manager has not engaged any investment subadviser for the Fund.
The Fund pays the Investment Manager a fee for its management services, which include investment advisory services and administrative services. The fee is calculated as a percentage of the daily net assets of the Fund and is paid monthly. For the Fund’s most recent fiscal year, management services fees paid to the Investment Manager by the Fund amounted to 0.49% of average daily net assets of the Fund, before any applicable reimbursements.
A discussion regarding the basis for the Board’s approval of the renewal of the Fund's management agreement is available in the Fund’s Form N-CSR for the fiscal period ended June 30, 2025.
Prospectus 2026
21
Columbia Variable Portfolio – Select Corporate Income Fund
More Information About the Fund (continued)
Portfolio Managers
Information about the portfolio managers primarily responsible for overseeing the Fund’s investments is shown below. The SAI provides additional information about the portfolio managers, including information relating to compensation, other accounts managed by the portfolio managers, and ownership by the portfolio managers of Fund shares.
| Portfolio Management |
Title |
Role with Fund |
Managed Fund Since |
| Tom Murphy, CFA |
Vice President, Senior Portfolio Manager and Head of Investment Grade Credit |
Lead Portfolio Manager |
2025 |
| Royce D. Wilson, CFA |
Senior Portfolio Manager |
Portfolio Manager |
2025 |
| John Dawson, CFA |
Senior Portfolio Manager |
Portfolio Manager |
2025 |
Mr. Murphy joined the Investment Manager in 2002. Mr. Murphy began his investment career in 1986 and earned a B.B.A. from the University of Notre Dame and an M.B.A. from the University of Michigan.
Mr. Wilson joined the Investment Manager in 2007. Mr. Wilson began his investment career in 2002 and earned a B.B.A. from Western Connecticut State University.
Mr. Dawson joined one of the Columbia Management legacy firms or acquired business lines in 2004. Mr. Dawson began his investment career in 1996 and earned a B.A. in Economics from Bucknell University and an M.B.A. with concentrations in Finance and Accounting from Indiana University.
The Distributor
Shares of the Fund are distributed by Columbia Management Investment Distributors, Inc., which is located at 290 Congress Street, Boston, MA 02210. The Distributor is a registered broker-dealer and an indirect, wholly-owned subsidiary of Ameriprise Financial. The Distributor and its affiliates may pay commissions, distribution and service fees and/or other compensation to entities, including Ameriprise Financial affiliates, for selling shares and providing services to investors.
The Transfer Agent
Columbia Management Investment Services Corp. is a registered transfer agent and wholly-owned subsidiary of Ameriprise Financial. The Transfer Agent is located at 290 Congress Street, Boston, MA 02210, and its responsibilities include processing purchases, redemptions and transfers of Fund shares, calculating and paying distributions, maintaining shareholder records, preparing account statements and providing customer service. The Transfer Agent has engaged SS&C GIDS, Inc. to provide various sub-transfer agency services. The Fund pays a service fee to participating insurance companies or other financial intermediaries that provide sub-recordkeeping and other services to Contract owners and the separate accounts. The Transfer Agent may retain as compensation for its services revenues for fees for wire, telephone and redemption orders, account transcripts due the Transfer Agent from Fund shareholders and interest (net of bank charges) earned with respect to balances in accounts the Transfer Agent maintains in connection with its services to the Fund.
Other Roles and Relationships of Ameriprise Financial and its Affiliates — Certain Conflicts of Interest
The Investment Manager, Distributor and Transfer Agent, all affiliates of Ameriprise Financial, provide various services to the Fund and other Columbia Funds for which they are compensated. Ameriprise Financial and its other affiliates may also provide other services to these funds and be compensated for them.
The Investment Manager and its affiliates may provide investment advisory and other services to other clients and customers substantially similar to those provided to the Columbia Funds. These activities, and other financial services activities of Ameriprise Financial and its affiliates, may present actual and potential conflicts of interest and introduce certain investment constraints.
22
Prospectus 2026
Columbia Variable Portfolio – Select Corporate Income Fund
More Information About the Fund (continued)
Ameriprise Financial is a major financial services company, engaged in a broad range of financial activities beyond the fund-related activities of the Investment Manager, including, among others, insurance, broker-dealer (sales and trading), asset management, banking and other financial activities. These additional activities may involve multiple advisory, financial, insurance and other interests in securities and other instruments, and in companies that issue securities and other instruments, that may be bought, sold or held by the Columbia Funds.
Conflicts of interest and limitations that could affect a Columbia Fund may arise from, for example, the following:
■
compensation and other benefits received by the Investment Manager and other Ameriprise Financial affiliates related to the management/administration of a Columbia Fund and the sale of its shares;
■
the allocation of, and competition for, investment opportunities among the Fund, other funds and accounts advised/managed by the Investment Manager and other Ameriprise Financial affiliates, or Ameriprise Financial itself and its affiliates;
■
separate and potentially divergent management of a Columbia Fund and other funds and accounts advised/managed by the Investment Manager and other Ameriprise Financial affiliates;
■
regulatory and other investment restrictions on investment activities of the Investment Manager and other Ameriprise Financial affiliates and accounts advised/managed by them;
■
insurance and other relationships of Ameriprise Financial affiliates with companies and other entities in which a Columbia Fund invests;
■
regulatory and other restrictions relating to the sharing of information between Ameriprise Financial and its affiliates, including the Investment Manager, and a Columbia Fund; and
■
insurance companies investing in the Fund may be affiliates of Ameriprise Financial; these affiliated insurance companies, individually and collectively, may hold through separate accounts a significant portion of the Fund's shares and may also invest in separate accounts managed by the Investment Manager that have the same or substantially similar investment objectives and strategies as the Fund.
The Investment Manager and Ameriprise Financial have adopted various policies and procedures that are intended to identify, monitor and address conflicts of interest. However, there is no assurance that these policies, procedures and disclosures will be effective.
Additional information about Ameriprise Financial and the types of conflicts of interest and other matters referenced above is set forth in the Investment Management and Other Services — Other Roles and Relationships of Ameriprise Financial and its Affiliates — Certain Conflicts of Interest section of the SAI. Investors in the Columbia Funds should carefully review these disclosures and consult with their financial advisor if they have any questions.
Certain Legal Matters
Ameriprise Financial and certain of its affiliates are involved, in the normal course of business, in legal proceedings that include regulatory inquiries, arbitration and litigation (including class actions) concerning matters arising in connection with the conduct of their activities as part of a diversified financial services firm. Ameriprise Financial believes that the Fund is not currently the subject of, and that neither Ameriprise Financial nor any of its affiliates are the subject of, any pending legal, arbitration or regulatory proceedings that are likely to have a material adverse effect on the Fund or the ability of Ameriprise Financial or its affiliates to perform under their contracts with the Fund. Information regarding certain pending and settled legal proceedings may be found in the Fund’s Form N-CSR and in the SAI. Additionally, Ameriprise Financial is required to make quarterly (10-Q), annual (10-K) and, as necessary, 8-K filings with the SEC on legal and regulatory matters that relate to Ameriprise Financial and its affiliates. Copies of these filings may be obtained by accessing the SEC website at sec.gov.
Prospectus 2026
23
Columbia Variable Portfolio – Select Corporate Income Fund
About Fund Shares and Transactions
Description of the Share Classes
Share Class Features
The Fund offers the classes of shares set forth on the cover of this prospectus. Each share class has its own cost structure and other features. The following summarizes the primary features of the Class 1, Class 2 and Class 3 shares.
| |
Class 1 Shares |
Class 2 Shares |
Class 3 Shares |
| Eligible Investors |
Shares of the Fund are available only to separate accounts of participating insurance companies as underlying investments for variable annuity contracts and/or variable life insurance policies (collectively, Contracts) or qualified pension and retirement plans (Qualified Plans) or other eligible investors authorized by the Distributor. | ||
| Investment Limits |
none |
none |
none |
| Conversion Features |
none |
none |
none |
| Front-End Sales Charges |
none |
none |
none |
| Contingent Deferred Sales Charges (CDSCs) |
none |
none |
none |
| Maximum Distribution and/or Service Fees |
none |
0.25% |
0.125% |
FUNDamentals
Financial Intermediaries
The term “financial intermediary” refers to the insurance company that issued your contract, qualified pension or retirement plan sponsors or the financial intermediary that employs your financial advisor. Financial intermediaries also include broker-dealers and financial advisors as well as firms that employ broker-dealers and financial advisors, including, for example, brokerage firms, banks, investment advisers, third party administrators and other firms in the financial services industry, including Ameriprise Financial and its affiliates.
Distribution and/or Service Fees
Pursuant to Rule 12b-1 under the Investment Company Act of 1940, as amended (the 1940 Act), the Board has approved, and the Fund has adopted, a distribution plan which sets the distribution fees that are periodically deducted from the Fund’s assets for Class 2 and Class 3 shares. The distribution fee for Class 2 shares is 0.25% and the distribution fee for Class 3 shares is 0.125%. These fees are calculated daily, may vary by share class and are intended to compensate the Distributor and/or financial intermediaries for selling shares of the Fund and/or providing services to investors. Because the fees are paid out of the Fund’s assets on an ongoing basis, they will increase the cost of your investment over time.
The Fund will pay these fees to the Distributor and/or to eligible financial intermediaries for as long as the distribution plan continues. The Fund may reduce or discontinue payments at any time.
The Fund pays a service fee to participating insurance companies or other financial intermediaries that provide sub-recordkeeping and other services to Contract owners, Qualified Plan participants and the separate accounts.
Financial Intermediary Compensation
The Distributor, the Investment Manager and their affiliates make payments, from their own resources, to financial intermediaries, primarily to affiliated and unaffiliated insurance companies, for marketing/sales support services relating to the Fund (Marketing Support Payments). Such payments are generally based upon one or more of the following factors: average net assets of the Columbia Funds sold by the Distributor attributable to that financial intermediary; gross sales of the Columbia Funds distributed by the Distributor attributable to that financial intermediary; or a negotiated lump sum payment. While the financial arrangements may vary for each financial intermediary, the Marketing Support Payments to any one financial intermediary are generally between 0.05% and
24
Prospectus 2026
Columbia Variable Portfolio – Select Corporate Income Fund
About Fund Shares and Transactions (continued)
0.40% on an annual basis for payments based on average net assets of the Fund attributable to the financial intermediary, and between 0.05% and 0.25% on an annual basis for a financial intermediary receiving a payment based on gross sales of the Columbia Funds attributable to the financial intermediary.
As employee compensation and business unit operating goals at all levels are generally tied to the success of Ameriprise Financial, employees of Ameriprise Financial and its affiliates, including employees of affiliated broker-dealers and insurance companies, are incented to include shares of the Columbia Funds in Contracts offered by affiliated insurance companies. Certain employees, directly or indirectly, receive higher compensation and other benefits as investment in the Columbia Funds increases. In addition, management, sales leaders and other employees may spend more of their time and resources promoting Ameriprise Financial and its subsidiary companies, including the Distributor and the Investment Manager, and the products they offer, including the Fund.
In addition, the Transfer Agent has certain arrangements in place to compensate financial intermediaries, primarily to affiliated and unaffiliated insurance companies, that hold Fund shares through networked and omnibus accounts, including omnibus retirement plans, for services that they provide to beneficial Fund shareholders (Shareholder Services). Shareholder Services and related fees vary by financial intermediary and may include sub-accounting, sub-transfer agency, participant recordkeeping, shareholder or participant reporting, shareholder or participant transaction processing, maintenance of shareholder records, preparation of account statements and provision of customer service, and are not intended to include services that are primarily intended to result in the sale of Fund shares. Payments for Shareholder Services generally are not expected, with certain limited exceptions, to exceed 0.40% of the average aggregate value of the Fund’s shares. Each Fund pays the Transfer Agent a service fee equal to the payments made by the Transfer Agent to participating insurance companies and other financial intermediaries that provide Shareholder Services up to the lesser of the amount charged by the financial intermediary or a contractual asset-based cap. Payments of amounts that exceed the amount paid by the Fund are borne by the Transfer Agent, the Investment Manager and/or their affiliates.
In addition to the payments described above, the Distributor, the Investment Manager and their affiliates typically make other payments or allow promotional incentives to certain broker-dealers to the extent permitted by SEC and Financial Industry Regulatory Authority (FINRA) rules and by other applicable laws and regulations.
Amounts paid by the Distributor, the Investment Manager and their affiliates are paid out of their own resources and do not increase the amount paid by you or the Fund. You can find further details in the SAI about the payments made by the Distributor, the Investment Manager and their affiliates, as well as a list of the financial intermediaries, including Ameriprise Financial affiliates, to which the Distributor, the Investment Manager or their affiliates have agreed to make Marketing Support Payments and fee payments for Shareholder Services.
Your financial intermediary may charge you fees and commissions in addition to those described in this prospectus. You should consult with your financial intermediary and review carefully any disclosure your financial intermediary provides regarding its services and compensation. Depending on the financial arrangement in place at any particular time, a financial intermediary and its financial advisors may have a conflict of interest or financial incentive with respect to recommendations regarding the Fund or any Contract or Qualified Plan that includes the Fund.
Share Price Determination
The price you pay or receive when you buy, sell or transfer shares is the Fund's next determined net asset value (or NAV) per share for a given share class. The Fund calculates the NAV per share for each class of shares of the Fund at the end of each business day, with the value of the Fund's shares based on the total value of all of the securities and other assets that it holds as of such specified time.
Prospectus 2026
25
Columbia Variable Portfolio – Select Corporate Income Fund
About Fund Shares and Transactions (continued)
FUNDamentals
NAV Calculation
Each of the Fund's share classes calculates its NAV per share as follows:
NAV per share = (Value of assets of the share class) – (Liabilities of the share class)
Number of outstanding shares of the class
Number of outstanding shares of the class
FUNDamentals
Business Days
A business day is any day that the New York Stock Exchange (NYSE) is open. A business day typically ends at the close of regular trading on the NYSE, usually at 4:00 p.m. Eastern time. If the NYSE is scheduled to close early, the business day will be considered to end as of the time of the NYSE’s scheduled close. The Fund will not treat an intraday unscheduled disruption in NYSE trading or an intraday unscheduled closing as a close of regular trading on the NYSE for these purposes and will price its shares as of the regularly scheduled closing time for that day (typically, 4:00 p.m. Eastern time). Nonetheless, the NAV of Fund shares may be determined at such other time or times (in addition to or in lieu of the time set forth above) as the Fund’s Board may approve or ratify. On holidays and other days when the NYSE is closed, the Fund’s NAV is not calculated and the Fund does not accept buy or sell orders. However, the value of the Fund’s assets may still be affected on such days to the extent that the Fund holds foreign securities that trade on days that foreign securities markets are open.
Equity securities listed on an exchange are typically valued at the closing price or last trade on their primary exchange at the close of business of the NYSE. Equity securities without a readily available closing price or that are not listed on any exchange are typically valued at the mean between the closing bid and asked prices. Other equity securities, debt securities and other assets are valued differently. For instance, bank loans trading in the secondary market are fair valued unless market quotations are readily available, fixed income investments maturing in 60 days or less are valued primarily using the amortized cost method, unless this methodology results in a valuation that does not approximate the market value of these securities, and those maturing in excess of 60 days are valued based on prices obtained from a pricing service, if available (which may represent market values or fair values). Investments in other open-end funds are valued at their published NAVs. The value of the Fund’s portfolio securities is determined in accordance with the valuation policy approved by the Board (the Valuation Policy). Pursuant to Rule 2a-5 under the 1940 Act, the Board has designated the Investment Manager as the Fund’s valuation designee. The Investment Manager, in turn, has authorized its valuation committee to make fair value determinations and to carry out supervisory and certain other functions relating to the valuation of Fund portfolio securities, pursuant to the Valuation Policy.
If a market price is not readily available or is deemed not to reflect market value for a portfolio security, the Investment Manager will determine the price based on a determination of the security's fair value pursuant to the Valuation Policy. In addition, the Investment Manager may use fair valuation techniques to price securities that trade on a foreign exchange when a significant event has occurred after the foreign exchange closes but before the time at which the Fund’s share price is calculated. Foreign exchanges typically close before the time at which Fund share prices are calculated, and may be closed altogether on days when the Fund is open. Such significant events affecting a foreign security may include, but are not limited to: (1) corporate actions, earnings announcements, litigation or other events impacting a single issuer; (2) governmental action that affects securities in one sector or country; (3) natural disasters or armed conflicts affecting a country or region; or (4) significant domestic or foreign market fluctuations. The Fund uses various criteria, including an evaluation of U.S. market moves after the close of foreign markets, in determining whether a foreign security's market price is readily available and reflective of market value and, if not, the fair value of the security.
26
Prospectus 2026
Columbia Variable Portfolio – Select Corporate Income Fund
About Fund Shares and Transactions (continued)
Fair valuation may have the effect of reducing stale pricing arbitrage opportunities presented by the pricing of Fund shares. However, when the Investment Manager uses fair valuation to price equity securities, it may value those securities higher or lower than another fund or manager would. Also, fair valuation of Fund holdings may cause the Fund's performance to diverge to a greater degree from the performance of various benchmark indices used to compare the Fund's performance because indices generally do not use fair valuation techniques. Because of the judgment involved in fair valuation decisions, there can be no assurance that the value ascribed to a particular security is accurate. The Fund has retained one or more independent fair valuation pricing services to assist in the fair valuation process for foreign securities.
Futures and options on futures are valued based upon the settlement price as determined by the principal exchange on which they are traded or, in the absence of a settlement price, at the mean of the closing bid and ask. Generally, over-the-counter derivatives, such as swaps and swaptions, are valued based on a price provided by an approved pricing service.
Shareholder Information
Each share class has its own cost structure and other features. Your product may not offer every share class. The Fund encourages you to consult with a financial advisor who can help you with your investment decisions and for more information about the share classes offered by the Fund and available under your product. Shares of the Fund are generally available for purchase only by participating insurance companies in connection with Contracts and Qualified Plan sponsors.
The Fund, the Distributor or the Transfer Agent may refuse any order to buy or transfer shares. If this happens, the Fund will return any money it received, but no interest will be paid on that money.
Shares of the Fund may not be purchased or sold directly by individual Contract owners or participants in a Qualified Plan. When you sell your shares through your Contract or Qualified Plan, the Fund is effectively buying them back. This is called a redemption. The right of redemption may be suspended or payment postponed whenever permitted by applicable laws and regulations, as described under Satisfying Fund Redemption Requests below.
Depending on the context, references to “you” or “your” herein refer either to the holder of a Contract, participant in a Qualified Plan or qualified institutional investor who may select Fund shares to fund his or her investment in the Contract or Qualified Plan or to the participating insurance company as the holder of Fund shares through one or more separate accounts or the Qualified Plan.
Satisfying Fund Redemption Requests
The Fund typically expects to send the redeeming participating insurance company or Qualified Plan sponsor payment for shares within two business days after your trade date. The Fund can suspend redemptions and/or delay payment of redemption proceeds for up to seven days. The Fund can also suspend redemptions and/or delay payment of redemption proceeds in excess of seven days under certain circumstances, including when the NYSE is closed or trading thereon is restricted or during emergency or other circumstances, including as determined by the SEC.
The Fund typically seeks to satisfy redemption requests from cash or cash equivalents held by the Fund, from the proceeds of orders to purchase Fund shares or from the proceeds of sales of Fund holdings effected in the normal course of managing the Fund. However, the Fund may have to sell Fund holdings, including in down markets, to meet heavier than usual redemption requests. For example, under stressed or abnormal market conditions or circumstances, including circumstances adversely affecting the liquidity of the Fund’s investments, the Fund may be more likely to be forced to sell Fund holdings to meet redemptions than under normal market circumstances. In these situations, the Fund’s portfolio managers may have to sell Fund holdings that would not otherwise be sold because, among other reasons, the current price to be received is less than the value of the holdings perceived by the Fund’s portfolio managers. The Fund may also, under certain circumstances (but more likely under stressed or abnormal market conditions or circumstances), borrow money under a credit facility to which the Fund and certain other Columbia Funds are parties or from other Columbia Funds under an interfund lending program (except for closed-end funds and money market funds, which are not eligible to borrow under the program). The Fund and the
Prospectus 2026
27
Columbia Variable Portfolio – Select Corporate Income Fund
About Fund Shares and Transactions (continued)
other Columbia Funds are limited as to the amount that each may individually and collectively borrow under the credit facility and the interfund lending program. As a result, borrowings available to the Fund under the credit facility and the interfund lending program might be insufficient, alone or in combination with the other strategies described herein, to satisfy Fund redemption requests. Please see About Fund Investments – Borrowings – Interfund Lending in the SAI for more information about the credit facility and interfund lending program. The Fund is also limited in the total amount it may borrow. The Fund may only borrow to the extent permitted by the 1940 Act, the rules and regulations thereunder, and any exemptive relief available to the Fund, which currently limit Fund borrowings to 33 1/3% of total assets (including any amounts borrowed) less liabilities (other than borrowings), plus an additional 5% of its total assets for temporary purposes (to be repaid within 60 days without extension or renewal), in each case determined at the time the borrowing is made.
In addition, the Fund reserves the right to honor redemption orders in whole or in part with in-kind distributions of Fund portfolio securities instead of cash if the Investment Manager, in its sole discretion, determines it to be in the best interest of the remaining shareholders. Such in-kind distributions typically represent a pro-rata portion of Fund portfolio assets subject to adjustments (e.g., for non-transferable securities, round lots and derivatives). In the event the Fund distributes portfolio securities in kind, shareholders may incur brokerage and other transaction costs associated with converting the portfolio securities into cash. Also, the portfolio securities may increase or decrease in value after they are distributed but before they are converted into cash. For U.S. federal income tax purposes, redemptions paid in securities are generally treated the same as redemptions paid in cash. If, during any 90-day period, you redeem shares in an amount greater than $250,000 or 1% of the Fund’s net assets (whichever is less), and if the Investment Manager determines it to be feasible and appropriate, the Fund may pay the redemption amount above such threshold by an in-kind distribution of Fund portfolio securities. Although shares of the Fund may not be purchased or sold by individual owners of Contracts or Qualified Plans, this policy applies indirectly to Contract and Qualified Plan owners.
Potential Conflicts of Interest – Mixed and Shared Funding
The Fund is available for purchase only through Contracts offered by participating insurance companies, Qualified Plans and other qualified institutional investors authorized by the Distributor. Due to differences in tax treatment and other considerations, the interests of various Contract owners, and the interests of Qualified Plan participants, if any, may conflict. The Fund does not foresee any disadvantages to investors arising from these potential conflicts of interest at this time. Nevertheless, the Board of the Fund intends to monitor events to identify any material irreconcilable conflicts which may arise, and to determine what action, if any, should be taken in response to any conflicts. If such a conflict were to arise, one or more separate accounts might be required to withdraw its investments in the Fund or shares of another mutual fund may be substituted. This might force the Fund to sell securities at disadvantageous prices.
Order Processing
Orders to buy and sell shares of the Fund that are placed by your participating insurance company or Qualified Plan sponsor are processed on business days. Orders received in “good form” by the Transfer Agent or a financial intermediary, including your participating insurance company or Qualified Plan sponsor, before the end of a business day are priced at the NAV per share of the Fund's applicable share class on that day. Orders received after the end of a business day will receive the next business day’s NAV per share. An order is in “good form” if the Transfer Agent or your financial intermediary has all of the information and documentation it deems necessary to effect your order. The market value of the Fund’s investments may change between the time you submit your order and the time the Fund next calculates its NAV per share. The business day that applies to your order is also called the trade date.
There is no sales charge associated with the purchase of Fund shares, but there may be charges associated with your Contract or Qualified Plan. Any charges that apply to your Contract or Qualified Plan, and any charges that apply to separate accounts of participating insurance companies or Qualified Plans that may own shares directly, are described in your separate Contract prospectus or Qualified Plan disclosure documents.
28
Prospectus 2026
Columbia Variable Portfolio – Select Corporate Income Fund
About Fund Shares and Transactions (continued)
You may transfer all or part of your investment in the Fund to one or more of the other investment options available under your Contract or Qualified Plan. You may provide instructions to sell any amount allocated to the Fund. Proceeds will be mailed within seven days after your surrender or withdrawal request is received in good form by an authorized agent. The amount you receive may be more or less than the amount you invested.
Please refer to your Contract prospectus or Qualified Plan disclosure documents, as applicable, for more information about transfers as well as surrenders and withdrawals.
Information Sharing Agreements
As required by Rule 22c-2 under the 1940 Act, the Fund or certain of its service providers will enter into information sharing agreements with financial intermediaries, including participating life insurance companies and financial intermediaries that sponsor or offer retirement plans through which shares of the Fund are made available for purchase. Pursuant to Rule 22c-2, financial intermediaries are required, upon request, to: (i) provide shareholder account and transaction information; and (ii) execute instructions from the Fund to restrict or prohibit further purchases of Fund shares by shareholders who have been identified by the Fund as having engaged in transactions that violate the Fund's excessive trading policies and procedures.
Excessive Trading Practices Policy of Non-Money Market Funds
Right to Reject or Restrict Share Transaction Orders — The Fund is intended for investors with long-term investment purposes and is not intended as a vehicle for frequent trading activity (market timing) that is excessive. Investors should transact in Fund shares primarily for investment purposes. The Board has adopted excessive trading policies and procedures that are designed to deter excessive trading by investors (the Excessive Trading Policies and Procedures). The Fund discourages and does not accommodate excessive trading. Investments in a Fund by institutional investors in connection with redemptions in-kind are exempt from the Excessive Trading Policies and Procedures because they generally do not raise market timing or excessive trading concerns. Further discussion about the Fund’s use of redemptions in-kind is available under Satisfying Fund Redemption Requests.
The Fund reserves the right to reject, without any prior notice, any purchase or transfer order for any reason, and will not be liable for any loss resulting from rejected orders. For example, the Fund may in its sole discretion restrict or reject a purchase or transfer order even if the transaction is not subject to the specific limitation described below if the Fund or its agents determine that accepting the order could interfere with efficient management of the Fund's portfolio or is otherwise contrary to the Fund's best interests. The Excessive Trading Policies and Procedures apply equally to purchase or transfer transactions communicated directly to the Transfer Agent and to those received by financial intermediaries.
Specific Buying and Transferring Limitations — If the Fund detects that an investor has made two “material round trips” in any 28-day period, it will generally reject the investor's future purchase orders, including transfer buy orders, involving any Fund.
For these purposes, a “round trip” is a purchase or transfer into the Fund followed by a sale or transfer out of the Fund, or a sale or transfer out of the Fund followed by a purchase or transfer into the Fund. A “material” round trip is one that is deemed by the Fund to be material in terms of its amount or its potential detrimental impact on the Fund. Independent of this limit, the Fund may, in its sole discretion, reject future purchase orders by any person, group or account that appears to have engaged in any type of excessive trading activity.
These limits generally do not apply to automated transactions or transactions by registered investment companies in a “fund-of-funds” structure. These limits do not apply to payroll deduction contributions by retirement plan participants, transactions initiated by a retirement plan sponsor or certain other retirement plan transactions consisting of rollover transactions, loan repayments and disbursements, and required minimum distribution redemptions. They may be modified or rescinded for accounts held by certain retirement plans to conform to plan limits, for considerations relating to the Employee Retirement Income Security Act of 1974 or regulations of the Department of Labor, and for certain asset allocation or wrap programs. Accounts known to be under common ownership or control generally will be counted together, but accounts maintained or managed by a common
Prospectus 2026
29
Columbia Variable Portfolio – Select Corporate Income Fund
About Fund Shares and Transactions (continued)
intermediary generally will not be considered to be under common ownership or control. The Fund reserves the right to modify these restrictions at any time without prior notice to shareholders. In addition, the Fund may, in its sole discretion, reinstate trading privileges that have been revoked under the Fund's Excessive Trading Policies and Procedures.
Limitations on the Ability to Detect and Prevent Excessive Trading Practices — The Fund takes various steps designed to detect and prevent excessive trading, including daily review of available shareholder transaction information. However, the Fund receives buy, sell or transfer orders through financial intermediaries, and cannot always know of or reasonably detect excessive trading that may be facilitated by financial intermediaries or by the use of the omnibus account arrangements they offer. Omnibus account arrangements are common forms of holding shares of mutual funds, particularly among certain financial intermediaries such as broker-dealers, retirement plans and variable insurance products. These arrangements often permit financial intermediaries to aggregate their clients' transactions and accounts, and in these circumstances, the identities of the financial intermediary clients that beneficially own Fund shares are often not known to the Fund.
Some financial intermediaries apply their own restrictions or policies to their clients’ transactions and accounts, which may be more or less restrictive than those described here. This may impact the Fund's ability to curtail excessive trading, even where it is identified. For these and other reasons, it is possible that excessive trading may occur despite the Fund's efforts to detect and prevent it.
Although these restrictions and policies involve judgments that are inherently subjective and may involve some selectivity in their application, the Fund seeks to act in a manner that it believes is consistent with the best interests of Fund shareholders in making any such judgments.
Risks of Excessive Trading — Excessive trading creates certain risks to the Fund's long-term shareholders and may create the following adverse effects:
■
negative impact on the Fund's performance;
■
potential dilution of the value of the Fund's shares;
■
interference with the efficient management of the Fund's portfolio, such as the need to maintain undesirably large cash positions, the need to use its line of credit or the need to buy or sell securities it otherwise would not have bought or sold;
■
losses on the sale of investments resulting from the need to sell securities at less favorable prices; and
■
increased brokerage and administrative costs.
To the extent that the Fund invests significantly in foreign securities traded on markets that close before the Fund's valuation time, it may be particularly susceptible to dilution, which may be exacerbated as a result of excessive trading. Because events may occur after the close of foreign markets and before the Fund's valuation time that influence the value of foreign securities, investors may seek to trade Fund shares in an effort to benefit from their understanding of the value of foreign securities as of the Fund's valuation time. This is often referred to as price arbitrage. The Fund has adopted procedures designed to adjust closing market prices of foreign securities under certain circumstances to reflect what the Fund believes to be the fair value of those securities as of its valuation time. To the extent the adjustments do not work fully, investors engaging in price arbitrage may cause dilution in the value of the Fund's shares held by other shareholders.
Similarly, to the extent that the Fund invests significantly in thinly traded securities and other debt instruments that are rated below investment grade (commonly called “high-yield” or “junk” bonds), equity securities of small-capitalization companies, floating rate loans, or tax-exempt or other securities that may trade infrequently, because these securities are often traded infrequently, investors may seek to trade Fund shares in an effort to benefit from their understanding of the value of these securities as of the Fund's valuation time. This is also a type of price arbitrage. Any such frequent trading strategies may interfere with efficient management of the Fund's portfolio to a greater degree than would be the case for mutual funds that invest only, or significantly, in highly liquid securities, in part because the Fund may have difficulty selling these particular investments at advantageous times or prices to satisfy large and/or frequent sell orders. Any successful price arbitrage may also cause dilution in the value of Fund shares held by non-redeeming shareholders.
30
Prospectus 2026
Columbia Variable Portfolio – Select Corporate Income Fund
About Fund Shares and Transactions (continued)
Excessive Trading Practices Policy of Columbia Variable Portfolio - Government Money Market Fund
A money market fund is designed to offer investors a liquid cash option that they may buy and sell as often as they wish. Accordingly, the Board has not adopted policies and procedures designed to discourage excessive or short-term trading of Columbia Variable Portfolio - Government Money Market Fund shares. However, since frequent purchases and sales of Columbia Variable Portfolio - Government Money Market Fund shares could in certain instances harm shareholders in various ways, including reducing the returns to long-term shareholders by increasing costs (such as spreads paid to dealers who trade money market instruments with Columbia Variable Portfolio - Government Money Market Fund) and disrupting portfolio management strategies, Columbia Variable Portfolio - Government Money Market Fund reserves the right, but has no obligation, to reject any purchase or transfer transaction at any time. Columbia Variable Portfolio - Government Money Market Fund has no limits on purchase or transfer transactions. In addition, Columbia Variable Portfolio - Government Money Market Fund reserves the right to impose or modify restrictions on purchases, transfers or trading of Fund shares at any time.
Prospectus 2026
31
Columbia Variable Portfolio – Select Corporate Income Fund
Distributions and Taxes
Distributions to Shareholders
A mutual fund can make money two ways:
■
It can earn income on its investments. Examples of fund income are interest paid on money market instruments and bonds, and dividends paid on common stocks.
■
A mutual fund can also have capital gains if the value of its investments increases. While a fund continues to hold an investment, any gain is generally unrealized. If the fund sells an investment, it generally will realize a capital gain if it sells that investment for a higher price than its adjusted cost basis, and will generally realize a capital loss if it sells that investment for a lower price than its adjusted cost basis. Capital gains and losses are either short-term or long-term, depending on whether the fund holds the securities for one year or less (short-term) or more than one year (long-term).
Mutual funds make payments of fund earnings to shareholders, distributing them among all shareholders of the fund. As a shareholder, you are entitled to your portion of a fund's distributed income, including capital gains. Reinvesting your distributions buys you more shares of a fund — which lets you take advantage of the potential for compound growth. Putting the money you earn back into your investment means it, in turn, may earn even more money (or be exposed to additional losses, if the fund earns a negative return). Over time, the power of compounding has the potential to significantly increase the value of your investment. There is no assurance, however, that you'll earn more money if you reinvest your distributions rather than receive them in cash.
The Fund intends to pay out, in the form of distributions to shareholders, a sufficient amount of its income and gains so that the Fund will qualify for treatment as a regulated investment company and generally will not have to pay any federal income or excise tax. The Fund generally intends to distribute any net realized capital gain (whether long-term or short-term gain) at least once a year. Normally, the Fund will declare and pay distributions of net investment income according to the following schedule:
| Declaration and Distribution Schedule | |
| Declarations |
Annually |
| Distributions |
Annually |
The Fund may declare or pay distributions of net investment income more frequently.
Different share classes of the Fund usually pay different net investment income distribution amounts, because each class has different expenses. Each time a distribution is made, the NAV per share of the share class is reduced by the amount of the distribution.
The Fund will automatically reinvest distributions in additional shares of the same share class of the Fund unless you inform us you want to receive your distributions to be paid in cash.
Taxes and Your Investment
Taxation of the Fund: The Fund has elected and intends to qualify and to be eligible for treatment each year as a regulated investment company. A regulated investment company generally is not subject to tax at the fund level on income and gains from investments that are distributed to shareholders. However, the Fund’s failure to qualify and be eligible for treatment as a regulated investment company would result in fund-level taxation, and consequently, a reduction in income available for distribution to you.
Taxation of Fund Shares: Shares of the Fund are only offered to separate accounts of participating insurance companies, Qualified Plans, and certain other eligible persons or plans permitted to hold shares of the Fund pursuant to the applicable U.S. Treasury Regulations without impairing the ability of participating insurance companies to satisfy the diversification requirements of Section 817(h) of the Internal Revenue Code of 1986, as amended. Each participating insurance company, including each participating insurance company that is an affiliate of the Investment Manager, includes in its taxable income any net investment income derived from the investment of assets held in its separate accounts because the insurance company is considered the owner of these assets under federal income tax law. The insurance company may claim certain tax benefits associated with this investment
32
Prospectus 2026
Columbia Variable Portfolio – Select Corporate Income Fund
Distributions and Taxes (continued)
income. These benefits, which may include foreign tax credits (which can reduce the insurance company’s U.S. taxes on foreign source income) and the corporate dividends-received deduction (which is a tax deduction for the insurance company attributable to certain dividends received from the Fund), are not passed on to Contract owners since the affiliated insurance company is the owner of the assets under federal tax law and is taxed on the investment income generated by the assets.
Taxation of Variable Annuity Contracts and Variable Life Insurance Policies: Your Contract may qualify for favorable tax treatment. Please refer to your Contract prospectus for more information about the tax implications of your investment in the Contract. As long as your Contract continues to qualify for such favorable tax treatment, you will not be taxed currently on your investment in the Fund through such Contract, even if the Fund makes distributions to the separate account and/or you change your investment options under the Contract. In order to qualify for such treatment, among other things, the separate accounts of participating insurance companies, which maintain and invest net proceeds from Contracts, must be “adequately diversified.” The Fund intends to operate in such a manner so that a separate account investing only in Fund shares on behalf of a holder of a Contract will be “adequately diversified.” If the Fund does not meet such requirements because its investments are not adequately diversified, your Contract could lose its favorable tax treatment, and income and gain allocable to your Contract could be taxable currently to you. This could also occur if Contract holders are found to have an impermissible level of control over the investments underlying their Contracts. You should consult with the participating insurance company that issued your Contract, plan sponsor, or other eligible investor through which your investment in the Fund is made regarding the U.S. federal income taxation of your investment.
FUNDamentals
Taxes
The information provided above is only a summary of how U.S. federal income taxes may affect your indirect investment in the Fund. It is not intended as a substitute for careful tax planning. Your investment in the Fund may have other tax implications. It does not apply to certain types of investors who may be subject to special rules, including foreign or tax-exempt investors or those holding Fund shares through a tax-advantaged account other than a Contract, such as a 401(k) plan or IRA. Please see the SAI for more detailed tax information. You should consult with your own tax advisor about the particular tax consequences to you of an investment in the Fund, including the effect of any foreign, state and local taxes, and the effect of possible changes in applicable tax laws.
Prospectus 2026
33
Columbia Variable Portfolio – Select Corporate Income Fund
Financial Highlights
The financial highlights table is intended to help you understand the Fund’s financial performance for the past five fiscal years or, if shorter, the Fund’s period of operations. Certain information reflects financial results for a single Fund share. Per share net investment income (loss) amounts are calculated based on average shares outstanding during the period. The total return in the table represents the rate that an investor would have earned (or lost) on an investment in the Fund assuming all dividends and distributions had been reinvested. Total return does not reflect any fees and expenses imposed under your Contract and/or Qualified Plan, as applicable; such fees and expenses would reduce the total return for all periods shown. Total return and portfolio turnover are not annualized for periods of less than one year. The ratios of expenses and net investment income are annualized for periods of less than one year. The portfolio turnover rate is calculated without regard to purchase and sales transactions of short-term instruments and certain derivatives, if any. If such transactions were included, the Fund’s portfolio turnover rate may be higher. A zero balance may reflect an amount rounding to less than $0.01 or 0.01%. This information has been audited by PricewaterhouseCoopers LLP, an independent registered public accounting firm, whose report, along with the Fund’s financial statements, is included in the Fund’s Form N-CSR, which is available upon request.
Prospectus 2026
35
Columbia Variable Portfolio – Select Corporate Income Fund
Financial Highlights (continued)
| |
Net asset value, beginning of period |
Net investment income |
Net realized and unrealized gain (loss) |
Total from investment operations |
Distributions from net investment income |
Total distributions to shareholders |
| Class 1 | ||||||
| Year Ended 12/31/2025 |
$7.80 |
0.34 |
0.25 |
0.59 |
(0.54) |
(0.54) |
| Year Ended 12/31/2024 |
$7.81 |
0.35 |
(0.10) |
0.25 |
(0.26) |
(0.26) |
| Year Ended 12/31/2023 |
$7.34 |
0.33 |
0.39 |
0.72 |
(0.25) |
(0.25) |
| Year Ended 12/31/2022 |
$8.77 |
0.26 |
(1.42) |
(1.16) |
(0.27) |
(0.27) |
| Year Ended 12/31/2021 |
$9.01 |
0.25 |
(0.13) |
0.12 |
(0.36) |
(0.36) |
| Class 2 | ||||||
| Year Ended 12/31/2025 |
$7.65 |
0.32 |
0.23 |
0.55 |
(0.52) |
(0.52) |
| Year Ended 12/31/2024 |
$7.65 |
0.32 |
(0.08) |
0.24 |
(0.24) |
(0.24) |
| Year Ended 12/31/2023 |
$7.21 |
0.31 |
0.36 |
0.67 |
(0.23) |
(0.23) |
| Year Ended 12/31/2022 |
$8.61 |
0.24 |
(1.39) |
(1.15) |
(0.25) |
(0.25) |
| Year Ended 12/31/2021 |
$8.86 |
0.23 |
(0.14) |
0.09 |
(0.34) |
(0.34) |
| Class 3 | ||||||
| Year Ended 12/31/2025 |
$7.73 |
0.33 |
0.24 |
0.57 |
(0.53) |
(0.53) |
| Year Ended 12/31/2024 |
$7.74 |
0.34 |
(0.10) |
0.24 |
(0.25) |
(0.25) |
| Year Ended 12/31/2023 |
$7.28 |
0.32 |
0.38 |
0.70 |
(0.24) |
(0.24) |
| Year Ended 12/31/2022 |
$8.70 |
0.25 |
(1.41) |
(1.16) |
(0.26) |
(0.26) |
| Year Ended 12/31/2021 |
$8.95 |
0.24 |
(0.14) |
0.10 |
(0.35) |
(0.35) |
| Notes to Financial Highlights | |
| (a) |
In addition to the fees and expenses that the Fund bears directly, the Fund indirectly bears a pro rata share of the fees and expenses of any other funds in which it invests. Such indirect expenses are not included in the Fund's reported expense ratios. |
| (b) |
Total net expenses include the impact of certain fee waivers/expense reimbursements made by the Investment Manager and certain of its affiliates, if applicable. |
| (c) |
Ratios include interest on collateral expense which is less than 0.01%. |
36
Prospectus 2026
Columbia Variable Portfolio – Select Corporate Income Fund
Financial Highlights (continued)
| |
Net asset value, end of period |
Total return |
Total gross expense ratio to average net assets(a) |
Total net expense ratio to average net assets(a),(b) |
Net investment income ratio to average net assets |
Portfolio turnover |
Net assets, end of period (000's) |
| Class 1 | |||||||
| Year Ended 12/31/2025 |
$7.85 |
7.93% |
0.51%(c) |
0.47%(c) |
4.41% |
94% |
$1,857,568 |
| Year Ended 12/31/2024 |
$7.80 |
3.35% |
0.93% |
0.59% |
4.52% |
44% |
$309 |
| Year Ended 12/31/2023 |
$7.81 |
10.00% |
0.89% |
0.61% |
4.47% |
38% |
$10 |
| Year Ended 12/31/2022 |
$7.34 |
(13.49%) |
0.87%(c) |
0.64%(c) |
3.42% |
31% |
$9 |
| Year Ended 12/31/2021 |
$8.77 |
1.37% |
0.89%(c) |
0.61%(c) |
2.87% |
42% |
$11 |
| Class 2 | |||||||
| Year Ended 12/31/2025 |
$7.68 |
7.55% |
0.77%(c) |
0.76%(c) |
4.19% |
94% |
$16,207 |
| Year Ended 12/31/2024 |
$7.65 |
3.30% |
1.18% |
0.84% |
4.26% |
44% |
$11,455 |
| Year Ended 12/31/2023 |
$7.65 |
9.47% |
1.14% |
0.86% |
4.20% |
38% |
$10,438 |
| Year Ended 12/31/2022 |
$7.21 |
(13.63%) |
1.12%(c) |
0.89%(c) |
3.17% |
31% |
$9,953 |
| Year Ended 12/31/2021 |
$8.61 |
1.03% |
1.14%(c) |
0.86%(c) |
2.62% |
42% |
$11,301 |
| Class 3 | |||||||
| Year Ended 12/31/2025 |
$7.77 |
7.74% |
0.65%(c) |
0.63%(c) |
4.31% |
94% |
$68,368 |
| Year Ended 12/31/2024 |
$7.73 |
3.25% |
1.05% |
0.71% |
4.39% |
44% |
$68,029 |
| Year Ended 12/31/2023 |
$7.74 |
9.81% |
1.02% |
0.74% |
4.32% |
38% |
$71,109 |
| Year Ended 12/31/2022 |
$7.28 |
(13.60%) |
0.99%(c) |
0.76%(c) |
3.28% |
31% |
$70,602 |
| Year Ended 12/31/2021 |
$8.70 |
1.14% |
1.01%(c) |
0.74%(c) |
2.74% |
42% |
$91,320 |
Prospectus 2026
37
Columbia Variable Portfolio – Select Corporate Income Fund

For More Information
The Fund is generally available only to owners of Contracts issued by participating insurance companies and participants in Qualified Plans. Please refer to your Contract prospectus or Qualified Plan disclosure documents for information about how to buy, sell and transfer shares of the Fund.
Additional Information About the Fund
Additional information about the Fund’s investments is available in the Fund’s annual and semiannual reports to shareholders and in Form N-CSR. In the Fund’s annual report, you will find a discussion of the market conditions and investment strategies that significantly affected the Fund’s performance during its last fiscal year. In the Fund’s Form N-CSR, you will find the Fund’s annual and semiannual financial statements. The SAI also provides additional information about the Fund and its policies. The SAI, which has been filed with the SEC, is legally part of this prospectus (incorporated by reference). To obtain these documents free of charge, to request other information about the Fund and to make shareholder inquiries, please contact the Fund as follows:
By Mail: Columbia Management Investment Services Corp.
P.O. Box 219104
Kansas City, MO 64121-9104
P.O. Box 219104
Kansas City, MO 64121-9104
By Telephone: 800.345.6611
Online: columbiathreadneedleus.com
Reports and other information about the Fund are also available in the EDGAR Database on the SEC’s website at http://www.sec.gov. You can receive copies of this information, for a duplication fee, by electronic request at the following e-mail address: publicinfo@sec.gov.
The investment company registration number of Columbia Funds Variable Series Trust II, of which the Fund is a series, is 811-22127.
Columbia Threadneedle Investments (Columbia Threadneedle) is the global brand name of the Columbia and Threadneedle group of companies.
The Fund is distributed by Columbia Management Investment Distributors, Inc., 290 Congress Street, Boston, MA 02210.
The Fund is distributed by Columbia Management Investment Distributors, Inc., 290 Congress Street, Boston, MA 02210.
© 2026 Columbia Threadneedle. All rights reserved.
PRO7008_12_E01_(05/26)

Columbia Variable Portfolio – Emerging Markets Bond Fund
Prospectus
May 1, 2026
As with all mutual funds, the Securities and Exchange Commission (SEC) has not approved or disapproved these securities or passed upon the adequacy of this prospectus. Any representation to the contrary is a criminal offense.

Columbia Variable Portfolio – Emerging Markets Bond Fund
Table of Contents
| 3 | |
| 3 | |
| 3 | |
| 3 | |
| 4 | |
| 10 | |
| 11 | |
| 11 | |
| 11 | |
| 11 | |
| 12 | |
| 12 | |
| 12 | |
| 13 | |
| 22 | |
| 25 | |
| 28 | |
| 28 | |
| 30 | |
| 30 | |
| 30 | |
| 31 | |
| 33 | |
| 38 | |
| 38 | |
| 38 | |
| 41 |
2
Prospectus 2026
Columbia Variable Portfolio – Emerging Markets Bond Fund
Summary of the Fund
Investment Objective
Columbia Variable Portfolio – Emerging Markets Bond Fund (the Fund) seeks to provide shareholders with high total return through current income and, secondarily, through capital appreciation.
Fees and Expenses of the Fund
This table describes the fees and expenses that you may pay as an investor in the Fund. The table does not reflect any fees or expenses imposed by your Contract or Qualified Plan, which are disclosed in your separate Contract prospectus or Qualified Plan disclosure documents. If the additional fees or expenses were reflected, the expenses set forth below would be higher.
| Annual Fund Operating Expenses (expenses that you pay each year as a percentage of the value of your investment) | ||
| |
Class 1 |
Class 2 |
| Management fees |
% |
% |
| Distribution and/or service (12b-1) fees |
% |
% |
| Other expenses |
% |
% |
| Total annual Fund operating expenses(a) |
% |
% |
(a)
Example
The following example is intended to help you compare the cost of investing in the Fund with the cost of investing in other mutual funds. The example illustrates the hypothetical expenses that you would incur over the time periods indicated, and assumes that:
■
you invest $10,000 in the applicable class of Fund shares for the periods indicated,
■
your investment has a 5% return each year, and
■
the Fund’s total annual operating expenses remain the same as shown in the Annual Fund Operating Expenses table above.
The example does not reflect any fees and expenses that apply to your Contract or Qualified Plan. Inclusion of these charges would increase expenses for all periods shown.
Although your actual costs may be higher or lower, based on the assumptions listed above, your costs would be:
| |
1 year |
3 years |
5 years |
10 years |
| Class 1 (whether or not shares are redeemed) |
$ |
$ |
$ |
$ |
| Class 2 (whether or not shares are redeemed) |
$ |
$ |
$ |
$ |
Portfolio Turnover
The Fund may pay transaction costs, such as commissions, when it buys and sells securities (or “turns over” its portfolio). A higher portfolio turnover rate may indicate higher transaction costs. These costs, which are not reflected in annual fund operating expenses or in the example, affect the Fund’s performance. During the most recent fiscal year, the Fund’s portfolio turnover rate was 46 % of the average value of its portfolio.
Principal Investment Strategies
The Fund invests primarily in fixed income securities of emerging markets issuers. For these purposes, emerging market countries are generally those either defined by World Bank-defined per capita income brackets or determined to be an emerging market based on the Fund investment team’s qualitative judgments about a country’s level of
Prospectus 2026
3
Columbia Variable Portfolio – Emerging Markets Bond Fund
Summary of the Fund (continued)
economic and institutional development, among other factors. Under normal circumstances, at least 80% of the Fund’s net assets (plus the amount of any borrowings for investment purposes) will be invested in fixed income securities of issuers that are located in emerging markets countries, or that earn 50% or more of their total revenues from goods or services produced in emerging markets countries or from sales made in emerging markets countries. Fixed income securities may be denominated in either U.S. dollars or the local currency of the issuer. While the Fund may invest 25% or more of its total assets in the securities of foreign governmental and corporate entities located in the same country, it will not invest 25% or more of its total assets in any single issuer. From time to time, the Fund may focus its investments in certain countries or geographic areas, including the Latin America region along with the Middle East and North Africa region. The Fund can invest in emerging market sovereign debt instruments of any credit quality, including those rated investment grade and below investment grade or considered to be of comparable quality (commonly referred to as “high yield” investments or “junk bonds”). Although the emerging markets sovereign debt universe largely consists of investment grade instruments, a significant portion of that universe is rated in these lower rating categories. The Fund may invest up to 100% of its assets in debt securities that are rated below investment grade or, if unrated, determined to be of comparable quality.
The Fund may invest in debt instruments of any maturity and does not seek to maintain a particular dollar-weighted average maturity.
The Fund may invest in derivatives, such as forward contracts (including forward foreign currency contracts), futures (including interest rate futures), and swaps (including credit default swaps and credit default swap indexes) for hedging and investment purposes.
The Fund may invest in privately placed and other securities or instruments that are purchased and sold pursuant to Rule 144A or other exemptions under the Securities Act of 1933, as amended, subject to certain regulatory restrictions. The Fund also invests in money market instruments (which may include investments in one or more affiliated or unaffiliated money market funds or similar vehicles).
The Fund is non-diversified, which means that it can invest a greater percentage of its assets in the securities of fewer issuers than can a diversified fund.
Principal Risks
An investment in the Fund involves risks, including Emerging Market Securities Risk, Foreign Securities Risk, High-Yield Investments Risk, Sovereign Debt Risk, Interest Rate Risk, Credit Risk, Market Risk, and Changing Distribution Level Risk, among others. Descriptions of these and other principal risks of investing in the Fund are provided below. There is no assurance that the Fund will achieve its investment objective and you may lose money. The value of the Fund’s holdings may decline, and the Fund’s net asset value (NAV) and share price may go down. An investment in the Fund is not a bank deposit and is not insured or guaranteed by the Federal Deposit Insurance Corporation or any other government agency. The significance of any specific risk to an investment in the Fund will vary over time depending on the composition of the Fund's portfolio, market conditions, and other factors. You should read all of the risk information below carefully, because any one or more of these risks may result in losses to the Fund.
Active Management Risk. Due to its active management, the Fund could underperform its benchmark index and/or other funds with similar investment objectives and/or strategies.
Changing Distribution Level Risk. The Fund normally expects to receive income which may include interest, dividends and/or capital gains, depending upon its investments. The distribution amounts paid by the Fund will vary and generally depend on the amount of income the Fund earns (less expenses) on its portfolio holdings, and capital gains or losses it recognizes. A decline in the Fund’s income or net capital gains arising from its investments may reduce its distribution level.
Counterparty Risk. Counterparty risk is the risk that a counterparty to a transaction in a financial instrument held by the Fund or by a special purpose or structured vehicle invested in by the Fund may become insolvent or otherwise fail to perform its obligations. As a result, the Fund may obtain no or limited recovery of its investment, and any recovery may be significantly delayed.
4
Prospectus 2026
Columbia Variable Portfolio – Emerging Markets Bond Fund
Summary of the Fund (continued)
Credit Risk. Credit risk is the risk that the value of debt instruments may decline if the issuer thereof defaults or otherwise becomes unable or unwilling, or is perceived to be unable or unwilling, to honor its financial obligations, such as making payments to the Fund when due. Credit rating agencies, such as S&P Global Ratings, Moody’s Investors Service, Inc. (Moody’s Ratings), Fitch Ratings, Inc. (Fitch), Morningstar DBRS (DBRS) and Kroll Bond Rating Agency, LLC (KBRA), assign credit ratings to certain debt instruments to indicate their credit risk. A rating downgrade by such agencies can negatively impact the value of such instruments. Lower-rated or unrated instruments held by the Fund may present increased credit risk as compared to higher-rated instruments. Non-investment grade debt instruments may be subject to greater price fluctuations and are more likely to experience a default than investment grade debt instruments and therefore may expose the Fund to increased credit risk. If the Fund purchases unrated instruments, or if the ratings of instruments held by the Fund are lowered after purchase, the Fund will depend on analysis of credit risk more heavily than usual.
Derivatives Risk. Derivatives may involve significant risks. Derivatives are financial instruments with a value in relation to, or derived from, the value of an underlying asset(s) or other reference, such as an index, rate or other economic indicator (each an underlying reference). Derivatives may include those that are privately placed or otherwise exempt from SEC registration, including certain Rule 144A eligible securities. Derivatives could result in Fund losses if the underlying reference does not perform as anticipated. Use of derivatives is a highly specialized activity that can involve investment techniques, risks, and tax planning different from those associated with more traditional investment instruments. The Fund’s derivatives strategy may not be successful, and use of certain derivatives could result in substantial, potentially unlimited, losses to the Fund regardless of the Fund’s actual investment. A relatively small movement in the price, rate or other economic indicator associated with the underlying reference may result in substantial losses for the Fund. Derivatives may be more volatile than other types of investments. The value of derivatives may be influenced by a variety of factors, including national and international political and economic developments. Potential changes to the regulation of the derivatives markets may make derivatives more costly, may limit the market for derivatives, or may otherwise adversely affect the value or performance of derivatives. Derivatives can increase the Fund’s risk exposure to underlying references and their attendant risks, such as credit risk, market risk, foreign currency risk and interest rate risk, while potentially exposing the Fund to correlation risk, counterparty risk, hedging risk, inflation risk, leverage risk, liquidity risk, pricing risk and volatility risk.
Derivatives Risk – Forward Contracts Risk. A forward contract is an over-the-counter derivative transaction between two parties to buy or sell a specified amount of an underlying reference at a specified price (or rate) on a specified date in the future. Forward contracts are negotiated on an individual basis and are not standardized or traded on exchanges. The market for forward contracts is substantially unregulated and can experience lengthy periods of illiquidity, unusually high trading volume and other negative impacts, such as political intervention, which may result in volatility or disruptions in such markets. A relatively small price movement in a forward contract may result in substantial losses to the Fund, exceeding the amount of the margin paid. Forward contracts can increase the Fund’s risk exposure to underlying references and their attendant risks, such as credit risk, market risk, foreign currency risk and interest rate risk, while potentially exposing the Fund to correlation risk, counterparty risk, hedging risk, inflation risk, leverage risk, liquidity risk, pricing risk and volatility risk.
Derivatives Risk – Futures Contracts Risk. A futures contract is an exchange-traded derivative transaction between two parties in which a buyer (holding the “long” position) agrees to pay a fixed price (or rate) at a specified future date for delivery of an underlying reference from a seller (holding the “short” position). The seller hopes that the market price on the delivery date is less than the agreed upon price, while the buyer hopes for the contrary. Certain futures contract markets are highly volatile, and futures contracts may be illiquid. Futures exchanges may limit fluctuations in futures contract prices by imposing a maximum permissible daily price movement. The Fund may be disadvantaged if it is prohibited from executing a trade outside the daily permissible price movement. At or prior to maturity of a futures contract, the Fund may enter into an offsetting contract and may incur a loss to the extent there has been adverse movement in futures contract prices. The liquidity of the futures markets depends on participants entering into offsetting transactions rather than making or taking delivery. To the extent participants make or take delivery, liquidity in the futures market could be reduced. Because of the low margin deposits normally required in futures trading, it is possible that the Fund may employ a high degree of leverage in the portfolio. As a result, a
Prospectus 2026
5
Columbia Variable Portfolio – Emerging Markets Bond Fund
Summary of the Fund (continued)
relatively small price movement in a futures contract may result in substantial losses to the Fund, exceeding the amount of the margin paid. For certain types of futures contracts, losses are potentially unlimited. Futures markets are highly volatile, and the use of futures may increase the volatility of the Fund’s NAV. Futures contracts executed (if any) on foreign exchanges may not provide the same protection as U.S. exchanges. Futures contracts can increase the Fund’s risk exposure to underlying references and their attendant risks, such as credit risk, market risk, foreign currency risk and interest rate risk, while potentially exposing the Fund to correlation risk, counterparty risk, hedging risk, inflation risk, leverage risk, liquidity risk, pricing risk and volatility risk.
Derivatives Risk – Swaps Risk. In a typical swap transaction, two parties agree to exchange the return earned on a specified underlying reference for a fixed return or the return from another underlying reference during a specified period of time. Swaps may be difficult to value and may be illiquid. Swaps could result in Fund losses if the underlying asset or reference does not perform as anticipated. Swaps create significant investment leverage such that a relatively small price movement in a swap may result in immediate and substantial losses to the Fund. The Fund may only close out a swap with its particular counterparty and may only transfer a position with the consent of that counterparty. Certain swaps, such as short swap transactions and total return swaps, have the potential for unlimited losses, regardless of the size of the initial position. Swaps can increase the Fund’s risk exposure to underlying references and their attendant risks, such as credit risk, market risk, foreign currency risk and interest rate risk, while potentially exposing the Fund to correlation risk, counterparty risk, hedging risk, inflation risk, leverage risk, liquidity risk, pricing risk and volatility risk.
Emerging Market Securities Risk. Securities issued by foreign governments or companies in emerging market countries, such as China, Russia and certain countries in Eastern Europe, the Middle East, Asia, Latin America or Africa, are more likely to have greater exposure to the risks of investing in foreign securities that are described in Foreign Securities Risk. In addition, emerging market countries are more likely to experience instability resulting, for example, from rapid changes or developments in social, political, economic or other conditions. Their economies are usually less mature and their securities markets are typically less developed with more limited trading activity (i.e., lower trading volumes and less liquidity) than more developed countries. Emerging market securities tend to be more volatile, and may be more susceptible to market manipulation, than securities in more developed markets. Many emerging market countries are heavily dependent on international trade and have fewer trading partners, which makes them more sensitive to world commodity prices and economic downturns in other countries, and some have a higher risk of currency devaluations. Due to the differences in the nature and quality of financial information of issuers of emerging market securities, including auditing and financial reporting standards, financial information and disclosures about such issuers may be unavailable or, if made available, may be considerably less reliable than publicly available information about other foreign securities.
Fixed Income Instruments Risk. The Fund is subject to the general risks and considerations associated with investing in debt securities, including the risk that issuers will fail to make timely payments of principal or interest or default altogether. Lower-rated securities in which the Fund may invest may be more volatile and may decline more in price in response to negative issuer developments or general economic news than higher rated securities. In addition, as interest rates rise, the Fund’s investments typically will lose value.
Foreign Currency Risk. The performance of the Fund may be materially affected positively or negatively by foreign currency strength or weakness relative to the U.S. dollar, particularly if the Fund invests a significant percentage of its assets in foreign securities or other assets denominated in currencies other than the U.S. dollar.
Foreign Securities Risk. Investments in or exposure to securities of foreign companies may involve heightened risks relative to investments in or exposure to securities of U.S. companies. Investing in securities of foreign companies subjects the Fund to the risks associated with an issuer’s (and any of its related companies’) country of organization and places of business operations, including risks related to political, regulatory, economic, social, diplomatic and other conditions or events (including, for example, military confrontations and actions, war, other conflicts, terrorism and disease/virus outbreaks and epidemics) occurring in the country or region, as well as risks associated with less developed custody and settlement practices. Foreign securities may be more volatile and less liquid than securities of U.S. companies and are subject to the risks associated with potential imposition of economic and other sanctions
6
Prospectus 2026
Columbia Variable Portfolio – Emerging Markets Bond Fund
Summary of the Fund (continued)
against a particular foreign country, its nationals or industries or businesses within the country. In addition, foreign governments may impose withholding or other taxes on the Fund’s income, capital gains or proceeds from the disposition of foreign securities, which could reduce the Fund’s return on such securities.
Frontier Market Risk. Frontier market countries generally have smaller economies and even less developed capital markets than traditional emerging market countries (which themselves have increased investment risk relative to more developed market countries) and, as a result, the Fund’s exposure to the risks associated with investing in emerging market countries are magnified when the Fund invests in frontier market countries. Increased risks include: the potential for extreme price volatility and illiquidity in frontier market countries; government ownership or control of parts of the private sector and of certain companies; trade barriers, exchange controls, managed adjustments in relative currency values and other protectionist and similar measures imposed or negotiated by the countries with which frontier market countries trade; and the relatively new and unsettled securities laws in many frontier market countries.
Geographic Focus Risk. The Fund may be particularly susceptible to risks related to economic, political, regulatory or other events or conditions affecting issuers and countries within the specific geographic regions in which the Fund invests. The Fund’s NAV may be more volatile than the NAV of a more geographically diversified fund.
■
Latin America Region. The Fund is particularly susceptible to risks related to economic, political, regulatory, legal, social or other events or conditions affecting issuers in, or those that have investment exposure to, the Latin America region. These include risks of elevated and volatile interest, inflation and unemployment rates. Currency devaluations, exchange rate volatility and relatively high dependence upon commodities and international trade may also present additional risks for the Fund. Latin American economies may be susceptible to adverse government regulatory and economic intervention and controls, limitations in the ability to repatriate investment income, capital or the proceeds of the sale of securities, inadequate investor protections, less developed custody, settlement, regulatory, accounting, auditing and financial standards, unfavorable changes in laws or regulations, natural disasters, corruption and military activity.
■
Middle East and North Africa Region. The Fund is particularly susceptible to risks related to economic, political, regulatory, legal, social or other events or conditions affecting issuers in, or those that have investment exposure to, the Middle East and North Africa region. These include the risk of local and regional conflicts including terrorist activity, religious, ethnic and/or socio-economic unrest, acts of war or other conflicts in the region and elevated risks of volatile interest rates, excessive inflation and unemployment rates. Currency devaluations, exchange rate volatility and relatively high dependence upon commodities and international trade may also present additional risks for the Fund. Middle Eastern and North African economies may be susceptible to adverse government regulatory and economic intervention and controls, limitations in the ability to repatriate investment income, capital or the proceeds of the sale of securities, inadequate investor protections, less developed custody, settlement, regulatory, accounting, auditing and financial standards, unfavorable changes in laws or regulations, natural disasters, corruption and military activity.
High-Yield Investments Risk. Securities and other debt instruments held by the Fund that are rated below investment grade (commonly called “high-yield” or “junk” bonds) and unrated debt instruments of comparable quality expose the Fund to a greater risk of loss of principal and income than a fund that invests solely or primarily in investment grade debt instruments. In addition, these investments have greater price fluctuations, are less liquid and are more likely to experience a default than higher-rated debt instruments. High-yield debt instruments are considered to be predominantly speculative with respect to the issuer’s capacity to pay interest and repay principal.
Interest Rate Risk. Interest rate risk is the risk of losses attributable to changes in interest rates. In general, if interest rates rise, the values of debt instruments tend to fall, and if interest rates fall, the values of debt instruments tend to rise. Changes in the value of a debt instrument usually will not affect the amount of income the Fund receives from it but will generally affect the value of your investment in the Fund. Changes in interest rates may also affect the liquidity of the Fund’s investments in debt instruments. In general, the longer the maturity or duration of a debt instrument, the greater its sensitivity to changes in interest rates. For example, a three-year duration means a bond is expected to decrease in value by 3% if interest rates rise 1% and increase in value by 3% if interest rates fall 1%. Interest rate declines also may increase prepayments of debt obligations, which, in turn, would increase prepayment
Prospectus 2026
7
Columbia Variable Portfolio – Emerging Markets Bond Fund
Summary of the Fund (continued)
risk. The Fund is subject to the risk that the income generated by its investments may not keep pace with inflation. Actions by governments and central banking authorities can result in increases or decreases in interest rates. Higher periods of inflation could lead such authorities to raise interest rates. Such actions may negatively affect the value of debt instruments held by the Fund, resulting in a negative impact on the Fund's performance and NAV. Any interest rate increases could cause the value of the Fund’s investments in debt instruments to decrease. Rising interest rates may prompt redemptions from the Fund, which may force the Fund to sell investments at a time when it is not advantageous to do so, which could result in losses.
Issuer Risk. An issuer in which the Fund invests or to which it has exposure may perform poorly or below expectations, and the value of its securities may therefore decline, which may negatively affect the Fund’s performance. Underperformance of an issuer may be caused by poor management decisions, competitive pressures, breakthroughs in technology, reliance on suppliers, labor problems or shortages, corporate restructurings, fraudulent disclosures, natural disasters, military confrontations and actions, war, other conflicts, terrorism, disease/virus outbreaks, epidemics or other events, conditions and factors which may impair the value of your investment in the Fund.
Liquidity Risk. Liquidity risk is the risk associated with any event, circumstance, or characteristic of an investment or market that negatively impacts the Fund’s ability to sell, or realize the proceeds from the sale of, an investment at a desirable time or price. Liquidity risk may arise because of, for example, a lack of marketability of the investment, which means that when seeking to sell its portfolio investments, the Fund could find that selling is more difficult than anticipated, especially during times of high market volatility. Decreases in the number of financial institutions, including banks and broker-dealers, willing to make markets (match up sellers and buyers) in the Fund’s investments or decreases in their capacity or willingness to trade such investments may increase the Fund’s exposure to this risk. The debt market has experienced considerable growth, and financial institutions making markets in instruments purchased and sold by the Fund (e.g., bond dealers) have been subject to increased regulation. The impact of that growth and regulation on the ability and willingness of financial institutions to engage in trading or “making a market” in such instruments remains unsettled. Certain types of investments, such as lower-rated securities or those that are purchased and sold in over-the-counter markets, may be especially subject to liquidity risk. Securities or other assets in which the Fund invests may be traded in the over-the-counter market rather than on an exchange and therefore may be more difficult to purchase or sell at a fair price, which may have a negative impact on the Fund’s performance. Market participants attempting to sell the same or a similar instrument at the same time as the Fund could exacerbate the Fund’s exposure to liquidity risk. The Fund may have to accept a lower selling price for the holding, sell other liquid or more liquid investments that it might otherwise prefer to hold (thereby increasing the proportion of the Fund’s investments in less liquid or illiquid securities), or forego another more appealing investment opportunity. The liquidity of Fund investments may change significantly over time and certain investments that were liquid when purchased by the Fund may later become illiquid, particularly in times of overall economic distress. Changing regulatory, market or other conditions or environments (for example, the interest rate or credit environments) may also adversely affect the liquidity and the price of the Fund's investments. Judgment plays a larger role in valuing illiquid or less liquid investments as compared to valuing liquid or more liquid investments. Price volatility may be higher for illiquid or less liquid investments as a result of, for example, the relatively less frequent pricing of such securities (as compared to liquid or more liquid investments). Generally, the less liquid the market at the time the Fund sells a portfolio investment, the greater the risk of loss or decline of value to the Fund. Overall market liquidity and other factors can lead to an increase in redemptions, which may negatively impact Fund performance and NAV, including, for example, if the Fund is forced to sell investments in a down market. Foreign securities can present enhanced liquidity risks, including as a result of less developed custody, settlement or other practices of foreign markets.
Market Risk. The Fund may incur losses due to declines in the value of one or more securities in which it invests. These declines may be due to factors affecting a particular issuer, or the result of, among other things, political, regulatory, market, economic or social developments affecting the relevant market(s) more generally. In addition, turbulence in financial markets and reduced liquidity in equity, credit and/or fixed income markets may negatively affect many issuers, which could adversely affect the Fund’s ability to price or value hard-to-value assets in thinly traded and closed markets and could cause significant redemptions and operational challenges. Global economies
8
Prospectus 2026
Columbia Variable Portfolio – Emerging Markets Bond Fund
Summary of the Fund (continued)
and financial markets are increasingly interconnected, and conditions and events in one country, region or financial market may adversely impact issuers in a different country, region or financial market. These risks may be magnified if certain events or developments adversely interrupt the global supply chain; in these and other circumstances, such risks might affect companies worldwide. As a result, local, regional or global events such as terrorism, war, other conflicts, natural disasters, disease/virus outbreaks and epidemics or other public health issues, recessions, depressions or other events – or the potential for such events – could have a significant negative impact on global economic and market conditions.
Money Market Fund Investment Risk. An investment in a money market fund is not a bank deposit and is not insured or guaranteed by any bank, the Federal Deposit Insurance Corporation (FDIC) or any other government agency. Certain money market funds float their NAV while others seek to preserve the value of investments at a stable NAV (typically, $1.00 per share). An investment in a money market fund, even an investment in a fund seeking to maintain a stable NAV per share, is not guaranteed and it is possible for the Fund to lose money by investing in these and other types of money market funds. Certain money market funds (including the Fund’s cash sweep vehicle) are subject to mandatory liquidity fees if daily net redemptions exceed 5% of their net assets and may also impose a discretionary liquidity fee of up to 2% on redemptions if that fee is determined to be in the best interests of the money market fund. Such fees, if imposed, will reduce the amount the Fund receives on redemptions. In addition to the fees and expenses that the Fund directly bears, the Fund indirectly bears the fees and expenses of any money market funds in which it invests, including affiliated money market funds. By investing in a money market fund, the Fund will be exposed to the investment risks of the money market fund in direct proportion to such investment. To the extent the Fund invests in instruments such as derivatives, the Fund may hold investments, which may be significant, in money market fund shares to cover its obligations resulting from the Fund's investments in such instruments. Money market funds and the securities they invest in are subject to comprehensive regulations. The enactment of new legislation or regulations, as well as changes in interpretation and enforcement of current laws, may affect the manner of operation, performance and/or yield of money market funds.
Non-Diversified Fund Risk. The Fund is non-diversified, which generally means that it may invest a greater percentage of its total assets in the securities of fewer issuers than a “diversified” fund. This increases the risk that a change in the value of any one investment held by the Fund could affect the overall value of the Fund more than it would affect that of a diversified fund holding a greater number of investments. Accordingly, the Fund's value will likely be more volatile than the value of a more diversified fund.
Prepayment and Extension Risk. Prepayment and extension risk is the risk that a bond or other security or investment might, in the case of prepayment risk, be called or otherwise converted, prepaid or redeemed before maturity and, in the case of extension risk, that the investment might not be called as expected. In the case of prepayment risk, if the investment is converted, prepaid or redeemed before maturity, the portfolio managers may not be able to invest the proceeds in other investments providing as high a level of income, resulting in a reduced yield to the Fund. As interest rates decrease or spreads narrow on such investments, the likelihood of prepayment increases. Conversely, extension risk is the risk that an unexpected rise in interest rates will extend the life of an investment beyond the prepayment time. If the Fund’s investments are locked in at a lower interest rate for a longer period of time, the portfolio managers may be unable to capitalize on investments with higher interest rates or wider spreads.
Reinvestment Risk. Reinvestment risk arises when the Fund is unable to reinvest income or principal at the same or at least the same return it is currently earning.
Rule 144A and Other Exempted Securities Risk. The Fund may invest in privately placed and other securities or instruments exempt from SEC registration (collectively “private placements”), subject to certain regulatory restrictions. In the U.S. market, private placements are typically sold only to qualified institutional buyers, or qualified purchasers, as applicable. An insufficient number of buyers interested in purchasing private placements at a particular time could adversely affect the marketability of such investments and the Fund might be unable to dispose of them promptly or at reasonable prices, subjecting the Fund to liquidity risk. The Fund’s holdings of private placements may increase the level of Fund illiquidity if eligible buyers are unable or unwilling to purchase them at a particular time. Issuers of Rule 144A eligible securities are required to furnish information to potential investors upon request. However, the required disclosure is much less extensive than that required of public companies and is not
Prospectus 2026
9
Columbia Variable Portfolio – Emerging Markets Bond Fund
Summary of the Fund (continued)
publicly available since the offering information is not filed with the SEC. Further, issuers of Rule 144A eligible securities can require recipients of the offering information (such as the Fund) to agree contractually to keep the information confidential, which could also adversely affect the Fund’s ability to dispose of the security.
Sovereign Debt Risk. The willingness or ability of a sovereign or quasi-sovereign debtor to repay principal and pay interest in a timely manner may be affected by a variety of factors, including its cash flow situation, the extent of its reserves, the availability of sufficient foreign exchange on the date a payment is due, the relative size of the debt service burden to the economy as a whole, the sovereign or quasi-sovereign debtor’s policy toward international lenders, and the political constraints to which such debtor may be subject. Sovereign debt risk is increased for emerging market issuers.
Unrated Securities Risk. The Fund may purchase unrated securities which are not rated by a rating agency. Unrated securities may be less liquid than comparable rated securities and involve the risk that the Investment Manager may not accurately evaluate the security’s comparative credit rating. Analysis of creditworthiness of issuers of high yield securities may be more complex than for issuers of higher-quality debt securities. To the extent that the Fund purchases unrated securities, the Fund’s success in achieving its investment objective may depend more heavily on the Investment Manager’s creditworthiness analysis than if the Fund invested exclusively in rated securities.
Performance Information
Except for differences in annual returns resulting from differences in expenses (where applicable), the share classes of the Fund would have substantially similar annual returns because all share classes of the Fund invest in the same portfolio of securities.
The returns shown do not reflect any fees and expenses imposed under your Contract or Qualified Plan and would be lower if they did.
| Year by Year Total Return (%) as of December 31 Each Year |
Best and Worst Quarterly Returns During the Period Shown in the Bar Chart | ||
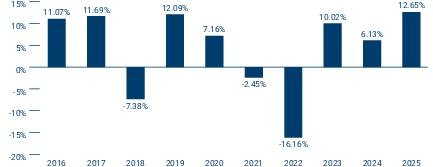 |
|
|
|
| |
|
- | |
10
Prospectus 2026
Columbia Variable Portfolio – Emerging Markets Bond Fund
Summary of the Fund (continued)
Average Annual Total Returns (for periods ended December 31, 2025)
| |
Share Class Inception Date |
1 Year |
5 Years |
10 Years |
| Class 1 |
|
|
|
|
| Class 2 |
|
|
|
|
| JPMorgan Emerging Markets Bond Index-Global (reflects no deductions for fees, expenses or taxes) |
|
|
|
|
Fund Management
Investment Manager: Columbia Management Investment Advisers, LLC
| Portfolio Management |
Title |
Role with Fund |
Managed Fund Since |
| Adrian Hilton |
Head of Emerging Markets Debt |
Lead Portfolio Manager |
2020 |
| Christopher Cooke |
Portfolio Manager |
Portfolio Manager |
2017 |
Purchase and Sale of Fund Shares
The Fund is available for purchase through Contracts offered by the separate accounts of participating insurance companies or Qualified Plans or by other eligible investors authorized by Columbia Management Investment Distributors, Inc. (the Distributor). Shares of the Fund may not be purchased or sold by individual owners of Contracts or Qualified Plans. If you are a Contract holder or Qualified Plan participant, please refer to your separate Contract prospectus or Qualified Plan disclosure documents for information about minimum investment requirements and how to purchase and redeem shares of the Fund on days the Fund is open for business.
Tax Information
The Fund normally distributes its net investment income and net realized capital gains, if any, to its shareholders, which are generally the participating insurance companies and Qualified Plans investing in the Fund through separate accounts. These distributions may not be taxable to you as the holder of a Contract or a participant in a Qualified Plan. Please consult the prospectus or other information provided to you by your participating insurance company and/or Qualified Plan regarding the U.S. federal income taxation of your contract, policy and/or plan.
Payments to Broker-Dealers and Other Financial Intermediaries
If you make allocations to the Fund, the Fund, its Distributor or other related companies may pay participating insurance companies or other financial intermediaries for the allocation (sale) of Fund shares and related services in connection with such allocations to the Fund. These payments may create a conflict of interest by influencing the participating insurance company, other financial intermediary or your salesperson to recommend an allocation to the Fund over another fund or other investment option. Ask your financial advisor or salesperson or visit your financial intermediary’s website for more information.
Prospectus 2026
11
Columbia Variable Portfolio – Emerging Markets Bond Fund
More Information About the Fund
Investment Objective
Columbia Variable Portfolio – Emerging Markets Bond Fund (the Fund) seeks to provide shareholders with high total return through current income and, secondarily, through capital appreciation. The Fund’s investment objective is not a fundamental policy and may be changed by the Fund’s Board of Trustees without shareholder approval as long as shareholders are given 60 days’ advance written notice of the change. Because any investment involves risk, there is no assurance the Fund’s investment objective will be achieved.
Principal Investment Strategies
The Fund invests primarily in fixed income securities of emerging markets issuers. For these purposes, emerging market countries are generally those either defined by World Bank-defined per capita income brackets or determined to be an emerging market based on the Fund investment team’s qualitative judgments about a country’s level of economic and institutional development, among other factors. Under normal circumstances, at least 80% of the Fund’s net assets (plus the amount of any borrowings for investment purposes) will be invested in fixed income securities of issuers that are located in emerging markets countries, or that earn 50% or more of their total revenues from goods or services produced in emerging markets countries or from sales made in emerging markets countries. Fixed income securities may be denominated in either U.S. dollars or the local currency of the issuer. While the Fund may invest 25% or more of its total assets in the securities of foreign governmental and corporate entities located in the same country, it will not invest 25% or more of its total assets in any single issuer. From time to time, the Fund may focus its investments in certain countries or geographic areas, including the Latin America region along with the Middle East and North Africa region. The Fund can invest in emerging market sovereign debt instruments of any credit quality, including those rated investment grade and below investment grade or considered to be of comparable quality (commonly referred to as “high yield” investments or “junk bonds”). Although the emerging markets sovereign debt universe largely consists of investment grade instruments, a significant portion of that universe is rated in these lower rating categories. The Fund may invest up to 100% of its assets in debt securities that are rated below investment grade or, if unrated, determined to be of comparable quality.
The Fund may invest in debt instruments of any maturity and does not seek to maintain a particular dollar-weighted average maturity. A bond is issued with a specific maturity date, which is the date when the issuer must pay back the bond’s principal (face value). Bond maturities range from less than 1 year to more than 30 years. Typically, the longer a bond’s maturity, the more price risk the Fund and the Fund’s investors face as interest rates rise, but the Fund could receive a higher yield in return for that longer maturity and higher interest rate risk.
The Fund may invest in derivatives, such as forward contracts (including forward foreign currency contracts), futures (including interest rate futures), and swaps (including credit default swaps and credit default swap indexes) for hedging and investment purposes.
The Fund may invest in privately placed and other securities or instruments that are purchased and sold pursuant to Rule 144A or other exemptions under the Securities Act of 1933, as amended, subject to certain regulatory restrictions. The Fund also invests in money market instruments (which may include investments in one or more affiliated or unaffiliated money market funds or similar vehicles).
The Fund is non-diversified, which means that it can invest a greater percentage of its assets in the securities of fewer issuers than can a diversified fund.
In pursuit of the Fund’s objective, Columbia Management Investment Advisers, LLC (the Investment Manager) chooses investments by:
■
Analyzing the creditworthiness of emerging market countries;
■
Seeking to evaluate the best relative value opportunities among emerging market countries, by comparing sovereign debt spreads to fundamental creditworthiness and comparing the recent sovereign debt spread relationships among countries to historic relationships; and
■
Seeking to identify emerging markets bonds that can take advantage of attractive local interest rates and provide exposure to undervalued currencies.
12
Prospectus 2026
Columbia Variable Portfolio – Emerging Markets Bond Fund
More Information About the Fund (continued)
In evaluating whether to sell a security, the Investment Manager considers, among other factors, whether in its view:
■
The security is overvalued;
■
The security has new credit risks; or
■
The security continues to meet the standards described above.
The Fund’s investment policy with respect to 80% of its net assets may be changed by the Fund’s Board of Trustees without shareholder approval as long as shareholders are given 60 days’ advance written notice of the change.
Principal Risks
An investment in the Fund involves risks, including Emerging Market Securities Risk, Foreign Securities Risk, High-Yield Investments Risk, Sovereign Debt Risk, Interest Rate Risk, Credit Risk, Market Risk, and Changing Distribution Level Risk, among others. Descriptions of these and other principal risks of investing in the Fund are provided below. There is no assurance that the Fund will achieve its investment objective and you may lose money. The value of the Fund’s holdings may decline, and the Fund’s net asset value (NAV) and share price may go down. An investment in the Fund is not a bank deposit and is not insured or guaranteed by the Federal Deposit Insurance Corporation or any other government agency. The significance of any specific risk to an investment in the Fund will vary over time depending on the composition of the Fund's portfolio, market conditions, and other factors. You should read all of the risk information below carefully, because any one or more of these risks may result in losses to the Fund.
Active Management Risk. The Fund is actively managed and its performance therefore will reflect, in part, the ability of the portfolio managers to make investment decisions that seek to achieve the Fund’s investment objective. Due to its active management, the Fund could underperform its benchmark index and/or other funds with similar investment objectives and/or strategies.
Changing Distribution Level Risk. The Fund normally expects to receive income which may include interest, dividends and/or capital gains, depending upon its investments. The distribution amounts paid by the Fund will vary and generally depend on the amount of income the Fund earns (less expenses) on its portfolio holdings, and capital gains or losses it recognizes. A decline in the Fund’s income or net capital gains arising from its investments may reduce its distribution level.
Counterparty Risk. The risk exists that a counterparty to a transaction in a financial instrument held by the Fund or by a special purpose or structured vehicle in which the Fund invests may become insolvent or otherwise fail to perform its obligations, including making payments to the Fund, due to financial difficulties. The Fund may obtain no or limited recovery in a bankruptcy or other reorganizational proceedings, and any recovery may be significantly delayed. Transactions that the Fund enters into may involve counterparties in the financials sector and, as a result, events affecting the financials sector may cause the Fund’s NAV to fluctuate.
Credit Risk. Credit risk is the risk that the value of debt instruments may decline if the issuer thereof defaults or otherwise becomes unable or unwilling, or is perceived to be unable or unwilling, to honor its financial obligations, such as making payments to the Fund when due. Various factors could affect the actual or perceived willingness or ability of the issuer to make timely interest or principal payments, including changes in the financial condition of the issuer or in general economic conditions. Credit rating agencies, such as S&P Global Ratings, Moody’s Ratings, Fitch, DBRS and KBRA, assign credit ratings to certain debt instruments to indicate their credit risk. A rating downgrade by such agencies can negatively impact the value of such instruments. Lower-rated or unrated instruments held by the Fund may present increased credit risk as compared to higher-rated instruments. Non-investment grade debt instruments may be subject to greater price fluctuations and are more likely to experience a default than investment grade debt instruments and therefore may expose the Fund to increased credit risk. If the Fund purchases unrated instruments, or if the ratings of instruments held by the Fund are lowered after purchase, the Fund will depend on analysis of credit risk more heavily than usual.
Derivatives Risk. Derivatives may involve significant risks. Derivatives are financial instruments, traded on an exchange or in the over-the-counter (OTC) markets, with a value in relation to, or derived from, the value of an underlying asset(s) (such as a security, commodity or currency) or other reference, such as an index, rate or other economic indicator (each an underlying reference). Derivatives may include those that are privately placed or
Prospectus 2026
13
Columbia Variable Portfolio – Emerging Markets Bond Fund
More Information About the Fund (continued)
otherwise exempt from SEC registration, including certain Rule 144A eligible securities. Derivatives could result in Fund losses if the underlying reference does not perform as anticipated. Use of derivatives is a highly specialized activity that can involve investment techniques, risks, and tax planning different from those associated with more traditional investment instruments. The Fund’s derivatives strategy may not be successful, and use of certain derivatives could result in substantial, potentially unlimited, losses to the Fund regardless of the Fund’s actual investment. A relatively small movement in the price, rate or other economic indicator associated with the underlying reference may result in substantial losses for the Fund. Derivatives may be more volatile than other types of investments. Derivatives can increase the Fund’s risk exposure to underlying references and their attendant risks, including the risk of an adverse credit event associated with the underlying reference (credit risk), the risk of an adverse movement in the value, price or rate of the underlying reference (market risk), the risk of an adverse movement in the value of underlying currencies (foreign currency risk) and the risk of an adverse movement in underlying interest rates (interest rate risk). Derivatives may expose the Fund to additional risks, including the risk of loss due to a derivative position that is imperfectly correlated with the underlying reference it is intended to hedge or replicate (correlation risk), the risk that a counterparty will fail to perform as agreed (counterparty risk), the risk that a hedging strategy may fail to mitigate losses, and may offset gains (hedging risk), the risk that the return on an investment may not keep pace with inflation (inflation risk), the risk that losses may be greater than the amount invested (leverage risk), the risk that the Fund may be unable to sell an investment at an advantageous time or price (liquidity risk), the risk that the investment may be difficult to value (pricing risk), and the risk that the price or value of the investment fluctuates significantly over short periods of time (volatility risk). The value of derivatives may be influenced by a variety of factors, including national and international political and economic developments. Potential changes to the regulation of the derivatives markets may make derivatives more costly, may limit the market for derivatives, or may otherwise adversely affect the value or performance of derivatives.
Derivatives Risk – Forward Contracts Risk. A forward contract is an over-the-counter derivative transaction between two parties to buy or sell a specified amount of an underlying reference at a specified price (or rate) on a specified date in the future. Forward contracts are negotiated on an individual basis and are not standardized or traded on exchanges. The market for forward contracts is substantially unregulated (there is no limit on daily price movements and speculative position limits are not applicable). The principals who deal in certain forward contract markets are not required to continue to make markets in the underlying references in which they trade and these markets can experience periods of illiquidity, sometimes of significant duration. There have been periods during which certain participants in forward contract markets have refused to quote prices for certain underlying references or have quoted prices with an unusually wide spread between the price at which they were prepared to buy and that at which they were prepared to sell. At or prior to maturity of a forward contract, the Fund may enter into an offsetting contract and may incur a loss to the extent there has been adverse movement in forward contract prices. The liquidity of the markets for forward contracts depends on participants entering into offsetting transactions rather than making or taking delivery. To the extent participants make or take delivery, liquidity in the market for forwards could be reduced. A relatively small price movement in a forward contract may result in substantial losses to the Fund, exceeding the amount of the margin paid. Forward contracts can increase the Fund’s risk exposure to underlying references and their attendant risks, such as credit risk, market risk, foreign currency risk and interest rate risk, while potentially exposing the Fund to correlation risk, counterparty risk, hedging risk, inflation risk, leverage risk, liquidity risk, pricing risk and volatility risk.
■
A forward foreign currency contract is a derivative (forward contract) in which the underlying reference is a country's or region’s currency. The Fund may agree to buy or sell a country's or region’s currency at a specific price on a specific date in the future. These instruments may fall in value (sometimes dramatically) due to foreign market downswings or foreign currency value fluctuations, subjecting the Fund to foreign currency risk (the risk that Fund performance may be negatively impacted by foreign currency strength or weakness relative to the U.S. dollar, particularly if the Fund exposes a significant percentage of its assets to currencies other than the U.S. dollar). The effectiveness of any currency strategy by a Fund may be reduced by the Fund's inability to precisely match forward contract amounts and the value of securities involved. Forward foreign currency contracts used for hedging may also limit any potential gain that might result from an increase or decrease in the value of the
14
Prospectus 2026
Columbia Variable Portfolio – Emerging Markets Bond Fund
More Information About the Fund (continued)
currency. Unanticipated changes in the currency markets could result in reduced performance for the Fund. When the Fund converts its foreign currencies into U.S. dollars, it may incur currency conversion costs due to the spread between the prices at which it may buy and sell various currencies in the market.
Derivatives Risk – Futures Contracts Risk. A futures contract is an exchange-traded derivative transaction between two parties in which a buyer (holding the “long” position) agrees to pay a fixed price (or rate) at a specified future date for delivery of an underlying reference from a seller (holding the “short” position). The seller hopes that the market price on the delivery date is less than the agreed upon price, while the buyer hopes for the contrary. Certain futures contract markets are highly volatile, and futures contracts may be illiquid. Futures exchanges may limit fluctuations in futures contract prices by imposing a maximum permissible daily price movement. The Fund may be disadvantaged if it is prohibited from executing a trade outside the daily permissible price movement. At or prior to maturity of a futures contract, the Fund may enter into an offsetting contract and may incur a loss to the extent there has been adverse movement in futures contract prices. The liquidity of the futures markets depends on participants entering into offsetting transactions rather than making or taking delivery. To the extent participants make or take delivery, liquidity in the futures market could be reduced. Positions in futures contracts may be closed out only on the exchange on which they were entered into or through a linked exchange, and no secondary market exists for such contracts. Futures positions are marked to market each day, and variation margin payment must be paid to or by the Fund. Because of the low margin deposits normally required in futures trading, it is possible that the Fund may employ a high degree of leverage in the portfolio. As a result, a relatively small price movement in a futures contract may result in substantial losses to the Fund, exceeding the amount of the margin paid. For certain types of futures contracts, losses are potentially unlimited. Futures markets are highly volatile, and the use of futures may increase the volatility of the Fund’s NAV. Futures contracts executed (if any) on foreign exchanges may not provide the same protection as U.S. exchanges. Futures contracts can increase the Fund’s risk exposure to underlying references and their attendant risks, such as credit risk, market risk, foreign currency risk and interest rate risk, while potentially exposing the Fund to correlation risk, counterparty risk, hedging risk, inflation risk, leverage risk, liquidity risk, pricing risk and volatility risk.
■
An interest rate future is a derivative that is an agreement whereby the buyer and seller agree to the future delivery of an interest-bearing instrument on a specific date at a pre-determined price. Examples include Treasury-bill futures, Treasury-bond futures and Eurodollar futures.
Derivatives Risk – Swaps Risk. In a typical swap transaction, two parties agree to exchange the return earned on a specified underlying reference for a fixed return or the return from another underlying reference during a specified period of time. Swaps may be difficult to value and may be illiquid. Swaps could result in Fund losses if the underlying asset or reference does not perform as anticipated. Swaps create significant investment leverage such that a relatively small price movement in a swap may result in immediate and substantial losses to the Fund. The Fund may only close out a swap with its particular counterparty and may only transfer a position with the consent of that counterparty. Certain swaps, such as short swap transactions and total return swaps, have the potential for unlimited losses, regardless of the size of the initial position. Swaps can increase the Fund’s risk exposure to underlying references and their attendant risks, such as credit risk, market risk, foreign currency risk and interest rate risk, while potentially exposing the Fund to correlation risk, counterparty risk, hedging risk, inflation risk, leverage risk, liquidity risk, pricing risk and volatility risk.
■
A credit default swap (including a swap on a credit default index, sometimes referred to as a credit default swap index) is a derivative and special type of swap where one party pays, in effect, an insurance premium through a stream of payments to another party in exchange for the right to receive a specified return upon the occurrence of a particular credit event by one or more third parties, such as bankruptcy, default or a similar event. A credit default swap may be embedded within a structured note or other derivative instrument. Credit default swaps enable an investor to buy or sell protection against such a credit event (such as an issuer’s bankruptcy, restructuring or failure to make timely payments of interest or principal). Credit default swap indices are indices that reflect the performance of a basket of credit default swaps and are subject to the same risks as credit default swaps. If such a default were to occur, any contractual remedies that the Fund may have may be subject to bankruptcy and insolvency laws, which could delay or limit the Fund's recovery. Thus, if the counterparty under a credit default swap defaults on its obligation to make payments thereunder, as a result of its bankruptcy or
Prospectus 2026
15
Columbia Variable Portfolio – Emerging Markets Bond Fund
More Information About the Fund (continued)
otherwise, the Fund may lose such payments altogether, or collect only a portion thereof, which collection could involve costs or delays. The Fund’s return from investment in a credit default swap index may not match the return of the referenced index. Further, investment in a credit default swap index could result in losses if the referenced index does not perform as expected. Unexpected changes in the composition of the index may also affect performance of the credit default swap index. If a referenced index has a dramatic intraday move that causes a material decline in the Fund’s net assets, the terms of the Fund’s credit default swap index may permit the counterparty to immediately close out the transaction. In that event, the Fund may be unable to enter into another credit default swap index or otherwise achieve desired exposure, even if the referenced index reverses all or a portion of its intraday move.
Emerging Market Securities Risk. Securities issued by foreign governments or companies in emerging market countries, such as China, Russia and certain countries in Eastern Europe, the Middle East, Asia, Latin America or Africa, are more likely to have greater exposure to the risks of investing in foreign securities that are described in Foreign Securities Risk. In addition, emerging market countries are more likely to experience instability resulting, for example, from rapid changes or developments in social, political, economic or other conditions. Their economies are usually less mature and their securities markets are typically less developed with more limited trading activity (i.e., lower trading volumes and less liquidity) than more developed countries. Emerging market securities tend to be more volatile, and may be more susceptible to market manipulation, than securities in more developed markets. Many emerging market countries are heavily dependent on international trade and have fewer trading partners, which makes them more sensitive to world commodity prices and economic downturns in other countries. Some emerging market countries have a higher risk of currency devaluations, and some of these countries may experience periods of high inflation or rapid changes in inflation rates and may have hostile relations with other countries. Due to the differences in the nature and quality of financial information of issuers of emerging market securities, including auditing and financial reporting standards, financial information and disclosures about such issuers may be unavailable or, if made available, may be considerably less reliable than publicly available information about other foreign securities.
Fixed Income Instruments Risk. The Fund is subject to the general risks and considerations associated with investing in debt securities, including the risk that issuers will fail to make timely payments of principal or interest or default altogether. Typically, shorter-term bonds are less volatile than longer-term bonds; however, longer-term bonds typically offer higher yields and more stable interest income than shorter-term bonds due to their longer term and extended fixed payment schedule. Lower-rated securities in which the Fund may invest may be more volatile and may decline more in price in response to negative issuer developments or general economic news than higher rated securities. In addition, as interest rates rise, the Fund’s investments typically will lose value.
Foreign Currency Risk. The performance of the Fund may be materially affected positively or negatively by foreign currency strength or weakness relative to the U.S. dollar, particularly if the Fund invests a significant percentage of its assets in foreign securities or other assets denominated in currencies other than the U.S. dollar. Currency rates in foreign countries may fluctuate significantly over short or long periods of time for a number of reasons, including changes in interest rates, imposition of currency controls and economic or political developments in the U.S. or abroad. The Fund may also incur currency conversion costs when converting foreign currencies into U.S. dollars and vice versa. Restrictions on currency trading may be imposed by foreign countries, which may adversely affect the value of your investment in the Fund. Even though the currencies of some countries may be pegged to the U.S. dollar, the conversion rate may be controlled by government regulation or intervention at levels significantly different than what would normally prevail in a free market. Significant revaluations of the U.S. dollar exchange rate of these currencies could cause substantial reductions in the Fund’s NAV.
Foreign Securities Risk. Investments in or exposure to securities of foreign companies may involve heightened risks relative to investments in or exposure to securities of U.S. companies. For example, foreign markets can be extremely volatile. Foreign securities may also be less liquid, making them more difficult to trade, than securities of U.S. companies so that the Fund may, at times, be unable to sell foreign securities at desirable times or prices. Brokerage commissions, custodial costs and other fees are also generally higher for foreign securities. The Fund may have limited or no legal recourse in the event of default with respect to certain foreign securities, including those issued by foreign governments. In addition, foreign governments may impose withholding or other taxes on
16
Prospectus 2026
Columbia Variable Portfolio – Emerging Markets Bond Fund
More Information About the Fund (continued)
the Fund’s income, capital gains or proceeds from the disposition of foreign securities, which could reduce the Fund’s return on such securities. In some cases, such withholding or other taxes could potentially be confiscatory. Other risks include: possible delays in the settlement of transactions or in the payment of income; generally less publicly available information about foreign companies; the impact of economic, political, social, diplomatic or other conditions or events (including, for example, military confrontations and actions, war, other conflicts, terrorism and disease/virus outbreaks and epidemics), possible seizure, expropriation or nationalization of a company or its assets or the assets of a particular investor or category of investors; accounting, auditing and financial reporting standards that may be less comprehensive and stringent than those applicable to domestic companies; the imposition of economic and other sanctions against a particular foreign country, its nationals or industries or businesses within the country; and the generally less stringent standard of care to which local agents may be held in the local markets. In addition, it may be difficult to obtain reliable information about the securities and business operations of certain foreign issuers. Governments or trade groups may compel local agents to hold securities in designated depositories that are not subject to independent evaluation. The less developed a country’s securities market is, the greater the level of risks. Economic sanctions may be, and have been, imposed against certain countries, organizations, companies, entities and/or individuals. Economic sanctions and other similar governmental actions could, among other things, effectively restrict or eliminate the Fund’s ability to purchase or sell securities, and thus may make the Fund’s investments in such securities less liquid or more difficult to value. In addition, as a result of economic sanctions, the Fund may be forced to sell or otherwise dispose of investments at inopportune times or prices, which could result in losses to the Fund and increased transaction costs. These conditions may be in place for a substantial period of time and enacted with limited advance notice to the Fund. The risks posed by sanctions against a particular foreign country, its nationals or industries or businesses within the country may be heightened to the extent the Fund invests significantly in the affected country or region or in issuers from the affected country that depend on global markets. Additionally, investments in certain countries may subject the Fund to a number of tax rules, the application of which may be uncertain. Countries may amend or revise their existing tax laws, regulations and/or procedures in the future, possibly with retroactive effect. Changes in or uncertainties regarding the laws, regulations or procedures of a country could reduce the after-tax profits of the Fund, directly or indirectly, including by reducing the after-tax profits of companies located in such countries in which the Fund invests, or result in unexpected tax liabilities for the Fund.
Frontier Market Risk. Frontier market countries generally have smaller economies and even less developed capital markets than typical emerging market countries (which themselves have increased investment risk relative to more developed market countries) and, as a result, the Fund’s exposure to risks associated with investing in emerging market countries are magnified when the Fund invests in frontier market countries. The increased risks include: the potential for extreme price volatility and illiquidity in frontier market countries; government ownership or control of parts of the private sector and of certain companies; trade barriers, exchange controls, managed adjustments in relative currency values and other protectionist measures imposed or negotiated by the countries with which frontier market countries trade; and the relatively new and unsettled securities laws in many frontier market countries. Securities issued by foreign governments or companies in frontier market countries are even more likely than emerging markets securities to have greater exposure to the risks of investing in foreign securities that are described in Foreign Securities Risk.
Geographic Focus Risk. The Fund may be particularly susceptible to risks related to economic, political, regulatory or other events or conditions affecting issuers and countries within the specific geographic regions in which the Fund invests. Currency devaluations could occur in countries that have not yet experienced currency devaluation to date, or could continue to occur in countries that have already experienced such devaluations. As a result, the Fund’s NAV may be more volatile than the NAV of a more geographically diversified fund.
■
Latin America Region. The Fund is particularly susceptible to risks related to economic, political, regulatory, legal, social or other events or conditions affecting issuers in, or those that have investment exposure to, the Latin America region. The economies of many Latin American countries have experienced elevated and volatile interest rates, inflation rates and unemployment rates. Currency devaluations and exchange rate volatility have also been common among Latin American economies. Relatively high dependence upon commodities, such as petroleum, minerals, metals and agricultural products, amongst others, may cause certain Latin American economies to be
Prospectus 2026
17
Columbia Variable Portfolio – Emerging Markets Bond Fund
More Information About the Fund (continued)
particularly sensitive to fluctuations in commodity prices. International economic conditions, trade arrangements and flow of international capital may have significant impact on Latin American economies due to their relatively heavy reliance upon international trade. Latin American economies may also be susceptible to adverse government regulatory and economic intervention and controls which may negatively impact economic growth. Limitations in the ability to repatriate investment income, capital or the proceeds of the sale of securities from Latin American countries could adversely affect the Fund. Other risks associated with investments in Latin American economies may include inadequate investor protections, less developed custody, settlement, regulatory, accounting, auditing and financial standards, unfavorable changes in laws or regulations, natural disasters, corruption and military activity. The risks described under “Emerging Market Securities Risk,” “Frontier Market Risk,” and “Foreign Securities Risk” may be more pronounced due to the Fund’s focus on investments in the region.
■
Middle East and North Africa Region. The Fund is particularly susceptible to risks related to economic, political, regulatory, legal, social or other events or conditions affecting issuers in, or those that have investment exposure to, the Middle East and North Africa region. The economies of many Middle Eastern and North African countries have experienced local and regional conflicts including terrorist activity, religious, ethnic and/or socio-economic unrest, acts of war or other conflicts in the region, as well as elevated and volatile interest rates, inflation rates and unemployment rates. Currency devaluations and exchange rate volatility have also been common among Middle Eastern and North African economies. Relatively high dependence upon commodities, such as petroleum and minerals amongst others, may cause certain Middle Eastern and North African economies to be particularly sensitive to fluctuations in commodity prices. International economic conditions, trade arrangements and flow of international capital may have a significant impact on Middle Eastern and North African economies due to their relatively heavy reliance upon international trade. Middle Eastern and North African economies may also be susceptible to adverse government regulatory and economic intervention and controls which may negatively impact economic growth. Limitations in the ability to repatriate investment income, capital or the proceeds of the sale of securities from Middle Eastern and North African countries could adversely affect the Fund. Other risks associated with investments in Middle Eastern and North African economies may include inadequate investor protections, less developed custody, settlement, regulatory, accounting, auditing and financial standards, unfavorable changes in laws or regulations, natural disasters, corruption and military activity. The risks described under “Emerging Market Securities Risk,” “Frontier Market Risk,” and “Foreign Securities Risk” may be more pronounced due to the Fund’s focus on investments in the region.
High-Yield Investments Risk. Securities and other debt instruments held by the Fund that are rated below investment grade (commonly called “high-yield” or “junk” bonds) and unrated debt instruments of comparable quality tend to be more sensitive to credit risk than higher-rated debt instruments and may experience greater price fluctuations in response to perceived changes in the ability of the issuing entity or obligor to pay interest and principal when due than to changes in interest rates. These investments are generally more likely to experience a default than higher-rated debt instruments. High-yield debt instruments are considered to be predominantly speculative with respect to the issuer’s capacity to pay interest and repay principal. These debt instruments typically pay a premium – a higher interest rate or yield – because of the increased risk of loss, including default. High-yield debt instruments may require a greater degree of judgment to establish a price, may be difficult to sell at the time and price the Fund desires, may carry high transaction costs, and also are generally less liquid than higher-rated debt instruments. The ratings provided by third party rating agencies are based on analyses by these ratings agencies of the credit quality of the debt instruments and may not take into account every risk related to whether interest or principal will be timely repaid. In adverse economic and other circumstances, issuers of lower-rated debt instruments are more likely to have difficulty making principal and interest payments than issuers of higher-rated debt instruments.
Interest Rate Risk. Interest rate risk is the risk of losses attributable to changes in interest rates. In general, if interest rates rise, the values of debt instruments tend to fall, and if interest rates fall, the values of debt instruments tend to rise. Changes in the value of a debt instrument usually will not affect the amount of income the Fund receives from it but will generally affect the value of your investment in the Fund. Changes in interest rates may also affect the liquidity of the Fund’s investments in debt instruments. In general, the longer the maturity or duration of a debt instrument, the greater its sensitivity to changes in interest rates. For example, a three-year duration means a bond is
18
Prospectus 2026
Columbia Variable Portfolio – Emerging Markets Bond Fund
More Information About the Fund (continued)
expected to decrease in value by 3% if interest rates rise 1% and increase in value by 3% if interest rates fall 1%. Interest rate declines also may increase prepayments of debt obligations, which, in turn, would increase prepayment risk (the risk that the Fund will have to reinvest the money received in securities that have lower yields). The Fund is subject to the risk that the income generated by its investments may not keep pace with inflation. Actions by governments and central banking authorities can result in increases or decreases in interest rates. Higher periods of inflation could lead such authorities to raise interest rates. Such actions may negatively affect the value of debt instruments held by the Fund, resulting in a negative impact on the Fund's performance and NAV. Any interest rate increases could cause the value of the Fund’s investments in debt instruments to decrease. Rising interest rates may prompt redemptions from the Fund, which may force the Fund to sell investments at a time when it is not advantageous to do so, which could result in losses.
Issuer Risk. An issuer in which the Fund invests or to which it has exposure may perform poorly or below expectations, and the value of its securities may therefore decline, which may negatively affect the Fund’s performance. Underperformance of an issuer may be caused by poor management decisions, competitive pressures, breakthroughs in technology, reliance on suppliers, labor problems or shortages, corporate restructurings, fraudulent disclosures, natural disasters, military confrontations and actions, war, other conflicts, terrorism, disease/virus outbreaks, epidemics or other events, conditions and factors which may impair the value of your investment in the Fund.
Liquidity Risk. Liquidity risk is the risk associated with any event, circumstance, or characteristic of an investment or market that negatively impacts the Fund’s ability to sell, or realize the proceeds from the sale of, an investment at a desirable time or price. Liquidity risk may arise because of, for example, a lack of marketability of the investment, which means that when seeking to sell its portfolio investments, the Fund could find that selling is more difficult than anticipated, especially during times of high market volatility. Decreases in the number of financial institutions, including banks and broker-dealers, willing to make markets (match up sellers and buyers) in the Fund’s investments or decreases in their capacity or willingness to trade such investments may increase the Fund’s exposure to this risk. The debt market has experienced considerable growth, and financial institutions making markets in instruments purchased and sold by the Fund (e.g., bond dealers) have been subject to increased regulation. The impact of that growth and regulation on the ability and willingness of financial institutions to engage in trading or “making a market” in such instruments remains unsettled. Certain types of investments, such as lower-rated securities or those that are purchased and sold in over-the-counter markets, may be especially subject to liquidity risk. Securities or other assets in which the Fund invests may be traded in the over-the-counter market rather than on an exchange and therefore may be more difficult to purchase or sell at a fair price, which may have a negative impact on the Fund’s performance. Market participants attempting to sell the same or a similar instrument at the same time as the Fund could exacerbate the Fund’s exposure to liquidity risk. The Fund may have to accept a lower selling price for the holding, sell other liquid or more liquid investments that it might otherwise prefer to hold (thereby increasing the proportion of the Fund’s investments in less liquid or illiquid securities), or forego another more appealing investment opportunity. The liquidity of Fund investments may change significantly over time and certain investments that were liquid when purchased by the Fund may later become illiquid, particularly in times of overall economic distress. Changing regulatory, market or other conditions or environments (for example, the interest rate or credit environments) may also adversely affect the liquidity and the price of the Fund's investments. Judgment plays a larger role in valuing illiquid or less liquid investments as compared to valuing liquid or more liquid investments. Price volatility may be higher for illiquid or less liquid investments as a result of, for example, the relatively less frequent pricing of such securities (as compared to liquid or more liquid investments). Generally, the less liquid the market at the time the Fund sells a portfolio investment, the greater the risk of loss or decline of value to the Fund. Overall market liquidity and other factors can lead to an increase in redemptions, which may negatively impact Fund performance and NAV, including, for example, if the Fund is forced to sell investments in a down market. Foreign securities can present enhanced liquidity risks, including as a result of less developed custody, settlement or other practices of foreign markets.
Market Risk. The Fund may incur losses due to declines in the value of one or more securities in which it invests. These declines may be due to factors affecting a particular issuer, or the result of, among other things, political, regulatory, market, economic or social developments affecting the relevant market(s) more generally. In addition,
Prospectus 2026
19
Columbia Variable Portfolio – Emerging Markets Bond Fund
More Information About the Fund (continued)
turbulence in financial markets and reduced liquidity in equity, credit and/or fixed income markets may negatively affect many issuers, which could adversely affect the Fund’s ability to price or value hard-to-value assets in thinly traded and closed markets and could cause significant redemptions and operational challenges. Global economies and financial markets are increasingly interconnected, and conditions and events in one country, region or financial market may adversely impact issuers in a different country, region or financial market. These risks may be magnified if certain events or developments adversely interrupt the global supply chain; in these and other circumstances, such risks might affect companies worldwide. As a result, local, regional or global events such as terrorism, war, other conflicts, natural disasters, disease/virus outbreaks and epidemics or other public health issues, recessions, depressions or other events – or the potential for such events – could have a significant negative impact on global economic and market conditions.
The large-scale invasion of Ukraine by Russia in February 2022 has resulted in sanctions and market disruptions, including declines in regional and global stock markets, unusual volatility in global commodity markets and significant devaluations of Russian currency. In addition, the Iranian conflict that commenced in February 2026 may result in similar, and potentially more severe, disruptions. Escalation of hostilities in the Middle East region could disrupt energy production or transportation, including through key shipping routes, which may lead to increased volatility in energy and other commodity prices. The extent and duration of these conflicts are impossible to predict but could continue to be significant. Market disruption caused by these conflicts, and any countermeasures or responses thereto (including international sanctions, a downgrade in a country’s credit rating, purchasing and financing restrictions, boycotts, tariffs, changes in consumer or purchaser preferences, cyberattacks and espionage) could continue to have severe adverse impacts on regional and/or global securities and commodities markets, including markets for oil and natural gas. These impacts may include reduced market liquidity, distress in credit markets, further disruption of global supply chains, increased risk of inflation, and limited access to investments in certain international markets and/or issuers. These developments and other related events could negatively impact Fund performance.
Money Market Fund Investment Risk. An investment in a money market fund is not a bank deposit and is not insured or guaranteed by any bank, the FDIC or any other government agency. Certain money market funds float their NAV while others seek to preserve the value of investments at a stable NAV (typically $1.00 per share). An investment in a money market fund, even an investment in a fund seeking to maintain a stable NAV per share, is not guaranteed and it is possible for the Fund to lose money by investing in these and other types of money market funds. Certain money market funds (including the Fund’s cash sweep vehicle) must impose a mandatory liquidity fee on redemptions if daily net redemptions exceed 5% of their net assets and certain money market funds (including the Fund’s cash sweep vehicle) may impose a discretionary liquidity fee of up to 2% on redemptions if that fee is determined to be in the best interests of the money market fund. The amount of any mandatory liquidity fee will represent a good faith estimate of the costs of liquidating a pro rata portion of each of the money market fund’s portfolio holdings to meet the redemptions, or 1% of the value of the shares redeemed if such an amount cannot be estimated. Such fees, if imposed, will reduce the amount the Fund receives on redemptions. In addition to the fees and expenses that the Fund directly bears, the Fund indirectly bears the fees and expenses of any money market funds in which it invests, including affiliated money market funds. To the extent these fees and expenses, along with the fees and expenses of any other funds in which the Fund may invest, are expected to equal or exceed 0.01% of the Fund’s average daily net assets, they will be reflected in the Annual Fund Operating Expenses set forth in the table under Fees and Expenses of the Fund. By investing in a money market fund, the Fund will be exposed to the investment risks of the money market fund in direct proportion to such investment. The money market fund may not achieve its investment objective. The Fund, through its investment in the money market fund, may not achieve its investment objective. To the extent the Fund invests in instruments such as derivatives, the Fund may hold investments, which may be significant, in money market fund shares to cover its obligations resulting from the Fund's investments in such instruments. Money market funds and the securities they invest in are subject to comprehensive regulations. The enactment of new legislation or regulations, as well as changes in interpretation and enforcement of current laws, may affect the manner of operation, performance and/or yield of money market funds.
20
Prospectus 2026
Columbia Variable Portfolio – Emerging Markets Bond Fund
More Information About the Fund (continued)
Non-Diversified Fund Risk. The Fund is non-diversified, which generally means that it may invest a greater percentage of its total assets in the securities of fewer issuers than a “diversified” fund. This increases the risk that a change in the value of any one investment held by the Fund could affect the overall value of the Fund more than it would affect that of a diversified fund holding a greater number of investments. Accordingly, the Fund's value will likely be more volatile than the value of a more diversified fund.
Prepayment and Extension Risk. Prepayment and extension risk is the risk that a bond or other security or investment might, in the case of prepayment risk, be called or otherwise converted, prepaid or redeemed before maturity and, in the case of extension risk, that the investment might not be called as expected. In the case of prepayment risk, if the investment is converted, prepaid or redeemed before maturity, the portfolio managers may not be able to invest the proceeds in other investments providing as high a level of income, resulting in a reduced yield to the Fund. As interest rates decrease or spreads narrow on such investments, the likelihood of prepayment increases. Conversely, extension risk is the risk that an unexpected rise in interest rates will extend the life of an investment beyond the prepayment time. If the Fund's investments are locked in at a lower interest rate for a longer period of time, the portfolio managers may be unable to capitalize on investments with higher interest rates or wider spreads.
Reinvestment Risk. Reinvestment risk arises when the Fund is unable to reinvest income or principal at the same or at least the same return it is currently earning.
Rule 144A and Other Exempted Securities Risk. The Fund may invest in privately placed and other securities or instruments exempt from SEC registration (collectively “private placements”), subject to certain regulatory restrictions. In the U.S. market, private placements are typically sold only to qualified institutional buyers, or qualified purchasers, as applicable. An insufficient number of buyers interested in purchasing private placements at a particular time could adversely affect the marketability of such investments and the Fund might be unable to dispose of them promptly or at reasonable prices, subjecting the Fund to liquidity risk (the risk that it may not be possible for the Fund to liquidate the instrument at an advantageous time or price). The Fund’s holdings of private placements may increase the level of Fund illiquidity if eligible buyers are unable or unwilling to purchase them at a particular time. The Fund may also have to bear the expense of registering the securities for resale and the risk of substantial delays in effecting the registration. Additionally, the purchase price and subsequent valuation of private placements typically reflect a discount, which may be significant, from the market price of comparable securities for which a more liquid market exists. Issuers of Rule 144A eligible securities are required to furnish information to potential investors upon request. However, the required disclosure is much less extensive than that required of public companies and is not publicly available since the offering information is not filed with the SEC. Further, issuers of Rule 144A eligible securities can require recipients of the offering information (such as the Fund) to agree contractually to keep the information confidential, which could also adversely affect the Fund’s ability to dispose of the security.
Sovereign Debt Risk. The willingness or ability of a sovereign or quasi-sovereign debtor to repay principal and pay interest in a timely manner may be affected by a variety of factors, including its cash flow situation, the extent of its reserves, the availability of sufficient foreign exchange on the date a payment is due, the relative size of the debt service burden to the economy as a whole, the sovereign or quasi-sovereign debtor’s policy toward international lenders, and the political constraints to which such debtor may be subject.
With respect to sovereign or quasi-sovereign debt of emerging market issuers, investors should be aware that certain emerging market countries are among the largest debtors to commercial banks and foreign governments. At times, certain emerging market countries have declared moratoria on the payment of principal and interest on external debt. Certain emerging market countries have experienced difficulty in servicing their sovereign or quasi-sovereign debt on a timely basis and that has led to defaults and the restructuring of certain indebtedness to the detriment of debt holders. Sovereign debt risk is increased for emerging market issuers.
Unrated Securities Risk. The Fund may purchase unrated securities which are not rated by a rating agency. Unrated securities may be less liquid than comparable rated securities and involve the risk that the Investment Manager may not accurately evaluate the security’s comparative credit rating. Analysis of creditworthiness of issuers of high yield
Prospectus 2026
21
Columbia Variable Portfolio – Emerging Markets Bond Fund
More Information About the Fund (continued)
securities may be more complex than for issuers of higher-quality debt securities. To the extent that the Fund purchases unrated securities, the Fund’s success in achieving its investment objective may depend more heavily on the Investment Manager’s creditworthiness analysis than if the Fund invested exclusively in rated securities.
Additional Investment Strategies and Policies
This section describes certain investment strategies and policies that the Fund may utilize in pursuit of its investment objective and some additional factors and risks involved with investing in the Fund.
Investment Guidelines
As a general matter, and except as specifically described in the discussion of the Fund's principal investment strategies in this prospectus or as otherwise required by the Investment Company Act of 1940, as amended (the 1940 Act), the rules and regulations thereunder and any applicable exemptive relief, whenever an investment policy or limitation states a percentage of the Fund's assets that may be invested in any security or other asset or sets forth a policy regarding an investment standard, compliance with that percentage limitation or standard will be determined solely at the time of the Fund's investment in the security or asset.
Holding Other Kinds of Investments
The Fund may hold other investments that are not part of its principal investment strategies. These investments and their risks are described below and/or in the Statement of Additional Information (SAI). The Fund may choose not to invest in certain securities described in this prospectus and in the SAI, although it has the ability to do so. Information on the Fund’s holdings can be found in the Fund’s Form N-CSR or by visiting columbiathreadneedleus.com.
Transactions in Derivatives
The Fund may enter into derivative transactions or otherwise have exposure to derivative transactions through underlying investments. Derivatives are financial contracts whose values are, for example, based on (or “derived” from) traditional securities (such as a stock or bond), assets (such as a commodity like gold or a foreign currency), reference rates (such as the Secured Overnight Financing Rate (commonly known as SOFR)) or market indices (such as the Standard & Poor’s 500® Index). The use of derivatives is a highly specialized activity which involves investment techniques and risks different from those associated with ordinary portfolio securities transactions. Derivatives involve special risks and may result in losses or may limit the Fund’s potential gain from favorable market movements. Derivative strategies often involve leverage, which may exaggerate a loss, potentially causing the Fund to lose more money than it would have lost had it invested in the underlying security or other asset directly. The values of derivatives may move in unexpected ways, especially in unusual market conditions, and may result in increased volatility in the value of the derivative and/or the Fund’s shares, among other consequences. Other risks arise from the Fund’s potential inability to terminate or to sell derivative positions. A liquid secondary market may not always exist for the Fund’s derivative positions at times when the Fund might wish to terminate or to sell such positions. Over-the-counter instruments (investments not traded on an exchange) may be illiquid, and transactions in derivatives traded in the over-the-counter market are subject to the risk that the other party will not meet its obligations. The use of derivatives also involves the risks of mispricing or improper valuation and that changes in the value of the derivative may not correlate perfectly with the underlying security, asset, reference rate or index. The Fund also may not be able to find a suitable derivative transaction counterparty, and thus may be unable to engage in derivative transactions when it is deemed favorable to do so, or at all. The U.S. government and the European Union (and some other jurisdictions) have enacted regulations and similar requirements that prescribe clearing, margin, reporting and registration requirements for participants in the derivatives market. These requirements are evolving and their ultimate impact on the Fund remains unclear, but such impact could include restricting and/or imposing significant costs or other burdens upon the Fund’s participation in derivatives transactions. Additionally, regulations governing the use of derivatives by registered investment companies, such as the Fund, require, among other things, that a fund that invests in derivative instruments beyond a specified limited amount apply a value-at-risk-based limit
22
Prospectus 2026
Columbia Variable Portfolio – Emerging Markets Bond Fund
More Information About the Fund (continued)
to its portfolio and establish a comprehensive derivatives risk management program. As of the date of this prospectus, the Fund is not required to maintain a comprehensive derivatives risk management program given its more limited use of derivatives. For more information on the risks of derivative investments and strategies, see the SAI.
Affiliated Fund Investing
The Investment Manager or an affiliate serves as investment adviser to funds using the Columbia brand (Columbia Funds), including those that are structured as “fund-of-funds”, and provides asset-allocation services to (i) shareholders by investing in shares of other Columbia Funds, which may include the Fund (collectively referred to in this section as Underlying Funds), and (ii) discretionary managed accounts (collectively referred to as affiliated products) that invest exclusively in Underlying Funds. These affiliated products, individually or collectively, may own a significant percentage of the outstanding shares of one or more Underlying Funds, and the Investment Manager seeks to balance potential conflicts of interest between the affiliated products and the Underlying Funds in which they invest. The affiliated products’ investment in the Underlying Funds may have the effect of creating economies of scale, possibly resulting in lower expense ratios for the Underlying Funds, because the affiliated products may own substantial portions of the shares of Underlying Funds. However, redemption of Underlying Fund shares by one or more affiliated products could cause the expense ratio of an Underlying Fund to increase, as its fixed costs would be spread over a smaller asset base. Because of large positions of certain affiliated products, the Underlying Funds may experience relatively large inflows and outflows of cash due to affiliated products’ purchases and sales of Underlying Fund shares. Although the Investment Manager or its affiliate may seek to minimize the impact of these transactions where possible, for example, by structuring them over a reasonable period of time or through other measures, Underlying Funds may experience increased expenses as they buy and sell portfolio securities to manage the cash flow effect related to these transactions. Further, when the Investment Manager or its affiliate structures transactions over a reasonable period of time in order to manage the potential impact of the buy and sell decisions for the affiliated products, those affiliated products, including funds-of-funds, may pay more or less (for purchase activity), or receive more or less (for redemption activity), for shares of the Underlying Funds than if the transactions were executed in one transaction. In addition, substantial redemptions by affiliated products within a short period of time could require the Underlying Fund to liquidate positions more rapidly than would otherwise be desirable, which may have the effect of reducing or eliminating potential gain or causing it to realize a loss. In order to meet such redemptions, an Underlying Fund may be forced to sell its liquid (or more liquid) positions, leaving the Underlying Fund holding, post-redemption, a relatively larger position in illiquid investments (i.e., any investment that the Fund reasonably expects cannot be sold or disposed of in current market conditions in seven calendar days or less without the sale or disposition significantly changing the market value of the investment) or less liquid securities. Substantial redemptions may also adversely affect the ability of the Underlying Fund to implement its investment strategy. The Investment Manager or its affiliate also has a conflict of interest in determining the allocation of affiliated products’ assets among the Underlying Funds, as it earns different fees from the various Underlying Funds.
Investing in Money Market Funds
The Fund may invest cash in, or hold as collateral for certain investments, shares of registered or unregistered money market funds, including funds advised by the Investment Manager or its affiliates. These funds are not insured or guaranteed by the Federal Deposit Insurance Corporation (FDIC) or any other government agency. The Fund and its shareholders indirectly bear a portion of the expenses of any money market fund or other fund in which the Fund may invest.
Investing Defensively
The Fund may from time to time take temporary defensive investment positions that may be inconsistent with the Fund’s principal investment strategies in attempting to respond to adverse market, economic, political, social or other conditions, including, without limitation, investing some or all of its assets in money market instruments or shares of affiliated or unaffiliated money market funds or holding some or all of its assets in cash or cash equivalents. The Fund may take such defensive investment positions for as long a period as deemed necessary.
Prospectus 2026
23
Columbia Variable Portfolio – Emerging Markets Bond Fund
More Information About the Fund (continued)
The Fund may not achieve its investment objective while it is investing defensively. Investing defensively may adversely affect Fund performance. During these times, the portfolio managers may make frequent portfolio holding changes, which could result in increased trading expenses and decreased Fund performance. See also Investing in Money Market Funds above for more information.
Other Strategic and Investment Measures
The Fund may also from time to time take temporary portfolio positions that may or may not be consistent with the Fund’s principal investment strategies in attempting to respond to adverse market, economic, political, social or other conditions, including, without limitation, investing in derivatives, such as forward contracts, futures contracts, options, structured investments and swaps, for various purposes, including among others, investing in particular derivatives in seeking to reduce investment exposures, or in seeking to achieve indirect investment exposures, to a sector, country, region or currency where the Investment Manager believes such positioning is appropriate. The Fund may take such portfolio positions for as long a period as deemed necessary. While the Fund is so positioned, derivatives could comprise a substantial portion of the Fund’s investments and the Fund may not achieve its investment objective. Investing in this manner may adversely affect Fund performance. During these times, the portfolio managers may make frequent portfolio holding changes, which could result in increased trading expenses and decreased Fund performance. For information on the risks of investing in derivatives, see Transactions in Derivatives above.
Portfolio Holdings Disclosure
The Board has adopted policies and procedures that govern the timing and circumstances of disclosure to shareholders and third parties of information regarding the securities owned by the Fund. A description of these policies and procedures is included in the SAI. Fund policy generally permits the disclosure of portfolio holdings information on the Fund's website (columbiathreadneedleus.com) only after a certain amount of time has passed, as described in the SAI.
Purchases and sales of portfolio securities can take place at any time, so the portfolio holdings information available on the Fund's website may not always be current.
FUNDamentals
Portfolio Holdings Versus the Benchmarks
The Fund does not limit its investments to the securities within its benchmark(s), and accordingly the Fund's holdings may diverge from those of its benchmark(s). In addition, the Fund may invest in securities outside any industry and geographic sectors represented in its benchmark(s). The Fund's weightings in individual securities, and in industry or geographic sectors, may also vary considerably from those of its benchmark(s).
Cash Flows
The timing and magnitude of cash inflows from investors buying Fund shares could prevent the Fund from always being fully invested. Conversely, the timing and magnitude of cash outflows to shareholders redeeming Fund shares could require the Fund to sell portfolio securities at less than opportune times or to hold ready reserves of uninvested cash in amounts larger than might otherwise be the case to meet shareholder redemptions. Either situation could adversely impact the Fund’s performance.
Understanding Annual Fund Operating Expenses
The Fund’s annual operating expenses, as presented in the Annual Fund Operating Expenses table in the Fees and Expenses of the Fund section of this prospectus, generally are based on expenses incurred during the Fund’s most recently completed fiscal year, may vary by share class and are expressed as a percentage (expense ratio) of the Fund’s average net assets during that fiscal year. The expense ratios reflect the Fund’s fee arrangements as of the date of this prospectus and, unless indicated otherwise, are based on expenses incurred during the Fund’s most recent fiscal year. The Fund’s assets will fluctuate, but unless indicated otherwise in the Annual Fund Operating
24
Prospectus 2026
Columbia Variable Portfolio – Emerging Markets Bond Fund
More Information About the Fund (continued)
Expenses table, no adjustments have been or will be made to the expense ratios to reflect any differences in the Fund’s average net assets between the most recently completed fiscal year and the date of this prospectus or a later date. In general, the Fund’s expense ratios will increase as its net assets decrease, such that the Fund’s actual expense ratios may be higher than the expense ratios presented in the Annual Fund Operating Expenses table if assets fall. Any commitment by the Investment Manager and/or its affiliates to waive fees and/or cap (reimburse) expenses is expected, in part, to limit the impact of any increase in the Fund’s expense ratios that would otherwise result because of a decrease in the Fund’s assets in the current fiscal year. The Fund’s annual operating expenses are comprised of (i) investment management fees, (ii) distribution and/or service fees, and (iii) other expenses. Management fees do not vary by class, but distribution and/or service fees and other expenses may vary by class.
FUNDamentals
Other Expenses
“Other expenses” consist of the fees the Fund pays to its custodian, transfer agent, auditors, lawyers and trustees, costs relating to compliance and miscellaneous expenses. Generally, these expenses are allocated on a pro rata basis across all share classes. These fees include certain sub-transfer agency and shareholder servicing fees. For more information on these fees, see About Fund Shares and Transactions — Financial Intermediary Compensation.
Fee Waiver/Expense Reimbursement Arrangements and Impact on Past Performance
The Investment Manager and certain of its affiliates have contractually agreed to waive fees and/or reimburse expenses (excluding certain fees and expenses described below) through April 30, 2027, unless sooner terminated at the sole discretion of the Fund's Board, so that the Fund’s net operating expenses, after giving effect to fees waived/expenses reimbursed and any balance credits and/or overdraft charges from the Fund’s custodian, do not exceed the annual rates of:
| Columbia Variable Portfolio - Emerging Markets Bond Fund | |
| Class 1 |
0.78% |
| Class 2 |
1.03% |
Under the agreement, the following fees and expenses are excluded from the Fund’s operating expenses when calculating the waiver/reimbursement commitment, and therefore will be paid by the Fund, if applicable: taxes (including foreign transaction taxes), expenses associated with investment in affiliated and non-affiliated pooled investment vehicles (including mutual funds and exchange-traded funds), transaction costs and brokerage commissions, costs related to any securities lending program, dividend expenses associated with securities sold short, inverse floater program fees and expenses, transaction charges and interest on borrowed money, interest, costs associated with shareholder meetings, infrequent and/or unusual expenses and any other expenses the exclusion of which is specifically approved by the Fund’s Board. This agreement may be modified or amended only with approval from all parties.
Effect of Fee Waivers and/or Expense Reimbursements on Past Performance. The Fund’s returns shown in the Performance Information section of this prospectus reflect the effect of any fee waivers and/or reimbursements of Fund expenses by the Investment Manager and/or any of its affiliates that were in place during the performance period shown. Without such fee waivers/expense reimbursements, the Fund’s returns might have been lower.
Primary Service Provider Contracts
The Fund enters into contractual arrangements (Service Provider Contracts) with various service providers, including, among others, the Investment Manager, the Distributor, Columbia Management Investment Services Corp. (the Transfer Agent) and the Fund’s custodian. The Fund’s Service Provider Contracts are solely among the parties thereto. Shareholders are not parties to, or intended to be third-party beneficiaries of, any Service Provider Contracts. Further, this prospectus, the SAI and any Service Provider Contracts are not intended to give rise to any agreement,
Prospectus 2026
25
Columbia Variable Portfolio – Emerging Markets Bond Fund
More Information About the Fund (continued)
duty, special relationship or other obligation between the Fund and any investor, or give rise to any contractual, tort or other rights in any individual shareholder, group of shareholders or other person, including any right to assert a fiduciary or other duty, enforce the Service Provider Contracts against the parties or to seek any remedy thereunder, either directly or on behalf of the Fund. Nothing in the previous sentence should be read to suggest any waiver of any rights under federal or state securities laws.
The Investment Manager, the Distributor, and the Transfer Agent are all affiliates of Ameriprise Financial, Inc. (Ameriprise Financial). They and their affiliates currently provide key services, including investment advisory, administration, distribution, shareholder servicing and transfer agency services, to the Fund and various other funds, including the Columbia Funds, and are paid for providing these services. These service relationships are described below.
The Investment Manager
Columbia Management Investment Advisers, LLC is located at 290 Congress Street, Boston, MA 02210 and serves as investment adviser and administrator to the Columbia Funds. The Investment Manager is a registered investment adviser and a wholly-owned subsidiary of Ameriprise Financial. The Investment Manager’s management experience covers all major asset classes, including equity securities, debt instruments and money market instruments. In addition to serving as an investment adviser to traditional mutual funds, exchange-traded funds and closed-end funds, the Investment Manager acts as an investment adviser for itself, its affiliates, individuals, corporations, retirement plans, private investment companies and financial intermediaries.
Subject to oversight by the Board, the Investment Manager manages the day-to-day operations of the Fund, determining what securities and other investments the Fund should buy or sell and executing portfolio transactions. The Investment Manager may use the research and other capabilities of its affiliates and third parties in managing the Fund’s investments. The Investment Manager is also responsible for overseeing the administrative operations of the Fund, including the general supervision of the Fund’s operations, the coordination of the Fund’s other service providers and the provision of related clerical and administrative services.
The SEC has issued an order that permits the Investment Manager, subject to the approval of the Board, to appoint unaffiliated subadvisers by entering into subadvisory agreements with them, and to change in material respects the terms of those subadvisory agreements, including the fees paid thereunder, for the Fund without first obtaining shareholder approval, thereby avoiding the expense and delays typically associated with obtaining shareholder approval. The Fund furnishes shareholders with information about new subadvisers retained in reliance on the order within 90 days after hiring the subadviser. The Investment Manager and its affiliates may have other relationships, including significant financial relationships, with current or potential subadvisers or their affiliates, which may create certain conflicts of interest. When making recommendations to the Board to appoint or to change a subadviser, or to change the terms of a subadvisory agreement, the Investment Manager discloses to the Board the nature of any such material relationships. The SEC has issued a separate order that permits the Board to approve new subadvisory agreements or material changes to existing subadvisory agreements at a meeting that is not in person, provided that the Trustees are able to participate in the meeting using a means of communication that allows them to hear each other simultaneously during the meeting and other conditions of the order are satisfied. At present, the Investment Manager has not engaged any investment subadviser for the Fund.
The Investment Manager and its investment advisory affiliates (Participating Affiliates) around the world may coordinate in providing services to their clients. From time to time, the Investment Manager (or any affiliated investment subadviser to the Fund, as the case may be) may engage its Participating Affiliates to provide a variety of services such as investment research, investment monitoring, trading, and discretionary investment management (including portfolio management) to certain accounts managed by the Investment Manager, including the Fund. These Participating Affiliates will provide services to the Fund and other accounts of the Investment Manager (or any affiliated investment subadviser to the Fund, as the case may be) either pursuant to subadvisory agreements, delegation agreements, personnel-sharing agreements or similar inter-company or other arrangements or relationships and the Fund will pay no additional fees and expenses as a result of any such arrangements or
26
Prospectus 2026
Columbia Variable Portfolio – Emerging Markets Bond Fund
More Information About the Fund (continued)
relationships. These Participating Affiliates, like the Investment Manager, are direct or indirect subsidiaries of Ameriprise Financial and are registered with the appropriate respective regulators in their home jurisdictions and, where required, the SEC and the Commodity Futures Trading Commission in the United States.
Pursuant to some of these arrangements or relationships, certain personnel of these Participating Affiliates serve as “associated persons” or officers of the Investment Manager and, in this capacity, subject to the oversight and supervision of the Investment Manager and consistent with the investment objectives, policies and limitations set forth in this prospectus and the Fund's SAI, and with the Investment Manager’s and the Fund's compliance policies and procedures, provide services to the Fund.
The Fund pays the Investment Manager a fee for its management services, which include investment advisory services and administrative services. The fee is calculated as a percentage of the daily net assets of the Fund and is paid monthly. For the Fund’s most recent fiscal year, management services fees paid to the Investment Manager by the Fund amounted to 0.60% of average daily net assets of the Fund, before any applicable reimbursements.
A discussion regarding the basis for the Board’s approval of the renewal of the Fund's management agreement is available in the Fund’s Form N-CSR for the fiscal period ended June 30, 2025.
Portfolio Managers
Information about the portfolio managers primarily responsible for overseeing the Fund’s investments is shown below. The SAI provides additional information about the portfolio managers, including information relating to compensation, other accounts managed by the portfolio managers, and ownership by the portfolio managers of Fund shares.
| Portfolio Management |
Title |
Role with Fund |
Managed Fund Since |
| Adrian Hilton |
Head of Emerging Markets Debt |
Lead Portfolio Manager |
2020 |
| Christopher Cooke |
Portfolio Manager |
Portfolio Manager |
2017 |
Mr. Hilton joined Threadneedle Asset Management Limited, a Participating Affiliate, in 2016 as a fixed income portfolio manager. Mr. Hilton began his investment career in 2000 and earned a B.A. in History from the University of Birmingham (U.K.).
Mr. Cooke joined Threadneedle Asset Management Limited, a Participating Affiliate, in 2008. Prior to becoming Deputy Portfolio Manager in 2017, Mr. Cooke served as a portfolio analyst since 2013 and, prior to that, served as a graduate trainee and business analyst. Mr. Cooke began his investment career in 2008 and earned a BSc in computer science and artificial intelligence from the Aberystwyth University (Wales).
The Distributor
Shares of the Fund are distributed by Columbia Management Investment Distributors, Inc., which is located at 290 Congress Street, Boston, MA 02210. The Distributor is a registered broker-dealer and an indirect, wholly-owned subsidiary of Ameriprise Financial. The Distributor and its affiliates may pay commissions, distribution and service fees and/or other compensation to entities, including Ameriprise Financial affiliates, for selling shares and providing services to investors.
The Transfer Agent
Columbia Management Investment Services Corp. is a registered transfer agent and wholly-owned subsidiary of Ameriprise Financial. The Transfer Agent is located at 290 Congress Street, Boston, MA 02210, and its responsibilities include processing purchases, redemptions and transfers of Fund shares, calculating and paying distributions, maintaining shareholder records, preparing account statements and providing customer service. The Transfer Agent has engaged SS&C GIDS, Inc. to provide various sub-transfer agency services. The Fund pays a service fee to participating insurance companies or other financial intermediaries that provide sub-recordkeeping and other services to Contract owners and the separate accounts. The Transfer Agent may retain as compensation for its services revenues for fees for wire, telephone and redemption orders, account transcripts due the Transfer Agent from Fund shareholders and interest (net of bank charges) earned with respect to balances in accounts the Transfer Agent maintains in connection with its services to the Fund.
Prospectus 2026
27
Columbia Variable Portfolio – Emerging Markets Bond Fund
More Information About the Fund (continued)
Other Roles and Relationships of Ameriprise Financial and its Affiliates — Certain Conflicts of Interest
The Investment Manager, Distributor and Transfer Agent, all affiliates of Ameriprise Financial, provide various services to the Fund and other Columbia Funds for which they are compensated. Ameriprise Financial and its other affiliates may also provide other services to these funds and be compensated for them.
The Investment Manager and its affiliates may provide investment advisory and other services to other clients and customers substantially similar to those provided to the Columbia Funds. These activities, and other financial services activities of Ameriprise Financial and its affiliates, may present actual and potential conflicts of interest and introduce certain investment constraints.
Ameriprise Financial is a major financial services company, engaged in a broad range of financial activities beyond the fund-related activities of the Investment Manager, including, among others, insurance, broker-dealer (sales and trading), asset management, banking and other financial activities. These additional activities may involve multiple advisory, financial, insurance and other interests in securities and other instruments, and in companies that issue securities and other instruments, that may be bought, sold or held by the Columbia Funds.
Conflicts of interest and limitations that could affect a Columbia Fund may arise from, for example, the following:
■
compensation and other benefits received by the Investment Manager and other Ameriprise Financial affiliates related to the management/administration of a Columbia Fund and the sale of its shares;
■
the allocation of, and competition for, investment opportunities among the Fund, other funds and accounts advised/managed by the Investment Manager and other Ameriprise Financial affiliates, or Ameriprise Financial itself and its affiliates;
■
separate and potentially divergent management of a Columbia Fund and other funds and accounts advised/managed by the Investment Manager and other Ameriprise Financial affiliates;
■
regulatory and other investment restrictions on investment activities of the Investment Manager and other Ameriprise Financial affiliates and accounts advised/managed by them;
■
insurance and other relationships of Ameriprise Financial affiliates with companies and other entities in which a Columbia Fund invests;
■
regulatory and other restrictions relating to the sharing of information between Ameriprise Financial and its affiliates, including the Investment Manager, and a Columbia Fund; and
■
insurance companies investing in the Fund may be affiliates of Ameriprise Financial; these affiliated insurance companies, individually and collectively, may hold through separate accounts a significant portion of the Fund's shares and may also invest in separate accounts managed by the Investment Manager that have the same or substantially similar investment objectives and strategies as the Fund.
The Investment Manager and Ameriprise Financial have adopted various policies and procedures that are intended to identify, monitor and address conflicts of interest. However, there is no assurance that these policies, procedures and disclosures will be effective.
Additional information about Ameriprise Financial and the types of conflicts of interest and other matters referenced above is set forth in the Investment Management and Other Services — Other Roles and Relationships of Ameriprise Financial and its Affiliates — Certain Conflicts of Interest section of the SAI. Investors in the Columbia Funds should carefully review these disclosures and consult with their financial advisor if they have any questions.
Certain Legal Matters
Ameriprise Financial and certain of its affiliates are involved, in the normal course of business, in legal proceedings that include regulatory inquiries, arbitration and litigation (including class actions) concerning matters arising in connection with the conduct of their activities as part of a diversified financial services firm. Ameriprise Financial believes that the Fund is not currently the subject of, and that neither Ameriprise Financial nor any of its affiliates are the subject of, any pending legal, arbitration or regulatory proceedings that are likely to have a material adverse
28
Prospectus 2026
Columbia Variable Portfolio – Emerging Markets Bond Fund
More Information About the Fund (continued)
effect on the Fund or the ability of Ameriprise Financial or its affiliates to perform under their contracts with the Fund. Information regarding certain pending and settled legal proceedings may be found in the Fund’s Form N-CSR and in the SAI. Additionally, Ameriprise Financial is required to make quarterly (10-Q), annual (10-K) and, as necessary, 8-K filings with the SEC on legal and regulatory matters that relate to Ameriprise Financial and its affiliates. Copies of these filings may be obtained by accessing the SEC website at sec.gov.
Prospectus 2026
29
Columbia Variable Portfolio – Emerging Markets Bond Fund
About Fund Shares and Transactions
Description of the Share Classes
Share Class Features
The Fund offers the classes of shares set forth on the cover of this prospectus. Each share class has its own cost structure and other features. The following summarizes the primary features of the Class 1 and Class 2 shares.
| |
Class 1 Shares |
Class 2 Shares |
| Eligible Investors |
Shares of the Fund are available only to separate accounts of participating insurance companies as underlying investments for variable annuity contracts and/or variable life insurance policies (collectively, Contracts) or qualified pension and retirement plans (Qualified Plans) or other eligible investors authorized by the Distributor. | |
| Investment Limits |
none |
none |
| Conversion Features |
none |
none |
| Front-End Sales Charges |
none |
none |
| Contingent Deferred Sales Charges (CDSCs) |
none |
none |
| Maximum Distribution and/or Service Fees |
none |
0.25% |
FUNDamentals
Financial Intermediaries
The term “financial intermediary” refers to the insurance company that issued your contract, qualified pension or retirement plan sponsors or the financial intermediary that employs your financial advisor. Financial intermediaries also include broker-dealers and financial advisors as well as firms that employ broker-dealers and financial advisors, including, for example, brokerage firms, banks, investment advisers, third party administrators and other firms in the financial services industry, including Ameriprise Financial and its affiliates.
Distribution and/or Service Fees
Pursuant to Rule 12b-1 under the Investment Company Act of 1940, as amended (the 1940 Act), the Board has approved, and the Fund has adopted, a distribution plan which sets the distribution fees that are periodically deducted from the Fund’s assets for Class 2 shares. The distribution fee for Class 2 shares is 0.25%. These fees are calculated daily, may vary by share class and are intended to compensate the Distributor and/or financial intermediaries for selling shares of the Fund and/or providing services to investors. Because the fees are paid out of the Fund’s assets on an ongoing basis, they will increase the cost of your investment over time.
The Fund will pay these fees to the Distributor and/or to eligible financial intermediaries for as long as the distribution plan continues. The Fund may reduce or discontinue payments at any time.
The Fund pays a service fee to participating insurance companies or other financial intermediaries that provide sub-recordkeeping and other services to Contract owners, Qualified Plan participants and the separate accounts.
Financial Intermediary Compensation
The Distributor, the Investment Manager and their affiliates make payments, from their own resources, to financial intermediaries, primarily to affiliated and unaffiliated insurance companies, for marketing/sales support services relating to the Fund (Marketing Support Payments). Such payments are generally based upon one or more of the following factors: average net assets of the Columbia Funds sold by the Distributor attributable to that financial intermediary; gross sales of the Columbia Funds distributed by the Distributor attributable to that financial intermediary; or a negotiated lump sum payment. While the financial arrangements may vary for each financial intermediary, the Marketing Support Payments to any one financial intermediary are generally between 0.05% and 0.40% on an annual basis for payments based on average net assets of the Fund attributable to the financial intermediary, and between 0.05% and 0.25% on an annual basis for a financial intermediary receiving a payment based on gross sales of the Columbia Funds attributable to the financial intermediary.
30
Prospectus 2026
Columbia Variable Portfolio – Emerging Markets Bond Fund
About Fund Shares and Transactions (continued)
As employee compensation and business unit operating goals at all levels are generally tied to the success of Ameriprise Financial, employees of Ameriprise Financial and its affiliates, including employees of affiliated broker-dealers and insurance companies, are incented to include shares of the Columbia Funds in Contracts offered by affiliated insurance companies. Certain employees, directly or indirectly, receive higher compensation and other benefits as investment in the Columbia Funds increases. In addition, management, sales leaders and other employees may spend more of their time and resources promoting Ameriprise Financial and its subsidiary companies, including the Distributor and the Investment Manager, and the products they offer, including the Fund.
In addition, the Transfer Agent has certain arrangements in place to compensate financial intermediaries, primarily to affiliated and unaffiliated insurance companies, that hold Fund shares through networked and omnibus accounts, including omnibus retirement plans, for services that they provide to beneficial Fund shareholders (Shareholder Services). Shareholder Services and related fees vary by financial intermediary and may include sub-accounting, sub-transfer agency, participant recordkeeping, shareholder or participant reporting, shareholder or participant transaction processing, maintenance of shareholder records, preparation of account statements and provision of customer service, and are not intended to include services that are primarily intended to result in the sale of Fund shares. Payments for Shareholder Services generally are not expected, with certain limited exceptions, to exceed 0.40% of the average aggregate value of the Fund’s shares. Each Fund pays the Transfer Agent a service fee equal to the payments made by the Transfer Agent to participating insurance companies and other financial intermediaries that provide Shareholder Services up to the lesser of the amount charged by the financial intermediary or a contractual asset-based cap. Payments of amounts that exceed the amount paid by the Fund are borne by the Transfer Agent, the Investment Manager and/or their affiliates.
In addition to the payments described above, the Distributor, the Investment Manager and their affiliates typically make other payments or allow promotional incentives to certain broker-dealers to the extent permitted by SEC and Financial Industry Regulatory Authority (FINRA) rules and by other applicable laws and regulations.
Amounts paid by the Distributor, the Investment Manager and their affiliates are paid out of their own resources and do not increase the amount paid by you or the Fund. You can find further details in the SAI about the payments made by the Distributor, the Investment Manager and their affiliates, as well as a list of the financial intermediaries, including Ameriprise Financial affiliates, to which the Distributor, the Investment Manager or their affiliates have agreed to make Marketing Support Payments and fee payments for Shareholder Services.
Your financial intermediary may charge you fees and commissions in addition to those described in this prospectus. You should consult with your financial intermediary and review carefully any disclosure your financial intermediary provides regarding its services and compensation. Depending on the financial arrangement in place at any particular time, a financial intermediary and its financial advisors may have a conflict of interest or financial incentive with respect to recommendations regarding the Fund or any Contract or Qualified Plan that includes the Fund.
Share Price Determination
The price you pay or receive when you buy, sell or transfer shares is the Fund's next determined net asset value (or NAV) per share for a given share class. The Fund calculates the NAV per share for each class of shares of the Fund at the end of each business day, with the value of the Fund's shares based on the total value of all of the securities and other assets that it holds as of such specified time.
FUNDamentals
NAV Calculation
Each of the Fund's share classes calculates its NAV per share as follows:
NAV per share = (Value of assets of the share class) – (Liabilities of the share class)
Number of outstanding shares of the class
Number of outstanding shares of the class
Prospectus 2026
31
Columbia Variable Portfolio – Emerging Markets Bond Fund
About Fund Shares and Transactions (continued)
FUNDamentals
Business Days
A business day is any day that the New York Stock Exchange (NYSE) is open. A business day typically ends at the close of regular trading on the NYSE, usually at 4:00 p.m. Eastern time. If the NYSE is scheduled to close early, the business day will be considered to end as of the time of the NYSE’s scheduled close. The Fund will not treat an intraday unscheduled disruption in NYSE trading or an intraday unscheduled closing as a close of regular trading on the NYSE for these purposes and will price its shares as of the regularly scheduled closing time for that day (typically, 4:00 p.m. Eastern time). Nonetheless, the NAV of Fund shares may be determined at such other time or times (in addition to or in lieu of the time set forth above) as the Fund’s Board may approve or ratify. On holidays and other days when the NYSE is closed, the Fund’s NAV is not calculated and the Fund does not accept buy or sell orders. However, the value of the Fund’s assets may still be affected on such days to the extent that the Fund holds foreign securities that trade on days that foreign securities markets are open.
Equity securities listed on an exchange are typically valued at the closing price or last trade on their primary exchange at the close of business of the NYSE. Equity securities without a readily available closing price or that are not listed on any exchange are typically valued at the mean between the closing bid and asked prices. Other equity securities, debt securities and other assets are valued differently. For instance, bank loans trading in the secondary market are fair valued unless market quotations are readily available, fixed income investments maturing in 60 days or less are valued primarily using the amortized cost method, unless this methodology results in a valuation that does not approximate the market value of these securities, and those maturing in excess of 60 days are valued based on prices obtained from a pricing service, if available (which may represent market values or fair values). Investments in other open-end funds are valued at their published NAVs. The value of the Fund’s portfolio securities is determined in accordance with the valuation policy approved by the Board (the Valuation Policy). Pursuant to Rule 2a-5 under the 1940 Act, the Board has designated the Investment Manager as the Fund’s valuation designee. The Investment Manager, in turn, has authorized its valuation committee to make fair value determinations and to carry out supervisory and certain other functions relating to the valuation of Fund portfolio securities, pursuant to the Valuation Policy.
If a market price is not readily available or is deemed not to reflect market value for a portfolio security, the Investment Manager will determine the price based on a determination of the security's fair value pursuant to the Valuation Policy. In addition, the Investment Manager may use fair valuation techniques to price securities that trade on a foreign exchange when a significant event has occurred after the foreign exchange closes but before the time at which the Fund’s share price is calculated. Foreign exchanges typically close before the time at which Fund share prices are calculated, and may be closed altogether on days when the Fund is open. Such significant events affecting a foreign security may include, but are not limited to: (1) corporate actions, earnings announcements, litigation or other events impacting a single issuer; (2) governmental action that affects securities in one sector or country; (3) natural disasters or armed conflicts affecting a country or region; or (4) significant domestic or foreign market fluctuations. The Fund uses various criteria, including an evaluation of U.S. market moves after the close of foreign markets, in determining whether a foreign security's market price is readily available and reflective of market value and, if not, the fair value of the security.
Fair valuation may have the effect of reducing stale pricing arbitrage opportunities presented by the pricing of Fund shares. However, when the Investment Manager uses fair valuation to price equity securities, it may value those securities higher or lower than another fund or manager would. Also, fair valuation of Fund holdings may cause the Fund's performance to diverge to a greater degree from the performance of various benchmark indices used to compare the Fund's performance because indices generally do not use fair valuation techniques. Because of the judgment involved in fair valuation decisions, there can be no assurance that the value ascribed to a particular security is accurate. The Fund has retained one or more independent fair valuation pricing services to assist in the fair valuation process for foreign securities.
32
Prospectus 2026
Columbia Variable Portfolio – Emerging Markets Bond Fund
About Fund Shares and Transactions (continued)
Futures and options on futures are valued based upon the settlement price as determined by the principal exchange on which they are traded or, in the absence of a settlement price, at the mean of the closing bid and ask. Generally, over-the-counter derivatives, such as swaps and swaptions, are valued based on a price provided by an approved pricing service.
Shareholder Information
Each share class has its own cost structure and other features. Your product may not offer every share class. The Fund encourages you to consult with a financial advisor who can help you with your investment decisions and for more information about the share classes offered by the Fund and available under your product. Shares of the Fund are generally available for purchase only by participating insurance companies in connection with Contracts and Qualified Plan sponsors.
The Fund, the Distributor or the Transfer Agent may refuse any order to buy or transfer shares. If this happens, the Fund will return any money it received, but no interest will be paid on that money.
Shares of the Fund may not be purchased or sold directly by individual Contract owners or participants in a Qualified Plan. When you sell your shares through your Contract or Qualified Plan, the Fund is effectively buying them back. This is called a redemption. The right of redemption may be suspended or payment postponed whenever permitted by applicable laws and regulations, as described under Satisfying Fund Redemption Requests below.
Depending on the context, references to “you” or “your” herein refer either to the holder of a Contract, participant in a Qualified Plan or qualified institutional investor who may select Fund shares to fund his or her investment in the Contract or Qualified Plan or to the participating insurance company as the holder of Fund shares through one or more separate accounts or the Qualified Plan.
Satisfying Fund Redemption Requests
The Fund typically expects to send the redeeming participating insurance company or Qualified Plan sponsor payment for shares within two business days after your trade date. The Fund can suspend redemptions and/or delay payment of redemption proceeds for up to seven days. The Fund can also suspend redemptions and/or delay payment of redemption proceeds in excess of seven days under certain circumstances, including when the NYSE is closed or trading thereon is restricted or during emergency or other circumstances, including as determined by the SEC.
The Fund typically seeks to satisfy redemption requests from cash or cash equivalents held by the Fund, from the proceeds of orders to purchase Fund shares or from the proceeds of sales of Fund holdings effected in the normal course of managing the Fund. However, the Fund may have to sell Fund holdings, including in down markets, to meet heavier than usual redemption requests. For example, under stressed or abnormal market conditions or circumstances, including circumstances adversely affecting the liquidity of the Fund’s investments, the Fund may be more likely to be forced to sell Fund holdings to meet redemptions than under normal market circumstances. In these situations, the Fund’s portfolio managers may have to sell Fund holdings that would not otherwise be sold because, among other reasons, the current price to be received is less than the value of the holdings perceived by the Fund’s portfolio managers. The Fund may also, under certain circumstances (but more likely under stressed or abnormal market conditions or circumstances), borrow money under a credit facility to which the Fund and certain other Columbia Funds are parties or from other Columbia Funds under an interfund lending program (except for closed-end funds and money market funds, which are not eligible to borrow under the program). The Fund and the other Columbia Funds are limited as to the amount that each may individually and collectively borrow under the credit facility and the interfund lending program. As a result, borrowings available to the Fund under the credit facility and the interfund lending program might be insufficient, alone or in combination with the other strategies described herein, to satisfy Fund redemption requests. Please see About Fund Investments – Borrowings – Interfund Lending in the SAI for more information about the credit facility and interfund lending program. The Fund is also limited in the total amount it may borrow. The Fund may only borrow to the extent permitted by the 1940 Act, the rules and regulations thereunder, and any exemptive relief available to the Fund, which currently limit Fund borrowings to
Prospectus 2026
33
Columbia Variable Portfolio – Emerging Markets Bond Fund
About Fund Shares and Transactions (continued)
33 1/3% of total assets (including any amounts borrowed) less liabilities (other than borrowings), plus an additional 5% of its total assets for temporary purposes (to be repaid within 60 days without extension or renewal), in each case determined at the time the borrowing is made.
In addition, the Fund reserves the right to honor redemption orders in whole or in part with in-kind distributions of Fund portfolio securities instead of cash if the Investment Manager, in its sole discretion, determines it to be in the best interest of the remaining shareholders. Such in-kind distributions typically represent a pro-rata portion of Fund portfolio assets subject to adjustments (e.g., for non-transferable securities, round lots and derivatives). In the event the Fund distributes portfolio securities in kind, shareholders may incur brokerage and other transaction costs associated with converting the portfolio securities into cash. Also, the portfolio securities may increase or decrease in value after they are distributed but before they are converted into cash. For U.S. federal income tax purposes, redemptions paid in securities are generally treated the same as redemptions paid in cash. If, during any 90-day period, you redeem shares in an amount greater than $250,000 or 1% of the Fund’s net assets (whichever is less), and if the Investment Manager determines it to be feasible and appropriate, the Fund may pay the redemption amount above such threshold by an in-kind distribution of Fund portfolio securities. Although shares of the Fund may not be purchased or sold by individual owners of Contracts or Qualified Plans, this policy applies indirectly to Contract and Qualified Plan owners.
Potential Conflicts of Interest – Mixed and Shared Funding
The Fund is available for purchase only through Contracts offered by participating insurance companies, Qualified Plans and other qualified institutional investors authorized by the Distributor. Due to differences in tax treatment and other considerations, the interests of various Contract owners, and the interests of Qualified Plan participants, if any, may conflict. The Fund does not foresee any disadvantages to investors arising from these potential conflicts of interest at this time. Nevertheless, the Board of the Fund intends to monitor events to identify any material irreconcilable conflicts which may arise, and to determine what action, if any, should be taken in response to any conflicts. If such a conflict were to arise, one or more separate accounts might be required to withdraw its investments in the Fund or shares of another mutual fund may be substituted. This might force the Fund to sell securities at disadvantageous prices.
Order Processing
Orders to buy and sell shares of the Fund that are placed by your participating insurance company or Qualified Plan sponsor are processed on business days. Orders received in “good form” by the Transfer Agent or a financial intermediary, including your participating insurance company or Qualified Plan sponsor, before the end of a business day are priced at the NAV per share of the Fund's applicable share class on that day. Orders received after the end of a business day will receive the next business day’s NAV per share. An order is in “good form” if the Transfer Agent or your financial intermediary has all of the information and documentation it deems necessary to effect your order. The market value of the Fund’s investments may change between the time you submit your order and the time the Fund next calculates its NAV per share. The business day that applies to your order is also called the trade date.
There is no sales charge associated with the purchase of Fund shares, but there may be charges associated with your Contract or Qualified Plan. Any charges that apply to your Contract or Qualified Plan, and any charges that apply to separate accounts of participating insurance companies or Qualified Plans that may own shares directly, are described in your separate Contract prospectus or Qualified Plan disclosure documents.
You may transfer all or part of your investment in the Fund to one or more of the other investment options available under your Contract or Qualified Plan. You may provide instructions to sell any amount allocated to the Fund. Proceeds will be mailed within seven days after your surrender or withdrawal request is received in good form by an authorized agent. The amount you receive may be more or less than the amount you invested.
Please refer to your Contract prospectus or Qualified Plan disclosure documents, as applicable, for more information about transfers as well as surrenders and withdrawals.
34
Prospectus 2026
Columbia Variable Portfolio – Emerging Markets Bond Fund
About Fund Shares and Transactions (continued)
Information Sharing Agreements
As required by Rule 22c-2 under the 1940 Act, the Fund or certain of its service providers will enter into information sharing agreements with financial intermediaries, including participating life insurance companies and financial intermediaries that sponsor or offer retirement plans through which shares of the Fund are made available for purchase. Pursuant to Rule 22c-2, financial intermediaries are required, upon request, to: (i) provide shareholder account and transaction information; and (ii) execute instructions from the Fund to restrict or prohibit further purchases of Fund shares by shareholders who have been identified by the Fund as having engaged in transactions that violate the Fund's excessive trading policies and procedures.
Excessive Trading Practices Policy of Non-Money Market Funds
Right to Reject or Restrict Share Transaction Orders — The Fund is intended for investors with long-term investment purposes and is not intended as a vehicle for frequent trading activity (market timing) that is excessive. Investors should transact in Fund shares primarily for investment purposes. The Board has adopted excessive trading policies and procedures that are designed to deter excessive trading by investors (the Excessive Trading Policies and Procedures). The Fund discourages and does not accommodate excessive trading. Investments in a Fund by institutional investors in connection with redemptions in-kind are exempt from the Excessive Trading Policies and Procedures because they generally do not raise market timing or excessive trading concerns. Further discussion about the Fund’s use of redemptions in-kind is available under Satisfying Fund Redemption Requests.
The Fund reserves the right to reject, without any prior notice, any purchase or transfer order for any reason, and will not be liable for any loss resulting from rejected orders. For example, the Fund may in its sole discretion restrict or reject a purchase or transfer order even if the transaction is not subject to the specific limitation described below if the Fund or its agents determine that accepting the order could interfere with efficient management of the Fund's portfolio or is otherwise contrary to the Fund's best interests. The Excessive Trading Policies and Procedures apply equally to purchase or transfer transactions communicated directly to the Transfer Agent and to those received by financial intermediaries.
Specific Buying and Transferring Limitations — If the Fund detects that an investor has made two “material round trips” in any 28-day period, it will generally reject the investor's future purchase orders, including transfer buy orders, involving any Fund.
For these purposes, a “round trip” is a purchase or transfer into the Fund followed by a sale or transfer out of the Fund, or a sale or transfer out of the Fund followed by a purchase or transfer into the Fund. A “material” round trip is one that is deemed by the Fund to be material in terms of its amount or its potential detrimental impact on the Fund. Independent of this limit, the Fund may, in its sole discretion, reject future purchase orders by any person, group or account that appears to have engaged in any type of excessive trading activity.
These limits generally do not apply to automated transactions or transactions by registered investment companies in a “fund-of-funds” structure. These limits do not apply to payroll deduction contributions by retirement plan participants, transactions initiated by a retirement plan sponsor or certain other retirement plan transactions consisting of rollover transactions, loan repayments and disbursements, and required minimum distribution redemptions. They may be modified or rescinded for accounts held by certain retirement plans to conform to plan limits, for considerations relating to the Employee Retirement Income Security Act of 1974 or regulations of the Department of Labor, and for certain asset allocation or wrap programs. Accounts known to be under common ownership or control generally will be counted together, but accounts maintained or managed by a common intermediary generally will not be considered to be under common ownership or control. The Fund reserves the right to modify these restrictions at any time without prior notice to shareholders. In addition, the Fund may, in its sole discretion, reinstate trading privileges that have been revoked under the Fund's Excessive Trading Policies and Procedures.
Limitations on the Ability to Detect and Prevent Excessive Trading Practices — The Fund takes various steps designed to detect and prevent excessive trading, including daily review of available shareholder transaction information. However, the Fund receives buy, sell or transfer orders through financial intermediaries, and cannot always know of or reasonably detect excessive trading that may be facilitated by financial intermediaries or by the use of the
Prospectus 2026
35
Columbia Variable Portfolio – Emerging Markets Bond Fund
About Fund Shares and Transactions (continued)
omnibus account arrangements they offer. Omnibus account arrangements are common forms of holding shares of mutual funds, particularly among certain financial intermediaries such as broker-dealers, retirement plans and variable insurance products. These arrangements often permit financial intermediaries to aggregate their clients' transactions and accounts, and in these circumstances, the identities of the financial intermediary clients that beneficially own Fund shares are often not known to the Fund.
Some financial intermediaries apply their own restrictions or policies to their clients’ transactions and accounts, which may be more or less restrictive than those described here. This may impact the Fund's ability to curtail excessive trading, even where it is identified. For these and other reasons, it is possible that excessive trading may occur despite the Fund's efforts to detect and prevent it.
Although these restrictions and policies involve judgments that are inherently subjective and may involve some selectivity in their application, the Fund seeks to act in a manner that it believes is consistent with the best interests of Fund shareholders in making any such judgments.
Risks of Excessive Trading — Excessive trading creates certain risks to the Fund's long-term shareholders and may create the following adverse effects:
■
negative impact on the Fund's performance;
■
potential dilution of the value of the Fund's shares;
■
interference with the efficient management of the Fund's portfolio, such as the need to maintain undesirably large cash positions, the need to use its line of credit or the need to buy or sell securities it otherwise would not have bought or sold;
■
losses on the sale of investments resulting from the need to sell securities at less favorable prices; and
■
increased brokerage and administrative costs.
To the extent that the Fund invests significantly in foreign securities traded on markets that close before the Fund's valuation time, it may be particularly susceptible to dilution, which may be exacerbated as a result of excessive trading. Because events may occur after the close of foreign markets and before the Fund's valuation time that influence the value of foreign securities, investors may seek to trade Fund shares in an effort to benefit from their understanding of the value of foreign securities as of the Fund's valuation time. This is often referred to as price arbitrage. The Fund has adopted procedures designed to adjust closing market prices of foreign securities under certain circumstances to reflect what the Fund believes to be the fair value of those securities as of its valuation time. To the extent the adjustments do not work fully, investors engaging in price arbitrage may cause dilution in the value of the Fund's shares held by other shareholders.
Similarly, to the extent that the Fund invests significantly in thinly traded securities and other debt instruments that are rated below investment grade (commonly called “high-yield” or “junk” bonds), equity securities of small-capitalization companies, floating rate loans, or tax-exempt or other securities that may trade infrequently, because these securities are often traded infrequently, investors may seek to trade Fund shares in an effort to benefit from their understanding of the value of these securities as of the Fund's valuation time. This is also a type of price arbitrage. Any such frequent trading strategies may interfere with efficient management of the Fund's portfolio to a greater degree than would be the case for mutual funds that invest only, or significantly, in highly liquid securities, in part because the Fund may have difficulty selling these particular investments at advantageous times or prices to satisfy large and/or frequent sell orders. Any successful price arbitrage may also cause dilution in the value of Fund shares held by non-redeeming shareholders.
Excessive Trading Practices Policy of Columbia Variable Portfolio - Government Money Market Fund
A money market fund is designed to offer investors a liquid cash option that they may buy and sell as often as they wish. Accordingly, the Board has not adopted policies and procedures designed to discourage excessive or short-term trading of Columbia Variable Portfolio - Government Money Market Fund shares. However, since frequent purchases and sales of Columbia Variable Portfolio - Government Money Market Fund shares could in certain instances harm shareholders in various ways, including reducing the returns to long-term shareholders by increasing
36
Prospectus 2026
Columbia Variable Portfolio – Emerging Markets Bond Fund
About Fund Shares and Transactions (continued)
costs (such as spreads paid to dealers who trade money market instruments with Columbia Variable Portfolio - Government Money Market Fund) and disrupting portfolio management strategies, Columbia Variable Portfolio - Government Money Market Fund reserves the right, but has no obligation, to reject any purchase or transfer transaction at any time. Columbia Variable Portfolio - Government Money Market Fund has no limits on purchase or transfer transactions. In addition, Columbia Variable Portfolio - Government Money Market Fund reserves the right to impose or modify restrictions on purchases, transfers or trading of Fund shares at any time.
Prospectus 2026
37
Columbia Variable Portfolio – Emerging Markets Bond Fund
Distributions and Taxes
Distributions to Shareholders
A mutual fund can make money two ways:
■
It can earn income on its investments. Examples of fund income are interest paid on money market instruments and bonds, and dividends paid on common stocks.
■
A mutual fund can also have capital gains if the value of its investments increases. While a fund continues to hold an investment, any gain is generally unrealized. If the fund sells an investment, it generally will realize a capital gain if it sells that investment for a higher price than its adjusted cost basis, and will generally realize a capital loss if it sells that investment for a lower price than its adjusted cost basis. Capital gains and losses are either short-term or long-term, depending on whether the fund holds the securities for one year or less (short-term) or more than one year (long-term).
Mutual funds make payments of fund earnings to shareholders, distributing them among all shareholders of the fund. As a shareholder, you are entitled to your portion of a fund's distributed income, including capital gains. Reinvesting your distributions buys you more shares of a fund — which lets you take advantage of the potential for compound growth. Putting the money you earn back into your investment means it, in turn, may earn even more money (or be exposed to additional losses, if the fund earns a negative return). Over time, the power of compounding has the potential to significantly increase the value of your investment. There is no assurance, however, that you'll earn more money if you reinvest your distributions rather than receive them in cash.
The Fund intends to pay out, in the form of distributions to shareholders, a sufficient amount of its income and gains so that the Fund will qualify for treatment as a regulated investment company and generally will not have to pay any federal income or excise tax. The Fund generally intends to distribute any net realized capital gain (whether long-term or short-term gain) at least once a year. Normally, the Fund will declare and pay distributions of net investment income according to the following schedule:
| Declaration and Distribution Schedule | |
| Declarations |
Quarterly |
| Distributions |
Quarterly |
The Fund may declare or pay distributions of net investment income more frequently.
Different share classes of the Fund usually pay different net investment income distribution amounts, because each class has different expenses. Each time a distribution is made, the NAV per share of the share class is reduced by the amount of the distribution.
The Fund will automatically reinvest distributions in additional shares of the same share class of the Fund unless you inform us you want to receive your distributions to be paid in cash.
Taxes and Your Investment
Taxation of the Fund: The Fund has elected and intends to qualify and to be eligible for treatment each year as a regulated investment company. A regulated investment company generally is not subject to tax at the fund level on income and gains from investments that are distributed to shareholders. However, the Fund’s failure to qualify and be eligible for treatment as a regulated investment company would result in fund-level taxation, and consequently, a reduction in income available for distribution to you.
Taxation of Fund Shares: Shares of the Fund are only offered to separate accounts of participating insurance companies, Qualified Plans, and certain other eligible persons or plans permitted to hold shares of the Fund pursuant to the applicable U.S. Treasury Regulations without impairing the ability of participating insurance companies to satisfy the diversification requirements of Section 817(h) of the Internal Revenue Code of 1986, as amended. Each participating insurance company, including each participating insurance company that is an affiliate of the Investment Manager, includes in its taxable income any net investment income derived from the investment of assets held in its separate accounts because the insurance company is considered the owner of these assets under federal income tax law. The insurance company may claim certain tax benefits associated with this investment
38
Prospectus 2026
Columbia Variable Portfolio – Emerging Markets Bond Fund
Distributions and Taxes (continued)
income. These benefits, which may include foreign tax credits (which can reduce the insurance company’s U.S. taxes on foreign source income) and the corporate dividends-received deduction (which is a tax deduction for the insurance company attributable to certain dividends received from the Fund), are not passed on to Contract owners since the affiliated insurance company is the owner of the assets under federal tax law and is taxed on the investment income generated by the assets.
Taxation of Variable Annuity Contracts and Variable Life Insurance Policies: Your Contract may qualify for favorable tax treatment. Please refer to your Contract prospectus for more information about the tax implications of your investment in the Contract. As long as your Contract continues to qualify for such favorable tax treatment, you will not be taxed currently on your investment in the Fund through such Contract, even if the Fund makes distributions to the separate account and/or you change your investment options under the Contract. In order to qualify for such treatment, among other things, the separate accounts of participating insurance companies, which maintain and invest net proceeds from Contracts, must be “adequately diversified.” The Fund intends to operate in such a manner so that a separate account investing only in Fund shares on behalf of a holder of a Contract will be “adequately diversified.” If the Fund does not meet such requirements because its investments are not adequately diversified, your Contract could lose its favorable tax treatment, and income and gain allocable to your Contract could be taxable currently to you. This could also occur if Contract holders are found to have an impermissible level of control over the investments underlying their Contracts. You should consult with the participating insurance company that issued your Contract, plan sponsor, or other eligible investor through which your investment in the Fund is made regarding the U.S. federal income taxation of your investment.
FUNDamentals
Taxes
The information provided above is only a summary of how U.S. federal income taxes may affect your indirect investment in the Fund. It is not intended as a substitute for careful tax planning. Your investment in the Fund may have other tax implications. It does not apply to certain types of investors who may be subject to special rules, including foreign or tax-exempt investors or those holding Fund shares through a tax-advantaged account other than a Contract, such as a 401(k) plan or IRA. Please see the SAI for more detailed tax information. You should consult with your own tax advisor about the particular tax consequences to you of an investment in the Fund, including the effect of any foreign, state and local taxes, and the effect of possible changes in applicable tax laws.
Prospectus 2026
39
Columbia Variable Portfolio – Emerging Markets Bond Fund
Financial Highlights
The financial highlights table is intended to help you understand the Fund’s financial performance for the past five fiscal years or, if shorter, the Fund’s period of operations. Certain information reflects financial results for a single Fund share. Per share net investment income (loss) amounts are calculated based on average shares outstanding during the period. The total return in the table represents the rate that an investor would have earned (or lost) on an investment in the Fund assuming all dividends and distributions had been reinvested. Total return does not reflect any fees and expenses imposed under your Contract and/or Qualified Plan, as applicable; such fees and expenses would reduce the total return for all periods shown. Total return and portfolio turnover are not annualized for periods of less than one year. The ratios of expenses and net investment income are annualized for periods of less than one year. The portfolio turnover rate is calculated without regard to purchase and sales transactions of short-term instruments and certain derivatives, if any. If such transactions were included, the Fund’s portfolio turnover rate may be higher. A zero balance may reflect an amount rounding to less than $0.01 or 0.01%. This information has been audited by PricewaterhouseCoopers LLP, an independent registered public accounting firm, whose report, along with the Fund’s financial statements, is included in the Fund’s Form N-CSR, which is available upon request.
Prospectus 2026
41
Columbia Variable Portfolio – Emerging Markets Bond Fund
Financial Highlights (continued)
| |
Net asset value, beginning of period |
Net investment income |
Net realized and unrealized gain (loss) |
Total from investment operations |
Distributions from net investment income |
Total distributions to shareholders |
| Class 1 | ||||||
| Year Ended 12/31/2025 |
$7.94 |
0.44 |
0.55 |
0.99 |
(0.44) |
(0.44) |
| Year Ended 12/31/2024 |
$7.86 |
0.42 |
0.08 |
0.50 |
(0.42) |
(0.42) |
| Year Ended 12/31/2023 |
$7.52 |
0.40 |
0.36 |
0.76 |
(0.42) |
(0.42) |
| Year Ended 12/31/2022 |
$9.37 |
0.34 |
(1.85) |
(1.51) |
(0.34) |
(0.34) |
| Year Ended 12/31/2021 |
$9.97 |
0.37 |
(0.59) |
(0.22) |
(0.38) |
(0.38) |
| Class 2 | ||||||
| Year Ended 12/31/2025 |
$7.93 |
0.42 |
0.56 |
0.98 |
(0.42) |
(0.42) |
| Year Ended 12/31/2024 |
$7.85 |
0.39 |
0.09 |
0.48 |
(0.40) |
(0.40) |
| Year Ended 12/31/2023 |
$7.52 |
0.38 |
0.35 |
0.73 |
(0.40) |
(0.40) |
| Year Ended 12/31/2022 |
$9.36 |
0.32 |
(1.83) |
(1.51) |
(0.33) |
(0.33) |
| Year Ended 12/31/2021 |
$9.96 |
0.34 |
(0.59) |
(0.25) |
(0.35) |
(0.35) |
| Notes to Financial Highlights | |
| (a) |
In addition to the fees and expenses that the Fund bears directly, the Fund indirectly bears a pro rata share of the fees and expenses of any other funds in which it invests. Such indirect expenses are not included in the Fund's reported expense ratios. |
| (b) |
Total net expenses include the impact of certain fee waivers/expense reimbursements made by the Investment Manager and certain of its affiliates, if applicable. |
| (c) |
Ratios include interfund lending expense which is less than 0.01%. |
42
Prospectus 2026
Columbia Variable Portfolio – Emerging Markets Bond Fund
Financial Highlights (continued)
| |
Net asset value, end of period |
Total return |
Total gross expense ratio to average net assets(a) |
Total net expense ratio to average net assets(a),(b) |
Net investment income ratio to average net assets |
Portfolio turnover |
Net assets, end of period (000's) |
| Class 1 | |||||||
| Year Ended 12/31/2025 |
$8.49 |
12.78% |
0.73%(c) |
0.73%(c) |
5.40% |
46% |
$205,374 |
| Year Ended 12/31/2024 |
$7.94 |
6.39% |
0.75%(c) |
0.75%(c) |
5.20% |
45% |
$197,159 |
| Year Ended 12/31/2023 |
$7.86 |
10.43% |
0.76% |
0.76% |
5.32% |
29% |
$205,936 |
| Year Ended 12/31/2022 |
$7.52 |
(16.03%) |
0.75% |
0.75% |
4.37% |
22% |
$216,467 |
| Year Ended 12/31/2021 |
$9.37 |
(2.20%) |
0.76% |
0.76% |
3.81% |
41% |
$248,905 |
| Class 2 | |||||||
| Year Ended 12/31/2025 |
$8.49 |
12.65% |
0.98%(c) |
0.98%(c) |
5.15% |
46% |
$195,389 |
| Year Ended 12/31/2024 |
$7.93 |
6.13% |
1.00%(c) |
1.00%(c) |
4.94% |
45% |
$196,377 |
| Year Ended 12/31/2023 |
$7.85 |
10.02% |
1.01% |
1.01% |
5.07% |
29% |
$200,794 |
| Year Ended 12/31/2022 |
$7.52 |
(16.16%) |
1.00% |
1.00% |
4.11% |
22% |
$199,492 |
| Year Ended 12/31/2021 |
$9.36 |
(2.45%) |
1.01% |
1.01% |
3.56% |
41% |
$250,595 |
Prospectus 2026
43
Columbia Variable Portfolio – Emerging Markets Bond Fund

For More Information
The Fund is generally available only to owners of Contracts issued by participating insurance companies and participants in Qualified Plans. Please refer to your Contract prospectus or Qualified Plan disclosure documents for information about how to buy, sell and transfer shares of the Fund.
Additional Information About the Fund
Additional information about the Fund’s investments is available in the Fund’s annual and semiannual reports to shareholders and in Form N-CSR. In the Fund’s annual report, you will find a discussion of the market conditions and investment strategies that significantly affected the Fund’s performance during its last fiscal year. In the Fund’s Form N-CSR, you will find the Fund’s annual and semiannual financial statements. The SAI also provides additional information about the Fund and its policies. The SAI, which has been filed with the SEC, is legally part of this prospectus (incorporated by reference). To obtain these documents free of charge, to request other information about the Fund and to make shareholder inquiries, please contact the Fund as follows:
By Mail: Columbia Management Investment Services Corp.
P.O. Box 219104
Kansas City, MO 64121-9104
P.O. Box 219104
Kansas City, MO 64121-9104
By Telephone: 800.345.6611
Online: columbiathreadneedleus.com
Reports and other information about the Fund are also available in the EDGAR Database on the SEC’s website at http://www.sec.gov. You can receive copies of this information, for a duplication fee, by electronic request at the following e-mail address: publicinfo@sec.gov.
The investment company registration number of Columbia Funds Variable Series Trust II, of which the Fund is a series, is 811-22127.
Columbia Threadneedle Investments (Columbia Threadneedle) is the global brand name of the Columbia and Threadneedle group of companies.
The Fund is distributed by Columbia Management Investment Distributors, Inc., 290 Congress Street, Boston, MA 02210.
The Fund is distributed by Columbia Management Investment Distributors, Inc., 290 Congress Street, Boston, MA 02210.
© 2026 Columbia Threadneedle. All rights reserved.
PRO7006_12_E01_(05/26)

Columbia Variable Portfolio – High Yield Bond Fund
Prospectus
May 1, 2026
As with all mutual funds, the Securities and Exchange Commission (SEC) has not approved or disapproved these securities or passed upon the adequacy of this prospectus. Any representation to the contrary is a criminal offense.

Columbia Variable Portfolio – High Yield Bond Fund
Table of Contents
| 3 | |
| 3 | |
| 3 | |
| 4 | |
| 4 | |
| 9 | |
| 9 | |
| 10 | |
| 10 | |
| 10 | |
| 11 | |
| 11 | |
| 11 | |
| 12 | |
| 18 | |
| 22 | |
| 23 | |
| 24 | |
| 25 | |
| 25 | |
| 25 | |
| 26 | |
| 28 | |
| 33 | |
| 33 | |
| 33 | |
| 35 |
2
Prospectus 2026
Columbia Variable Portfolio – High Yield Bond Fund
Summary of the Fund
Investment Objective
Fees and Expenses of the Fund
This table describes the fees and expenses that you may pay as an investor in the Fund. The table does not reflect any fees or expenses imposed by your Contract or Qualified Plan, which are disclosed in your separate Contract prospectus or Qualified Plan disclosure documents. If the additional fees or expenses were reflected, the expenses set forth below would be higher.
| Annual Fund Operating Expenses (expenses that you pay each year as a percentage of the value of your investment) | |||
| |
Class 1 |
Class 2 |
Class 3 |
| Management fees |
% |
% |
% |
| Distribution and/or service (12b-1) fees |
% |
% |
% |
| Other expenses |
% |
% |
% |
| Total annual Fund operating expenses(a) |
% |
% |
% |
| Less: Fee waivers and/or expense reimbursements(b) |
( %) |
( %) |
( %) |
| Total annual Fund operating expenses after fee waivers and/or expense reimbursements |
% |
% |
% |
(a)
(b)
Example
The following example is intended to help you compare the cost of investing in the Fund with the cost of investing in other mutual funds. The example illustrates the hypothetical expenses that you would incur over the time periods indicated, and assumes that:
■
you invest $10,000 in the applicable class of Fund shares for the periods indicated,
■
your investment has a 5% return each year, and
■
the Fund’s total annual operating expenses remain the same as shown in the Annual Fund Operating Expenses table above.
The example does not reflect any fees and expenses that apply to your Contract or Qualified Plan. Inclusion of these charges would increase expenses for all periods shown.
Since the waivers and/or reimbursements shown in the Annual Fund Operating Expenses table above expire as indicated in the preceding table, they are only reflected in the 1 year example and the first year of the other examples. Although your actual costs may be higher or lower, based on the assumptions listed above, your costs would be:
| |
1 year |
3 years |
5 years |
10 years |
| Class 1 (whether or not shares are redeemed) |
$ |
$ |
$ |
$ |
| Class 2 (whether or not shares are redeemed) |
$ |
$ |
$ |
$ |
| Class 3 (whether or not shares are redeemed) |
$ |
$ |
$ |
$ |
Prospectus 2026
3
Columbia Variable Portfolio – High Yield Bond Fund
Summary of the Fund (continued)
Portfolio Turnover
The Fund may pay transaction costs, such as commissions, when it buys and sells securities (or “turns over” its portfolio). A higher portfolio turnover rate may indicate higher transaction costs. These costs, which are not reflected in annual fund operating expenses or in the example, affect the Fund’s performance. During the most recent fiscal year, the Fund’s portfolio turnover rate was 48 % of the average value of its portfolio.
Principal Investment Strategies
Under normal circumstances, the Fund invests at least 80% of its net assets (plus the amount of any borrowings for investment purposes) in high-yield debt instruments (commonly referred to as “junk” bonds or securities). These high yield debt instruments include corporate debt securities as well as floating rate loans rated below investment grade by nationally recognized statistical rating organizations, or if unrated, determined to be of comparable quality.
The Fund may invest up to 25% of its net assets in debt instruments of foreign issuers.
Corporate debt instruments in which the Fund invests are typically unsecured, with a fixed-rate of interest, and are usually issued by companies or similar entities to provide financing for their operations, or other activities.
The Fund may invest in debt instruments of any maturity and does not seek to maintain a particular dollar-weighted average maturity. Because the Fund emphasizes high-yield investments, more emphasis is put on credit risk by the portfolio managers in selecting investments than either maturity or duration.
The Fund may invest in privately placed and other securities or instruments that are purchased and sold pursuant to Rule 144A or other exemptions under the Securities Act of 1933, as amended, subject to certain regulatory restrictions.
Principal Risks
An investment in the Fund involves risks, including High-Yield Investments Risk, Interest Rate Risk, Changing Distribution Level Risk, Credit Risk, and Market Risk, among others. Descriptions of these and other principal risks of investing in the Fund are provided below. There is no assurance that the Fund will achieve its investment objective and you may lose money. The value of the Fund’s holdings may decline, and the Fund’s net asset value (NAV) and share price may go down. An investment in the Fund is not a bank deposit and is not insured or guaranteed by the Federal Deposit Insurance Corporation or any other government agency. The significance of any specific risk to an investment in the Fund will vary over time depending on the composition of the Fund's portfolio, market conditions, and other factors. You should read all of the risk information below carefully, because any one or more of these risks may result in losses to the Fund.
Active Management Risk. Due to its active management, the Fund could underperform its benchmark index and/or other funds with similar investment objectives and/or strategies.
Changing Distribution Level Risk. The Fund normally expects to receive income which may include interest, dividends and/or capital gains, depending upon its investments. The distribution amounts paid by the Fund will vary and generally depend on the amount of income the Fund earns (less expenses) on its portfolio holdings, and capital gains or losses it recognizes. A decline in the Fund’s income or net capital gains arising from its investments may reduce its distribution level.
Counterparty Risk. Counterparty risk is the risk that a counterparty to a transaction in a financial instrument held by the Fund or by a special purpose or structured vehicle invested in by the Fund may become insolvent or otherwise fail to perform its obligations. As a result, the Fund may obtain no or limited recovery of its investment, and any recovery may be significantly delayed.
Credit Risk. Credit risk is the risk that the value of loans or other debt instruments may decline if the borrower or the issuer thereof defaults or otherwise becomes unable or unwilling, or is perceived to be unable or unwilling, to honor its financial obligations, such as making payments to the Fund when due. Credit rating agencies, such as S&P Global Ratings, Moody’s Investors Service, Inc. (Moody’s Ratings), Fitch Ratings, Inc. (Fitch), Morningstar DBRS (DBRS) and Kroll Bond Rating Agency, LLC (KBRA), assign credit ratings to certain loans and debt instruments to indicate their credit risk. A rating downgrade by such agencies can negatively impact the value of such instruments. Lower-rated
4
Prospectus 2026
Columbia Variable Portfolio – High Yield Bond Fund
Summary of the Fund (continued)
or unrated loans or instruments held by the Fund may present increased credit risk as compared to higher-rated loans or instruments. Non-investment grade loans or debt instruments may be subject to greater price fluctuations and are more likely to experience a default than investment grade loans or debt instruments and therefore may expose the Fund to increased credit risk. If the Fund purchases unrated loans or instruments, or if the ratings of loans or instruments held by the Fund are lowered after purchase, the Fund will depend on analysis of credit risk more heavily than usual. If the issuer of a loan or debt instrument declares bankruptcy or is declared bankrupt, there may be a delay before the Fund can act on the collateral (if any) securing the loan or debt instrument, which may adversely affect the Fund. Further, there is a risk that a court could take action with respect to a loan or debt instrument that is adverse to the holders of the loan or debt instrument. Such actions may include invalidating the loan or debt instrument, the lien on the collateral (if any), the priority status of the loan or debt instrument, or ordering the refund of interest previously paid by the borrower. Any such actions by a court could adversely affect the Fund’s performance. A default or expected default of a loan or debt instrument could also make it difficult for the Fund to sell the loan or debt instrument at a price approximating the value previously placed on it. In order to enforce its rights in the event of a default, bankruptcy or similar situation, the Fund may be required to retain legal or similar counsel. This may increase the Fund’s operating expenses and adversely affect its NAV. Loans or debt instruments that have a lower priority for repayment in an issuer’s capital structure typically involve a higher degree of overall risk than more senior loans or debt instruments of the same borrower.
Fixed Income Instruments Risk. The Fund is subject to the general risks and considerations associated with investing in debt securities, including the risk that issuers will fail to make timely payments of principal or interest or default altogether. Lower-rated securities in which the Fund may invest may be more volatile and may decline more in price in response to negative issuer developments or general economic news than higher rated securities. In addition, as interest rates rise, the Fund’s investments typically will lose value.
Foreign Securities Risk. Investments in or exposure to securities of foreign companies may involve heightened risks relative to investments in or exposure to securities of U.S. companies. Investing in securities of foreign companies subjects the Fund to the risks associated with an issuer’s (and any of its related companies’) country of organization and places of business operations, including risks related to political, regulatory, economic, social, diplomatic and other conditions or events (including, for example, military confrontations and actions, war, other conflicts, terrorism and disease/virus outbreaks and epidemics) occurring in the country or region, as well as risks associated with less developed custody and settlement practices. Foreign securities may be more volatile and less liquid than securities of U.S. companies and are subject to the risks associated with potential imposition of economic and other sanctions against a particular foreign country, its nationals or industries or businesses within the country. In addition, foreign governments may impose withholding or other taxes on the Fund’s income, capital gains or proceeds from the disposition of foreign securities, which could reduce the Fund’s return on such securities. The performance of the Fund may also be negatively affected by fluctuations in a foreign currency's strength or weakness relative to the U.S. dollar, particularly to the extent the Fund invests a significant percentage of its assets in foreign securities or other assets denominated in currencies other than the U.S. dollar.
High-Yield Investments Risk. Securities and other debt instruments held by the Fund that are rated below investment grade (commonly called “high-yield” or “junk” bonds) and unrated debt instruments of comparable quality expose the Fund to a greater risk of loss of principal and income than a fund that invests solely or primarily in investment grade debt instruments. In addition, these investments have greater price fluctuations, are less liquid and are more likely to experience a default than higher-rated debt instruments. High-yield debt instruments are considered to be predominantly speculative with respect to the issuer’s capacity to pay interest and repay principal.
Highly Leveraged Transactions Risk. The loans or other debt instruments in which the Fund invests may include highly leveraged transactions whereby the borrower assumes large amounts of debt in order to have the financial resources to attempt to achieve its business objectives. Loans or other debt instruments that are part of highly leveraged transactions involve a greater risk (including default and bankruptcy) than other investments.
Impairment of Collateral Risk. The value of collateral, if any, securing a loan can decline, and may be insufficient to meet the borrower’s obligations or difficult or costly to liquidate. In addition, the Fund’s access to collateral may be limited by bankruptcy or other insolvency laws. Further, certain floating rate and other loans may not be fully collateralized and may decline in value.
Prospectus 2026
5
Columbia Variable Portfolio – High Yield Bond Fund
Summary of the Fund (continued)
Interest Rate Risk. Interest rate risk is the risk of losses attributable to changes in interest rates. In general, if interest rates rise, the values of loans and other debt instruments tend to fall, and if interest rates fall, the values of loans and other debt instruments tend to rise. Changes in the value of a debt instrument usually will not affect the amount of income the Fund receives from it but will generally affect the value of your investment in the Fund. Changes in interest rates may also affect the liquidity of the Fund’s investments in debt instruments. In general, the longer the maturity or duration of a debt instrument, the greater its sensitivity to changes in interest rates. For example, a three-year duration means a bond is expected to decrease in value by 3% if interest rates rise 1% and increase in value by 3% if interest rates fall 1%. Interest rate declines also may increase prepayments of debt obligations, which, in turn, would increase prepayment risk. The Fund is subject to the risk that the income generated by its investments may not keep pace with inflation. Actions by governments and central banking authorities can result in increases or decreases in interest rates. Higher periods of inflation could lead such authorities to raise interest rates. Such actions may negatively affect the value of debt instruments held by the Fund, resulting in a negative impact on the Fund's performance and NAV. Any interest rate increases could cause the value of the Fund’s investments in debt instruments to decrease. Rising interest rates may prompt redemptions from the Fund, which may force the Fund to sell investments at a time when it is not advantageous to do so, which could result in losses.
Issuer Risk. An issuer in which the Fund invests or to which it has exposure may perform poorly or below expectations, and the value of its loans or securities may therefore decline, which may negatively affect the Fund’s performance. Underperformance of an issuer may be caused by poor management decisions, competitive pressures, breakthroughs in technology, reliance on suppliers, labor problems or shortages, corporate restructurings, fraudulent disclosures, natural disasters, military confrontations and actions, war, other conflicts, terrorism, disease/virus outbreaks, epidemics or other events, conditions and factors which may impair the value of your investment in the Fund.
Liquidity Risk. Liquidity risk is the risk associated with any event, circumstance, or characteristic of an investment or market that negatively impacts the Fund’s ability to sell, or realize the proceeds from the sale of, an investment at a desirable time or price. Liquidity risk may arise because of, for example, a lack of marketability of the investment, which means that when seeking to sell its portfolio investments, the Fund could find that selling is more difficult than anticipated, especially during times of high market volatility. Decreases in the number of financial institutions, including banks and broker-dealers, willing to make markets (match up sellers and buyers) in the Fund’s investments or decreases in their capacity or willingness to trade such investments may increase the Fund’s exposure to this risk. The debt market has experienced considerable growth, and financial institutions making markets in instruments purchased and sold by the Fund (e.g., bond dealers) have been subject to increased regulation. The impact of that growth and regulation on the ability and willingness of financial institutions to engage in trading or “making a market” in such instruments remains unsettled. Certain types of investments, such as lower-rated securities or those that are purchased and sold in over-the-counter markets, may be especially subject to liquidity risk. Securities or other assets in which the Fund invests may be traded in the over-the-counter market rather than on an exchange and therefore may be more difficult to purchase or sell at a fair price, which may have a negative impact on the Fund’s performance. Market participants attempting to sell the same or a similar instrument at the same time as the Fund could exacerbate the Fund’s exposure to liquidity risk. The Fund may have to accept a lower selling price for the holding, sell other liquid or more liquid investments that it might otherwise prefer to hold (thereby increasing the proportion of the Fund’s investments in less liquid or illiquid securities), or forego another more appealing investment opportunity. The liquidity of Fund investments may change significantly over time and certain investments that were liquid when purchased by the Fund may later become illiquid, particularly in times of overall economic distress. Changing regulatory, market or other conditions or environments (for example, the interest rate or credit environments) may also adversely affect the liquidity and the price of the Fund's investments. Judgment plays a larger role in valuing illiquid or less liquid investments as compared to valuing liquid or more liquid investments. Price volatility may be higher for illiquid or less liquid investments as a result of, for example, the relatively less frequent pricing of such securities (as compared to liquid or more liquid investments). Generally, the less liquid the market at the time the Fund sells a portfolio investment, the greater the risk of loss or decline of value to the Fund. Overall market liquidity and other factors can lead to an increase in redemptions, which may negatively impact Fund performance and NAV, including, for example, if the Fund is forced to sell investments in a down market. Floating
6
Prospectus 2026
Columbia Variable Portfolio – High Yield Bond Fund
Summary of the Fund (continued)
rate loans generally are subject to legal or contractual restrictions on resale, may trade infrequently, their value may be impaired when the Fund needs to liquidate such loans, and are typically subject to extended settlement periods, each of which gives rise to liquidity risk.
Loan Interests Risk. Loan interests may not be considered “securities,” and purchasers, such as the Fund, therefore may not be entitled to rely on the anti-fraud protections of the federal securities laws. Loan interests generally are subject to restrictions on transfer, and the Fund may be unable to sell its loan interests at a time when it may otherwise be desirable to do so or may be able to sell them only at prices that are less than what the Fund regards as their fair market value. Accordingly, loan interests may at times be illiquid. Loan interests may be difficult to value and typically have extended settlement periods (generally greater than 7 days). Extended settlement periods during significant Fund redemption activity could potentially cause increased short-term liquidity demands on the Fund. As a result, the Fund may be forced to sell investments at unfavorable prices, or borrow money or effect short settlements where possible (at a cost to the Fund), in an effort to generate sufficient cash to pay redeeming shareholders. The Fund’s actions in this regard may not be successful. Interests in loans created to finance highly leveraged companies or transactions, such as corporate acquisitions, may be especially vulnerable to adverse changes in economic or market conditions. Interests in secured loans have the benefit of collateral and, typically, of restrictive covenants limiting the ability of the borrower to further encumber its assets. There is a risk that the value of any collateral securing a loan in which the Fund has an interest may decline and that the collateral may not be sufficient to cover the amount owed on the loan. In the event the borrower defaults, the Fund’s access to the collateral may be limited or delayed by bankruptcy or other insolvency laws. Further, there is a risk that a court could take action with respect to a loan that is adverse to the holders of the loan, and the Fund, to enforce its rights in the event of a default, bankruptcy or similar situation, may need to retain legal or similar counsel. This may increase the Fund’s operating expenses and adversely affect its NAV. Loans that have a lower priority for repayment in an issuer’s capital structure may involve a higher degree of overall risk than more senior loans of the same borrower. In the event of a default, second lien secured loans will generally be paid only if the value of the collateral exceeds the amount of the borrower’s obligations to the first lien secured lenders, and the remaining collateral may not be sufficient to cover the full amount owed on the loan in which the Fund has an interest. The Fund may acquire a participation interest in a loan that is held by another party. When the Fund’s loan interest is a participation, the Fund may have less control over the exercise of remedies than the party selling the participation interest, and it normally would not have any direct rights against the borrower.
Market Risk. The Fund may incur losses due to declines in the value of one or more securities in which it invests. These declines may be due to factors affecting a particular issuer, or the result of, among other things, political, regulatory, market, economic or social developments affecting the relevant market(s) more generally. In addition, turbulence in financial markets and reduced liquidity in equity, credit and/or fixed income markets may negatively affect many issuers, which could adversely affect the Fund’s ability to price or value hard-to-value assets in thinly traded and closed markets and could cause significant redemptions and operational challenges. Global economies and financial markets are increasingly interconnected, and conditions and events in one country, region or financial market may adversely impact issuers in a different country, region or financial market. These risks may be magnified if certain events or developments adversely interrupt the global supply chain; in these and other circumstances, such risks might affect companies worldwide. As a result, local, regional or global events such as terrorism, war, other conflicts, natural disasters, disease/virus outbreaks and epidemics or other public health issues, recessions, depressions or other events – or the potential for such events – could have a significant negative impact on global economic and market conditions.
Prepayment and Extension Risk. Prepayment and extension risk is the risk that a loan, bond or other security or investment might, in the case of prepayment risk, be called or otherwise converted, prepaid or redeemed before maturity and, in the case of extension risk, that the investment might not be called as expected. In the case of prepayment risk, if the investment is converted, prepaid or redeemed before maturity, the portfolio managers may not be able to invest the proceeds in other investments providing as high a level of income, resulting in a reduced yield to the Fund. As interest rates decrease or spreads narrow on such investments, the likelihood of prepayment
Prospectus 2026
7
Columbia Variable Portfolio – High Yield Bond Fund
Summary of the Fund (continued)
increases. Conversely, extension risk is the risk that an unexpected rise in interest rates will extend the life of an investment beyond the prepayment time. If the Fund’s investments are locked in at a lower interest rate for a longer period of time, the portfolio managers may be unable to capitalize on investments with higher interest rates or wider spreads.
Reinvestment Risk. Reinvestment risk arises when the Fund is unable to reinvest income or principal at the same or at least the same return it is currently earning.
Rule 144A and Other Exempted Securities Risk. The Fund may invest in privately placed and other securities or instruments exempt from SEC registration (collectively “private placements”), subject to certain regulatory restrictions. In the U.S. market, private placements are typically sold only to qualified institutional buyers, or qualified purchasers, as applicable. An insufficient number of buyers interested in purchasing private placements at a particular time could adversely affect the marketability of such investments and the Fund might be unable to dispose of them promptly or at reasonable prices, subjecting the Fund to liquidity risk. The Fund’s holdings of private placements may increase the level of Fund illiquidity if eligible buyers are unable or unwilling to purchase them at a particular time. Issuers of Rule 144A eligible securities are required to furnish information to potential investors upon request. However, the required disclosure is much less extensive than that required of public companies and is not publicly available since the offering information is not filed with the SEC. Further, issuers of Rule 144A eligible securities can require recipients of the offering information (such as the Fund) to agree contractually to keep the information confidential, which could also adversely affect the Fund’s ability to dispose of the security.
Unrated Securities Risk. The Fund may purchase unrated securities which are not rated by a rating agency. Unrated securities may be less liquid than comparable rated securities and involve the risk that the Investment Manager may not accurately evaluate the security’s comparative credit rating. Analysis of creditworthiness of issuers of high yield securities may be more complex than for issuers of higher-quality debt securities. To the extent that the Fund purchases unrated securities, the Fund’s success in achieving its investment objective may depend more heavily on the Investment Manager’s creditworthiness analysis than if the Fund invested exclusively in rated securities.
8
Prospectus 2026
Columbia Variable Portfolio – High Yield Bond Fund
Summary of the Fund (continued)
Performance Information
The following bar chart and table show you how the Fund has performed in the past, and can help you understand the risks of investing in the Fund. The bar chart shows how the Fund’s Class 2 share performance has varied for each full calendar year shown. The table below the bar chart compares the Fund’s returns for the periods shown with a broad measure of market performance, as well as another measure of performance for markets in which the Fund may invest.
Except for differences in annual returns resulting from differences in expenses (where applicable), the share classes of the Fund would have substantially similar annual returns because all share classes of the Fund invest in the same portfolio of securities.
The returns shown do not reflect any fees and expenses imposed under your Contract or Qualified Plan and would be lower if they did.
| |
Best and Worst Quarterly Returns During the Period Shown in the Bar Chart | ||
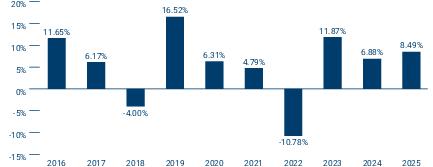 |
|
|
|
| |
|
- | |
Average Annual Total Returns (for periods ended December 31, 2025)
| |
Share Class Inception Date |
1 Year |
5 Years |
10 Years |
| Class 1 |
|
|
|
|
| Class 2 |
|
|
|
|
| Class 3 |
|
|
|
|
| ICE BofA US Cash Pay High Yield Constrained Index (reflects no deductions for fees, expenses, taxes or, for periods prior to July 2022, transaction costs) |
|
|
|
|
| Bloomberg U.S. Aggregate Bond Index (reflects no deductions for fees, expenses or taxes) |
|
|
- |
|
Fund Management
Investment Manager: Columbia Management Investment Advisers, LLC
| Portfolio Management |
Title |
Role with Fund |
Managed Fund Since |
| Daniel DeYoung |
Senior Portfolio Manager |
Portfolio Manager |
2019 |
| Spencer Sutcliffe |
Senior Portfolio Manager |
Portfolio Manager |
2024 |
Prospectus 2026
9
Columbia Variable Portfolio – High Yield Bond Fund
Summary of the Fund (continued)
Purchase and Sale of Fund Shares
The Fund is available for purchase through Contracts offered by the separate accounts of participating insurance companies or Qualified Plans or by other eligible investors authorized by Columbia Management Investment Distributors, Inc. (the Distributor). Shares of the Fund may not be purchased or sold by individual owners of Contracts or Qualified Plans. If you are a Contract holder or Qualified Plan participant, please refer to your separate Contract prospectus or Qualified Plan disclosure documents for information about minimum investment requirements and how to purchase and redeem shares of the Fund on days the Fund is open for business.
Tax Information
The Fund normally distributes its net investment income and net realized capital gains, if any, to its shareholders, which are generally the participating insurance companies and Qualified Plans investing in the Fund through separate accounts. These distributions may not be taxable to you as the holder of a Contract or a participant in a Qualified Plan. Please consult the prospectus or other information provided to you by your participating insurance company and/or Qualified Plan regarding the U.S. federal income taxation of your contract, policy and/or plan.
Payments to Broker-Dealers and Other Financial Intermediaries
If you make allocations to the Fund, the Fund, its Distributor or other related companies may pay participating insurance companies or other financial intermediaries for the allocation (sale) of Fund shares and related services in connection with such allocations to the Fund. These payments may create a conflict of interest by influencing the participating insurance company, other financial intermediary or your salesperson to recommend an allocation to the Fund over another fund or other investment option. Ask your financial advisor or salesperson or visit your financial intermediary’s website for more information.
10
Prospectus 2026
Columbia Variable Portfolio – High Yield Bond Fund
More Information About the Fund
Investment Objective
Columbia Variable Portfolio – High Yield Bond Fund (the Fund) seeks to provide shareholders with high current income as its primary objective and, as its secondary objective, capital growth. Only shareholders can change the Fund’s investment objective. Because any investment involves risk, there is no assurance the Fund’s investment objective will be achieved.
Principal Investment Strategies
Under normal circumstances, the Fund invests at least 80% of its net assets (plus the amount of any borrowings for investment purposes) in high-yield debt instruments (commonly referred to as “junk” bonds or securities). These high yield debt instruments include corporate debt securities as well as floating rate loans rated below investment grade by nationally recognized statistical rating organizations, or if unrated, determined to be of comparable quality.
The Fund may invest up to 25% of its net assets in debt instruments of foreign issuers.
Corporate debt instruments in which the Fund invests are typically unsecured, with a fixed-rate of interest, and are usually issued by companies or similar entities to provide financing for their operations, or other activities. Floating rate loans, which are another form of financing, are typically secured, with interest rates that adjust or “float” periodically (normally on a daily, monthly, quarterly or semiannual basis by reference to a base lending rate, plus a premium). Secured debt instruments are ordinarily secured by specific collateral or assets of the issuer or borrower such that holders of these instruments will have claims senior to the claims of other parties who hold unsecured instruments.
The Fund may invest in debt instruments of any maturity and does not seek to maintain a particular dollar-weighted average maturity. A bond is issued with a specific maturity date, which is the date when the issuer must pay back the bond’s principal (face value). Bond maturities range from less than 1 year to more than 30 years. Typically, the longer a bond’s maturity, the more price risk the Fund and the Fund’s investors face as interest rates rise, but the Fund could receive a higher yield in return for that longer maturity and higher interest rate risk. Because the Fund emphasizes high-yield investments, more emphasis is put on credit risk by the portfolio managers in selecting investments than either maturity or duration.
The Fund may invest in privately placed and other securities or instruments that are purchased and sold pursuant to Rule 144A or other exemptions under the Securities Act of 1933, as amended, subject to certain regulatory restrictions.
In pursuit of the Fund’s objective, Columbia Management Investment Advisers, LLC (the Investment Manager) chooses investments by:
■
Rigorous, in-house credit research using a proprietary risk and relative value rating system with the goal of generating strong risk-adjusted returns;
■
A process focused on seeking to identify issuers with improving credit quality characterized by several factors including:
■
stable and strengthening cash flows,
■
the ability to de-leverage through free cash flow,
■
asset valuations supporting debt,
■
strong management,
■
strong and sustainable market positioning, and/or
■
access to capital;
■
A top down assessment of broad economic and market conditions to determine quality and industry weightings;
■
Review of the legal documentation supporting the loan, including an analysis of the covenants and the rights and remedies of the lender.
Prospectus 2026
11
Columbia Variable Portfolio – High Yield Bond Fund
More Information About the Fund (continued)
In evaluating whether to sell an investment, considerations by the Investment Manager include but are not limited to:
■
Deterioration in the issuer’s results relative to analyst expectations,
■
Inability of the issuer to de-leverage,
■
Reduced asset coverage for the issuer,
■
Deterioration in the issuer’s competitive position,
■
Reduced access to capital for the issuer,
■
Changes in the issuer’s management,
■
Whether the Investment Manager’s price target for the security has been achieved, and/or
■
The investment’s potential upside/downside compared to other investments or investment opportunities.
The Fund’s investment policy with respect to 80% of its net assets may be changed by the Fund’s Board of Trustees without shareholder approval as long as shareholders are given 60 days’ advance written notice of the change.
Principal Risks
An investment in the Fund involves risks, including High-Yield Investments Risk, Interest Rate Risk, Changing Distribution Level Risk, Credit Risk, and Market Risk, among others. Descriptions of these and other principal risks of investing in the Fund are provided below. There is no assurance that the Fund will achieve its investment objective and you may lose money. The value of the Fund’s holdings may decline, and the Fund’s net asset value (NAV) and share price may go down. An investment in the Fund is not a bank deposit and is not insured or guaranteed by the Federal Deposit Insurance Corporation or any other government agency. The significance of any specific risk to an investment in the Fund will vary over time depending on the composition of the Fund's portfolio, market conditions, and other factors. You should read all of the risk information below carefully, because any one or more of these risks may result in losses to the Fund.
Active Management Risk. The Fund is actively managed and its performance therefore will reflect, in part, the ability of the portfolio managers to make investment decisions that seek to achieve the Fund’s investment objective. Due to its active management, the Fund could underperform its benchmark index and/or other funds with similar investment objectives and/or strategies.
Changing Distribution Level Risk. The Fund normally expects to receive income which may include interest, dividends and/or capital gains, depending upon its investments. The distribution amounts paid by the Fund will vary and generally depend on the amount of income the Fund earns (less expenses) on its portfolio holdings, and capital gains or losses it recognizes. A decline in the Fund’s income or net capital gains arising from its investments may reduce its distribution level.
Counterparty Risk. The risk exists that a counterparty to a transaction in a financial instrument held by the Fund or by a special purpose or structured vehicle in which the Fund invests may become insolvent or otherwise fail to perform its obligations, including making payments to the Fund, due to financial difficulties. The Fund may obtain no or limited recovery in a bankruptcy or other reorganizational proceedings, and any recovery may be significantly delayed. Transactions that the Fund enters into may involve counterparties in the financials sector and, as a result, events affecting the financials sector may cause the Fund’s NAV to fluctuate.
Credit Risk. Credit risk is the risk that the value of loans or other debt instruments may decline if the borrower or the issuer thereof defaults or otherwise becomes unable or unwilling, or is perceived to be unable or unwilling, to honor its financial obligations, such as making payments to the Fund when due. Various factors could affect the actual or perceived willingness or ability of the borrower or the issuer to make timely interest or principal payments, including changes in the financial condition of the borrower or the issuer or in general economic conditions. Credit rating agencies, such as S&P Global Ratings, Moody’s Ratings, Fitch, DBRS and KBRA, assign credit ratings to certain loans and debt instruments to indicate their credit risk. A rating downgrade by such agencies can negatively impact the value of such instruments. Lower-rated or unrated loans or instruments held by the Fund may present increased credit risk as compared to higher-rated loans or instruments. Non-investment grade loans or debt instruments may be subject to greater price fluctuations and are more likely to experience a default than investment grade loans or
12
Prospectus 2026
Columbia Variable Portfolio – High Yield Bond Fund
More Information About the Fund (continued)
debt instruments and therefore may expose the Fund to increased credit risk. If the Fund purchases unrated loans or instruments, or if the ratings of loans or instruments held by the Fund are lowered after purchase, the Fund will depend on analysis of credit risk more heavily than usual. If the issuer of a loan or debt instrument declares bankruptcy or is declared bankrupt, there may be a delay before the Fund can act on the collateral (if any) securing the loan or debt instrument, which may adversely affect the Fund. Further, there is a risk that a court could take action with respect to a loan or debt instrument that is adverse to the holders of the loan or debt instrument. Such actions may include invalidating the loan or debt instrument, the lien on the collateral (if any), the priority status of the loan or debt instrument, or ordering the refund of interest previously paid by the borrower. Any such actions by a court could adversely affect the Fund’s performance. A default or expected default of a loan or debt instrument could also make it difficult for the Fund to sell the loan or debt instrument at a price approximating the value previously placed on it. In order to enforce its rights in the event of a default, bankruptcy or similar situation, the Fund may be required to retain legal or similar counsel. This may increase the Fund’s operating expenses and adversely affect its NAV. Loans or debt instruments that have a lower priority for repayment in an issuer’s capital structure typically involve a higher degree of overall risk than more senior loans or debt instruments of the same borrower.
Fixed Income Instruments Risk. The Fund is subject to the general risks and considerations associated with investing in debt securities, including the risk that issuers will fail to make timely payments of principal or interest or default altogether. Typically, shorter-term bonds are less volatile than longer-term bonds; however, longer-term bonds typically offer higher yields and more stable interest income than shorter-term bonds due to their longer term and extended fixed payment schedule. Lower-rated securities in which the Fund may invest may be more volatile and may decline more in price in response to negative issuer developments or general economic news than higher rated securities. In addition, as interest rates rise, the Fund’s investments typically will lose value.
Foreign Securities Risk. Investments in or exposure to securities of foreign companies may involve heightened risks relative to investments in or exposure to securities of U.S. companies. For example, foreign markets can be extremely volatile. Foreign securities may also be less liquid, making them more difficult to trade, than securities of U.S. companies so that the Fund may, at times, be unable to sell foreign securities at desirable times or prices. Brokerage commissions, custodial costs and other fees are also generally higher for foreign securities. The Fund may have limited or no legal recourse in the event of default with respect to certain foreign securities, including those issued by foreign governments. In addition, foreign governments may impose withholding or other taxes on the Fund’s income, capital gains or proceeds from the disposition of foreign securities, which could reduce the Fund’s return on such securities. In some cases, such withholding or other taxes could potentially be confiscatory. Other risks include: possible delays in the settlement of transactions or in the payment of income; generally less publicly available information about foreign companies; the impact of economic, political, social, diplomatic or other conditions or events (including, for example, military confrontations and actions, war, other conflicts, terrorism and disease/virus outbreaks and epidemics), possible seizure, expropriation or nationalization of a company or its assets or the assets of a particular investor or category of investors; accounting, auditing and financial reporting standards that may be less comprehensive and stringent than those applicable to domestic companies; the imposition of economic and other sanctions against a particular foreign country, its nationals or industries or businesses within the country; and the generally less stringent standard of care to which local agents may be held in the local markets. In addition, it may be difficult to obtain reliable information about the securities and business operations of certain foreign issuers. Governments or trade groups may compel local agents to hold securities in designated depositories that are not subject to independent evaluation. The less developed a country’s securities market is, the greater the level of risks. Economic sanctions may be, and have been, imposed against certain countries, organizations, companies, entities and/or individuals. Economic sanctions and other similar governmental actions could, among other things, effectively restrict or eliminate the Fund’s ability to purchase or sell securities, and thus may make the Fund’s investments in such securities less liquid or more difficult to value. In addition, as a result of economic sanctions, the Fund may be forced to sell or otherwise dispose of investments at inopportune times or prices, which could result in losses to the Fund and increased transaction costs. These conditions may be in place for a substantial period of time and enacted with limited advance notice to the Fund. The risks posed by sanctions against a particular foreign country, its nationals or industries or businesses within the country may be heightened to the extent the Fund invests significantly in the affected country or region or in issuers from the affected country that depend on global markets. Additionally, investments in certain countries may subject the Fund to a number of tax
Prospectus 2026
13
Columbia Variable Portfolio – High Yield Bond Fund
More Information About the Fund (continued)
rules, the application of which may be uncertain. Countries may amend or revise their existing tax laws, regulations and/or procedures in the future, possibly with retroactive effect. Changes in or uncertainties regarding the laws, regulations or procedures of a country could reduce the after-tax profits of the Fund, directly or indirectly, including by reducing the after-tax profits of companies located in such countries in which the Fund invests, or result in unexpected tax liabilities for the Fund. The performance of the Fund may also be negatively affected by fluctuations in a foreign currency's strength or weakness relative to the U.S. dollar, particularly to the extent the Fund invests a significant percentage of its assets in foreign securities or other assets denominated in currencies other than the U.S. dollar. Currency rates in foreign countries may fluctuate significantly over short or long periods of time for a number of reasons, including changes in interest rates, imposition of currency exchange controls and economic or political developments in the U.S. or abroad. The Fund may also incur currency conversion costs when converting foreign currencies into U.S. dollars and vice versa.
High-Yield Investments Risk. Securities and other debt instruments held by the Fund that are rated below investment grade (commonly called “high-yield” or “junk” bonds) and unrated debt instruments of comparable quality tend to be more sensitive to credit risk than higher-rated debt instruments and may experience greater price fluctuations in response to perceived changes in the ability of the issuing entity or obligor to pay interest and principal when due than to changes in interest rates. These investments are generally more likely to experience a default than higher-rated debt instruments. High-yield debt instruments are considered to be predominantly speculative with respect to the issuer’s capacity to pay interest and repay principal. These debt instruments typically pay a premium – a higher interest rate or yield – because of the increased risk of loss, including default. High-yield debt instruments may require a greater degree of judgment to establish a price, may be difficult to sell at the time and price the Fund desires, may carry high transaction costs, and also are generally less liquid than higher-rated debt instruments. The ratings provided by third party rating agencies are based on analyses by these ratings agencies of the credit quality of the debt instruments and may not take into account every risk related to whether interest or principal will be timely repaid. In adverse economic and other circumstances, issuers of lower-rated debt instruments are more likely to have difficulty making principal and interest payments than issuers of higher-rated debt instruments.
Highly Leveraged Transactions Risk. The loans or other debt instruments in which the Fund invests may consist of transactions involving refinancings, recapitalizations, mergers and acquisitions and other financings for general corporate purposes. The Fund’s investments also may include senior obligations of a borrower issued in connection with a restructuring pursuant to Chapter 11 of the U.S. Bankruptcy Code (commonly known as “debtor-in-possession” financings), provided that such senior obligations are determined by the Fund’s portfolio managers to be a suitable investment for the Fund. In such highly leveraged transactions, the borrower assumes large amounts of debt in order to have the financial resources to attempt to achieve its business objectives. Such business objectives may include but are not limited to: management’s taking over control of a company (leveraged buy-out); reorganizing the assets and liabilities of a company (leveraged recapitalization); or acquiring another company. Loans or other debt instruments that are part of highly leveraged transactions involve a greater risk (including default and bankruptcy) than other investments.
Impairment of Collateral Risk. The value of collateral, if any, securing a loan can decline, and may be insufficient to meet the borrower’s obligations or difficult or costly to liquidate. In addition, the Fund’s access to collateral may be limited by bankruptcy or other insolvency laws. Further, certain floating rate and other loans may not be fully collateralized and may decline in value.
Interest Rate Risk. Interest rate risk is the risk of losses attributable to changes in interest rates. In general, if interest rates rise, the values of loans and other debt instruments tend to fall, and if interest rates fall, the values of loans and other debt instruments tend to rise. Changes in the value of a debt instrument usually will not affect the amount of income the Fund receives from it but will generally affect the value of your investment in the Fund. Changes in interest rates may also affect the liquidity of the Fund’s investments in debt instruments. In general, the longer the maturity or duration of a debt instrument, the greater its sensitivity to changes in interest rates. For example, a three-year duration means a bond is expected to decrease in value by 3% if interest rates rise 1% and increase in value by 3% if interest rates fall 1%. Interest rate declines also may increase prepayments of debt obligations, which, in turn, would increase prepayment risk (the risk that the Fund will have to reinvest the money received in securities that
14
Prospectus 2026
Columbia Variable Portfolio – High Yield Bond Fund
More Information About the Fund (continued)
have lower yields). The Fund is subject to the risk that the income generated by its investments may not keep pace with inflation. Actions by governments and central banking authorities can result in increases or decreases in interest rates. Higher periods of inflation could lead such authorities to raise interest rates. Such actions may negatively affect the value of debt instruments held by the Fund, resulting in a negative impact on the Fund's performance and NAV. Debt instruments with floating coupon rates are typically less sensitive to interest rate changes, but these debt instruments may decline in value if their coupon rates do not rise as much as, or keep pace with, yields on such types of debt instruments. Because rates on certain floating rate loans and other debt instruments reset only periodically, changes in interest rates (and particularly sudden and significant changes) can be expected to cause fluctuations in the Fund’s NAV. Any interest rate increases could cause the value of the Fund’s investments in debt instruments to decrease. Rising interest rates may prompt redemptions from the Fund, which may force the Fund to sell investments at a time when it is not advantageous to do so, which could result in losses.
Issuer Risk. An issuer in which the Fund invests or to which it has exposure may perform poorly or below expectations, and the value of its loans or securities may therefore decline, which may negatively affect the Fund’s performance. Underperformance of an issuer may be caused by poor management decisions, competitive pressures, breakthroughs in technology, reliance on suppliers, labor problems or shortages, corporate restructurings, fraudulent disclosures, natural disasters, military confrontations and actions, war, other conflicts, terrorism, disease/virus outbreaks, epidemics or other events, conditions and factors which may impair the value of your investment in the Fund.
Liquidity Risk. Liquidity risk is the risk associated with any event, circumstance, or characteristic of an investment or market that negatively impacts the Fund’s ability to sell, or realize the proceeds from the sale of, an investment at a desirable time or price. Liquidity risk may arise because of, for example, a lack of marketability of the investment, which means that when seeking to sell its portfolio investments, the Fund could find that selling is more difficult than anticipated, especially during times of high market volatility. Decreases in the number of financial institutions, including banks and broker-dealers, willing to make markets (match up sellers and buyers) in the Fund’s investments or decreases in their capacity or willingness to trade such investments may increase the Fund’s exposure to this risk. The debt market has experienced considerable growth, and financial institutions making markets in instruments purchased and sold by the Fund (e.g., bond dealers) have been subject to increased regulation. The impact of that growth and regulation on the ability and willingness of financial institutions to engage in trading or “making a market” in such instruments remains unsettled. Certain types of investments, such as lower-rated securities or those that are purchased and sold in over-the-counter markets, may be especially subject to liquidity risk. Securities or other assets in which the Fund invests may be traded in the over-the-counter market rather than on an exchange and therefore may be more difficult to purchase or sell at a fair price, which may have a negative impact on the Fund’s performance. Market participants attempting to sell the same or a similar instrument at the same time as the Fund could exacerbate the Fund’s exposure to liquidity risk. The Fund may have to accept a lower selling price for the holding, sell other liquid or more liquid investments that it might otherwise prefer to hold (thereby increasing the proportion of the Fund’s investments in less liquid or illiquid securities), or forego another more appealing investment opportunity. The liquidity of Fund investments may change significantly over time and certain investments that were liquid when purchased by the Fund may later become illiquid, particularly in times of overall economic distress. Changing regulatory, market or other conditions or environments (for example, the interest rate or credit environments) may also adversely affect the liquidity and the price of the Fund's investments. Judgment plays a larger role in valuing illiquid or less liquid investments as compared to valuing liquid or more liquid investments. Price volatility may be higher for illiquid or less liquid investments as a result of, for example, the relatively less frequent pricing of such securities (as compared to liquid or more liquid investments). Generally, the less liquid the market at the time the Fund sells a portfolio investment, the greater the risk of loss or decline of value to the Fund. Overall market liquidity and other factors can lead to an increase in redemptions, which may negatively impact Fund performance and NAV, including, for example, if the Fund is forced to sell investments in a down market. Floating rate loans generally are subject to legal or contractual restrictions on resale, may trade infrequently, their value may be impaired when the Fund needs to liquidate such loans, and are typically subject to extended settlement periods, each of which gives rise to liquidity risk.
Prospectus 2026
15
Columbia Variable Portfolio – High Yield Bond Fund
More Information About the Fund (continued)
Loan Interests Risk. Loan interests may not be considered “securities,” and purchasers, such as the Fund, therefore may not be entitled to rely on the anti-fraud protections of the federal securities laws. Loan interests generally are subject to restrictions on transfer, and the Fund may be unable to sell loan interests at a time when it may otherwise be desirable to do so or may be able to sell them only at prices that are less than what the Fund regards as their fair market value. Accordingly, loan interests may at times be illiquid. Loan interests may be difficult to value and typically have extended settlement periods (generally greater than 7 days). This exposes the Fund to the risk that the receipt of principal and interest payments may be late due to delayed interest settlement. Extended settlement periods during significant Fund redemption activity could potentially cause increased short-term liquidity demands on the Fund. As a result, the Fund may be forced to sell investments at unfavorable prices, or borrow money or effect short settlements where possible (at a cost to the Fund), in an effort to generate sufficient cash to pay redeeming shareholders. The Fund’s actions in this regard may not be successful. Interests in loans created to finance highly leveraged companies or transactions, such as corporate acquisitions, may be especially vulnerable to adverse changes in economic or market conditions.
Interests in secured loans have the benefit of collateral and, typically, of restrictive covenants limiting the ability of the borrower to further encumber its assets, although many covenants may be waived or modified with the consent of a certain percentage of the holders of the loans even if the Fund does not consent. There is a risk that the value of any collateral securing a loan in which the Fund has an interest may decline and that the collateral may not be sufficient to cover the amount owed on the loan. In most loan agreements there is no formal requirement to pledge additional collateral. In the event the borrower defaults, the Fund’s access to the collateral may be limited or delayed by bankruptcy or other insolvency laws. Further, there is a risk that a court could take action with respect to a loan that is adverse to the holders of the loan, including the Fund. Such actions may include invalidating the loan, the lien on the collateral, the priority status of the loan, or ordering the refund of interest previously paid by the borrower. Any such actions by a court could adversely affect the Fund’s performance. A default or expected default of a loan could also make it difficult for the Fund to sell the loan at a price approximating the value previously placed on it. In order to enforce its rights in the event of a default, bankruptcy or similar situation, the Fund may be required to retain legal or similar counsel. This may increase the Fund’s operating expenses and adversely affect its NAV. Loans that have a lower priority for repayment in an issuer’s capital structure may involve a higher degree of overall risk than more senior loans of the same borrower. In the event of a default, second lien secured loans will generally be paid only if the value of the collateral exceeds the amount of the borrower’s obligations to the first lien secured lenders. The remaining collateral may not be sufficient to cover the full amount owed on the loan in which the Fund has an interest. In addition, if a secured loan is foreclosed, the Fund would likely bear the costs and liabilities associated with owning and disposing of the collateral. The collateral may be difficult to sell and the Fund would bear the risk that the collateral may decline in value while the Fund is holding it. From time to time, disagreements may arise amongst the holders of loans and debt in the capital structure of an issuer, which may give rise to litigation risks, including the risk that a court could take action adverse to the holders of the loan, which could negatively impact the Fund’s performance.
The Fund may acquire a loan interest by obtaining an assignment of all or a portion of the interests in a particular loan that are held by an original lender or a prior assignee. As an assignee, the Fund will usually succeed to all rights and obligations of its assignor with respect to the portion of the loan that is being assigned. However, the rights and obligations acquired by the purchaser of a loan assignment may differ from, and be more limited than, those held by the original lenders or the assignor. Alternatively, the Fund may acquire a participation interest in a loan that is held by another party. When the Fund’s loan interest is a participation, the Fund may have less control over the exercise of remedies than the party selling the participation interest, and the Fund normally would not have any direct rights against the borrower. As a participant, the Fund would also be subject to the risk that the party selling the participation interest would not remit the Fund’s pro rata share of loan payments to the Fund. It may also be difficult for the Fund to obtain an accurate picture of a lending bank’s financial condition.
Market Risk. The Fund may incur losses due to declines in the value of one or more securities in which it invests. These declines may be due to factors affecting a particular issuer, or the result of, among other things, political, regulatory, market, economic or social developments affecting the relevant market(s) more generally. In addition, turbulence in financial markets and reduced liquidity in equity, credit and/or fixed income markets may negatively
16
Prospectus 2026
Columbia Variable Portfolio – High Yield Bond Fund
More Information About the Fund (continued)
affect many issuers, which could adversely affect the Fund’s ability to price or value hard-to-value assets in thinly traded and closed markets and could cause significant redemptions and operational challenges. Global economies and financial markets are increasingly interconnected, and conditions and events in one country, region or financial market may adversely impact issuers in a different country, region or financial market. These risks may be magnified if certain events or developments adversely interrupt the global supply chain; in these and other circumstances, such risks might affect companies worldwide. As a result, local, regional or global events such as terrorism, war, other conflicts, natural disasters, disease/virus outbreaks and epidemics or other public health issues, recessions, depressions or other events – or the potential for such events – could have a significant negative impact on global economic and market conditions.
The large-scale invasion of Ukraine by Russia in February 2022 has resulted in sanctions and market disruptions, including declines in regional and global stock markets, unusual volatility in global commodity markets and significant devaluations of Russian currency. In addition, the Iranian conflict that commenced in February 2026 may result in similar, and potentially more severe, disruptions. Escalation of hostilities in the Middle East region could disrupt energy production or transportation, including through key shipping routes, which may lead to increased volatility in energy and other commodity prices. The extent and duration of these conflicts are impossible to predict but could continue to be significant. Market disruption caused by these conflicts, and any countermeasures or responses thereto (including international sanctions, a downgrade in a country’s credit rating, purchasing and financing restrictions, boycotts, tariffs, changes in consumer or purchaser preferences, cyberattacks and espionage) could continue to have severe adverse impacts on regional and/or global securities and commodities markets, including markets for oil and natural gas. These impacts may include reduced market liquidity, distress in credit markets, further disruption of global supply chains, increased risk of inflation, and limited access to investments in certain international markets and/or issuers. These developments and other related events could negatively impact Fund performance.
Prepayment and Extension Risk. Prepayment and extension risk is the risk that a loan, bond or other security or investment might, in the case of prepayment risk, be called or otherwise converted, prepaid or redeemed before maturity and, in the case of extension risk, that the investment might not be called as expected. In the case of prepayment risk, if the investment is converted, prepaid or redeemed before maturity, the portfolio managers may not be able to invest the proceeds in other investments providing as high a level of income, resulting in a reduced yield to the Fund. As interest rates decrease or spreads narrow on such investments, the likelihood of prepayment increases. Conversely, extension risk is the risk that an unexpected rise in interest rates will extend the life of an investment beyond the prepayment time. If the Fund's investments are locked in at a lower interest rate for a longer period of time, the portfolio managers may be unable to capitalize on investments with higher interest rates or wider spreads.
Reinvestment Risk. Reinvestment risk arises when the Fund is unable to reinvest income or principal at the same or at least the same return it is currently earning.
Rule 144A and Other Exempted Securities Risk. The Fund may invest in privately placed and other securities or instruments exempt from SEC registration (collectively “private placements”), subject to certain regulatory restrictions. In the U.S. market, private placements are typically sold only to qualified institutional buyers, or qualified purchasers, as applicable. An insufficient number of buyers interested in purchasing private placements at a particular time could adversely affect the marketability of such investments and the Fund might be unable to dispose of them promptly or at reasonable prices, subjecting the Fund to liquidity risk (the risk that it may not be possible for the Fund to liquidate the instrument at an advantageous time or price). The Fund’s holdings of private placements may increase the level of Fund illiquidity if eligible buyers are unable or unwilling to purchase them at a particular time. The Fund may also have to bear the expense of registering the securities for resale and the risk of substantial delays in effecting the registration. Additionally, the purchase price and subsequent valuation of private placements typically reflect a discount, which may be significant, from the market price of comparable securities for which a more liquid market exists. Issuers of Rule 144A eligible securities are required to furnish information to potential investors upon request. However, the required disclosure is much less extensive than that required of public
Prospectus 2026
17
Columbia Variable Portfolio – High Yield Bond Fund
More Information About the Fund (continued)
companies and is not publicly available since the offering information is not filed with the SEC. Further, issuers of Rule 144A eligible securities can require recipients of the offering information (such as the Fund) to agree contractually to keep the information confidential, which could also adversely affect the Fund’s ability to dispose of the security.
Unrated Securities Risk. The Fund may purchase unrated securities which are not rated by a rating agency. Unrated securities may be less liquid than comparable rated securities and involve the risk that the Investment Manager may not accurately evaluate the security’s comparative credit rating. Analysis of creditworthiness of issuers of high yield securities may be more complex than for issuers of higher-quality debt securities. To the extent that the Fund purchases unrated securities, the Fund’s success in achieving its investment objective may depend more heavily on the Investment Manager’s creditworthiness analysis than if the Fund invested exclusively in rated securities.
Additional Investment Strategies and Policies
This section describes certain investment strategies and policies that the Fund may utilize in pursuit of its investment objective and some additional factors and risks involved with investing in the Fund.
Investment Guidelines
As a general matter, and except as specifically described in the discussion of the Fund's principal investment strategies in this prospectus or as otherwise required by the Investment Company Act of 1940, as amended (the 1940 Act), the rules and regulations thereunder and any applicable exemptive relief, whenever an investment policy or limitation states a percentage of the Fund's assets that may be invested in any security or other asset or sets forth a policy regarding an investment standard, compliance with that percentage limitation or standard will be determined solely at the time of the Fund's investment in the security or asset.
Holding Other Kinds of Investments
The Fund may hold other investments that are not part of its principal investment strategies. These investments and their risks are described below and/or in the Statement of Additional Information (SAI). The Fund may choose not to invest in certain securities described in this prospectus and in the SAI, although it has the ability to do so. Information on the Fund’s holdings can be found in the Fund’s Form N-CSR or by visiting columbiathreadneedleus.com.
Transactions in Derivatives
The Fund may enter into derivative transactions or otherwise have exposure to derivative transactions through underlying investments. Derivatives are financial contracts whose values are, for example, based on (or “derived” from) traditional securities (such as a stock or bond), assets (such as a commodity like gold or a foreign currency), reference rates (such as the Secured Overnight Financing Rate (commonly known as SOFR)) or market indices (such as the Standard & Poor’s 500® Index). The use of derivatives is a highly specialized activity which involves investment techniques and risks different from those associated with ordinary portfolio securities transactions. Derivatives involve special risks and may result in losses or may limit the Fund’s potential gain from favorable market movements. Derivative strategies often involve leverage, which may exaggerate a loss, potentially causing the Fund to lose more money than it would have lost had it invested in the underlying security or other asset directly. The values of derivatives may move in unexpected ways, especially in unusual market conditions, and may result in increased volatility in the value of the derivative and/or the Fund’s shares, among other consequences. Other risks arise from the Fund’s potential inability to terminate or to sell derivative positions. A liquid secondary market may not always exist for the Fund’s derivative positions at times when the Fund might wish to terminate or to sell such positions. Over-the-counter instruments (investments not traded on an exchange) may be illiquid, and transactions in derivatives traded in the over-the-counter market are subject to the risk that the other party will not meet its obligations. The use of derivatives also involves the risks of mispricing or improper valuation and that changes in the value of the derivative may not correlate perfectly with the underlying security, asset, reference rate or index. The Fund also may not be able to find a suitable derivative transaction counterparty, and thus may be unable to engage in derivative transactions when it is deemed favorable to do so, or at all. The U.S. government and the European Union (and some other jurisdictions) have enacted regulations and similar requirements that prescribe clearing, margin,
18
Prospectus 2026
Columbia Variable Portfolio – High Yield Bond Fund
More Information About the Fund (continued)
reporting and registration requirements for participants in the derivatives market. These requirements are evolving and their ultimate impact on the Fund remains unclear, but such impact could include restricting and/or imposing significant costs or other burdens upon the Fund’s participation in derivatives transactions. Additionally, regulations governing the use of derivatives by registered investment companies, such as the Fund, require, among other things, that a fund that invests in derivative instruments beyond a specified limited amount apply a value-at-risk-based limit to its portfolio and establish a comprehensive derivatives risk management program. As of the date of this prospectus, the Fund is not required to maintain a comprehensive derivatives risk management program given its more limited use of derivatives. For more information on the risks of derivative investments and strategies, see the SAI.
Affiliated Fund Investing
The Investment Manager or an affiliate serves as investment adviser to funds using the Columbia brand (Columbia Funds), including those that are structured as “fund-of-funds”, and provides asset-allocation services to (i) shareholders by investing in shares of other Columbia Funds, which may include the Fund (collectively referred to in this section as Underlying Funds), and (ii) discretionary managed accounts (collectively referred to as affiliated products) that invest exclusively in Underlying Funds. These affiliated products, individually or collectively, may own a significant percentage of the outstanding shares of one or more Underlying Funds, and the Investment Manager seeks to balance potential conflicts of interest between the affiliated products and the Underlying Funds in which they invest. The affiliated products’ investment in the Underlying Funds may have the effect of creating economies of scale, possibly resulting in lower expense ratios for the Underlying Funds, because the affiliated products may own substantial portions of the shares of Underlying Funds. However, redemption of Underlying Fund shares by one or more affiliated products could cause the expense ratio of an Underlying Fund to increase, as its fixed costs would be spread over a smaller asset base. Because of large positions of certain affiliated products, the Underlying Funds may experience relatively large inflows and outflows of cash due to affiliated products’ purchases and sales of Underlying Fund shares. Although the Investment Manager or its affiliate may seek to minimize the impact of these transactions where possible, for example, by structuring them over a reasonable period of time or through other measures, Underlying Funds may experience increased expenses as they buy and sell portfolio securities to manage the cash flow effect related to these transactions. Further, when the Investment Manager or its affiliate structures transactions over a reasonable period of time in order to manage the potential impact of the buy and sell decisions for the affiliated products, those affiliated products, including funds-of-funds, may pay more or less (for purchase activity), or receive more or less (for redemption activity), for shares of the Underlying Funds than if the transactions were executed in one transaction. In addition, substantial redemptions by affiliated products within a short period of time could require the Underlying Fund to liquidate positions more rapidly than would otherwise be desirable, which may have the effect of reducing or eliminating potential gain or causing it to realize a loss. In order to meet such redemptions, an Underlying Fund may be forced to sell its liquid (or more liquid) positions, leaving the Underlying Fund holding, post-redemption, a relatively larger position in illiquid investments (i.e., any investment that the Fund reasonably expects cannot be sold or disposed of in current market conditions in seven calendar days or less without the sale or disposition significantly changing the market value of the investment) or less liquid securities. Substantial redemptions may also adversely affect the ability of the Underlying Fund to implement its investment strategy. The Investment Manager or its affiliate also has a conflict of interest in determining the allocation of affiliated products’ assets among the Underlying Funds, as it earns different fees from the various Underlying Funds.
Investing in Money Market Funds
The Fund may invest cash in, or hold as collateral for certain investments, shares of registered or unregistered money market funds, including funds advised by the Investment Manager or its affiliates. These funds are not insured or guaranteed by the Federal Deposit Insurance Corporation (FDIC) or any other government agency. The Fund and its shareholders indirectly bear a portion of the expenses of any money market fund or other fund in which the Fund may invest.
Prospectus 2026
19
Columbia Variable Portfolio – High Yield Bond Fund
More Information About the Fund (continued)
Investing Defensively
The Fund may from time to time take temporary defensive investment positions that may be inconsistent with the Fund’s principal investment strategies in attempting to respond to adverse market, economic, political, social or other conditions, including, without limitation, investing some or all of its assets in money market instruments or shares of affiliated or unaffiliated money market funds or holding some or all of its assets in cash or cash equivalents. The Fund may take such defensive investment positions for as long a period as deemed necessary.
The Fund may not achieve its investment objective while it is investing defensively. Investing defensively may adversely affect Fund performance. During these times, the portfolio managers may make frequent portfolio holding changes, which could result in increased trading expenses and decreased Fund performance. See also Investing in Money Market Funds above for more information.
Other Strategic and Investment Measures
The Fund may also from time to time take temporary portfolio positions that may or may not be consistent with the Fund’s principal investment strategies in attempting to respond to adverse market, economic, political, social or other conditions, including, without limitation, investing in derivatives, such as forward contracts, futures contracts, options, structured investments and swaps, for various purposes, including among others, investing in particular derivatives in seeking to reduce investment exposures, or in seeking to achieve indirect investment exposures, to a sector, country, region or currency where the Investment Manager believes such positioning is appropriate. The Fund may take such portfolio positions for as long a period as deemed necessary. While the Fund is so positioned, derivatives could comprise a substantial portion of the Fund’s investments and the Fund may not achieve its investment objective. Investing in this manner may adversely affect Fund performance. During these times, the portfolio managers may make frequent portfolio holding changes, which could result in increased trading expenses and decreased Fund performance. For information on the risks of investing in derivatives, see Transactions in Derivatives above.
Portfolio Holdings Disclosure
The Board has adopted policies and procedures that govern the timing and circumstances of disclosure to shareholders and third parties of information regarding the securities owned by the Fund. A description of these policies and procedures is included in the SAI. Fund policy generally permits the disclosure of portfolio holdings information on the Fund's website (columbiathreadneedleus.com) only after a certain amount of time has passed, as described in the SAI.
Purchases and sales of portfolio securities can take place at any time, so the portfolio holdings information available on the Fund's website may not always be current.
FUNDamentals
Portfolio Holdings Versus the Benchmarks
The Fund does not limit its investments to the securities within its benchmark(s), and accordingly the Fund's holdings may diverge from those of its benchmark(s). In addition, the Fund may invest in securities outside any industry and geographic sectors represented in its benchmark(s). The Fund's weightings in individual securities, and in industry or geographic sectors, may also vary considerably from those of its benchmark(s).
Cash Flows
The timing and magnitude of cash inflows from investors buying Fund shares could prevent the Fund from always being fully invested. Conversely, the timing and magnitude of cash outflows to shareholders redeeming Fund shares could require the Fund to sell portfolio securities at less than opportune times or to hold ready reserves of uninvested cash in amounts larger than might otherwise be the case to meet shareholder redemptions. Either situation could adversely impact the Fund’s performance.
20
Prospectus 2026
Columbia Variable Portfolio – High Yield Bond Fund
More Information About the Fund (continued)
Understanding Annual Fund Operating Expenses
The Fund’s annual operating expenses, as presented in the Annual Fund Operating Expenses table in the Fees and Expenses of the Fund section of this prospectus, generally are based on expenses incurred during the Fund’s most recently completed fiscal year, may vary by share class and are expressed as a percentage (expense ratio) of the Fund’s average net assets during that fiscal year. The expense ratios reflect the Fund’s fee arrangements as of the date of this prospectus and, unless indicated otherwise, are based on expenses incurred during the Fund’s most recent fiscal year. The Fund’s assets will fluctuate, but unless indicated otherwise in the Annual Fund Operating Expenses table, no adjustments have been or will be made to the expense ratios to reflect any differences in the Fund’s average net assets between the most recently completed fiscal year and the date of this prospectus or a later date. In general, the Fund’s expense ratios will increase as its net assets decrease, such that the Fund’s actual expense ratios may be higher than the expense ratios presented in the Annual Fund Operating Expenses table if assets fall. Any commitment by the Investment Manager and/or its affiliates to waive fees and/or cap (reimburse) expenses is expected, in part, to limit the impact of any increase in the Fund’s expense ratios that would otherwise result because of a decrease in the Fund’s assets in the current fiscal year. The Fund’s annual operating expenses are comprised of (i) investment management fees, (ii) distribution and/or service fees, and (iii) other expenses. Management fees do not vary by class, but distribution and/or service fees and other expenses may vary by class.
FUNDamentals
Other Expenses
“Other expenses” consist of the fees the Fund pays to its custodian, transfer agent, auditors, lawyers and trustees, costs relating to compliance and miscellaneous expenses. Generally, these expenses are allocated on a pro rata basis across all share classes. These fees include certain sub-transfer agency and shareholder servicing fees. For more information on these fees, see About Fund Shares and Transactions — Financial Intermediary Compensation.
Fee Waiver/Expense Reimbursement Arrangements and Impact on Past Performance
The Investment Manager and certain of its affiliates have contractually agreed to waive fees and/or reimburse expenses (excluding certain fees and expenses described below) through April 30, 2027, unless sooner terminated at the sole discretion of the Fund's Board, so that the Fund’s net operating expenses, after giving effect to fees waived/expenses reimbursed and any balance credits and/or overdraft charges from the Fund’s custodian, do not exceed the annual rates of:
| Columbia Variable Portfolio – High Yield Bond Fund | |
| Class 1 |
0.64% |
| Class 2 |
0.89% |
| Class 3 |
0.765% |
Under the agreement, the following fees and expenses are excluded from the Fund’s operating expenses when calculating the waiver/reimbursement commitment, and therefore will be paid by the Fund, if applicable: taxes (including foreign transaction taxes), expenses associated with investment in affiliated and non-affiliated pooled investment vehicles (including mutual funds and exchange-traded funds), transaction costs and brokerage commissions, costs related to any securities lending program, dividend expenses associated with securities sold short, inverse floater program fees and expenses, transaction charges and interest on borrowed money, interest, costs associated with shareholder meetings, infrequent and/or unusual expenses and any other expenses the exclusion of which is specifically approved by the Fund’s Board. This agreement may be modified or amended only with approval from all parties.
The Investment Manager has contractually agreed to implement a waiver with respect to Fund assets invested in funds that pay a management or advisory fee to the Investment Manager or its affiliate (underlying affiliated funds). Under this arrangement, the Investment Manager waives its net management fee (management fee less
Prospectus 2026
21
Columbia Variable Portfolio – High Yield Bond Fund
More Information About the Fund (continued)
reimbursements/waivers) with respect to the Fund in an amount equal to the net management or advisory fee (fee less reimbursement/waivers) payable by an underlying affiliated fund on the assets invested by the Fund in the underlying affiliated fund.
Effect of Fee Waivers and/or Expense Reimbursements on Past Performance. The Fund’s returns shown in the Performance Information section of this prospectus reflect the effect of any fee waivers and/or reimbursements of Fund expenses by the Investment Manager and/or any of its affiliates that were in place during the performance period shown. Without such fee waivers/expense reimbursements, the Fund’s returns might have been lower.
Primary Service Provider Contracts
The Fund enters into contractual arrangements (Service Provider Contracts) with various service providers, including, among others, the Investment Manager, the Distributor, Columbia Management Investment Services Corp. (the Transfer Agent) and the Fund’s custodian. The Fund’s Service Provider Contracts are solely among the parties thereto. Shareholders are not parties to, or intended to be third-party beneficiaries of, any Service Provider Contracts. Further, this prospectus, the SAI and any Service Provider Contracts are not intended to give rise to any agreement, duty, special relationship or other obligation between the Fund and any investor, or give rise to any contractual, tort or other rights in any individual shareholder, group of shareholders or other person, including any right to assert a fiduciary or other duty, enforce the Service Provider Contracts against the parties or to seek any remedy thereunder, either directly or on behalf of the Fund. Nothing in the previous sentence should be read to suggest any waiver of any rights under federal or state securities laws.
The Investment Manager, the Distributor, and the Transfer Agent are all affiliates of Ameriprise Financial, Inc. (Ameriprise Financial). They and their affiliates currently provide key services, including investment advisory, administration, distribution, shareholder servicing and transfer agency services, to the Fund and various other funds, including the Columbia Funds, and are paid for providing these services. These service relationships are described below.
The Investment Manager
Columbia Management Investment Advisers, LLC is located at 290 Congress Street, Boston, MA 02210 and serves as investment adviser and administrator to the Columbia Funds. The Investment Manager is a registered investment adviser and a wholly-owned subsidiary of Ameriprise Financial. The Investment Manager’s management experience covers all major asset classes, including equity securities, debt instruments and money market instruments. In addition to serving as an investment adviser to traditional mutual funds, exchange-traded funds and closed-end funds, the Investment Manager acts as an investment adviser for itself, its affiliates, individuals, corporations, retirement plans, private investment companies and financial intermediaries.
Subject to oversight by the Board, the Investment Manager manages the day-to-day operations of the Fund, determining what securities and other investments the Fund should buy or sell and executing portfolio transactions. The Investment Manager may use the research and other capabilities of its affiliates and third parties in managing the Fund’s investments. The Investment Manager is also responsible for overseeing the administrative operations of the Fund, including the general supervision of the Fund’s operations, the coordination of the Fund’s other service providers and the provision of related clerical and administrative services.
The SEC has issued an order that permits the Investment Manager, subject to the approval of the Board, to appoint unaffiliated subadvisers by entering into subadvisory agreements with them, and to change in material respects the terms of those subadvisory agreements, including the fees paid thereunder, for the Fund without first obtaining shareholder approval, thereby avoiding the expense and delays typically associated with obtaining shareholder approval. The Fund furnishes shareholders with information about new subadvisers retained in reliance on the order within 90 days after hiring the subadviser. The Investment Manager and its affiliates may have other relationships, including significant financial relationships, with current or potential subadvisers or their affiliates, which may create certain conflicts of interest. When making recommendations to the Board to appoint or to change a subadviser, or to change the terms of a subadvisory agreement, the Investment Manager discloses to the Board the nature of any such material relationships. The SEC has issued a separate order that permits the Board to approve new subadvisory agreements or material changes to existing subadvisory agreements at a meeting that is not in person, provided that
22
Prospectus 2026
Columbia Variable Portfolio – High Yield Bond Fund
More Information About the Fund (continued)
the Trustees are able to participate in the meeting using a means of communication that allows them to hear each other simultaneously during the meeting and other conditions of the order are satisfied. At present, the Investment Manager has not engaged any investment subadviser for the Fund.
The Fund pays the Investment Manager a fee for its management services, which include investment advisory services and administrative services. The fee is calculated as a percentage of the daily net assets of the Fund and is paid monthly. For the Fund’s most recent fiscal year, management services fees paid to the Investment Manager by the Fund amounted to 0.65% of average daily net assets of the Fund.
A discussion regarding the basis for the Board’s approval of the renewal of the Fund's management agreement is available in the Fund’s Form N-CSR for the fiscal period ended June 30, 2025.
Portfolio Managers
Information about the portfolio managers primarily responsible for overseeing the Fund’s investments is shown below. The SAI provides additional information about the portfolio managers, including information relating to compensation, other accounts managed by the portfolio managers, and ownership by the portfolio managers of Fund shares.
| Portfolio Management |
Title |
Role with Fund |
Managed Fund Since |
| Daniel DeYoung |
Senior Portfolio Manager |
Portfolio Manager |
2019 |
| Spencer Sutcliffe |
Senior Portfolio Manager |
Portfolio Manager |
2024 |
Mr. DeYoung joined the Investment Manager in 2013. Mr. DeYoung began his investment career in 2005 and earned a B.S. from the University of Minnesota Carlson School of Management.
Mr. Sutcliffe joined one of the Columbia Management legacy firms or acquired business lines in 2010. Mr. Sutcliffe began his investment career in 2001 and earned a B.B.A. from Marshall University and an M.B.A. from Butler University.
The Distributor
Shares of the Fund are distributed by Columbia Management Investment Distributors, Inc., which is located at 290 Congress Street, Boston, MA 02210. The Distributor is a registered broker-dealer and an indirect, wholly-owned subsidiary of Ameriprise Financial. The Distributor and its affiliates may pay commissions, distribution and service fees and/or other compensation to entities, including Ameriprise Financial affiliates, for selling shares and providing services to investors.
The Transfer Agent
Columbia Management Investment Services Corp. is a registered transfer agent and wholly-owned subsidiary of Ameriprise Financial. The Transfer Agent is located at 290 Congress Street, Boston, MA 02210, and its responsibilities include processing purchases, redemptions and transfers of Fund shares, calculating and paying distributions, maintaining shareholder records, preparing account statements and providing customer service. The Transfer Agent has engaged SS&C GIDS, Inc. to provide various sub-transfer agency services. The Fund pays a service fee to participating insurance companies or other financial intermediaries that provide sub-recordkeeping and other services to Contract owners and the separate accounts. The Transfer Agent may retain as compensation for its services revenues for fees for wire, telephone and redemption orders, account transcripts due the Transfer Agent from Fund shareholders and interest (net of bank charges) earned with respect to balances in accounts the Transfer Agent maintains in connection with its services to the Fund.
Other Roles and Relationships of Ameriprise Financial and its Affiliates — Certain Conflicts of Interest
The Investment Manager, Distributor and Transfer Agent, all affiliates of Ameriprise Financial, provide various services to the Fund and other Columbia Funds for which they are compensated. Ameriprise Financial and its other affiliates may also provide other services to these funds and be compensated for them.
Prospectus 2026
23
Columbia Variable Portfolio – High Yield Bond Fund
More Information About the Fund (continued)
The Investment Manager and its affiliates may provide investment advisory and other services to other clients and customers substantially similar to those provided to the Columbia Funds. These activities, and other financial services activities of Ameriprise Financial and its affiliates, may present actual and potential conflicts of interest and introduce certain investment constraints.
Ameriprise Financial is a major financial services company, engaged in a broad range of financial activities beyond the fund-related activities of the Investment Manager, including, among others, insurance, broker-dealer (sales and trading), asset management, banking and other financial activities. These additional activities may involve multiple advisory, financial, insurance and other interests in securities and other instruments, and in companies that issue securities and other instruments, that may be bought, sold or held by the Columbia Funds.
Conflicts of interest and limitations that could affect a Columbia Fund may arise from, for example, the following:
■
compensation and other benefits received by the Investment Manager and other Ameriprise Financial affiliates related to the management/administration of a Columbia Fund and the sale of its shares;
■
the allocation of, and competition for, investment opportunities among the Fund, other funds and accounts advised/managed by the Investment Manager and other Ameriprise Financial affiliates, or Ameriprise Financial itself and its affiliates;
■
separate and potentially divergent management of a Columbia Fund and other funds and accounts advised/managed by the Investment Manager and other Ameriprise Financial affiliates;
■
regulatory and other investment restrictions on investment activities of the Investment Manager and other Ameriprise Financial affiliates and accounts advised/managed by them;
■
insurance and other relationships of Ameriprise Financial affiliates with companies and other entities in which a Columbia Fund invests;
■
regulatory and other restrictions relating to the sharing of information between Ameriprise Financial and its affiliates, including the Investment Manager, and a Columbia Fund; and
■
insurance companies investing in the Fund may be affiliates of Ameriprise Financial; these affiliated insurance companies, individually and collectively, may hold through separate accounts a significant portion of the Fund's shares and may also invest in separate accounts managed by the Investment Manager that have the same or substantially similar investment objectives and strategies as the Fund.
The Investment Manager and Ameriprise Financial have adopted various policies and procedures that are intended to identify, monitor and address conflicts of interest. However, there is no assurance that these policies, procedures and disclosures will be effective.
Additional information about Ameriprise Financial and the types of conflicts of interest and other matters referenced above is set forth in the Investment Management and Other Services — Other Roles and Relationships of Ameriprise Financial and its Affiliates — Certain Conflicts of Interest section of the SAI. Investors in the Columbia Funds should carefully review these disclosures and consult with their financial advisor if they have any questions.
Certain Legal Matters
Ameriprise Financial and certain of its affiliates are involved, in the normal course of business, in legal proceedings that include regulatory inquiries, arbitration and litigation (including class actions) concerning matters arising in connection with the conduct of their activities as part of a diversified financial services firm. Ameriprise Financial believes that the Fund is not currently the subject of, and that neither Ameriprise Financial nor any of its affiliates are the subject of, any pending legal, arbitration or regulatory proceedings that are likely to have a material adverse effect on the Fund or the ability of Ameriprise Financial or its affiliates to perform under their contracts with the Fund. Information regarding certain pending and settled legal proceedings may be found in the Fund’s Form N-CSR and in the SAI. Additionally, Ameriprise Financial is required to make quarterly (10-Q), annual (10-K) and, as necessary, 8-K filings with the SEC on legal and regulatory matters that relate to Ameriprise Financial and its affiliates. Copies of these filings may be obtained by accessing the SEC website at sec.gov.
24
Prospectus 2026
Columbia Variable Portfolio – High Yield Bond Fund
About Fund Shares and Transactions
Description of the Share Classes
Share Class Features
The Fund offers the classes of shares set forth on the cover of this prospectus. Each share class has its own cost structure and other features. The following summarizes the primary features of the Class 1, Class 2 and Class 3 shares.
| |
Class 1 Shares |
Class 2 Shares |
Class 3 Shares |
| Eligible Investors |
Shares of the Fund are available only to separate accounts of participating insurance companies as underlying investments for variable annuity contracts and/or variable life insurance policies (collectively, Contracts) or qualified pension and retirement plans (Qualified Plans) or other eligible investors authorized by the Distributor. | ||
| Investment Limits |
none |
none |
none |
| Conversion Features |
none |
none |
none |
| Front-End Sales Charges |
none |
none |
none |
| Contingent Deferred Sales Charges (CDSCs) |
none |
none |
none |
| Maximum Distribution and/or Service Fees |
none |
0.25% |
0.125% |
FUNDamentals
Financial Intermediaries
The term “financial intermediary” refers to the insurance company that issued your contract, qualified pension or retirement plan sponsors or the financial intermediary that employs your financial advisor. Financial intermediaries also include broker-dealers and financial advisors as well as firms that employ broker-dealers and financial advisors, including, for example, brokerage firms, banks, investment advisers, third party administrators and other firms in the financial services industry, including Ameriprise Financial and its affiliates.
Distribution and/or Service Fees
Pursuant to Rule 12b-1 under the Investment Company Act of 1940, as amended (the 1940 Act), the Board has approved, and the Fund has adopted, a distribution plan which sets the distribution fees that are periodically deducted from the Fund’s assets for Class 2 and Class 3 shares. The distribution fee for Class 2 shares is 0.25% and the distribution fee for Class 3 shares is 0.125%. These fees are calculated daily, may vary by share class and are intended to compensate the Distributor and/or financial intermediaries for selling shares of the Fund and/or providing services to investors. Because the fees are paid out of the Fund’s assets on an ongoing basis, they will increase the cost of your investment over time.
The Fund will pay these fees to the Distributor and/or to eligible financial intermediaries for as long as the distribution plan continues. The Fund may reduce or discontinue payments at any time.
The Fund pays a service fee to participating insurance companies or other financial intermediaries that provide sub-recordkeeping and other services to Contract owners, Qualified Plan participants and the separate accounts.
Financial Intermediary Compensation
The Distributor, the Investment Manager and their affiliates make payments, from their own resources, to financial intermediaries, primarily to affiliated and unaffiliated insurance companies, for marketing/sales support services relating to the Fund (Marketing Support Payments). Such payments are generally based upon one or more of the following factors: average net assets of the Columbia Funds sold by the Distributor attributable to that financial intermediary; gross sales of the Columbia Funds distributed by the Distributor attributable to that financial intermediary; or a negotiated lump sum payment. While the financial arrangements may vary for each financial intermediary, the Marketing Support Payments to any one financial intermediary are generally between 0.05% and
Prospectus 2026
25
Columbia Variable Portfolio – High Yield Bond Fund
About Fund Shares and Transactions (continued)
0.40% on an annual basis for payments based on average net assets of the Fund attributable to the financial intermediary, and between 0.05% and 0.25% on an annual basis for a financial intermediary receiving a payment based on gross sales of the Columbia Funds attributable to the financial intermediary.
As employee compensation and business unit operating goals at all levels are generally tied to the success of Ameriprise Financial, employees of Ameriprise Financial and its affiliates, including employees of affiliated broker-dealers and insurance companies, are incented to include shares of the Columbia Funds in Contracts offered by affiliated insurance companies. Certain employees, directly or indirectly, receive higher compensation and other benefits as investment in the Columbia Funds increases. In addition, management, sales leaders and other employees may spend more of their time and resources promoting Ameriprise Financial and its subsidiary companies, including the Distributor and the Investment Manager, and the products they offer, including the Fund.
In addition, the Transfer Agent has certain arrangements in place to compensate financial intermediaries, primarily to affiliated and unaffiliated insurance companies, that hold Fund shares through networked and omnibus accounts, including omnibus retirement plans, for services that they provide to beneficial Fund shareholders (Shareholder Services). Shareholder Services and related fees vary by financial intermediary and may include sub-accounting, sub-transfer agency, participant recordkeeping, shareholder or participant reporting, shareholder or participant transaction processing, maintenance of shareholder records, preparation of account statements and provision of customer service, and are not intended to include services that are primarily intended to result in the sale of Fund shares. Payments for Shareholder Services generally are not expected, with certain limited exceptions, to exceed 0.40% of the average aggregate value of the Fund’s shares. Each Fund pays the Transfer Agent a service fee equal to the payments made by the Transfer Agent to participating insurance companies and other financial intermediaries that provide Shareholder Services up to the lesser of the amount charged by the financial intermediary or a contractual asset-based cap. Payments of amounts that exceed the amount paid by the Fund are borne by the Transfer Agent, the Investment Manager and/or their affiliates.
In addition to the payments described above, the Distributor, the Investment Manager and their affiliates typically make other payments or allow promotional incentives to certain broker-dealers to the extent permitted by SEC and Financial Industry Regulatory Authority (FINRA) rules and by other applicable laws and regulations.
Amounts paid by the Distributor, the Investment Manager and their affiliates are paid out of their own resources and do not increase the amount paid by you or the Fund. You can find further details in the SAI about the payments made by the Distributor, the Investment Manager and their affiliates, as well as a list of the financial intermediaries, including Ameriprise Financial affiliates, to which the Distributor, the Investment Manager or their affiliates have agreed to make Marketing Support Payments and fee payments for Shareholder Services.
Your financial intermediary may charge you fees and commissions in addition to those described in this prospectus. You should consult with your financial intermediary and review carefully any disclosure your financial intermediary provides regarding its services and compensation. Depending on the financial arrangement in place at any particular time, a financial intermediary and its financial advisors may have a conflict of interest or financial incentive with respect to recommendations regarding the Fund or any Contract or Qualified Plan that includes the Fund.
Share Price Determination
The price you pay or receive when you buy, sell or transfer shares is the Fund's next determined net asset value (or NAV) per share for a given share class. The Fund calculates the NAV per share for each class of shares of the Fund at the end of each business day, with the value of the Fund's shares based on the total value of all of the securities and other assets that it holds as of such specified time.
26
Prospectus 2026
Columbia Variable Portfolio – High Yield Bond Fund
About Fund Shares and Transactions (continued)
FUNDamentals
NAV Calculation
Each of the Fund's share classes calculates its NAV per share as follows:
NAV per share = (Value of assets of the share class) – (Liabilities of the share class)
Number of outstanding shares of the class
Number of outstanding shares of the class
FUNDamentals
Business Days
A business day is any day that the New York Stock Exchange (NYSE) is open. A business day typically ends at the close of regular trading on the NYSE, usually at 4:00 p.m. Eastern time. If the NYSE is scheduled to close early, the business day will be considered to end as of the time of the NYSE’s scheduled close. The Fund will not treat an intraday unscheduled disruption in NYSE trading or an intraday unscheduled closing as a close of regular trading on the NYSE for these purposes and will price its shares as of the regularly scheduled closing time for that day (typically, 4:00 p.m. Eastern time). Nonetheless, the NAV of Fund shares may be determined at such other time or times (in addition to or in lieu of the time set forth above) as the Fund’s Board may approve or ratify. On holidays and other days when the NYSE is closed, the Fund’s NAV is not calculated and the Fund does not accept buy or sell orders. However, the value of the Fund’s assets may still be affected on such days to the extent that the Fund holds foreign securities that trade on days that foreign securities markets are open.
Equity securities listed on an exchange are typically valued at the closing price or last trade on their primary exchange at the close of business of the NYSE. Equity securities without a readily available closing price or that are not listed on any exchange are typically valued at the mean between the closing bid and asked prices. Other equity securities, debt securities and other assets are valued differently. For instance, bank loans trading in the secondary market are fair valued unless market quotations are readily available, fixed income investments maturing in 60 days or less are valued primarily using the amortized cost method, unless this methodology results in a valuation that does not approximate the market value of these securities, and those maturing in excess of 60 days are valued based on prices obtained from a pricing service, if available (which may represent market values or fair values). Investments in other open-end funds are valued at their published NAVs. The value of the Fund’s portfolio securities is determined in accordance with the valuation policy approved by the Board (the Valuation Policy). Pursuant to Rule 2a-5 under the 1940 Act, the Board has designated the Investment Manager as the Fund’s valuation designee. The Investment Manager, in turn, has authorized its valuation committee to make fair value determinations and to carry out supervisory and certain other functions relating to the valuation of Fund portfolio securities, pursuant to the Valuation Policy.
If a market price is not readily available or is deemed not to reflect market value for a portfolio security, the Investment Manager will determine the price based on a determination of the security's fair value pursuant to the Valuation Policy. In addition, the Investment Manager may use fair valuation techniques to price securities that trade on a foreign exchange when a significant event has occurred after the foreign exchange closes but before the time at which the Fund’s share price is calculated. Foreign exchanges typically close before the time at which Fund share prices are calculated, and may be closed altogether on days when the Fund is open. Such significant events affecting a foreign security may include, but are not limited to: (1) corporate actions, earnings announcements, litigation or other events impacting a single issuer; (2) governmental action that affects securities in one sector or country; (3) natural disasters or armed conflicts affecting a country or region; or (4) significant domestic or foreign market fluctuations. The Fund uses various criteria, including an evaluation of U.S. market moves after the close of foreign markets, in determining whether a foreign security's market price is readily available and reflective of market value and, if not, the fair value of the security.
Prospectus 2026
27
Columbia Variable Portfolio – High Yield Bond Fund
About Fund Shares and Transactions (continued)
Fair valuation may have the effect of reducing stale pricing arbitrage opportunities presented by the pricing of Fund shares. However, when the Investment Manager uses fair valuation to price equity securities, it may value those securities higher or lower than another fund or manager would. Also, fair valuation of Fund holdings may cause the Fund's performance to diverge to a greater degree from the performance of various benchmark indices used to compare the Fund's performance because indices generally do not use fair valuation techniques. Because of the judgment involved in fair valuation decisions, there can be no assurance that the value ascribed to a particular security is accurate. The Fund has retained one or more independent fair valuation pricing services to assist in the fair valuation process for foreign securities.
Futures and options on futures are valued based upon the settlement price as determined by the principal exchange on which they are traded or, in the absence of a settlement price, at the mean of the closing bid and ask. Generally, over-the-counter derivatives, such as swaps and swaptions, are valued based on a price provided by an approved pricing service.
Shareholder Information
Each share class has its own cost structure and other features. Your product may not offer every share class. The Fund encourages you to consult with a financial advisor who can help you with your investment decisions and for more information about the share classes offered by the Fund and available under your product. Shares of the Fund are generally available for purchase only by participating insurance companies in connection with Contracts and Qualified Plan sponsors.
The Fund, the Distributor or the Transfer Agent may refuse any order to buy or transfer shares. If this happens, the Fund will return any money it received, but no interest will be paid on that money.
Shares of the Fund may not be purchased or sold directly by individual Contract owners or participants in a Qualified Plan. When you sell your shares through your Contract or Qualified Plan, the Fund is effectively buying them back. This is called a redemption. The right of redemption may be suspended or payment postponed whenever permitted by applicable laws and regulations, as described under Satisfying Fund Redemption Requests below.
Depending on the context, references to “you” or “your” herein refer either to the holder of a Contract, participant in a Qualified Plan or qualified institutional investor who may select Fund shares to fund his or her investment in the Contract or Qualified Plan or to the participating insurance company as the holder of Fund shares through one or more separate accounts or the Qualified Plan.
Satisfying Fund Redemption Requests
The Fund typically expects to send the redeeming participating insurance company or Qualified Plan sponsor payment for shares within two business days after your trade date. The Fund can suspend redemptions and/or delay payment of redemption proceeds for up to seven days. The Fund can also suspend redemptions and/or delay payment of redemption proceeds in excess of seven days under certain circumstances, including when the NYSE is closed or trading thereon is restricted or during emergency or other circumstances, including as determined by the SEC.
The Fund typically seeks to satisfy redemption requests from cash or cash equivalents held by the Fund, from the proceeds of orders to purchase Fund shares or from the proceeds of sales of Fund holdings effected in the normal course of managing the Fund. However, the Fund may have to sell Fund holdings, including in down markets, to meet heavier than usual redemption requests. For example, under stressed or abnormal market conditions or circumstances, including circumstances adversely affecting the liquidity of the Fund’s investments, the Fund may be more likely to be forced to sell Fund holdings to meet redemptions than under normal market circumstances. In these situations, the Fund’s portfolio managers may have to sell Fund holdings that would not otherwise be sold because, among other reasons, the current price to be received is less than the value of the holdings perceived by the Fund’s portfolio managers. The Fund may also, under certain circumstances (but more likely under stressed or abnormal market conditions or circumstances), borrow money under a credit facility to which the Fund and certain other Columbia Funds are parties or from other Columbia Funds under an interfund lending program (except for closed-end funds and money market funds, which are not eligible to borrow under the program). The Fund and the
28
Prospectus 2026
Columbia Variable Portfolio – High Yield Bond Fund
About Fund Shares and Transactions (continued)
other Columbia Funds are limited as to the amount that each may individually and collectively borrow under the credit facility and the interfund lending program. As a result, borrowings available to the Fund under the credit facility and the interfund lending program might be insufficient, alone or in combination with the other strategies described herein, to satisfy Fund redemption requests. Please see About Fund Investments – Borrowings – Interfund Lending in the SAI for more information about the credit facility and interfund lending program. The Fund is also limited in the total amount it may borrow. The Fund may only borrow to the extent permitted by the 1940 Act, the rules and regulations thereunder, and any exemptive relief available to the Fund, which currently limit Fund borrowings to 33 1/3% of total assets (including any amounts borrowed) less liabilities (other than borrowings), plus an additional 5% of its total assets for temporary purposes (to be repaid within 60 days without extension or renewal), in each case determined at the time the borrowing is made.
In addition, the Fund reserves the right to honor redemption orders in whole or in part with in-kind distributions of Fund portfolio securities instead of cash if the Investment Manager, in its sole discretion, determines it to be in the best interest of the remaining shareholders. Such in-kind distributions typically represent a pro-rata portion of Fund portfolio assets subject to adjustments (e.g., for non-transferable securities, round lots and derivatives). In the event the Fund distributes portfolio securities in kind, shareholders may incur brokerage and other transaction costs associated with converting the portfolio securities into cash. Also, the portfolio securities may increase or decrease in value after they are distributed but before they are converted into cash. For U.S. federal income tax purposes, redemptions paid in securities are generally treated the same as redemptions paid in cash. If, during any 90-day period, you redeem shares in an amount greater than $250,000 or 1% of the Fund’s net assets (whichever is less), and if the Investment Manager determines it to be feasible and appropriate, the Fund may pay the redemption amount above such threshold by an in-kind distribution of Fund portfolio securities. Although shares of the Fund may not be purchased or sold by individual owners of Contracts or Qualified Plans, this policy applies indirectly to Contract and Qualified Plan owners.
Potential Conflicts of Interest – Mixed and Shared Funding
The Fund is available for purchase only through Contracts offered by participating insurance companies, Qualified Plans and other qualified institutional investors authorized by the Distributor. Due to differences in tax treatment and other considerations, the interests of various Contract owners, and the interests of Qualified Plan participants, if any, may conflict. The Fund does not foresee any disadvantages to investors arising from these potential conflicts of interest at this time. Nevertheless, the Board of the Fund intends to monitor events to identify any material irreconcilable conflicts which may arise, and to determine what action, if any, should be taken in response to any conflicts. If such a conflict were to arise, one or more separate accounts might be required to withdraw its investments in the Fund or shares of another mutual fund may be substituted. This might force the Fund to sell securities at disadvantageous prices.
Order Processing
Orders to buy and sell shares of the Fund that are placed by your participating insurance company or Qualified Plan sponsor are processed on business days. Orders received in “good form” by the Transfer Agent or a financial intermediary, including your participating insurance company or Qualified Plan sponsor, before the end of a business day are priced at the NAV per share of the Fund's applicable share class on that day. Orders received after the end of a business day will receive the next business day’s NAV per share. An order is in “good form” if the Transfer Agent or your financial intermediary has all of the information and documentation it deems necessary to effect your order. The market value of the Fund’s investments may change between the time you submit your order and the time the Fund next calculates its NAV per share. The business day that applies to your order is also called the trade date.
There is no sales charge associated with the purchase of Fund shares, but there may be charges associated with your Contract or Qualified Plan. Any charges that apply to your Contract or Qualified Plan, and any charges that apply to separate accounts of participating insurance companies or Qualified Plans that may own shares directly, are described in your separate Contract prospectus or Qualified Plan disclosure documents.
Prospectus 2026
29
Columbia Variable Portfolio – High Yield Bond Fund
About Fund Shares and Transactions (continued)
You may transfer all or part of your investment in the Fund to one or more of the other investment options available under your Contract or Qualified Plan. You may provide instructions to sell any amount allocated to the Fund. Proceeds will be mailed within seven days after your surrender or withdrawal request is received in good form by an authorized agent. The amount you receive may be more or less than the amount you invested.
Please refer to your Contract prospectus or Qualified Plan disclosure documents, as applicable, for more information about transfers as well as surrenders and withdrawals.
Information Sharing Agreements
As required by Rule 22c-2 under the 1940 Act, the Fund or certain of its service providers will enter into information sharing agreements with financial intermediaries, including participating life insurance companies and financial intermediaries that sponsor or offer retirement plans through which shares of the Fund are made available for purchase. Pursuant to Rule 22c-2, financial intermediaries are required, upon request, to: (i) provide shareholder account and transaction information; and (ii) execute instructions from the Fund to restrict or prohibit further purchases of Fund shares by shareholders who have been identified by the Fund as having engaged in transactions that violate the Fund's excessive trading policies and procedures.
Excessive Trading Practices Policy of Non-Money Market Funds
Right to Reject or Restrict Share Transaction Orders — The Fund is intended for investors with long-term investment purposes and is not intended as a vehicle for frequent trading activity (market timing) that is excessive. Investors should transact in Fund shares primarily for investment purposes. The Board has adopted excessive trading policies and procedures that are designed to deter excessive trading by investors (the Excessive Trading Policies and Procedures). The Fund discourages and does not accommodate excessive trading. Investments in a Fund by institutional investors in connection with redemptions in-kind are exempt from the Excessive Trading Policies and Procedures because they generally do not raise market timing or excessive trading concerns. Further discussion about the Fund’s use of redemptions in-kind is available under Satisfying Fund Redemption Requests.
The Fund reserves the right to reject, without any prior notice, any purchase or transfer order for any reason, and will not be liable for any loss resulting from rejected orders. For example, the Fund may in its sole discretion restrict or reject a purchase or transfer order even if the transaction is not subject to the specific limitation described below if the Fund or its agents determine that accepting the order could interfere with efficient management of the Fund's portfolio or is otherwise contrary to the Fund's best interests. The Excessive Trading Policies and Procedures apply equally to purchase or transfer transactions communicated directly to the Transfer Agent and to those received by financial intermediaries.
Specific Buying and Transferring Limitations — If the Fund detects that an investor has made two “material round trips” in any 28-day period, it will generally reject the investor's future purchase orders, including transfer buy orders, involving any Fund.
For these purposes, a “round trip” is a purchase or transfer into the Fund followed by a sale or transfer out of the Fund, or a sale or transfer out of the Fund followed by a purchase or transfer into the Fund. A “material” round trip is one that is deemed by the Fund to be material in terms of its amount or its potential detrimental impact on the Fund. Independent of this limit, the Fund may, in its sole discretion, reject future purchase orders by any person, group or account that appears to have engaged in any type of excessive trading activity.
These limits generally do not apply to automated transactions or transactions by registered investment companies in a “fund-of-funds” structure. These limits do not apply to payroll deduction contributions by retirement plan participants, transactions initiated by a retirement plan sponsor or certain other retirement plan transactions consisting of rollover transactions, loan repayments and disbursements, and required minimum distribution redemptions. They may be modified or rescinded for accounts held by certain retirement plans to conform to plan limits, for considerations relating to the Employee Retirement Income Security Act of 1974 or regulations of the Department of Labor, and for certain asset allocation or wrap programs. Accounts known to be under common ownership or control generally will be counted together, but accounts maintained or managed by a common
30
Prospectus 2026
Columbia Variable Portfolio – High Yield Bond Fund
About Fund Shares and Transactions (continued)
intermediary generally will not be considered to be under common ownership or control. The Fund reserves the right to modify these restrictions at any time without prior notice to shareholders. In addition, the Fund may, in its sole discretion, reinstate trading privileges that have been revoked under the Fund's Excessive Trading Policies and Procedures.
Limitations on the Ability to Detect and Prevent Excessive Trading Practices — The Fund takes various steps designed to detect and prevent excessive trading, including daily review of available shareholder transaction information. However, the Fund receives buy, sell or transfer orders through financial intermediaries, and cannot always know of or reasonably detect excessive trading that may be facilitated by financial intermediaries or by the use of the omnibus account arrangements they offer. Omnibus account arrangements are common forms of holding shares of mutual funds, particularly among certain financial intermediaries such as broker-dealers, retirement plans and variable insurance products. These arrangements often permit financial intermediaries to aggregate their clients' transactions and accounts, and in these circumstances, the identities of the financial intermediary clients that beneficially own Fund shares are often not known to the Fund.
Some financial intermediaries apply their own restrictions or policies to their clients’ transactions and accounts, which may be more or less restrictive than those described here. This may impact the Fund's ability to curtail excessive trading, even where it is identified. For these and other reasons, it is possible that excessive trading may occur despite the Fund's efforts to detect and prevent it.
Although these restrictions and policies involve judgments that are inherently subjective and may involve some selectivity in their application, the Fund seeks to act in a manner that it believes is consistent with the best interests of Fund shareholders in making any such judgments.
Risks of Excessive Trading — Excessive trading creates certain risks to the Fund's long-term shareholders and may create the following adverse effects:
■
negative impact on the Fund's performance;
■
potential dilution of the value of the Fund's shares;
■
interference with the efficient management of the Fund's portfolio, such as the need to maintain undesirably large cash positions, the need to use its line of credit or the need to buy or sell securities it otherwise would not have bought or sold;
■
losses on the sale of investments resulting from the need to sell securities at less favorable prices; and
■
increased brokerage and administrative costs.
To the extent that the Fund invests significantly in foreign securities traded on markets that close before the Fund's valuation time, it may be particularly susceptible to dilution, which may be exacerbated as a result of excessive trading. Because events may occur after the close of foreign markets and before the Fund's valuation time that influence the value of foreign securities, investors may seek to trade Fund shares in an effort to benefit from their understanding of the value of foreign securities as of the Fund's valuation time. This is often referred to as price arbitrage. The Fund has adopted procedures designed to adjust closing market prices of foreign securities under certain circumstances to reflect what the Fund believes to be the fair value of those securities as of its valuation time. To the extent the adjustments do not work fully, investors engaging in price arbitrage may cause dilution in the value of the Fund's shares held by other shareholders.
Similarly, to the extent that the Fund invests significantly in thinly traded securities and other debt instruments that are rated below investment grade (commonly called “high-yield” or “junk” bonds), equity securities of small-capitalization companies, floating rate loans, or tax-exempt or other securities that may trade infrequently, because these securities are often traded infrequently, investors may seek to trade Fund shares in an effort to benefit from their understanding of the value of these securities as of the Fund's valuation time. This is also a type of price arbitrage. Any such frequent trading strategies may interfere with efficient management of the Fund's portfolio to a greater degree than would be the case for mutual funds that invest only, or significantly, in highly liquid securities, in part because the Fund may have difficulty selling these particular investments at advantageous times or prices to satisfy large and/or frequent sell orders. Any successful price arbitrage may also cause dilution in the value of Fund shares held by non-redeeming shareholders.
Prospectus 2026
31
Columbia Variable Portfolio – High Yield Bond Fund
About Fund Shares and Transactions (continued)
Excessive Trading Practices Policy of Columbia Variable Portfolio - Government Money Market Fund
A money market fund is designed to offer investors a liquid cash option that they may buy and sell as often as they wish. Accordingly, the Board has not adopted policies and procedures designed to discourage excessive or short-term trading of Columbia Variable Portfolio - Government Money Market Fund shares. However, since frequent purchases and sales of Columbia Variable Portfolio - Government Money Market Fund shares could in certain instances harm shareholders in various ways, including reducing the returns to long-term shareholders by increasing costs (such as spreads paid to dealers who trade money market instruments with Columbia Variable Portfolio - Government Money Market Fund) and disrupting portfolio management strategies, Columbia Variable Portfolio - Government Money Market Fund reserves the right, but has no obligation, to reject any purchase or transfer transaction at any time. Columbia Variable Portfolio - Government Money Market Fund has no limits on purchase or transfer transactions. In addition, Columbia Variable Portfolio - Government Money Market Fund reserves the right to impose or modify restrictions on purchases, transfers or trading of Fund shares at any time.
32
Prospectus 2026
Columbia Variable Portfolio – High Yield Bond Fund
Distributions and Taxes
Distributions to Shareholders
A mutual fund can make money two ways:
■
It can earn income on its investments. Examples of fund income are interest paid on money market instruments and bonds, and dividends paid on common stocks.
■
A mutual fund can also have capital gains if the value of its investments increases. While a fund continues to hold an investment, any gain is generally unrealized. If the fund sells an investment, it generally will realize a capital gain if it sells that investment for a higher price than its adjusted cost basis, and will generally realize a capital loss if it sells that investment for a lower price than its adjusted cost basis. Capital gains and losses are either short-term or long-term, depending on whether the fund holds the securities for one year or less (short-term) or more than one year (long-term).
Mutual funds make payments of fund earnings to shareholders, distributing them among all shareholders of the fund. As a shareholder, you are entitled to your portion of a fund's distributed income, including capital gains. Reinvesting your distributions buys you more shares of a fund — which lets you take advantage of the potential for compound growth. Putting the money you earn back into your investment means it, in turn, may earn even more money (or be exposed to additional losses, if the fund earns a negative return). Over time, the power of compounding has the potential to significantly increase the value of your investment. There is no assurance, however, that you'll earn more money if you reinvest your distributions rather than receive them in cash.
The Fund intends to pay out, in the form of distributions to shareholders, a sufficient amount of its income and gains so that the Fund will qualify for treatment as a regulated investment company and generally will not have to pay any federal income or excise tax. The Fund generally intends to distribute any net realized capital gain (whether long-term or short-term gain) at least once a year. Normally, the Fund will declare and pay distributions of net investment income according to the following schedule:
| Declaration and Distribution Schedule | |
| Declarations |
Annually |
| Distributions |
Annually |
The Fund may declare or pay distributions of net investment income more frequently.
Different share classes of the Fund usually pay different net investment income distribution amounts, because each class has different expenses. Each time a distribution is made, the NAV per share of the share class is reduced by the amount of the distribution.
The Fund will automatically reinvest distributions in additional shares of the same share class of the Fund unless you inform us you want to receive your distributions to be paid in cash.
Taxes and Your Investment
Taxation of the Fund: The Fund has elected and intends to qualify and to be eligible for treatment each year as a regulated investment company. A regulated investment company generally is not subject to tax at the fund level on income and gains from investments that are distributed to shareholders. However, the Fund’s failure to qualify and be eligible for treatment as a regulated investment company would result in fund-level taxation, and consequently, a reduction in income available for distribution to you.
Taxation of Fund Shares: Shares of the Fund are only offered to separate accounts of participating insurance companies, Qualified Plans, and certain other eligible persons or plans permitted to hold shares of the Fund pursuant to the applicable U.S. Treasury Regulations without impairing the ability of participating insurance companies to satisfy the diversification requirements of Section 817(h) of the Internal Revenue Code of 1986, as amended. Each participating insurance company, including each participating insurance company that is an affiliate of the Investment Manager, includes in its taxable income any net investment income derived from the investment of assets held in its separate accounts because the insurance company is considered the owner of these assets under federal income tax law. The insurance company may claim certain tax benefits associated with this investment
Prospectus 2026
33
Columbia Variable Portfolio – High Yield Bond Fund
Distributions and Taxes (continued)
income. These benefits, which may include foreign tax credits (which can reduce the insurance company’s U.S. taxes on foreign source income) and the corporate dividends-received deduction (which is a tax deduction for the insurance company attributable to certain dividends received from the Fund), are not passed on to Contract owners since the affiliated insurance company is the owner of the assets under federal tax law and is taxed on the investment income generated by the assets.
Taxation of Variable Annuity Contracts and Variable Life Insurance Policies: Your Contract may qualify for favorable tax treatment. Please refer to your Contract prospectus for more information about the tax implications of your investment in the Contract. As long as your Contract continues to qualify for such favorable tax treatment, you will not be taxed currently on your investment in the Fund through such Contract, even if the Fund makes distributions to the separate account and/or you change your investment options under the Contract. In order to qualify for such treatment, among other things, the separate accounts of participating insurance companies, which maintain and invest net proceeds from Contracts, must be “adequately diversified.” The Fund intends to operate in such a manner so that a separate account investing only in Fund shares on behalf of a holder of a Contract will be “adequately diversified.” If the Fund does not meet such requirements because its investments are not adequately diversified, your Contract could lose its favorable tax treatment, and income and gain allocable to your Contract could be taxable currently to you. This could also occur if Contract holders are found to have an impermissible level of control over the investments underlying their Contracts. You should consult with the participating insurance company that issued your Contract, plan sponsor, or other eligible investor through which your investment in the Fund is made regarding the U.S. federal income taxation of your investment.
FUNDamentals
Taxes
The information provided above is only a summary of how U.S. federal income taxes may affect your indirect investment in the Fund. It is not intended as a substitute for careful tax planning. Your investment in the Fund may have other tax implications. It does not apply to certain types of investors who may be subject to special rules, including foreign or tax-exempt investors or those holding Fund shares through a tax-advantaged account other than a Contract, such as a 401(k) plan or IRA. Please see the SAI for more detailed tax information. You should consult with your own tax advisor about the particular tax consequences to you of an investment in the Fund, including the effect of any foreign, state and local taxes, and the effect of possible changes in applicable tax laws.
34
Prospectus 2026
Columbia Variable Portfolio – High Yield Bond Fund
Financial Highlights
The financial highlights table is intended to help you understand the Fund’s financial performance for the past five fiscal years or, if shorter, the Fund’s period of operations. Certain information reflects financial results for a single Fund share. Per share net investment income (loss) amounts are calculated based on average shares outstanding during the period. The total return in the table represents the rate that an investor would have earned (or lost) on an investment in the Fund assuming all dividends and distributions had been reinvested. Total return does not reflect any fees and expenses imposed under your Contract and/or Qualified Plan, as applicable; such fees and expenses would reduce the total return for all periods shown. Total return and portfolio turnover are not annualized for periods of less than one year. The ratios of expenses and net investment income are annualized for periods of less than one year. The portfolio turnover rate is calculated without regard to purchase and sales transactions of short-term instruments and certain derivatives, if any. If such transactions were included, the Fund’s portfolio turnover rate may be higher. A zero balance may reflect an amount rounding to less than $0.01 or 0.01%. This information has been audited by PricewaterhouseCoopers LLP, an independent registered public accounting firm, whose report, along with the Fund’s financial statements, is included in the Fund’s Form N-CSR, which is available upon request.
Prospectus 2026
35
Columbia Variable Portfolio – High Yield Bond Fund
Financial Highlights (continued)
| |
Net asset value, beginning of period |
Net investment income |
Net realized and unrealized gain (loss) |
Total from investment operations |
Distributions from net investment income |
Distributions from net realized gains |
Total distributions to shareholders |
| Class 1 | |||||||
| Year Ended 12/31/2025 |
$6.16 |
0.39 |
0.14 |
0.53 |
(0.39) |
— |
(0.39) |
| Year Ended 12/31/2024 |
$6.11 |
0.38 |
0.04 |
0.42 |
(0.37) |
— |
(0.37) |
| Year Ended 12/31/2023 |
$5.76 |
0.35 |
0.33 |
0.68 |
(0.33) |
— |
(0.33) |
| Year Ended 12/31/2022 |
$6.85 |
0.31 |
(1.03) |
(0.72) |
(0.33) |
(0.04) |
(0.37) |
| Year Ended 12/31/2021 |
$6.87 |
0.31 |
0.03 |
0.34 |
(0.36) |
— |
(0.36) |
| Class 2 | |||||||
| Year Ended 12/31/2025 |
$6.08 |
0.37 |
0.13 |
0.50 |
(0.37) |
— |
(0.37) |
| Year Ended 12/31/2024 |
$6.03 |
0.36 |
0.05 |
0.41 |
(0.36) |
— |
(0.36) |
| Year Ended 12/31/2023 |
$5.69 |
0.33 |
0.33 |
0.66 |
(0.32) |
— |
(0.32) |
| Year Ended 12/31/2022 |
$6.77 |
0.29 |
(1.01) |
(0.72) |
(0.32) |
(0.04) |
(0.36) |
| Year Ended 12/31/2021 |
$6.79 |
0.29 |
0.03 |
0.32 |
(0.34) |
— |
(0.34) |
| Class 3 | |||||||
| Year Ended 12/31/2025 |
$6.14 |
0.38 |
0.13 |
0.51 |
(0.38) |
— |
(0.38) |
| Year Ended 12/31/2024 |
$6.09 |
0.37 |
0.04 |
0.41 |
(0.36) |
— |
(0.36) |
| Year Ended 12/31/2023 |
$5.74 |
0.34 |
0.33 |
0.67 |
(0.32) |
— |
(0.32) |
| Year Ended 12/31/2022 |
$6.83 |
0.30 |
(1.02) |
(0.72) |
(0.33) |
(0.04) |
(0.37) |
| Year Ended 12/31/2021 |
$6.85 |
0.30 |
0.03 |
0.33 |
(0.35) |
— |
(0.35) |
| Notes to Financial Highlights | |
| (a) |
In addition to the fees and expenses that the Fund bears directly, the Fund indirectly bears a pro rata share of the fees and expenses of any other funds in which it invests. Such indirect expenses are not included in the Fund's reported expense ratios. |
| (b) |
Total net expenses include the impact of certain fee waivers/expense reimbursements made by the Investment Manager and certain of its affiliates, if applicable. |
36
Prospectus 2026
Columbia Variable Portfolio – High Yield Bond Fund
Financial Highlights (continued)
| |
Net asset value, end of period |
Total return |
Total gross expense ratio to average net assets(a) |
Total net expense ratio to average net assets(a),(b) |
Net investment income ratio to average net assets |
Portfolio turnover |
Net assets, end of period (000's) |
| Class 1 | |||||||
| Year Ended 12/31/2025 |
$6.30 |
8.81% |
0.79% |
0.64% |
6.27% |
48% |
$8,784 |
| Year Ended 12/31/2024 |
$6.16 |
7.04% |
0.79% |
0.64% |
6.17% |
39% |
$5,943 |
| Year Ended 12/31/2023 |
$6.11 |
12.19% |
0.78% |
0.65% |
5.98% |
31% |
$3,768 |
| Year Ended 12/31/2022 |
$5.76 |
(10.54%) |
0.78% |
0.66% |
5.21% |
40% |
$2,314 |
| Year Ended 12/31/2021 |
$6.85 |
4.98% |
0.77% |
0.67% |
4.52% |
60% |
$1,349 |
| Class 2 | |||||||
| Year Ended 12/31/2025 |
$6.21 |
8.49% |
1.03% |
0.89% |
6.01% |
48% |
$104,191 |
| Year Ended 12/31/2024 |
$6.08 |
6.88% |
1.04% |
0.89% |
5.91% |
39% |
$90,109 |
| Year Ended 12/31/2023 |
$6.03 |
11.87% |
1.03% |
0.90% |
5.73% |
31% |
$84,374 |
| Year Ended 12/31/2022 |
$5.69 |
(10.78%) |
1.02% |
0.91% |
4.87% |
40% |
$71,928 |
| Year Ended 12/31/2021 |
$6.77 |
4.79% |
1.02% |
0.92% |
4.28% |
60% |
$85,990 |
| Class 3 | |||||||
| Year Ended 12/31/2025 |
$6.27 |
8.54% |
0.91% |
0.76% |
6.13% |
48% |
$180,946 |
| Year Ended 12/31/2024 |
$6.14 |
6.95% |
0.91% |
0.76% |
6.04% |
39% |
$184,201 |
| Year Ended 12/31/2023 |
$6.09 |
12.08% |
0.91% |
0.77% |
5.82% |
31% |
$191,318 |
| Year Ended 12/31/2022 |
$5.74 |
(10.70%) |
0.90% |
0.79% |
4.99% |
40% |
$191,313 |
| Year Ended 12/31/2021 |
$6.83 |
4.86% |
0.89% |
0.80% |
4.42% |
60% |
$243,649 |
Prospectus 2026
37
Columbia Variable Portfolio – High Yield Bond Fund

For More Information
The Fund is generally available only to owners of Contracts issued by participating insurance companies and participants in Qualified Plans. Please refer to your Contract prospectus or Qualified Plan disclosure documents for information about how to buy, sell and transfer shares of the Fund.
Additional Information About the Fund
Additional information about the Fund’s investments is available in the Fund’s annual and semiannual reports to shareholders and in Form N-CSR. In the Fund’s annual report, you will find a discussion of the market conditions and investment strategies that significantly affected the Fund’s performance during its last fiscal year. In the Fund’s Form N-CSR, you will find the Fund’s annual and semiannual financial statements. The SAI also provides additional information about the Fund and its policies. The SAI, which has been filed with the SEC, is legally part of this prospectus (incorporated by reference). To obtain these documents free of charge, to request other information about the Fund and to make shareholder inquiries, please contact the Fund as follows:
By Mail: Columbia Management Investment Services Corp.
P.O. Box 219104
Kansas City, MO 64121-9104
P.O. Box 219104
Kansas City, MO 64121-9104
By Telephone: 800.345.6611
Online: columbiathreadneedleus.com
Reports and other information about the Fund are also available in the EDGAR Database on the SEC’s website at http://www.sec.gov. You can receive copies of this information, for a duplication fee, by electronic request at the following e-mail address: publicinfo@sec.gov.
The investment company registration number of Columbia Funds Variable Series Trust II, of which the Fund is a series, is 811-22127.
Columbia Threadneedle Investments (Columbia Threadneedle) is the global brand name of the Columbia and Threadneedle group of companies.
The Fund is distributed by Columbia Management Investment Distributors, Inc., 290 Congress Street, Boston, MA 02210.
The Fund is distributed by Columbia Management Investment Distributors, Inc., 290 Congress Street, Boston, MA 02210.
© 2026 Columbia Threadneedle. All rights reserved.
PRO7010_12_E01_(05/26)

Columbia Variable Portfolio – Large Cap Index Fund
Prospectus
May 1, 2026
As with all mutual funds, the Securities and Exchange Commission (SEC) has not approved or disapproved these securities or passed upon the adequacy of this prospectus. Any representation to the contrary is a criminal offense.

Columbia Variable Portfolio – Large Cap Index Fund
Table of Contents
| 3 | |
| 3 | |
| 3 | |
| 4 | |
| 4 | |
| 6 | |
| 7 | |
| 7 | |
| 7 | |
| 8 | |
| 9 | |
| 9 | |
| 9 | |
| 9 | |
| 13 | |
| 16 | |
| 18 | |
| 19 | |
| 20 | |
| 20 | |
| 20 | |
| 21 | |
| 23 | |
| 28 | |
| 28 | |
| 28 | |
| 31 |
2
Prospectus 2026
Columbia Variable Portfolio – Large Cap Index Fund
Summary of the Fund
Investment Objective
Columbia Variable Portfolio – Large Cap Index Fund (the Fund) seeks to provide shareholders with long-term capital appreciation.
Fees and Expenses of the Fund
This table describes the fees and expenses that you may pay as an investor in the Fund. The table does not reflect any fees or expenses imposed by your Contract or Qualified Plan, which are disclosed in your separate Contract prospectus or Qualified Plan disclosure documents. If the additional fees or expenses were reflected, the expenses set forth below would be higher.
| Annual Fund Operating Expenses (expenses that you pay each year as a percentage of the value of your investment) | |||
| |
Class 1 |
Class 2 |
Class 3 |
| Management fees |
% |
% |
% |
| Distribution and/or service (12b-1) fees |
% |
% |
% |
| Other expenses |
% |
% |
% |
| Total annual Fund operating expenses(a) |
% |
% |
% |
| Less: Fee waivers and/or expense reimbursements(b) |
( %) |
( %) |
( %) |
| Total annual Fund operating expenses after fee waivers and/or expense reimbursements |
% |
% |
% |
(a)
(b)
Example
The following example is intended to help you compare the cost of investing in the Fund with the cost of investing in other mutual funds. The example illustrates the hypothetical expenses that you would incur over the time periods indicated, and assumes that:
■
you invest $10,000 in the applicable class of Fund shares for the periods indicated,
■
your investment has a 5% return each year, and
■
the Fund’s total annual operating expenses remain the same as shown in the Annual Fund Operating Expenses table above.
The example does not reflect any fees and expenses that apply to your Contract or Qualified Plan. Inclusion of these charges would increase expenses for all periods shown.
Since the waivers and/or reimbursements shown in the Annual Fund Operating Expenses table above expire as indicated in the preceding table, they are only reflected in the 1 year example and the first year of the other examples. Although your actual costs may be higher or lower, based on the assumptions listed above, your costs would be:
| |
1 year |
3 years |
5 years |
10 years |
| Class 1 (whether or not shares are redeemed) |
$ |
$ |
$ |
$ |
| Class 2 (whether or not shares are redeemed) |
$ |
$ |
$ |
$ |
| Class 3 (whether or not shares are redeemed) |
$ |
$ |
$ |
$ |
Prospectus 2026
3
Columbia Variable Portfolio – Large Cap Index Fund
Summary of the Fund (continued)
Portfolio Turnover
The Fund may pay transaction costs, such as commissions, when it buys and sells securities (or “turns over” its portfolio). A higher portfolio turnover rate may indicate higher transaction costs. These costs, which are not reflected in annual fund operating expenses or in the example, affect the Fund’s performance. During the most recent fiscal year, the Fund’s portfolio turnover rate was 3 % of the average value of its portfolio.
Principal Investment Strategies
Under normal circumstances, the Fund invests at least 80% of its net assets (plus the amount of any borrowings for investment purposes) in common stocks that comprise the Standard & Poor's (S&P) 500® Index (the Index).
The Fund may invest in derivatives, such as futures (including equity index futures), for cash equitization purposes.
Different common stocks have different weightings in the Index, depending on the amount of stock outstanding and the stock’s current price. In seeking to match the performance of the Index, Columbia Management Investment Advisers, LLC (the Investment Manager) attempts to allocate the Fund’s assets among common stocks in approximately the same weightings as the Index. This is referred to as a passive or indexing approach to investing. As a result of the Fund’s indexing approach to investing, the Fund will typically emphasize within the portfolio those economic sectors emphasized by the Index, such as the information technology sector. The Fund may buy shares of Ameriprise Financial, Inc., an affiliate of the Investment Manager, which is currently included in the Index, subject to certain restrictions.
The Fund may operate as non-diversified when the Index is non-diversified. A non-diversified fund can invest a greater percentage of its assets in the securities of fewer issuers than can a diversified fund.
Principal Risks
An investment in the Fund involves risks, including Correlation/Tracking Error Risk, Passive Investment Risk, Large-Cap Stock Risk, Market Risk, and Sector Risk, among others. Descriptions of these and other principal risks of investing in the Fund are provided below. There is no assurance that the Fund will achieve its investment objective and you may lose money. The value of the Fund’s holdings may decline, and the Fund’s net asset value (NAV) and share price may go down. An investment in the Fund is not a bank deposit and is not insured or guaranteed by the Federal Deposit Insurance Corporation or any other government agency. The significance of any specific risk to an investment in the Fund will vary over time depending on the composition of the Fund's portfolio, market conditions, and other factors. You should read all of the risk information below carefully, because any one or more of these risks may result in losses to the Fund.
Correlation/Tracking Error Risk. The Fund’s value will generally decline when the performance of the securities within the Index declines. A number of factors may affect the Fund’s ability to achieve a high degree of correlation with the Index, and there is no guarantee that the Fund will achieve a high degree of correlation. Failure to achieve a high degree of correlation may prevent the Fund from achieving its investment objective. In addition, the Fund bears management and other expenses and transaction costs in trading securities or other instruments, which the Index does not bear. The Fund, unlike the Index, is subject to regulatory requirements that can limit the Fund’s investments relative to what the Index can hold. Accordingly, the Fund's performance will likely fail to match the performance of the Index, after taking expenses into account, as well as regulatory limitations. It is not possible to invest directly in an index.
Derivatives Risk. Derivatives may involve significant risks. Derivatives are financial instruments with a value in relation to, or derived from, the value of an underlying asset(s) or other reference, such as an index, rate or other economic indicator (each an underlying reference). Derivatives may include those that are privately placed or otherwise exempt from SEC registration, including certain Rule 144A eligible securities. Derivatives could result in Fund losses if the underlying reference does not perform as anticipated. Use of derivatives is a highly specialized activity that can involve investment techniques, risks, and tax planning different from those associated with more traditional investment instruments. The Fund’s derivatives strategy may not be successful, and use of certain derivatives could result in substantial, potentially unlimited, losses to the Fund regardless of the Fund’s actual investment. A relatively small movement in the price, rate or other economic indicator associated with the underlying
4
Prospectus 2026
Columbia Variable Portfolio – Large Cap Index Fund
Summary of the Fund (continued)
reference may result in substantial losses for the Fund. Derivatives may be more volatile than other types of investments. The value of derivatives may be influenced by a variety of factors, including national and international political and economic developments. Potential changes to the regulation of the derivatives markets may make derivatives more costly, may limit the market for derivatives, or may otherwise adversely affect the value or performance of derivatives. Derivatives can increase the Fund’s risk exposure to underlying references and their attendant risks, such as credit risk, market risk, foreign currency risk and interest rate risk, while potentially exposing the Fund to correlation risk, counterparty risk, hedging risk, inflation risk, leverage risk, liquidity risk, pricing risk and volatility risk.
Derivatives Risk – Futures Contracts Risk. A futures contract is an exchange-traded derivative transaction between two parties in which a buyer (holding the “long” position) agrees to pay a fixed price (or rate) at a specified future date for delivery of an underlying reference from a seller (holding the “short” position). The seller hopes that the market price on the delivery date is less than the agreed upon price, while the buyer hopes for the contrary. Certain futures contract markets are highly volatile, and futures contracts may be illiquid. Futures exchanges may limit fluctuations in futures contract prices by imposing a maximum permissible daily price movement. The Fund may be disadvantaged if it is prohibited from executing a trade outside the daily permissible price movement. At or prior to maturity of a futures contract, the Fund may enter into an offsetting contract and may incur a loss to the extent there has been adverse movement in futures contract prices. The liquidity of the futures markets depends on participants entering into offsetting transactions rather than making or taking delivery. To the extent participants make or take delivery, liquidity in the futures market could be reduced. Because of the low margin deposits normally required in futures trading, it is possible that the Fund may employ a high degree of leverage in the portfolio. As a result, a relatively small price movement in a futures contract may result in substantial losses to the Fund, exceeding the amount of the margin paid. For certain types of futures contracts, losses are potentially unlimited. Futures markets are highly volatile, and the use of futures may increase the volatility of the Fund’s NAV. Futures contracts executed (if any) on foreign exchanges may not provide the same protection as U.S. exchanges. Futures contracts can increase the Fund’s risk exposure to underlying references and their attendant risks, such as credit risk, market risk, foreign currency risk and interest rate risk, while potentially exposing the Fund to correlation risk, counterparty risk, hedging risk, inflation risk, leverage risk, liquidity risk, pricing risk and volatility risk.
Equity Securities Risk. Equity securities may experience significant volatility. Such securities may fall sharply in response to adverse events affecting overall markets, a particular industry or sector, or an individual company’s financial condition.
Issuer Risk. An issuer in which the Fund invests or to which it has exposure may perform poorly or below expectations, and the value of its securities may therefore decline, which may negatively affect the Fund’s performance. Underperformance of an issuer may be caused by poor management decisions, competitive pressures, breakthroughs in technology, reliance on suppliers, labor problems or shortages, corporate restructurings, fraudulent disclosures, natural disasters, military confrontations and actions, war, other conflicts, terrorism, disease/virus outbreaks, epidemics or other events, conditions and factors which may impair the value of your investment in the Fund.
■
Large-Cap Stock Risk. Investments in larger, more established companies (larger companies) may involve certain risks associated with their larger size. For instance, larger companies may be less able to respond quickly to new competitive challenges, such as changes in consumer tastes or innovation from smaller competitors. Also, larger companies are sometimes less able to achieve as high growth rates as successful smaller companies, especially during extended periods of economic expansion.
Market Risk. The Fund may incur losses due to declines in the value of one or more securities in which it invests. These declines may be due to factors affecting a particular issuer, or the result of, among other things, political, regulatory, market, economic or social developments affecting the relevant market(s) more generally. In addition, turbulence in financial markets and reduced liquidity in equity, credit and/or fixed income markets may negatively affect many issuers, which could adversely affect the Fund’s ability to price or value hard-to-value assets in thinly traded and closed markets and could cause significant redemptions and operational challenges. Global economies and financial markets are increasingly interconnected, and conditions and events in one country, region or financial market may adversely impact issuers in a different country, region or financial market. These risks may be magnified
Prospectus 2026
5
Columbia Variable Portfolio – Large Cap Index Fund
Summary of the Fund (continued)
if certain events or developments adversely interrupt the global supply chain; in these and other circumstances, such risks might affect companies worldwide. As a result, local, regional or global events such as terrorism, war, other conflicts, natural disasters, disease/virus outbreaks and epidemics or other public health issues, recessions, depressions or other events – or the potential for such events – could have a significant negative impact on global economic and market conditions.
Non-Diversified Fund Risk. The Fund is passively managed to track an unaffiliated index, and the Fund may hold a non-diversified portfolio to the extent that its index’s holdings represent a non-diversified portfolio. When holding a non-diversified portfolio, it may invest a greater percentage of its total assets in the securities of fewer issuers than a “diversified” fund. This increases the risk that a change in the value of any one investment held by the Fund could affect the overall value of the Fund more than it would affect that of a diversified fund holding a greater number of investments. Accordingly, the Fund's value will likely be more volatile than the value of a more diversified fund.
Passive Investment Risk. The Fund is not actively managed and may be affected by a general decline in market segments related to its Index’s investment exposures. The Fund invests in securities or instruments included in, or believed by the portfolio managers to be representative of, the Index regardless of their investment merits. The Fund does not seek temporary defensive positions when markets decline or appear overvalued.
Sector Risk. At times, the Fund may have a significant portion of its assets invested in securities of companies conducting business in a related group of industries within one or more economic sectors, including the information technology sector. The Fund generally invests in issuers, including to concentrate its investments in issuers conducting business in a related group of industries, to approximately the same extent as the Index. Companies in the same sector may be similarly affected by economic, regulatory, political or market events or conditions, which may make the Fund vulnerable to unfavorable developments in that group of industries or economic sector.
■
Information Technology Sector. The Fund is vulnerable to the particular risks that may affect companies in the information technology sector. Companies in the information technology sector are subject to certain risks, including the risk that new services, equipment or technologies will not be accepted by consumers and businesses or will become rapidly obsolete. Performance of such companies may be affected by factors including obtaining and protecting patents (or the failure to do so) and significant competitive pressures, including aggressive pricing of their products or services, new market entrants, competition for market share and short product cycles due to an accelerated rate of technological developments. Such competitive pressures may lead to limited earnings and/or falling profit margins. As a result, the value of their securities may fall or fail to rise. In addition, many information technology sector companies have limited operating histories and prices of these companies’ securities historically have been more volatile than other securities, especially over the short term. Some companies in the information technology sector are facing increased government and regulatory scrutiny and may be subject to adverse government or regulatory action, which could negatively impact the value of their securities.
Performance Information
The following bar chart and table show you how the Fund has performed in the past, and can help you understand the risks of investing in the Fund. The bar chart shows how the Fund’s Class 2 share performance has varied for each full calendar year shown. The table below the bar chart compares the Fund’s returns for the periods shown with a broad measure of market performance.
Except for differences in annual returns resulting from differences in expenses (where applicable), the share classes of the Fund would have substantially similar annual returns because all share classes of the Fund invest in the same portfolio of securities.
The returns shown do not reflect any fees and expenses imposed under your Contract or Qualified Plan and would be lower if they did.
6
Prospectus 2026
Columbia Variable Portfolio – Large Cap Index Fund
Summary of the Fund (continued)
| |
Best and Worst Quarterly Returns During the Period Shown in the Bar Chart | ||
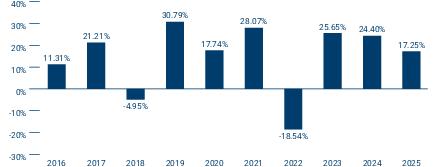 |
|
|
|
| |
|
- | |
Average Annual Total Returns (for periods ended December 31, 2025)
| |
Share Class Inception Date |
1 Year |
5 Years |
10 Years |
| Class 1 |
|
|
|
|
| Class 2 |
|
|
|
|
| Class 3 |
|
|
|
|
| S&P 500® Index (reflects no deductions for fees, expenses or taxes) |
|
|
|
|
Fund Management
Investment Manager: Columbia Management Investment Advisers, LLC
| Portfolio Management |
Title |
Role with Fund |
Managed Fund Since |
| Christopher Lo, CFA |
Senior Portfolio Manager |
Lead Portfolio Manager |
2014 |
| Shirley Wang, CFA, CPA |
Associate Portfolio Manager |
Portfolio Manager |
September 2025 |
Purchase and Sale of Fund Shares
The Fund is available for purchase through Contracts offered by the separate accounts of participating insurance companies or Qualified Plans or by other eligible investors authorized by Columbia Management Investment Distributors, Inc. (the Distributor). Shares of the Fund may not be purchased or sold by individual owners of Contracts or Qualified Plans. If you are a Contract holder or Qualified Plan participant, please refer to your separate Contract prospectus or Qualified Plan disclosure documents for information about minimum investment requirements and how to purchase and redeem shares of the Fund on days the Fund is open for business.
Tax Information
The Fund expects to be treated as a partnership for U.S. federal income tax purposes, and does not expect to make regular distributions (other than in redemption of Fund shares) to shareholders which are generally the participating insurance companies investing in the Fund through separate accounts or Qualified Plans or certain other eligible investors authorized by the Distributor. You should consult with the participating insurance company that issued your Contract, plan sponsor or other eligible investor through which your investment in the Fund is made regarding the U.S. federal income taxation of your investment.
Prospectus 2026
7
Columbia Variable Portfolio – Large Cap Index Fund
Summary of the Fund (continued)
Payments to Broker-Dealers and Other Financial Intermediaries
If you make allocations to the Fund, the Fund, its Distributor or other related companies may pay participating insurance companies or other financial intermediaries for the allocation (sale) of Fund shares and related services in connection with such allocations to the Fund. These payments may create a conflict of interest by influencing the participating insurance company, other financial intermediary or your salesperson to recommend an allocation to the Fund over another fund or other investment option. Ask your financial advisor or salesperson or visit your financial intermediary’s website for more information.
8
Prospectus 2026
Columbia Variable Portfolio – Large Cap Index Fund
More Information About the Fund
Investment Objective
Columbia Variable Portfolio – Large Cap Index Fund (the Fund) seeks to provide shareholders with long-term capital appreciation. Only shareholders can change the Fund’s investment objective. Because any investment involves risk, there is no assurance the Fund’s investment objective will be achieved.
Principal Investment Strategies
Under normal circumstances, the Fund invests at least 80% of its net assets (plus the amount of any borrowings for investment purposes) in common stocks that comprise the Standard & Poor's (S&P) 500® Index (the Index).
The Fund may invest in derivatives, such as futures (including equity index futures), for cash equitization purposes.
Different common stocks have different weightings in the Index, depending on the amount of stock outstanding and the stock’s current price. In seeking to match the performance of the Index, Columbia Management Investment Advisers, LLC (the Investment Manager) attempts to allocate the Fund’s assets among common stocks in approximately the same weightings as the Index. This is referred to as a passive or indexing approach to investing. As a result of the Fund’s indexing approach to investing, the Fund will typically emphasize within the portfolio those economic sectors emphasized by the Index, such as the information technology sector. The Fund may buy shares of Ameriprise Financial, Inc., an affiliate of the Investment Manager, which is currently included in the Index, subject to certain restrictions.
The Fund attempts to achieve at least a 95% correlation between the performance of the Index and the Fund’s investment results, before fees and expenses. A correlation of 1.00 means the return of the Fund can be completely explained by the return of the Index. The Fund’s ability to track the Index is affected by, among other things, transaction costs and other expenses (which the Index does not incur), changes in the composition of the Index, changes in the number of shares issued by the companies represented in the Index, and by the timing and amount of Fund shareholder purchases and redemptions.
In the event a correlation of 0.95 or better is not achieved, the Fund’s Board of Trustees will consider alternative arrangements.
The Fund may change its target Index for a different index if the current Index is discontinued or if the Board believes a different index would better enable the Fund to match the performance of the market segment represented by the current Index. The substitute index will measure the same general segment of the market as the current Index.
The Investment Manager may sell a stock when the stock’s percentage weighting in the index is reduced, when the stock is removed from the index, if the timing of cash flows in and out of the Fund requires it to sell a security, corporate actions have affected the issuer (such as corporate reorganizations, mergers or acquisitions) or for other reasons.
Although index funds, by their nature, tend to be tax-efficient investments, the Fund generally is managed without regard to tax efficiency.
The Fund may operate as non-diversified when the Index is non-diversified. A non-diversified fund can invest a greater percentage of its assets in the securities of fewer issuers than can a diversified fund.
The Fund’s investment policy with respect to 80% of its net assets may be changed by the Fund’s Board of Trustees without shareholder approval as long as shareholders are given 60 days’ advance written notice of the change.
Principal Risks
An investment in the Fund involves risks, including Correlation/Tracking Error Risk, Passive Investment Risk, Large-Cap Stock Risk, Market Risk, and Sector Risk, among others. Descriptions of these and other principal risks of investing in the Fund are provided below. There is no assurance that the Fund will achieve its investment objective and you may lose money. The value of the Fund’s holdings may decline, and the Fund’s net asset value (NAV) and share price may go down. An investment in the Fund is not a bank deposit and is not insured or guaranteed by the Federal Deposit Insurance Corporation or any other government agency. The significance of any specific risk to an
Prospectus 2026
9
Columbia Variable Portfolio – Large Cap Index Fund
More Information About the Fund (continued)
investment in the Fund will vary over time depending on the composition of the Fund's portfolio, market conditions, and other factors. You should read all of the risk information below carefully, because any one or more of these risks may result in losses to the Fund.
Correlation/Tracking Error Risk. The Fund’s value will generally decline when the performance of the securities within the Index declines. A number of factors may affect the Fund’s ability to achieve a high degree of correlation with the Index, and there is no guarantee that the Fund will achieve a high degree of correlation. Failure to achieve a high degree of correlation may prevent the Fund from achieving its investment objective. The factors that may adversely affect the Fund’s correlation with the Index include, among others, the size of the Fund’s portfolio, fees, expenses, transaction costs, income items, valuation methodology, accounting standards, the effectiveness of sampling techniques (if applicable), changes in the Index and disruptions or illiquidity in the markets for the securities or other instruments in which the Fund invests. While the Fund typically seeks to track the performance of the Index by investing all, or substantially all, of its assets in the components of the Index in approximately the same proportion as their weighting in the Index, at times, the Fund may not have investment exposure to all components of the Index, or its weighting of investment exposure to such components may be different from that of the Index. In addition, the Fund may invest in securities or other instruments not included in the Index. The Fund may take or refrain from taking investment positions for various reasons, such as tax efficiency purposes, or to comply with regulatory restrictions, which may negatively affect the Fund’s correlation with the Index. The Fund may also be subject to large movements of assets into and out of the Fund, potentially resulting in the Fund being over- or under-exposed to certain components of the Index and may be impacted by Index reconstitutions and Index rebalancing events. Holding cash balances may detract from the Fund’s ability to track the Index. In addition, the Fund’s NAV may deviate from the Index if the Fund fair values a portfolio security at a price other than the price used by the Index for that security. The Fund also bears management and other expenses and transaction costs in trading securities or other instruments, which the Index does not bear. The Fund, unlike the Index, is subject to regulatory requirements that can limit the Fund’s investments relative to what the Index can hold. The Fund, unlike the Index, is subject to Office of Foreign Assets Control and other regulatory restrictions, including, for example, restrictions on the ability of the Fund to invest in or hold certain securities. If the Fund is restricted from investing in or holding a security that was a component of the Index, and the Index did not remove such security, timely or at all, the Fund’s ability to track the Index could be negatively impacted. Accordingly, the Fund’s performance will likely fail to match the performance of the Index, after taking expenses into account, as well as regulatory limitations. Any of these factors could decrease correlation between the performance of the Fund and the Index and may hinder the Fund’s ability to meet its investment objective. It is not possible to invest directly in an index.
Derivatives Risk. Derivatives may involve significant risks. Derivatives are financial instruments, traded on an exchange or in the over-the-counter (OTC) markets, with a value in relation to, or derived from, the value of an underlying asset(s) (such as a security, commodity or currency) or other reference, such as an index, rate or other economic indicator (each an underlying reference). Derivatives may include those that are privately placed or otherwise exempt from SEC registration, including certain Rule 144A eligible securities. Derivatives could result in Fund losses if the underlying reference does not perform as anticipated. Use of derivatives is a highly specialized activity that can involve investment techniques, risks, and tax planning different from those associated with more traditional investment instruments. The Fund’s derivatives strategy may not be successful, and use of certain derivatives could result in substantial, potentially unlimited, losses to the Fund regardless of the Fund’s actual investment. A relatively small movement in the price, rate or other economic indicator associated with the underlying reference may result in substantial losses for the Fund. Derivatives may be more volatile than other types of investments. Derivatives can increase the Fund’s risk exposure to underlying references and their attendant risks, including the risk of an adverse credit event associated with the underlying reference (credit risk), the risk of an adverse movement in the value, price or rate of the underlying reference (market risk), the risk of an adverse movement in the value of underlying currencies (foreign currency risk) and the risk of an adverse movement in underlying interest rates (interest rate risk). Derivatives may expose the Fund to additional risks, including the risk of loss due to a derivative position that is imperfectly correlated with the underlying reference it is intended to hedge or replicate (correlation risk), the risk that a counterparty will fail to perform as agreed (counterparty risk), the risk that a hedging strategy may fail to mitigate losses, and may offset gains (hedging risk), the risk that the return on an investment may not keep pace with inflation (inflation risk), the risk that losses may be greater than the amount
10
Prospectus 2026
Columbia Variable Portfolio – Large Cap Index Fund
More Information About the Fund (continued)
invested (leverage risk), the risk that the Fund may be unable to sell an investment at an advantageous time or price (liquidity risk), the risk that the investment may be difficult to value (pricing risk), and the risk that the price or value of the investment fluctuates significantly over short periods of time (volatility risk). The value of derivatives may be influenced by a variety of factors, including national and international political and economic developments. Potential changes to the regulation of the derivatives markets may make derivatives more costly, may limit the market for derivatives, or may otherwise adversely affect the value or performance of derivatives.
Derivatives Risk – Futures Contracts Risk. A futures contract is an exchange-traded derivative transaction between two parties in which a buyer (holding the “long” position) agrees to pay a fixed price (or rate) at a specified future date for delivery of an underlying reference from a seller (holding the “short” position). The seller hopes that the market price on the delivery date is less than the agreed upon price, while the buyer hopes for the contrary. Certain futures contract markets are highly volatile, and futures contracts may be illiquid. Futures exchanges may limit fluctuations in futures contract prices by imposing a maximum permissible daily price movement. The Fund may be disadvantaged if it is prohibited from executing a trade outside the daily permissible price movement. At or prior to maturity of a futures contract, the Fund may enter into an offsetting contract and may incur a loss to the extent there has been adverse movement in futures contract prices. The liquidity of the futures markets depends on participants entering into offsetting transactions rather than making or taking delivery. To the extent participants make or take delivery, liquidity in the futures market could be reduced. Positions in futures contracts may be closed out only on the exchange on which they were entered into or through a linked exchange, and no secondary market exists for such contracts. Futures positions are marked to market each day, and variation margin payment must be paid to or by the Fund. Because of the low margin deposits normally required in futures trading, it is possible that the Fund may employ a high degree of leverage in the portfolio. As a result, a relatively small price movement in a futures contract may result in substantial losses to the Fund, exceeding the amount of the margin paid. For certain types of futures contracts, losses are potentially unlimited. Futures markets are highly volatile, and the use of futures may increase the volatility of the Fund’s NAV. Futures contracts executed (if any) on foreign exchanges may not provide the same protection as U.S. exchanges. Futures contracts can increase the Fund’s risk exposure to underlying references and their attendant risks, such as credit risk, market risk, foreign currency risk and interest rate risk, while potentially exposing the Fund to correlation risk, counterparty risk, hedging risk, inflation risk, leverage risk, liquidity risk, pricing risk and volatility risk.
■
An equity future is a derivative that is an agreement for the contract holder to buy or sell a specified amount of an individual equity, a basket of equities, or the securities in an equity index on a specified date at a predetermined price.
Equity Securities Risk. Investments in equity securities represent ownership in a company that fluctuates in value with changes in the company’s financial condition. Equity markets may experience significant volatility at times and may fall sharply in response to adverse events. Certain segments of the equity market may react differently than other segments and U.S. markets may react differently than foreign markets. Individual equity prices also may experience dramatic movements in price. Price movements may result from factors affecting individual companies, sectors, or industries selected for the Fund’s portfolio or the securities market as a whole, including periods of slower growth or recessionary economic conditions, future expectations of poor economic conditions, changes in political or social conditions, and lack of investor confidence. In addition, individual equity interests may be adversely affected by factors such as reduced sales, increased costs, or a negative outlook for the future performance of the company. As compared with preferred stock and debt, common stock generally involves greater risk and has lower priority when liquidation, bankruptcy, and dividend payments are made. Preferred stock may be subordinated to bonds or other debt instruments in a company’s capital structure and is typically less liquid than common stock.
Issuer Risk. An issuer in which the Fund invests or to which it has exposure may perform poorly or below expectations, and the value of its securities may therefore decline, which may negatively affect the Fund’s performance. Underperformance of an issuer may be caused by poor management decisions, competitive pressures, breakthroughs in technology, reliance on suppliers, labor problems or shortages, corporate restructurings, fraudulent disclosures, natural disasters, military confrontations and actions, war, other conflicts, terrorism, disease/virus outbreaks, epidemics or other events, conditions and factors which may impair the value of your investment in the Fund.
Prospectus 2026
11
Columbia Variable Portfolio – Large Cap Index Fund
More Information About the Fund (continued)
■
Large-Cap Stock Risk. Investments in larger companies may involve certain risks associated with their larger size. For instance, larger companies may be less able to respond quickly to new competitive challenges, such as changes in consumer tastes or innovation from smaller competitors. Also, larger companies are sometimes less able to achieve as high growth rates as successful smaller companies, especially during extended periods of economic expansion.
Market Risk. The Fund may incur losses due to declines in the value of one or more securities in which it invests. These declines may be due to factors affecting a particular issuer, or the result of, among other things, political, regulatory, market, economic or social developments affecting the relevant market(s) more generally. In addition, turbulence in financial markets and reduced liquidity in equity, credit and/or fixed income markets may negatively affect many issuers, which could adversely affect the Fund’s ability to price or value hard-to-value assets in thinly traded and closed markets and could cause significant redemptions and operational challenges. Global economies and financial markets are increasingly interconnected, and conditions and events in one country, region or financial market may adversely impact issuers in a different country, region or financial market. These risks may be magnified if certain events or developments adversely interrupt the global supply chain; in these and other circumstances, such risks might affect companies worldwide. As a result, local, regional or global events such as terrorism, war, other conflicts, natural disasters, disease/virus outbreaks and epidemics or other public health issues, recessions, depressions or other events – or the potential for such events – could have a significant negative impact on global economic and market conditions.
The large-scale invasion of Ukraine by Russia in February 2022 has resulted in sanctions and market disruptions, including declines in regional and global stock markets, unusual volatility in global commodity markets and significant devaluations of Russian currency. In addition, the Iranian conflict that commenced in February 2026 may result in similar, and potentially more severe, disruptions. Escalation of hostilities in the Middle East region could disrupt energy production or transportation, including through key shipping routes, which may lead to increased volatility in energy and other commodity prices. The extent and duration of these conflicts are impossible to predict but could continue to be significant. Market disruption caused by these conflicts, and any countermeasures or responses thereto (including international sanctions, a downgrade in a country’s credit rating, purchasing and financing restrictions, boycotts, tariffs, changes in consumer or purchaser preferences, cyberattacks and espionage) could continue to have severe adverse impacts on regional and/or global securities and commodities markets, including markets for oil and natural gas. These impacts may include reduced market liquidity, distress in credit markets, further disruption of global supply chains, increased risk of inflation, and limited access to investments in certain international markets and/or issuers. These developments and other related events could negatively impact Fund performance.
Non-Diversified Fund Risk. The Fund is passively managed to track an unaffiliated index, and the Fund may hold a non-diversified portfolio to the extent that its index’s holdings represent a non-diversified portfolio. When holding a non-diversified portfolio, it may invest a greater percentage of its total assets in the securities of fewer issuers than a “diversified” fund. This increases the risk that a change in the value of any one investment held by the Fund could affect the overall value of the Fund more than it would affect that of a diversified fund holding a greater number of investments. Accordingly, the Fund's value will likely be more volatile than the value of a more diversified fund.
Passive Investment Risk. The Fund is not actively managed and may be affected by a general decline in market segments related to its Index’s investment exposures. The Fund invests in securities or instruments included in, or believed by the portfolio managers to be representative of, the Index regardless of their investment merits. The Fund does not seek temporary defensive positions when markets decline or appear overvalued.
Sector Risk. At times, the Fund may have a significant portion of its assets invested in securities of companies conducting business in a related group of industries within one or more economic sectors, including the information technology sector. The Fund generally invests in issuers, including to concentrate its investments in issuers conducting business in a related group of industries, to approximately the same extent as the Index. Companies in the same sector may be similarly affected by economic, regulatory, political or market events or conditions, which may make the Fund vulnerable to unfavorable developments in that group of industries or economic sector.
12
Prospectus 2026
Columbia Variable Portfolio – Large Cap Index Fund
More Information About the Fund (continued)
■
Information Technology Sector. The Fund is vulnerable to the particular risks that may affect companies in the information technology sector. Companies in the information technology sector are subject to certain risks, including the risk that new services, equipment or technologies will not be accepted by consumers and businesses or will become rapidly obsolete. Performance of such companies may be affected by factors including obtaining and protecting patents (or the failure to do so) and significant competitive pressures, including aggressive pricing of their products or services, new market entrants, competition for market share and short product cycles due to an accelerated rate of technological developments. Such competitive pressures may lead to limited earnings and/or falling profit margins. As a result, the value of their securities may fall or fail to rise. In addition, many information technology sector companies have limited operating histories and prices of these companies’ securities historically have been more volatile than other securities, especially over the short term. Some companies in the information technology sector are facing increased government and regulatory scrutiny and may be subject to adverse government or regulatory action, which could negatively impact the value of their securities.
Additional Investment Strategies and Policies
This section describes certain investment strategies and policies that the Fund may utilize in pursuit of its investment objective and some additional factors and risks involved with investing in the Fund.
Investment Guidelines
As a general matter, and except as specifically described in the discussion of the Fund's principal investment strategies in this prospectus or as otherwise required by the Investment Company Act of 1940, as amended (the 1940 Act), the rules and regulations thereunder and any applicable exemptive relief, whenever an investment policy or limitation states a percentage of the Fund's assets that may be invested in any security or other asset or sets forth a policy regarding an investment standard, compliance with that percentage limitation or standard will be determined solely at the time of the Fund's investment in the security or asset.
Holding Other Kinds of Investments
The Fund may hold other investments that are not part of its principal investment strategies. These investments and their risks are described below and/or in the Statement of Additional Information (SAI). The Fund may choose not to invest in certain securities described in this prospectus and in the SAI, although it has the ability to do so. Information on the Fund’s holdings can be found in the Fund’s Form N-CSR or by visiting columbiathreadneedleus.com.
Transactions in Derivatives
The Fund may enter into derivative transactions or otherwise have exposure to derivative transactions through underlying investments. Derivatives are financial contracts whose values are, for example, based on (or “derived” from) traditional securities (such as a stock or bond), assets (such as a commodity like gold or a foreign currency), reference rates (such as the Secured Overnight Financing Rate (commonly known as SOFR)) or market indices (such as the Standard & Poor’s 500® Index). The use of derivatives is a highly specialized activity which involves investment techniques and risks different from those associated with ordinary portfolio securities transactions. Derivatives involve special risks and may result in losses or may limit the Fund’s potential gain from favorable market movements. Derivative strategies often involve leverage, which may exaggerate a loss, potentially causing the Fund to lose more money than it would have lost had it invested in the underlying security or other asset directly. The values of derivatives may move in unexpected ways, especially in unusual market conditions, and may result in increased volatility in the value of the derivative and/or the Fund’s shares, among other consequences. Other risks arise from the Fund’s potential inability to terminate or to sell derivative positions. A liquid secondary market may not always exist for the Fund’s derivative positions at times when the Fund might wish to terminate or to sell such positions. Over-the-counter instruments (investments not traded on an exchange) may be illiquid, and transactions in derivatives traded in the over-the-counter market are subject to the risk that the other party will not meet its obligations. The use of derivatives also involves the risks of mispricing or improper valuation and that changes in the value of the derivative may not correlate perfectly with the underlying security, asset, reference rate or index. The
Prospectus 2026
13
Columbia Variable Portfolio – Large Cap Index Fund
More Information About the Fund (continued)
Fund also may not be able to find a suitable derivative transaction counterparty, and thus may be unable to engage in derivative transactions when it is deemed favorable to do so, or at all. The U.S. government and the European Union (and some other jurisdictions) have enacted regulations and similar requirements that prescribe clearing, margin, reporting and registration requirements for participants in the derivatives market. These requirements are evolving and their ultimate impact on the Fund remains unclear, but such impact could include restricting and/or imposing significant costs or other burdens upon the Fund’s participation in derivatives transactions. Additionally, regulations governing the use of derivatives by registered investment companies, such as the Fund, require, among other things, that a fund that invests in derivative instruments beyond a specified limited amount apply a value-at-risk-based limit to its portfolio and establish a comprehensive derivatives risk management program. As of the date of this prospectus, the Fund is not required to maintain a comprehensive derivatives risk management program given its more limited use of derivatives. For more information on the risks of derivative investments and strategies, see the SAI.
Affiliated Fund Investing
The Investment Manager or an affiliate serves as investment adviser to funds using the Columbia brand (Columbia Funds), including those that are structured as “fund-of-funds”, and provides asset-allocation services to (i) shareholders by investing in shares of other Columbia Funds, which may include the Fund (collectively referred to in this section as Underlying Funds), and (ii) discretionary managed accounts (collectively referred to as affiliated products) that invest exclusively in Underlying Funds. These affiliated products, individually or collectively, may own a significant percentage of the outstanding shares of one or more Underlying Funds, and the Investment Manager seeks to balance potential conflicts of interest between the affiliated products and the Underlying Funds in which they invest. The affiliated products’ investment in the Underlying Funds may have the effect of creating economies of scale, possibly resulting in lower expense ratios for the Underlying Funds, because the affiliated products may own substantial portions of the shares of Underlying Funds. However, redemption of Underlying Fund shares by one or more affiliated products could cause the expense ratio of an Underlying Fund to increase, as its fixed costs would be spread over a smaller asset base. Because of large positions of certain affiliated products, the Underlying Funds may experience relatively large inflows and outflows of cash due to affiliated products’ purchases and sales of Underlying Fund shares. Although the Investment Manager or its affiliate may seek to minimize the impact of these transactions where possible, for example, by structuring them over a reasonable period of time or through other measures, Underlying Funds may experience increased expenses as they buy and sell portfolio securities to manage the cash flow effect related to these transactions. Further, when the Investment Manager or its affiliate structures transactions over a reasonable period of time in order to manage the potential impact of the buy and sell decisions for the affiliated products, those affiliated products, including funds-of-funds, may pay more or less (for purchase activity), or receive more or less (for redemption activity), for shares of the Underlying Funds than if the transactions were executed in one transaction. In addition, substantial redemptions by affiliated products within a short period of time could require the Underlying Fund to liquidate positions more rapidly than would otherwise be desirable, which may have the effect of reducing or eliminating potential gain or causing it to realize a loss. In order to meet such redemptions, an Underlying Fund may be forced to sell its liquid (or more liquid) positions, leaving the Underlying Fund holding, post-redemption, a relatively larger position in illiquid investments (i.e., any investment that the Fund reasonably expects cannot be sold or disposed of in current market conditions in seven calendar days or less without the sale or disposition significantly changing the market value of the investment) or less liquid securities. Substantial redemptions may also adversely affect the ability of the Underlying Fund to implement its investment strategy. The Investment Manager or its affiliate also has a conflict of interest in determining the allocation of affiliated products’ assets among the Underlying Funds, as it earns different fees from the various Underlying Funds.
Investing in Money Market Funds
The Fund may invest cash in, or hold as collateral for certain investments, shares of registered or unregistered money market funds, including funds advised by the Investment Manager or its affiliates. These funds are not insured or guaranteed by the Federal Deposit Insurance Corporation (FDIC) or any other government agency. The Fund and its shareholders indirectly bear a portion of the expenses of any money market fund or other fund in which the Fund may invest.
14
Prospectus 2026
Columbia Variable Portfolio – Large Cap Index Fund
More Information About the Fund (continued)
Investing Defensively
The Fund may from time to time take temporary defensive investment positions that may be inconsistent with the Fund’s principal investment strategies in attempting to respond to adverse market, economic, political, social or other conditions, including, without limitation, investing some or all of its assets in money market instruments or shares of affiliated or unaffiliated money market funds or holding some or all of its assets in cash or cash equivalents. The Fund may take such defensive investment positions for as long a period as deemed necessary.
The Fund may not achieve its investment objective while it is investing defensively. Investing defensively may adversely affect Fund performance. During these times, the portfolio managers may make frequent portfolio holding changes, which could result in increased trading expenses and decreased Fund performance. See also Investing in Money Market Funds above for more information.
Other Strategic and Investment Measures
The Fund may also from time to time take temporary portfolio positions that may or may not be consistent with the Fund’s principal investment strategies in attempting to respond to adverse market, economic, political, social or other conditions, including, without limitation, investing in derivatives, such as forward contracts, futures contracts, options, structured investments and swaps, for various purposes, including among others, investing in particular derivatives in seeking to reduce investment exposures, or in seeking to achieve indirect investment exposures, to a sector, country, region or currency where the Investment Manager believes such positioning is appropriate. The Fund may take such portfolio positions for as long a period as deemed necessary. While the Fund is so positioned, derivatives could comprise a substantial portion of the Fund’s investments and the Fund may not achieve its investment objective. Investing in this manner may adversely affect Fund performance. During these times, the portfolio managers may make frequent portfolio holding changes, which could result in increased trading expenses and decreased Fund performance. For information on the risks of investing in derivatives, see Transactions in Derivatives above.
Portfolio Holdings Disclosure
The Board has adopted policies and procedures that govern the timing and circumstances of disclosure to shareholders and third parties of information regarding the securities owned by the Fund. A description of these policies and procedures is included in the SAI. Fund policy generally permits the disclosure of portfolio holdings information on the Fund's website (columbiathreadneedleus.com) only after a certain amount of time has passed, as described in the SAI.
Purchases and sales of portfolio securities can take place at any time, so the portfolio holdings information available on the Fund's website may not always be current.
Cash Flows
The timing and magnitude of cash inflows from investors buying Fund shares could prevent the Fund from always being fully invested. Conversely, the timing and magnitude of cash outflows to shareholders redeeming Fund shares could require the Fund to sell portfolio securities at less than opportune times or to hold ready reserves of uninvested cash in amounts larger than might otherwise be the case to meet shareholder redemptions. Either situation could adversely impact the Fund’s performance.
Understanding Annual Fund Operating Expenses
The Fund’s annual operating expenses, as presented in the Annual Fund Operating Expenses table in the Fees and Expenses of the Fund section of this prospectus, generally are based on expenses incurred during the Fund’s most recently completed fiscal year, may vary by share class and are expressed as a percentage (expense ratio) of the Fund’s average net assets during that fiscal year. The expense ratios reflect the Fund’s fee arrangements as of the date of this prospectus and, unless indicated otherwise, are based on expenses incurred during the Fund’s most recent fiscal year. The Fund’s assets will fluctuate, but unless indicated otherwise in the Annual Fund Operating Expenses table, no adjustments have been or will be made to the expense ratios to reflect any differences in the Fund’s average net assets between the most recently completed fiscal year and the date of this prospectus or a later date. In general, the Fund’s expense ratios will increase as its net assets decrease, such that the Fund’s actual
Prospectus 2026
15
Columbia Variable Portfolio – Large Cap Index Fund
More Information About the Fund (continued)
expense ratios may be higher than the expense ratios presented in the Annual Fund Operating Expenses table if assets fall. Any commitment by the Investment Manager and/or its affiliates to waive fees and/or cap (reimburse) expenses is expected, in part, to limit the impact of any increase in the Fund’s expense ratios that would otherwise result because of a decrease in the Fund’s assets in the current fiscal year. The Fund’s annual operating expenses are comprised of (i) investment management fees, (ii) distribution and/or service fees, and (iii) other expenses. Management fees do not vary by class, but distribution and/or service fees and other expenses may vary by class.
FUNDamentals
Other Expenses
“Other expenses” consist of the fees the Fund pays to its custodian, transfer agent, auditors, lawyers and trustees, costs relating to compliance and miscellaneous expenses. Generally, these expenses are allocated on a pro rata basis across all share classes. These fees include certain sub-transfer agency and shareholder servicing fees. For more information on these fees, see About Fund Shares and Transactions — Financial Intermediary Compensation.
Fee Waiver/Expense Reimbursement Arrangements and Impact on Past Performance
The Investment Manager and certain of its affiliates have contractually agreed to waive fees and/or reimburse expenses (excluding certain fees and expenses described below) through April 30, 2027, unless sooner terminated at the sole discretion of the Fund's Board, so that the Fund’s net operating expenses, after giving effect to fees waived/expenses reimbursed and any balance credits and/or overdraft charges from the Fund’s custodian, do not exceed the annual rates of:
| Columbia Variable Portfolio – Large Cap Index Fund | |
| Class 1 |
0.25% |
| Class 2 |
0.50% |
| Class 3 |
0.375% |
Under the agreement, the following fees and expenses are excluded from the Fund’s operating expenses when calculating the waiver/reimbursement commitment, and therefore will be paid by the Fund, if applicable: taxes (including foreign transaction taxes), expenses associated with investment in affiliated and non-affiliated pooled investment vehicles (including mutual funds and exchange-traded funds), transaction costs and brokerage commissions, costs related to any securities lending program, dividend expenses associated with securities sold short, inverse floater program fees and expenses, transaction charges and interest on borrowed money, interest, costs associated with shareholder meetings, infrequent and/or unusual expenses and any other expenses the exclusion of which is specifically approved by the Fund’s Board. This agreement may be modified or amended only with approval from all parties.
Effect of Fee Waivers and/or Expense Reimbursements on Past Performance. The Fund’s returns shown in the Performance Information section of this prospectus reflect the effect of any fee waivers and/or reimbursements of Fund expenses by the Investment Manager and/or any of its affiliates that were in place during the performance period shown. Without such fee waivers/expense reimbursements, the Fund’s returns might have been lower.
Primary Service Provider Contracts
The Fund enters into contractual arrangements (Service Provider Contracts) with various service providers, including, among others, the Investment Manager, the Distributor, Columbia Management Investment Services Corp. (the Transfer Agent) and the Fund’s custodian. The Fund’s Service Provider Contracts are solely among the parties thereto. Shareholders are not parties to, or intended to be third-party beneficiaries of, any Service Provider Contracts. Further, this prospectus, the SAI and any Service Provider Contracts are not intended to give rise to any agreement, duty, special relationship or other obligation between the Fund and any investor, or give rise to any contractual, tort or other rights in any individual shareholder, group of shareholders or other person, including any right to assert a
16
Prospectus 2026
Columbia Variable Portfolio – Large Cap Index Fund
More Information About the Fund (continued)
fiduciary or other duty, enforce the Service Provider Contracts against the parties or to seek any remedy thereunder, either directly or on behalf of the Fund. Nothing in the previous sentence should be read to suggest any waiver of any rights under federal or state securities laws.
The Investment Manager, the Distributor, and the Transfer Agent are all affiliates of Ameriprise Financial, Inc. (Ameriprise Financial). They and their affiliates currently provide key services, including investment advisory, administration, distribution, shareholder servicing and transfer agency services, to the Fund and various other funds, including the Columbia Funds, and are paid for providing these services. These service relationships are described below.
The Investment Manager
Columbia Management Investment Advisers, LLC is located at 290 Congress Street, Boston, MA 02210 and serves as investment adviser and administrator to the Columbia Funds. The Investment Manager is a registered investment adviser and a wholly-owned subsidiary of Ameriprise Financial. The Investment Manager’s management experience covers all major asset classes, including equity securities, debt instruments and money market instruments. In addition to serving as an investment adviser to traditional mutual funds, exchange-traded funds and closed-end funds, the Investment Manager acts as an investment adviser for itself, its affiliates, individuals, corporations, retirement plans, private investment companies and financial intermediaries.
Subject to oversight by the Board, the Investment Manager manages the day-to-day operations of the Fund, determining what securities and other investments the Fund should buy or sell and executing portfolio transactions. The Investment Manager may use the research and other capabilities of its affiliates and third parties in managing the Fund’s investments. The Investment Manager is also responsible for overseeing the administrative operations of the Fund, including the general supervision of the Fund’s operations, the coordination of the Fund’s other service providers and the provision of related clerical and administrative services.
The SEC has issued an order that permits the Investment Manager, subject to the approval of the Board, to appoint unaffiliated subadvisers by entering into subadvisory agreements with them, and to change in material respects the terms of those subadvisory agreements, including the fees paid thereunder, for the Fund without first obtaining shareholder approval, thereby avoiding the expense and delays typically associated with obtaining shareholder approval. The Fund furnishes shareholders with information about new subadvisers retained in reliance on the order within 90 days after hiring the subadviser. The Investment Manager and its affiliates may have other relationships, including significant financial relationships, with current or potential subadvisers or their affiliates, which may create certain conflicts of interest. When making recommendations to the Board to appoint or to change a subadviser, or to change the terms of a subadvisory agreement, the Investment Manager discloses to the Board the nature of any such material relationships. The SEC has issued a separate order that permits the Board to approve new subadvisory agreements or material changes to existing subadvisory agreements at a meeting that is not in person, provided that the Trustees are able to participate in the meeting using a means of communication that allows them to hear each other simultaneously during the meeting and other conditions of the order are satisfied. At present, the Investment Manager has not engaged any investment subadviser for the Fund.
The Fund pays the Investment Manager a fee for its management services, which include investment advisory services and administrative services. The fee is calculated as a percentage of the daily net assets of the Fund and is paid monthly. For the Fund’s most recent fiscal year, management services fees paid to the Investment Manager by the Fund amounted to 0.20% of average daily net assets of the Fund, before any applicable reimbursements.
A discussion regarding the basis for the Board’s approval of the renewal of the Fund's management agreement is available in the Fund’s Form N-CSR for the fiscal period ended June 30, 2025.
Portfolio Managers
Information about the portfolio managers primarily responsible for overseeing the Fund’s investments is shown below. The SAI provides additional information about the portfolio managers, including information relating to compensation, other accounts managed by the portfolio managers, and ownership by the portfolio managers of Fund shares.
Prospectus 2026
17
Columbia Variable Portfolio – Large Cap Index Fund
More Information About the Fund (continued)
| Portfolio Management |
Title |
Role with Fund |
Managed Fund Since |
| Christopher Lo, CFA |
Senior Portfolio Manager |
Lead Portfolio Manager |
2014 |
| Shirley Wang, CFA, CPA |
Associate Portfolio Manager |
Portfolio Manager |
September 2025 |
Dr. Lo joined one of the Columbia Management legacy firms or acquired business lines in 1998. Dr. Lo began his investment career in 1998 and earned a B.S. and M.E. from Rensselaer Polytechnic Institute, an M.B.A. from the Stern School of Business at New York University and a doctoral degree in professional studies (DPS) from Pace University, with a concentration in finance and international economics.
Ms. Wang joined one of the Columbia Management legacy firms or acquired business lines in 2002. Ms. Wang began her investment career in 1998 and earned a B.S. in Business Administration from Boston University.
The Distributor
Shares of the Fund are distributed by Columbia Management Investment Distributors, Inc., which is located at 290 Congress Street, Boston, MA 02210. The Distributor is a registered broker-dealer and an indirect, wholly-owned subsidiary of Ameriprise Financial. The Distributor and its affiliates may pay commissions, distribution and service fees and/or other compensation to entities, including Ameriprise Financial affiliates, for selling shares and providing services to investors.
The Transfer Agent
Columbia Management Investment Services Corp. is a registered transfer agent and wholly-owned subsidiary of Ameriprise Financial. The Transfer Agent is located at 290 Congress Street, Boston, MA 02210, and its responsibilities include processing purchases, redemptions and transfers of Fund shares, calculating and paying distributions, maintaining shareholder records, preparing account statements and providing customer service. The Transfer Agent has engaged SS&C GIDS, Inc. to provide various sub-transfer agency services. The Fund pays a service fee to participating insurance companies or other financial intermediaries that provide sub-recordkeeping and other services to Contract owners and the separate accounts. The Transfer Agent may retain as compensation for its services revenues for fees for wire, telephone and redemption orders, account transcripts due the Transfer Agent from Fund shareholders and interest (net of bank charges) earned with respect to balances in accounts the Transfer Agent maintains in connection with its services to the Fund.
Other Roles and Relationships of Ameriprise Financial and its Affiliates — Certain Conflicts of Interest
The Investment Manager, Distributor and Transfer Agent, all affiliates of Ameriprise Financial, provide various services to the Fund and other Columbia Funds for which they are compensated. Ameriprise Financial and its other affiliates may also provide other services to these funds and be compensated for them.
The Investment Manager and its affiliates may provide investment advisory and other services to other clients and customers substantially similar to those provided to the Columbia Funds. These activities, and other financial services activities of Ameriprise Financial and its affiliates, may present actual and potential conflicts of interest and introduce certain investment constraints.
Ameriprise Financial is a major financial services company, engaged in a broad range of financial activities beyond the fund-related activities of the Investment Manager, including, among others, insurance, broker-dealer (sales and trading), asset management, banking and other financial activities. These additional activities may involve multiple advisory, financial, insurance and other interests in securities and other instruments, and in companies that issue securities and other instruments, that may be bought, sold or held by the Columbia Funds.
Conflicts of interest and limitations that could affect a Columbia Fund may arise from, for example, the following:
■
compensation and other benefits received by the Investment Manager and other Ameriprise Financial affiliates related to the management/administration of a Columbia Fund and the sale of its shares;
18
Prospectus 2026
Columbia Variable Portfolio – Large Cap Index Fund
More Information About the Fund (continued)
■
the allocation of, and competition for, investment opportunities among the Fund, other funds and accounts advised/managed by the Investment Manager and other Ameriprise Financial affiliates, or Ameriprise Financial itself and its affiliates;
■
separate and potentially divergent management of a Columbia Fund and other funds and accounts advised/managed by the Investment Manager and other Ameriprise Financial affiliates;
■
regulatory and other investment restrictions on investment activities of the Investment Manager and other Ameriprise Financial affiliates and accounts advised/managed by them;
■
insurance and other relationships of Ameriprise Financial affiliates with companies and other entities in which a Columbia Fund invests;
■
regulatory and other restrictions relating to the sharing of information between Ameriprise Financial and its affiliates, including the Investment Manager, and a Columbia Fund; and
■
insurance companies investing in the Fund may be affiliates of Ameriprise Financial; these affiliated insurance companies, individually and collectively, may hold through separate accounts a significant portion of the Fund's shares and may also invest in separate accounts managed by the Investment Manager that have the same or substantially similar investment objectives and strategies as the Fund.
The Investment Manager and Ameriprise Financial have adopted various policies and procedures that are intended to identify, monitor and address conflicts of interest. However, there is no assurance that these policies, procedures and disclosures will be effective.
Additional information about Ameriprise Financial and the types of conflicts of interest and other matters referenced above is set forth in the Investment Management and Other Services — Other Roles and Relationships of Ameriprise Financial and its Affiliates — Certain Conflicts of Interest section of the SAI. Investors in the Columbia Funds should carefully review these disclosures and consult with their financial advisor if they have any questions.
Certain Legal Matters
Ameriprise Financial and certain of its affiliates are involved, in the normal course of business, in legal proceedings that include regulatory inquiries, arbitration and litigation (including class actions) concerning matters arising in connection with the conduct of their activities as part of a diversified financial services firm. Ameriprise Financial believes that the Fund is not currently the subject of, and that neither Ameriprise Financial nor any of its affiliates are the subject of, any pending legal, arbitration or regulatory proceedings that are likely to have a material adverse effect on the Fund or the ability of Ameriprise Financial or its affiliates to perform under their contracts with the Fund. Information regarding certain pending and settled legal proceedings may be found in the Fund’s Form N-CSR and in the SAI. Additionally, Ameriprise Financial is required to make quarterly (10-Q), annual (10-K) and, as necessary, 8-K filings with the SEC on legal and regulatory matters that relate to Ameriprise Financial and its affiliates. Copies of these filings may be obtained by accessing the SEC website at sec.gov.
Prospectus 2026
19
Columbia Variable Portfolio – Large Cap Index Fund
About Fund Shares and Transactions
Description of the Share Classes
Share Class Features
The Fund offers the classes of shares set forth on the cover of this prospectus. Each share class has its own cost structure and other features. The following summarizes the primary features of the Class 1, Class 2 and Class 3 shares.
| |
Class 1 Shares |
Class 2 Shares |
Class 3 Shares |
| Eligible Investors |
Shares of the Fund are available only to separate accounts of participating insurance companies as underlying investments for variable annuity contracts and/or variable life insurance policies (collectively, Contracts) or qualified pension and retirement plans (Qualified Plans) or other eligible investors authorized by the Distributor. | ||
| Investment Limits |
none |
none |
none |
| Conversion Features |
none |
none |
none |
| Front-End Sales Charges |
none |
none |
none |
| Contingent Deferred Sales Charges (CDSCs) |
none |
none |
none |
| Maximum Distribution and/or Service Fees |
none |
0.25% |
0.125% |
FUNDamentals
Financial Intermediaries
The term “financial intermediary” refers to the insurance company that issued your contract, qualified pension or retirement plan sponsors or the financial intermediary that employs your financial advisor. Financial intermediaries also include broker-dealers and financial advisors as well as firms that employ broker-dealers and financial advisors, including, for example, brokerage firms, banks, investment advisers, third party administrators and other firms in the financial services industry, including Ameriprise Financial and its affiliates.
Distribution and/or Service Fees
Pursuant to Rule 12b-1 under the Investment Company Act of 1940, as amended (the 1940 Act), the Board has approved, and the Fund has adopted, a distribution plan which sets the distribution fees that are periodically deducted from the Fund’s assets for Class 2 and Class 3 shares. The distribution fee for Class 2 shares is 0.25% and the distribution fee for Class 3 shares is 0.125%. These fees are calculated daily, may vary by share class and are intended to compensate the Distributor and/or financial intermediaries for selling shares of the Fund and/or providing services to investors. Because the fees are paid out of the Fund’s assets on an ongoing basis, they will increase the cost of your investment over time.
The Fund will pay these fees to the Distributor and/or to eligible financial intermediaries for as long as the distribution plan continues. The Fund may reduce or discontinue payments at any time.
The Fund pays a service fee to participating insurance companies or other financial intermediaries that provide sub-recordkeeping and other services to Contract owners, Qualified Plan participants and the separate accounts.
Financial Intermediary Compensation
The Distributor, the Investment Manager and their affiliates make payments, from their own resources, to financial intermediaries, primarily to affiliated and unaffiliated insurance companies, for marketing/sales support services relating to the Fund (Marketing Support Payments). Such payments are generally based upon one or more of the following factors: average net assets of the Columbia Funds sold by the Distributor attributable to that financial intermediary; gross sales of the Columbia Funds distributed by the Distributor attributable to that financial intermediary; or a negotiated lump sum payment. While the financial arrangements may vary for each financial intermediary, the Marketing Support Payments to any one financial intermediary are generally between 0.05% and
20
Prospectus 2026
Columbia Variable Portfolio – Large Cap Index Fund
About Fund Shares and Transactions (continued)
0.40% on an annual basis for payments based on average net assets of the Fund attributable to the financial intermediary, and between 0.05% and 0.25% on an annual basis for a financial intermediary receiving a payment based on gross sales of the Columbia Funds attributable to the financial intermediary.
As employee compensation and business unit operating goals at all levels are generally tied to the success of Ameriprise Financial, employees of Ameriprise Financial and its affiliates, including employees of affiliated broker-dealers and insurance companies, are incented to include shares of the Columbia Funds in Contracts offered by affiliated insurance companies. Certain employees, directly or indirectly, receive higher compensation and other benefits as investment in the Columbia Funds increases. In addition, management, sales leaders and other employees may spend more of their time and resources promoting Ameriprise Financial and its subsidiary companies, including the Distributor and the Investment Manager, and the products they offer, including the Fund.
In addition, the Transfer Agent has certain arrangements in place to compensate financial intermediaries, primarily to affiliated and unaffiliated insurance companies, that hold Fund shares through networked and omnibus accounts, including omnibus retirement plans, for services that they provide to beneficial Fund shareholders (Shareholder Services). Shareholder Services and related fees vary by financial intermediary and may include sub-accounting, sub-transfer agency, participant recordkeeping, shareholder or participant reporting, shareholder or participant transaction processing, maintenance of shareholder records, preparation of account statements and provision of customer service, and are not intended to include services that are primarily intended to result in the sale of Fund shares. Payments for Shareholder Services generally are not expected, with certain limited exceptions, to exceed 0.40% of the average aggregate value of the Fund’s shares. Each Fund pays the Transfer Agent a service fee equal to the payments made by the Transfer Agent to participating insurance companies and other financial intermediaries that provide Shareholder Services up to the lesser of the amount charged by the financial intermediary or a contractual asset-based cap. Payments of amounts that exceed the amount paid by the Fund are borne by the Transfer Agent, the Investment Manager and/or their affiliates.
In addition to the payments described above, the Distributor, the Investment Manager and their affiliates typically make other payments or allow promotional incentives to certain broker-dealers to the extent permitted by SEC and Financial Industry Regulatory Authority (FINRA) rules and by other applicable laws and regulations.
Amounts paid by the Distributor, the Investment Manager and their affiliates are paid out of their own resources and do not increase the amount paid by you or the Fund. You can find further details in the SAI about the payments made by the Distributor, the Investment Manager and their affiliates, as well as a list of the financial intermediaries, including Ameriprise Financial affiliates, to which the Distributor, the Investment Manager or their affiliates have agreed to make Marketing Support Payments and fee payments for Shareholder Services.
Your financial intermediary may charge you fees and commissions in addition to those described in this prospectus. You should consult with your financial intermediary and review carefully any disclosure your financial intermediary provides regarding its services and compensation. Depending on the financial arrangement in place at any particular time, a financial intermediary and its financial advisors may have a conflict of interest or financial incentive with respect to recommendations regarding the Fund or any Contract or Qualified Plan that includes the Fund.
Share Price Determination
The price you pay or receive when you buy, sell or transfer shares is the Fund's next determined net asset value (or NAV) per share for a given share class. The Fund calculates the NAV per share for each class of shares of the Fund at the end of each business day, with the value of the Fund's shares based on the total value of all of the securities and other assets that it holds as of such specified time.
Prospectus 2026
21
Columbia Variable Portfolio – Large Cap Index Fund
About Fund Shares and Transactions (continued)
FUNDamentals
NAV Calculation
Each of the Fund's share classes calculates its NAV per share as follows:
NAV per share = (Value of assets of the share class) – (Liabilities of the share class)
Number of outstanding shares of the class
Number of outstanding shares of the class
FUNDamentals
Business Days
A business day is any day that the New York Stock Exchange (NYSE) is open. A business day typically ends at the close of regular trading on the NYSE, usually at 4:00 p.m. Eastern time. If the NYSE is scheduled to close early, the business day will be considered to end as of the time of the NYSE’s scheduled close. The Fund will not treat an intraday unscheduled disruption in NYSE trading or an intraday unscheduled closing as a close of regular trading on the NYSE for these purposes and will price its shares as of the regularly scheduled closing time for that day (typically, 4:00 p.m. Eastern time). Nonetheless, the NAV of Fund shares may be determined at such other time or times (in addition to or in lieu of the time set forth above) as the Fund’s Board may approve or ratify. On holidays and other days when the NYSE is closed, the Fund’s NAV is not calculated and the Fund does not accept buy or sell orders. However, the value of the Fund’s assets may still be affected on such days to the extent that the Fund holds foreign securities that trade on days that foreign securities markets are open.
Equity securities listed on an exchange are typically valued at the closing price or last trade on their primary exchange at the close of business of the NYSE. Equity securities without a readily available closing price or that are not listed on any exchange are typically valued at the mean between the closing bid and asked prices. Other equity securities, debt securities and other assets are valued differently. For instance, bank loans trading in the secondary market are fair valued unless market quotations are readily available, fixed income investments maturing in 60 days or less are valued primarily using the amortized cost method, unless this methodology results in a valuation that does not approximate the market value of these securities, and those maturing in excess of 60 days are valued based on prices obtained from a pricing service, if available (which may represent market values or fair values). Investments in other open-end funds are valued at their published NAVs. The value of the Fund’s portfolio securities is determined in accordance with the valuation policy approved by the Board (the Valuation Policy). Pursuant to Rule 2a-5 under the 1940 Act, the Board has designated the Investment Manager as the Fund’s valuation designee. The Investment Manager, in turn, has authorized its valuation committee to make fair value determinations and to carry out supervisory and certain other functions relating to the valuation of Fund portfolio securities, pursuant to the Valuation Policy.
If a market price is not readily available or is deemed not to reflect market value for a portfolio security, the Investment Manager will determine the price based on a determination of the security's fair value pursuant to the Valuation Policy. In addition, the Investment Manager may use fair valuation techniques to price securities that trade on a foreign exchange when a significant event has occurred after the foreign exchange closes but before the time at which the Fund’s share price is calculated. Foreign exchanges typically close before the time at which Fund share prices are calculated, and may be closed altogether on days when the Fund is open. Such significant events affecting a foreign security may include, but are not limited to: (1) corporate actions, earnings announcements, litigation or other events impacting a single issuer; (2) governmental action that affects securities in one sector or country; (3) natural disasters or armed conflicts affecting a country or region; or (4) significant domestic or foreign market fluctuations. The Fund uses various criteria, including an evaluation of U.S. market moves after the close of foreign markets, in determining whether a foreign security's market price is readily available and reflective of market value and, if not, the fair value of the security.
22
Prospectus 2026
Columbia Variable Portfolio – Large Cap Index Fund
About Fund Shares and Transactions (continued)
Fair valuation may have the effect of reducing stale pricing arbitrage opportunities presented by the pricing of Fund shares. However, when the Investment Manager uses fair valuation to price equity securities, it may value those securities higher or lower than another fund or manager would. Also, fair valuation of Fund holdings may cause the Fund's performance to diverge to a greater degree from the performance of various benchmark indices used to compare the Fund's performance because indices generally do not use fair valuation techniques. Because of the judgment involved in fair valuation decisions, there can be no assurance that the value ascribed to a particular security is accurate. The Fund has retained one or more independent fair valuation pricing services to assist in the fair valuation process for foreign securities.
Futures and options on futures are valued based upon the settlement price as determined by the principal exchange on which they are traded or, in the absence of a settlement price, at the mean of the closing bid and ask. Generally, over-the-counter derivatives, such as swaps and swaptions, are valued based on a price provided by an approved pricing service.
Shareholder Information
Each share class has its own cost structure and other features. Your product may not offer every share class. The Fund encourages you to consult with a financial advisor who can help you with your investment decisions and for more information about the share classes offered by the Fund and available under your product. Shares of the Fund are generally available for purchase only by participating insurance companies in connection with Contracts and Qualified Plan sponsors.
The Fund, the Distributor or the Transfer Agent may refuse any order to buy or transfer shares. If this happens, the Fund will return any money it received, but no interest will be paid on that money.
Shares of the Fund may not be purchased or sold directly by individual Contract owners or participants in a Qualified Plan. When you sell your shares through your Contract or Qualified Plan, the Fund is effectively buying them back. This is called a redemption. The right of redemption may be suspended or payment postponed whenever permitted by applicable laws and regulations, as described under Satisfying Fund Redemption Requests below.
Depending on the context, references to “you” or “your” herein refer either to the holder of a Contract, participant in a Qualified Plan or qualified institutional investor who may select Fund shares to fund his or her investment in the Contract or Qualified Plan or to the participating insurance company as the holder of Fund shares through one or more separate accounts or the Qualified Plan.
Satisfying Fund Redemption Requests
The Fund typically expects to send the redeeming participating insurance company or Qualified Plan sponsor payment for shares within two business days after your trade date. The Fund can suspend redemptions and/or delay payment of redemption proceeds for up to seven days. The Fund can also suspend redemptions and/or delay payment of redemption proceeds in excess of seven days under certain circumstances, including when the NYSE is closed or trading thereon is restricted or during emergency or other circumstances, including as determined by the SEC.
The Fund typically seeks to satisfy redemption requests from cash or cash equivalents held by the Fund, from the proceeds of orders to purchase Fund shares or from the proceeds of sales of Fund holdings effected in the normal course of managing the Fund. However, the Fund may have to sell Fund holdings, including in down markets, to meet heavier than usual redemption requests. For example, under stressed or abnormal market conditions or circumstances, including circumstances adversely affecting the liquidity of the Fund’s investments, the Fund may be more likely to be forced to sell Fund holdings to meet redemptions than under normal market circumstances. In these situations, the Fund’s portfolio managers may have to sell Fund holdings that would not otherwise be sold because, among other reasons, the current price to be received is less than the value of the holdings perceived by the Fund’s portfolio managers. The Fund may also, under certain circumstances (but more likely under stressed or abnormal market conditions or circumstances), borrow money under a credit facility to which the Fund and certain other Columbia Funds are parties or from other Columbia Funds under an interfund lending program (except for closed-end funds and money market funds, which are not eligible to borrow under the program). The Fund and the
Prospectus 2026
23
Columbia Variable Portfolio – Large Cap Index Fund
About Fund Shares and Transactions (continued)
other Columbia Funds are limited as to the amount that each may individually and collectively borrow under the credit facility and the interfund lending program. As a result, borrowings available to the Fund under the credit facility and the interfund lending program might be insufficient, alone or in combination with the other strategies described herein, to satisfy Fund redemption requests. Please see About Fund Investments – Borrowings – Interfund Lending in the SAI for more information about the credit facility and interfund lending program. The Fund is also limited in the total amount it may borrow. The Fund may only borrow to the extent permitted by the 1940 Act, the rules and regulations thereunder, and any exemptive relief available to the Fund, which currently limit Fund borrowings to 33 1/3% of total assets (including any amounts borrowed) less liabilities (other than borrowings), plus an additional 5% of its total assets for temporary purposes (to be repaid within 60 days without extension or renewal), in each case determined at the time the borrowing is made.
In addition, the Fund reserves the right to honor redemption orders in whole or in part with in-kind distributions of Fund portfolio securities instead of cash if the Investment Manager, in its sole discretion, determines it to be in the best interest of the remaining shareholders. Such in-kind distributions typically represent a pro-rata portion of Fund portfolio assets subject to adjustments (e.g., for non-transferable securities, round lots and derivatives). In the event the Fund distributes portfolio securities in kind, shareholders may incur brokerage and other transaction costs associated with converting the portfolio securities into cash. Also, the portfolio securities may increase or decrease in value after they are distributed but before they are converted into cash. For U.S. federal income tax purposes, redemptions paid in securities are generally treated the same as redemptions paid in cash. If, during any 90-day period, you redeem shares in an amount greater than $250,000 or 1% of the Fund’s net assets (whichever is less), and if the Investment Manager determines it to be feasible and appropriate, the Fund may pay the redemption amount above such threshold by an in-kind distribution of Fund portfolio securities. Although shares of the Fund may not be purchased or sold by individual owners of Contracts or Qualified Plans, this policy applies indirectly to Contract and Qualified Plan owners.
Potential Conflicts of Interest – Mixed and Shared Funding
The Fund is available for purchase only through Contracts offered by participating insurance companies, Qualified Plans and other qualified institutional investors authorized by the Distributor. Due to differences in tax treatment and other considerations, the interests of various Contract owners, and the interests of Qualified Plan participants, if any, may conflict. The Fund does not foresee any disadvantages to investors arising from these potential conflicts of interest at this time. Nevertheless, the Board of the Fund intends to monitor events to identify any material irreconcilable conflicts which may arise, and to determine what action, if any, should be taken in response to any conflicts. If such a conflict were to arise, one or more separate accounts might be required to withdraw its investments in the Fund or shares of another mutual fund may be substituted. This might force the Fund to sell securities at disadvantageous prices.
Order Processing
Orders to buy and sell shares of the Fund that are placed by your participating insurance company or Qualified Plan sponsor are processed on business days. Orders received in “good form” by the Transfer Agent or a financial intermediary, including your participating insurance company or Qualified Plan sponsor, before the end of a business day are priced at the NAV per share of the Fund's applicable share class on that day. Orders received after the end of a business day will receive the next business day’s NAV per share. An order is in “good form” if the Transfer Agent or your financial intermediary has all of the information and documentation it deems necessary to effect your order. The market value of the Fund’s investments may change between the time you submit your order and the time the Fund next calculates its NAV per share. The business day that applies to your order is also called the trade date.
There is no sales charge associated with the purchase of Fund shares, but there may be charges associated with your Contract or Qualified Plan. Any charges that apply to your Contract or Qualified Plan, and any charges that apply to separate accounts of participating insurance companies or Qualified Plans that may own shares directly, are described in your separate Contract prospectus or Qualified Plan disclosure documents.
24
Prospectus 2026
Columbia Variable Portfolio – Large Cap Index Fund
About Fund Shares and Transactions (continued)
You may transfer all or part of your investment in the Fund to one or more of the other investment options available under your Contract or Qualified Plan. You may provide instructions to sell any amount allocated to the Fund. Proceeds will be mailed within seven days after your surrender or withdrawal request is received in good form by an authorized agent. The amount you receive may be more or less than the amount you invested.
Please refer to your Contract prospectus or Qualified Plan disclosure documents, as applicable, for more information about transfers as well as surrenders and withdrawals.
Information Sharing Agreements
As required by Rule 22c-2 under the 1940 Act, the Fund or certain of its service providers will enter into information sharing agreements with financial intermediaries, including participating life insurance companies and financial intermediaries that sponsor or offer retirement plans through which shares of the Fund are made available for purchase. Pursuant to Rule 22c-2, financial intermediaries are required, upon request, to: (i) provide shareholder account and transaction information; and (ii) execute instructions from the Fund to restrict or prohibit further purchases of Fund shares by shareholders who have been identified by the Fund as having engaged in transactions that violate the Fund's excessive trading policies and procedures.
Excessive Trading Practices Policy of Non-Money Market Funds
Right to Reject or Restrict Share Transaction Orders — The Fund is intended for investors with long-term investment purposes and is not intended as a vehicle for frequent trading activity (market timing) that is excessive. Investors should transact in Fund shares primarily for investment purposes. The Board has adopted excessive trading policies and procedures that are designed to deter excessive trading by investors (the Excessive Trading Policies and Procedures). The Fund discourages and does not accommodate excessive trading. Investments in a Fund by institutional investors in connection with redemptions in-kind are exempt from the Excessive Trading Policies and Procedures because they generally do not raise market timing or excessive trading concerns. Further discussion about the Fund’s use of redemptions in-kind is available under Satisfying Fund Redemption Requests.
The Fund reserves the right to reject, without any prior notice, any purchase or transfer order for any reason, and will not be liable for any loss resulting from rejected orders. For example, the Fund may in its sole discretion restrict or reject a purchase or transfer order even if the transaction is not subject to the specific limitation described below if the Fund or its agents determine that accepting the order could interfere with efficient management of the Fund's portfolio or is otherwise contrary to the Fund's best interests. The Excessive Trading Policies and Procedures apply equally to purchase or transfer transactions communicated directly to the Transfer Agent and to those received by financial intermediaries.
Specific Buying and Transferring Limitations — If the Fund detects that an investor has made two “material round trips” in any 28-day period, it will generally reject the investor's future purchase orders, including transfer buy orders, involving any Fund.
For these purposes, a “round trip” is a purchase or transfer into the Fund followed by a sale or transfer out of the Fund, or a sale or transfer out of the Fund followed by a purchase or transfer into the Fund. A “material” round trip is one that is deemed by the Fund to be material in terms of its amount or its potential detrimental impact on the Fund. Independent of this limit, the Fund may, in its sole discretion, reject future purchase orders by any person, group or account that appears to have engaged in any type of excessive trading activity.
These limits generally do not apply to automated transactions or transactions by registered investment companies in a “fund-of-funds” structure. These limits do not apply to payroll deduction contributions by retirement plan participants, transactions initiated by a retirement plan sponsor or certain other retirement plan transactions consisting of rollover transactions, loan repayments and disbursements, and required minimum distribution redemptions. They may be modified or rescinded for accounts held by certain retirement plans to conform to plan limits, for considerations relating to the Employee Retirement Income Security Act of 1974 or regulations of the Department of Labor, and for certain asset allocation or wrap programs. Accounts known to be under common ownership or control generally will be counted together, but accounts maintained or managed by a common
Prospectus 2026
25
Columbia Variable Portfolio – Large Cap Index Fund
About Fund Shares and Transactions (continued)
intermediary generally will not be considered to be under common ownership or control. The Fund reserves the right to modify these restrictions at any time without prior notice to shareholders. In addition, the Fund may, in its sole discretion, reinstate trading privileges that have been revoked under the Fund's Excessive Trading Policies and Procedures.
Limitations on the Ability to Detect and Prevent Excessive Trading Practices — The Fund takes various steps designed to detect and prevent excessive trading, including daily review of available shareholder transaction information. However, the Fund receives buy, sell or transfer orders through financial intermediaries, and cannot always know of or reasonably detect excessive trading that may be facilitated by financial intermediaries or by the use of the omnibus account arrangements they offer. Omnibus account arrangements are common forms of holding shares of mutual funds, particularly among certain financial intermediaries such as broker-dealers, retirement plans and variable insurance products. These arrangements often permit financial intermediaries to aggregate their clients' transactions and accounts, and in these circumstances, the identities of the financial intermediary clients that beneficially own Fund shares are often not known to the Fund.
Some financial intermediaries apply their own restrictions or policies to their clients’ transactions and accounts, which may be more or less restrictive than those described here. This may impact the Fund's ability to curtail excessive trading, even where it is identified. For these and other reasons, it is possible that excessive trading may occur despite the Fund's efforts to detect and prevent it.
Although these restrictions and policies involve judgments that are inherently subjective and may involve some selectivity in their application, the Fund seeks to act in a manner that it believes is consistent with the best interests of Fund shareholders in making any such judgments.
Risks of Excessive Trading — Excessive trading creates certain risks to the Fund's long-term shareholders and may create the following adverse effects:
■
negative impact on the Fund's performance;
■
potential dilution of the value of the Fund's shares;
■
interference with the efficient management of the Fund's portfolio, such as the need to maintain undesirably large cash positions, the need to use its line of credit or the need to buy or sell securities it otherwise would not have bought or sold;
■
losses on the sale of investments resulting from the need to sell securities at less favorable prices; and
■
increased brokerage and administrative costs.
To the extent that the Fund invests significantly in foreign securities traded on markets that close before the Fund's valuation time, it may be particularly susceptible to dilution, which may be exacerbated as a result of excessive trading. Because events may occur after the close of foreign markets and before the Fund's valuation time that influence the value of foreign securities, investors may seek to trade Fund shares in an effort to benefit from their understanding of the value of foreign securities as of the Fund's valuation time. This is often referred to as price arbitrage. The Fund has adopted procedures designed to adjust closing market prices of foreign securities under certain circumstances to reflect what the Fund believes to be the fair value of those securities as of its valuation time. To the extent the adjustments do not work fully, investors engaging in price arbitrage may cause dilution in the value of the Fund's shares held by other shareholders.
Similarly, to the extent that the Fund invests significantly in thinly traded securities and other debt instruments that are rated below investment grade (commonly called “high-yield” or “junk” bonds), equity securities of small-capitalization companies, floating rate loans, or tax-exempt or other securities that may trade infrequently, because these securities are often traded infrequently, investors may seek to trade Fund shares in an effort to benefit from their understanding of the value of these securities as of the Fund's valuation time. This is also a type of price arbitrage. Any such frequent trading strategies may interfere with efficient management of the Fund's portfolio to a greater degree than would be the case for mutual funds that invest only, or significantly, in highly liquid securities, in part because the Fund may have difficulty selling these particular investments at advantageous times or prices to satisfy large and/or frequent sell orders. Any successful price arbitrage may also cause dilution in the value of Fund shares held by non-redeeming shareholders.
26
Prospectus 2026
Columbia Variable Portfolio – Large Cap Index Fund
About Fund Shares and Transactions (continued)
Excessive Trading Practices Policy of Columbia Variable Portfolio - Government Money Market Fund
A money market fund is designed to offer investors a liquid cash option that they may buy and sell as often as they wish. Accordingly, the Board has not adopted policies and procedures designed to discourage excessive or short-term trading of Columbia Variable Portfolio - Government Money Market Fund shares. However, since frequent purchases and sales of Columbia Variable Portfolio - Government Money Market Fund shares could in certain instances harm shareholders in various ways, including reducing the returns to long-term shareholders by increasing costs (such as spreads paid to dealers who trade money market instruments with Columbia Variable Portfolio - Government Money Market Fund) and disrupting portfolio management strategies, Columbia Variable Portfolio - Government Money Market Fund reserves the right, but has no obligation, to reject any purchase or transfer transaction at any time. Columbia Variable Portfolio - Government Money Market Fund has no limits on purchase or transfer transactions. In addition, Columbia Variable Portfolio - Government Money Market Fund reserves the right to impose or modify restrictions on purchases, transfers or trading of Fund shares at any time.
Prospectus 2026
27
Columbia Variable Portfolio – Large Cap Index Fund
Distributions and Taxes
Distributions to Shareholders
A mutual fund can make money two ways:
■
It can earn income on its investments. Examples of fund income are interest paid on money market instruments and bonds, and dividends paid on common stocks.
■
A mutual fund can also have capital gains if the value of its investments increases.
In the case of the Fund, because the Fund expects to be treated as a partnership for tax purposes, it is not required to and does not expect to make regular distributions to its shareholders (other than in redemption of Fund shares), but may do so in the sole discretion of the Fund’s Board of Trustees (or its delegates).
Taxes and Your Investment
Taxation of the Fund: The Fund is currently treated and expects to continue to be treated as a partnership that is not a “publicly traded partnership” for U.S. federal income tax purposes. If the Fund were not to qualify for such treatment, the Fund could be subject to U.S. federal income tax at the Fund level, which would reduce the value of an investment in the Fund.
As a partnership that is not a “publicly traded partnership,” the Fund is generally not itself subject to U.S. federal income tax. Instead, each shareholder will be required to take into account for U.S. federal income tax purposes its allocable share of the Fund’s income, gains, losses, deductions, credits, and other tax items, without regard to whether such shareholder has received or will receive corresponding distributions from the Fund. In addition, unlike mutual funds that intend to be treated as regulated investment companies for U.S. federal income tax purposes, the Fund is not required to meet any specific qualifying income or distribution requirements, although to the extent regulated investment companies invest in the Fund, such requirements will be taken into account by the Fund.
Certain Fund income may be subject to tax in other countries, including withholding or other taxes on dividends, interest or capital gains. Tax conventions between certain countries and the United States may reduce or eliminate such taxes. In certain countries the Fund may incur a higher rate of tax on dividends than it would have incurred if the Fund had been treated as a regulated investment company.
Taxation of Fund Shares: Shares of the Fund are only offered to separate accounts of participating insurance companies, Qualified Plans, and certain other eligible persons or plans permitted to hold shares of the Fund pursuant to the applicable U.S. Treasury Regulations without impairing the ability of participating insurance companies to satisfy the diversification requirements of Section 817(h) of the Internal Revenue Code of 1986, as amended. Each participating insurance company, including each participating insurance company that is an affiliate of the Investment Manager, includes in its taxable income any net investment income derived from the investment of assets held in its separate accounts because the insurance company is considered the owner of these assets under federal income tax law. The insurance company may claim certain tax benefits associated with this investment income, which benefits may be greater with respect to the Fund than if the Fund were treated as a regulated investment company for U.S. federal income tax purposes. These benefits, which may include foreign tax credits (which can reduce the insurance company’s U.S. taxes on foreign source income) and the corporate dividends-received deduction (which is a tax deduction for the insurance company attributable to certain dividends received by the Fund), are not passed on to Contract owners since the affiliated insurance company is the owner of the assets under federal tax law and is taxed on the investment income generated by the assets.
Taxation of Variable Annuity Contracts and Variable Life Insurance Policies: Your Contract may qualify for favorable tax treatment. Please refer to your Contract prospectus for more information about the tax implications of your investment in the Contract. As long as your Contract continues to qualify for such favorable tax treatment, you will not be taxed currently on your investment in the Fund through such Contract, even if the Fund makes allocations or distributions to the separate account and/or you change your investment options under the Contract. In order to qualify for such treatment, among other things, the separate accounts of participating insurance companies, which maintain and invest net proceeds from Contracts, must be “adequately diversified.” The Fund intends to operate in such a manner so that a separate account investing only in Fund shares on behalf of a holder of a Contract will be “adequately diversified.” If the Fund does not meet such requirements because its investments are not adequately
28
Prospectus 2026
Columbia Variable Portfolio – Large Cap Index Fund
Distributions and Taxes (continued)
diversified, your Contract could lose its favorable tax treatment, and income and gain allocable to your Contract could be taxable currently to you. This could also occur if Contract holders are found to have an impermissible level of control over the investments underlying their Contracts or if the Fund does not qualify for treatment as a partnership that is not a “publicly traded partnership.” You should consult with the participating insurance company that issued your Contract, plan sponsor, or other eligible investor through which your investment in the Fund is made regarding the U.S. federal income taxation of your investment.
FUNDamentals
Taxes
The information provided above is only a summary of how U.S. federal income taxes may affect your indirect investment in the Fund. It is not intended as a substitute for careful tax planning. Your investment in the Fund may have other tax implications. It does not apply to certain types of investors who may be subject to special rules, including foreign or tax-exempt investors or those holding Fund shares through a tax-advantaged account other than a Contract, such as a 401(k) plan or IRA. Please see the SAI for more detailed tax information. You should consult with your own tax advisor about the particular tax consequences to you of an investment in the Fund, including the effect of any foreign, state and local taxes, and the effect of possible changes in applicable tax laws.
Prospectus 2026
29
Columbia Variable Portfolio – Large Cap Index Fund
Financial Highlights
The financial highlights table is intended to help you understand the Fund’s financial performance for the past five fiscal years or, if shorter, the Fund’s period of operations. Certain information reflects financial results for a single Fund share. Per share net investment income (loss) amounts are calculated based on average shares outstanding during the period. The total return in the table represents the rate that an investor would have earned (or lost) on an investment in the Fund assuming all dividends and distributions had been reinvested. Total return does not reflect any fees and expenses imposed under your Contract and/or Qualified Plan, as applicable; such fees and expenses would reduce the total return for all periods shown. Total return and portfolio turnover are not annualized for periods of less than one year. The ratios of expenses and net investment income are annualized for periods of less than one year. The portfolio turnover rate is calculated without regard to purchase and sales transactions of short-term instruments and certain derivatives, if any. If such transactions were included, the Fund’s portfolio turnover rate may be higher. A zero balance may reflect an amount rounding to less than $0.01 or 0.01%. This information has been audited by PricewaterhouseCoopers LLP, an independent registered public accounting firm, whose report, along with the Fund’s financial statements, is included in the Fund’s Form N-CSR, which is available upon request.
Prospectus 2026
31
Columbia Variable Portfolio – Large Cap Index Fund
Financial Highlights (continued)
| |
Net asset value, beginning of period |
Net investment income |
Net realized and unrealized gain (loss) |
Total from investment operations |
| Class 1 | ||||
| Year Ended 12/31/2025 |
$50.34 |
0.55 |
8.30 |
8.85 |
| Year Ended 12/31/2024 |
$40.37 |
0.52 |
9.45 |
9.97 |
| Year Ended 12/31/2023 |
$32.05 |
0.51 |
7.81 |
8.32 |
| Year Ended 12/31/2022 |
$39.25 |
0.46 |
(7.66) |
(7.20) |
| Year Ended 12/31/2021 |
$30.57 |
0.40 |
8.28 |
8.68 |
| Class 2 | ||||
| Year Ended 12/31/2025 |
$48.69 |
0.40 |
8.00 |
8.40 |
| Year Ended 12/31/2024 |
$39.14 |
0.40 |
9.15 |
9.55 |
| Year Ended 12/31/2023 |
$31.15 |
0.41 |
7.58 |
7.99 |
| Year Ended 12/31/2022 |
$38.24 |
0.37 |
(7.46) |
(7.09) |
| Year Ended 12/31/2021 |
$29.86 |
0.31 |
8.07 |
8.38 |
| Class 3 | ||||
| Year Ended 12/31/2025 |
$49.53 |
0.48 |
8.15 |
8.63 |
| Year Ended 12/31/2024 |
$39.77 |
0.46 |
9.30 |
9.76 |
| Year Ended 12/31/2023 |
$31.61 |
0.46 |
7.70 |
8.16 |
| Year Ended 12/31/2022 |
$38.76 |
0.41 |
(7.56) |
(7.15) |
| Year Ended 12/31/2021 |
$30.23 |
0.35 |
8.18 |
8.53 |
| Notes to Financial Highlights | |
| (a) |
In addition to the fees and expenses that the Fund bears directly, the Fund indirectly bears a pro rata share of the fees and expenses of any other funds in which it invests. Such indirect expenses are not included in the Fund's reported expense ratios. |
| (b) |
Total net expenses include the impact of certain fee waivers/expense reimbursements made by the Investment Manager and certain of its affiliates, if applicable. |
| (c) |
Ratios include interest on collateral expense which is less than 0.01%. |
32
Prospectus 2026
Columbia Variable Portfolio – Large Cap Index Fund
Financial Highlights (continued)
| |
Net asset value, end of period |
Total return |
Total gross expense ratio to average net assets(a) |
Total net expense ratio to average net assets(a),(b) |
Net investment income ratio to average net assets |
Portfolio turnover |
Net assets, end of period (000's) |
| Class 1 | |||||||
| Year Ended 12/31/2025 |
$59.19 |
17.58% |
0.26%(c) |
0.25%(c) |
1.03% |
3% |
$1,113,210 |
| Year Ended 12/31/2024 |
$50.34 |
24.70% |
0.25%(c) |
0.25%(c) |
1.13% |
2% |
$1,062,457 |
| Year Ended 12/31/2023 |
$40.37 |
25.96% |
0.25%(c) |
0.25%(c) |
1.42% |
2% |
$916,315 |
| Year Ended 12/31/2022 |
$32.05 |
(18.34%) |
0.25%(c) |
0.25%(c) |
1.36% |
2% |
$781,574 |
| Year Ended 12/31/2021 |
$39.25 |
28.39% |
0.25%(c) |
0.25%(c) |
1.14% |
5% |
$947,973 |
| Class 2 | |||||||
| Year Ended 12/31/2025 |
$57.09 |
17.25% |
0.51%(c) |
0.50%(c) |
0.78% |
3% |
$331,513 |
| Year Ended 12/31/2024 |
$48.69 |
24.40% |
0.50%(c) |
0.50%(c) |
0.88% |
2% |
$227,913 |
| Year Ended 12/31/2023 |
$39.14 |
25.65% |
0.51%(c) |
0.50%(c) |
1.18% |
2% |
$132,360 |
| Year Ended 12/31/2022 |
$31.15 |
(18.54%) |
0.50%(c) |
0.50%(c) |
1.15% |
2% |
$69,385 |
| Year Ended 12/31/2021 |
$38.24 |
28.07% |
0.50%(c) |
0.50%(c) |
0.89% |
5% |
$43,195 |
| Class 3 | |||||||
| Year Ended 12/31/2025 |
$58.16 |
17.43% |
0.38%(c) |
0.38%(c) |
0.91% |
3% |
$1,014,510 |
| Year Ended 12/31/2024 |
$49.53 |
24.54% |
0.38%(c) |
0.38%(c) |
1.01% |
2% |
$941,800 |
| Year Ended 12/31/2023 |
$39.77 |
25.82% |
0.38%(c) |
0.38%(c) |
1.30% |
2% |
$812,224 |
| Year Ended 12/31/2022 |
$31.61 |
(18.45%) |
0.38%(c) |
0.38%(c) |
1.23% |
2% |
$673,982 |
| Year Ended 12/31/2021 |
$38.76 |
28.22% |
0.38%(c) |
0.38%(c) |
1.01% |
5% |
$858,770 |
Prospectus 2026
33
Columbia Variable Portfolio – Large Cap Index Fund

For More Information
The Fund is generally available only to owners of Contracts issued by participating insurance companies and participants in Qualified Plans. Please refer to your Contract prospectus or Qualified Plan disclosure documents for information about how to buy, sell and transfer shares of the Fund.
Additional Information About the Fund
Additional information about the Fund’s investments is available in the Fund’s annual and semiannual reports to shareholders and in Form N-CSR. In the Fund’s annual report, you will find a discussion of the market conditions and investment strategies that significantly affected the Fund’s performance during its last fiscal year. In the Fund’s Form N-CSR, you will find the Fund’s annual and semiannual financial statements. The SAI also provides additional information about the Fund and its policies. The SAI, which has been filed with the SEC, is legally part of this prospectus (incorporated by reference). To obtain these documents free of charge, to request other information about the Fund and to make shareholder inquiries, please contact the Fund as follows:
By Mail: Columbia Management Investment Services Corp.
P.O. Box 219104
Kansas City, MO 64121-9104
P.O. Box 219104
Kansas City, MO 64121-9104
By Telephone: 800.345.6611
Online: columbiathreadneedleus.com
Reports and other information about the Fund are also available in the EDGAR Database on the SEC’s website at http://www.sec.gov. You can receive copies of this information, for a duplication fee, by electronic request at the following e-mail address: publicinfo@sec.gov.
The investment company registration number of Columbia Funds Variable Series Trust II, of which the Fund is a series, is 811-22127.
Columbia Threadneedle Investments (Columbia Threadneedle) is the global brand name of the Columbia and Threadneedle group of companies.
The Fund is distributed by Columbia Management Investment Distributors, Inc., 290 Congress Street, Boston, MA 02210.
The Fund is distributed by Columbia Management Investment Distributors, Inc., 290 Congress Street, Boston, MA 02210.
© 2026 Columbia Threadneedle. All rights reserved.
PRO7014_12_E01_(05/26)

Columbia Variable Portfolio – Select Mid Cap Growth Fund
Prospectus
May 1, 2026
As with all mutual funds, the Securities and Exchange Commission (SEC) has not approved or disapproved these securities or passed upon the adequacy of this prospectus. Any representation to the contrary is a criminal offense.

Columbia Variable Portfolio – Select Mid Cap Growth Fund
Table of Contents
| 3 | |
| 3 | |
| 3 | |
| 4 | |
| 5 | |
| 7 | |
| 8 | |
| 8 | |
| 8 | |
| 8 | |
| 9 | |
| 9 | |
| 9 | |
| 10 | |
| 13 | |
| 17 | |
| 19 | |
| 19 | |
| 21 | |
| 21 | |
| 21 | |
| 22 | |
| 24 | |
| 29 | |
| 29 | |
| 29 | |
| 31 |
2
Prospectus 2026
Columbia Variable Portfolio – Select Mid Cap Growth Fund
Summary of the Fund
Investment Objective
Columbia Variable Portfolio – Select Mid Cap Growth Fund (the Fund) seeks to provide shareholders with growth of capital.
Fees and Expenses of the Fund
This table describes the fees and expenses that you may pay as an investor in the Fund. The table does not reflect any fees or expenses imposed by your Contract or Qualified Plan, which are disclosed in your separate Contract prospectus or Qualified Plan disclosure documents. If the additional fees or expenses were reflected, the expenses set forth below would be higher.
| Annual Fund Operating Expenses (expenses that you pay each year as a percentage of the value of your investment) | |||
| |
Class 1 |
Class 2 |
Class 3 |
| Management fees |
% |
% |
% |
| Distribution and/or service (12b-1) fees |
% |
% |
% |
| Other expenses(a) |
% |
% |
% |
| Total annual Fund operating expenses(b) |
% |
% |
% |
| Less: Fee waivers and/or expense reimbursements(c) |
( %) |
( %) |
( %) |
| Total annual Fund operating expenses after fee waivers and/or expense reimbursements |
% |
% |
% |
(a)
(b)
(c)
Example
The following example is intended to help you compare the cost of investing in the Fund with the cost of investing in other mutual funds. The example illustrates the hypothetical expenses that you would incur over the time periods indicated, and assumes that:
■
you invest $10,000 in the applicable class of Fund shares for the periods indicated,
■
your investment has a 5% return each year, and
■
the Fund’s total annual operating expenses remain the same as shown in the Annual Fund Operating Expenses table above.
The example does not reflect any fees and expenses that apply to your Contract or Qualified Plan. Inclusion of these charges would increase expenses for all periods shown.
Prospectus 2026
3
Columbia Variable Portfolio – Select Mid Cap Growth Fund
Summary of the Fund (continued)
Since the waivers and/or reimbursements shown in the Annual Fund Operating Expenses table above expire as indicated in the preceding table, they are only reflected in the 1 year example and the first year of the other examples. Although your actual costs may be higher or lower, based on the assumptions listed above, your costs would be:
| |
1 year |
3 years |
5 years |
10 years |
| Class 1 (whether or not shares are redeemed) |
$ |
$ |
$ |
$ |
| Class 2 (whether or not shares are redeemed) |
$ |
$ |
$ |
$ |
| Class 3 (whether or not shares are redeemed) |
$ |
$ |
$ |
$ |
Portfolio Turnover
The Fund may pay transaction costs, such as commissions, when it buys and sells securities (or “turns over” its portfolio). A higher portfolio turnover rate may indicate higher transaction costs. These costs, which are not reflected in annual fund operating expenses or in the example, affect the Fund’s performance. During the most recent fiscal year, the Fund’s portfolio turnover rate was 195 % of the average value of its portfolio.
Principal Investment Strategies
Under normal circumstances, the Fund invests at least 80% of its net assets (plus the amount of any borrowings for investment purposes) in the common stocks of mid-capitalization companies. These companies have market capitalizations in the range of companies in the Russell Midcap® Index (the Capitalization Index), which ranged between $134.5 million and $116.7 billion as of March 31, 2026. The market capitalization range and composition of companies in the Capitalization Index are subject to change. As such, the size of the companies in which the Fund invests may change. The Fund may continue to hold a security even if the company’s market capitalization is no longer within the range of the Capitalization Index. Under normal circumstances, the Fund also invests at least 80% of its net assets (plus the amount of any borrowings for investment purposes) in equity securities of “growth” companies. The Fund considers “growth” companies to be those companies that are either constituents of an index constructed by a third party to identify companies with various characteristics of growth companies, have a higher Institutional Brokers' Estimate System (I/B/E/S) medium-term growth forecast (two year) than the median ranked stock within the company’s GICS sector, or have a higher sales per share historical growth rate (five year) than the median ranked stock within the company’s GICS sector. The third-party broad-based index currently used to identify growth companies is the Russell 3000® Growth Index, although the Fund may change this index without prior notice. The I/B/E/S is a database used by brokers and investors to access the estimates made by stock analysts regarding the future earnings of publicly traded American companies. The I/B/E/S medium term growth forecast is a measure of the average annualized EPS (earnings per share) growth forecast of contributing analysts/estimators for the forthcoming two years. The Fund may at times emphasize one or more sectors in selecting its investments, including the industrials sector.
The Fund may invest up to 20% of its total assets in foreign securities. The Fund may invest directly in foreign securities or indirectly through depositary receipts.
The Fund may invest in special situations, such as companies involved in initial public offerings, tender offers, mergers and other corporate restructurings, and in companies involved in management changes or companies developing new technologies. The Fund typically employs a focused portfolio investing style, which results in fewer holdings than a fund that seeks to achieve its investment objective by investing in a greater number of issuers.
The Fund’s investment strategy may involve the frequent trading of portfolio securities.
4
Prospectus 2026
Columbia Variable Portfolio – Select Mid Cap Growth Fund
Summary of the Fund (continued)
Principal Risks
An investment in the Fund involves risks, including Mid-Cap Stock Risk, Market Risk, Growth Securities Risk, and Focused Portfolio Risk, among others. Descriptions of these and other principal risks of investing in the Fund are provided below. There is no assurance that the Fund will achieve its investment objective and you may lose money. The value of the Fund’s holdings may decline, and the Fund’s net asset value (NAV) and share price may go down. An investment in the Fund is not a bank deposit and is not insured or guaranteed by the Federal Deposit Insurance Corporation or any other government agency. The significance of any specific risk to an investment in the Fund will vary over time depending on the composition of the Fund's portfolio, market conditions, and other factors. You should read all of the risk information below carefully, because any one or more of these risks may result in losses to the Fund.
Active Management Risk. Due to its active management, the Fund could underperform its benchmark index and/or other funds with similar investment objectives and/or strategies.
Depositary Receipts Risk. Depositary receipts are receipts issued by a bank or trust company reflecting ownership of underlying securities issued by foreign companies. Some foreign securities are traded in the form of American Depositary Receipts and/or Global Depositary Receipts. Depositary receipts involve risks similar to the risks associated with investments in foreign securities, including those associated with an issuer’s (and any of its related companies’) country of organization and places of business operations, which may be related to the particular political, regulatory, economic, social and other conditions or events (including, for example, military confrontations and actions, war, other conflicts, terrorism and disease/virus outbreaks and epidemics) occurring in the country and fluctuations in such country’s currency, as well as market risk tied to the underlying foreign company. In addition, holders of depositary receipts may have limited voting rights, may not have the same rights afforded to stockholders of a typical domestic company in the event of a corporate action, such as an acquisition, merger or rights offering, and may experience difficulty in receiving company stockholder communications. There is no guarantee that a financial institution will continue to sponsor a depositary receipt, or that a depositary receipt will continue to trade on an exchange, either of which could adversely affect the liquidity, availability and pricing of the depositary receipt. Changes in foreign currency exchange rates will affect the value of depositary receipts and, therefore, may affect the value of your investment in the Fund.
Equity Securities Risk. Equity securities may experience significant volatility. Such securities may fall sharply in response to adverse events affecting overall markets, a particular industry or sector, or an individual company’s financial condition.
Focused Portfolio Risk. Because the Fund may invest in a limited number of companies, the Fund as a whole is subject to greater risk of loss if any of those securities decline in price.
Foreign Securities Risk. Investments in or exposure to securities of foreign companies may involve heightened risks relative to investments in or exposure to securities of U.S. companies. Investing in securities of foreign companies subjects the Fund to the risks associated with an issuer’s (and any of its related companies’) country of organization and places of business operations, including risks related to political, regulatory, economic, social, diplomatic and other conditions or events (including, for example, military confrontations and actions, war, other conflicts, terrorism and disease/virus outbreaks and epidemics) occurring in the country or region, as well as risks associated with less developed custody and settlement practices. Foreign securities may be more volatile and less liquid than securities of U.S. companies and are subject to the risks associated with potential imposition of economic and other sanctions against a particular foreign country, its nationals or industries or businesses within the country. In addition, foreign governments may impose withholding or other taxes on the Fund’s income, capital gains or proceeds from the disposition of foreign securities, which could reduce the Fund’s return on such securities. The performance of the Fund may also be negatively affected by fluctuations in a foreign currency's strength or weakness relative to the U.S. dollar, particularly to the extent the Fund invests a significant percentage of its assets in foreign securities or other assets denominated in currencies other than the U.S. dollar.
Prospectus 2026
5
Columbia Variable Portfolio – Select Mid Cap Growth Fund
Summary of the Fund (continued)
Frequent Trading Risk. The portfolio managers may actively and frequently trade investments in the Fund's portfolio to carry out its investment strategies. Frequent trading can also mean higher brokerage and other transaction costs, which could reduce the Fund's return. The trading costs associated with portfolio turnover may adversely affect the Fund’s performance.
Growth Securities Risk. Growth securities typically trade at a higher multiple of earnings than other types of equity securities. Accordingly, the market values of growth securities may never reach their expected market value and may decline in price. In addition, growth securities, at times, may not perform as well as value securities or the stock market in general, and may be out of favor with investors for varying periods of time. Growth securities may also be sensitive to movements in interest rates.
Issuer Risk. An issuer in which the Fund invests or to which it has exposure may perform poorly or below expectations, and the value of its securities may therefore decline, which may negatively affect the Fund’s performance. Underperformance of an issuer may be caused by poor management decisions, competitive pressures, breakthroughs in technology, reliance on suppliers, labor problems or shortages, corporate restructurings, fraudulent disclosures, natural disasters, military confrontations and actions, war, other conflicts, terrorism, disease/virus outbreaks, epidemics or other events, conditions and factors which may impair the value of your investment in the Fund.
■
Mid-Cap Stock Risk. Investments in mid-capitalization companies (mid-cap companies) often involve greater risks than investments in larger, more established companies (larger companies) because mid-cap companies tend to have less predictable earnings and may lack the management experience, financial resources, product diversification and competitive strengths of larger companies, and may be less liquid than the securities of larger companies.
Market Risk. The Fund may incur losses due to declines in the value of one or more securities in which it invests. These declines may be due to factors affecting a particular issuer, or the result of, among other things, political, regulatory, market, economic or social developments affecting the relevant market(s) more generally. In addition, turbulence in financial markets and reduced liquidity in equity, credit and/or fixed income markets may negatively affect many issuers, which could adversely affect the Fund’s ability to price or value hard-to-value assets in thinly traded and closed markets and could cause significant redemptions and operational challenges. Global economies and financial markets are increasingly interconnected, and conditions and events in one country, region or financial market may adversely impact issuers in a different country, region or financial market. These risks may be magnified if certain events or developments adversely interrupt the global supply chain; in these and other circumstances, such risks might affect companies worldwide. As a result, local, regional or global events such as terrorism, war, other conflicts, natural disasters, disease/virus outbreaks and epidemics or other public health issues, recessions, depressions or other events – or the potential for such events – could have a significant negative impact on global economic and market conditions.
Sector Risk. At times, the Fund may have a significant portion of its assets invested in securities of companies conducting business in a related group of industries within one or more economic sectors, including the industrials sector. Companies in the same sector may be similarly affected by economic, regulatory, political or market events or conditions, which may make the Fund vulnerable to unfavorable developments in that group of industries or economic sector.
■
Industrials Sector. The Fund is vulnerable to the particular risks that may affect companies in the industrials sector. Companies in the industrials sector are subject to certain risks, including changes in supply and demand for their specific product or service and for industrial sector products in general, including decline in demand for such products due to rapid technological developments and frequent new product introduction. Performance of such companies may be affected by factors including government regulation, world events, economic conditions and risks for environmental damage and product liability claims.
Special Situations Risk. Securities of companies that are involved in an initial public offering or a major corporate event, such as a business consolidation or restructuring, may be exposed to heightened risk because of the high degree of uncertainty that can be associated with such events. Securities issued in initial public offerings often are issued by companies that are in the early stages of development, have a history of little or no revenues and may
6
Prospectus 2026
Columbia Variable Portfolio – Select Mid Cap Growth Fund
Summary of the Fund (continued)
operate at a loss following the offering. It is possible that there will be no active trading market for the securities after the offering, and that the market price of the securities may be subject to significant and unpredictable fluctuations. Certain “special situation” investments are investments in securities or other instruments that may be classified as illiquid or lacking a readily ascertainable fair value. Certain special situation investments prevent ownership interests therein from being withdrawn until the special situation investment, or a portion thereof, is realized or deemed realized, which may negatively impact Fund performance. Investing in special situations may have a magnified effect on the performance of funds with small amounts of assets.
Performance Information
The following bar chart and table show you how the Fund has performed in the past, and can help you understand the risks of investing in the Fund. The bar chart shows how the Fund’s Class 2 share performance has varied for each full calendar year shown. The table below the bar chart compares the Fund’s returns for the periods shown with a broad measure of market performance, as well as another measure of performance for markets in which the Fund may invest.
Except for differences in annual returns resulting from differences in expenses (where applicable), the share classes of the Fund would have substantially similar annual returns because all share classes of the Fund invest in the same portfolio of securities.
The returns shown do not reflect any fees and expenses imposed under your Contract or Qualified Plan and would be lower if they did.
| Year by Year Total Return (%) as of December 31 Each Year |
Best and Worst Quarterly Returns During the Period Shown in the Bar Chart | ||
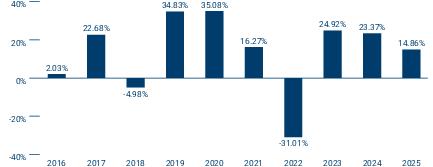 |
|
|
|
| |
|
- | |
Average Annual Total Returns (for periods ended December 31, 2025)
| |
Share Class Inception Date |
1 Year |
5 Years |
10 Years |
| Class 1 |
|
|
|
|
| Class 2 |
|
|
|
|
| Class 3 |
|
|
|
|
| Russell Midcap® Growth Index (reflects no deductions for fees, expenses or taxes) |
|
|
|
|
| Russell 3000® Index (reflects no deductions for fees, expenses or taxes) |
|
|
|
|
Prospectus 2026
7
Columbia Variable Portfolio – Select Mid Cap Growth Fund
Summary of the Fund (continued)
Fund Management
Investment Manager: Columbia Management Investment Advisers, LLC
| Portfolio Management |
Title |
Role with Fund |
Managed Fund Since |
| Daniel Cole, CFA |
Senior Portfolio Manager |
Co-Portfolio Manager |
2021 |
| Wayne Collette, CFA |
Senior Portfolio Manager |
Co-Portfolio Manager |
2023 |
| Dana Kelley, CFA |
Portfolio Manager |
Co-Portfolio Manager |
2023 |
Purchase and Sale of Fund Shares
The Fund is available for purchase through Contracts offered by the separate accounts of participating insurance companies or Qualified Plans or by other eligible investors authorized by Columbia Management Investment Distributors, Inc. (the Distributor). Shares of the Fund may not be purchased or sold by individual owners of Contracts or Qualified Plans. If you are a Contract holder or Qualified Plan participant, please refer to your separate Contract prospectus or Qualified Plan disclosure documents for information about minimum investment requirements and how to purchase and redeem shares of the Fund on days the Fund is open for business.
Tax Information
The Fund expects to be treated as a partnership for U.S. federal income tax purposes, and does not expect to make regular distributions (other than in redemption of Fund shares) to shareholders which are generally the participating insurance companies investing in the Fund through separate accounts or Qualified Plans or certain other eligible investors authorized by the Distributor. You should consult with the participating insurance company that issued your Contract, plan sponsor or other eligible investor through which your investment in the Fund is made regarding the U.S. federal income taxation of your investment.
Payments to Broker-Dealers and Other Financial Intermediaries
If you make allocations to the Fund, the Fund, its Distributor or other related companies may pay participating insurance companies or other financial intermediaries for the allocation (sale) of Fund shares and related services in connection with such allocations to the Fund. These payments may create a conflict of interest by influencing the participating insurance company, other financial intermediary or your salesperson to recommend an allocation to the Fund over another fund or other investment option. Ask your financial advisor or salesperson or visit your financial intermediary’s website for more information.
8
Prospectus 2026
Columbia Variable Portfolio – Select Mid Cap Growth Fund
More Information About the Fund
Investment Objective
Columbia Variable Portfolio – Select Mid Cap Growth Fund (the Fund) seeks to provide shareholders with growth of capital. Only shareholders can change the Fund’s investment objective. Because any investment involves risk, there is no assurance the Fund’s investment objective will be achieved.
Principal Investment Strategies
Under normal circumstances, the Fund invests at least 80% of its net assets (plus the amount of any borrowings for investment purposes) in the common stocks of mid-capitalization companies. These companies have market capitalizations in the range of companies in the Russell Midcap® Index (the Capitalization Index), which ranged between $134.5 million and $116.7 billion as of March 31, 2026. The market capitalization range and composition of companies in the Capitalization Index are subject to change. As such, the size of the companies in which the Fund invests may change. The Fund may continue to hold a security even if the company’s market capitalization is no longer within the range of the Capitalization Index. Under normal circumstances, the Fund also invests at least 80% of its net assets (plus the amount of any borrowings for investment purposes) in equity securities of “growth” companies. The Fund considers “growth” companies to be those companies that are either constituents of an index constructed by a third party to identify companies with various characteristics of growth companies, have a higher Institutional Brokers' Estimate System (I/B/E/S) medium-term growth forecast (two year) than the median ranked stock within the company’s GICS sector, or have a higher sales per share historical growth rate (five year) than the median ranked stock within the company’s GICS sector. The third-party broad-based index currently used to identify growth companies is the Russell 3000® Growth Index, although the Fund may change this index without prior notice. The I/B/E/S is a database used by brokers and investors to access the estimates made by stock analysts regarding the future earnings of publicly traded American companies. The I/B/E/S medium term growth forecast is a measure of the average annualized EPS (earnings per share) growth forecast of contributing analysts/estimators for the forthcoming two years. The Fund may at times emphasize one or more sectors in selecting its investments, including the industrials sector.
The Fund may invest up to 20% of its total assets in foreign securities. The Fund may invest directly in foreign securities or indirectly through depositary receipts. Depositary receipts are receipts issued by a bank or trust company reflecting ownership of underlying securities issued by foreign companies.
The Fund may invest in special situations, such as companies involved in initial public offerings, tender offers, mergers and other corporate restructurings, and in companies involved in management changes or companies developing new technologies. The Fund typically employs a focused portfolio investing style, which results in fewer holdings than a fund that seeks to achieve its investment objective by investing in a greater number of issuers.
The investment manager employs fundamental analysis with risk management analysis in identifying investment opportunities and constructing the Fund’s portfolio.
Columbia Management Investment Advisers, LLC (the Investment Manager) considers, among other factors:
■
overall economic and market conditions; and
■
the financial condition and management of a company, including its competitive position, the quality of its balance sheet and earnings, its future prospects, and the potential for growth and stock price appreciation.
The Investment Manager may sell a security when the security’s price reaches a target set by the Investment Manager; if the Investment Manager believes that there is deterioration in the issuer’s financial circumstances or fundamental prospects; if other investments are more attractive; or for other reasons.
The Fund’s investment strategy may involve the frequent trading of portfolio securities.
The Fund’s investment policies with respect to 80% of its net assets may be changed by the Fund’s Board of Trustees without shareholder approval as long as shareholders are given 60 days’ advance written notice of the change.
Prospectus 2026
9
Columbia Variable Portfolio – Select Mid Cap Growth Fund
More Information About the Fund (continued)
Principal Risks
An investment in the Fund involves risks, including Mid-Cap Stock Risk, Market Risk, Growth Securities Risk, and Focused Portfolio Risk, among others. Descriptions of these and other principal risks of investing in the Fund are provided below. There is no assurance that the Fund will achieve its investment objective and you may lose money. The value of the Fund’s holdings may decline, and the Fund’s net asset value (NAV) and share price may go down. An investment in the Fund is not a bank deposit and is not insured or guaranteed by the Federal Deposit Insurance Corporation or any other government agency. The significance of any specific risk to an investment in the Fund will vary over time depending on the composition of the Fund's portfolio, market conditions, and other factors. You should read all of the risk information below carefully, because any one or more of these risks may result in losses to the Fund.
Active Management Risk. The Fund is actively managed and its performance therefore will reflect, in part, the ability of the portfolio managers to make investment decisions that seek to achieve the Fund’s investment objective. Due to its active management, the Fund could underperform its benchmark index and/or other funds with similar investment objectives and/or strategies.
Depositary Receipts Risk. Depositary receipts are receipts issued by a bank or trust company reflecting ownership of underlying securities issued by foreign companies. Some foreign securities are traded in the form of American Depositary Receipts and/or Global Depositary Receipts. Depositary receipts involve risks similar to the risks associated with investments in foreign securities, including those associated with an issuer’s (and any of its related companies’) country of organization and places of business operations, which may be related to the particular political, regulatory, economic, social and other conditions or events (including, for example, military confrontations and actions, war, other conflicts, terrorism and disease/virus outbreaks and epidemics) occurring in the country and fluctuations in such country’s currency, as well as market risk tied to the underlying foreign company. In addition, holders of depositary receipts may have limited voting rights, may not have the same rights afforded to stockholders of a typical domestic company in the event of a corporate action, such as an acquisition, merger or rights offering, and may experience difficulty in receiving company stockholder communications. There is no guarantee that a financial institution will continue to sponsor a depositary receipt, or that a depositary receipt will continue to trade on an exchange, either of which could adversely affect the liquidity, availability and pricing of the depositary receipt. Changes in foreign currency exchange rates will affect the value of depositary receipts and, therefore, may affect the value of your investment in the Fund.
Equity Securities Risk. Investments in equity securities represent ownership in a company that fluctuates in value with changes in the company’s financial condition. Equity markets may experience significant volatility at times and may fall sharply in response to adverse events. Certain segments of the equity market may react differently than other segments and U.S. markets may react differently than foreign markets. Individual equity prices also may experience dramatic movements in price. Price movements may result from factors affecting individual companies, sectors, or industries selected for the Fund’s portfolio or the securities market as a whole, including periods of slower growth or recessionary economic conditions, future expectations of poor economic conditions, changes in political or social conditions, and lack of investor confidence. In addition, individual equity interests may be adversely affected by factors such as reduced sales, increased costs, or a negative outlook for the future performance of the company. As compared with preferred stock and debt, common stock generally involves greater risk and has lower priority when liquidation, bankruptcy, and dividend payments are made. Preferred stock may be subordinated to bonds or other debt instruments in a company’s capital structure and is typically less liquid than common stock.
Focused Portfolio Risk. The Fund, because it may invest in a limited number of companies, may have more volatility in its NAV and is considered to have more risk than a fund that invests in a greater number of companies because changes in the value of a single security may have a more significant effect, either negative or positive, on the Fund’s NAV. To the extent the Fund invests its assets in fewer securities, the Fund is subject to greater risk of loss if any of those securities decline in price.
Foreign Securities Risk. Investments in or exposure to securities of foreign companies may involve heightened risks relative to investments in or exposure to securities of U.S. companies. For example, foreign markets can be extremely volatile. Foreign securities may also be less liquid, making them more difficult to trade, than securities of
10
Prospectus 2026
Columbia Variable Portfolio – Select Mid Cap Growth Fund
More Information About the Fund (continued)
U.S. companies so that the Fund may, at times, be unable to sell foreign securities at desirable times or prices. Brokerage commissions, custodial costs and other fees are also generally higher for foreign securities. The Fund may have limited or no legal recourse in the event of default with respect to certain foreign securities, including those issued by foreign governments. In addition, foreign governments may impose withholding or other taxes on the Fund’s income, capital gains or proceeds from the disposition of foreign securities, which could reduce the Fund’s return on such securities. In some cases, such withholding or other taxes could potentially be confiscatory. Other risks include: possible delays in the settlement of transactions or in the payment of income; generally less publicly available information about foreign companies; the impact of economic, political, social, diplomatic or other conditions or events (including, for example, military confrontations and actions, war, other conflicts, terrorism and disease/virus outbreaks and epidemics), possible seizure, expropriation or nationalization of a company or its assets or the assets of a particular investor or category of investors; accounting, auditing and financial reporting standards that may be less comprehensive and stringent than those applicable to domestic companies; the imposition of economic and other sanctions against a particular foreign country, its nationals or industries or businesses within the country; and the generally less stringent standard of care to which local agents may be held in the local markets. In addition, it may be difficult to obtain reliable information about the securities and business operations of certain foreign issuers. Governments or trade groups may compel local agents to hold securities in designated depositories that are not subject to independent evaluation. The less developed a country’s securities market is, the greater the level of risks. Economic sanctions may be, and have been, imposed against certain countries, organizations, companies, entities and/or individuals. Economic sanctions and other similar governmental actions could, among other things, effectively restrict or eliminate the Fund’s ability to purchase or sell securities, and thus may make the Fund’s investments in such securities less liquid or more difficult to value. In addition, as a result of economic sanctions, the Fund may be forced to sell or otherwise dispose of investments at inopportune times or prices, which could result in losses to the Fund and increased transaction costs. These conditions may be in place for a substantial period of time and enacted with limited advance notice to the Fund. The risks posed by sanctions against a particular foreign country, its nationals or industries or businesses within the country may be heightened to the extent the Fund invests significantly in the affected country or region or in issuers from the affected country that depend on global markets. Additionally, investments in certain countries may subject the Fund to a number of tax rules, the application of which may be uncertain. Countries may amend or revise their existing tax laws, regulations and/or procedures in the future, possibly with retroactive effect. Changes in or uncertainties regarding the laws, regulations or procedures of a country could reduce the after-tax profits of the Fund, directly or indirectly, including by reducing the after-tax profits of companies located in such countries in which the Fund invests, or result in unexpected tax liabilities for the Fund. The performance of the Fund may also be negatively affected by fluctuations in a foreign currency's strength or weakness relative to the U.S. dollar, particularly to the extent the Fund invests a significant percentage of its assets in foreign securities or other assets denominated in currencies other than the U.S. dollar. Currency rates in foreign countries may fluctuate significantly over short or long periods of time for a number of reasons, including changes in interest rates, imposition of currency exchange controls and economic or political developments in the U.S. or abroad. The Fund may also incur currency conversion costs when converting foreign currencies into U.S. dollars and vice versa.
Frequent Trading Risk. The portfolio managers may actively and frequently trade investments in the Fund's portfolio to carry out its investment strategies. Frequent trading can also mean higher brokerage and other transaction costs, which could reduce the Fund's return. The trading costs associated with portfolio turnover may adversely affect the Fund’s performance.
Growth Securities Risk. Growth securities typically trade at a higher multiple of earnings than other types of equity securities. Accordingly, the market values of growth securities may never reach their expected market value and may decline in price. In addition, growth securities, at times, may not perform as well as value securities or the stock market in general, and may be out of favor with investors for varying periods of time. Growth securities may also be sensitive to movements in interest rates.
Issuer Risk. An issuer in which the Fund invests or to which it has exposure may perform poorly or below expectations, and the value of its securities may therefore decline, which may negatively affect the Fund’s performance. Underperformance of an issuer may be caused by poor management decisions, competitive pressures,
Prospectus 2026
11
Columbia Variable Portfolio – Select Mid Cap Growth Fund
More Information About the Fund (continued)
breakthroughs in technology, reliance on suppliers, labor problems or shortages, corporate restructurings, fraudulent disclosures, natural disasters, military confrontations and actions, war, other conflicts, terrorism, disease/virus outbreaks, epidemics or other events, conditions and factors which may impair the value of your investment in the Fund.
■
Mid-Cap Stock Risk. Securities of mid-cap companies can, in certain circumstances, have more risk than securities of larger companies. For example, mid-cap companies may be more vulnerable to market downturns and adverse business or economic events than larger companies because they may have more limited financial resources and business operations. Mid-cap companies are also more likely than larger companies to have more limited product lines and operating histories and to depend on smaller and generally less experienced management teams. Securities of mid-cap companies may trade less frequently and in smaller volumes and may fluctuate more sharply in value than securities of larger companies. When the Fund takes significant positions in mid-cap companies with limited trading volumes, the liquidation of those positions, particularly in a distressed market, could be difficult and result in Fund investment losses that would affect the value of your investment in the Fund. In addition, some mid-cap companies may not be widely followed by the investment community, which can lower the demand for their stocks.
Market Risk. The Fund may incur losses due to declines in the value of one or more securities in which it invests. These declines may be due to factors affecting a particular issuer, or the result of, among other things, political, regulatory, market, economic or social developments affecting the relevant market(s) more generally. In addition, turbulence in financial markets and reduced liquidity in equity, credit and/or fixed income markets may negatively affect many issuers, which could adversely affect the Fund’s ability to price or value hard-to-value assets in thinly traded and closed markets and could cause significant redemptions and operational challenges. Global economies and financial markets are increasingly interconnected, and conditions and events in one country, region or financial market may adversely impact issuers in a different country, region or financial market. These risks may be magnified if certain events or developments adversely interrupt the global supply chain; in these and other circumstances, such risks might affect companies worldwide. As a result, local, regional or global events such as terrorism, war, other conflicts, natural disasters, disease/virus outbreaks and epidemics or other public health issues, recessions, depressions or other events – or the potential for such events – could have a significant negative impact on global economic and market conditions.
The large-scale invasion of Ukraine by Russia in February 2022 has resulted in sanctions and market disruptions, including declines in regional and global stock markets, unusual volatility in global commodity markets and significant devaluations of Russian currency. In addition, the Iranian conflict that commenced in February 2026 may result in similar, and potentially more severe, disruptions. Escalation of hostilities in the Middle East region could disrupt energy production or transportation, including through key shipping routes, which may lead to increased volatility in energy and other commodity prices. The extent and duration of these conflicts are impossible to predict but could continue to be significant. Market disruption caused by these conflicts, and any countermeasures or responses thereto (including international sanctions, a downgrade in a country’s credit rating, purchasing and financing restrictions, boycotts, tariffs, changes in consumer or purchaser preferences, cyberattacks and espionage) could continue to have severe adverse impacts on regional and/or global securities and commodities markets, including markets for oil and natural gas. These impacts may include reduced market liquidity, distress in credit markets, further disruption of global supply chains, increased risk of inflation, and limited access to investments in certain international markets and/or issuers. These developments and other related events could negatively impact Fund performance.
Sector Risk. At times, the Fund may have a significant portion of its assets invested in securities of companies conducting business in a related group of industries within one or more economic sectors, including the industrials sector. Companies in the same sector may be similarly affected by economic, regulatory, political or market events or conditions, which may make the Fund vulnerable to unfavorable developments in that group of industries or economic sector.
■
Industrials Sector. The Fund is vulnerable to the particular risks that may affect companies in the industrials sector. Companies in the industrials sector are subject to certain risks, including changes in supply and demand for their specific product or service and for industrial sector products in general, including decline in demand for
12
Prospectus 2026
Columbia Variable Portfolio – Select Mid Cap Growth Fund
More Information About the Fund (continued)
such products due to rapid technological developments and frequent new product introduction. Performance of such companies may be affected by factors including government regulation, world events, economic conditions and risks for environmental damage and product liability claims.
Special Situations Risk. Securities of companies that are involved in an initial public offering or a major corporate event, such as a business consolidation or restructuring, may be exposed to heightened risk because of the high degree of uncertainty that can be associated with such events. Securities issued in initial public offerings often are issued by companies that are in the early stages of development, have a history of little or no revenues and may operate at a loss following the offering. It is possible that there will be no active trading market for the securities after the offering, and that the market price of the securities may be subject to significant and unpredictable fluctuations. Initial public offerings are subject to many of the same risks as investing in companies with smaller market capitalizations. To the extent the Fund determines to invest in initial public offerings, it may not be able to invest to the extent desired, because, for example, only a small portion (if any) of the securities being offered in an initial public offering are available to the Fund. The investment performance of the Fund during periods when it is unable to invest significantly or at all in initial public offerings may be lower than during periods when the Fund is able to do so. Certain “special situation” investments are investments in securities or other instruments that may be classified as illiquid or lacking a readily ascertainable fair value. Certain special situation investments prevent ownership interests therein from being withdrawn until the special situation investment, or a portion thereof, is realized or deemed realized, which may negatively impact Fund performance. Investing in special situations may have a magnified effect on the performance of funds with small amounts of assets.
Additional Investment Strategies and Policies
This section describes certain investment strategies and policies that the Fund may utilize in pursuit of its investment objective and some additional factors and risks involved with investing in the Fund.
Investment Guidelines
As a general matter, and except as specifically described in the discussion of the Fund's principal investment strategies in this prospectus or as otherwise required by the Investment Company Act of 1940, as amended (the 1940 Act), the rules and regulations thereunder and any applicable exemptive relief, whenever an investment policy or limitation states a percentage of the Fund's assets that may be invested in any security or other asset or sets forth a policy regarding an investment standard, compliance with that percentage limitation or standard will be determined solely at the time of the Fund's investment in the security or asset.
Holding Other Kinds of Investments
The Fund may hold other investments that are not part of its principal investment strategies. These investments and their risks are described below and/or in the Statement of Additional Information (SAI). The Fund may choose not to invest in certain securities described in this prospectus and in the SAI, although it has the ability to do so. Information on the Fund’s holdings can be found in the Fund’s Form N-CSR or by visiting columbiathreadneedleus.com.
Transactions in Derivatives
The Fund may enter into derivative transactions or otherwise have exposure to derivative transactions through underlying investments. Derivatives are financial contracts whose values are, for example, based on (or “derived” from) traditional securities (such as a stock or bond), assets (such as a commodity like gold or a foreign currency), reference rates (such as the Secured Overnight Financing Rate (commonly known as SOFR)) or market indices (such as the Standard & Poor’s 500® Index). The use of derivatives is a highly specialized activity which involves investment techniques and risks different from those associated with ordinary portfolio securities transactions. Derivatives involve special risks and may result in losses or may limit the Fund’s potential gain from favorable market movements. Derivative strategies often involve leverage, which may exaggerate a loss, potentially causing the Fund to lose more money than it would have lost had it invested in the underlying security or other asset directly. The values of derivatives may move in unexpected ways, especially in unusual market conditions, and may result in increased volatility in the value of the derivative and/or the Fund’s shares, among other consequences. Other risks
Prospectus 2026
13
Columbia Variable Portfolio – Select Mid Cap Growth Fund
More Information About the Fund (continued)
arise from the Fund’s potential inability to terminate or to sell derivative positions. A liquid secondary market may not always exist for the Fund’s derivative positions at times when the Fund might wish to terminate or to sell such positions. Over-the-counter instruments (investments not traded on an exchange) may be illiquid, and transactions in derivatives traded in the over-the-counter market are subject to the risk that the other party will not meet its obligations. The use of derivatives also involves the risks of mispricing or improper valuation and that changes in the value of the derivative may not correlate perfectly with the underlying security, asset, reference rate or index. The Fund also may not be able to find a suitable derivative transaction counterparty, and thus may be unable to engage in derivative transactions when it is deemed favorable to do so, or at all. The U.S. government and the European Union (and some other jurisdictions) have enacted regulations and similar requirements that prescribe clearing, margin, reporting and registration requirements for participants in the derivatives market. These requirements are evolving and their ultimate impact on the Fund remains unclear, but such impact could include restricting and/or imposing significant costs or other burdens upon the Fund’s participation in derivatives transactions. Additionally, regulations governing the use of derivatives by registered investment companies, such as the Fund, require, among other things, that a fund that invests in derivative instruments beyond a specified limited amount apply a value-at-risk-based limit to its portfolio and establish a comprehensive derivatives risk management program. As of the date of this prospectus, the Fund is not required to maintain a comprehensive derivatives risk management program given its more limited use of derivatives. For more information on the risks of derivative investments and strategies, see the SAI.
Affiliated Fund Investing
The Investment Manager or an affiliate serves as investment adviser to funds using the Columbia brand (Columbia Funds), including those that are structured as “fund-of-funds”, and provides asset-allocation services to (i) shareholders by investing in shares of other Columbia Funds, which may include the Fund (collectively referred to in this section as Underlying Funds), and (ii) discretionary managed accounts (collectively referred to as affiliated products) that invest exclusively in Underlying Funds. These affiliated products, individually or collectively, may own a significant percentage of the outstanding shares of one or more Underlying Funds, and the Investment Manager seeks to balance potential conflicts of interest between the affiliated products and the Underlying Funds in which they invest. The affiliated products’ investment in the Underlying Funds may have the effect of creating economies of scale, possibly resulting in lower expense ratios for the Underlying Funds, because the affiliated products may own substantial portions of the shares of Underlying Funds. However, redemption of Underlying Fund shares by one or more affiliated products could cause the expense ratio of an Underlying Fund to increase, as its fixed costs would be spread over a smaller asset base. Because of large positions of certain affiliated products, the Underlying Funds may experience relatively large inflows and outflows of cash due to affiliated products’ purchases and sales of Underlying Fund shares. Although the Investment Manager or its affiliate may seek to minimize the impact of these transactions where possible, for example, by structuring them over a reasonable period of time or through other measures, Underlying Funds may experience increased expenses as they buy and sell portfolio securities to manage the cash flow effect related to these transactions. Further, when the Investment Manager or its affiliate structures transactions over a reasonable period of time in order to manage the potential impact of the buy and sell decisions for the affiliated products, those affiliated products, including funds-of-funds, may pay more or less (for purchase activity), or receive more or less (for redemption activity), for shares of the Underlying Funds than if the transactions were executed in one transaction. In addition, substantial redemptions by affiliated products within a short period of time could require the Underlying Fund to liquidate positions more rapidly than would otherwise be desirable, which may have the effect of reducing or eliminating potential gain or causing it to realize a loss. In order to meet such redemptions, an Underlying Fund may be forced to sell its liquid (or more liquid) positions, leaving the Underlying Fund holding, post-redemption, a relatively larger position in illiquid investments (i.e., any investment that the Fund reasonably expects cannot be sold or disposed of in current market conditions in seven calendar days or less without the sale or disposition significantly changing the market value of the investment) or less liquid securities. Substantial redemptions may also adversely affect the ability of the Underlying Fund to implement its investment strategy. The Investment Manager or its affiliate also has a conflict of interest in determining the allocation of affiliated products’ assets among the Underlying Funds, as it earns different fees from the various Underlying Funds.
14
Prospectus 2026
Columbia Variable Portfolio – Select Mid Cap Growth Fund
More Information About the Fund (continued)
Investing in Money Market Funds
The Fund may invest cash in, or hold as collateral for certain investments, shares of registered or unregistered money market funds, including funds advised by the Investment Manager or its affiliates. These funds are not insured or guaranteed by the Federal Deposit Insurance Corporation (FDIC) or any other government agency. The Fund and its shareholders indirectly bear a portion of the expenses of any money market fund or other fund in which the Fund may invest.
Investing Defensively
The Fund may from time to time take temporary defensive investment positions that may be inconsistent with the Fund’s principal investment strategies in attempting to respond to adverse market, economic, political, social or other conditions, including, without limitation, investing some or all of its assets in money market instruments or shares of affiliated or unaffiliated money market funds or holding some or all of its assets in cash or cash equivalents. The Fund may take such defensive investment positions for as long a period as deemed necessary.
The Fund may not achieve its investment objective while it is investing defensively. Investing defensively may adversely affect Fund performance. During these times, the portfolio managers may make frequent portfolio holding changes, which could result in increased trading expenses and decreased Fund performance. See also Investing in Money Market Funds above for more information.
Other Strategic and Investment Measures
The Fund may also from time to time take temporary portfolio positions that may or may not be consistent with the Fund’s principal investment strategies in attempting to respond to adverse market, economic, political, social or other conditions, including, without limitation, investing in derivatives, such as forward contracts, futures contracts, options, structured investments and swaps, for various purposes, including among others, investing in particular derivatives in seeking to reduce investment exposures, or in seeking to achieve indirect investment exposures, to a sector, country, region or currency where the Investment Manager believes such positioning is appropriate. The Fund may take such portfolio positions for as long a period as deemed necessary. While the Fund is so positioned, derivatives could comprise a substantial portion of the Fund’s investments and the Fund may not achieve its investment objective. Investing in this manner may adversely affect Fund performance. During these times, the portfolio managers may make frequent portfolio holding changes, which could result in increased trading expenses and decreased Fund performance. For information on the risks of investing in derivatives, see Transactions in Derivatives above.
Portfolio Holdings Disclosure
The Board has adopted policies and procedures that govern the timing and circumstances of disclosure to shareholders and third parties of information regarding the securities owned by the Fund. A description of these policies and procedures is included in the SAI. Fund policy generally permits the disclosure of portfolio holdings information on the Fund's website (columbiathreadneedleus.com) only after a certain amount of time has passed, as described in the SAI.
Purchases and sales of portfolio securities can take place at any time, so the portfolio holdings information available on the Fund's website may not always be current.
FUNDamentals
Portfolio Holdings Versus the Benchmarks
The Fund does not limit its investments to the securities within its benchmark(s), and accordingly the Fund's holdings may diverge from those of its benchmark(s). In addition, the Fund may invest in securities outside any industry and geographic sectors represented in its benchmark(s). The Fund's weightings in individual securities, and in industry or geographic sectors, may also vary considerably from those of its benchmark(s).
Prospectus 2026
15
Columbia Variable Portfolio – Select Mid Cap Growth Fund
More Information About the Fund (continued)
Cash Flows
The timing and magnitude of cash inflows from investors buying Fund shares could prevent the Fund from always being fully invested. Conversely, the timing and magnitude of cash outflows to shareholders redeeming Fund shares could require the Fund to sell portfolio securities at less than opportune times or to hold ready reserves of uninvested cash in amounts larger than might otherwise be the case to meet shareholder redemptions. Either situation could adversely impact the Fund’s performance.
Understanding Annual Fund Operating Expenses
The Fund’s annual operating expenses, as presented in the Annual Fund Operating Expenses table in the Fees and Expenses of the Fund section of this prospectus, generally are based on expenses incurred during the Fund’s most recently completed fiscal year, may vary by share class and are expressed as a percentage (expense ratio) of the Fund’s average net assets during that fiscal year. The expense ratios reflect the Fund’s fee arrangements as of the date of this prospectus and, unless indicated otherwise, are based on expenses incurred during the Fund’s most recent fiscal year. The Fund’s assets will fluctuate, but unless indicated otherwise in the Annual Fund Operating Expenses table, no adjustments have been or will be made to the expense ratios to reflect any differences in the Fund’s average net assets between the most recently completed fiscal year and the date of this prospectus or a later date. In general, the Fund’s expense ratios will increase as its net assets decrease, such that the Fund’s actual expense ratios may be higher than the expense ratios presented in the Annual Fund Operating Expenses table if assets fall. Any commitment by the Investment Manager and/or its affiliates to waive fees and/or cap (reimburse) expenses is expected, in part, to limit the impact of any increase in the Fund’s expense ratios that would otherwise result because of a decrease in the Fund’s assets in the current fiscal year. The Fund’s annual operating expenses are comprised of (i) investment management fees, (ii) distribution and/or service fees, and (iii) other expenses. Management fees do not vary by class, but distribution and/or service fees and other expenses may vary by class.
FUNDamentals
Other Expenses
“Other expenses” consist of the fees the Fund pays to its custodian, transfer agent, auditors, lawyers and trustees, costs relating to compliance and miscellaneous expenses. Generally, these expenses are allocated on a pro rata basis across all share classes. These fees include certain sub-transfer agency and shareholder servicing fees. For more information on these fees, see About Fund Shares and Transactions — Financial Intermediary Compensation.
Fee Waiver/Expense Reimbursement Arrangements and Impact on Past Performance
The Investment Manager and certain of its affiliates have contractually agreed to waive fees and/or reimburse expenses (excluding certain fees and expenses described below) through April 30, 2027, unless sooner terminated at the sole discretion of the Fund's Board, so that the Fund’s net operating expenses, after giving effect to fees waived/expenses reimbursed and any balance credits and/or overdraft charges from the Fund’s custodian, do not exceed the annual rates of:
| Columbia Variable Portfolio – Select Mid Cap Growth Fund | |
| Class 1 |
0.83% |
| Class 2 |
1.08% |
| Class 3 |
0.955% |
Under the agreement, the following fees and expenses are excluded from the Fund’s operating expenses when calculating the waiver/reimbursement commitment, and therefore will be paid by the Fund, if applicable: taxes (including foreign transaction taxes), expenses associated with investment in affiliated and non-affiliated pooled investment vehicles (including mutual funds and exchange-traded funds), transaction costs and brokerage commissions, costs related to any securities lending program, dividend expenses associated with securities sold
16
Prospectus 2026
Columbia Variable Portfolio – Select Mid Cap Growth Fund
More Information About the Fund (continued)
short, inverse floater program fees and expenses, transaction charges and interest on borrowed money, interest, costs associated with shareholder meetings, infrequent and/or unusual expenses and any other expenses the exclusion of which is specifically approved by the Fund’s Board. This agreement may be modified or amended only with approval from all parties.
Effect of Fee Waivers and/or Expense Reimbursements on Past Performance. The Fund’s returns shown in the Performance Information section of this prospectus reflect the effect of any fee waivers and/or reimbursements of Fund expenses by the Investment Manager and/or any of its affiliates that were in place during the performance period shown. Without such fee waivers/expense reimbursements, the Fund’s returns might have been lower.
Primary Service Provider Contracts
The Fund enters into contractual arrangements (Service Provider Contracts) with various service providers, including, among others, the Investment Manager, the Distributor, Columbia Management Investment Services Corp. (the Transfer Agent) and the Fund’s custodian. The Fund’s Service Provider Contracts are solely among the parties thereto. Shareholders are not parties to, or intended to be third-party beneficiaries of, any Service Provider Contracts. Further, this prospectus, the SAI and any Service Provider Contracts are not intended to give rise to any agreement, duty, special relationship or other obligation between the Fund and any investor, or give rise to any contractual, tort or other rights in any individual shareholder, group of shareholders or other person, including any right to assert a fiduciary or other duty, enforce the Service Provider Contracts against the parties or to seek any remedy thereunder, either directly or on behalf of the Fund. Nothing in the previous sentence should be read to suggest any waiver of any rights under federal or state securities laws.
The Investment Manager, the Distributor, and the Transfer Agent are all affiliates of Ameriprise Financial, Inc. (Ameriprise Financial). They and their affiliates currently provide key services, including investment advisory, administration, distribution, shareholder servicing and transfer agency services, to the Fund and various other funds, including the Columbia Funds, and are paid for providing these services. These service relationships are described below.
The Investment Manager
Columbia Management Investment Advisers, LLC is located at 290 Congress Street, Boston, MA 02210 and serves as investment adviser and administrator to the Columbia Funds. The Investment Manager is a registered investment adviser and a wholly-owned subsidiary of Ameriprise Financial. The Investment Manager’s management experience covers all major asset classes, including equity securities, debt instruments and money market instruments. In addition to serving as an investment adviser to traditional mutual funds, exchange-traded funds and closed-end funds, the Investment Manager acts as an investment adviser for itself, its affiliates, individuals, corporations, retirement plans, private investment companies and financial intermediaries.
Subject to oversight by the Board, the Investment Manager manages the day-to-day operations of the Fund, determining what securities and other investments the Fund should buy or sell and executing portfolio transactions. The Investment Manager may use the research and other capabilities of its affiliates and third parties in managing the Fund’s investments. The Investment Manager is also responsible for overseeing the administrative operations of the Fund, including the general supervision of the Fund’s operations, the coordination of the Fund’s other service providers and the provision of related clerical and administrative services.
The SEC has issued an order that permits the Investment Manager, subject to the approval of the Board, to appoint unaffiliated subadvisers by entering into subadvisory agreements with them, and to change in material respects the terms of those subadvisory agreements, including the fees paid thereunder, for the Fund without first obtaining shareholder approval, thereby avoiding the expense and delays typically associated with obtaining shareholder approval. The Fund furnishes shareholders with information about new subadvisers retained in reliance on the order within 90 days after hiring the subadviser. The Investment Manager and its affiliates may have other relationships, including significant financial relationships, with current or potential subadvisers or their affiliates, which may create certain conflicts of interest. When making recommendations to the Board to appoint or to change a subadviser, or to change the terms of a subadvisory agreement, the Investment Manager discloses to the Board the nature of any such material relationships. The SEC has issued a separate order that permits the Board to approve new subadvisory
Prospectus 2026
17
Columbia Variable Portfolio – Select Mid Cap Growth Fund
More Information About the Fund (continued)
agreements or material changes to existing subadvisory agreements at a meeting that is not in person, provided that the Trustees are able to participate in the meeting using a means of communication that allows them to hear each other simultaneously during the meeting and other conditions of the order are satisfied. At present, the Investment Manager has not engaged any investment subadviser for the Fund.
The Fund pays the Investment Manager a fee for its management services, which include investment advisory services and administrative services. The fee is calculated as a percentage of the daily net assets of the Fund and is paid monthly. For the Fund’s most recent fiscal year, management services fees paid to the Investment Manager by the Fund amounted to 0.82% of average daily net assets of the Fund, before any applicable reimbursements.
A discussion regarding the basis for the Board’s approval of the renewal of the Fund's management agreement is available in the Fund’s Form N-CSR for the fiscal period ended June 30, 2025.
Portfolio Managers
Information about the portfolio managers primarily responsible for overseeing the Fund’s investments is shown below. The SAI provides additional information about the portfolio managers, including information relating to compensation, other accounts managed by the portfolio managers, and ownership by the portfolio managers of Fund shares.
| Portfolio Management |
Title |
Role with Fund |
Managed Fund Since |
| Daniel Cole, CFA |
Senior Portfolio Manager |
Co-Portfolio Manager |
2021 |
| Wayne Collette, CFA |
Senior Portfolio Manager |
Co-Portfolio Manager |
2023 |
| Dana Kelley, CFA |
Portfolio Manager |
Co-Portfolio Manager |
2023 |
Mr. Cole joined the Investment Manager in 2014. Mr. Cole began his investment career in 1993 and earned a B.S. from Guilford College and an M.B.A. in finance from Virginia Polytechnic Institute and State University.
Mr. Collette joined one of the Columbia Management legacy firms or acquired business lines in 2001. Mr. Collette began his investment career in 1996 and earned a B.A. from Brandeis University and an M.B.A. in finance from the Columbia Business School at Columbia University in the City of New York.
Mr. Kelley joined the Investment Manager in 2011. Mr. Kelley began his investment career in 2008 and earned a B.S. in finance from the University of Connecticut.
The Distributor
Shares of the Fund are distributed by Columbia Management Investment Distributors, Inc., which is located at 290 Congress Street, Boston, MA 02210. The Distributor is a registered broker-dealer and an indirect, wholly-owned subsidiary of Ameriprise Financial. The Distributor and its affiliates may pay commissions, distribution and service fees and/or other compensation to entities, including Ameriprise Financial affiliates, for selling shares and providing services to investors.
The Transfer Agent
Columbia Management Investment Services Corp. is a registered transfer agent and wholly-owned subsidiary of Ameriprise Financial. The Transfer Agent is located at 290 Congress Street, Boston, MA 02210, and its responsibilities include processing purchases, redemptions and transfers of Fund shares, calculating and paying distributions, maintaining shareholder records, preparing account statements and providing customer service. The Transfer Agent has engaged SS&C GIDS, Inc. to provide various sub-transfer agency services. The Fund pays a service fee to participating insurance companies or other financial intermediaries that provide sub-recordkeeping and other services to Contract owners and the separate accounts. The Transfer Agent may retain as compensation for its services revenues for fees for wire, telephone and redemption orders, account transcripts due the Transfer Agent from Fund shareholders and interest (net of bank charges) earned with respect to balances in accounts the Transfer Agent maintains in connection with its services to the Fund.
18
Prospectus 2026
Columbia Variable Portfolio – Select Mid Cap Growth Fund
More Information About the Fund (continued)
Other Roles and Relationships of Ameriprise Financial and its Affiliates — Certain Conflicts of Interest
The Investment Manager, Distributor and Transfer Agent, all affiliates of Ameriprise Financial, provide various services to the Fund and other Columbia Funds for which they are compensated. Ameriprise Financial and its other affiliates may also provide other services to these funds and be compensated for them.
The Investment Manager and its affiliates may provide investment advisory and other services to other clients and customers substantially similar to those provided to the Columbia Funds. These activities, and other financial services activities of Ameriprise Financial and its affiliates, may present actual and potential conflicts of interest and introduce certain investment constraints.
Ameriprise Financial is a major financial services company, engaged in a broad range of financial activities beyond the fund-related activities of the Investment Manager, including, among others, insurance, broker-dealer (sales and trading), asset management, banking and other financial activities. These additional activities may involve multiple advisory, financial, insurance and other interests in securities and other instruments, and in companies that issue securities and other instruments, that may be bought, sold or held by the Columbia Funds.
Conflicts of interest and limitations that could affect a Columbia Fund may arise from, for example, the following:
■
compensation and other benefits received by the Investment Manager and other Ameriprise Financial affiliates related to the management/administration of a Columbia Fund and the sale of its shares;
■
the allocation of, and competition for, investment opportunities among the Fund, other funds and accounts advised/managed by the Investment Manager and other Ameriprise Financial affiliates, or Ameriprise Financial itself and its affiliates;
■
separate and potentially divergent management of a Columbia Fund and other funds and accounts advised/managed by the Investment Manager and other Ameriprise Financial affiliates;
■
regulatory and other investment restrictions on investment activities of the Investment Manager and other Ameriprise Financial affiliates and accounts advised/managed by them;
■
insurance and other relationships of Ameriprise Financial affiliates with companies and other entities in which a Columbia Fund invests;
■
regulatory and other restrictions relating to the sharing of information between Ameriprise Financial and its affiliates, including the Investment Manager, and a Columbia Fund; and
■
insurance companies investing in the Fund may be affiliates of Ameriprise Financial; these affiliated insurance companies, individually and collectively, may hold through separate accounts a significant portion of the Fund's shares and may also invest in separate accounts managed by the Investment Manager that have the same or substantially similar investment objectives and strategies as the Fund.
The Investment Manager and Ameriprise Financial have adopted various policies and procedures that are intended to identify, monitor and address conflicts of interest. However, there is no assurance that these policies, procedures and disclosures will be effective.
Additional information about Ameriprise Financial and the types of conflicts of interest and other matters referenced above is set forth in the Investment Management and Other Services — Other Roles and Relationships of Ameriprise Financial and its Affiliates — Certain Conflicts of Interest section of the SAI. Investors in the Columbia Funds should carefully review these disclosures and consult with their financial advisor if they have any questions.
Certain Legal Matters
Ameriprise Financial and certain of its affiliates are involved, in the normal course of business, in legal proceedings that include regulatory inquiries, arbitration and litigation (including class actions) concerning matters arising in connection with the conduct of their activities as part of a diversified financial services firm. Ameriprise Financial believes that the Fund is not currently the subject of, and that neither Ameriprise Financial nor any of its affiliates are the subject of, any pending legal, arbitration or regulatory proceedings that are likely to have a material adverse
Prospectus 2026
19
Columbia Variable Portfolio – Select Mid Cap Growth Fund
More Information About the Fund (continued)
effect on the Fund or the ability of Ameriprise Financial or its affiliates to perform under their contracts with the Fund. Information regarding certain pending and settled legal proceedings may be found in the Fund’s Form N-CSR and in the SAI. Additionally, Ameriprise Financial is required to make quarterly (10-Q), annual (10-K) and, as necessary, 8-K filings with the SEC on legal and regulatory matters that relate to Ameriprise Financial and its affiliates. Copies of these filings may be obtained by accessing the SEC website at sec.gov.
20
Prospectus 2026
Columbia Variable Portfolio – Select Mid Cap Growth Fund
About Fund Shares and Transactions
Description of the Share Classes
Share Class Features
The Fund offers the classes of shares set forth on the cover of this prospectus. Each share class has its own cost structure and other features. The following summarizes the primary features of the Class 1, Class 2 and Class 3 shares.
| |
Class 1 Shares |
Class 2 Shares |
Class 3 Shares |
| Eligible Investors |
Shares of the Fund are available only to separate accounts of participating insurance companies as underlying investments for variable annuity contracts and/or variable life insurance policies (collectively, Contracts) or qualified pension and retirement plans (Qualified Plans) or other eligible investors authorized by the Distributor. | ||
| Investment Limits |
none |
none |
none |
| Conversion Features |
none |
none |
none |
| Front-End Sales Charges |
none |
none |
none |
| Contingent Deferred Sales Charges (CDSCs) |
none |
none |
none |
| Maximum Distribution and/or Service Fees |
none |
0.25% |
0.125% |
FUNDamentals
Financial Intermediaries
The term “financial intermediary” refers to the insurance company that issued your contract, qualified pension or retirement plan sponsors or the financial intermediary that employs your financial advisor. Financial intermediaries also include broker-dealers and financial advisors as well as firms that employ broker-dealers and financial advisors, including, for example, brokerage firms, banks, investment advisers, third party administrators and other firms in the financial services industry, including Ameriprise Financial and its affiliates.
Distribution and/or Service Fees
Pursuant to Rule 12b-1 under the Investment Company Act of 1940, as amended (the 1940 Act), the Board has approved, and the Fund has adopted, a distribution plan which sets the distribution fees that are periodically deducted from the Fund’s assets for Class 2 and Class 3 shares. The distribution fee for Class 2 shares is 0.25% and the distribution fee for Class 3 shares is 0.125%. These fees are calculated daily, may vary by share class and are intended to compensate the Distributor and/or financial intermediaries for selling shares of the Fund and/or providing services to investors. Because the fees are paid out of the Fund’s assets on an ongoing basis, they will increase the cost of your investment over time.
The Fund will pay these fees to the Distributor and/or to eligible financial intermediaries for as long as the distribution plan continues. The Fund may reduce or discontinue payments at any time.
The Fund pays a service fee to participating insurance companies or other financial intermediaries that provide sub-recordkeeping and other services to Contract owners, Qualified Plan participants and the separate accounts.
Financial Intermediary Compensation
The Distributor, the Investment Manager and their affiliates make payments, from their own resources, to financial intermediaries, primarily to affiliated and unaffiliated insurance companies, for marketing/sales support services relating to the Fund (Marketing Support Payments). Such payments are generally based upon one or more of the following factors: average net assets of the Columbia Funds sold by the Distributor attributable to that financial intermediary; gross sales of the Columbia Funds distributed by the Distributor attributable to that financial intermediary; or a negotiated lump sum payment. While the financial arrangements may vary for each financial intermediary, the Marketing Support Payments to any one financial intermediary are generally between 0.05% and
Prospectus 2026
21
Columbia Variable Portfolio – Select Mid Cap Growth Fund
About Fund Shares and Transactions (continued)
0.40% on an annual basis for payments based on average net assets of the Fund attributable to the financial intermediary, and between 0.05% and 0.25% on an annual basis for a financial intermediary receiving a payment based on gross sales of the Columbia Funds attributable to the financial intermediary.
As employee compensation and business unit operating goals at all levels are generally tied to the success of Ameriprise Financial, employees of Ameriprise Financial and its affiliates, including employees of affiliated broker-dealers and insurance companies, are incented to include shares of the Columbia Funds in Contracts offered by affiliated insurance companies. Certain employees, directly or indirectly, receive higher compensation and other benefits as investment in the Columbia Funds increases. In addition, management, sales leaders and other employees may spend more of their time and resources promoting Ameriprise Financial and its subsidiary companies, including the Distributor and the Investment Manager, and the products they offer, including the Fund.
In addition, the Transfer Agent has certain arrangements in place to compensate financial intermediaries, primarily to affiliated and unaffiliated insurance companies, that hold Fund shares through networked and omnibus accounts, including omnibus retirement plans, for services that they provide to beneficial Fund shareholders (Shareholder Services). Shareholder Services and related fees vary by financial intermediary and may include sub-accounting, sub-transfer agency, participant recordkeeping, shareholder or participant reporting, shareholder or participant transaction processing, maintenance of shareholder records, preparation of account statements and provision of customer service, and are not intended to include services that are primarily intended to result in the sale of Fund shares. Payments for Shareholder Services generally are not expected, with certain limited exceptions, to exceed 0.40% of the average aggregate value of the Fund’s shares. Each Fund pays the Transfer Agent a service fee equal to the payments made by the Transfer Agent to participating insurance companies and other financial intermediaries that provide Shareholder Services up to the lesser of the amount charged by the financial intermediary or a contractual asset-based cap. Payments of amounts that exceed the amount paid by the Fund are borne by the Transfer Agent, the Investment Manager and/or their affiliates.
In addition to the payments described above, the Distributor, the Investment Manager and their affiliates typically make other payments or allow promotional incentives to certain broker-dealers to the extent permitted by SEC and Financial Industry Regulatory Authority (FINRA) rules and by other applicable laws and regulations.
Amounts paid by the Distributor, the Investment Manager and their affiliates are paid out of their own resources and do not increase the amount paid by you or the Fund. You can find further details in the SAI about the payments made by the Distributor, the Investment Manager and their affiliates, as well as a list of the financial intermediaries, including Ameriprise Financial affiliates, to which the Distributor, the Investment Manager or their affiliates have agreed to make Marketing Support Payments and fee payments for Shareholder Services.
Your financial intermediary may charge you fees and commissions in addition to those described in this prospectus. You should consult with your financial intermediary and review carefully any disclosure your financial intermediary provides regarding its services and compensation. Depending on the financial arrangement in place at any particular time, a financial intermediary and its financial advisors may have a conflict of interest or financial incentive with respect to recommendations regarding the Fund or any Contract or Qualified Plan that includes the Fund.
Share Price Determination
The price you pay or receive when you buy, sell or transfer shares is the Fund's next determined net asset value (or NAV) per share for a given share class. The Fund calculates the NAV per share for each class of shares of the Fund at the end of each business day, with the value of the Fund's shares based on the total value of all of the securities and other assets that it holds as of such specified time.
22
Prospectus 2026
Columbia Variable Portfolio – Select Mid Cap Growth Fund
About Fund Shares and Transactions (continued)
FUNDamentals
NAV Calculation
Each of the Fund's share classes calculates its NAV per share as follows:
NAV per share = (Value of assets of the share class) – (Liabilities of the share class)
Number of outstanding shares of the class
Number of outstanding shares of the class
FUNDamentals
Business Days
A business day is any day that the New York Stock Exchange (NYSE) is open. A business day typically ends at the close of regular trading on the NYSE, usually at 4:00 p.m. Eastern time. If the NYSE is scheduled to close early, the business day will be considered to end as of the time of the NYSE’s scheduled close. The Fund will not treat an intraday unscheduled disruption in NYSE trading or an intraday unscheduled closing as a close of regular trading on the NYSE for these purposes and will price its shares as of the regularly scheduled closing time for that day (typically, 4:00 p.m. Eastern time). Nonetheless, the NAV of Fund shares may be determined at such other time or times (in addition to or in lieu of the time set forth above) as the Fund’s Board may approve or ratify. On holidays and other days when the NYSE is closed, the Fund’s NAV is not calculated and the Fund does not accept buy or sell orders. However, the value of the Fund’s assets may still be affected on such days to the extent that the Fund holds foreign securities that trade on days that foreign securities markets are open.
Equity securities listed on an exchange are typically valued at the closing price or last trade on their primary exchange at the close of business of the NYSE. Equity securities without a readily available closing price or that are not listed on any exchange are typically valued at the mean between the closing bid and asked prices. Other equity securities, debt securities and other assets are valued differently. For instance, bank loans trading in the secondary market are fair valued unless market quotations are readily available, fixed income investments maturing in 60 days or less are valued primarily using the amortized cost method, unless this methodology results in a valuation that does not approximate the market value of these securities, and those maturing in excess of 60 days are valued based on prices obtained from a pricing service, if available (which may represent market values or fair values). Investments in other open-end funds are valued at their published NAVs. The value of the Fund’s portfolio securities is determined in accordance with the valuation policy approved by the Board (the Valuation Policy). Pursuant to Rule 2a-5 under the 1940 Act, the Board has designated the Investment Manager as the Fund’s valuation designee. The Investment Manager, in turn, has authorized its valuation committee to make fair value determinations and to carry out supervisory and certain other functions relating to the valuation of Fund portfolio securities, pursuant to the Valuation Policy.
If a market price is not readily available or is deemed not to reflect market value for a portfolio security, the Investment Manager will determine the price based on a determination of the security's fair value pursuant to the Valuation Policy. In addition, the Investment Manager may use fair valuation techniques to price securities that trade on a foreign exchange when a significant event has occurred after the foreign exchange closes but before the time at which the Fund’s share price is calculated. Foreign exchanges typically close before the time at which Fund share prices are calculated, and may be closed altogether on days when the Fund is open. Such significant events affecting a foreign security may include, but are not limited to: (1) corporate actions, earnings announcements, litigation or other events impacting a single issuer; (2) governmental action that affects securities in one sector or country; (3) natural disasters or armed conflicts affecting a country or region; or (4) significant domestic or foreign market fluctuations. The Fund uses various criteria, including an evaluation of U.S. market moves after the close of foreign markets, in determining whether a foreign security's market price is readily available and reflective of market value and, if not, the fair value of the security.
Prospectus 2026
23
Columbia Variable Portfolio – Select Mid Cap Growth Fund
About Fund Shares and Transactions (continued)
Fair valuation may have the effect of reducing stale pricing arbitrage opportunities presented by the pricing of Fund shares. However, when the Investment Manager uses fair valuation to price equity securities, it may value those securities higher or lower than another fund or manager would. Also, fair valuation of Fund holdings may cause the Fund's performance to diverge to a greater degree from the performance of various benchmark indices used to compare the Fund's performance because indices generally do not use fair valuation techniques. Because of the judgment involved in fair valuation decisions, there can be no assurance that the value ascribed to a particular security is accurate. The Fund has retained one or more independent fair valuation pricing services to assist in the fair valuation process for foreign securities.
Futures and options on futures are valued based upon the settlement price as determined by the principal exchange on which they are traded or, in the absence of a settlement price, at the mean of the closing bid and ask. Generally, over-the-counter derivatives, such as swaps and swaptions, are valued based on a price provided by an approved pricing service.
Shareholder Information
Each share class has its own cost structure and other features. Your product may not offer every share class. The Fund encourages you to consult with a financial advisor who can help you with your investment decisions and for more information about the share classes offered by the Fund and available under your product. Shares of the Fund are generally available for purchase only by participating insurance companies in connection with Contracts and Qualified Plan sponsors.
The Fund, the Distributor or the Transfer Agent may refuse any order to buy or transfer shares. If this happens, the Fund will return any money it received, but no interest will be paid on that money.
Shares of the Fund may not be purchased or sold directly by individual Contract owners or participants in a Qualified Plan. When you sell your shares through your Contract or Qualified Plan, the Fund is effectively buying them back. This is called a redemption. The right of redemption may be suspended or payment postponed whenever permitted by applicable laws and regulations, as described under Satisfying Fund Redemption Requests below.
Depending on the context, references to “you” or “your” herein refer either to the holder of a Contract, participant in a Qualified Plan or qualified institutional investor who may select Fund shares to fund his or her investment in the Contract or Qualified Plan or to the participating insurance company as the holder of Fund shares through one or more separate accounts or the Qualified Plan.
Satisfying Fund Redemption Requests
The Fund typically expects to send the redeeming participating insurance company or Qualified Plan sponsor payment for shares within two business days after your trade date. The Fund can suspend redemptions and/or delay payment of redemption proceeds for up to seven days. The Fund can also suspend redemptions and/or delay payment of redemption proceeds in excess of seven days under certain circumstances, including when the NYSE is closed or trading thereon is restricted or during emergency or other circumstances, including as determined by the SEC.
The Fund typically seeks to satisfy redemption requests from cash or cash equivalents held by the Fund, from the proceeds of orders to purchase Fund shares or from the proceeds of sales of Fund holdings effected in the normal course of managing the Fund. However, the Fund may have to sell Fund holdings, including in down markets, to meet heavier than usual redemption requests. For example, under stressed or abnormal market conditions or circumstances, including circumstances adversely affecting the liquidity of the Fund’s investments, the Fund may be more likely to be forced to sell Fund holdings to meet redemptions than under normal market circumstances. In these situations, the Fund’s portfolio managers may have to sell Fund holdings that would not otherwise be sold because, among other reasons, the current price to be received is less than the value of the holdings perceived by the Fund’s portfolio managers. The Fund may also, under certain circumstances (but more likely under stressed or abnormal market conditions or circumstances), borrow money under a credit facility to which the Fund and certain other Columbia Funds are parties or from other Columbia Funds under an interfund lending program (except for closed-end funds and money market funds, which are not eligible to borrow under the program). The Fund and the
24
Prospectus 2026
Columbia Variable Portfolio – Select Mid Cap Growth Fund
About Fund Shares and Transactions (continued)
other Columbia Funds are limited as to the amount that each may individually and collectively borrow under the credit facility and the interfund lending program. As a result, borrowings available to the Fund under the credit facility and the interfund lending program might be insufficient, alone or in combination with the other strategies described herein, to satisfy Fund redemption requests. Please see About Fund Investments – Borrowings – Interfund Lending in the SAI for more information about the credit facility and interfund lending program. The Fund is also limited in the total amount it may borrow. The Fund may only borrow to the extent permitted by the 1940 Act, the rules and regulations thereunder, and any exemptive relief available to the Fund, which currently limit Fund borrowings to 33 1/3% of total assets (including any amounts borrowed) less liabilities (other than borrowings), plus an additional 5% of its total assets for temporary purposes (to be repaid within 60 days without extension or renewal), in each case determined at the time the borrowing is made.
In addition, the Fund reserves the right to honor redemption orders in whole or in part with in-kind distributions of Fund portfolio securities instead of cash if the Investment Manager, in its sole discretion, determines it to be in the best interest of the remaining shareholders. Such in-kind distributions typically represent a pro-rata portion of Fund portfolio assets subject to adjustments (e.g., for non-transferable securities, round lots and derivatives). In the event the Fund distributes portfolio securities in kind, shareholders may incur brokerage and other transaction costs associated with converting the portfolio securities into cash. Also, the portfolio securities may increase or decrease in value after they are distributed but before they are converted into cash. For U.S. federal income tax purposes, redemptions paid in securities are generally treated the same as redemptions paid in cash. If, during any 90-day period, you redeem shares in an amount greater than $250,000 or 1% of the Fund’s net assets (whichever is less), and if the Investment Manager determines it to be feasible and appropriate, the Fund may pay the redemption amount above such threshold by an in-kind distribution of Fund portfolio securities. Although shares of the Fund may not be purchased or sold by individual owners of Contracts or Qualified Plans, this policy applies indirectly to Contract and Qualified Plan owners.
Potential Conflicts of Interest – Mixed and Shared Funding
The Fund is available for purchase only through Contracts offered by participating insurance companies, Qualified Plans and other qualified institutional investors authorized by the Distributor. Due to differences in tax treatment and other considerations, the interests of various Contract owners, and the interests of Qualified Plan participants, if any, may conflict. The Fund does not foresee any disadvantages to investors arising from these potential conflicts of interest at this time. Nevertheless, the Board of the Fund intends to monitor events to identify any material irreconcilable conflicts which may arise, and to determine what action, if any, should be taken in response to any conflicts. If such a conflict were to arise, one or more separate accounts might be required to withdraw its investments in the Fund or shares of another mutual fund may be substituted. This might force the Fund to sell securities at disadvantageous prices.
Order Processing
Orders to buy and sell shares of the Fund that are placed by your participating insurance company or Qualified Plan sponsor are processed on business days. Orders received in “good form” by the Transfer Agent or a financial intermediary, including your participating insurance company or Qualified Plan sponsor, before the end of a business day are priced at the NAV per share of the Fund's applicable share class on that day. Orders received after the end of a business day will receive the next business day’s NAV per share. An order is in “good form” if the Transfer Agent or your financial intermediary has all of the information and documentation it deems necessary to effect your order. The market value of the Fund’s investments may change between the time you submit your order and the time the Fund next calculates its NAV per share. The business day that applies to your order is also called the trade date.
There is no sales charge associated with the purchase of Fund shares, but there may be charges associated with your Contract or Qualified Plan. Any charges that apply to your Contract or Qualified Plan, and any charges that apply to separate accounts of participating insurance companies or Qualified Plans that may own shares directly, are described in your separate Contract prospectus or Qualified Plan disclosure documents.
Prospectus 2026
25
Columbia Variable Portfolio – Select Mid Cap Growth Fund
About Fund Shares and Transactions (continued)
You may transfer all or part of your investment in the Fund to one or more of the other investment options available under your Contract or Qualified Plan. You may provide instructions to sell any amount allocated to the Fund. Proceeds will be mailed within seven days after your surrender or withdrawal request is received in good form by an authorized agent. The amount you receive may be more or less than the amount you invested.
Please refer to your Contract prospectus or Qualified Plan disclosure documents, as applicable, for more information about transfers as well as surrenders and withdrawals.
Information Sharing Agreements
As required by Rule 22c-2 under the 1940 Act, the Fund or certain of its service providers will enter into information sharing agreements with financial intermediaries, including participating life insurance companies and financial intermediaries that sponsor or offer retirement plans through which shares of the Fund are made available for purchase. Pursuant to Rule 22c-2, financial intermediaries are required, upon request, to: (i) provide shareholder account and transaction information; and (ii) execute instructions from the Fund to restrict or prohibit further purchases of Fund shares by shareholders who have been identified by the Fund as having engaged in transactions that violate the Fund's excessive trading policies and procedures.
Excessive Trading Practices Policy of Non-Money Market Funds
Right to Reject or Restrict Share Transaction Orders — The Fund is intended for investors with long-term investment purposes and is not intended as a vehicle for frequent trading activity (market timing) that is excessive. Investors should transact in Fund shares primarily for investment purposes. The Board has adopted excessive trading policies and procedures that are designed to deter excessive trading by investors (the Excessive Trading Policies and Procedures). The Fund discourages and does not accommodate excessive trading. Investments in a Fund by institutional investors in connection with redemptions in-kind are exempt from the Excessive Trading Policies and Procedures because they generally do not raise market timing or excessive trading concerns. Further discussion about the Fund’s use of redemptions in-kind is available under Satisfying Fund Redemption Requests.
The Fund reserves the right to reject, without any prior notice, any purchase or transfer order for any reason, and will not be liable for any loss resulting from rejected orders. For example, the Fund may in its sole discretion restrict or reject a purchase or transfer order even if the transaction is not subject to the specific limitation described below if the Fund or its agents determine that accepting the order could interfere with efficient management of the Fund's portfolio or is otherwise contrary to the Fund's best interests. The Excessive Trading Policies and Procedures apply equally to purchase or transfer transactions communicated directly to the Transfer Agent and to those received by financial intermediaries.
Specific Buying and Transferring Limitations — If the Fund detects that an investor has made two “material round trips” in any 28-day period, it will generally reject the investor's future purchase orders, including transfer buy orders, involving any Fund.
For these purposes, a “round trip” is a purchase or transfer into the Fund followed by a sale or transfer out of the Fund, or a sale or transfer out of the Fund followed by a purchase or transfer into the Fund. A “material” round trip is one that is deemed by the Fund to be material in terms of its amount or its potential detrimental impact on the Fund. Independent of this limit, the Fund may, in its sole discretion, reject future purchase orders by any person, group or account that appears to have engaged in any type of excessive trading activity.
These limits generally do not apply to automated transactions or transactions by registered investment companies in a “fund-of-funds” structure. These limits do not apply to payroll deduction contributions by retirement plan participants, transactions initiated by a retirement plan sponsor or certain other retirement plan transactions consisting of rollover transactions, loan repayments and disbursements, and required minimum distribution redemptions. They may be modified or rescinded for accounts held by certain retirement plans to conform to plan limits, for considerations relating to the Employee Retirement Income Security Act of 1974 or regulations of the Department of Labor, and for certain asset allocation or wrap programs. Accounts known to be under common ownership or control generally will be counted together, but accounts maintained or managed by a common
26
Prospectus 2026
Columbia Variable Portfolio – Select Mid Cap Growth Fund
About Fund Shares and Transactions (continued)
intermediary generally will not be considered to be under common ownership or control. The Fund reserves the right to modify these restrictions at any time without prior notice to shareholders. In addition, the Fund may, in its sole discretion, reinstate trading privileges that have been revoked under the Fund's Excessive Trading Policies and Procedures.
Limitations on the Ability to Detect and Prevent Excessive Trading Practices — The Fund takes various steps designed to detect and prevent excessive trading, including daily review of available shareholder transaction information. However, the Fund receives buy, sell or transfer orders through financial intermediaries, and cannot always know of or reasonably detect excessive trading that may be facilitated by financial intermediaries or by the use of the omnibus account arrangements they offer. Omnibus account arrangements are common forms of holding shares of mutual funds, particularly among certain financial intermediaries such as broker-dealers, retirement plans and variable insurance products. These arrangements often permit financial intermediaries to aggregate their clients' transactions and accounts, and in these circumstances, the identities of the financial intermediary clients that beneficially own Fund shares are often not known to the Fund.
Some financial intermediaries apply their own restrictions or policies to their clients’ transactions and accounts, which may be more or less restrictive than those described here. This may impact the Fund's ability to curtail excessive trading, even where it is identified. For these and other reasons, it is possible that excessive trading may occur despite the Fund's efforts to detect and prevent it.
Although these restrictions and policies involve judgments that are inherently subjective and may involve some selectivity in their application, the Fund seeks to act in a manner that it believes is consistent with the best interests of Fund shareholders in making any such judgments.
Risks of Excessive Trading — Excessive trading creates certain risks to the Fund's long-term shareholders and may create the following adverse effects:
■
negative impact on the Fund's performance;
■
potential dilution of the value of the Fund's shares;
■
interference with the efficient management of the Fund's portfolio, such as the need to maintain undesirably large cash positions, the need to use its line of credit or the need to buy or sell securities it otherwise would not have bought or sold;
■
losses on the sale of investments resulting from the need to sell securities at less favorable prices; and
■
increased brokerage and administrative costs.
To the extent that the Fund invests significantly in foreign securities traded on markets that close before the Fund's valuation time, it may be particularly susceptible to dilution, which may be exacerbated as a result of excessive trading. Because events may occur after the close of foreign markets and before the Fund's valuation time that influence the value of foreign securities, investors may seek to trade Fund shares in an effort to benefit from their understanding of the value of foreign securities as of the Fund's valuation time. This is often referred to as price arbitrage. The Fund has adopted procedures designed to adjust closing market prices of foreign securities under certain circumstances to reflect what the Fund believes to be the fair value of those securities as of its valuation time. To the extent the adjustments do not work fully, investors engaging in price arbitrage may cause dilution in the value of the Fund's shares held by other shareholders.
Similarly, to the extent that the Fund invests significantly in thinly traded securities and other debt instruments that are rated below investment grade (commonly called “high-yield” or “junk” bonds), equity securities of small-capitalization companies, floating rate loans, or tax-exempt or other securities that may trade infrequently, because these securities are often traded infrequently, investors may seek to trade Fund shares in an effort to benefit from their understanding of the value of these securities as of the Fund's valuation time. This is also a type of price arbitrage. Any such frequent trading strategies may interfere with efficient management of the Fund's portfolio to a greater degree than would be the case for mutual funds that invest only, or significantly, in highly liquid securities, in part because the Fund may have difficulty selling these particular investments at advantageous times or prices to satisfy large and/or frequent sell orders. Any successful price arbitrage may also cause dilution in the value of Fund shares held by non-redeeming shareholders.
Prospectus 2026
27
Columbia Variable Portfolio – Select Mid Cap Growth Fund
About Fund Shares and Transactions (continued)
Excessive Trading Practices Policy of Columbia Variable Portfolio - Government Money Market Fund
A money market fund is designed to offer investors a liquid cash option that they may buy and sell as often as they wish. Accordingly, the Board has not adopted policies and procedures designed to discourage excessive or short-term trading of Columbia Variable Portfolio - Government Money Market Fund shares. However, since frequent purchases and sales of Columbia Variable Portfolio - Government Money Market Fund shares could in certain instances harm shareholders in various ways, including reducing the returns to long-term shareholders by increasing costs (such as spreads paid to dealers who trade money market instruments with Columbia Variable Portfolio - Government Money Market Fund) and disrupting portfolio management strategies, Columbia Variable Portfolio - Government Money Market Fund reserves the right, but has no obligation, to reject any purchase or transfer transaction at any time. Columbia Variable Portfolio - Government Money Market Fund has no limits on purchase or transfer transactions. In addition, Columbia Variable Portfolio - Government Money Market Fund reserves the right to impose or modify restrictions on purchases, transfers or trading of Fund shares at any time.
28
Prospectus 2026
Columbia Variable Portfolio – Select Mid Cap Growth Fund
Distributions and Taxes
Distributions to Shareholders
A mutual fund can make money two ways:
■
It can earn income on its investments. Examples of fund income are interest paid on money market instruments and bonds, and dividends paid on common stocks.
■
A mutual fund can also have capital gains if the value of its investments increases.
In the case of the Fund, because the Fund expects to be treated as a partnership for tax purposes, it is not required to and does not expect to make regular distributions to its shareholders (other than in redemption of Fund shares), but may do so in the sole discretion of the Fund’s Board of Trustees (or its delegates).
Taxes and Your Investment
Taxation of the Fund: The Fund is currently treated and expects to continue to be treated as a partnership that is not a “publicly traded partnership” for U.S. federal income tax purposes. If the Fund were not to qualify for such treatment, the Fund could be subject to U.S. federal income tax at the Fund level, which would reduce the value of an investment in the Fund.
As a partnership that is not a “publicly traded partnership,” the Fund is generally not itself subject to U.S. federal income tax. Instead, each shareholder will be required to take into account for U.S. federal income tax purposes its allocable share of the Fund’s income, gains, losses, deductions, credits, and other tax items, without regard to whether such shareholder has received or will receive corresponding distributions from the Fund. In addition, unlike mutual funds that intend to be treated as regulated investment companies for U.S. federal income tax purposes, the Fund is not required to meet any specific qualifying income or distribution requirements, although to the extent regulated investment companies invest in the Fund, such requirements will be taken into account by the Fund.
Certain Fund income may be subject to tax in other countries, including withholding or other taxes on dividends, interest or capital gains. Tax conventions between certain countries and the United States may reduce or eliminate such taxes. In certain countries the Fund may incur a higher rate of tax on dividends than it would have incurred if the Fund had been treated as a regulated investment company.
As a partnership that is not a “publicly traded partnership,” the Fund is generally not itself subject to U.S. federal income tax. Instead, each shareholder will be required to take into account for U.S. federal income tax purposes its allocable share of the Fund’s income, gains, losses, deductions, credits, and other tax items, without regard to whether such shareholder has received or will receive corresponding distributions from the Fund. In addition, unlike mutual funds that intend to be treated as regulated investment companies for U.S. federal income tax purposes, the Fund is not required to meet any specific qualifying income or distribution requirements, although to the extent regulated investment companies invest in the Fund, such requirements will be taken into account by the Fund.
Certain Fund income may be subject to tax in other countries, including withholding or other taxes on dividends, interest or capital gains. Tax conventions between certain countries and the United States may reduce or eliminate such taxes. In certain countries the Fund may incur a higher rate of tax on dividends than it would have incurred if the Fund had been treated as a regulated investment company.
Taxation of Fund Shares: Shares of the Fund are only offered to separate accounts of participating insurance companies, Qualified Plans, and certain other eligible persons or plans permitted to hold shares of the Fund pursuant to the applicable U.S. Treasury Regulations without impairing the ability of participating insurance companies to satisfy the diversification requirements of Section 817(h) of the Internal Revenue Code of 1986, as amended. Each participating insurance company, including each participating insurance company that is an affiliate of the Investment Manager, includes in its taxable income any net investment income derived from the investment of assets held in its separate accounts because the insurance company is considered the owner of these assets under federal income tax law. The insurance company may claim certain tax benefits associated with this investment income, which benefits may be greater with respect to the Fund than if the Fund were treated as a regulated investment company for U.S. federal income tax purposes. These benefits, which may include foreign tax credits (which can reduce the insurance company’s U.S. taxes on foreign source income) and the corporate dividends-received deduction (which is a tax deduction for the insurance company attributable to certain dividends received by the Fund), are not passed on to Contract owners since the affiliated insurance company is the owner of the assets under federal tax law and is taxed on the investment income generated by the assets.
Taxation of Variable Annuity Contracts and Variable Life Insurance Policies: Your Contract may qualify for favorable tax treatment. Please refer to your Contract prospectus for more information about the tax implications of your investment in the Contract. As long as your Contract continues to qualify for such favorable tax treatment, you will not be taxed currently on your investment in the Fund through such Contract, even if the Fund makes allocations or distributions to the separate account and/or you change your investment options under the Contract. In order to qualify for such treatment, among other things, the separate accounts of participating insurance companies, which maintain and invest net proceeds from Contracts, must be “adequately diversified.” The Fund intends to operate in such a manner so that a separate account investing only in Fund shares on behalf of a holder of a Contract will be “adequately diversified.” If the Fund does not meet such requirements because its investments are not adequately
Prospectus 2026
29
Columbia Variable Portfolio – Select Mid Cap Growth Fund
Distributions and Taxes (continued)
diversified, your Contract could lose its favorable tax treatment, and income and gain allocable to your Contract could be taxable currently to you. This could also occur if Contract holders are found to have an impermissible level of control over the investments underlying their Contracts or if the Fund does not qualify for treatment as a partnership that is not a “publicly traded partnership.” You should consult with the participating insurance company that issued your Contract, plan sponsor, or other eligible investor through which your investment in the Fund is made regarding the U.S. federal income taxation of your investment.
FUNDamentals
Taxes
The information provided above is only a summary of how U.S. federal income taxes may affect your indirect investment in the Fund. It is not intended as a substitute for careful tax planning. Your investment in the Fund may have other tax implications. It does not apply to certain types of investors who may be subject to special rules, including foreign or tax-exempt investors or those holding Fund shares through a tax-advantaged account other than a Contract, such as a 401(k) plan or IRA. Please see the SAI for more detailed tax information. You should consult with your own tax advisor about the particular tax consequences to you of an investment in the Fund, including the effect of any foreign, state and local taxes, and the effect of possible changes in applicable tax laws.
30
Prospectus 2026
Columbia Variable Portfolio – Select Mid Cap Growth Fund
Financial Highlights
The financial highlights table is intended to help you understand the Fund’s financial performance for the past five fiscal years or, if shorter, the Fund’s period of operations. Certain information reflects financial results for a single Fund share. Per share net investment income (loss) amounts are calculated based on average shares outstanding during the period. The total return in the table represents the rate that an investor would have earned (or lost) on an investment in the Fund assuming all dividends and distributions had been reinvested. Total return does not reflect any fees and expenses imposed under your Contract and/or Qualified Plan, as applicable; such fees and expenses would reduce the total return for all periods shown. Total return and portfolio turnover are not annualized for periods of less than one year. The ratios of expenses and net investment income are annualized for periods of less than one year. The portfolio turnover rate is calculated without regard to purchase and sales transactions of short-term instruments and certain derivatives, if any. If such transactions were included, the Fund’s portfolio turnover rate may be higher. A zero balance may reflect an amount rounding to less than $0.01 or 0.01%. This information has been audited by PricewaterhouseCoopers LLP, an independent registered public accounting firm, whose report, along with the Fund’s financial statements, is included in the Fund’s Form N-CSR, which is available upon request.
Prospectus 2026
31
Columbia Variable Portfolio – Select Mid Cap Growth Fund
Financial Highlights (continued)
| |
Net asset value, beginning of period |
Net investment income (loss) |
Net realized and unrealized gain (loss) |
Total from investment operations |
| Class 1 | ||||
| Year Ended 12/31/2025 |
$56.15 |
(0.30) |
8.80 |
8.50 |
| Year Ended 12/31/2024 |
$45.40 |
(0.19) |
10.94 |
10.75 |
| Year Ended 12/31/2023 |
$36.25 |
(0.04) |
9.19 |
9.15 |
| Year Ended 12/31/2022 |
$52.41 |
(0.15) |
(16.01) |
(16.16) |
| Year Ended 12/31/2021 |
$44.96 |
(0.27) |
7.72 |
7.45 |
| Class 2 | ||||
| Year Ended 12/31/2025 |
$54.17 |
(0.44) |
8.49 |
8.05 |
| Year Ended 12/31/2024 |
$43.91 |
(0.30) |
10.56 |
10.26 |
| Year Ended 12/31/2023 |
$35.15 |
(0.14) |
8.90 |
8.76 |
| Year Ended 12/31/2022 |
$50.95 |
(0.24) |
(15.56) |
(15.80) |
| Year Ended 12/31/2021 |
$43.82 |
(0.38) |
7.51 |
7.13 |
| Class 3 | ||||
| Year Ended 12/31/2025 |
$55.13 |
(0.37) |
8.63 |
8.26 |
| Year Ended 12/31/2024 |
$44.63 |
(0.25) |
10.75 |
10.50 |
| Year Ended 12/31/2023 |
$35.68 |
(0.09) |
9.04 |
8.95 |
| Year Ended 12/31/2022 |
$51.65 |
(0.20) |
(15.77) |
(15.97) |
| Year Ended 12/31/2021 |
$44.37 |
(0.33) |
7.61 |
7.28 |
| Notes to Financial Highlights | |
| (a) |
In addition to the fees and expenses that the Fund bears directly, the Fund indirectly bears a pro rata share of the fees and expenses of any other funds in which it invests. Such indirect expenses are not included in the Fund's reported expense ratios. |
| (b) |
Total net expenses include the impact of certain fee waivers/expense reimbursements made by the Investment Manager and certain of its affiliates, if applicable. |
| (c) |
The Fund received a payment from an affiliate. Had the Fund not received this payment, the total return would have been lower by 0.01%. |
| (d) |
Ratios include interfund lending expense which is less than 0.01%. |
32
Prospectus 2026
Columbia Variable Portfolio – Select Mid Cap Growth Fund
Financial Highlights (continued)
| |
Net asset value, end of period |
Total return |
Total gross expense ratio to average net assets(a) |
Total net expense ratio to average net assets(a),(b) |
Net investment income (loss) ratio to average net assets |
Portfolio turnover |
Net assets, end of period (000's) |
| Class 1 | |||||||
| Year Ended 12/31/2025 |
$64.65 |
15.14%(c) |
0.90% |
0.82% |
(0.50%) |
195% |
$137,957 |
| Year Ended 12/31/2024 |
$56.15 |
23.68% |
0.90% |
0.82% |
(0.37%) |
174% |
$138,660 |
| Year Ended 12/31/2023 |
$45.40 |
25.24% |
0.89%(d) |
0.83%(d) |
(0.10%) |
201% |
$162,697 |
| Year Ended 12/31/2022 |
$36.25 |
(30.84%) |
0.88% |
0.84% |
(0.39%) |
73% |
$162,078 |
| Year Ended 12/31/2021 |
$52.41 |
16.57% |
0.88% |
0.82% |
(0.54%) |
75% |
$215,521 |
| Class 2 | |||||||
| Year Ended 12/31/2025 |
$62.22 |
14.86%(c) |
1.15% |
1.07% |
(0.75%) |
195% |
$60,683 |
| Year Ended 12/31/2024 |
$54.17 |
23.37% |
1.15% |
1.07% |
(0.62%) |
174% |
$54,824 |
| Year Ended 12/31/2023 |
$43.91 |
24.92% |
1.14%(d) |
1.08%(d) |
(0.34%) |
201% |
$44,677 |
| Year Ended 12/31/2022 |
$35.15 |
(31.01%) |
1.13% |
1.09% |
(0.64%) |
73% |
$34,453 |
| Year Ended 12/31/2021 |
$50.95 |
16.27% |
1.13% |
1.07% |
(0.79%) |
75% |
$49,778 |
| Class 3 | |||||||
| Year Ended 12/31/2025 |
$63.39 |
14.98%(c) |
1.02% |
0.94% |
(0.63%) |
195% |
$274,045 |
| Year Ended 12/31/2024 |
$55.13 |
23.52% |
1.02% |
0.94% |
(0.50%) |
174% |
$267,749 |
| Year Ended 12/31/2023 |
$44.63 |
25.08% |
1.02%(d) |
0.95%(d) |
(0.22%) |
201% |
$244,891 |
| Year Ended 12/31/2022 |
$35.68 |
(30.92%) |
1.01% |
0.96% |
(0.52%) |
73% |
$214,338 |
| Year Ended 12/31/2021 |
$51.65 |
16.41% |
1.00% |
0.94% |
(0.66%) |
75% |
$343,782 |
Prospectus 2026
33
Columbia Variable Portfolio – Select Mid Cap Growth Fund

For More Information
The Fund is generally available only to owners of Contracts issued by participating insurance companies and participants in Qualified Plans. Please refer to your Contract prospectus or Qualified Plan disclosure documents for information about how to buy, sell and transfer shares of the Fund.
Additional Information About the Fund
Additional information about the Fund’s investments is available in the Fund’s annual and semiannual reports to shareholders and in Form N-CSR. In the Fund’s annual report, you will find a discussion of the market conditions and investment strategies that significantly affected the Fund’s performance during its last fiscal year. In the Fund’s Form N-CSR, you will find the Fund’s annual and semiannual financial statements. The SAI also provides additional information about the Fund and its policies. The SAI, which has been filed with the SEC, is legally part of this prospectus (incorporated by reference). To obtain these documents free of charge, to request other information about the Fund and to make shareholder inquiries, please contact the Fund as follows:
By Mail: Columbia Management Investment Services Corp.
P.O. Box 219104
Kansas City, MO 64121-9104
P.O. Box 219104
Kansas City, MO 64121-9104
By Telephone: 800.345.6611
Online: columbiathreadneedleus.com
Reports and other information about the Fund are also available in the EDGAR Database on the SEC’s website at http://www.sec.gov. You can receive copies of this information, for a duplication fee, by electronic request at the following e-mail address: publicinfo@sec.gov.
The investment company registration number of Columbia Funds Variable Series Trust II, of which the Fund is a series, is 811-22127.
Columbia Threadneedle Investments (Columbia Threadneedle) is the global brand name of the Columbia and Threadneedle group of companies.
The Fund is distributed by Columbia Management Investment Distributors, Inc., 290 Congress Street, Boston, MA 02210.
The Fund is distributed by Columbia Management Investment Distributors, Inc., 290 Congress Street, Boston, MA 02210.
© 2026 Columbia Threadneedle. All rights reserved.
PRO7017_12_E01_(05/26)

Columbia Variable Portfolio – Select Mid Cap Value Fund
Prospectus
May 1, 2026
As with all mutual funds, the Securities and Exchange Commission (SEC) has not approved or disapproved these securities or passed upon the adequacy of this prospectus. Any representation to the contrary is a criminal offense.

Columbia Variable Portfolio – Select Mid Cap Value Fund
Table of Contents
| 3 | |
| 3 | |
| 3 | |
| 4 | |
| 4 | |
| 6 | |
| 7 | |
| 7 | |
| 7 | |
| 8 | |
| 9 | |
| 9 | |
| 9 | |
| 10 | |
| 13 | |
| 17 | |
| 18 | |
| 19 | |
| 20 | |
| 20 | |
| 20 | |
| 21 | |
| 23 | |
| 28 | |
| 28 | |
| 28 | |
| 31 |
2
Prospectus 2026
Columbia Variable Portfolio – Select Mid Cap Value Fund
Summary of the Fund
Investment Objective
Columbia Variable Portfolio – Select Mid Cap Value Fund (the Fund) seeks to provide shareholders with long-term growth of capital.
Fees and Expenses of the Fund
This table describes the fees and expenses that you may pay as an investor in the Fund. The table does not reflect any fees or expenses imposed by your Contract or Qualified Plan, which are disclosed in your separate Contract prospectus or Qualified Plan disclosure documents. If the additional fees or expenses were reflected, the expenses set forth below would be higher.
| Annual Fund Operating Expenses (expenses that you pay each year as a percentage of the value of your investment) | |||
| |
Class 1 |
Class 2 |
Class 3 |
| Management fees |
% |
% |
% |
| Distribution and/or service (12b-1) fees |
% |
% |
% |
| Other expenses |
% |
% |
% |
| Total annual Fund operating expenses(a) |
% |
% |
% |
| Less: Fee waivers and/or expense reimbursements(b) |
( %) |
( %) |
( %) |
| Total annual Fund operating expenses after fee waivers and/or expense reimbursements |
% |
% |
% |
(a)
(b)
Example
The following example is intended to help you compare the cost of investing in the Fund with the cost of investing in other mutual funds. The example illustrates the hypothetical expenses that you would incur over the time periods indicated, and assumes that:
■
you invest $10,000 in the applicable class of Fund shares for the periods indicated,
■
your investment has a 5% return each year, and
■
the Fund’s total annual operating expenses remain the same as shown in the Annual Fund Operating Expenses table above.
The example does not reflect any fees and expenses that apply to your Contract or Qualified Plan. Inclusion of these charges would increase expenses for all periods shown.
Since the waivers and/or reimbursements shown in the Annual Fund Operating Expenses table above expire as indicated in the preceding table, they are only reflected in the 1 year example and the first year of the other examples. Although your actual costs may be higher or lower, based on the assumptions listed above, your costs would be:
| |
1 year |
3 years |
5 years |
10 years |
| Class 1 (whether or not shares are redeemed) |
$ |
$ |
$ |
$ |
| Class 2 (whether or not shares are redeemed) |
$ |
$ |
$ |
$ |
| Class 3 (whether or not shares are redeemed) |
$ |
$ |
$ |
$ |
Prospectus 2026
3
Columbia Variable Portfolio – Select Mid Cap Value Fund
Summary of the Fund (continued)
Portfolio Turnover
The Fund may pay transaction costs, such as commissions, when it buys and sells securities (or “turns over” its portfolio). A higher portfolio turnover rate may indicate higher transaction costs. These costs, which are not reflected in annual fund operating expenses or in the example, affect the Fund’s performance. During the most recent fiscal year, the Fund’s portfolio turnover rate was 11 % of the average value of its portfolio.
Principal Investment Strategies
Under normal circumstances, the Fund invests at least 80% of its net assets (plus the amount of any borrowings for investment purposes) in equity securities of medium-sized companies. Medium-sized companies are those whose market capitalizations fall within the market capitalization range of the Russell Midcap® Value Index (the Capitalization Index), which ranged between $134.5 million and $116.7 billion as of March 31, 2026. The market capitalization range and composition of companies in the Capitalization Index are subject to change. As such, the size of the companies in which the Fund invests may change. The Fund may continue to hold a security even if the company’s market capitalization is no longer within the range of the Capitalization Index. Under normal circumstances, the Fund also invests at least 80% of its net assets (plus the amount of any borrowings for investment purposes) in equity securities of “value” companies. The Fund considers “value” companies to be those companies that are either constituents of an index constructed by a third party to identify companies with various characteristics of value companies, or that have a higher book-to-price (B/P) ratio than the median ranked stock within the company’s GICS sector, have a higher EBITDA/EV (earnings before interest, taxes, depreciation and amortization-to-enterprise value) or have a lower price-to-earnings ratio than the median ranked stock within the company’s GICS sector. The third-party broad-based index currently used to identify value companies is the Russell 3000® Value Index, although the Fund may change the referenced index without prior notice.
The Fund may invest up to 25% of its net assets in foreign investments. The Fund normally invests in common stocks and also may invest in real estate investment trusts. The Fund may at times emphasize one or more sectors in selecting its investments, including the financials sector. The Fund may hold a small number of securities, consistent with its value investment approach. Generally, the Fund anticipates holding between 30 and 50 securities in its portfolio; however, the Fund may hold, at any time, more or fewer securities than noted in this range.
Principal Risks
An investment in the Fund involves risks, including Mid-Cap Stock Risk, Market Risk, Value Securities Risk, and Focused Portfolio Risk, among others. Descriptions of these and other principal risks of investing in the Fund are provided below. There is no assurance that the Fund will achieve its investment objective and you may lose money. The value of the Fund’s holdings may decline, and the Fund’s net asset value (NAV) and share price may go down. An investment in the Fund is not a bank deposit and is not insured or guaranteed by the Federal Deposit Insurance Corporation or any other government agency. The significance of any specific risk to an investment in the Fund will vary over time depending on the composition of the Fund's portfolio, market conditions, and other factors. You should read all of the risk information below carefully, because any one or more of these risks may result in losses to the Fund.
Active Management Risk. Due to its active management, the Fund could underperform its benchmark index and/or other funds with similar investment objectives and/or strategies.
Equity Securities Risk. Equity securities may experience significant volatility. Such securities may fall sharply in response to adverse events affecting overall markets, a particular industry or sector, or an individual company’s financial condition.
Focused Portfolio Risk. Because the Fund may invest in a limited number of companies, the Fund as a whole is subject to greater risk of loss if any of those securities decline in price.
Foreign Securities Risk. Investments in or exposure to securities of foreign companies may involve heightened risks relative to investments in or exposure to securities of U.S. companies. Investing in securities of foreign companies subjects the Fund to the risks associated with an issuer’s (and any of its related companies’) country of organization and places of business operations, including risks related to political, regulatory, economic, social, diplomatic and
4
Prospectus 2026
Columbia Variable Portfolio – Select Mid Cap Value Fund
Summary of the Fund (continued)
other conditions or events (including, for example, military confrontations and actions, war, other conflicts, terrorism and disease/virus outbreaks and epidemics) occurring in the country or region, as well as risks associated with less developed custody and settlement practices. Foreign securities may be more volatile and less liquid than securities of U.S. companies and are subject to the risks associated with potential imposition of economic and other sanctions against a particular foreign country, its nationals or industries or businesses within the country. In addition, foreign governments may impose withholding or other taxes on the Fund’s income, capital gains or proceeds from the disposition of foreign securities, which could reduce the Fund’s return on such securities. The performance of the Fund may also be negatively affected by fluctuations in a foreign currency's strength or weakness relative to the U.S. dollar, particularly to the extent the Fund invests a significant percentage of its assets in foreign securities or other assets denominated in currencies other than the U.S. dollar.
Issuer Risk. An issuer in which the Fund invests or to which it has exposure may perform poorly or below expectations, and the value of its securities may therefore decline, which may negatively affect the Fund’s performance. Underperformance of an issuer may be caused by poor management decisions, competitive pressures, breakthroughs in technology, reliance on suppliers, labor problems or shortages, corporate restructurings, fraudulent disclosures, natural disasters, military confrontations and actions, war, other conflicts, terrorism, disease/virus outbreaks, epidemics or other events, conditions and factors which may impair the value of your investment in the Fund.
■
Mid-Cap Stock Risk. Investments in mid-capitalization companies (mid-cap companies) often involve greater risks than investments in larger, more established companies (larger companies) because mid-cap companies tend to have less predictable earnings and may lack the management experience, financial resources, product diversification and competitive strengths of larger companies, and may be less liquid than the securities of larger companies.
Market Risk. The Fund may incur losses due to declines in the value of one or more securities in which it invests. These declines may be due to factors affecting a particular issuer, or the result of, among other things, political, regulatory, market, economic or social developments affecting the relevant market(s) more generally. In addition, turbulence in financial markets and reduced liquidity in equity, credit and/or fixed income markets may negatively affect many issuers, which could adversely affect the Fund’s ability to price or value hard-to-value assets in thinly traded and closed markets and could cause significant redemptions and operational challenges. Global economies and financial markets are increasingly interconnected, and conditions and events in one country, region or financial market may adversely impact issuers in a different country, region or financial market. These risks may be magnified if certain events or developments adversely interrupt the global supply chain; in these and other circumstances, such risks might affect companies worldwide. As a result, local, regional or global events such as terrorism, war, other conflicts, natural disasters, disease/virus outbreaks and epidemics or other public health issues, recessions, depressions or other events – or the potential for such events – could have a significant negative impact on global economic and market conditions.
Real Estate-Related Investment Risk. Investments in real estate investment trusts (REITs) and in securities of other companies (wherever organized) principally engaged in the real estate industry subject the Fund to, among other things, risks similar to those of direct investments in real estate and the real estate industry in general. These include risks related to general and local economic conditions, possible lack of availability of financing and changes in interest rates or property values. The value of interests in a REIT may be affected by, among other factors, changes in the value of the underlying properties owned by the REIT, changes in the prospect for earnings and/or cash flow growth of the REIT itself, defaults by borrowers or tenants, market saturation, decreases in market rates for rents, and other economic, political, or regulatory matters affecting the real estate industry, including REITs. REITs may be subject to more abrupt or erratic price movements than the overall securities markets. In a rising interest rate environment, the stock prices of real estate-related investments may decline and the borrowing costs of these companies may increase. REITs are also subject to the risk of failing to qualify for favorable tax treatment under the Internal Revenue Code of 1986, as amended. The failure of a REIT to continue to qualify as a REIT for tax purposes can materially and adversely affect its value. Some REITs (especially mortgage REITs) are affected by risks similar to those associated with investments in debt securities including changes in interest rates and the quality of credit extended.
Prospectus 2026
5
Columbia Variable Portfolio – Select Mid Cap Value Fund
Summary of the Fund (continued)
Sector Risk. At times, the Fund may have a significant portion of its assets invested in securities of companies conducting business in a related group of industries within one or more economic sectors, including the financials sector. Companies in the same sector may be similarly affected by economic, regulatory, political or market events or conditions, which may make the Fund vulnerable to unfavorable developments in that group of industries or economic sector.
■
Financials Sector. The Fund is vulnerable to the particular risks that may affect companies in the financials sector. Companies in the financials sector are subject to certain risks, including the risk of regulatory change, decreased liquidity in credit markets and unstable interest rates. Such companies may have concentrated portfolios, such as a high level of loans to one or more industries or sectors, which makes them vulnerable to economic conditions that affect such industries or sectors. Performance of such companies may be affected by competitive pressures and exposure to investments, agreements and counterparties, including credit products that, under certain circumstances, may lead to losses (e.g., subprime loans). Companies in the financials sector are subject to extensive governmental regulation that may limit the amount and types of loans and other financial commitments they can make, and the interest rates and fees they may charge. In addition, profitability of such companies is largely dependent upon the availability and the cost of capital.
Value Securities Risk. Value securities are securities of companies that may have experienced, for example, adverse business, industry or other developments or may be subject to special risks that have caused the securities to be out of favor and, in turn, potentially undervalued. The market value of a portfolio security may not meet the perceived value assessment of that security as determined by the portfolio managers, or may decline in price, even though the securities are already believed to be undervalued by the portfolio managers. There is also a risk that it may take longer than expected for the value of these investments to rise to the perceived value as determined by the portfolio managers. In addition, value securities, at times, may not perform as well as growth securities or the stock market in general, and may be out of favor with investors for varying periods of time.
Performance Information
The following bar chart and table show you how the Fund has performed in the past, and can help you understand the risks of investing in the Fund. The bar chart shows how the Fund’s Class 2 share performance has varied for each full calendar year shown. The table below the bar chart compares the Fund’s returns for the periods shown with a broad measure of market performance, as well as another measure of performance for markets in which the Fund may invest.
Except for differences in annual returns resulting from differences in expenses (where applicable), the share classes of the Fund would have substantially similar annual returns because all share classes of the Fund invest in the same portfolio of securities.
The returns shown do not reflect any fees and expenses imposed under your Contract or Qualified Plan and would be lower if they did.
6
Prospectus 2026
Columbia Variable Portfolio – Select Mid Cap Value Fund
Summary of the Fund (continued)
| Year by Year Total Return (%) as of December 31 Each Year |
Best and Worst Quarterly Returns During the Period Shown in the Bar Chart | ||
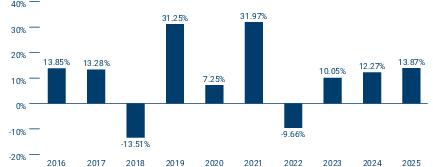 |
|
|
|
| |
|
- | |
Average Annual Total Returns (for periods ended December 31, 2025)
| |
Share Class Inception Date |
1 Year |
5 Years |
10 Years |
| Class 1 |
|
|
|
|
| Class 2 |
|
|
|
|
| Class 3 |
|
|
|
|
| Russell Midcap® Value Index (reflects no deductions for fees, expenses or taxes) |
|
|
|
|
| Russell 3000® Index (reflects no deductions for fees, expenses or taxes) |
|
|
|
|
Fund Management
Investment Manager: Columbia Management Investment Advisers, LLC
| Portfolio Management |
Title |
Role with Fund |
Managed Fund Since |
| Kari Montanus |
Senior Portfolio Manager |
Lead Portfolio Manager |
2018 |
| Jonas Patrikson, CFA |
Senior Portfolio Manager |
Portfolio Manager |
2014 |
Purchase and Sale of Fund Shares
The Fund is available for purchase through Contracts offered by the separate accounts of participating insurance companies or Qualified Plans or by other eligible investors authorized by Columbia Management Investment Distributors, Inc. (the Distributor). Shares of the Fund may not be purchased or sold by individual owners of Contracts or Qualified Plans. If you are a Contract holder or Qualified Plan participant, please refer to your separate Contract prospectus or Qualified Plan disclosure documents for information about minimum investment requirements and how to purchase and redeem shares of the Fund on days the Fund is open for business.
Tax Information
The Fund expects to be treated as a partnership for U.S. federal income tax purposes, and does not expect to make regular distributions (other than in redemption of Fund shares) to shareholders which are generally the participating insurance companies investing in the Fund through separate accounts or Qualified Plans or certain other eligible investors authorized by the Distributor. You should consult with the participating insurance company that issued your Contract, plan sponsor or other eligible investor through which your investment in the Fund is made regarding the U.S. federal income taxation of your investment.
Prospectus 2026
7
Columbia Variable Portfolio – Select Mid Cap Value Fund
Summary of the Fund (continued)
Payments to Broker-Dealers and Other Financial Intermediaries
If you make allocations to the Fund, the Fund, its Distributor or other related companies may pay participating insurance companies or other financial intermediaries for the allocation (sale) of Fund shares and related services in connection with such allocations to the Fund. These payments may create a conflict of interest by influencing the participating insurance company, other financial intermediary or your salesperson to recommend an allocation to the Fund over another fund or other investment option. Ask your financial advisor or salesperson or visit your financial intermediary’s website for more information.
8
Prospectus 2026
Columbia Variable Portfolio – Select Mid Cap Value Fund
More Information About the Fund
Investment Objective
Columbia Variable Portfolio – Select Mid Cap Value Fund (the Fund) seeks to provide shareholders with long-term growth of capital. Only shareholders can change the Fund’s investment objective. Because any investment involves risk, there is no assurance the Fund’s investment objective will be achieved.
Principal Investment Strategies
Under normal circumstances, the Fund invests at least 80% of its net assets (plus the amount of any borrowings for investment purposes) in equity securities of medium-sized companies. Medium-sized companies are those whose market capitalizations fall within the market capitalization range of the Russell Midcap® Value Index (the Capitalization Index), which ranged between $134.5 million and $116.7 billion as of March 31, 2026. The market capitalization range and composition of companies in the Capitalization Index are subject to change. As such, the size of the companies in which the Fund invests may change. The Fund may continue to hold a security even if the company’s market capitalization is no longer within the range of the Capitalization Index. Under normal circumstances, the Fund also invests at least 80% of its net assets (plus the amount of any borrowings for investment purposes) in equity securities of “value” companies. The Fund considers “value” companies to be those companies that are either constituents of an index constructed by a third party to identify companies with various characteristics of value companies, or that have a higher book-to-price (B/P) ratio than the median ranked stock within the company’s GICS sector, have a higher EBITDA/EV (earnings before interest, taxes, depreciation and amortization-to-enterprise value) or have a lower price-to-earnings ratio than the median ranked stock within the company’s GICS sector. The third-party broad-based index currently used to identify value companies is the Russell 3000® Value Index, although the Fund may change the referenced index without prior notice.
The Fund may invest up to 25% of its net assets in foreign investments. The Fund normally invests in common stocks and also may invest in real estate investment trusts. The Fund may at times emphasize one or more sectors in selecting its investments, including the financials sector. The Fund may hold a small number of securities, consistent with its value investment approach. Generally, the Fund anticipates holding between 30 and 50 securities in its portfolio; however, the Fund may hold, at any time, more or fewer securities than noted in this range.
The investment manager employs fundamental analysis with risk management in identifying value opportunities and constructing the Fund's portfolio.
In pursuit of the Fund’s objective, the portfolio managers use a bottom-up stock selection approach, which means that they concentrate on individual company fundamentals, rather than on a particular industry, although at times factors that make a particular company attractive may also make other companies within the same industry attractive, and the portfolio managers may invest in these issuers as well.
Columbia Management Investment Advisers, LLC (the Investment Manager) considers a variety of factors in identifying investment opportunities and constructing the Fund’s portfolio which may include, among others, the following:
■
a low price-to-earnings and/or low price-to-book ratio;
■
positive change in senior management;
■
positive corporate restructuring;
■
temporary setback in price due to factors that no longer exist or are ending;
■
a positive shift in the company’s business cycle; and/or
■
a catalyst for increase in the rate of the company’s earnings growth.
The Investment Manager generally sells a stock if it believes the stock has become fully valued, its fundamentals have deteriorated, or ongoing evaluation reveals that there are more attractive investment opportunities available. The Investment Manager monitors the Fund’s holdings, remaining sensitive to overvaluation and deteriorating fundamentals.
Prospectus 2026
9
Columbia Variable Portfolio – Select Mid Cap Value Fund
More Information About the Fund (continued)
The Fund’s investment policies with respect to 80% of its net assets may be changed by the Fund’s Board of Trustees without shareholder approval as long as shareholders are given 60 days’ advance written notice of the change.
Principal Risks
An investment in the Fund involves risks, including Mid-Cap Stock Risk, Market Risk, Value Securities Risk, and Focused Portfolio Risk, among others. Descriptions of these and other principal risks of investing in the Fund are provided below. There is no assurance that the Fund will achieve its investment objective and you may lose money. The value of the Fund’s holdings may decline, and the Fund’s net asset value (NAV) and share price may go down. An investment in the Fund is not a bank deposit and is not insured or guaranteed by the Federal Deposit Insurance Corporation or any other government agency. The significance of any specific risk to an investment in the Fund will vary over time depending on the composition of the Fund's portfolio, market conditions, and other factors. You should read all of the risk information below carefully, because any one or more of these risks may result in losses to the Fund.
Active Management Risk. The Fund is actively managed and its performance therefore will reflect, in part, the ability of the portfolio managers to make investment decisions that seek to achieve the Fund’s investment objective. Due to its active management, the Fund could underperform its benchmark index and/or other funds with similar investment objectives and/or strategies.
Equity Securities Risk. Investments in equity securities represent ownership in a company that fluctuates in value with changes in the company’s financial condition. Equity markets may experience significant volatility at times and may fall sharply in response to adverse events. Certain segments of the equity market may react differently than other segments and U.S. markets may react differently than foreign markets. Individual equity prices also may experience dramatic movements in price. Price movements may result from factors affecting individual companies, sectors, or industries selected for the Fund’s portfolio or the securities market as a whole, including periods of slower growth or recessionary economic conditions, future expectations of poor economic conditions, changes in political or social conditions, and lack of investor confidence. In addition, individual equity interests may be adversely affected by factors such as reduced sales, increased costs, or a negative outlook for the future performance of the company. As compared with preferred stock and debt, common stock generally involves greater risk and has lower priority when liquidation, bankruptcy, and dividend payments are made. Preferred stock may be subordinated to bonds or other debt instruments in a company’s capital structure and is typically less liquid than common stock.
Focused Portfolio Risk. The Fund, because it may invest in a limited number of companies, may have more volatility in its NAV and is considered to have more risk than a fund that invests in a greater number of companies because changes in the value of a single security may have a more significant effect, either negative or positive, on the Fund’s NAV. To the extent the Fund invests its assets in fewer securities, the Fund is subject to greater risk of loss if any of those securities decline in price.
Foreign Securities Risk. Investments in or exposure to securities of foreign companies may involve heightened risks relative to investments in or exposure to securities of U.S. companies. For example, foreign markets can be extremely volatile. Foreign securities may also be less liquid, making them more difficult to trade, than securities of U.S. companies so that the Fund may, at times, be unable to sell foreign securities at desirable times or prices. Brokerage commissions, custodial costs and other fees are also generally higher for foreign securities. The Fund may have limited or no legal recourse in the event of default with respect to certain foreign securities, including those issued by foreign governments. In addition, foreign governments may impose withholding or other taxes on the Fund’s income, capital gains or proceeds from the disposition of foreign securities, which could reduce the Fund’s return on such securities. In some cases, such withholding or other taxes could potentially be confiscatory. Other risks include: possible delays in the settlement of transactions or in the payment of income; generally less publicly available information about foreign companies; the impact of economic, political, social, diplomatic or other conditions or events (including, for example, military confrontations and actions, war, other conflicts, terrorism and disease/virus outbreaks and epidemics), possible seizure, expropriation or nationalization of a company or its assets or the assets of a particular investor or category of investors; accounting, auditing and financial reporting standards that may be less comprehensive and stringent than those applicable to domestic companies; the imposition of economic and other sanctions against a particular foreign country, its nationals or industries or businesses within
10
Prospectus 2026
Columbia Variable Portfolio – Select Mid Cap Value Fund
More Information About the Fund (continued)
the country; and the generally less stringent standard of care to which local agents may be held in the local markets. In addition, it may be difficult to obtain reliable information about the securities and business operations of certain foreign issuers. Governments or trade groups may compel local agents to hold securities in designated depositories that are not subject to independent evaluation. The less developed a country’s securities market is, the greater the level of risks. Economic sanctions may be, and have been, imposed against certain countries, organizations, companies, entities and/or individuals. Economic sanctions and other similar governmental actions could, among other things, effectively restrict or eliminate the Fund’s ability to purchase or sell securities, and thus may make the Fund’s investments in such securities less liquid or more difficult to value. In addition, as a result of economic sanctions, the Fund may be forced to sell or otherwise dispose of investments at inopportune times or prices, which could result in losses to the Fund and increased transaction costs. These conditions may be in place for a substantial period of time and enacted with limited advance notice to the Fund. The risks posed by sanctions against a particular foreign country, its nationals or industries or businesses within the country may be heightened to the extent the Fund invests significantly in the affected country or region or in issuers from the affected country that depend on global markets. Additionally, investments in certain countries may subject the Fund to a number of tax rules, the application of which may be uncertain. Countries may amend or revise their existing tax laws, regulations and/or procedures in the future, possibly with retroactive effect. Changes in or uncertainties regarding the laws, regulations or procedures of a country could reduce the after-tax profits of the Fund, directly or indirectly, including by reducing the after-tax profits of companies located in such countries in which the Fund invests, or result in unexpected tax liabilities for the Fund. The performance of the Fund may also be negatively affected by fluctuations in a foreign currency's strength or weakness relative to the U.S. dollar, particularly to the extent the Fund invests a significant percentage of its assets in foreign securities or other assets denominated in currencies other than the U.S. dollar. Currency rates in foreign countries may fluctuate significantly over short or long periods of time for a number of reasons, including changes in interest rates, imposition of currency exchange controls and economic or political developments in the U.S. or abroad. The Fund may also incur currency conversion costs when converting foreign currencies into U.S. dollars and vice versa.
Issuer Risk. An issuer in which the Fund invests or to which it has exposure may perform poorly or below expectations, and the value of its securities may therefore decline, which may negatively affect the Fund’s performance. Underperformance of an issuer may be caused by poor management decisions, competitive pressures, breakthroughs in technology, reliance on suppliers, labor problems or shortages, corporate restructurings, fraudulent disclosures, natural disasters, military confrontations and actions, war, other conflicts, terrorism, disease/virus outbreaks, epidemics or other events, conditions and factors which may impair the value of your investment in the Fund.
■
Mid-Cap Stock Risk. Securities of mid-cap companies can, in certain circumstances, have more risk than securities of larger companies. For example, mid-cap companies may be more vulnerable to market downturns and adverse business or economic events than larger companies because they may have more limited financial resources and business operations. Mid-cap companies are also more likely than larger companies to have more limited product lines and operating histories and to depend on smaller and generally less experienced management teams. Securities of mid-cap companies may trade less frequently and in smaller volumes and may fluctuate more sharply in value than securities of larger companies. When the Fund takes significant positions in mid-cap companies with limited trading volumes, the liquidation of those positions, particularly in a distressed market, could be difficult and result in Fund investment losses that would affect the value of your investment in the Fund. In addition, some mid-cap companies may not be widely followed by the investment community, which can lower the demand for their stocks.
Market Risk. The Fund may incur losses due to declines in the value of one or more securities in which it invests. These declines may be due to factors affecting a particular issuer, or the result of, among other things, political, regulatory, market, economic or social developments affecting the relevant market(s) more generally. In addition, turbulence in financial markets and reduced liquidity in equity, credit and/or fixed income markets may negatively affect many issuers, which could adversely affect the Fund’s ability to price or value hard-to-value assets in thinly traded and closed markets and could cause significant redemptions and operational challenges. Global economies and financial markets are increasingly interconnected, and conditions and events in one country, region or financial
Prospectus 2026
11
Columbia Variable Portfolio – Select Mid Cap Value Fund
More Information About the Fund (continued)
market may adversely impact issuers in a different country, region or financial market. These risks may be magnified if certain events or developments adversely interrupt the global supply chain; in these and other circumstances, such risks might affect companies worldwide. As a result, local, regional or global events such as terrorism, war, other conflicts, natural disasters, disease/virus outbreaks and epidemics or other public health issues, recessions, depressions or other events – or the potential for such events – could have a significant negative impact on global economic and market conditions.
The large-scale invasion of Ukraine by Russia in February 2022 has resulted in sanctions and market disruptions, including declines in regional and global stock markets, unusual volatility in global commodity markets and significant devaluations of Russian currency. In addition, the Iranian conflict that commenced in February 2026 may result in similar, and potentially more severe, disruptions. Escalation of hostilities in the Middle East region could disrupt energy production or transportation, including through key shipping routes, which may lead to increased volatility in energy and other commodity prices. The extent and duration of these conflicts are impossible to predict but could continue to be significant. Market disruption caused by these conflicts, and any countermeasures or responses thereto (including international sanctions, a downgrade in a country’s credit rating, purchasing and financing restrictions, boycotts, tariffs, changes in consumer or purchaser preferences, cyberattacks and espionage) could continue to have severe adverse impacts on regional and/or global securities and commodities markets, including markets for oil and natural gas. These impacts may include reduced market liquidity, distress in credit markets, further disruption of global supply chains, increased risk of inflation, and limited access to investments in certain international markets and/or issuers. These developments and other related events could negatively impact Fund performance.
Real Estate-Related Investment Risk. Investments in real estate investment trusts (REITs) and in securities of other companies (wherever organized) principally engaged in the real estate industry subject the Fund to, among other things, risks similar to those of direct investments in real estate and the real estate industry in general. These include risks related to general and local economic conditions, possible lack of availability of financing and changes in interest rates or property values. REITs are entities that either own properties or make construction or mortgage loans, and also may include operating or finance companies. The value of interests in a REIT may be affected by, among other factors, changes in the value of the underlying properties owned by the REIT, changes in the prospect for earnings and/or cash flow growth of the REIT itself, defaults by borrowers or tenants, market saturation, decreases in market rates for rents, and other economic, political, or regulatory matters affecting the real estate industry, including REITs. REITs and similar non-U.S. entities depend upon specialized management skills, may have limited financial resources, may have less trading volume in their securities, and may be subject to more abrupt or erratic price movements than the overall securities markets. In a rising interest rate environment, the stock prices of real estate-related investments may decline and the borrowing costs of these companies may increase. REITs are also subject to the risk of failing to qualify for favorable tax treatment under the Internal Revenue Code of 1986, as amended. The failure of a REIT to continue to qualify as a REIT for tax purposes can materially and adversely affect its value. Some REITs (especially mortgage REITs) are affected by risks similar to those associated with investments in debt securities including changes in interest rates and the quality of credit extended.
Sector Risk. At times, the Fund may have a significant portion of its assets invested in securities of companies conducting business in a related group of industries within one or more economic sectors, including the financials sector. Companies in the same sector may be similarly affected by economic, regulatory, political or market events or conditions, which may make the Fund vulnerable to unfavorable developments in that group of industries or economic sector.
■
Financials Sector. The Fund is vulnerable to the particular risks that may affect companies in the financials sector. Companies in the financials sector are subject to certain risks, including the risk of regulatory change, decreased liquidity in credit markets and unstable interest rates. Such companies may have concentrated portfolios, such as a high level of loans to one or more industries or sectors, which makes them vulnerable to economic conditions that affect such industries or sectors. Performance of such companies may be affected by competitive pressures and exposure to investments, agreements and counterparties, including credit products that, under certain circumstances, may lead to losses (e.g., subprime loans). Companies in the financials sector are subject to
12
Prospectus 2026
Columbia Variable Portfolio – Select Mid Cap Value Fund
More Information About the Fund (continued)
extensive governmental regulation that may limit the amount and types of loans and other financial commitments they can make, and the interest rates and fees they may charge. In addition, profitability of such companies is largely dependent upon the availability and the cost of capital.
Value Securities Risk. Value securities are securities of companies that may have experienced, for example, adverse business, industry or other developments or may be subject to special risks that have caused the securities to be out of favor and, in turn, potentially undervalued. The market value of a portfolio security may not meet the perceived value assessment of that security as determined by the portfolio managers, or may decline in price, even though the securities are already believed to be undervalued by the portfolio managers. There is also a risk that it may take longer than expected for the value of these investments to rise to the perceived value as determined by the portfolio managers. In addition, value securities, at times, may not perform as well as growth securities or the stock market in general, and may be out of favor with investors for varying periods of time.
Additional Investment Strategies and Policies
This section describes certain investment strategies and policies that the Fund may utilize in pursuit of its investment objective and some additional factors and risks involved with investing in the Fund.
Investment Guidelines
As a general matter, and except as specifically described in the discussion of the Fund's principal investment strategies in this prospectus or as otherwise required by the Investment Company Act of 1940, as amended (the 1940 Act), the rules and regulations thereunder and any applicable exemptive relief, whenever an investment policy or limitation states a percentage of the Fund's assets that may be invested in any security or other asset or sets forth a policy regarding an investment standard, compliance with that percentage limitation or standard will be determined solely at the time of the Fund's investment in the security or asset.
Holding Other Kinds of Investments
The Fund may hold other investments that are not part of its principal investment strategies. These investments and their risks are described below and/or in the Statement of Additional Information (SAI). The Fund may choose not to invest in certain securities described in this prospectus and in the SAI, although it has the ability to do so. Information on the Fund’s holdings can be found in the Fund’s Form N-CSR or by visiting columbiathreadneedleus.com.
Transactions in Derivatives
The Fund may enter into derivative transactions or otherwise have exposure to derivative transactions through underlying investments. Derivatives are financial contracts whose values are, for example, based on (or “derived” from) traditional securities (such as a stock or bond), assets (such as a commodity like gold or a foreign currency), reference rates (such as the Secured Overnight Financing Rate (commonly known as SOFR)) or market indices (such as the Standard & Poor’s 500® Index). The use of derivatives is a highly specialized activity which involves investment techniques and risks different from those associated with ordinary portfolio securities transactions. Derivatives involve special risks and may result in losses or may limit the Fund’s potential gain from favorable market movements. Derivative strategies often involve leverage, which may exaggerate a loss, potentially causing the Fund to lose more money than it would have lost had it invested in the underlying security or other asset directly. The values of derivatives may move in unexpected ways, especially in unusual market conditions, and may result in increased volatility in the value of the derivative and/or the Fund’s shares, among other consequences. Other risks arise from the Fund’s potential inability to terminate or to sell derivative positions. A liquid secondary market may not always exist for the Fund’s derivative positions at times when the Fund might wish to terminate or to sell such positions. Over-the-counter instruments (investments not traded on an exchange) may be illiquid, and transactions in derivatives traded in the over-the-counter market are subject to the risk that the other party will not meet its obligations. The use of derivatives also involves the risks of mispricing or improper valuation and that changes in the value of the derivative may not correlate perfectly with the underlying security, asset, reference rate or index. The Fund also may not be able to find a suitable derivative transaction counterparty, and thus may be unable to engage in derivative transactions when it is deemed favorable to do so, or at all. The U.S. government and the European Union
Prospectus 2026
13
Columbia Variable Portfolio – Select Mid Cap Value Fund
More Information About the Fund (continued)
(and some other jurisdictions) have enacted regulations and similar requirements that prescribe clearing, margin, reporting and registration requirements for participants in the derivatives market. These requirements are evolving and their ultimate impact on the Fund remains unclear, but such impact could include restricting and/or imposing significant costs or other burdens upon the Fund’s participation in derivatives transactions. Additionally, regulations governing the use of derivatives by registered investment companies, such as the Fund, require, among other things, that a fund that invests in derivative instruments beyond a specified limited amount apply a value-at-risk-based limit to its portfolio and establish a comprehensive derivatives risk management program. As of the date of this prospectus, the Fund is not required to maintain a comprehensive derivatives risk management program given its more limited use of derivatives. For more information on the risks of derivative investments and strategies, see the SAI.
Affiliated Fund Investing
The Investment Manager or an affiliate serves as investment adviser to funds using the Columbia brand (Columbia Funds), including those that are structured as “fund-of-funds”, and provides asset-allocation services to (i) shareholders by investing in shares of other Columbia Funds, which may include the Fund (collectively referred to in this section as Underlying Funds), and (ii) discretionary managed accounts (collectively referred to as affiliated products) that invest exclusively in Underlying Funds. These affiliated products, individually or collectively, may own a significant percentage of the outstanding shares of one or more Underlying Funds, and the Investment Manager seeks to balance potential conflicts of interest between the affiliated products and the Underlying Funds in which they invest. The affiliated products’ investment in the Underlying Funds may have the effect of creating economies of scale, possibly resulting in lower expense ratios for the Underlying Funds, because the affiliated products may own substantial portions of the shares of Underlying Funds. However, redemption of Underlying Fund shares by one or more affiliated products could cause the expense ratio of an Underlying Fund to increase, as its fixed costs would be spread over a smaller asset base. Because of large positions of certain affiliated products, the Underlying Funds may experience relatively large inflows and outflows of cash due to affiliated products’ purchases and sales of Underlying Fund shares. Although the Investment Manager or its affiliate may seek to minimize the impact of these transactions where possible, for example, by structuring them over a reasonable period of time or through other measures, Underlying Funds may experience increased expenses as they buy and sell portfolio securities to manage the cash flow effect related to these transactions. Further, when the Investment Manager or its affiliate structures transactions over a reasonable period of time in order to manage the potential impact of the buy and sell decisions for the affiliated products, those affiliated products, including funds-of-funds, may pay more or less (for purchase activity), or receive more or less (for redemption activity), for shares of the Underlying Funds than if the transactions were executed in one transaction. In addition, substantial redemptions by affiliated products within a short period of time could require the Underlying Fund to liquidate positions more rapidly than would otherwise be desirable, which may have the effect of reducing or eliminating potential gain or causing it to realize a loss. In order to meet such redemptions, an Underlying Fund may be forced to sell its liquid (or more liquid) positions, leaving the Underlying Fund holding, post-redemption, a relatively larger position in illiquid investments (i.e., any investment that the Fund reasonably expects cannot be sold or disposed of in current market conditions in seven calendar days or less without the sale or disposition significantly changing the market value of the investment) or less liquid securities. Substantial redemptions may also adversely affect the ability of the Underlying Fund to implement its investment strategy. The Investment Manager or its affiliate also has a conflict of interest in determining the allocation of affiliated products’ assets among the Underlying Funds, as it earns different fees from the various Underlying Funds.
Investing in Money Market Funds
The Fund may invest cash in, or hold as collateral for certain investments, shares of registered or unregistered money market funds, including funds advised by the Investment Manager or its affiliates. These funds are not insured or guaranteed by the Federal Deposit Insurance Corporation (FDIC) or any other government agency. The Fund and its shareholders indirectly bear a portion of the expenses of any money market fund or other fund in which the Fund may invest.
14
Prospectus 2026
Columbia Variable Portfolio – Select Mid Cap Value Fund
More Information About the Fund (continued)
Investing Defensively
The Fund may from time to time take temporary defensive investment positions that may be inconsistent with the Fund’s principal investment strategies in attempting to respond to adverse market, economic, political, social or other conditions, including, without limitation, investing some or all of its assets in money market instruments or shares of affiliated or unaffiliated money market funds or holding some or all of its assets in cash or cash equivalents. The Fund may take such defensive investment positions for as long a period as deemed necessary.
The Fund may not achieve its investment objective while it is investing defensively. Investing defensively may adversely affect Fund performance. During these times, the portfolio managers may make frequent portfolio holding changes, which could result in increased trading expenses and decreased Fund performance. See also Investing in Money Market Funds above for more information.
Other Strategic and Investment Measures
The Fund may also from time to time take temporary portfolio positions that may or may not be consistent with the Fund’s principal investment strategies in attempting to respond to adverse market, economic, political, social or other conditions, including, without limitation, investing in derivatives, such as forward contracts, futures contracts, options, structured investments and swaps, for various purposes, including among others, investing in particular derivatives in seeking to reduce investment exposures, or in seeking to achieve indirect investment exposures, to a sector, country, region or currency where the Investment Manager believes such positioning is appropriate. The Fund may take such portfolio positions for as long a period as deemed necessary. While the Fund is so positioned, derivatives could comprise a substantial portion of the Fund’s investments and the Fund may not achieve its investment objective. Investing in this manner may adversely affect Fund performance. During these times, the portfolio managers may make frequent portfolio holding changes, which could result in increased trading expenses and decreased Fund performance. For information on the risks of investing in derivatives, see Transactions in Derivatives above.
Portfolio Holdings Disclosure
The Board has adopted policies and procedures that govern the timing and circumstances of disclosure to shareholders and third parties of information regarding the securities owned by the Fund. A description of these policies and procedures is included in the SAI. Fund policy generally permits the disclosure of portfolio holdings information on the Fund's website (columbiathreadneedleus.com) only after a certain amount of time has passed, as described in the SAI.
Purchases and sales of portfolio securities can take place at any time, so the portfolio holdings information available on the Fund's website may not always be current.
FUNDamentals
Portfolio Holdings Versus the Benchmarks
The Fund does not limit its investments to the securities within its benchmark(s), and accordingly the Fund's holdings may diverge from those of its benchmark(s). In addition, the Fund may invest in securities outside any industry and geographic sectors represented in its benchmark(s). The Fund's weightings in individual securities, and in industry or geographic sectors, may also vary considerably from those of its benchmark(s).
Cash Flows
The timing and magnitude of cash inflows from investors buying Fund shares could prevent the Fund from always being fully invested. Conversely, the timing and magnitude of cash outflows to shareholders redeeming Fund shares could require the Fund to sell portfolio securities at less than opportune times or to hold ready reserves of uninvested cash in amounts larger than might otherwise be the case to meet shareholder redemptions. Either situation could adversely impact the Fund’s performance.
Prospectus 2026
15
Columbia Variable Portfolio – Select Mid Cap Value Fund
More Information About the Fund (continued)
Understanding Annual Fund Operating Expenses
The Fund’s annual operating expenses, as presented in the Annual Fund Operating Expenses table in the Fees and Expenses of the Fund section of this prospectus, generally are based on expenses incurred during the Fund’s most recently completed fiscal year, may vary by share class and are expressed as a percentage (expense ratio) of the Fund’s average net assets during that fiscal year. The expense ratios reflect the Fund’s fee arrangements as of the date of this prospectus and, unless indicated otherwise, are based on expenses incurred during the Fund’s most recent fiscal year. The Fund’s assets will fluctuate, but unless indicated otherwise in the Annual Fund Operating Expenses table, no adjustments have been or will be made to the expense ratios to reflect any differences in the Fund’s average net assets between the most recently completed fiscal year and the date of this prospectus or a later date. In general, the Fund’s expense ratios will increase as its net assets decrease, such that the Fund’s actual expense ratios may be higher than the expense ratios presented in the Annual Fund Operating Expenses table if assets fall. Any commitment by the Investment Manager and/or its affiliates to waive fees and/or cap (reimburse) expenses is expected, in part, to limit the impact of any increase in the Fund’s expense ratios that would otherwise result because of a decrease in the Fund’s assets in the current fiscal year. The Fund’s annual operating expenses are comprised of (i) investment management fees, (ii) distribution and/or service fees, and (iii) other expenses. Management fees do not vary by class, but distribution and/or service fees and other expenses may vary by class.
FUNDamentals
Other Expenses
“Other expenses” consist of the fees the Fund pays to its custodian, transfer agent, auditors, lawyers and trustees, costs relating to compliance and miscellaneous expenses. Generally, these expenses are allocated on a pro rata basis across all share classes. These fees include certain sub-transfer agency and shareholder servicing fees. For more information on these fees, see About Fund Shares and Transactions — Financial Intermediary Compensation.
Fee Waiver/Expense Reimbursement Arrangements and Impact on Past Performance
The Investment Manager and certain of its affiliates have contractually agreed to waive fees and/or reimburse expenses (excluding certain fees and expenses described below) through April 30, 2027, unless sooner terminated at the sole discretion of the Fund's Board, so that the Fund’s net operating expenses, after giving effect to fees waived/expenses reimbursed and any balance credits and/or overdraft charges from the Fund’s custodian, do not exceed the annual rates of:
| Columbia Variable Portfolio – Select Mid Cap Value Fund | |
| Class 1 |
0.83% |
| Class 2 |
1.08% |
| Class 3 |
0.955% |
Under the agreement, the following fees and expenses are excluded from the Fund’s operating expenses when calculating the waiver/reimbursement commitment, and therefore will be paid by the Fund, if applicable: taxes (including foreign transaction taxes), expenses associated with investment in affiliated and non-affiliated pooled investment vehicles (including mutual funds and exchange-traded funds), transaction costs and brokerage commissions, costs related to any securities lending program, dividend expenses associated with securities sold short, inverse floater program fees and expenses, transaction charges and interest on borrowed money, interest, costs associated with shareholder meetings, infrequent and/or unusual expenses and any other expenses the exclusion of which is specifically approved by the Fund’s Board. This agreement may be modified or amended only with approval from all parties.
16
Prospectus 2026
Columbia Variable Portfolio – Select Mid Cap Value Fund
More Information About the Fund (continued)
Effect of Fee Waivers and/or Expense Reimbursements on Past Performance. The Fund’s returns shown in the Performance Information section of this prospectus reflect the effect of any fee waivers and/or reimbursements of Fund expenses by the Investment Manager and/or any of its affiliates that were in place during the performance period shown. Without such fee waivers/expense reimbursements, the Fund’s returns might have been lower.
Primary Service Provider Contracts
The Fund enters into contractual arrangements (Service Provider Contracts) with various service providers, including, among others, the Investment Manager, the Distributor, Columbia Management Investment Services Corp. (the Transfer Agent) and the Fund’s custodian. The Fund’s Service Provider Contracts are solely among the parties thereto. Shareholders are not parties to, or intended to be third-party beneficiaries of, any Service Provider Contracts. Further, this prospectus, the SAI and any Service Provider Contracts are not intended to give rise to any agreement, duty, special relationship or other obligation between the Fund and any investor, or give rise to any contractual, tort or other rights in any individual shareholder, group of shareholders or other person, including any right to assert a fiduciary or other duty, enforce the Service Provider Contracts against the parties or to seek any remedy thereunder, either directly or on behalf of the Fund. Nothing in the previous sentence should be read to suggest any waiver of any rights under federal or state securities laws.
The Investment Manager, the Distributor, and the Transfer Agent are all affiliates of Ameriprise Financial, Inc. (Ameriprise Financial). They and their affiliates currently provide key services, including investment advisory, administration, distribution, shareholder servicing and transfer agency services, to the Fund and various other funds, including the Columbia Funds, and are paid for providing these services. These service relationships are described below.
The Investment Manager
Columbia Management Investment Advisers, LLC is located at 290 Congress Street, Boston, MA 02210 and serves as investment adviser and administrator to the Columbia Funds. The Investment Manager is a registered investment adviser and a wholly-owned subsidiary of Ameriprise Financial. The Investment Manager’s management experience covers all major asset classes, including equity securities, debt instruments and money market instruments. In addition to serving as an investment adviser to traditional mutual funds, exchange-traded funds and closed-end funds, the Investment Manager acts as an investment adviser for itself, its affiliates, individuals, corporations, retirement plans, private investment companies and financial intermediaries.
Subject to oversight by the Board, the Investment Manager manages the day-to-day operations of the Fund, determining what securities and other investments the Fund should buy or sell and executing portfolio transactions. The Investment Manager may use the research and other capabilities of its affiliates and third parties in managing the Fund’s investments. The Investment Manager is also responsible for overseeing the administrative operations of the Fund, including the general supervision of the Fund’s operations, the coordination of the Fund’s other service providers and the provision of related clerical and administrative services.
The SEC has issued an order that permits the Investment Manager, subject to the approval of the Board, to appoint unaffiliated subadvisers by entering into subadvisory agreements with them, and to change in material respects the terms of those subadvisory agreements, including the fees paid thereunder, for the Fund without first obtaining shareholder approval, thereby avoiding the expense and delays typically associated with obtaining shareholder approval. The Fund furnishes shareholders with information about new subadvisers retained in reliance on the order within 90 days after hiring the subadviser. The Investment Manager and its affiliates may have other relationships, including significant financial relationships, with current or potential subadvisers or their affiliates, which may create certain conflicts of interest. When making recommendations to the Board to appoint or to change a subadviser, or to change the terms of a subadvisory agreement, the Investment Manager discloses to the Board the nature of any such material relationships. The SEC has issued a separate order that permits the Board to approve new subadvisory agreements or material changes to existing subadvisory agreements at a meeting that is not in person, provided that the Trustees are able to participate in the meeting using a means of communication that allows them to hear each other simultaneously during the meeting and other conditions of the order are satisfied. At present, the Investment Manager has not engaged any investment subadviser for the Fund.
Prospectus 2026
17
Columbia Variable Portfolio – Select Mid Cap Value Fund
More Information About the Fund (continued)
The Fund pays the Investment Manager a fee for its management services, which include investment advisory services and administrative services. The fee is calculated as a percentage of the daily net assets of the Fund and is paid monthly. For the Fund’s most recent fiscal year, management services fees paid to the Investment Manager by the Fund amounted to 0.82% of average daily net assets of the Fund, before any applicable reimbursements.
A discussion regarding the basis for the Board’s approval of the renewal of the Fund's management agreement is available in the Fund’s Form N-CSR for the fiscal period ended June 30, 2025.
Portfolio Managers
Information about the portfolio managers primarily responsible for overseeing the Fund’s investments is shown below. The SAI provides additional information about the portfolio managers, including information relating to compensation, other accounts managed by the portfolio managers, and ownership by the portfolio managers of Fund shares.
| Portfolio Management |
Title |
Role with Fund |
Managed Fund Since |
| Kari Montanus |
Senior Portfolio Manager |
Lead Portfolio Manager |
2018 |
| Jonas Patrikson, CFA |
Senior Portfolio Manager |
Portfolio Manager |
2014 |
Ms. Montanus joined one of the Columbia Management legacy firms or acquired business lines in 2003. Ms. Montanus began her investment career in 1992 and earned a B.A. from Stanford University and an M.B.A. in finance from The Wharton School, University of Pennsylvania.
Mr. Patrikson joined one of the Columbia Management legacy firms or acquired business lines in 2004. Mr. Patrikson began his investment career in 1990 and earned a B.A. from the University of Linkoping, Sweden.
The Distributor
Shares of the Fund are distributed by Columbia Management Investment Distributors, Inc., which is located at 290 Congress Street, Boston, MA 02210. The Distributor is a registered broker-dealer and an indirect, wholly-owned subsidiary of Ameriprise Financial. The Distributor and its affiliates may pay commissions, distribution and service fees and/or other compensation to entities, including Ameriprise Financial affiliates, for selling shares and providing services to investors.
The Transfer Agent
Columbia Management Investment Services Corp. is a registered transfer agent and wholly-owned subsidiary of Ameriprise Financial. The Transfer Agent is located at 290 Congress Street, Boston, MA 02210, and its responsibilities include processing purchases, redemptions and transfers of Fund shares, calculating and paying distributions, maintaining shareholder records, preparing account statements and providing customer service. The Transfer Agent has engaged SS&C GIDS, Inc. to provide various sub-transfer agency services. The Fund pays a service fee to participating insurance companies or other financial intermediaries that provide sub-recordkeeping and other services to Contract owners and the separate accounts. The Transfer Agent may retain as compensation for its services revenues for fees for wire, telephone and redemption orders, account transcripts due the Transfer Agent from Fund shareholders and interest (net of bank charges) earned with respect to balances in accounts the Transfer Agent maintains in connection with its services to the Fund.
Other Roles and Relationships of Ameriprise Financial and its Affiliates — Certain Conflicts of Interest
The Investment Manager, Distributor and Transfer Agent, all affiliates of Ameriprise Financial, provide various services to the Fund and other Columbia Funds for which they are compensated. Ameriprise Financial and its other affiliates may also provide other services to these funds and be compensated for them.
The Investment Manager and its affiliates may provide investment advisory and other services to other clients and customers substantially similar to those provided to the Columbia Funds. These activities, and other financial services activities of Ameriprise Financial and its affiliates, may present actual and potential conflicts of interest and introduce certain investment constraints.
18
Prospectus 2026
Columbia Variable Portfolio – Select Mid Cap Value Fund
More Information About the Fund (continued)
Ameriprise Financial is a major financial services company, engaged in a broad range of financial activities beyond the fund-related activities of the Investment Manager, including, among others, insurance, broker-dealer (sales and trading), asset management, banking and other financial activities. These additional activities may involve multiple advisory, financial, insurance and other interests in securities and other instruments, and in companies that issue securities and other instruments, that may be bought, sold or held by the Columbia Funds.
Conflicts of interest and limitations that could affect a Columbia Fund may arise from, for example, the following:
■
compensation and other benefits received by the Investment Manager and other Ameriprise Financial affiliates related to the management/administration of a Columbia Fund and the sale of its shares;
■
the allocation of, and competition for, investment opportunities among the Fund, other funds and accounts advised/managed by the Investment Manager and other Ameriprise Financial affiliates, or Ameriprise Financial itself and its affiliates;
■
separate and potentially divergent management of a Columbia Fund and other funds and accounts advised/managed by the Investment Manager and other Ameriprise Financial affiliates;
■
regulatory and other investment restrictions on investment activities of the Investment Manager and other Ameriprise Financial affiliates and accounts advised/managed by them;
■
insurance and other relationships of Ameriprise Financial affiliates with companies and other entities in which a Columbia Fund invests;
■
regulatory and other restrictions relating to the sharing of information between Ameriprise Financial and its affiliates, including the Investment Manager, and a Columbia Fund; and
■
insurance companies investing in the Fund may be affiliates of Ameriprise Financial; these affiliated insurance companies, individually and collectively, may hold through separate accounts a significant portion of the Fund's shares and may also invest in separate accounts managed by the Investment Manager that have the same or substantially similar investment objectives and strategies as the Fund.
The Investment Manager and Ameriprise Financial have adopted various policies and procedures that are intended to identify, monitor and address conflicts of interest. However, there is no assurance that these policies, procedures and disclosures will be effective.
Additional information about Ameriprise Financial and the types of conflicts of interest and other matters referenced above is set forth in the Investment Management and Other Services — Other Roles and Relationships of Ameriprise Financial and its Affiliates — Certain Conflicts of Interest section of the SAI. Investors in the Columbia Funds should carefully review these disclosures and consult with their financial advisor if they have any questions.
Certain Legal Matters
Ameriprise Financial and certain of its affiliates are involved, in the normal course of business, in legal proceedings that include regulatory inquiries, arbitration and litigation (including class actions) concerning matters arising in connection with the conduct of their activities as part of a diversified financial services firm. Ameriprise Financial believes that the Fund is not currently the subject of, and that neither Ameriprise Financial nor any of its affiliates are the subject of, any pending legal, arbitration or regulatory proceedings that are likely to have a material adverse effect on the Fund or the ability of Ameriprise Financial or its affiliates to perform under their contracts with the Fund. Information regarding certain pending and settled legal proceedings may be found in the Fund’s Form N-CSR and in the SAI. Additionally, Ameriprise Financial is required to make quarterly (10-Q), annual (10-K) and, as necessary, 8-K filings with the SEC on legal and regulatory matters that relate to Ameriprise Financial and its affiliates. Copies of these filings may be obtained by accessing the SEC website at sec.gov.
Prospectus 2026
19
Columbia Variable Portfolio – Select Mid Cap Value Fund
About Fund Shares and Transactions
Description of the Share Classes
Share Class Features
The Fund offers the classes of shares set forth on the cover of this prospectus. Each share class has its own cost structure and other features. The following summarizes the primary features of the Class 1, Class 2 and Class 3 shares.
| |
Class 1 Shares |
Class 2 Shares |
Class 3 Shares |
| Eligible Investors |
Shares of the Fund are available only to separate accounts of participating insurance companies as underlying investments for variable annuity contracts and/or variable life insurance policies (collectively, Contracts) or qualified pension and retirement plans (Qualified Plans) or other eligible investors authorized by the Distributor. | ||
| Investment Limits |
none |
none |
none |
| Conversion Features |
none |
none |
none |
| Front-End Sales Charges |
none |
none |
none |
| Contingent Deferred Sales Charges (CDSCs) |
none |
none |
none |
| Maximum Distribution and/or Service Fees |
none |
0.25% |
0.125% |
FUNDamentals
Financial Intermediaries
The term “financial intermediary” refers to the insurance company that issued your contract, qualified pension or retirement plan sponsors or the financial intermediary that employs your financial advisor. Financial intermediaries also include broker-dealers and financial advisors as well as firms that employ broker-dealers and financial advisors, including, for example, brokerage firms, banks, investment advisers, third party administrators and other firms in the financial services industry, including Ameriprise Financial and its affiliates.
Distribution and/or Service Fees
Pursuant to Rule 12b-1 under the Investment Company Act of 1940, as amended (the 1940 Act), the Board has approved, and the Fund has adopted, a distribution plan which sets the distribution fees that are periodically deducted from the Fund’s assets for Class 2 and Class 3 shares. The distribution fee for Class 2 shares is 0.25% and the distribution fee for Class 3 shares is 0.125%. These fees are calculated daily, may vary by share class and are intended to compensate the Distributor and/or financial intermediaries for selling shares of the Fund and/or providing services to investors. Because the fees are paid out of the Fund’s assets on an ongoing basis, they will increase the cost of your investment over time.
The Fund will pay these fees to the Distributor and/or to eligible financial intermediaries for as long as the distribution plan continues. The Fund may reduce or discontinue payments at any time.
The Fund pays a service fee to participating insurance companies or other financial intermediaries that provide sub-recordkeeping and other services to Contract owners, Qualified Plan participants and the separate accounts.
Financial Intermediary Compensation
The Distributor, the Investment Manager and their affiliates make payments, from their own resources, to financial intermediaries, primarily to affiliated and unaffiliated insurance companies, for marketing/sales support services relating to the Fund (Marketing Support Payments). Such payments are generally based upon one or more of the following factors: average net assets of the Columbia Funds sold by the Distributor attributable to that financial intermediary; gross sales of the Columbia Funds distributed by the Distributor attributable to that financial intermediary; or a negotiated lump sum payment. While the financial arrangements may vary for each financial intermediary, the Marketing Support Payments to any one financial intermediary are generally between 0.05% and
20
Prospectus 2026
Columbia Variable Portfolio – Select Mid Cap Value Fund
About Fund Shares and Transactions (continued)
0.40% on an annual basis for payments based on average net assets of the Fund attributable to the financial intermediary, and between 0.05% and 0.25% on an annual basis for a financial intermediary receiving a payment based on gross sales of the Columbia Funds attributable to the financial intermediary.
As employee compensation and business unit operating goals at all levels are generally tied to the success of Ameriprise Financial, employees of Ameriprise Financial and its affiliates, including employees of affiliated broker-dealers and insurance companies, are incented to include shares of the Columbia Funds in Contracts offered by affiliated insurance companies. Certain employees, directly or indirectly, receive higher compensation and other benefits as investment in the Columbia Funds increases. In addition, management, sales leaders and other employees may spend more of their time and resources promoting Ameriprise Financial and its subsidiary companies, including the Distributor and the Investment Manager, and the products they offer, including the Fund.
In addition, the Transfer Agent has certain arrangements in place to compensate financial intermediaries, primarily to affiliated and unaffiliated insurance companies, that hold Fund shares through networked and omnibus accounts, including omnibus retirement plans, for services that they provide to beneficial Fund shareholders (Shareholder Services). Shareholder Services and related fees vary by financial intermediary and may include sub-accounting, sub-transfer agency, participant recordkeeping, shareholder or participant reporting, shareholder or participant transaction processing, maintenance of shareholder records, preparation of account statements and provision of customer service, and are not intended to include services that are primarily intended to result in the sale of Fund shares. Payments for Shareholder Services generally are not expected, with certain limited exceptions, to exceed 0.40% of the average aggregate value of the Fund’s shares. Each Fund pays the Transfer Agent a service fee equal to the payments made by the Transfer Agent to participating insurance companies and other financial intermediaries that provide Shareholder Services up to the lesser of the amount charged by the financial intermediary or a contractual asset-based cap. Payments of amounts that exceed the amount paid by the Fund are borne by the Transfer Agent, the Investment Manager and/or their affiliates.
In addition to the payments described above, the Distributor, the Investment Manager and their affiliates typically make other payments or allow promotional incentives to certain broker-dealers to the extent permitted by SEC and Financial Industry Regulatory Authority (FINRA) rules and by other applicable laws and regulations.
Amounts paid by the Distributor, the Investment Manager and their affiliates are paid out of their own resources and do not increase the amount paid by you or the Fund. You can find further details in the SAI about the payments made by the Distributor, the Investment Manager and their affiliates, as well as a list of the financial intermediaries, including Ameriprise Financial affiliates, to which the Distributor, the Investment Manager or their affiliates have agreed to make Marketing Support Payments and fee payments for Shareholder Services.
Your financial intermediary may charge you fees and commissions in addition to those described in this prospectus. You should consult with your financial intermediary and review carefully any disclosure your financial intermediary provides regarding its services and compensation. Depending on the financial arrangement in place at any particular time, a financial intermediary and its financial advisors may have a conflict of interest or financial incentive with respect to recommendations regarding the Fund or any Contract or Qualified Plan that includes the Fund.
Share Price Determination
The price you pay or receive when you buy, sell or transfer shares is the Fund's next determined net asset value (or NAV) per share for a given share class. The Fund calculates the NAV per share for each class of shares of the Fund at the end of each business day, with the value of the Fund's shares based on the total value of all of the securities and other assets that it holds as of such specified time.
Prospectus 2026
21
Columbia Variable Portfolio – Select Mid Cap Value Fund
About Fund Shares and Transactions (continued)
FUNDamentals
NAV Calculation
Each of the Fund's share classes calculates its NAV per share as follows:
NAV per share = (Value of assets of the share class) – (Liabilities of the share class)
Number of outstanding shares of the class
Number of outstanding shares of the class
FUNDamentals
Business Days
A business day is any day that the New York Stock Exchange (NYSE) is open. A business day typically ends at the close of regular trading on the NYSE, usually at 4:00 p.m. Eastern time. If the NYSE is scheduled to close early, the business day will be considered to end as of the time of the NYSE’s scheduled close. The Fund will not treat an intraday unscheduled disruption in NYSE trading or an intraday unscheduled closing as a close of regular trading on the NYSE for these purposes and will price its shares as of the regularly scheduled closing time for that day (typically, 4:00 p.m. Eastern time). Nonetheless, the NAV of Fund shares may be determined at such other time or times (in addition to or in lieu of the time set forth above) as the Fund’s Board may approve or ratify. On holidays and other days when the NYSE is closed, the Fund’s NAV is not calculated and the Fund does not accept buy or sell orders. However, the value of the Fund’s assets may still be affected on such days to the extent that the Fund holds foreign securities that trade on days that foreign securities markets are open.
Equity securities listed on an exchange are typically valued at the closing price or last trade on their primary exchange at the close of business of the NYSE. Equity securities without a readily available closing price or that are not listed on any exchange are typically valued at the mean between the closing bid and asked prices. Other equity securities, debt securities and other assets are valued differently. For instance, bank loans trading in the secondary market are fair valued unless market quotations are readily available, fixed income investments maturing in 60 days or less are valued primarily using the amortized cost method, unless this methodology results in a valuation that does not approximate the market value of these securities, and those maturing in excess of 60 days are valued based on prices obtained from a pricing service, if available (which may represent market values or fair values). Investments in other open-end funds are valued at their published NAVs. The value of the Fund’s portfolio securities is determined in accordance with the valuation policy approved by the Board (the Valuation Policy). Pursuant to Rule 2a-5 under the 1940 Act, the Board has designated the Investment Manager as the Fund’s valuation designee. The Investment Manager, in turn, has authorized its valuation committee to make fair value determinations and to carry out supervisory and certain other functions relating to the valuation of Fund portfolio securities, pursuant to the Valuation Policy.
If a market price is not readily available or is deemed not to reflect market value for a portfolio security, the Investment Manager will determine the price based on a determination of the security's fair value pursuant to the Valuation Policy. In addition, the Investment Manager may use fair valuation techniques to price securities that trade on a foreign exchange when a significant event has occurred after the foreign exchange closes but before the time at which the Fund’s share price is calculated. Foreign exchanges typically close before the time at which Fund share prices are calculated, and may be closed altogether on days when the Fund is open. Such significant events affecting a foreign security may include, but are not limited to: (1) corporate actions, earnings announcements, litigation or other events impacting a single issuer; (2) governmental action that affects securities in one sector or country; (3) natural disasters or armed conflicts affecting a country or region; or (4) significant domestic or foreign market fluctuations. The Fund uses various criteria, including an evaluation of U.S. market moves after the close of foreign markets, in determining whether a foreign security's market price is readily available and reflective of market value and, if not, the fair value of the security.
22
Prospectus 2026
Columbia Variable Portfolio – Select Mid Cap Value Fund
About Fund Shares and Transactions (continued)
Fair valuation may have the effect of reducing stale pricing arbitrage opportunities presented by the pricing of Fund shares. However, when the Investment Manager uses fair valuation to price equity securities, it may value those securities higher or lower than another fund or manager would. Also, fair valuation of Fund holdings may cause the Fund's performance to diverge to a greater degree from the performance of various benchmark indices used to compare the Fund's performance because indices generally do not use fair valuation techniques. Because of the judgment involved in fair valuation decisions, there can be no assurance that the value ascribed to a particular security is accurate. The Fund has retained one or more independent fair valuation pricing services to assist in the fair valuation process for foreign securities.
Futures and options on futures are valued based upon the settlement price as determined by the principal exchange on which they are traded or, in the absence of a settlement price, at the mean of the closing bid and ask. Generally, over-the-counter derivatives, such as swaps and swaptions, are valued based on a price provided by an approved pricing service.
Shareholder Information
Each share class has its own cost structure and other features. Your product may not offer every share class. The Fund encourages you to consult with a financial advisor who can help you with your investment decisions and for more information about the share classes offered by the Fund and available under your product. Shares of the Fund are generally available for purchase only by participating insurance companies in connection with Contracts and Qualified Plan sponsors.
The Fund, the Distributor or the Transfer Agent may refuse any order to buy or transfer shares. If this happens, the Fund will return any money it received, but no interest will be paid on that money.
Shares of the Fund may not be purchased or sold directly by individual Contract owners or participants in a Qualified Plan. When you sell your shares through your Contract or Qualified Plan, the Fund is effectively buying them back. This is called a redemption. The right of redemption may be suspended or payment postponed whenever permitted by applicable laws and regulations, as described under Satisfying Fund Redemption Requests below.
Depending on the context, references to “you” or “your” herein refer either to the holder of a Contract, participant in a Qualified Plan or qualified institutional investor who may select Fund shares to fund his or her investment in the Contract or Qualified Plan or to the participating insurance company as the holder of Fund shares through one or more separate accounts or the Qualified Plan.
Satisfying Fund Redemption Requests
The Fund typically expects to send the redeeming participating insurance company or Qualified Plan sponsor payment for shares within two business days after your trade date. The Fund can suspend redemptions and/or delay payment of redemption proceeds for up to seven days. The Fund can also suspend redemptions and/or delay payment of redemption proceeds in excess of seven days under certain circumstances, including when the NYSE is closed or trading thereon is restricted or during emergency or other circumstances, including as determined by the SEC.
The Fund typically seeks to satisfy redemption requests from cash or cash equivalents held by the Fund, from the proceeds of orders to purchase Fund shares or from the proceeds of sales of Fund holdings effected in the normal course of managing the Fund. However, the Fund may have to sell Fund holdings, including in down markets, to meet heavier than usual redemption requests. For example, under stressed or abnormal market conditions or circumstances, including circumstances adversely affecting the liquidity of the Fund’s investments, the Fund may be more likely to be forced to sell Fund holdings to meet redemptions than under normal market circumstances. In these situations, the Fund’s portfolio managers may have to sell Fund holdings that would not otherwise be sold because, among other reasons, the current price to be received is less than the value of the holdings perceived by the Fund’s portfolio managers. The Fund may also, under certain circumstances (but more likely under stressed or abnormal market conditions or circumstances), borrow money under a credit facility to which the Fund and certain other Columbia Funds are parties or from other Columbia Funds under an interfund lending program (except for closed-end funds and money market funds, which are not eligible to borrow under the program). The Fund and the
Prospectus 2026
23
Columbia Variable Portfolio – Select Mid Cap Value Fund
About Fund Shares and Transactions (continued)
other Columbia Funds are limited as to the amount that each may individually and collectively borrow under the credit facility and the interfund lending program. As a result, borrowings available to the Fund under the credit facility and the interfund lending program might be insufficient, alone or in combination with the other strategies described herein, to satisfy Fund redemption requests. Please see About Fund Investments – Borrowings – Interfund Lending in the SAI for more information about the credit facility and interfund lending program. The Fund is also limited in the total amount it may borrow. The Fund may only borrow to the extent permitted by the 1940 Act, the rules and regulations thereunder, and any exemptive relief available to the Fund, which currently limit Fund borrowings to 33 1/3% of total assets (including any amounts borrowed) less liabilities (other than borrowings), plus an additional 5% of its total assets for temporary purposes (to be repaid within 60 days without extension or renewal), in each case determined at the time the borrowing is made.
In addition, the Fund reserves the right to honor redemption orders in whole or in part with in-kind distributions of Fund portfolio securities instead of cash if the Investment Manager, in its sole discretion, determines it to be in the best interest of the remaining shareholders. Such in-kind distributions typically represent a pro-rata portion of Fund portfolio assets subject to adjustments (e.g., for non-transferable securities, round lots and derivatives). In the event the Fund distributes portfolio securities in kind, shareholders may incur brokerage and other transaction costs associated with converting the portfolio securities into cash. Also, the portfolio securities may increase or decrease in value after they are distributed but before they are converted into cash. For U.S. federal income tax purposes, redemptions paid in securities are generally treated the same as redemptions paid in cash. If, during any 90-day period, you redeem shares in an amount greater than $250,000 or 1% of the Fund’s net assets (whichever is less), and if the Investment Manager determines it to be feasible and appropriate, the Fund may pay the redemption amount above such threshold by an in-kind distribution of Fund portfolio securities. Although shares of the Fund may not be purchased or sold by individual owners of Contracts or Qualified Plans, this policy applies indirectly to Contract and Qualified Plan owners.
Potential Conflicts of Interest – Mixed and Shared Funding
The Fund is available for purchase only through Contracts offered by participating insurance companies, Qualified Plans and other qualified institutional investors authorized by the Distributor. Due to differences in tax treatment and other considerations, the interests of various Contract owners, and the interests of Qualified Plan participants, if any, may conflict. The Fund does not foresee any disadvantages to investors arising from these potential conflicts of interest at this time. Nevertheless, the Board of the Fund intends to monitor events to identify any material irreconcilable conflicts which may arise, and to determine what action, if any, should be taken in response to any conflicts. If such a conflict were to arise, one or more separate accounts might be required to withdraw its investments in the Fund or shares of another mutual fund may be substituted. This might force the Fund to sell securities at disadvantageous prices.
Order Processing
Orders to buy and sell shares of the Fund that are placed by your participating insurance company or Qualified Plan sponsor are processed on business days. Orders received in “good form” by the Transfer Agent or a financial intermediary, including your participating insurance company or Qualified Plan sponsor, before the end of a business day are priced at the NAV per share of the Fund's applicable share class on that day. Orders received after the end of a business day will receive the next business day’s NAV per share. An order is in “good form” if the Transfer Agent or your financial intermediary has all of the information and documentation it deems necessary to effect your order. The market value of the Fund’s investments may change between the time you submit your order and the time the Fund next calculates its NAV per share. The business day that applies to your order is also called the trade date.
There is no sales charge associated with the purchase of Fund shares, but there may be charges associated with your Contract or Qualified Plan. Any charges that apply to your Contract or Qualified Plan, and any charges that apply to separate accounts of participating insurance companies or Qualified Plans that may own shares directly, are described in your separate Contract prospectus or Qualified Plan disclosure documents.
24
Prospectus 2026
Columbia Variable Portfolio – Select Mid Cap Value Fund
About Fund Shares and Transactions (continued)
You may transfer all or part of your investment in the Fund to one or more of the other investment options available under your Contract or Qualified Plan. You may provide instructions to sell any amount allocated to the Fund. Proceeds will be mailed within seven days after your surrender or withdrawal request is received in good form by an authorized agent. The amount you receive may be more or less than the amount you invested.
Please refer to your Contract prospectus or Qualified Plan disclosure documents, as applicable, for more information about transfers as well as surrenders and withdrawals.
Information Sharing Agreements
As required by Rule 22c-2 under the 1940 Act, the Fund or certain of its service providers will enter into information sharing agreements with financial intermediaries, including participating life insurance companies and financial intermediaries that sponsor or offer retirement plans through which shares of the Fund are made available for purchase. Pursuant to Rule 22c-2, financial intermediaries are required, upon request, to: (i) provide shareholder account and transaction information; and (ii) execute instructions from the Fund to restrict or prohibit further purchases of Fund shares by shareholders who have been identified by the Fund as having engaged in transactions that violate the Fund's excessive trading policies and procedures.
Excessive Trading Practices Policy of Non-Money Market Funds
Right to Reject or Restrict Share Transaction Orders — The Fund is intended for investors with long-term investment purposes and is not intended as a vehicle for frequent trading activity (market timing) that is excessive. Investors should transact in Fund shares primarily for investment purposes. The Board has adopted excessive trading policies and procedures that are designed to deter excessive trading by investors (the Excessive Trading Policies and Procedures). The Fund discourages and does not accommodate excessive trading. Investments in a Fund by institutional investors in connection with redemptions in-kind are exempt from the Excessive Trading Policies and Procedures because they generally do not raise market timing or excessive trading concerns. Further discussion about the Fund’s use of redemptions in-kind is available under Satisfying Fund Redemption Requests.
The Fund reserves the right to reject, without any prior notice, any purchase or transfer order for any reason, and will not be liable for any loss resulting from rejected orders. For example, the Fund may in its sole discretion restrict or reject a purchase or transfer order even if the transaction is not subject to the specific limitation described below if the Fund or its agents determine that accepting the order could interfere with efficient management of the Fund's portfolio or is otherwise contrary to the Fund's best interests. The Excessive Trading Policies and Procedures apply equally to purchase or transfer transactions communicated directly to the Transfer Agent and to those received by financial intermediaries.
Specific Buying and Transferring Limitations — If the Fund detects that an investor has made two “material round trips” in any 28-day period, it will generally reject the investor's future purchase orders, including transfer buy orders, involving any Fund.
For these purposes, a “round trip” is a purchase or transfer into the Fund followed by a sale or transfer out of the Fund, or a sale or transfer out of the Fund followed by a purchase or transfer into the Fund. A “material” round trip is one that is deemed by the Fund to be material in terms of its amount or its potential detrimental impact on the Fund. Independent of this limit, the Fund may, in its sole discretion, reject future purchase orders by any person, group or account that appears to have engaged in any type of excessive trading activity.
These limits generally do not apply to automated transactions or transactions by registered investment companies in a “fund-of-funds” structure. These limits do not apply to payroll deduction contributions by retirement plan participants, transactions initiated by a retirement plan sponsor or certain other retirement plan transactions consisting of rollover transactions, loan repayments and disbursements, and required minimum distribution redemptions. They may be modified or rescinded for accounts held by certain retirement plans to conform to plan limits, for considerations relating to the Employee Retirement Income Security Act of 1974 or regulations of the Department of Labor, and for certain asset allocation or wrap programs. Accounts known to be under common ownership or control generally will be counted together, but accounts maintained or managed by a common
Prospectus 2026
25
Columbia Variable Portfolio – Select Mid Cap Value Fund
About Fund Shares and Transactions (continued)
intermediary generally will not be considered to be under common ownership or control. The Fund reserves the right to modify these restrictions at any time without prior notice to shareholders. In addition, the Fund may, in its sole discretion, reinstate trading privileges that have been revoked under the Fund's Excessive Trading Policies and Procedures.
Limitations on the Ability to Detect and Prevent Excessive Trading Practices — The Fund takes various steps designed to detect and prevent excessive trading, including daily review of available shareholder transaction information. However, the Fund receives buy, sell or transfer orders through financial intermediaries, and cannot always know of or reasonably detect excessive trading that may be facilitated by financial intermediaries or by the use of the omnibus account arrangements they offer. Omnibus account arrangements are common forms of holding shares of mutual funds, particularly among certain financial intermediaries such as broker-dealers, retirement plans and variable insurance products. These arrangements often permit financial intermediaries to aggregate their clients' transactions and accounts, and in these circumstances, the identities of the financial intermediary clients that beneficially own Fund shares are often not known to the Fund.
Some financial intermediaries apply their own restrictions or policies to their clients’ transactions and accounts, which may be more or less restrictive than those described here. This may impact the Fund's ability to curtail excessive trading, even where it is identified. For these and other reasons, it is possible that excessive trading may occur despite the Fund's efforts to detect and prevent it.
Although these restrictions and policies involve judgments that are inherently subjective and may involve some selectivity in their application, the Fund seeks to act in a manner that it believes is consistent with the best interests of Fund shareholders in making any such judgments.
Risks of Excessive Trading — Excessive trading creates certain risks to the Fund's long-term shareholders and may create the following adverse effects:
■
negative impact on the Fund's performance;
■
potential dilution of the value of the Fund's shares;
■
interference with the efficient management of the Fund's portfolio, such as the need to maintain undesirably large cash positions, the need to use its line of credit or the need to buy or sell securities it otherwise would not have bought or sold;
■
losses on the sale of investments resulting from the need to sell securities at less favorable prices; and
■
increased brokerage and administrative costs.
To the extent that the Fund invests significantly in foreign securities traded on markets that close before the Fund's valuation time, it may be particularly susceptible to dilution, which may be exacerbated as a result of excessive trading. Because events may occur after the close of foreign markets and before the Fund's valuation time that influence the value of foreign securities, investors may seek to trade Fund shares in an effort to benefit from their understanding of the value of foreign securities as of the Fund's valuation time. This is often referred to as price arbitrage. The Fund has adopted procedures designed to adjust closing market prices of foreign securities under certain circumstances to reflect what the Fund believes to be the fair value of those securities as of its valuation time. To the extent the adjustments do not work fully, investors engaging in price arbitrage may cause dilution in the value of the Fund's shares held by other shareholders.
Similarly, to the extent that the Fund invests significantly in thinly traded securities and other debt instruments that are rated below investment grade (commonly called “high-yield” or “junk” bonds), equity securities of small-capitalization companies, floating rate loans, or tax-exempt or other securities that may trade infrequently, because these securities are often traded infrequently, investors may seek to trade Fund shares in an effort to benefit from their understanding of the value of these securities as of the Fund's valuation time. This is also a type of price arbitrage. Any such frequent trading strategies may interfere with efficient management of the Fund's portfolio to a greater degree than would be the case for mutual funds that invest only, or significantly, in highly liquid securities, in part because the Fund may have difficulty selling these particular investments at advantageous times or prices to satisfy large and/or frequent sell orders. Any successful price arbitrage may also cause dilution in the value of Fund shares held by non-redeeming shareholders.
26
Prospectus 2026
Columbia Variable Portfolio – Select Mid Cap Value Fund
About Fund Shares and Transactions (continued)
Excessive Trading Practices Policy of Columbia Variable Portfolio - Government Money Market Fund
A money market fund is designed to offer investors a liquid cash option that they may buy and sell as often as they wish. Accordingly, the Board has not adopted policies and procedures designed to discourage excessive or short-term trading of Columbia Variable Portfolio - Government Money Market Fund shares. However, since frequent purchases and sales of Columbia Variable Portfolio - Government Money Market Fund shares could in certain instances harm shareholders in various ways, including reducing the returns to long-term shareholders by increasing costs (such as spreads paid to dealers who trade money market instruments with Columbia Variable Portfolio - Government Money Market Fund) and disrupting portfolio management strategies, Columbia Variable Portfolio - Government Money Market Fund reserves the right, but has no obligation, to reject any purchase or transfer transaction at any time. Columbia Variable Portfolio - Government Money Market Fund has no limits on purchase or transfer transactions. In addition, Columbia Variable Portfolio - Government Money Market Fund reserves the right to impose or modify restrictions on purchases, transfers or trading of Fund shares at any time.
Prospectus 2026
27
Columbia Variable Portfolio – Select Mid Cap Value Fund
Distributions and Taxes
Distributions to Shareholders
A mutual fund can make money two ways:
■
It can earn income on its investments. Examples of fund income are interest paid on money market instruments and bonds, and dividends paid on common stocks.
■
A mutual fund can also have capital gains if the value of its investments increases.
In the case of the Fund, because the Fund expects to be treated as a partnership for tax purposes, it is not required to and does not expect to make regular distributions to its shareholders (other than in redemption of Fund shares), but may do so in the sole discretion of the Fund’s Board of Trustees (or its delegates).
Taxes and Your Investment
Taxation of the Fund: The Fund is currently treated and expects to continue to be treated as a partnership that is not a “publicly traded partnership” for U.S. federal income tax purposes. If the Fund were not to qualify for such treatment, the Fund could be subject to U.S. federal income tax at the Fund level, which would reduce the value of an investment in the Fund.
As a partnership that is not a “publicly traded partnership,” the Fund is generally not itself subject to U.S. federal income tax. Instead, each shareholder will be required to take into account for U.S. federal income tax purposes its allocable share of the Fund’s income, gains, losses, deductions, credits, and other tax items, without regard to whether such shareholder has received or will receive corresponding distributions from the Fund. In addition, unlike mutual funds that intend to be treated as regulated investment companies for U.S. federal income tax purposes, the Fund is not required to meet any specific qualifying income or distribution requirements, although to the extent regulated investment companies invest in the Fund, such requirements will be taken into account by the Fund.
Certain Fund income may be subject to tax in other countries, including withholding or other taxes on dividends, interest or capital gains. Tax conventions between certain countries and the United States may reduce or eliminate such taxes. In certain countries the Fund may incur a higher rate of tax on dividends than it would have incurred if the Fund had been treated as a regulated investment company.
As a partnership that is not a “publicly traded partnership,” the Fund is generally not itself subject to U.S. federal income tax. Instead, each shareholder will be required to take into account for U.S. federal income tax purposes its allocable share of the Fund’s income, gains, losses, deductions, credits, and other tax items, without regard to whether such shareholder has received or will receive corresponding distributions from the Fund. In addition, unlike mutual funds that intend to be treated as regulated investment companies for U.S. federal income tax purposes, the Fund is not required to meet any specific qualifying income or distribution requirements, although to the extent regulated investment companies invest in the Fund, such requirements will be taken into account by the Fund.
Certain Fund income may be subject to tax in other countries, including withholding or other taxes on dividends, interest or capital gains. Tax conventions between certain countries and the United States may reduce or eliminate such taxes. In certain countries the Fund may incur a higher rate of tax on dividends than it would have incurred if the Fund had been treated as a regulated investment company.
Taxation of Fund Shares: Shares of the Fund are only offered to separate accounts of participating insurance companies, Qualified Plans, and certain other eligible persons or plans permitted to hold shares of the Fund pursuant to the applicable U.S. Treasury Regulations without impairing the ability of participating insurance companies to satisfy the diversification requirements of Section 817(h) of the Internal Revenue Code of 1986, as amended. Each participating insurance company, including each participating insurance company that is an affiliate of the Investment Manager, includes in its taxable income any net investment income derived from the investment of assets held in its separate accounts because the insurance company is considered the owner of these assets under federal income tax law. The insurance company may claim certain tax benefits associated with this investment income, which benefits may be greater with respect to the Fund than if the Fund were treated as a regulated investment company for U.S. federal income tax purposes. These benefits, which may include foreign tax credits (which can reduce the insurance company’s U.S. taxes on foreign source income) and the corporate dividends-received deduction (which is a tax deduction for the insurance company attributable to certain dividends received by the Fund), are not passed on to Contract owners since the affiliated insurance company is the owner of the assets under federal tax law and is taxed on the investment income generated by the assets.
Taxation of Variable Annuity Contracts and Variable Life Insurance Policies: Your Contract may qualify for favorable tax treatment. Please refer to your Contract prospectus for more information about the tax implications of your investment in the Contract. As long as your Contract continues to qualify for such favorable tax treatment, you will not be taxed currently on your investment in the Fund through such Contract, even if the Fund makes allocations or distributions to the separate account and/or you change your investment options under the Contract. In order to qualify for such treatment, among other things, the separate accounts of participating insurance companies, which maintain and invest net proceeds from Contracts, must be “adequately diversified.” The Fund intends to operate in such a manner so that a separate account investing only in Fund shares on behalf of a holder of a Contract will be “adequately diversified.” If the Fund does not meet such requirements because its investments are not adequately
28
Prospectus 2026
Columbia Variable Portfolio – Select Mid Cap Value Fund
Distributions and Taxes (continued)
diversified, your Contract could lose its favorable tax treatment, and income and gain allocable to your Contract could be taxable currently to you. This could also occur if Contract holders are found to have an impermissible level of control over the investments underlying their Contracts or if the Fund does not qualify for treatment as a partnership that is not a “publicly traded partnership.” You should consult with the participating insurance company that issued your Contract, plan sponsor, or other eligible investor through which your investment in the Fund is made regarding the U.S. federal income taxation of your investment.
FUNDamentals
Taxes
The information provided above is only a summary of how U.S. federal income taxes may affect your indirect investment in the Fund. It is not intended as a substitute for careful tax planning. Your investment in the Fund may have other tax implications. It does not apply to certain types of investors who may be subject to special rules, including foreign or tax-exempt investors or those holding Fund shares through a tax-advantaged account other than a Contract, such as a 401(k) plan or IRA. Please see the SAI for more detailed tax information. You should consult with your own tax advisor about the particular tax consequences to you of an investment in the Fund, including the effect of any foreign, state and local taxes, and the effect of possible changes in applicable tax laws.
Prospectus 2026
29
Columbia Variable Portfolio – Select Mid Cap Value Fund
Financial Highlights
The financial highlights table is intended to help you understand the Fund’s financial performance for the past five fiscal years or, if shorter, the Fund’s period of operations. Certain information reflects financial results for a single Fund share. Per share net investment income (loss) amounts are calculated based on average shares outstanding during the period. The total return in the table represents the rate that an investor would have earned (or lost) on an investment in the Fund assuming all dividends and distributions had been reinvested. Total return does not reflect any fees and expenses imposed under your Contract and/or Qualified Plan, as applicable; such fees and expenses would reduce the total return for all periods shown. Total return and portfolio turnover are not annualized for periods of less than one year. The ratios of expenses and net investment income are annualized for periods of less than one year. The portfolio turnover rate is calculated without regard to purchase and sales transactions of short-term instruments and certain derivatives, if any. If such transactions were included, the Fund’s portfolio turnover rate may be higher. A zero balance may reflect an amount rounding to less than $0.01 or 0.01%. This information has been audited by PricewaterhouseCoopers LLP, an independent registered public accounting firm, whose report, along with the Fund’s financial statements, is included in the Fund’s Form N-CSR, which is available upon request.
Prospectus 2026
31
Columbia Variable Portfolio – Select Mid Cap Value Fund
Financial Highlights (continued)
| |
Net asset value, beginning of period |
Net investment income |
Net realized and unrealized gain (loss) |
Total from investment operations |
| Class 1 | ||||
| Year Ended 12/31/2025 |
$41.46 |
0.43 |
5.45 |
5.88 |
| Year Ended 12/31/2024 |
$36.84 |
0.40 |
4.22 |
4.62 |
| Year Ended 12/31/2023 |
$33.40 |
0.39 |
3.05 |
3.44 |
| Year Ended 12/31/2022 |
$36.88 |
0.30 |
(3.78) |
(3.48) |
| Year Ended 12/31/2021 |
$27.87 |
0.22 |
8.79 |
9.01 |
| Class 2 | ||||
| Year Ended 12/31/2025 |
$40.08 |
0.31 |
5.25 |
5.56 |
| Year Ended 12/31/2024 |
$35.70 |
0.30 |
4.08 |
4.38 |
| Year Ended 12/31/2023 |
$32.44 |
0.29 |
2.97 |
3.26 |
| Year Ended 12/31/2022 |
$35.91 |
0.22 |
(3.69) |
(3.47) |
| Year Ended 12/31/2021 |
$27.21 |
0.14 |
8.56 |
8.70 |
| Class 3 | ||||
| Year Ended 12/31/2025 |
$40.76 |
0.37 |
5.34 |
5.71 |
| Year Ended 12/31/2024 |
$36.26 |
0.35 |
4.15 |
4.50 |
| Year Ended 12/31/2023 |
$32.91 |
0.34 |
3.01 |
3.35 |
| Year Ended 12/31/2022 |
$36.39 |
0.26 |
(3.74) |
(3.48) |
| Year Ended 12/31/2021 |
$27.54 |
0.18 |
8.67 |
8.85 |
| Notes to Financial Highlights | |
| (a) |
In addition to the fees and expenses that the Fund bears directly, the Fund indirectly bears a pro rata share of the fees and expenses of any other funds in which it invests. Such indirect expenses are not included in the Fund's reported expense ratios. |
| (b) |
Total net expenses include the impact of certain fee waivers/expense reimbursements made by the Investment Manager and certain of its affiliates, if applicable. |
| (c) |
Ratios include interfund lending expense which is less than 0.01%. |
32
Prospectus 2026
Columbia Variable Portfolio – Select Mid Cap Value Fund
Financial Highlights (continued)
| |
Net asset value, end of period |
Total return |
Total gross expense ratio to average net assets(a) |
Total net expense ratio to average net assets(a),(b) |
Net investment income ratio to average net assets |
Portfolio turnover |
Net assets, end of period (000's) |
| Class 1 | |||||||
| Year Ended 12/31/2025 |
$47.34 |
14.18% |
0.91% |
0.82% |
1.00% |
11% |
$131,896 |
| Year Ended 12/31/2024 |
$41.46 |
12.54% |
0.90% |
0.82% |
1.00% |
7% |
$129,275 |
| Year Ended 12/31/2023 |
$36.84 |
10.30% |
0.89%(c) |
0.82%(c) |
1.14% |
17% |
$156,439 |
| Year Ended 12/31/2022 |
$33.40 |
(9.44%) |
0.88% |
0.83% |
0.89% |
24% |
$166,488 |
| Year Ended 12/31/2021 |
$36.88 |
32.33% |
0.88% |
0.82% |
0.68% |
32% |
$222,591 |
| Class 2 | |||||||
| Year Ended 12/31/2025 |
$45.64 |
13.87% |
1.16% |
1.07% |
0.74% |
11% |
$56,831 |
| Year Ended 12/31/2024 |
$40.08 |
12.27% |
1.16% |
1.07% |
0.77% |
7% |
$56,087 |
| Year Ended 12/31/2023 |
$35.70 |
10.05% |
1.14%(c) |
1.07%(c) |
0.89% |
17% |
$51,720 |
| Year Ended 12/31/2022 |
$32.44 |
(9.66%) |
1.13% |
1.08% |
0.66% |
24% |
$48,561 |
| Year Ended 12/31/2021 |
$35.91 |
31.97% |
1.13% |
1.07% |
0.45% |
32% |
$49,498 |
| Class 3 | |||||||
| Year Ended 12/31/2025 |
$46.47 |
14.01% |
1.03% |
0.94% |
0.87% |
11% |
$62,923 |
| Year Ended 12/31/2024 |
$40.76 |
12.41% |
1.03% |
0.94% |
0.89% |
7% |
$61,612 |
| Year Ended 12/31/2023 |
$36.26 |
10.18% |
1.02%(c) |
0.95%(c) |
1.01% |
17% |
$62,714 |
| Year Ended 12/31/2022 |
$32.91 |
(9.56%) |
1.01% |
0.95% |
0.78% |
24% |
$65,155 |
| Year Ended 12/31/2021 |
$36.39 |
32.14% |
1.01% |
0.95% |
0.57% |
32% |
$73,390 |
Prospectus 2026
33
Columbia Variable Portfolio – Select Mid Cap Value Fund

For More Information
The Fund is generally available only to owners of Contracts issued by participating insurance companies and participants in Qualified Plans. Please refer to your Contract prospectus or Qualified Plan disclosure documents for information about how to buy, sell and transfer shares of the Fund.
Additional Information About the Fund
Additional information about the Fund’s investments is available in the Fund’s annual and semiannual reports to shareholders and in Form N-CSR. In the Fund’s annual report, you will find a discussion of the market conditions and investment strategies that significantly affected the Fund’s performance during its last fiscal year. In the Fund’s Form N-CSR, you will find the Fund’s annual and semiannual financial statements. The SAI also provides additional information about the Fund and its policies. The SAI, which has been filed with the SEC, is legally part of this prospectus (incorporated by reference). To obtain these documents free of charge, to request other information about the Fund and to make shareholder inquiries, please contact the Fund as follows:
By Mail: Columbia Management Investment Services Corp.
P.O. Box 219104
Kansas City, MO 64121-9104
P.O. Box 219104
Kansas City, MO 64121-9104
By Telephone: 800.345.6611
Online: columbiathreadneedleus.com
Reports and other information about the Fund are also available in the EDGAR Database on the SEC’s website at http://www.sec.gov. You can receive copies of this information, for a duplication fee, by electronic request at the following e-mail address: publicinfo@sec.gov.
The investment company registration number of Columbia Funds Variable Series Trust II, of which the Fund is a series, is 811-22127.
Columbia Threadneedle Investments (Columbia Threadneedle) is the global brand name of the Columbia and Threadneedle group of companies.
The Fund is distributed by Columbia Management Investment Distributors, Inc., 290 Congress Street, Boston, MA 02210.
The Fund is distributed by Columbia Management Investment Distributors, Inc., 290 Congress Street, Boston, MA 02210.
© 2026 Columbia Threadneedle. All rights reserved.
PRO7021_12_E01_(05/26)

Columbia Variable Portfolio - Select Short Corporate Income Fund
(formerly known as Columbia Variable Portfolio – Limited Duration Credit Fund)
Prospectus
May 1, 2026
As with all mutual funds, the Securities and Exchange Commission (SEC) has not approved or disapproved these securities or passed upon the adequacy of this prospectus. Any representation to the contrary is a criminal offense.

Columbia Variable Portfolio - Select Short Corporate Income Fund
Table of Contents
| 3 | |
| 3 | |
| 3 | |
| 4 | |
| 4 | |
| 7 | |
| 8 | |
| 8 | |
| 8 | |
| 8 | |
| 9 | |
| 9 | |
| 9 | |
| 10 | |
| 14 | |
| 17 | |
| 19 | |
| 20 | |
| 21 | |
| 21 | |
| 21 | |
| 22 | |
| 24 | |
| 29 | |
| 29 | |
| 29 | |
| 31 |
2
Prospectus 2026
Columbia Variable Portfolio - Select Short Corporate Income Fund
Summary of the Fund
Investment Objective
Columbia Variable Portfolio - Select Short Corporate Income Fund (the Fund) seeks to provide shareholders with a level of current income consistent with preservation of capital.
Fees and Expenses of the Fund
This table describes the fees and expenses that you may pay as an investor in the Fund. The table does not reflect any fees or expenses imposed by your Contract or Qualified Plan, which are disclosed in your separate Contract prospectus or Qualified Plan disclosure documents. If the additional fees or expenses were reflected, the expenses set forth below would be higher.
Annual Fund Operating Expenses (expenses that you pay each year as a percentage of the value of your investment) | ||
| |
Class 1 |
Class 2 |
| Management fees |
% |
% |
| Distribution and/or service (12b-1) fees |
% |
% |
| Other expenses |
% |
% |
| Total annual Fund operating expenses(a) |
% |
% |
| Less: Fee waivers and/or expense reimbursements(b) |
( %) |
( %) |
| Total annual Fund operating expenses after fee waivers and/or expense reimbursements |
% |
% |
(a)
(b)
Example
The following example is intended to help you compare the cost of investing in the Fund with the cost of investing in other mutual funds. The example illustrates the hypothetical expenses that you would incur over the time periods indicated, and assumes that:
■
you invest $10,000 in the applicable class of Fund shares for the periods indicated,
■
your investment has a 5% return each year, and
■
the Fund’s total annual operating expenses remain the same as shown in the Annual Fund Operating Expenses table above.
The example does not reflect any fees and expenses that apply to your Contract or Qualified Plan. Inclusion of these charges would increase expenses for all periods shown.
Since the waivers and/or reimbursements shown in the Annual Fund Operating Expenses table above expire as indicated in the preceding table, they are only reflected in the 1 year example and the first year of the other examples. Although your actual costs may be higher or lower, based on the assumptions listed above, your costs would be:
| |
1 year |
3 years |
5 years |
10 years |
| Class 1 (whether or not shares are redeemed) |
$ |
$ |
$ |
$ |
| Class 2 (whether or not shares are redeemed) |
$ |
$ |
$ |
$ |
Prospectus 2026
3
Columbia Variable Portfolio - Select Short Corporate Income Fund
Summary of the Fund (continued)
Portfolio Turnover
The Fund may pay transaction costs, such as commissions, when it buys and sells securities (or “turns over” its portfolio). A higher portfolio turnover rate may indicate higher transaction costs. These costs, which are not reflected in annual fund operating expenses or in the example, affect the Fund’s performance. During the most recent fiscal year, the Fund’s portfolio turnover rate was 129 % of the average value of its portfolio.
Principal Investment Strategies
Under normal circumstances, the Fund invests at least 80% of its net assets (plus the amount of any borrowings for investment purposes) in corporate bonds. The Fund primarily invests in debt securities with short- and intermediate-term maturities generally similar to those included in the Fund’s benchmark index, the Bloomberg U.S. 1-5 Year Corporate Index (the Index). The Fund may invest up to 15% of its net assets in debt instruments that, at the time of purchase, are rated below investment grade or are unrated but determined to be of comparable quality (commonly referred to as “high-yield” investments or “junk” bonds).
The Fund’s duration is managed to help reduce volatility associated with changes in interest rates. Under normal circumstances, the Fund will target duration to be similar to or lower than that of the Index, but will not exceed that of the Index by more than one year. As of March 31, 2026, the duration of the Index was 2.71 years.
The Fund may invest in privately placed and other securities or instruments that are purchased and sold pursuant to Rule 144A or other exemptions under the Securities Act of 1933, as amended, subject to certain regulatory restrictions.
The Fund may invest up to 25% of its net assets in foreign investments.
Principal Risks
An investment in the Fund involves risks, including Interest Rate Risk, Credit Risk, Market Risk, and Changing Distribution Level Risk, among others. Descriptions of these and other principal risks of investing in the Fund are provided below. There is no assurance that the Fund will achieve its investment objective and you may lose money . The value of the Fund’s holdings may decline, and the Fund’s net asset value (NAV) and share price may go down. An investment in the Fund is not a bank deposit and is not insured or guaranteed by the Federal Deposit Insurance Corporation or any other government agency. The significance of any specific risk to an investment in the Fund will vary over time depending on the composition of the Fund's portfolio, market conditions, and other factors. You should read all of the risk information below carefully, because any one or more of these risks may result in losses to the Fund.
Active Management Risk. Due to its active management, the Fund could underperform its benchmark index and/or other funds with similar investment objectives and/or strategies.
Changing Distribution Level Risk. The Fund normally expects to receive income which may include interest, dividends and/or capital gains, depending upon its investments. The distribution amounts paid by the Fund will vary and generally depend on the amount of income the Fund earns (less expenses) on its portfolio holdings, and capital gains or losses it recognizes. A decline in the Fund’s income or net capital gains arising from its investments may reduce its distribution level.
Credit Risk. Credit risk is the risk that the value of debt instruments may decline if the issuer thereof defaults or otherwise becomes unable or unwilling, or is perceived to be unable or unwilling, to honor its financial obligations, such as making payments to the Fund when due. Credit rating agencies, such as S&P Global Ratings, Moody’s Investors Service, Inc. (Moody’s Ratings), Fitch Ratings, Inc. (Fitch), Morningstar DBRS (DBRS) and Kroll Bond Rating Agency, LLC (KBRA), assign credit ratings to certain debt instruments to indicate their credit risk. A rating downgrade by such agencies can negatively impact the value of such instruments. Lower-rated or unrated instruments held by the Fund may present increased credit risk as compared to higher-rated instruments. Non-investment grade debt instruments may be subject to greater price fluctuations and are more likely to experience a default than investment
4
Prospectus 2026
Columbia Variable Portfolio - Select Short Corporate Income Fund
Summary of the Fund (continued)
grade debt instruments and therefore may expose the Fund to increased credit risk. If the Fund purchases unrated instruments, or if the ratings of instruments held by the Fund are lowered after purchase, the Fund will depend on analysis of credit risk more heavily than usual.
Fixed Income Instruments Risk. The Fund is subject to the general risks and considerations associated with investing in debt securities, including the risk that issuers will fail to make timely payments of principal or interest or default altogether. Lower-rated securities in which the Fund may invest may be more volatile and may decline more in price in response to negative issuer developments or general economic news than higher rated securities. In addition, as interest rates rise, the Fund’s investments typically will lose value.
Foreign Securities Risk. Investments in or exposure to securities of foreign companies may involve heightened risks relative to investments in or exposure to securities of U.S. companies. Investing in securities of foreign companies subjects the Fund to the risks associated with an issuer’s (and any of its related companies’) country of organization and places of business operations, including risks related to political, regulatory, economic, social, diplomatic and other conditions or events (including, for example, military confrontations and actions, war, other conflicts, terrorism and disease/virus outbreaks and epidemics) occurring in the country or region, as well as risks associated with less developed custody and settlement practices. Foreign securities may be more volatile and less liquid than securities of U.S. companies and are subject to the risks associated with potential imposition of economic and other sanctions against a particular foreign country, its nationals or industries or businesses within the country. In addition, foreign governments may impose withholding or other taxes on the Fund’s income, capital gains or proceeds from the disposition of foreign securities, which could reduce the Fund’s return on such securities. The performance of the Fund may also be negatively affected by fluctuations in a foreign currency's strength or weakness relative to the U.S. dollar, particularly to the extent the Fund invests a significant percentage of its assets in foreign securities or other assets denominated in currencies other than the U.S. dollar.
High-Yield Investments Risk. Securities and other debt instruments held by the Fund that are rated below investment grade (commonly called “high-yield” or “junk” bonds) and unrated debt instruments of comparable quality expose the Fund to a greater risk of loss of principal and income than a fund that invests solely or primarily in investment grade debt instruments. In addition, these investments have greater price fluctuations, are less liquid and are more likely to experience a default than higher-rated debt instruments. High-yield debt instruments are considered to be predominantly speculative with respect to the issuer’s capacity to pay interest and repay principal.
Interest Rate Risk. Interest rate risk is the risk of losses attributable to changes in interest rates. In general, if interest rates rise, the values of debt instruments tend to fall, and if interest rates fall, the values of debt instruments tend to rise. Changes in the value of a debt instrument usually will not affect the amount of income the Fund receives from it but will generally affect the value of your investment in the Fund. Changes in interest rates may also affect the liquidity of the Fund’s investments in debt instruments. In general, the longer the maturity or duration of a debt instrument, the greater its sensitivity to changes in interest rates. For example, a three-year duration means a bond is expected to decrease in value by 3% if interest rates rise 1% and increase in value by 3% if interest rates fall 1%. Interest rate declines also may increase prepayments of debt obligations, which, in turn, would increase prepayment risk. The Fund is subject to the risk that the income generated by its investments may not keep pace with inflation. Actions by governments and central banking authorities can result in increases or decreases in interest rates. Higher periods of inflation could lead such authorities to raise interest rates. Such actions may negatively affect the value of debt instruments held by the Fund, resulting in a negative impact on the Fund's performance and NAV. Any interest rate increases could cause the value of the Fund’s investments in debt instruments to decrease. Rising interest rates may prompt redemptions from the Fund, which may force the Fund to sell investments at a time when it is not advantageous to do so, which could result in losses.
Issuer Risk. An issuer in which the Fund invests or to which it has exposure may perform poorly or below expectations, and the value of its securities may therefore decline, which may negatively affect the Fund’s performance. Underperformance of an issuer may be caused by poor management decisions, competitive pressures, breakthroughs in technology, reliance on suppliers, labor problems or shortages, corporate restructurings, fraudulent disclosures, natural disasters, military confrontations and actions, war, other conflicts, terrorism, disease/virus outbreaks, epidemics or other events, conditions and factors which may impair the value of your investment in the Fund.
Prospectus 2026
5
Columbia Variable Portfolio - Select Short Corporate Income Fund
Summary of the Fund (continued)
Liquidity Risk. Liquidity risk is the risk associated with any event, circumstance, or characteristic of an investment or market that negatively impacts the Fund’s ability to sell, or realize the proceeds from the sale of, an investment at a desirable time or price. Liquidity risk may arise because of, for example, a lack of marketability of the investment, which means that when seeking to sell its portfolio investments, the Fund could find that selling is more difficult than anticipated, especially during times of high market volatility. Decreases in the number of financial institutions, including banks and broker-dealers, willing to make markets (match up sellers and buyers) in the Fund’s investments or decreases in their capacity or willingness to trade such investments may increase the Fund’s exposure to this risk. The debt market has experienced considerable growth, and financial institutions making markets in instruments purchased and sold by the Fund (e.g., bond dealers) have been subject to increased regulation. The impact of that growth and regulation on the ability and willingness of financial institutions to engage in trading or “making a market” in such instruments remains unsettled. Certain types of investments, such as lower-rated securities or those that are purchased and sold in over-the-counter markets, may be especially subject to liquidity risk. Securities or other assets in which the Fund invests may be traded in the over-the-counter market rather than on an exchange and therefore may be more difficult to purchase or sell at a fair price, which may have a negative impact on the Fund’s performance. Market participants attempting to sell the same or a similar instrument at the same time as the Fund could exacerbate the Fund’s exposure to liquidity risk. The Fund may have to accept a lower selling price for the holding, sell other liquid or more liquid investments that it might otherwise prefer to hold (thereby increasing the proportion of the Fund’s investments in less liquid or illiquid securities), or forego another more appealing investment opportunity. The liquidity of Fund investments may change significantly over time and certain investments that were liquid when purchased by the Fund may later become illiquid, particularly in times of overall economic distress. Changing regulatory, market or other conditions or environments (for example, the interest rate or credit environments) may also adversely affect the liquidity and the price of the Fund's investments. Judgment plays a larger role in valuing illiquid or less liquid investments as compared to valuing liquid or more liquid investments. Price volatility may be higher for illiquid or less liquid investments as a result of, for example, the relatively less frequent pricing of such securities (as compared to liquid or more liquid investments). Generally, the less liquid the market at the time the Fund sells a portfolio investment, the greater the risk of loss or decline of value to the Fund. Overall market liquidity and other factors can lead to an increase in redemptions, which may negatively impact Fund performance and NAV, including, for example, if the Fund is forced to sell investments in a down market.
Market Risk. The Fund may incur losses due to declines in the value of one or more securities in which it invests. These declines may be due to factors affecting a particular issuer, or the result of, among other things, political, regulatory, market, economic or social developments affecting the relevant market(s) more generally. In addition, turbulence in financial markets and reduced liquidity in equity, credit and/or fixed income markets may negatively affect many issuers, which could adversely affect the Fund’s ability to price or value hard-to-value assets in thinly traded and closed markets and could cause significant redemptions and operational challenges. Global economies and financial markets are increasingly interconnected, and conditions and events in one country, region or financial market may adversely impact issuers in a different country, region or financial market. These risks may be magnified if certain events or developments adversely interrupt the global supply chain; in these and other circumstances, such risks might affect companies worldwide. As a result, local, regional or global events such as terrorism, war, other conflicts, natural disasters, disease/virus outbreaks and epidemics or other public health issues, recessions, depressions or other events – or the potential for such events – could have a significant negative impact on global economic and market conditions.
Reinvestment Risk. Reinvestment risk arises when the Fund is unable to reinvest income or principal at the same or at least the same return it is currently earning.
Rule 144A and Other Exempted Securities Risk. The Fund may invest in privately placed and other securities or instruments exempt from SEC registration (collectively “private placements”), subject to certain regulatory restrictions. In the U.S. market, private placements are typically sold only to qualified institutional buyers, or qualified purchasers, as applicable. An insufficient number of buyers interested in purchasing private placements at a particular time could adversely affect the marketability of such investments and the Fund might be unable to dispose of them promptly or at reasonable prices, subjecting the Fund to liquidity risk. The Fund’s holdings of private placements may increase the level of Fund illiquidity if eligible buyers are unable or unwilling to purchase them at a
6
Prospectus 2026
Columbia Variable Portfolio - Select Short Corporate Income Fund
Summary of the Fund (continued)
particular time. Issuers of Rule 144A eligible securities are required to furnish information to potential investors upon request. However, the required disclosure is much less extensive than that required of public companies and is not publicly available since the offering information is not filed with the SEC. Further, issuers of Rule 144A eligible securities can require recipients of the offering information (such as the Fund) to agree contractually to keep the information confidential, which could also adversely affect the Fund’s ability to dispose of the security.
Unrated Securities Risk. The Fund may purchase unrated securities which are not rated by a rating agency. Unrated securities may be less liquid than comparable rated securities and involve the risk that the Investment Manager may not accurately evaluate the security’s comparative credit rating. Analysis of creditworthiness of issuers of high yield securities may be more complex than for issuers of higher-quality debt securities. To the extent that the Fund purchases unrated securities, the Fund’s success in achieving its investment objective may depend more heavily on the Investment Manager’s creditworthiness analysis than if the Fund invested exclusively in rated securities.
Performance Information
The following bar chart and table show you how the Fund has performed in the past, and can help you understand the risks of investing in the Fund. The bar chart shows how the Fund’s Class 2 share performance has varied for each full calendar year shown. The table below the bar chart compares the Fund’s returns for the periods shown with a broad measure of market performance, as well as another measure of performance for markets in which the Fund may invest.
Except for differences in annual returns resulting from differences in expenses (where applicable), the share classes of the Fund would have substantially similar annual returns because all share classes of the Fund invest in the same portfolio of securities.
The returns shown do not reflect any fees and expenses imposed under your Contract or Qualified Plan and would be lower if they did.
Year by Year Total Return (%) as of December 31 Each Year |
Best and Worst Quarterly Returns During the Period Shown in the Bar Chart | ||
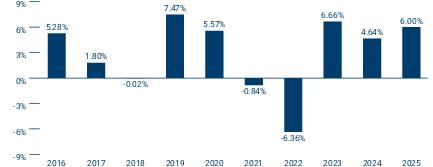 |
|
|
|
| |
|
- | |
Prospectus 2026
7
Columbia Variable Portfolio - Select Short Corporate Income Fund
Summary of the Fund (continued)
Average Annual Total Returns (for periods ended December 31, 2025)
| |
Share Class Inception Date |
1 Year |
5 Years |
10 Years |
| Class 1 |
|
|
|
|
| Class 2 |
|
|
|
|
| Bloomberg U.S. 1-5 Year Corporate Index (reflects no deductions for fees, expenses or taxes) |
|
|
|
|
| Bloomberg U.S. Aggregate Bond Index (reflects no deductions for fees, expenses or taxes) |
|
|
- |
|
Fund Management
Investment Manager: Columbia Management Investment Advisers, LLC
| Portfolio Management |
Title |
Role with Fund |
Managed Fund Since |
| Tom Murphy, CFA |
Vice President, Senior Portfolio Manager and Head of Investment Grade Credit |
Lead Portfolio Manager |
2010 |
| Royce D. Wilson, CFA |
Senior Portfolio Manager |
Portfolio Manager |
2012 |
| John Dawson, CFA |
Senior Portfolio Manager |
Portfolio Manager |
2020 |
Purchase and Sale of Fund Shares
The Fund is available for purchase through Contracts offered by the separate accounts of participating insurance companies or Qualified Plans or by other eligible investors authorized by Columbia Management Investment Distributors, Inc. (the Distributor). Shares of the Fund may not be purchased or sold by individual owners of Contracts or Qualified Plans. If you are a Contract holder or Qualified Plan participant, please refer to your separate Contract prospectus or Qualified Plan disclosure documents for information about minimum investment requirements and how to purchase and redeem shares of the Fund on days the Fund is open for business.
Tax Information
The Fund normally distributes its net investment income and net realized capital gains, if any, to its shareholders, which are generally the participating insurance companies and Qualified Plans investing in the Fund through separate accounts. These distributions may not be taxable to you as the holder of a Contract or a participant in a Qualified Plan. Please consult the prospectus or other information provided to you by your participating insurance company and/or Qualified Plan regarding the U.S. federal income taxation of your contract, policy and/or plan.
Payments to Broker-Dealers and Other Financial Intermediaries
If you make allocations to the Fund, the Fund, its Distributor or other related companies may pay participating insurance companies or other financial intermediaries for the allocation (sale) of Fund shares and related services in connection with such allocations to the Fund. These payments may create a conflict of interest by influencing the participating insurance company, other financial intermediary or your salesperson to recommend an allocation to the Fund over another fund or other investment option. Ask your financial advisor or salesperson or visit your financial intermediary’s website for more information.
8
Prospectus 2026
Columbia Variable Portfolio - Select Short Corporate Income Fund
More Information About the Fund
Investment Objective
Columbia Variable Portfolio - Select Short Corporate Income Fund (the Fund) seeks to provide shareholders with a level of current income consistent with preservation of capital. The Fund’s investment objective is not a fundamental policy and may be changed by the Fund’s Board of Trustees without shareholder approval as long as shareholders are given 60 days’ advance written notice of the change. Because any investment involves risk, there is no assurance the Fund’s investment objective will be achieved.
Principal Investment Strategies
Under normal circumstances, the Fund invests at least 80% of its net assets (plus the amount of any borrowings for investment purposes) in corporate bonds. The Fund primarily invests in debt securities with short- and intermediate-term maturities generally similar to those included in the Fund’s benchmark index, the Bloomberg U.S. 1-5 Year Corporate Index (the Index). The Fund may invest up to 15% of its net assets in debt instruments that, at the time of purchase, are rated below investment grade or are unrated but determined to be of comparable quality (commonly referred to as “high-yield” investments or “junk” bonds).
The Fund’s duration is managed to help reduce volatility associated with changes in interest rates. Under normal circumstances, the Fund will target duration to be similar to or lower than that of the Index, but will not exceed that of the Index by more than one year. As of March 31, 2026, the duration of the Index was 2.71 years. Duration measures the sensitivity of bond prices to changes in interest rates. The longer the duration of a bond, the more sensitive it will be to changes in interest rates. For example, a three-year duration means a bond is expected to decrease in value by 3% if interest rates rise 1% and increase in value by 3% if interest rates fall 1%.
The Fund may invest in privately placed and other securities or instruments that are purchased and sold pursuant to Rule 144A or other exemptions under the Securities Act of 1933, as amended, subject to certain regulatory restrictions.
The Fund may invest up to 25% of its net assets in foreign investments.
In pursuit of the Fund’s objective, Columbia Management Investment Advisers, LLC (the Investment Manager) chooses investments by:
■
Emphasizing an independent, proprietary credit research and selection process of issuers of debt securities over other factors such as interest rate and duration positioning;
■
Analyzing issuer-specific inputs, such as business strategy, management strength, competitive position and various financial metrics to identify the most attractive securities within each industry;
■
Investing opportunistically in lower-quality (junk) bonds based on relative valuations and risk-adjusted return expectations;
■
Utilizing quantitative risk controls and qualitative risk assessments in a framework that seeks to minimize issuer credit risk.
In evaluating whether to sell a security, the Investment Manager considers, among other factors:
■
Change in an issuer’s credit fundamentals relative to the Fund investment team’s expectations;
■
Changes to the fundamental attractiveness of a sector, industry group, or security;
■
Changes to the risk/reward trade-off of an issuer;
■
The potential development of event risk;
■
Adjustments needed to change overall portfolio risk.
The Fund’s investment policy with respect to 80% of its net assets may be changed by the Fund’s Board of Trustees without shareholder approval as long as shareholders are given 60 days’ advance written notice of the change.
Prospectus 2026
9
Columbia Variable Portfolio - Select Short Corporate Income Fund
More Information About the Fund (continued)
Principal Risks
An investment in the Fund involves risks, including Interest Rate Risk, Credit Risk, Market Risk, and Changing Distribution Level Risk, among others. Descriptions of these and other principal risks of investing in the Fund are provided below. There is no assurance that the Fund will achieve its investment objective and you may lose money. The value of the Fund’s holdings may decline, and the Fund’s net asset value (NAV) and share price may go down. An investment in the Fund is not a bank deposit and is not insured or guaranteed by the Federal Deposit Insurance Corporation or any other government agency. The significance of any specific risk to an investment in the Fund will vary over time depending on the composition of the Fund's portfolio, market conditions, and other factors. You should read all of the risk information below carefully, because any one or more of these risks may result in losses to the Fund.
Active Management Risk. The Fund is actively managed and its performance therefore will reflect, in part, the ability of the portfolio managers to make investment decisions that seek to achieve the Fund’s investment objective. Due to its active management, the Fund could underperform its benchmark index and/or other funds with similar investment objectives and/or strategies.
Changing Distribution Level Risk. The Fund normally expects to receive income which may include interest, dividends and/or capital gains, depending upon its investments. The distribution amounts paid by the Fund will vary and generally depend on the amount of income the Fund earns (less expenses) on its portfolio holdings, and capital gains or losses it recognizes. A decline in the Fund’s income or net capital gains arising from its investments may reduce its distribution level.
Credit Risk. Credit risk is the risk that the value of debt instruments may decline if the issuer thereof defaults or otherwise becomes unable or unwilling, or is perceived to be unable or unwilling, to honor its financial obligations, such as making payments to the Fund when due. Various factors could affect the actual or perceived willingness or ability of the issuer to make timely interest or principal payments, including changes in the financial condition of the issuer or in general economic conditions. Credit rating agencies, such as S&P Global Ratings, Moody’s Ratings, Fitch, DBRS and KBRA, assign credit ratings to certain debt instruments to indicate their credit risk. A rating downgrade by such agencies can negatively impact the value of such instruments. Lower-rated or unrated instruments held by the Fund may present increased credit risk as compared to higher-rated instruments. Non-investment grade debt instruments may be subject to greater price fluctuations and are more likely to experience a default than investment grade debt instruments and therefore may expose the Fund to increased credit risk. If the Fund purchases unrated instruments, or if the ratings of instruments held by the Fund are lowered after purchase, the Fund will depend on analysis of credit risk more heavily than usual.
Fixed Income Instruments Risk. The Fund is subject to the general risks and considerations associated with investing in debt securities, including the risk that issuers will fail to make timely payments of principal or interest or default altogether. Typically, shorter-term bonds are less volatile than longer-term bonds; however, longer-term bonds typically offer higher yields and more stable interest income than shorter-term bonds due to their longer term and extended fixed payment schedule. Lower-rated securities in which the Fund may invest may be more volatile and may decline more in price in response to negative issuer developments or general economic news than higher rated securities. In addition, as interest rates rise, the Fund’s investments typically will lose value.
Foreign Securities Risk. Investments in or exposure to securities of foreign companies may involve heightened risks relative to investments in or exposure to securities of U.S. companies. For example, foreign markets can be extremely volatile. Foreign securities may also be less liquid, making them more difficult to trade, than securities of U.S. companies so that the Fund may, at times, be unable to sell foreign securities at desirable times or prices. Brokerage commissions, custodial costs and other fees are also generally higher for foreign securities. The Fund may have limited or no legal recourse in the event of default with respect to certain foreign securities, including those issued by foreign governments. In addition, foreign governments may impose withholding or other taxes on the Fund’s income, capital gains or proceeds from the disposition of foreign securities, which could reduce the Fund’s return on such securities. In some cases, such withholding or other taxes could potentially be confiscatory. Other risks include: possible delays in the settlement of transactions or in the payment of income; generally less publicly available information about foreign companies; the impact of economic, political, social, diplomatic or other
10
Prospectus 2026
Columbia Variable Portfolio - Select Short Corporate Income Fund
More Information About the Fund (continued)
conditions or events (including, for example, military confrontations and actions, war, other conflicts, terrorism and disease/virus outbreaks and epidemics), possible seizure, expropriation or nationalization of a company or its assets or the assets of a particular investor or category of investors; accounting, auditing and financial reporting standards that may be less comprehensive and stringent than those applicable to domestic companies; the imposition of economic and other sanctions against a particular foreign country, its nationals or industries or businesses within the country; and the generally less stringent standard of care to which local agents may be held in the local markets. In addition, it may be difficult to obtain reliable information about the securities and business operations of certain foreign issuers. Governments or trade groups may compel local agents to hold securities in designated depositories that are not subject to independent evaluation. The less developed a country’s securities market is, the greater the level of risks. Economic sanctions may be, and have been, imposed against certain countries, organizations, companies, entities and/or individuals. Economic sanctions and other similar governmental actions could, among other things, effectively restrict or eliminate the Fund’s ability to purchase or sell securities, and thus may make the Fund’s investments in such securities less liquid or more difficult to value. In addition, as a result of economic sanctions, the Fund may be forced to sell or otherwise dispose of investments at inopportune times or prices, which could result in losses to the Fund and increased transaction costs. These conditions may be in place for a substantial period of time and enacted with limited advance notice to the Fund. The risks posed by sanctions against a particular foreign country, its nationals or industries or businesses within the country may be heightened to the extent the Fund invests significantly in the affected country or region or in issuers from the affected country that depend on global markets. Additionally, investments in certain countries may subject the Fund to a number of tax rules, the application of which may be uncertain. Countries may amend or revise their existing tax laws, regulations and/or procedures in the future, possibly with retroactive effect. Changes in or uncertainties regarding the laws, regulations or procedures of a country could reduce the after-tax profits of the Fund, directly or indirectly, including by reducing the after-tax profits of companies located in such countries in which the Fund invests, or result in unexpected tax liabilities for the Fund. The performance of the Fund may also be negatively affected by fluctuations in a foreign currency's strength or weakness relative to the U.S. dollar, particularly to the extent the Fund invests a significant percentage of its assets in foreign securities or other assets denominated in currencies other than the U.S. dollar. Currency rates in foreign countries may fluctuate significantly over short or long periods of time for a number of reasons, including changes in interest rates, imposition of currency exchange controls and economic or political developments in the U.S. or abroad. The Fund may also incur currency conversion costs when converting foreign currencies into U.S. dollars and vice versa.
High-Yield Investments Risk. Securities and other debt instruments held by the Fund that are rated below investment grade (commonly called “high-yield” or “junk” bonds) and unrated debt instruments of comparable quality tend to be more sensitive to credit risk than higher-rated debt instruments and may experience greater price fluctuations in response to perceived changes in the ability of the issuing entity or obligor to pay interest and principal when due than to changes in interest rates. These investments are generally more likely to experience a default than higher-rated debt instruments. High-yield debt instruments are considered to be predominantly speculative with respect to the issuer’s capacity to pay interest and repay principal. These debt instruments typically pay a premium – a higher interest rate or yield – because of the increased risk of loss, including default. High-yield debt instruments may require a greater degree of judgment to establish a price, may be difficult to sell at the time and price the Fund desires, may carry high transaction costs, and also are generally less liquid than higher-rated debt instruments. The ratings provided by third party rating agencies are based on analyses by these ratings agencies of the credit quality of the debt instruments and may not take into account every risk related to whether interest or principal will be timely repaid. In adverse economic and other circumstances, issuers of lower-rated debt instruments are more likely to have difficulty making principal and interest payments than issuers of higher-rated debt instruments.
Interest Rate Risk. Interest rate risk is the risk of losses attributable to changes in interest rates. In general, if interest rates rise, the values of debt instruments tend to fall, and if interest rates fall, the values of debt instruments tend to rise. Changes in the value of a debt instrument usually will not affect the amount of income the Fund receives from it but will generally affect the value of your investment in the Fund. Changes in interest rates may also affect the liquidity of the Fund’s investments in debt instruments. In general, the longer the maturity or duration of a debt instrument, the greater its sensitivity to changes in interest rates. For example, a three-year duration means a bond is
Prospectus 2026
11
Columbia Variable Portfolio - Select Short Corporate Income Fund
More Information About the Fund (continued)
expected to decrease in value by 3% if interest rates rise 1% and increase in value by 3% if interest rates fall 1%. Interest rate declines also may increase prepayments of debt obligations, which, in turn, would increase prepayment risk (the risk that the Fund will have to reinvest the money received in securities that have lower yields). The Fund is subject to the risk that the income generated by its investments may not keep pace with inflation. Actions by governments and central banking authorities can result in increases or decreases in interest rates. Higher periods of inflation could lead such authorities to raise interest rates. Such actions may negatively affect the value of debt instruments held by the Fund, resulting in a negative impact on the Fund's performance and NAV. Any interest rate increases could cause the value of the Fund’s investments in debt instruments to decrease. Rising interest rates may prompt redemptions from the Fund, which may force the Fund to sell investments at a time when it is not advantageous to do so, which could result in losses.
Issuer Risk. An issuer in which the Fund invests or to which it has exposure may perform poorly or below expectations, and the value of its securities may therefore decline, which may negatively affect the Fund’s performance. Underperformance of an issuer may be caused by poor management decisions, competitive pressures, breakthroughs in technology, reliance on suppliers, labor problems or shortages, corporate restructurings, fraudulent disclosures, natural disasters, military confrontations and actions, war, other conflicts, terrorism, disease/virus outbreaks, epidemics or other events, conditions and factors which may impair the value of your investment in the Fund.
Liquidity Risk. Liquidity risk is the risk associated with any event, circumstance, or characteristic of an investment or market that negatively impacts the Fund’s ability to sell, or realize the proceeds from the sale of, an investment at a desirable time or price. Liquidity risk may arise because of, for example, a lack of marketability of the investment, which means that when seeking to sell its portfolio investments, the Fund could find that selling is more difficult than anticipated, especially during times of high market volatility. Decreases in the number of financial institutions, including banks and broker-dealers, willing to make markets (match up sellers and buyers) in the Fund’s investments or decreases in their capacity or willingness to trade such investments may increase the Fund’s exposure to this risk. The debt market has experienced considerable growth, and financial institutions making markets in instruments purchased and sold by the Fund (e.g., bond dealers) have been subject to increased regulation. The impact of that growth and regulation on the ability and willingness of financial institutions to engage in trading or “making a market” in such instruments remains unsettled. Certain types of investments, such as lower-rated securities or those that are purchased and sold in over-the-counter markets, may be especially subject to liquidity risk. Securities or other assets in which the Fund invests may be traded in the over-the-counter market rather than on an exchange and therefore may be more difficult to purchase or sell at a fair price, which may have a negative impact on the Fund’s performance. Market participants attempting to sell the same or a similar instrument at the same time as the Fund could exacerbate the Fund’s exposure to liquidity risk. The Fund may have to accept a lower selling price for the holding, sell other liquid or more liquid investments that it might otherwise prefer to hold (thereby increasing the proportion of the Fund’s investments in less liquid or illiquid securities), or forego another more appealing investment opportunity. The liquidity of Fund investments may change significantly over time and certain investments that were liquid when purchased by the Fund may later become illiquid, particularly in times of overall economic distress. Changing regulatory, market or other conditions or environments (for example, the interest rate or credit environments) may also adversely affect the liquidity and the price of the Fund's investments. Judgment plays a larger role in valuing illiquid or less liquid investments as compared to valuing liquid or more liquid investments. Price volatility may be higher for illiquid or less liquid investments as a result of, for example, the relatively less frequent pricing of such securities (as compared to liquid or more liquid investments). Generally, the less liquid the market at the time the Fund sells a portfolio investment, the greater the risk of loss or decline of value to the Fund. Overall market liquidity and other factors can lead to an increase in redemptions, which may negatively impact Fund performance and NAV, including, for example, if the Fund is forced to sell investments in a down market.
Market Risk. The Fund may incur losses due to declines in the value of one or more securities in which it invests. These declines may be due to factors affecting a particular issuer, or the result of, among other things, political, regulatory, market, economic or social developments affecting the relevant market(s) more generally. In addition, turbulence in financial markets and reduced liquidity in equity, credit and/or fixed income markets may negatively affect many issuers, which could adversely affect the Fund’s ability to price or value hard-to-value assets in thinly
12
Prospectus 2026
Columbia Variable Portfolio - Select Short Corporate Income Fund
More Information About the Fund (continued)
traded and closed markets and could cause significant redemptions and operational challenges. Global economies and financial markets are increasingly interconnected, and conditions and events in one country, region or financial market may adversely impact issuers in a different country, region or financial market. These risks may be magnified if certain events or developments adversely interrupt the global supply chain; in these and other circumstances, such risks might affect companies worldwide. As a result, local, regional or global events such as terrorism, war, other conflicts, natural disasters, disease/virus outbreaks and epidemics or other public health issues, recessions, depressions or other events – or the potential for such events – could have a significant negative impact on global economic and market conditions.
The large-scale invasion of Ukraine by Russia in February 2022 has resulted in sanctions and market disruptions, including declines in regional and global stock markets, unusual volatility in global commodity markets and significant devaluations of Russian currency. In addition, the Iranian conflict that commenced in February 2026 may result in similar, and potentially more severe, disruptions. Escalation of hostilities in the Middle East region could disrupt energy production or transportation, including through key shipping routes, which may lead to increased volatility in energy and other commodity prices. The extent and duration of these conflicts are impossible to predict but could continue to be significant. Market disruption caused by these conflicts, and any countermeasures or responses thereto (including international sanctions, a downgrade in a country’s credit rating, purchasing and financing restrictions, boycotts, tariffs, changes in consumer or purchaser preferences, cyberattacks and espionage) could continue to have severe adverse impacts on regional and/or global securities and commodities markets, including markets for oil and natural gas. These impacts may include reduced market liquidity, distress in credit markets, further disruption of global supply chains, increased risk of inflation, and limited access to investments in certain international markets and/or issuers. These developments and other related events could negatively impact Fund performance.
Reinvestment Risk. Reinvestment risk arises when the Fund is unable to reinvest income or principal at the same or at least the same return it is currently earning.
Rule 144A and Other Exempted Securities Risk. The Fund may invest in privately placed and other securities or instruments exempt from SEC registration (collectively “private placements”), subject to certain regulatory restrictions. In the U.S. market, private placements are typically sold only to qualified institutional buyers, or qualified purchasers, as applicable. An insufficient number of buyers interested in purchasing private placements at a particular time could adversely affect the marketability of such investments and the Fund might be unable to dispose of them promptly or at reasonable prices, subjecting the Fund to liquidity risk (the risk that it may not be possible for the Fund to liquidate the instrument at an advantageous time or price). The Fund’s holdings of private placements may increase the level of Fund illiquidity if eligible buyers are unable or unwilling to purchase them at a particular time. The Fund may also have to bear the expense of registering the securities for resale and the risk of substantial delays in effecting the registration. Additionally, the purchase price and subsequent valuation of private placements typically reflect a discount, which may be significant, from the market price of comparable securities for which a more liquid market exists. Issuers of Rule 144A eligible securities are required to furnish information to potential investors upon request. However, the required disclosure is much less extensive than that required of public companies and is not publicly available since the offering information is not filed with the SEC. Further, issuers of Rule 144A eligible securities can require recipients of the offering information (such as the Fund) to agree contractually to keep the information confidential, which could also adversely affect the Fund’s ability to dispose of the security.
Unrated Securities Risk. The Fund may purchase unrated securities which are not rated by a rating agency. Unrated securities may be less liquid than comparable rated securities and involve the risk that the Investment Manager may not accurately evaluate the security’s comparative credit rating. Analysis of creditworthiness of issuers of high yield securities may be more complex than for issuers of higher-quality debt securities. To the extent that the Fund purchases unrated securities, the Fund’s success in achieving its investment objective may depend more heavily on the Investment Manager’s creditworthiness analysis than if the Fund invested exclusively in rated securities.
Prospectus 2026
13
Columbia Variable Portfolio - Select Short Corporate Income Fund
More Information About the Fund (continued)
Additional Investment Strategies and Policies
This section describes certain investment strategies and policies that the Fund may utilize in pursuit of its investment objective and some additional factors and risks involved with investing in the Fund.
Investment Guidelines
As a general matter, and except as specifically described in the discussion of the Fund's principal investment strategies in this prospectus or as otherwise required by the Investment Company Act of 1940, as amended (the 1940 Act), the rules and regulations thereunder and any applicable exemptive relief, whenever an investment policy or limitation states a percentage of the Fund's assets that may be invested in any security or other asset or sets forth a policy regarding an investment standard, compliance with that percentage limitation or standard will be determined solely at the time of the Fund's investment in the security or asset.
Holding Other Kinds of Investments
The Fund may hold other investments that are not part of its principal investment strategies. These investments and their risks are described below and/or in the Statement of Additional Information (SAI). The Fund may choose not to invest in certain securities described in this prospectus and in the SAI, although it has the ability to do so. Information on the Fund’s holdings can be found in the Fund’s Form N-CSR or by visiting columbiathreadneedleus.com.
Transactions in Derivatives
The Fund may enter into derivative transactions or otherwise have exposure to derivative transactions through underlying investments. Derivatives are financial contracts whose values are, for example, based on (or “derived” from) traditional securities (such as a stock or bond), assets (such as a commodity like gold or a foreign currency), reference rates (such as the Secured Overnight Financing Rate (commonly known as SOFR)) or market indices (such as the Standard & Poor’s 500® Index). The use of derivatives is a highly specialized activity which involves investment techniques and risks different from those associated with ordinary portfolio securities transactions. Derivatives involve special risks and may result in losses or may limit the Fund’s potential gain from favorable market movements. Derivative strategies often involve leverage, which may exaggerate a loss, potentially causing the Fund to lose more money than it would have lost had it invested in the underlying security or other asset directly. The values of derivatives may move in unexpected ways, especially in unusual market conditions, and may result in increased volatility in the value of the derivative and/or the Fund’s shares, among other consequences. Other risks arise from the Fund’s potential inability to terminate or to sell derivative positions. A liquid secondary market may not always exist for the Fund’s derivative positions at times when the Fund might wish to terminate or to sell such positions. Over-the-counter instruments (investments not traded on an exchange) may be illiquid, and transactions in derivatives traded in the over-the-counter market are subject to the risk that the other party will not meet its obligations. The use of derivatives also involves the risks of mispricing or improper valuation and that changes in the value of the derivative may not correlate perfectly with the underlying security, asset, reference rate or index. The Fund also may not be able to find a suitable derivative transaction counterparty, and thus may be unable to engage in derivative transactions when it is deemed favorable to do so, or at all. The U.S. government and the European Union (and some other jurisdictions) have enacted regulations and similar requirements that prescribe clearing, margin, reporting and registration requirements for participants in the derivatives market. These requirements are evolving and their ultimate impact on the Fund remains unclear, but such impact could include restricting and/or imposing significant costs or other burdens upon the Fund’s participation in derivatives transactions. Additionally, regulations governing the use of derivatives by registered investment companies, such as the Fund, require, among other things, that a fund that invests in derivative instruments beyond a specified limited amount apply a value-at-risk-based limit to its portfolio and establish a comprehensive derivatives risk management program. As of the date of this prospectus, the Fund is required to maintain a comprehensive derivatives risk management program. For more information on the risks of derivative investments and strategies, see the SAI.
14
Prospectus 2026
Columbia Variable Portfolio - Select Short Corporate Income Fund
More Information About the Fund (continued)
Affiliated Fund Investing
The Investment Manager or an affiliate serves as investment adviser to funds using the Columbia brand (Columbia Funds), including those that are structured as “fund-of-funds”, and provides asset-allocation services to (i) shareholders by investing in shares of other Columbia Funds, which may include the Fund (collectively referred to in this section as Underlying Funds), and (ii) discretionary managed accounts (collectively referred to as affiliated products) that invest exclusively in Underlying Funds. These affiliated products, individually or collectively, may own a significant percentage of the outstanding shares of one or more Underlying Funds, and the Investment Manager seeks to balance potential conflicts of interest between the affiliated products and the Underlying Funds in which they invest. The affiliated products’ investment in the Underlying Funds may have the effect of creating economies of scale, possibly resulting in lower expense ratios for the Underlying Funds, because the affiliated products may own substantial portions of the shares of Underlying Funds. However, redemption of Underlying Fund shares by one or more affiliated products could cause the expense ratio of an Underlying Fund to increase, as its fixed costs would be spread over a smaller asset base. Because of large positions of certain affiliated products, the Underlying Funds may experience relatively large inflows and outflows of cash due to affiliated products’ purchases and sales of Underlying Fund shares. Although the Investment Manager or its affiliate may seek to minimize the impact of these transactions where possible, for example, by structuring them over a reasonable period of time or through other measures, Underlying Funds may experience increased expenses as they buy and sell portfolio securities to manage the cash flow effect related to these transactions. Further, when the Investment Manager or its affiliate structures transactions over a reasonable period of time in order to manage the potential impact of the buy and sell decisions for the affiliated products, those affiliated products, including funds-of-funds, may pay more or less (for purchase activity), or receive more or less (for redemption activity), for shares of the Underlying Funds than if the transactions were executed in one transaction. In addition, substantial redemptions by affiliated products within a short period of time could require the Underlying Fund to liquidate positions more rapidly than would otherwise be desirable, which may have the effect of reducing or eliminating potential gain or causing it to realize a loss. In order to meet such redemptions, an Underlying Fund may be forced to sell its liquid (or more liquid) positions, leaving the Underlying Fund holding, post-redemption, a relatively larger position in illiquid investments (i.e., any investment that the Fund reasonably expects cannot be sold or disposed of in current market conditions in seven calendar days or less without the sale or disposition significantly changing the market value of the investment) or less liquid securities. Substantial redemptions may also adversely affect the ability of the Underlying Fund to implement its investment strategy. The Investment Manager or its affiliate also has a conflict of interest in determining the allocation of affiliated products’ assets among the Underlying Funds, as it earns different fees from the various Underlying Funds.
Investing in Money Market Funds
The Fund may invest cash in, or hold as collateral for certain investments, shares of registered or unregistered money market funds, including funds advised by the Investment Manager or its affiliates. These funds are not insured or guaranteed by the Federal Deposit Insurance Corporation (FDIC) or any other government agency. The Fund and its shareholders indirectly bear a portion of the expenses of any money market fund or other fund in which the Fund may invest.
Investing Defensively
The Fund may from time to time take temporary defensive investment positions that may be inconsistent with the Fund’s principal investment strategies in attempting to respond to adverse market, economic, political, social or other conditions, including, without limitation, investing some or all of its assets in money market instruments or shares of affiliated or unaffiliated money market funds or holding some or all of its assets in cash or cash equivalents. The Fund may take such defensive investment positions for as long a period as deemed necessary.
The Fund may not achieve its investment objective while it is investing defensively. Investing defensively may adversely affect Fund performance. During these times, the portfolio managers may make frequent portfolio holding changes, which could result in increased trading expenses and decreased Fund performance. See also Investing in Money Market Funds above for more information.
Prospectus 2026
15
Columbia Variable Portfolio - Select Short Corporate Income Fund
More Information About the Fund (continued)
Other Strategic and Investment Measures
The Fund may also from time to time take temporary portfolio positions that may or may not be consistent with the Fund’s principal investment strategies in attempting to respond to adverse market, economic, political, social or other conditions, including, without limitation, investing in derivatives, such as forward contracts, futures contracts, options, structured investments and swaps, for various purposes, including among others, investing in particular derivatives in seeking to reduce investment exposures, or in seeking to achieve indirect investment exposures, to a sector, country, region or currency where the Investment Manager believes such positioning is appropriate. The Fund may take such portfolio positions for as long a period as deemed necessary. While the Fund is so positioned, derivatives could comprise a substantial portion of the Fund’s investments and the Fund may not achieve its investment objective. Investing in this manner may adversely affect Fund performance. During these times, the portfolio managers may make frequent portfolio holding changes, which could result in increased trading expenses and decreased Fund performance. For information on the risks of investing in derivatives, see Transactions in Derivatives above.
Portfolio Holdings Disclosure
The Board has adopted policies and procedures that govern the timing and circumstances of disclosure to shareholders and third parties of information regarding the securities owned by the Fund. A description of these policies and procedures is included in the SAI. Fund policy generally permits the disclosure of portfolio holdings information on the Fund's website (columbiathreadneedleus.com) only after a certain amount of time has passed, as described in the SAI.
Purchases and sales of portfolio securities can take place at any time, so the portfolio holdings information available on the Fund's website may not always be current.
FUNDamentals
Portfolio Holdings Versus the Benchmarks
The Fund does not limit its investments to the securities within its benchmark(s), and accordingly the Fund's holdings may diverge from those of its benchmark(s). In addition, the Fund may invest in securities outside any industry and geographic sectors represented in its benchmark(s). The Fund's weightings in individual securities, and in industry or geographic sectors, may also vary considerably from those of its benchmark(s).
Cash Flows
The timing and magnitude of cash inflows from investors buying Fund shares could prevent the Fund from always being fully invested. Conversely, the timing and magnitude of cash outflows to shareholders redeeming Fund shares could require the Fund to sell portfolio securities at less than opportune times or to hold ready reserves of uninvested cash in amounts larger than might otherwise be the case to meet shareholder redemptions. Either situation could adversely impact the Fund’s performance.
Understanding Annual Fund Operating Expenses
The Fund’s annual operating expenses, as presented in the Annual Fund Operating Expenses table in the Fees and Expenses of the Fund section of this prospectus, generally are based on expenses incurred during the Fund’s most recently completed fiscal year, may vary by share class and are expressed as a percentage (expense ratio) of the Fund’s average net assets during that fiscal year. The expense ratios reflect the Fund’s fee arrangements as of the date of this prospectus and, unless indicated otherwise, are based on expenses incurred during the Fund’s most recent fiscal year. The Fund’s assets will fluctuate, but unless indicated otherwise in the Annual Fund Operating Expenses table, no adjustments have been or will be made to the expense ratios to reflect any differences in the Fund’s average net assets between the most recently completed fiscal year and the date of this prospectus or a later date. In general, the Fund’s expense ratios will increase as its net assets decrease, such that the Fund’s actual expense ratios may be higher than the expense ratios presented in the Annual Fund Operating Expenses table if assets fall. Any commitment by the Investment Manager and/or its affiliates to waive fees and/or cap (reimburse)
16
Prospectus 2026
Columbia Variable Portfolio - Select Short Corporate Income Fund
More Information About the Fund (continued)
expenses is expected, in part, to limit the impact of any increase in the Fund’s expense ratios that would otherwise result because of a decrease in the Fund’s assets in the current fiscal year. The Fund’s annual operating expenses are comprised of (i) investment management fees, (ii) distribution and/or service fees, and (iii) other expenses. Management fees do not vary by class, but distribution and/or service fees and other expenses may vary by class.
FUNDamentals
Other Expenses
“Other expenses” consist of the fees the Fund pays to its custodian, transfer agent, auditors, lawyers and trustees, costs relating to compliance and miscellaneous expenses. Generally, these expenses are allocated on a pro rata basis across all share classes. These fees include certain sub-transfer agency and shareholder servicing fees. For more information on these fees, see About Fund Shares and Transactions — Financial Intermediary Compensation.
Fee Waiver/Expense Reimbursement Arrangements and Impact on Past Performance
The Investment Manager and certain of its affiliates have contractually agreed to waive fees and/or reimburse expenses (excluding certain fees and expenses described below) through April 30, 2027, unless sooner terminated at the sole discretion of the Fund's Board, so that the Fund’s net operating expenses, after giving effect to fees waived/expenses reimbursed and any balance credits and/or overdraft charges from the Fund’s custodian, do not exceed the annual rates of:
| Columbia Variable Portfolio – Select Short Corporate Income Fund | |
| Class 1 |
0.41% |
| Class 2 |
0.66% |
Under the agreement, the following fees and expenses are excluded from the Fund’s operating expenses when calculating the waiver/reimbursement commitment, and therefore will be paid by the Fund, if applicable: taxes (including foreign transaction taxes), expenses associated with investment in affiliated and non-affiliated pooled investment vehicles (including mutual funds and exchange-traded funds), transaction costs and brokerage commissions, costs related to any securities lending program, dividend expenses associated with securities sold short, inverse floater program fees and expenses, transaction charges and interest on borrowed money, interest, costs associated with shareholder meetings, infrequent and/or unusual expenses and any other expenses the exclusion of which is specifically approved by the Fund’s Board. This agreement may be modified or amended only with approval from all parties.
Effect of Fee Waivers and/or Expense Reimbursements on Past Performance. The Fund’s returns shown in the Performance Information section of this prospectus reflect the effect of any fee waivers and/or reimbursements of Fund expenses by the Investment Manager and/or any of its affiliates that were in place during the performance period shown. Without such fee waivers/expense reimbursements, the Fund’s returns might have been lower.
Primary Service Provider Contracts
The Fund enters into contractual arrangements (Service Provider Contracts) with various service providers, including, among others, the Investment Manager, the Distributor, Columbia Management Investment Services Corp. (the Transfer Agent) and the Fund’s custodian. The Fund’s Service Provider Contracts are solely among the parties thereto. Shareholders are not parties to, or intended to be third-party beneficiaries of, any Service Provider Contracts. Further, this prospectus, the SAI and any Service Provider Contracts are not intended to give rise to any agreement, duty, special relationship or other obligation between the Fund and any investor, or give rise to any contractual, tort or other rights in any individual shareholder, group of shareholders or other person, including any right to assert a fiduciary or other duty, enforce the Service Provider Contracts against the parties or to seek any remedy thereunder, either directly or on behalf of the Fund. Nothing in the previous sentence should be read to suggest any waiver of any rights under federal or state securities laws.
Prospectus 2026
17
Columbia Variable Portfolio - Select Short Corporate Income Fund
More Information About the Fund (continued)
The Investment Manager, the Distributor, and the Transfer Agent are all affiliates of Ameriprise Financial, Inc. (Ameriprise Financial). They and their affiliates currently provide key services, including investment advisory, administration, distribution, shareholder servicing and transfer agency services, to the Fund and various other funds, including the Columbia Funds, and are paid for providing these services. These service relationships are described below.
The Investment Manager
Columbia Management Investment Advisers, LLC is located at 290 Congress Street, Boston, MA 02210 and serves as investment adviser and administrator to the Columbia Funds. The Investment Manager is a registered investment adviser and a wholly-owned subsidiary of Ameriprise Financial. The Investment Manager’s management experience covers all major asset classes, including equity securities, debt instruments and money market instruments. In addition to serving as an investment adviser to traditional mutual funds, exchange-traded funds and closed-end funds, the Investment Manager acts as an investment adviser for itself, its affiliates, individuals, corporations, retirement plans, private investment companies and financial intermediaries.
Subject to oversight by the Board, the Investment Manager manages the day-to-day operations of the Fund, determining what securities and other investments the Fund should buy or sell and executing portfolio transactions. The Investment Manager may use the research and other capabilities of its affiliates and third parties in managing the Fund’s investments. The Investment Manager is also responsible for overseeing the administrative operations of the Fund, including the general supervision of the Fund’s operations, the coordination of the Fund’s other service providers and the provision of related clerical and administrative services.
The SEC has issued an order that permits the Investment Manager, subject to the approval of the Board, to appoint unaffiliated subadvisers by entering into subadvisory agreements with them, and to change in material respects the terms of those subadvisory agreements, including the fees paid thereunder, for the Fund without first obtaining shareholder approval, thereby avoiding the expense and delays typically associated with obtaining shareholder approval. The Fund furnishes shareholders with information about new subadvisers retained in reliance on the order within 90 days after hiring the subadviser. The Investment Manager and its affiliates may have other relationships, including significant financial relationships, with current or potential subadvisers or their affiliates, which may create certain conflicts of interest. When making recommendations to the Board to appoint or to change a subadviser, or to change the terms of a subadvisory agreement, the Investment Manager discloses to the Board the nature of any such material relationships. The SEC has issued a separate order that permits the Board to approve new subadvisory agreements or material changes to existing subadvisory agreements at a meeting that is not in person, provided that the Trustees are able to participate in the meeting using a means of communication that allows them to hear each other simultaneously during the meeting and other conditions of the order are satisfied. At present, the Investment Manager has not engaged any investment subadviser for the Fund.
The Fund pays the Investment Manager a fee for its management services, which include investment advisory services and administrative services. The fee is calculated as a percentage of the daily net assets of the Fund and is paid monthly. For the Fund’s most recent fiscal year, management services fees paid to the Investment Manager by the Fund amounted to 0.48% of average daily net assets of the Fund, before any applicable reimbursements.
A discussion regarding the basis for the Board’s approval of the renewal of the Fund's management agreement is available in the Fund’s Form N-CSR for the fiscal period ended June 30, 2025.
18
Prospectus 2026
Columbia Variable Portfolio - Select Short Corporate Income Fund
More Information About the Fund (continued)
Portfolio Managers
Information about the portfolio managers primarily responsible for overseeing the Fund’s investments is shown below. The SAI provides additional information about the portfolio managers, including information relating to compensation, other accounts managed by the portfolio managers, and ownership by the portfolio managers of Fund shares.
| Portfolio Management |
Title |
Role with Fund |
Managed Fund Since |
| Tom Murphy, CFA |
Vice President, Senior Portfolio Manager and Head of Investment Grade Credit |
Lead Portfolio Manager |
2010 |
| Royce D. Wilson, CFA |
Senior Portfolio Manager |
Portfolio Manager |
2012 |
| John Dawson, CFA |
Senior Portfolio Manager |
Portfolio Manager |
2020 |
Mr. Murphy joined the Investment Manager in 2002. Mr. Murphy began his investment career in 1986 and earned a B.B.A. from the University of Notre Dame and an M.B.A. from the University of Michigan.
Mr. Wilson joined the Investment Manager in 2007. Mr. Wilson began his investment career in 2002 and earned a B.B.A. from Western Connecticut State University.
Mr. Dawson joined one of the Columbia Management legacy firms or acquired business lines in 2004. Mr. Dawson began his investment career in 1996 and earned a B.A. in Economics from Bucknell University and an M.B.A. with concentrations in Finance and Accounting from Indiana University.
The Distributor
Shares of the Fund are distributed by Columbia Management Investment Distributors, Inc., which is located at 290 Congress Street, Boston, MA 02210. The Distributor is a registered broker-dealer and an indirect, wholly-owned subsidiary of Ameriprise Financial. The Distributor and its affiliates may pay commissions, distribution and service fees and/or other compensation to entities, including Ameriprise Financial affiliates, for selling shares and providing services to investors.
The Transfer Agent
Columbia Management Investment Services Corp. is a registered transfer agent and wholly-owned subsidiary of Ameriprise Financial. The Transfer Agent is located at 290 Congress Street, Boston, MA 02210, and its responsibilities include processing purchases, redemptions and transfers of Fund shares, calculating and paying distributions, maintaining shareholder records, preparing account statements and providing customer service. The Transfer Agent has engaged SS&C GIDS, Inc. to provide various sub-transfer agency services. The Fund pays a service fee to participating insurance companies or other financial intermediaries that provide sub-recordkeeping and other services to Contract owners and the separate accounts. The Transfer Agent may retain as compensation for its services revenues for fees for wire, telephone and redemption orders, account transcripts due the Transfer Agent from Fund shareholders and interest (net of bank charges) earned with respect to balances in accounts the Transfer Agent maintains in connection with its services to the Fund.
Other Roles and Relationships of Ameriprise Financial and its Affiliates — Certain Conflicts of Interest
The Investment Manager, Distributor and Transfer Agent, all affiliates of Ameriprise Financial, provide various services to the Fund and other Columbia Funds for which they are compensated. Ameriprise Financial and its other affiliates may also provide other services to these funds and be compensated for them.
The Investment Manager and its affiliates may provide investment advisory and other services to other clients and customers substantially similar to those provided to the Columbia Funds. These activities, and other financial services activities of Ameriprise Financial and its affiliates, may present actual and potential conflicts of interest and introduce certain investment constraints.
Prospectus 2026
19
Columbia Variable Portfolio - Select Short Corporate Income Fund
More Information About the Fund (continued)
Ameriprise Financial is a major financial services company, engaged in a broad range of financial activities beyond the fund-related activities of the Investment Manager, including, among others, insurance, broker-dealer (sales and trading), asset management, banking and other financial activities. These additional activities may involve multiple advisory, financial, insurance and other interests in securities and other instruments, and in companies that issue securities and other instruments, that may be bought, sold or held by the Columbia Funds.
Conflicts of interest and limitations that could affect a Columbia Fund may arise from, for example, the following:
■
compensation and other benefits received by the Investment Manager and other Ameriprise Financial affiliates related to the management/administration of a Columbia Fund and the sale of its shares;
■
the allocation of, and competition for, investment opportunities among the Fund, other funds and accounts advised/managed by the Investment Manager and other Ameriprise Financial affiliates, or Ameriprise Financial itself and its affiliates;
■
separate and potentially divergent management of a Columbia Fund and other funds and accounts advised/managed by the Investment Manager and other Ameriprise Financial affiliates;
■
regulatory and other investment restrictions on investment activities of the Investment Manager and other Ameriprise Financial affiliates and accounts advised/managed by them;
■
insurance and other relationships of Ameriprise Financial affiliates with companies and other entities in which a Columbia Fund invests;
■
regulatory and other restrictions relating to the sharing of information between Ameriprise Financial and its affiliates, including the Investment Manager, and a Columbia Fund; and
■
insurance companies investing in the Fund may be affiliates of Ameriprise Financial; these affiliated insurance companies, individually and collectively, may hold through separate accounts a significant portion of the Fund's shares and may also invest in separate accounts managed by the Investment Manager that have the same or substantially similar investment objectives and strategies as the Fund.
The Investment Manager and Ameriprise Financial have adopted various policies and procedures that are intended to identify, monitor and address conflicts of interest. However, there is no assurance that these policies, procedures and disclosures will be effective.
Additional information about Ameriprise Financial and the types of conflicts of interest and other matters referenced above is set forth in the Investment Management and Other Services — Other Roles and Relationships of Ameriprise Financial and its Affiliates — Certain Conflicts of Interest section of the SAI. Investors in the Columbia Funds should carefully review these disclosures and consult with their financial advisor if they have any questions.
Certain Legal Matters
Ameriprise Financial and certain of its affiliates are involved, in the normal course of business, in legal proceedings that include regulatory inquiries, arbitration and litigation (including class actions) concerning matters arising in connection with the conduct of their activities as part of a diversified financial services firm. Ameriprise Financial believes that the Fund is not currently the subject of, and that neither Ameriprise Financial nor any of its affiliates are the subject of, any pending legal, arbitration or regulatory proceedings that are likely to have a material adverse effect on the Fund or the ability of Ameriprise Financial or its affiliates to perform under their contracts with the Fund. Information regarding certain pending and settled legal proceedings may be found in the Fund’s Form N-CSR and in the SAI. Additionally, Ameriprise Financial is required to make quarterly (10-Q), annual (10-K) and, as necessary, 8-K filings with the SEC on legal and regulatory matters that relate to Ameriprise Financial and its affiliates. Copies of these filings may be obtained by accessing the SEC website at sec.gov.
20
Prospectus 2026
Columbia Variable Portfolio - Select Short Corporate Income Fund
About Fund Shares and Transactions
Description of the Share Classes
Share Class Features
The Fund offers the classes of shares set forth on the cover of this prospectus. Each share class has its own cost structure and other features. The following summarizes the primary features of the Class 1 and Class 2 shares.
| |
Class 1 Shares |
Class 2 Shares |
| Eligible Investors |
Shares of the Fund are available only to separate accounts of participating insurance companies as underlying investments for variable annuity contracts and/or variable life insurance policies (collectively, Contracts) or qualified pension and retirement plans (Qualified Plans) or other eligible investors authorized by the Distributor. | |
| Investment Limits |
none |
none |
| Conversion Features |
none |
none |
| Front-End Sales Charges |
none |
none |
| Contingent Deferred Sales Charges (CDSCs) |
none |
none |
| Maximum Distribution and/or Service Fees |
none |
0.25% |
FUNDamentals
Financial Intermediaries
The term “financial intermediary” refers to the insurance company that issued your contract, qualified pension or retirement plan sponsors or the financial intermediary that employs your financial advisor. Financial intermediaries also include broker-dealers and financial advisors as well as firms that employ broker-dealers and financial advisors, including, for example, brokerage firms, banks, investment advisers, third party administrators and other firms in the financial services industry, including Ameriprise Financial and its affiliates.
Distribution and/or Service Fees
Pursuant to Rule 12b-1 under the Investment Company Act of 1940, as amended (the 1940 Act), the Board has approved, and the Fund has adopted, a distribution plan which sets the distribution fees that are periodically deducted from the Fund’s assets for Class 2 shares. The distribution fee for Class 2 shares is 0.25%. These fees are calculated daily, may vary by share class and are intended to compensate the Distributor and/or financial intermediaries for selling shares of the Fund and/or providing services to investors. Because the fees are paid out of the Fund’s assets on an ongoing basis, they will increase the cost of your investment over time.
The Fund will pay these fees to the Distributor and/or to eligible financial intermediaries for as long as the distribution plan continues. The Fund may reduce or discontinue payments at any time.
The Fund pays a service fee to participating insurance companies or other financial intermediaries that provide sub-recordkeeping and other services to Contract owners, Qualified Plan participants and the separate accounts.
Financial Intermediary Compensation
The Distributor, the Investment Manager and their affiliates make payments, from their own resources, to financial intermediaries, primarily to affiliated and unaffiliated insurance companies, for marketing/sales support services relating to the Fund (Marketing Support Payments). Such payments are generally based upon one or more of the following factors: average net assets of the Columbia Funds sold by the Distributor attributable to that financial intermediary; gross sales of the Columbia Funds distributed by the Distributor attributable to that financial intermediary; or a negotiated lump sum payment. While the financial arrangements may vary for each financial intermediary, the Marketing Support Payments to any one financial intermediary are generally between 0.05% and 0.40% on an annual basis for payments based on average net assets of the Fund attributable to the financial intermediary, and between 0.05% and 0.25% on an annual basis for a financial intermediary receiving a payment based on gross sales of the Columbia Funds attributable to the financial intermediary.
Prospectus 2026
21
Columbia Variable Portfolio - Select Short Corporate Income Fund
About Fund Shares and Transactions (continued)
As employee compensation and business unit operating goals at all levels are generally tied to the success of Ameriprise Financial, employees of Ameriprise Financial and its affiliates, including employees of affiliated broker-dealers and insurance companies, are incented to include shares of the Columbia Funds in Contracts offered by affiliated insurance companies. Certain employees, directly or indirectly, receive higher compensation and other benefits as investment in the Columbia Funds increases. In addition, management, sales leaders and other employees may spend more of their time and resources promoting Ameriprise Financial and its subsidiary companies, including the Distributor and the Investment Manager, and the products they offer, including the Fund.
In addition, the Transfer Agent has certain arrangements in place to compensate financial intermediaries, primarily to affiliated and unaffiliated insurance companies, that hold Fund shares through networked and omnibus accounts, including omnibus retirement plans, for services that they provide to beneficial Fund shareholders (Shareholder Services). Shareholder Services and related fees vary by financial intermediary and may include sub-accounting, sub-transfer agency, participant recordkeeping, shareholder or participant reporting, shareholder or participant transaction processing, maintenance of shareholder records, preparation of account statements and provision of customer service, and are not intended to include services that are primarily intended to result in the sale of Fund shares. Payments for Shareholder Services generally are not expected, with certain limited exceptions, to exceed 0.40% of the average aggregate value of the Fund’s shares. Each Fund pays the Transfer Agent a service fee equal to the payments made by the Transfer Agent to participating insurance companies and other financial intermediaries that provide Shareholder Services up to the lesser of the amount charged by the financial intermediary or a contractual asset-based cap. Payments of amounts that exceed the amount paid by the Fund are borne by the Transfer Agent, the Investment Manager and/or their affiliates.
In addition to the payments described above, the Distributor, the Investment Manager and their affiliates typically make other payments or allow promotional incentives to certain broker-dealers to the extent permitted by SEC and Financial Industry Regulatory Authority (FINRA) rules and by other applicable laws and regulations.
Amounts paid by the Distributor, the Investment Manager and their affiliates are paid out of their own resources and do not increase the amount paid by you or the Fund. You can find further details in the SAI about the payments made by the Distributor, the Investment Manager and their affiliates, as well as a list of the financial intermediaries, including Ameriprise Financial affiliates, to which the Distributor, the Investment Manager or their affiliates have agreed to make Marketing Support Payments and fee payments for Shareholder Services.
Your financial intermediary may charge you fees and commissions in addition to those described in this prospectus. You should consult with your financial intermediary and review carefully any disclosure your financial intermediary provides regarding its services and compensation. Depending on the financial arrangement in place at any particular time, a financial intermediary and its financial advisors may have a conflict of interest or financial incentive with respect to recommendations regarding the Fund or any Contract or Qualified Plan that includes the Fund.
Share Price Determination
The price you pay or receive when you buy, sell or transfer shares is the Fund's next determined net asset value (or NAV) per share for a given share class. The Fund calculates the NAV per share for each class of shares of the Fund at the end of each business day, with the value of the Fund's shares based on the total value of all of the securities and other assets that it holds as of such specified time.
FUNDamentals
NAV Calculation
Each of the Fund's share classes calculates its NAV per share as follows:
NAV per share = (Value of assets of the share class) – (Liabilities of the share class)
Number of outstanding shares of the class
Number of outstanding shares of the class
22
Prospectus 2026
Columbia Variable Portfolio - Select Short Corporate Income Fund
About Fund Shares and Transactions (continued)
FUNDamentals
Business Days
A business day is any day that the New York Stock Exchange (NYSE) is open. A business day typically ends at the close of regular trading on the NYSE, usually at 4:00 p.m. Eastern time. If the NYSE is scheduled to close early, the business day will be considered to end as of the time of the NYSE’s scheduled close. The Fund will not treat an intraday unscheduled disruption in NYSE trading or an intraday unscheduled closing as a close of regular trading on the NYSE for these purposes and will price its shares as of the regularly scheduled closing time for that day (typically, 4:00 p.m. Eastern time). Nonetheless, the NAV of Fund shares may be determined at such other time or times (in addition to or in lieu of the time set forth above) as the Fund’s Board may approve or ratify. On holidays and other days when the NYSE is closed, the Fund’s NAV is not calculated and the Fund does not accept buy or sell orders. However, the value of the Fund’s assets may still be affected on such days to the extent that the Fund holds foreign securities that trade on days that foreign securities markets are open.
Equity securities listed on an exchange are typically valued at the closing price or last trade on their primary exchange at the close of business of the NYSE. Equity securities without a readily available closing price or that are not listed on any exchange are typically valued at the mean between the closing bid and asked prices. Other equity securities, debt securities and other assets are valued differently. For instance, bank loans trading in the secondary market are fair valued unless market quotations are readily available, fixed income investments maturing in 60 days or less are valued primarily using the amortized cost method, unless this methodology results in a valuation that does not approximate the market value of these securities, and those maturing in excess of 60 days are valued based on prices obtained from a pricing service, if available (which may represent market values or fair values). Investments in other open-end funds are valued at their published NAVs. The value of the Fund’s portfolio securities is determined in accordance with the valuation policy approved by the Board (the Valuation Policy). Pursuant to Rule 2a-5 under the 1940 Act, the Board has designated the Investment Manager as the Fund’s valuation designee. The Investment Manager, in turn, has authorized its valuation committee to make fair value determinations and to carry out supervisory and certain other functions relating to the valuation of Fund portfolio securities, pursuant to the Valuation Policy.
If a market price is not readily available or is deemed not to reflect market value for a portfolio security, the Investment Manager will determine the price based on a determination of the security's fair value pursuant to the Valuation Policy. In addition, the Investment Manager may use fair valuation techniques to price securities that trade on a foreign exchange when a significant event has occurred after the foreign exchange closes but before the time at which the Fund’s share price is calculated. Foreign exchanges typically close before the time at which Fund share prices are calculated, and may be closed altogether on days when the Fund is open. Such significant events affecting a foreign security may include, but are not limited to: (1) corporate actions, earnings announcements, litigation or other events impacting a single issuer; (2) governmental action that affects securities in one sector or country; (3) natural disasters or armed conflicts affecting a country or region; or (4) significant domestic or foreign market fluctuations. The Fund uses various criteria, including an evaluation of U.S. market moves after the close of foreign markets, in determining whether a foreign security's market price is readily available and reflective of market value and, if not, the fair value of the security.
Fair valuation may have the effect of reducing stale pricing arbitrage opportunities presented by the pricing of Fund shares. However, when the Investment Manager uses fair valuation to price equity securities, it may value those securities higher or lower than another fund or manager would. Also, fair valuation of Fund holdings may cause the Fund's performance to diverge to a greater degree from the performance of various benchmark indices used to compare the Fund's performance because indices generally do not use fair valuation techniques. Because of the judgment involved in fair valuation decisions, there can be no assurance that the value ascribed to a particular security is accurate. The Fund has retained one or more independent fair valuation pricing services to assist in the fair valuation process for foreign securities.
Prospectus 2026
23
Columbia Variable Portfolio - Select Short Corporate Income Fund
About Fund Shares and Transactions (continued)
Futures and options on futures are valued based upon the settlement price as determined by the principal exchange on which they are traded or, in the absence of a settlement price, at the mean of the closing bid and ask. Generally, over-the-counter derivatives, such as swaps and swaptions, are valued based on a price provided by an approved pricing service.
Shareholder Information
Each share class has its own cost structure and other features. Your product may not offer every share class. The Fund encourages you to consult with a financial advisor who can help you with your investment decisions and for more information about the share classes offered by the Fund and available under your product. Shares of the Fund are generally available for purchase only by participating insurance companies in connection with Contracts and Qualified Plan sponsors.
The Fund, the Distributor or the Transfer Agent may refuse any order to buy or transfer shares. If this happens, the Fund will return any money it received, but no interest will be paid on that money.
Shares of the Fund may not be purchased or sold directly by individual Contract owners or participants in a Qualified Plan. When you sell your shares through your Contract or Qualified Plan, the Fund is effectively buying them back. This is called a redemption. The right of redemption may be suspended or payment postponed whenever permitted by applicable laws and regulations, as described under Satisfying Fund Redemption Requests below.
Depending on the context, references to “you” or “your” herein refer either to the holder of a Contract, participant in a Qualified Plan or qualified institutional investor who may select Fund shares to fund his or her investment in the Contract or Qualified Plan or to the participating insurance company as the holder of Fund shares through one or more separate accounts or the Qualified Plan.
Satisfying Fund Redemption Requests
The Fund typically expects to send the redeeming participating insurance company or Qualified Plan sponsor payment for shares within two business days after your trade date. The Fund can suspend redemptions and/or delay payment of redemption proceeds for up to seven days. The Fund can also suspend redemptions and/or delay payment of redemption proceeds in excess of seven days under certain circumstances, including when the NYSE is closed or trading thereon is restricted or during emergency or other circumstances, including as determined by the SEC.
The Fund typically seeks to satisfy redemption requests from cash or cash equivalents held by the Fund, from the proceeds of orders to purchase Fund shares or from the proceeds of sales of Fund holdings effected in the normal course of managing the Fund. However, the Fund may have to sell Fund holdings, including in down markets, to meet heavier than usual redemption requests. For example, under stressed or abnormal market conditions or circumstances, including circumstances adversely affecting the liquidity of the Fund’s investments, the Fund may be more likely to be forced to sell Fund holdings to meet redemptions than under normal market circumstances. In these situations, the Fund’s portfolio managers may have to sell Fund holdings that would not otherwise be sold because, among other reasons, the current price to be received is less than the value of the holdings perceived by the Fund’s portfolio managers. The Fund may also, under certain circumstances (but more likely under stressed or abnormal market conditions or circumstances), borrow money under a credit facility to which the Fund and certain other Columbia Funds are parties or from other Columbia Funds under an interfund lending program (except for closed-end funds and money market funds, which are not eligible to borrow under the program). The Fund and the other Columbia Funds are limited as to the amount that each may individually and collectively borrow under the credit facility and the interfund lending program. As a result, borrowings available to the Fund under the credit facility and the interfund lending program might be insufficient, alone or in combination with the other strategies described herein, to satisfy Fund redemption requests. Please see About Fund Investments – Borrowings – Interfund Lending in the SAI for more information about the credit facility and interfund lending program. The Fund is also limited in the total amount it may borrow. The Fund may only borrow to the extent permitted by the 1940 Act, the rules and regulations thereunder, and any exemptive relief available to the Fund, which currently limit Fund borrowings to
24
Prospectus 2026
Columbia Variable Portfolio - Select Short Corporate Income Fund
About Fund Shares and Transactions (continued)
33 1/3% of total assets (including any amounts borrowed) less liabilities (other than borrowings), plus an additional 5% of its total assets for temporary purposes (to be repaid within 60 days without extension or renewal), in each case determined at the time the borrowing is made.
In addition, the Fund reserves the right to honor redemption orders in whole or in part with in-kind distributions of Fund portfolio securities instead of cash if the Investment Manager, in its sole discretion, determines it to be in the best interest of the remaining shareholders. Such in-kind distributions typically represent a pro-rata portion of Fund portfolio assets subject to adjustments (e.g., for non-transferable securities, round lots and derivatives). In the event the Fund distributes portfolio securities in kind, shareholders may incur brokerage and other transaction costs associated with converting the portfolio securities into cash. Also, the portfolio securities may increase or decrease in value after they are distributed but before they are converted into cash. For U.S. federal income tax purposes, redemptions paid in securities are generally treated the same as redemptions paid in cash. If, during any 90-day period, you redeem shares in an amount greater than $250,000 or 1% of the Fund’s net assets (whichever is less), and if the Investment Manager determines it to be feasible and appropriate, the Fund may pay the redemption amount above such threshold by an in-kind distribution of Fund portfolio securities. Although shares of the Fund may not be purchased or sold by individual owners of Contracts or Qualified Plans, this policy applies indirectly to Contract and Qualified Plan owners.
Potential Conflicts of Interest – Mixed and Shared Funding
The Fund is available for purchase only through Contracts offered by participating insurance companies, Qualified Plans and other qualified institutional investors authorized by the Distributor. Due to differences in tax treatment and other considerations, the interests of various Contract owners, and the interests of Qualified Plan participants, if any, may conflict. The Fund does not foresee any disadvantages to investors arising from these potential conflicts of interest at this time. Nevertheless, the Board of the Fund intends to monitor events to identify any material irreconcilable conflicts which may arise, and to determine what action, if any, should be taken in response to any conflicts. If such a conflict were to arise, one or more separate accounts might be required to withdraw its investments in the Fund or shares of another mutual fund may be substituted. This might force the Fund to sell securities at disadvantageous prices.
Order Processing
Orders to buy and sell shares of the Fund that are placed by your participating insurance company or Qualified Plan sponsor are processed on business days. Orders received in “good form” by the Transfer Agent or a financial intermediary, including your participating insurance company or Qualified Plan sponsor, before the end of a business day are priced at the NAV per share of the Fund's applicable share class on that day. Orders received after the end of a business day will receive the next business day’s NAV per share. An order is in “good form” if the Transfer Agent or your financial intermediary has all of the information and documentation it deems necessary to effect your order. The market value of the Fund’s investments may change between the time you submit your order and the time the Fund next calculates its NAV per share. The business day that applies to your order is also called the trade date.
There is no sales charge associated with the purchase of Fund shares, but there may be charges associated with your Contract or Qualified Plan. Any charges that apply to your Contract or Qualified Plan, and any charges that apply to separate accounts of participating insurance companies or Qualified Plans that may own shares directly, are described in your separate Contract prospectus or Qualified Plan disclosure documents.
You may transfer all or part of your investment in the Fund to one or more of the other investment options available under your Contract or Qualified Plan. You may provide instructions to sell any amount allocated to the Fund. Proceeds will be mailed within seven days after your surrender or withdrawal request is received in good form by an authorized agent. The amount you receive may be more or less than the amount you invested.
Please refer to your Contract prospectus or Qualified Plan disclosure documents, as applicable, for more information about transfers as well as surrenders and withdrawals.
Prospectus 2026
25
Columbia Variable Portfolio - Select Short Corporate Income Fund
About Fund Shares and Transactions (continued)
Information Sharing Agreements
As required by Rule 22c-2 under the 1940 Act, the Fund or certain of its service providers will enter into information sharing agreements with financial intermediaries, including participating life insurance companies and financial intermediaries that sponsor or offer retirement plans through which shares of the Fund are made available for purchase. Pursuant to Rule 22c-2, financial intermediaries are required, upon request, to: (i) provide shareholder account and transaction information; and (ii) execute instructions from the Fund to restrict or prohibit further purchases of Fund shares by shareholders who have been identified by the Fund as having engaged in transactions that violate the Fund's excessive trading policies and procedures.
Excessive Trading Practices Policy of Non-Money Market Funds
Right to Reject or Restrict Share Transaction Orders — The Fund is intended for investors with long-term investment purposes and is not intended as a vehicle for frequent trading activity (market timing) that is excessive. Investors should transact in Fund shares primarily for investment purposes. The Board has adopted excessive trading policies and procedures that are designed to deter excessive trading by investors (the Excessive Trading Policies and Procedures). The Fund discourages and does not accommodate excessive trading. Investments in a Fund by institutional investors in connection with redemptions in-kind are exempt from the Excessive Trading Policies and Procedures because they generally do not raise market timing or excessive trading concerns. Further discussion about the Fund’s use of redemptions in-kind is available under Satisfying Fund Redemption Requests.
The Fund reserves the right to reject, without any prior notice, any purchase or transfer order for any reason, and will not be liable for any loss resulting from rejected orders. For example, the Fund may in its sole discretion restrict or reject a purchase or transfer order even if the transaction is not subject to the specific limitation described below if the Fund or its agents determine that accepting the order could interfere with efficient management of the Fund's portfolio or is otherwise contrary to the Fund's best interests. The Excessive Trading Policies and Procedures apply equally to purchase or transfer transactions communicated directly to the Transfer Agent and to those received by financial intermediaries.
Specific Buying and Transferring Limitations — If the Fund detects that an investor has made two “material round trips” in any 28-day period, it will generally reject the investor's future purchase orders, including transfer buy orders, involving any Fund.
For these purposes, a “round trip” is a purchase or transfer into the Fund followed by a sale or transfer out of the Fund, or a sale or transfer out of the Fund followed by a purchase or transfer into the Fund. A “material” round trip is one that is deemed by the Fund to be material in terms of its amount or its potential detrimental impact on the Fund. Independent of this limit, the Fund may, in its sole discretion, reject future purchase orders by any person, group or account that appears to have engaged in any type of excessive trading activity.
These limits generally do not apply to automated transactions or transactions by registered investment companies in a “fund-of-funds” structure. These limits do not apply to payroll deduction contributions by retirement plan participants, transactions initiated by a retirement plan sponsor or certain other retirement plan transactions consisting of rollover transactions, loan repayments and disbursements, and required minimum distribution redemptions. They may be modified or rescinded for accounts held by certain retirement plans to conform to plan limits, for considerations relating to the Employee Retirement Income Security Act of 1974 or regulations of the Department of Labor, and for certain asset allocation or wrap programs. Accounts known to be under common ownership or control generally will be counted together, but accounts maintained or managed by a common intermediary generally will not be considered to be under common ownership or control. The Fund reserves the right to modify these restrictions at any time without prior notice to shareholders. In addition, the Fund may, in its sole discretion, reinstate trading privileges that have been revoked under the Fund's Excessive Trading Policies and Procedures.
Limitations on the Ability to Detect and Prevent Excessive Trading Practices — The Fund takes various steps designed to detect and prevent excessive trading, including daily review of available shareholder transaction information. However, the Fund receives buy, sell or transfer orders through financial intermediaries, and cannot always know of or reasonably detect excessive trading that may be facilitated by financial intermediaries or by the use of the
26
Prospectus 2026
Columbia Variable Portfolio - Select Short Corporate Income Fund
About Fund Shares and Transactions (continued)
omnibus account arrangements they offer. Omnibus account arrangements are common forms of holding shares of mutual funds, particularly among certain financial intermediaries such as broker-dealers, retirement plans and variable insurance products. These arrangements often permit financial intermediaries to aggregate their clients' transactions and accounts, and in these circumstances, the identities of the financial intermediary clients that beneficially own Fund shares are often not known to the Fund.
Some financial intermediaries apply their own restrictions or policies to their clients’ transactions and accounts, which may be more or less restrictive than those described here. This may impact the Fund's ability to curtail excessive trading, even where it is identified. For these and other reasons, it is possible that excessive trading may occur despite the Fund's efforts to detect and prevent it.
Although these restrictions and policies involve judgments that are inherently subjective and may involve some selectivity in their application, the Fund seeks to act in a manner that it believes is consistent with the best interests of Fund shareholders in making any such judgments.
Risks of Excessive Trading — Excessive trading creates certain risks to the Fund's long-term shareholders and may create the following adverse effects:
■
negative impact on the Fund's performance;
■
potential dilution of the value of the Fund's shares;
■
interference with the efficient management of the Fund's portfolio, such as the need to maintain undesirably large cash positions, the need to use its line of credit or the need to buy or sell securities it otherwise would not have bought or sold;
■
losses on the sale of investments resulting from the need to sell securities at less favorable prices; and
■
increased brokerage and administrative costs.
To the extent that the Fund invests significantly in foreign securities traded on markets that close before the Fund's valuation time, it may be particularly susceptible to dilution, which may be exacerbated as a result of excessive trading. Because events may occur after the close of foreign markets and before the Fund's valuation time that influence the value of foreign securities, investors may seek to trade Fund shares in an effort to benefit from their understanding of the value of foreign securities as of the Fund's valuation time. This is often referred to as price arbitrage. The Fund has adopted procedures designed to adjust closing market prices of foreign securities under certain circumstances to reflect what the Fund believes to be the fair value of those securities as of its valuation time. To the extent the adjustments do not work fully, investors engaging in price arbitrage may cause dilution in the value of the Fund's shares held by other shareholders.
Similarly, to the extent that the Fund invests significantly in thinly traded securities and other debt instruments that are rated below investment grade (commonly called “high-yield” or “junk” bonds), equity securities of small-capitalization companies, floating rate loans, or tax-exempt or other securities that may trade infrequently, because these securities are often traded infrequently, investors may seek to trade Fund shares in an effort to benefit from their understanding of the value of these securities as of the Fund's valuation time. This is also a type of price arbitrage. Any such frequent trading strategies may interfere with efficient management of the Fund's portfolio to a greater degree than would be the case for mutual funds that invest only, or significantly, in highly liquid securities, in part because the Fund may have difficulty selling these particular investments at advantageous times or prices to satisfy large and/or frequent sell orders. Any successful price arbitrage may also cause dilution in the value of Fund shares held by non-redeeming shareholders.
Excessive Trading Practices Policy of Columbia Variable Portfolio - Government Money Market Fund
A money market fund is designed to offer investors a liquid cash option that they may buy and sell as often as they wish. Accordingly, the Board has not adopted policies and procedures designed to discourage excessive or short-term trading of Columbia Variable Portfolio - Government Money Market Fund shares. However, since frequent purchases and sales of Columbia Variable Portfolio - Government Money Market Fund shares could in certain instances harm shareholders in various ways, including reducing the returns to long-term shareholders by increasing
Prospectus 2026
27
Columbia Variable Portfolio - Select Short Corporate Income Fund
About Fund Shares and Transactions (continued)
costs (such as spreads paid to dealers who trade money market instruments with Columbia Variable Portfolio - Government Money Market Fund) and disrupting portfolio management strategies, Columbia Variable Portfolio - Government Money Market Fund reserves the right, but has no obligation, to reject any purchase or transfer transaction at any time. Columbia Variable Portfolio - Government Money Market Fund has no limits on purchase or transfer transactions. In addition, Columbia Variable Portfolio - Government Money Market Fund reserves the right to impose or modify restrictions on purchases, transfers or trading of Fund shares at any time.
28
Prospectus 2026
Columbia Variable Portfolio - Select Short Corporate Income Fund
Distributions and Taxes
Distributions to Shareholders
A mutual fund can make money two ways:
■
It can earn income on its investments. Examples of fund income are interest paid on money market instruments and bonds, and dividends paid on common stocks.
■
A mutual fund can also have capital gains if the value of its investments increases. While a fund continues to hold an investment, any gain is generally unrealized. If the fund sells an investment, it generally will realize a capital gain if it sells that investment for a higher price than its adjusted cost basis, and will generally realize a capital loss if it sells that investment for a lower price than its adjusted cost basis. Capital gains and losses are either short-term or long-term, depending on whether the fund holds the securities for one year or less (short-term) or more than one year (long-term).
Mutual funds make payments of fund earnings to shareholders, distributing them among all shareholders of the fund. As a shareholder, you are entitled to your portion of a fund's distributed income, including capital gains. Reinvesting your distributions buys you more shares of a fund — which lets you take advantage of the potential for compound growth. Putting the money you earn back into your investment means it, in turn, may earn even more money (or be exposed to additional losses, if the fund earns a negative return). Over time, the power of compounding has the potential to significantly increase the value of your investment. There is no assurance, however, that you'll earn more money if you reinvest your distributions rather than receive them in cash.
The Fund intends to pay out, in the form of distributions to shareholders, a sufficient amount of its income and gains so that the Fund will qualify for treatment as a regulated investment company and generally will not have to pay any federal income or excise tax. The Fund generally intends to distribute any net realized capital gain (whether long-term or short-term gain) at least once a year. Normally, the Fund will declare and pay distributions of net investment income according to the following schedule:
| Declaration and Distribution Schedule | |
| Declarations |
Annually |
| Distributions |
Annually |
The Fund may declare or pay distributions of net investment income more frequently.
Different share classes of the Fund usually pay different net investment income distribution amounts, because each class has different expenses. Each time a distribution is made, the NAV per share of the share class is reduced by the amount of the distribution.
The Fund will automatically reinvest distributions in additional shares of the same share class of the Fund unless you inform us you want to receive your distributions to be paid in cash.
Taxes and Your Investment
Taxation of the Fund: The Fund has elected and intends to qualify and to be eligible for treatment each year as a regulated investment company. A regulated investment company generally is not subject to tax at the fund level on income and gains from investments that are distributed to shareholders. However, the Fund’s failure to qualify and be eligible for treatment as a regulated investment company would result in fund-level taxation, and consequently, a reduction in income available for distribution to you.
Taxation of Fund Shares: Shares of the Fund are only offered to separate accounts of participating insurance companies, Qualified Plans, and certain other eligible persons or plans permitted to hold shares of the Fund pursuant to the applicable U.S. Treasury Regulations without impairing the ability of participating insurance companies to satisfy the diversification requirements of Section 817(h) of the Internal Revenue Code of 1986, as amended. Each participating insurance company, including each participating insurance company that is an affiliate of the Investment Manager, includes in its taxable income any net investment income derived from the investment of assets held in its separate accounts because the insurance company is considered the owner of these assets under federal income tax law. The insurance company may claim certain tax benefits associated with this investment
Prospectus 2026
29
Columbia Variable Portfolio - Select Short Corporate Income Fund
Distributions and Taxes (continued)
income. These benefits, which may include foreign tax credits (which can reduce the insurance company’s U.S. taxes on foreign source income) and the corporate dividends-received deduction (which is a tax deduction for the insurance company attributable to certain dividends received from the Fund), are not passed on to Contract owners since the affiliated insurance company is the owner of the assets under federal tax law and is taxed on the investment income generated by the assets.
Taxation of Variable Annuity Contracts and Variable Life Insurance Policies: Your Contract may qualify for favorable tax treatment. Please refer to your Contract prospectus for more information about the tax implications of your investment in the Contract. As long as your Contract continues to qualify for such favorable tax treatment, you will not be taxed currently on your investment in the Fund through such Contract, even if the Fund makes distributions to the separate account and/or you change your investment options under the Contract. In order to qualify for such treatment, among other things, the separate accounts of participating insurance companies, which maintain and invest net proceeds from Contracts, must be “adequately diversified.” The Fund intends to operate in such a manner so that a separate account investing only in Fund shares on behalf of a holder of a Contract will be “adequately diversified.” If the Fund does not meet such requirements because its investments are not adequately diversified, your Contract could lose its favorable tax treatment, and income and gain allocable to your Contract could be taxable currently to you. This could also occur if Contract holders are found to have an impermissible level of control over the investments underlying their Contracts. You should consult with the participating insurance company that issued your Contract, plan sponsor, or other eligible investor through which your investment in the Fund is made regarding the U.S. federal income taxation of your investment.
FUNDamentals
Taxes
The information provided above is only a summary of how U.S. federal income taxes may affect your indirect investment in the Fund. It is not intended as a substitute for careful tax planning. Your investment in the Fund may have other tax implications. It does not apply to certain types of investors who may be subject to special rules, including foreign or tax-exempt investors or those holding Fund shares through a tax-advantaged account other than a Contract, such as a 401(k) plan or IRA. Please see the SAI for more detailed tax information. You should consult with your own tax advisor about the particular tax consequences to you of an investment in the Fund, including the effect of any foreign, state and local taxes, and the effect of possible changes in applicable tax laws.
30
Prospectus 2026
Columbia Variable Portfolio - Select Short Corporate Income Fund
Financial Highlights
The financial highlights table is intended to help you understand the Fund’s financial performance for the past five fiscal years or, if shorter, the Fund’s period of operations. Certain information reflects financial results for a single Fund share. Per share net investment income (loss) amounts are calculated based on average shares outstanding during the period. The total return in the table represents the rate that an investor would have earned (or lost) on an investment in the Fund assuming all dividends and distributions had been reinvested. Total return does not reflect any fees and expenses imposed under your Contract and/or Qualified Plan, as applicable; such fees and expenses would reduce the total return for all periods shown. Total return and portfolio turnover are not annualized for periods of less than one year. The ratios of expenses and net investment income are annualized for periods of less than one year. The portfolio turnover rate is calculated without regard to purchase and sales transactions of short-term instruments and certain derivatives, if any. If such transactions were included, the Fund’s portfolio turnover rate may be higher. A zero balance may reflect an amount rounding to less than $0.01 or 0.01%. This information has been audited by PricewaterhouseCoopers LLP, an independent registered public accounting firm, whose report, along with the Fund’s financial statements, is included in the Fund’s Form N-CSR, which is available upon request.
Prospectus 2026
31
Columbia Variable Portfolio - Select Short Corporate Income Fund
Financial Highlights (continued)
| |
Net asset value, beginning of period |
Net investment income |
Net realized and unrealized gain (loss) |
Total from investment operations |
Distributions from net investment income |
Total distributions to shareholders |
| Class 1 | ||||||
| Year Ended 12/31/2025 |
$9.55 |
0.42 |
0.17 |
0.59 |
(0.63) |
(0.63) |
| Year Ended 12/31/2024 |
$9.48 |
0.41 |
0.03 |
0.44 |
(0.37) |
(0.37) |
| Year Ended 12/31/2023 |
$9.17 |
0.35 |
0.27 |
0.62 |
(0.31) |
(0.31) |
| Year Ended 12/31/2022 |
$9.84 |
0.23 |
(0.83) |
(0.60) |
(0.07) |
(0.07) |
| Year Ended 12/31/2021 |
$10.06 |
0.11 |
(0.17) |
(0.06) |
(0.16) |
(0.16) |
| Class 2 | ||||||
| Year Ended 12/31/2025 |
$9.51 |
0.38 |
0.18 |
0.56 |
(0.61) |
(0.61) |
| Year Ended 12/31/2024 |
$9.43 |
0.38 |
0.05 |
0.43 |
(0.35) |
(0.35) |
| Year Ended 12/31/2023 |
$9.12 |
0.33 |
0.27 |
0.60 |
(0.29) |
(0.29) |
| Year Ended 12/31/2022 |
$9.79 |
0.20 |
(0.82) |
(0.62) |
(0.05) |
(0.05) |
| Year Ended 12/31/2021 |
$10.01 |
0.08 |
(0.16) |
(0.08) |
(0.14) |
(0.14) |
| Notes to Financial Highlights | |
| (a) |
In addition to the fees and expenses that the Fund bears directly, the Fund indirectly bears a pro rata share of the fees and expenses of any other funds in which it invests. Such indirect expenses are not included in the Fund's reported expense ratios. |
| (b) |
Total net expenses include the impact of certain fee waivers/expense reimbursements made by the Investment Manager and certain of its affiliates, if applicable. |
32
Prospectus 2026
Columbia Variable Portfolio - Select Short Corporate Income Fund
Financial Highlights (continued)
| |
Net asset value, end of period |
Total return |
Total gross expense ratio to average net assets(a) |
Total net expense ratio to average net assets(a),(b) |
Net investment income ratio to average net assets |
Portfolio turnover |
Net assets, end of period (000's) |
| Class 1 | |||||||
| Year Ended 12/31/2025 |
$9.51 |
6.35% |
0.51% |
0.41% |
4.33% |
129% |
$202,719 |
| Year Ended 12/31/2024 |
$9.55 |
4.75% |
0.51% |
0.41% |
4.28% |
103% |
$948,364 |
| Year Ended 12/31/2023 |
$9.48 |
6.89% |
0.50% |
0.42% |
3.77% |
78% |
$700,239 |
| Year Ended 12/31/2022 |
$9.17 |
(6.08%) |
0.49% |
0.46% |
2.45% |
110% |
$818,216 |
| Year Ended 12/31/2021 |
$9.84 |
(0.59%) |
0.50% |
0.48% |
1.08% |
88% |
$806,365 |
| Class 2 | |||||||
| Year Ended 12/31/2025 |
$9.46 |
6.00% |
0.78% |
0.66% |
4.04% |
129% |
$129,485 |
| Year Ended 12/31/2024 |
$9.51 |
4.64% |
0.75% |
0.66% |
4.03% |
103% |
$112,061 |
| Year Ended 12/31/2023 |
$9.43 |
6.66% |
0.75% |
0.67% |
3.53% |
78% |
$101,866 |
| Year Ended 12/31/2022 |
$9.12 |
(6.36%) |
0.74% |
0.71% |
2.18% |
110% |
$100,683 |
| Year Ended 12/31/2021 |
$9.79 |
(0.84%) |
0.75% |
0.73% |
0.83% |
88% |
$92,550 |
Prospectus 2026
33
Columbia Variable Portfolio - Select Short Corporate Income Fund

For More Information
The Fund is generally available only to owners of Contracts issued by participating insurance companies and participants in Qualified Plans. Please refer to your Contract prospectus or Qualified Plan disclosure documents for information about how to buy, sell and transfer shares of the Fund.
Additional Information About the Fund
Additional information about the Fund’s investments is available in the Fund’s annual and semiannual reports to shareholders and in Form N-CSR. In the Fund’s annual report, you will find a discussion of the market conditions and investment strategies that significantly affected the Fund’s performance during its last fiscal year. In the Fund’s Form N-CSR, you will find the Fund’s annual and semiannual financial statements. The SAI also provides additional information about the Fund and its policies. The SAI, which has been filed with the SEC, is legally part of this prospectus (incorporated by reference). To obtain these documents free of charge, to request other information about the Fund and to make shareholder inquiries, please contact the Fund as follows:
By Mail: Columbia Management Investment Services Corp.
P.O. Box 219104
Kansas City, MO 64121-9104
P.O. Box 219104
Kansas City, MO 64121-9104
By Telephone: 800.345.6611
Online: columbiathreadneedleus.com
Reports and other information about the Fund are also available in the EDGAR Database on the SEC’s website at http://www.sec.gov. You can receive copies of this information, for a duplication fee, by electronic request at the following e-mail address: publicinfo@sec.gov.
The investment company registration number of Columbia Funds Variable Series Trust II, of which the Fund is a series, is 811-22127.
Columbia Threadneedle Investments (Columbia Threadneedle) is the global brand name of the Columbia and Threadneedle group of companies.
The Fund is distributed by Columbia Management Investment Distributors, Inc., 290 Congress Street, Boston, MA 02210.
The Fund is distributed by Columbia Management Investment Distributors, Inc., 290 Congress Street, Boston, MA 02210.
© 2026 Columbia Threadneedle. All rights reserved.
PRO7015_12_E01_(05/26)

CTIVP® – CenterSquare Real Estate Fund
Prospectus
May 1, 2026
As with all mutual funds, the Securities and Exchange Commission (SEC) has not approved or disapproved these securities or passed upon the adequacy of this prospectus. Any representation to the contrary is a criminal offense.

CTIVP® – CenterSquare Real Estate Fund
Table of Contents
| 3 | |
| 3 | |
| 3 | |
| 3 | |
| 4 | |
| 5 | |
| 6 | |
| 7 | |
| 7 | |
| 7 | |
| 8 | |
| 8 | |
| 8 | |
| 8 | |
| 11 | |
| 14 | |
| 17 | |
| 17 | |
| 19 | |
| 19 | |
| 19 | |
| 20 | |
| 22 | |
| 27 | |
| 27 | |
| 27 | |
| 29 |
2
Prospectus 2026
CTIVP® – CenterSquare Real Estate Fund
Summary of the Fund
Investment Objective
CTIVP® – CenterSquare Real Estate Fund (the Fund) seeks to provide shareholders with current income and capital appreciation.
Fees and Expenses of the Fund
This table describes the fees and expenses that you may pay as an investor in the Fund. The table does not reflect any fees or expenses imposed by your Contract or Qualified Plan, which are disclosed in your separate Contract prospectus or Qualified Plan disclosure documents. If the additional fees or expenses were reflected, the expenses set forth below would be higher.
Annual Fund Operating Expenses (expenses that you pay each year as a percentage of the value of your investment) | ||
| |
Class 1 |
Class 2 |
| Management fees |
% |
% |
| Distribution and/or service (12b-1) fees |
% |
% |
| Other expenses |
% |
% |
| Total annual Fund operating expenses(a) |
% |
% |
(a)
Example
The following example is intended to help you compare the cost of investing in the Fund with the cost of investing in other mutual funds. The example illustrates the hypothetical expenses that you would incur over the time periods indicated, and assumes that:
■
you invest $10,000 in the applicable class of Fund shares for the periods indicated,
■
your investment has a 5% return each year, and
■
the Fund’s total annual operating expenses remain the same as shown in the Annual Fund Operating Expenses table above.
The example does not reflect any fees and expenses that apply to your Contract or Qualified Plan. Inclusion of these charges would increase expenses for all periods shown.
Although your actual costs may be higher or lower, based on the assumptions listed above, your costs would be:
| |
1 year |
3 years |
5 years |
10 years |
| Class 1 (whether or not shares are redeemed) |
$ |
$ |
$ |
$ |
| Class 2 (whether or not shares are redeemed) |
$ |
$ |
$ |
$ |
Portfolio Turnover
The Fund may pay transaction costs, such as commissions, when it buys and sells securities (or “turns over” its portfolio). A higher portfolio turnover rate may indicate higher transaction costs. These costs, which are not reflected in annual fund operating expenses or in the example, affect the Fund’s performance. During the most recent fiscal year, the Fund’s portfolio turnover rate was 32 % of the average value of its portfolio.
Principal Investment Strategies
Under normal circumstances, the Fund invests at least 80% of its net assets (plus the amount of any borrowings for investment purposes) in equity and equity-related securities issued by companies in the real estate industry. A company is considered to be in the real estate industry if it (i) derives at least 50% of its revenues or profits from the
Prospectus 2026
3
CTIVP® – CenterSquare Real Estate Fund
Summary of the Fund (continued)
ownership, construction, management, financing or sale of residential, commercial or industrial real estate or (ii) has at least 50% of the fair market value of its assets invested in residential, commercial or industrial real estate. Companies in the real estate industry include, among others, real estate operating companies (REOCs) and real estate investment trusts (REITs). The Fund may invest in companies that have market capitalizations of any size.
Principal Risks
An investment in the Fund involves risks, including Real Estate-Related Investment Risk, Changing Distribution Level Risk, and Market Risk, among others. Descriptions of these and other principal risks of investing in the Fund are provided below. There is no assurance that the Fund will achieve its investment objective and you may lose money . The value of the Fund’s holdings may decline, and the Fund’s net asset value (NAV) and share price may go down. An investment in the Fund is not a bank deposit and is not insured or guaranteed by the Federal Deposit Insurance Corporation or any other government agency. The significance of any specific risk to an investment in the Fund will vary over time depending on the composition of the Fund's portfolio, market conditions, and other factors. You should read all of the risk information below carefully, because any one or more of these risks may result in losses to the Fund.
Active Management Risk. Due to its active management, the Fund could underperform its benchmark index and/or other funds with similar investment objectives and/or strategies.
Changing Distribution Level Risk. The Fund normally expects to receive income which may include interest, dividends and/or capital gains, depending upon its investments. The distribution amounts paid by the Fund will vary and generally depend on the amount of income the Fund earns (less expenses) on its portfolio holdings, and capital gains or losses it recognizes. A decline in the Fund’s income or net capital gains arising from its investments may reduce its distribution level.
Industry Concentration Risk. Investments that are concentrated in a particular industry will make the Fund’s portfolio value more susceptible to the events or conditions impacting that particular industry.
Issuer Risk. An issuer in which the Fund invests or to which it has exposure may perform poorly or below expectations, and the value of its securities may therefore decline, which may negatively affect the Fund’s performance. Underperformance of an issuer may be caused by poor management decisions, competitive pressures, breakthroughs in technology, reliance on suppliers, labor problems or shortages, corporate restructurings, fraudulent disclosures, natural disasters, military confrontations and actions, war, other conflicts, terrorism, disease/virus outbreaks, epidemics or other events, conditions and factors which may impair the value of your investment in the Fund.
■
Small- and Mid-Cap Stock Risk. Investments in small- and mid-capitalization companies (small- and mid-cap companies) often involve greater risks than investments in larger, more established companies (larger companies) because small- and mid-cap companies tend to have less predictable earnings and may lack the management experience, financial resources, product diversification and competitive strengths of larger companies. Securities of small- and mid-cap companies may be less liquid and more volatile than the securities of larger companies.
■
Large-Cap Stock Risk. Investments in larger companies may involve certain risks associated with their larger size. For instance, larger companies may be less able to respond quickly to new competitive challenges, such as changes in consumer tastes or innovation from smaller competitors. Also, larger companies are sometimes less able to achieve as high growth rates as successful smaller companies, especially during extended periods of economic expansion.
Liquidity Risk. Liquidity risk is the risk associated with any event, circumstance, or characteristic of an investment or market that negatively impacts the Fund’s ability to sell, or realize the proceeds from the sale of, an investment at a desirable time or price. Liquidity risk may arise because of, for example, a lack of marketability of the investment, which means that when seeking to sell its portfolio investments, the Fund could find that selling is more difficult than anticipated, especially during times of high market volatility. Market participants attempting to sell the same or a similar instrument at the same time as the Fund could exacerbate the Fund’s exposure to liquidity risk. The Fund may have to accept a lower selling price for the holding, sell other liquid or more liquid investments that it might otherwise prefer to hold (thereby increasing the proportion of the Fund’s investments in less liquid or illiquid
4
Prospectus 2026
CTIVP® – CenterSquare Real Estate Fund
Summary of the Fund (continued)
securities), or forego another more appealing investment opportunity. The liquidity of Fund investments may change significantly over time and certain investments that were liquid when purchased by the Fund may later become illiquid, particularly in times of overall economic distress. Changing regulatory, market or other conditions or environments (for example, the interest rate or credit environments) may also adversely affect the liquidity and the price of the Fund's investments. Judgment plays a larger role in valuing illiquid or less liquid investments as compared to valuing liquid or more liquid investments. Price volatility may be higher for illiquid or less liquid investments as a result of, for example, the relatively less frequent pricing of such securities (as compared to liquid or more liquid investments). Generally, the less liquid the market at the time the Fund sells a portfolio investment, the greater the risk of loss or decline of value to the Fund. Overall market liquidity and other factors can lead to an increase in redemptions, which may negatively impact Fund performance and NAV, including, for example, if the Fund is forced to sell investments in a down market.
Market Risk. The Fund may incur losses due to declines in the value of one or more securities in which it invests. These declines may be due to factors affecting a particular issuer, or the result of, among other things, political, regulatory, market, economic or social developments affecting the relevant market(s) more generally. In addition, turbulence in financial markets and reduced liquidity in equity, credit and/or fixed income markets may negatively affect many issuers, which could adversely affect the Fund’s ability to price or value hard-to-value assets in thinly traded and closed markets and could cause significant redemptions and operational challenges. Global economies and financial markets are increasingly interconnected, and conditions and events in one country, region or financial market may adversely impact issuers in a different country, region or financial market. These risks may be magnified if certain events or developments adversely interrupt the global supply chain; in these and other circumstances, such risks might affect companies worldwide. As a result, local, regional or global events such as terrorism, war, other conflicts, natural disasters, disease/virus outbreaks and epidemics or other public health issues, recessions, depressions or other events – or the potential for such events – could have a significant negative impact on global economic and market conditions.
Real Estate-Related Investment Risk. Investments in real estate investment trusts (REITs) and in securities of other companies (wherever organized) principally engaged in the real estate industry subject the Fund to, among other things, risks similar to those of direct investments in real estate and the real estate industry in general. These include risks related to general and local economic conditions, possible lack of availability of financing and changes in interest rates or property values. The value of interests in a REIT may be affected by, among other factors, changes in the value of the underlying properties owned by the REIT, changes in the prospect for earnings and/or cash flow growth of the REIT itself, defaults by borrowers or tenants, market saturation, decreases in market rates for rents, and other economic, political, or regulatory matters affecting the real estate industry, including REITs. REITs may be subject to more abrupt or erratic price movements than the overall securities markets. In a rising interest rate environment, the stock prices of real estate-related investments may decline and the borrowing costs of these companies may increase. REITs are also subject to the risk of failing to qualify for favorable tax treatment under the Internal Revenue Code of 1986, as amended. The failure of a REIT to continue to qualify as a REIT for tax purposes can materially and adversely affect its value. Some REITs (especially mortgage REITs) are affected by risks similar to those associated with investments in debt securities including changes in interest rates and the quality of credit extended. Because the value of REITs and other real estate-related companies may fluctuate widely in response to changes in factors affecting the real estate markets, the value of an investment in the Fund may be more volatile than the value of an investment in a fund that is invested in a more diverse range of market sectors.
Performance Information
The following bar chart and table show you how the Fund has performed in the past, and can help you understand the risks of investing in the Fund. The bar chart shows how the Fund’s Class 2 share performance has varied for each full calendar year shown. The table below the bar chart compares the Fund’s returns for the periods shown with a broad measure of market performance, as well as another measure of performance for markets in which the Fund may invest.
Prospectus 2026
5
CTIVP® – CenterSquare Real Estate Fund
Summary of the Fund (continued)
Except for differences in annual returns resulting from differences in expenses (where applicable), the share classes of the Fund would have substantially similar annual returns because all share classes of the Fund invest in the same portfolio of securities.
The returns shown do not reflect any fees and expenses imposed under your Contract or Qualified Plan and would be lower if they did.
The Fund’s performance prior to June 2016 reflects returns achieved by one or more different subadviser(s) that managed the Fund according to different principal investment strategies. If the Fund’s current subadviser and strategies had been in place for the prior periods, results shown may have been different.
Year by Year Total Return (%) as of December 31 Each Year |
Best and Worst Quarterly Returns During the Period Shown in the Bar Chart | ||
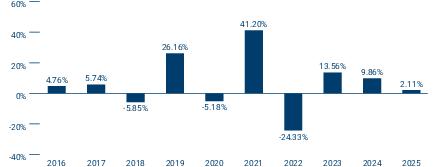 |
|
|
|
| |
|
- | |
Average Annual Total Returns (for periods ended December 31, 2025)
| |
Share Class Inception Date |
1 Year |
5 Years |
10 Years |
| Class 1 |
|
|
|
|
| Class 2 |
|
|
|
|
| FTSE Nareit Equity REITs Index (reflects no deductions for fees, expenses or taxes) |
|
|
|
|
| Russell 1000® Index (reflects no deductions for fees, expenses or taxes) |
|
|
|
|
Fund Management
Investment Manager: Columbia Management Investment Advisers, LLC
Subadviser: CenterSquare Investment Management LLC (CenterSquare)
| Portfolio Management |
Title |
Role with Fund |
Managed Fund Since |
| Dean Frankel, CFA |
Co-Chief Investment Officer of CenterSquare |
Co-Portfolio Manager |
2016 |
| Eric Rothman, CFA |
Portfolio Manager of CenterSquare |
Co-Portfolio Manager |
2016 |
6
Prospectus 2026
CTIVP® – CenterSquare Real Estate Fund
Summary of the Fund (continued)
Purchase and Sale of Fund Shares
The Fund is available for purchase through Contracts offered by the separate accounts of participating insurance companies or Qualified Plans or by other eligible investors authorized by Columbia Management Investment Distributors, Inc. (the Distributor). Shares of the Fund may not be purchased or sold by individual owners of Contracts or Qualified Plans. If you are a Contract holder or Qualified Plan participant, please refer to your separate Contract prospectus or Qualified Plan disclosure documents for information about minimum investment requirements and how to purchase and redeem shares of the Fund on days the Fund is open for business.
Tax Information
The Fund normally distributes its net investment income and net realized capital gains, if any, to its shareholders, which are generally the participating insurance companies and Qualified Plans investing in the Fund through separate accounts. These distributions may not be taxable to you as the holder of a Contract or a participant in a Qualified Plan. Please consult the prospectus or other information provided to you by your participating insurance company and/or Qualified Plan regarding the U.S. federal income taxation of your contract, policy and/or plan.
Payments to Broker-Dealers and Other Financial Intermediaries
If you make allocations to the Fund, the Fund, its Distributor or other related companies may pay participating insurance companies or other financial intermediaries for the allocation (sale) of Fund shares and related services in connection with such allocations to the Fund. These payments may create a conflict of interest by influencing the participating insurance company, other financial intermediary or your salesperson to recommend an allocation to the Fund over another fund or other investment option. Ask your financial advisor or salesperson or visit your financial intermediary’s website for more information.
Prospectus 2026
7
CTIVP® – CenterSquare Real Estate Fund
More Information About the Fund
Investment Objective
CTIVP® – CenterSquare Real Estate Fund (the Fund) seeks to provide shareholders with current income and capital appreciation. The Fund’s investment objective is not a fundamental policy and may be changed by the Fund’s Board of Trustees without shareholder approval as long as shareholders are given 60 days’ advance written notice of the change. Because any investment involves risk, there is no assurance the Fund’s investment objective will be achieved.
Principal Investment Strategies
Under normal circumstances, the Fund invests at least 80% of its net assets (plus the amount of any borrowings for investment purposes) in equity and equity-related securities issued by companies in the real estate industry. A company is considered to be in the real estate industry if it (i) derives at least 50% of its revenues or profits from the ownership, construction, management, financing or sale of residential, commercial or industrial real estate or (ii) has at least 50% of the fair market value of its assets invested in residential, commercial or industrial real estate. Companies in the real estate industry include, among others, real estate operating companies (REOCs) and real estate investment trusts (REITs). The Fund may invest in companies that have market capitalizations of any size.
Columbia Management Investment Advisers, LLC (Columbia Management or the Investment Manager) serves as the investment manager to the Fund and is responsible for the oversight of the Fund’s subadviser, CenterSquare Investment Management LLC (CenterSquare or the Subadviser), which provides day-to-day portfolio management to the Fund.
CenterSquare applies fundamental investment research techniques when deciding which securities to buy or sell. Typically, CenterSquare:
■
Monitors factors such as real estate trends and industry fundamentals of real estate sectors including office, apartment, retail, hotel, and industrial.
■
Selects stocks by evaluating each company’s real estate value, quality of its assets, and management record for improving earnings and increasing asset value relative to other publicly traded real estate companies.
■
Sells all or part of the Fund’s holdings in a particular security if CenterSquare believes:
■
The security appreciates to a premium relative to other real estate companies; or
■
The anticipated return is not sufficient compared with the risk of continued ownership.
The Fund’s investment policy with respect to 80% of its net assets may be changed by the Fund’s Board of Trustees without shareholder approval as long as shareholders are given 60 days’ advance written notice of the change.
Principal Risks
An investment in the Fund involves risks, including Real Estate-Related Investment Risk, Changing Distribution Level Risk, and Market Risk, among others. Descriptions of these and other principal risks of investing in the Fund are provided below. There is no assurance that the Fund will achieve its investment objective and you may lose money. The value of the Fund’s holdings may decline, and the Fund’s net asset value (NAV) and share price may go down. An investment in the Fund is not a bank deposit and is not insured or guaranteed by the Federal Deposit Insurance Corporation or any other government agency. The significance of any specific risk to an investment in the Fund will vary over time depending on the composition of the Fund's portfolio, market conditions, and other factors. You should read all of the risk information below carefully, because any one or more of these risks may result in losses to the Fund.
Active Management Risk. The Fund is actively managed and its performance therefore will reflect, in part, the ability of the portfolio managers to make investment decisions that seek to achieve the Fund’s investment objective. Due to its active management, the Fund could underperform its benchmark index and/or other funds with similar investment objectives and/or strategies.
8
Prospectus 2026
CTIVP® – CenterSquare Real Estate Fund
More Information About the Fund (continued)
Changing Distribution Level Risk. The Fund normally expects to receive income which may include interest, dividends and/or capital gains, depending upon its investments. The distribution amounts paid by the Fund will vary and generally depend on the amount of income the Fund earns (less expenses) on its portfolio holdings, and capital gains or losses it recognizes. A decline in the Fund’s income or net capital gains arising from its investments may reduce its distribution level.
Industry Concentration Risk. Investments that are concentrated in a particular industry will make the Fund’s portfolio value more susceptible to the events or conditions impacting that particular industry.
Issuer Risk. An issuer in which the Fund invests or to which it has exposure may perform poorly or below expectations, and the value of its securities may therefore decline, which may negatively affect the Fund’s performance. Underperformance of an issuer may be caused by poor management decisions, competitive pressures, breakthroughs in technology, reliance on suppliers, labor problems or shortages, corporate restructurings, fraudulent disclosures, natural disasters, military confrontations and actions, war, other conflicts, terrorism, disease/virus outbreaks, epidemics or other events, conditions and factors which may impair the value of your investment in the Fund.
■
Small- and Mid-Cap Stock Risk. Securities of small- and mid-cap companies can, in certain circumstances, have a higher potential for gains than securities of larger companies but are more likely to have more risk than larger companies. For example, small- and mid-cap companies may be more vulnerable to market downturns and adverse business or economic events than larger companies because they may have more limited financial resources and business operations. Small- and mid-cap companies are also more likely than larger companies to have more limited product lines and operating histories and to depend on smaller and generally less experienced management teams. Securities of small- and mid-cap companies may trade less frequently and in smaller volumes and may be less liquid and fluctuate more sharply in value than securities of larger companies. When the Fund takes significant positions in small- and mid-cap companies with limited trading volumes, the liquidation of those positions, particularly in a distressed market, could be prolonged and result in Fund investment losses that would affect the value of your investment in the Fund. In addition, some small- and mid-cap companies may not be widely followed by the investment community, which can lower the demand for their stocks.
■
Large-Cap Stock Risk. Investments in larger companies may involve certain risks associated with their larger size. For instance, larger companies may be less able to respond quickly to new competitive challenges, such as changes in consumer tastes or innovation from smaller competitors. Also, larger companies are sometimes less able to achieve as high growth rates as successful smaller companies, especially during extended periods of economic expansion.
Liquidity Risk. Liquidity risk is the risk associated with any event, circumstance, or characteristic of an investment or market that negatively impacts the Fund’s ability to sell, or realize the proceeds from the sale of, an investment at a desirable time or price. Liquidity risk may arise because of, for example, a lack of marketability of the investment, which means that when seeking to sell its portfolio investments, the Fund could find that selling is more difficult than anticipated, especially during times of high market volatility. Market participants attempting to sell the same or a similar instrument at the same time as the Fund could exacerbate the Fund’s exposure to liquidity risk. The Fund may have to accept a lower selling price for the holding, sell other liquid or more liquid investments that it might otherwise prefer to hold (thereby increasing the proportion of the Fund’s investments in less liquid or illiquid securities), or forego another more appealing investment opportunity. The liquidity of Fund investments may change significantly over time and certain investments that were liquid when purchased by the Fund may later become illiquid, particularly in times of overall economic distress. Changing regulatory, market or other conditions or environments (for example, the interest rate or credit environments) may also adversely affect the liquidity and the price of the Fund's investments. Judgment plays a larger role in valuing illiquid or less liquid investments as compared to valuing liquid or more liquid investments. Price volatility may be higher for illiquid or less liquid investments as a result of, for example, the relatively less frequent pricing of such securities (as compared to liquid or more liquid investments). Generally, the less liquid the market at the time the Fund sells a portfolio investment, the greater the risk of loss or decline of value to the Fund. Overall market liquidity and other factors can lead to an increase in redemptions, which may negatively impact Fund performance and NAV, including, for example, if the Fund is forced to sell investments in a down market.
Prospectus 2026
9
CTIVP® – CenterSquare Real Estate Fund
More Information About the Fund (continued)
Market Risk. The Fund may incur losses due to declines in the value of one or more securities in which it invests. These declines may be due to factors affecting a particular issuer, or the result of, among other things, political, regulatory, market, economic or social developments affecting the relevant market(s) more generally. In addition, turbulence in financial markets and reduced liquidity in equity, credit and/or fixed income markets may negatively affect many issuers, which could adversely affect the Fund’s ability to price or value hard-to-value assets in thinly traded and closed markets and could cause significant redemptions and operational challenges. Global economies and financial markets are increasingly interconnected, and conditions and events in one country, region or financial market may adversely impact issuers in a different country, region or financial market. These risks may be magnified if certain events or developments adversely interrupt the global supply chain; in these and other circumstances, such risks might affect companies worldwide. As a result, local, regional or global events such as terrorism, war, other conflicts, natural disasters, disease/virus outbreaks and epidemics or other public health issues, recessions, depressions or other events – or the potential for such events – could have a significant negative impact on global economic and market conditions.
The large-scale invasion of Ukraine by Russia in February 2022 has resulted in sanctions and market disruptions, including declines in regional and global stock markets, unusual volatility in global commodity markets and significant devaluations of Russian currency. In addition, the Iranian conflict that commenced in February 2026 may result in similar, and potentially more severe, disruptions. Escalation of hostilities in the Middle East region could disrupt energy production or transportation, including through key shipping routes, which may lead to increased volatility in energy and other commodity prices. The extent and duration of these conflicts are impossible to predict but could continue to be significant. Market disruption caused by these conflicts, and any countermeasures or responses thereto (including international sanctions, a downgrade in a country’s credit rating, purchasing and financing restrictions, boycotts, tariffs, changes in consumer or purchaser preferences, cyberattacks and espionage) could continue to have severe adverse impacts on regional and/or global securities and commodities markets, including markets for oil and natural gas. These impacts may include reduced market liquidity, distress in credit markets, further disruption of global supply chains, increased risk of inflation, and limited access to investments in certain international markets and/or issuers. These developments and other related events could negatively impact Fund performance.
Real Estate-Related Investment Risk. Investments in real estate investment trusts (REITs) and in securities of other companies (wherever organized) principally engaged in the real estate industry subject the Fund to, among other things, risks similar to those of direct investments in real estate and the real estate industry in general. These include risks related to general and local economic conditions, possible lack of availability of financing and changes in interest rates or property values. REITs are entities that either own properties or make construction or mortgage loans, and also may include operating or finance companies. The value of interests in a REIT may be affected by, among other factors, changes in the value of the underlying properties owned by the REIT, changes in the prospect for earnings and/or cash flow growth of the REIT itself, defaults by borrowers or tenants, market saturation, decreases in market rates for rents, and other economic, political, or regulatory matters affecting the real estate industry, including REITs. REITs and similar non-U.S. entities depend upon specialized management skills, may have limited financial resources, may have less trading volume in their securities, and may be subject to more abrupt or erratic price movements than the overall securities markets. In a rising interest rate environment, the stock prices of real estate-related investments may decline and the borrowing costs of these companies may increase. REITs are also subject to the risk of failing to qualify for favorable tax treatment under the Internal Revenue Code of 1986, as amended. The failure of a REIT to continue to qualify as a REIT for tax purposes can materially and adversely affect its value. Some REITs (especially mortgage REITs) are affected by risks similar to those associated with investments in debt securities including changes in interest rates and the quality of credit extended. Because the value of REITs and other real estate-related companies may fluctuate widely in response to changes in factors affecting the real estate markets, the value of an investment in the Fund may be more volatile than the value of an investment in a fund that is invested in a more diverse range of market sectors.
10
Prospectus 2026
CTIVP® – CenterSquare Real Estate Fund
More Information About the Fund (continued)
Additional Investment Strategies and Policies
This section describes certain investment strategies and policies that the Fund may utilize in pursuit of its investment objective and some additional factors and risks involved with investing in the Fund.
Investment Guidelines
As a general matter, and except as specifically described in the discussion of the Fund's principal investment strategies in this prospectus or as otherwise required by the Investment Company Act of 1940, as amended (the 1940 Act), the rules and regulations thereunder and any applicable exemptive relief, whenever an investment policy or limitation states a percentage of the Fund's assets that may be invested in any security or other asset or sets forth a policy regarding an investment standard, compliance with that percentage limitation or standard will be determined solely at the time of the Fund's investment in the security or asset.
Holding Other Kinds of Investments
The Fund may hold other investments that are not part of its principal investment strategies. These investments and their risks are described below and/or in the Statement of Additional Information (SAI). The Fund may choose not to invest in certain securities described in this prospectus and in the SAI, although it has the ability to do so. Information on the Fund’s holdings can be found in the Fund’s Form N-CSR or by visiting columbiathreadneedleus.com.
Transactions in Derivatives
The Fund may enter into derivative transactions or otherwise have exposure to derivative transactions through underlying investments. Derivatives are financial contracts whose values are, for example, based on (or “derived” from) traditional securities (such as a stock or bond), assets (such as a commodity like gold or a foreign currency), reference rates (such as the Secured Overnight Financing Rate (commonly known as SOFR)) or market indices (such as the Standard & Poor’s 500® Index). The use of derivatives is a highly specialized activity which involves investment techniques and risks different from those associated with ordinary portfolio securities transactions. Derivatives involve special risks and may result in losses or may limit the Fund’s potential gain from favorable market movements. Derivative strategies often involve leverage, which may exaggerate a loss, potentially causing the Fund to lose more money than it would have lost had it invested in the underlying security or other asset directly. The values of derivatives may move in unexpected ways, especially in unusual market conditions, and may result in increased volatility in the value of the derivative and/or the Fund’s shares, among other consequences. Other risks arise from the Fund’s potential inability to terminate or to sell derivative positions. A liquid secondary market may not always exist for the Fund’s derivative positions at times when the Fund might wish to terminate or to sell such positions. Over-the-counter instruments (investments not traded on an exchange) may be illiquid, and transactions in derivatives traded in the over-the-counter market are subject to the risk that the other party will not meet its obligations. The use of derivatives also involves the risks of mispricing or improper valuation and that changes in the value of the derivative may not correlate perfectly with the underlying security, asset, reference rate or index. The Fund also may not be able to find a suitable derivative transaction counterparty, and thus may be unable to engage in derivative transactions when it is deemed favorable to do so, or at all. The U.S. government and the European Union (and some other jurisdictions) have enacted regulations and similar requirements that prescribe clearing, margin, reporting and registration requirements for participants in the derivatives market. These requirements are evolving and their ultimate impact on the Fund remains unclear, but such impact could include restricting and/or imposing significant costs or other burdens upon the Fund’s participation in derivatives transactions. Additionally, regulations governing the use of derivatives by registered investment companies, such as the Fund, require, among other things, that a fund that invests in derivative instruments beyond a specified limited amount apply a value-at-risk-based limit to its portfolio and establish a comprehensive derivatives risk management program. As of the date of this prospectus, the Fund is not required to maintain a comprehensive derivatives risk management program given its more limited use of derivatives. For more information on the risks of derivative investments and strategies, see the SAI.
Prospectus 2026
11
CTIVP® – CenterSquare Real Estate Fund
More Information About the Fund (continued)
Affiliated Fund Investing
The Investment Manager or an affiliate serves as investment adviser to funds using the Columbia brand (Columbia Funds), including those that are structured as “fund-of-funds”, and provides asset-allocation services to (i) shareholders by investing in shares of other Columbia Funds, which may include the Fund (collectively referred to in this section as Underlying Funds), and (ii) discretionary managed accounts (collectively referred to as affiliated products) that invest exclusively in Underlying Funds. These affiliated products, individually or collectively, may own a significant percentage of the outstanding shares of one or more Underlying Funds, and the Investment Manager seeks to balance potential conflicts of interest between the affiliated products and the Underlying Funds in which they invest. The affiliated products’ investment in the Underlying Funds may have the effect of creating economies of scale, possibly resulting in lower expense ratios for the Underlying Funds, because the affiliated products may own substantial portions of the shares of Underlying Funds. However, redemption of Underlying Fund shares by one or more affiliated products could cause the expense ratio of an Underlying Fund to increase, as its fixed costs would be spread over a smaller asset base. Because of large positions of certain affiliated products, the Underlying Funds may experience relatively large inflows and outflows of cash due to affiliated products’ purchases and sales of Underlying Fund shares. Although the Investment Manager or its affiliate may seek to minimize the impact of these transactions where possible, for example, by structuring them over a reasonable period of time or through other measures, Underlying Funds may experience increased expenses as they buy and sell portfolio securities to manage the cash flow effect related to these transactions. Further, when the Investment Manager or its affiliate structures transactions over a reasonable period of time in order to manage the potential impact of the buy and sell decisions for the affiliated products, those affiliated products, including funds-of-funds, may pay more or less (for purchase activity), or receive more or less (for redemption activity), for shares of the Underlying Funds than if the transactions were executed in one transaction. In addition, substantial redemptions by affiliated products within a short period of time could require the Underlying Fund to liquidate positions more rapidly than would otherwise be desirable, which may have the effect of reducing or eliminating potential gain or causing it to realize a loss. In order to meet such redemptions, an Underlying Fund may be forced to sell its liquid (or more liquid) positions, leaving the Underlying Fund holding, post-redemption, a relatively larger position in illiquid investments (i.e., any investment that the Fund reasonably expects cannot be sold or disposed of in current market conditions in seven calendar days or less without the sale or disposition significantly changing the market value of the investment) or less liquid securities. Substantial redemptions may also adversely affect the ability of the Underlying Fund to implement its investment strategy. The Investment Manager or its affiliate also has a conflict of interest in determining the allocation of affiliated products’ assets among the Underlying Funds, as it earns different fees from the various Underlying Funds.
Investing in Money Market Funds
The Fund may invest cash in, or hold as collateral for certain investments, shares of registered or unregistered money market funds, including funds advised by the Investment Manager or its affiliates. These funds are not insured or guaranteed by the Federal Deposit Insurance Corporation (FDIC) or any other government agency. The Fund and its shareholders indirectly bear a portion of the expenses of any money market fund or other fund in which the Fund may invest.
Investing Defensively
The Fund may from time to time take temporary defensive investment positions that may be inconsistent with the Fund’s principal investment strategies in attempting to respond to adverse market, economic, political, social or other conditions, including, without limitation, investing some or all of its assets in money market instruments or shares of affiliated or unaffiliated money market funds or holding some or all of its assets in cash or cash equivalents. The Fund may take such defensive investment positions for as long a period as deemed necessary.
The Fund may not achieve its investment objective while it is investing defensively. Investing defensively may adversely affect Fund performance. During these times, the portfolio managers may make frequent portfolio holding changes, which could result in increased trading expenses and decreased Fund performance. See also Investing in Money Market Funds above for more information.
12
Prospectus 2026
CTIVP® – CenterSquare Real Estate Fund
More Information About the Fund (continued)
Other Strategic and Investment Measures
The Fund may also from time to time take temporary portfolio positions that may or may not be consistent with the Fund’s principal investment strategies in attempting to respond to adverse market, economic, political, social or other conditions, including, without limitation, investing in derivatives, such as forward contracts, futures contracts, options, structured investments and swaps, for various purposes, including among others, investing in particular derivatives in seeking to reduce investment exposures, or in seeking to achieve indirect investment exposures, to a sector, country, region or currency where the Investment Manager believes such positioning is appropriate. The Fund may take such portfolio positions for as long a period as deemed necessary. While the Fund is so positioned, derivatives could comprise a substantial portion of the Fund’s investments and the Fund may not achieve its investment objective. Investing in this manner may adversely affect Fund performance. During these times, the portfolio managers may make frequent portfolio holding changes, which could result in increased trading expenses and decreased Fund performance. For information on the risks of investing in derivatives, see Transactions in Derivatives above.
Portfolio Holdings Disclosure
The Board has adopted policies and procedures that govern the timing and circumstances of disclosure to shareholders and third parties of information regarding the securities owned by the Fund. A description of these policies and procedures is included in the SAI. Fund policy generally permits the disclosure of portfolio holdings information on the Fund's website (columbiathreadneedleus.com) only after a certain amount of time has passed, as described in the SAI.
Purchases and sales of portfolio securities can take place at any time, so the portfolio holdings information available on the Fund's website may not always be current.
FUNDamentals
Portfolio Holdings Versus the Benchmarks
The Fund does not limit its investments to the securities within its benchmark(s), and accordingly the Fund's holdings may diverge from those of its benchmark(s). In addition, the Fund may invest in securities outside any industry and geographic sectors represented in its benchmark(s). The Fund's weightings in individual securities, and in industry or geographic sectors, may also vary considerably from those of its benchmark(s).
Cash Flows
The timing and magnitude of cash inflows from investors buying Fund shares could prevent the Fund from always being fully invested. Conversely, the timing and magnitude of cash outflows to shareholders redeeming Fund shares could require the Fund to sell portfolio securities at less than opportune times or to hold ready reserves of uninvested cash in amounts larger than might otherwise be the case to meet shareholder redemptions. Either situation could adversely impact the Fund’s performance.
Understanding Annual Fund Operating Expenses
The Fund’s annual operating expenses, as presented in the Annual Fund Operating Expenses table in the Fees and Expenses of the Fund section of this prospectus, generally are based on expenses incurred during the Fund’s most recently completed fiscal year, may vary by share class and are expressed as a percentage (expense ratio) of the Fund’s average net assets during that fiscal year. The expense ratios reflect the Fund’s fee arrangements as of the date of this prospectus and, unless indicated otherwise, are based on expenses incurred during the Fund’s most recent fiscal year. The Fund’s assets will fluctuate, but unless indicated otherwise in the Annual Fund Operating Expenses table, no adjustments have been or will be made to the expense ratios to reflect any differences in the Fund’s average net assets between the most recently completed fiscal year and the date of this prospectus or a later date. In general, the Fund’s expense ratios will increase as its net assets decrease, such that the Fund’s actual expense ratios may be higher than the expense ratios presented in the Annual Fund Operating Expenses table if assets fall. Any commitment by the Investment Manager and/or its affiliates to waive fees and/or cap (reimburse)
Prospectus 2026
13
CTIVP® – CenterSquare Real Estate Fund
More Information About the Fund (continued)
expenses is expected, in part, to limit the impact of any increase in the Fund’s expense ratios that would otherwise result because of a decrease in the Fund’s assets in the current fiscal year. The Fund’s annual operating expenses are comprised of (i) investment management fees, (ii) distribution and/or service fees, and (iii) other expenses. Management fees do not vary by class, but distribution and/or service fees and other expenses may vary by class.
FUNDamentals
Other Expenses
“Other expenses” consist of the fees the Fund pays to its custodian, transfer agent, auditors, lawyers and trustees, costs relating to compliance and miscellaneous expenses. Generally, these expenses are allocated on a pro rata basis across all share classes. These fees include certain sub-transfer agency and shareholder servicing fees. For more information on these fees, see About Fund Shares and Transactions — Financial Intermediary Compensation.
Fee Waiver/Expense Reimbursement Arrangements and Impact on Past Performance
The Investment Manager and certain of its affiliates have contractually agreed to waive fees and/or reimburse expenses (excluding certain fees and expenses described below) through April 30, 2027, unless sooner terminated at the sole discretion of the Fund's Board, so that the Fund’s net operating expenses, after giving effect to fees waived/expenses reimbursed and any balance credits and/or overdraft charges from the Fund’s custodian, do not exceed the annual rates of:
| CTIVP® - CenterSquare Real Estate Fund | |
| Class 1 |
0.85% |
| Class 2 |
1.10% |
Under the agreement, the following fees and expenses are excluded from the Fund’s operating expenses when calculating the waiver/reimbursement commitment, and therefore will be paid by the Fund, if applicable: taxes (including foreign transaction taxes), expenses associated with investment in affiliated and non-affiliated pooled investment vehicles (including mutual funds and exchange-traded funds), transaction costs and brokerage commissions, costs related to any securities lending program, dividend expenses associated with securities sold short, inverse floater program fees and expenses, transaction charges and interest on borrowed money, interest, costs associated with shareholder meetings, infrequent and/or unusual expenses and any other expenses the exclusion of which is specifically approved by the Fund’s Board. This agreement may be modified or amended only with approval from all parties.
Effect of Fee Waivers and/or Expense Reimbursements on Past Performance. The Fund’s returns shown in the Performance Information section of this prospectus reflect the effect of any fee waivers and/or reimbursements of Fund expenses by the Investment Manager and/or any of its affiliates that were in place during the performance period shown. Without such fee waivers/expense reimbursements, the Fund’s returns might have been lower.
Primary Service Provider Contracts
The Fund enters into contractual arrangements (Service Provider Contracts) with various service providers, including, among others, the Investment Manager, the Distributor, Columbia Management Investment Services Corp. (the Transfer Agent) and the Fund’s custodian. The Fund’s Service Provider Contracts are solely among the parties thereto. Shareholders are not parties to, or intended to be third-party beneficiaries of, any Service Provider Contracts. Further, this prospectus, the SAI and any Service Provider Contracts are not intended to give rise to any agreement, duty, special relationship or other obligation between the Fund and any investor, or give rise to any contractual, tort or other rights in any individual shareholder, group of shareholders or other person, including any right to assert a fiduciary or other duty, enforce the Service Provider Contracts against the parties or to seek any remedy thereunder, either directly or on behalf of the Fund. Nothing in the previous sentence should be read to suggest any waiver of any rights under federal or state securities laws.
14
Prospectus 2026
CTIVP® – CenterSquare Real Estate Fund
More Information About the Fund (continued)
The Investment Manager, the Distributor, and the Transfer Agent are all affiliates of Ameriprise Financial, Inc. (Ameriprise Financial). They and their affiliates currently provide key services, including investment advisory, administration, distribution, shareholder servicing and transfer agency services, to the Fund and various other funds, including the Columbia Funds, and are paid for providing these services. These service relationships are described below.
The Investment Manager
Columbia Management Investment Advisers, LLC is located at 290 Congress Street, Boston, MA 02210 and serves as investment adviser and administrator to the Columbia Funds. The Investment Manager is a registered investment adviser and a wholly-owned subsidiary of Ameriprise Financial. The Investment Manager’s management experience covers all major asset classes, including equity securities, debt instruments and money market instruments. In addition to serving as an investment adviser to traditional mutual funds, exchange-traded funds and closed-end funds, the Investment Manager acts as an investment adviser for itself, its affiliates, individuals, corporations, retirement plans, private investment companies and financial intermediaries.
Subject to oversight by the Board, the Investment Manager manages the day-to-day operations of the Fund. The Investment Manager is responsible for the investment management of the Fund, but has delegated certain of its duties, including day-to-day portfolio management of all or a portion of the Fund’s assets to one or more investment subadvisers that determine what securities and other investments the Fund should buy or sell. The Investment Manager is also responsible for overseeing the administrative operations of the Fund, including the general supervision of the Fund’s operations, the coordination of the Fund’s other service providers and the provision of related clerical and administrative services.
The SEC has issued an order that permits the Investment Manager, subject to the approval of the Board, to appoint unaffiliated subadvisers by entering into subadvisory agreements with them, and to change in material respects the terms of those subadvisory agreements, including the fees paid thereunder, for the Fund without first obtaining shareholder approval, thereby avoiding the expense and delays typically associated with obtaining shareholder approval. The Fund furnishes shareholders with information about new subadvisers retained in reliance on the order within 90 days after hiring the subadviser. The Investment Manager and its affiliates may have other relationships, including significant financial relationships, with current or potential subadvisers or their affiliates, which may create certain conflicts of interest. When making recommendations to the Board to appoint or to change a subadviser, or to change the terms of a subadvisory agreement, the Investment Manager discloses to the Board the nature of any such material relationships. The SEC has issued a separate order that permits the Board to approve new subadvisory agreements or material changes to existing subadvisory agreements at a meeting that is not in person, provided that the Trustees are able to participate in the meeting using a means of communication that allows them to hear each other simultaneously during the meeting and other conditions of the order are satisfied.
The Fund pays the Investment Manager a fee for its management services, which include investment advisory services and administrative services. The fee is calculated as a percentage of the daily net assets of the Fund and is paid monthly. For the Fund’s most recent fiscal year, management services fees paid to the Investment Manager by the Fund amounted to 0.75% of average daily net assets of the Fund, before any applicable reimbursements.
A discussion regarding the basis for the Board’s approval of the renewal of the Fund's management agreement is available in the Fund’s Form N-CSR for the fiscal period ended June 30, 2025.
The Investment Manager has, with the approval of the Board, engaged an investment subadviser(s) to make the day-to-day investment decisions for the Fund. The Investment Manager pays the subadviser(s) for investment advisory services and retains ultimate responsibility (subject to Board oversight) for overseeing any subadviser it engages and for evaluating the Fund’s needs and the subadvisers’ skills and abilities on an ongoing basis. Based on its evaluations, the Investment Manager may at times recommend to the Board that the Fund change, add or terminate one or more subadvisers; continue to retain a subadviser even though the subadviser’s ownership or corporate structure has changed; or materially change a subadvisory agreement with a subadviser. A discussion regarding the basis for the Board’s approval of the renewal of the investment subadvisory agreement with CenterSquare is available in the Fund’s Form N-CSR for the fiscal period ended June 30, 2025.
Prospectus 2026
15
CTIVP® – CenterSquare Real Estate Fund
More Information About the Fund (continued)
The date the Subadviser began serving the Fund is set forth under Subadviser below. Any performance of the Fund prior to the date the Subadviser began serving was achieved by one or more different subadvisers. Similarly, the portfolio turnover rate for periods prior to the Subadviser’s management of the Fund was the result of management by one or more different subadvisers. A change in subadvisers may result in increased portfolio turnover.
Subadviser
CenterSquare Investment Management LLC, or its predecessor (CenterSquare Investment Management, Inc.), which has served as Subadviser to the Fund since June 2016, is located at Eight Tower Bridge, 161 Washington Street, 7th Floor, Conshohocken, PA 19428. CenterSquare, subject to the supervision of Columbia Management, provides day-to-day management of the Fund’s portfolio, as well as investment research and statistical information, under a subadvisory agreement with Columbia Management. CenterSquare was organized and formed in September 2017 to focus exclusively on opportunities in the real estate securities market, including publicly traded REITs. CenterSquare also provides discretionary and non-discretionary investment advisory services to institutional and high net worth investors in the form of separate accounts and pooled investment vehicles including private funds.
Portfolio Managers
Information about the portfolio managers primarily responsible for overseeing the Fund’s investments is shown below. The SAI provides additional information about the portfolio managers, including information relating to compensation, other accounts managed by the portfolio managers, and ownership by the portfolio managers of Fund shares.
Subadviser: CenterSquare Investment Management LLC (CenterSquare)
| Portfolio Management |
Title |
Role with Fund |
Managed Fund Since |
| Dean Frankel, CFA |
Co-Chief Investment Officer of CenterSquare |
Co-Portfolio Manager |
2016 |
| Eric Rothman, CFA |
Portfolio Manager of CenterSquare |
Co-Portfolio Manager |
2016 |
Mr. Frankel joined CenterSquare in 1997. Mr. Frankel began his investment career in 1997 and earned a B.S. in Economics from the Wharton School at the University of Pennsylvania.
Mr. Rothman joined CenterSquare in 2006. Mr. Rothman began his investment career in 1995 and earned a B.A. in Economics from Boston University.
The Distributor
Shares of the Fund are distributed by Columbia Management Investment Distributors, Inc., which is located at 290 Congress Street, Boston, MA 02210. The Distributor is a registered broker-dealer and an indirect, wholly-owned subsidiary of Ameriprise Financial. The Distributor and its affiliates may pay commissions, distribution and service fees and/or other compensation to entities, including Ameriprise Financial affiliates, for selling shares and providing services to investors.
The Transfer Agent
Columbia Management Investment Services Corp. is a registered transfer agent and wholly-owned subsidiary of Ameriprise Financial. The Transfer Agent is located at 290 Congress Street, Boston, MA 02210, and its responsibilities include processing purchases, redemptions and transfers of Fund shares, calculating and paying distributions, maintaining shareholder records, preparing account statements and providing customer service. The Transfer Agent has engaged SS&C GIDS, Inc. to provide various sub-transfer agency services. The Fund pays a service fee to participating insurance companies or other financial intermediaries that provide sub-recordkeeping and other services to Contract owners and the separate accounts. The Transfer Agent may retain as compensation for its services revenues for fees for wire, telephone and redemption orders, account transcripts due the Transfer Agent from Fund shareholders and interest (net of bank charges) earned with respect to balances in accounts the Transfer Agent maintains in connection with its services to the Fund.
16
Prospectus 2026
CTIVP® – CenterSquare Real Estate Fund
More Information About the Fund (continued)
Other Roles and Relationships of Ameriprise Financial and its Affiliates — Certain Conflicts of Interest
The Investment Manager, Distributor and Transfer Agent, all affiliates of Ameriprise Financial, provide various services to the Fund and other Columbia Funds for which they are compensated. Ameriprise Financial and its other affiliates may also provide other services to these funds and be compensated for them.
The Investment Manager and its affiliates may provide investment advisory and other services to other clients and customers substantially similar to those provided to the Columbia Funds. These activities, and other financial services activities of Ameriprise Financial and its affiliates, may present actual and potential conflicts of interest and introduce certain investment constraints.
Ameriprise Financial is a major financial services company, engaged in a broad range of financial activities beyond the fund-related activities of the Investment Manager, including, among others, insurance, broker-dealer (sales and trading), asset management, banking and other financial activities. These additional activities may involve multiple advisory, financial, insurance and other interests in securities and other instruments, and in companies that issue securities and other instruments, that may be bought, sold or held by the Columbia Funds.
Conflicts of interest and limitations that could affect a Columbia Fund may arise from, for example, the following:
■
compensation and other benefits received by the Investment Manager and other Ameriprise Financial affiliates related to the management/administration of a Columbia Fund and the sale of its shares;
■
the allocation of, and competition for, investment opportunities among the Fund, other funds and accounts advised/managed by the Investment Manager and other Ameriprise Financial affiliates, or Ameriprise Financial itself and its affiliates;
■
separate and potentially divergent management of a Columbia Fund and other funds and accounts advised/managed by the Investment Manager and other Ameriprise Financial affiliates;
■
regulatory and other investment restrictions on investment activities of the Investment Manager and other Ameriprise Financial affiliates and accounts advised/managed by them;
■
insurance and other relationships of Ameriprise Financial affiliates with companies and other entities in which a Columbia Fund invests;
■
regulatory and other restrictions relating to the sharing of information between Ameriprise Financial and its affiliates, including the Investment Manager, and a Columbia Fund; and
■
insurance companies investing in the Fund may be affiliates of Ameriprise Financial; these affiliated insurance companies, individually and collectively, may hold through separate accounts a significant portion of the Fund's shares and may also invest in separate accounts managed by the Investment Manager that have the same or substantially similar investment objectives and strategies as the Fund.
The Investment Manager and Ameriprise Financial have adopted various policies and procedures that are intended to identify, monitor and address conflicts of interest. However, there is no assurance that these policies, procedures and disclosures will be effective.
Additional information about Ameriprise Financial and the types of conflicts of interest and other matters referenced above is set forth in the Investment Management and Other Services — Other Roles and Relationships of Ameriprise Financial and its Affiliates — Certain Conflicts of Interest section of the SAI. Investors in the Columbia Funds should carefully review these disclosures and consult with their financial advisor if they have any questions.
Certain Legal Matters
Ameriprise Financial and certain of its affiliates are involved, in the normal course of business, in legal proceedings that include regulatory inquiries, arbitration and litigation (including class actions) concerning matters arising in connection with the conduct of their activities as part of a diversified financial services firm. Ameriprise Financial believes that the Fund is not currently the subject of, and that neither Ameriprise Financial nor any of its affiliates are the subject of, any pending legal, arbitration or regulatory proceedings that are likely to have a material adverse
Prospectus 2026
17
CTIVP® – CenterSquare Real Estate Fund
More Information About the Fund (continued)
effect on the Fund or the ability of Ameriprise Financial or its affiliates to perform under their contracts with the Fund. Information regarding certain pending and settled legal proceedings may be found in the Fund’s Form N-CSR and in the SAI. Additionally, Ameriprise Financial is required to make quarterly (10-Q), annual (10-K) and, as necessary, 8-K filings with the SEC on legal and regulatory matters that relate to Ameriprise Financial and its affiliates. Copies of these filings may be obtained by accessing the SEC website at sec.gov.
18
Prospectus 2026
CTIVP® – CenterSquare Real Estate Fund
About Fund Shares and Transactions
Description of the Share Classes
Share Class Features
The Fund offers the classes of shares set forth on the cover of this prospectus. Each share class has its own cost structure and other features. The following summarizes the primary features of the Class 1 and Class 2 shares.
| |
Class 1 Shares |
Class 2 Shares |
| Eligible Investors |
Shares of the Fund are available only to separate accounts of participating insurance companies as underlying investments for variable annuity contracts and/or variable life insurance policies (collectively, Contracts) or qualified pension and retirement plans (Qualified Plans) or other eligible investors authorized by the Distributor. | |
| Investment Limits |
none |
none |
| Conversion Features |
none |
none |
| Front-End Sales Charges |
none |
none |
| Contingent Deferred Sales Charges (CDSCs) |
none |
none |
| Maximum Distribution and/or Service Fees |
none |
0.25% |
FUNDamentals
Financial Intermediaries
The term “financial intermediary” refers to the insurance company that issued your contract, qualified pension or retirement plan sponsors or the financial intermediary that employs your financial advisor. Financial intermediaries also include broker-dealers and financial advisors as well as firms that employ broker-dealers and financial advisors, including, for example, brokerage firms, banks, investment advisers, third party administrators and other firms in the financial services industry, including Ameriprise Financial and its affiliates.
Distribution and/or Service Fees
Pursuant to Rule 12b-1 under the Investment Company Act of 1940, as amended (the 1940 Act), the Board has approved, and the Fund has adopted, a distribution plan which sets the distribution fees that are periodically deducted from the Fund’s assets for Class 2 shares. The distribution fee for Class 2 shares is 0.25%. These fees are calculated daily, may vary by share class and are intended to compensate the Distributor and/or financial intermediaries for selling shares of the Fund and/or providing services to investors. Because the fees are paid out of the Fund’s assets on an ongoing basis, they will increase the cost of your investment over time.
The Fund will pay these fees to the Distributor and/or to eligible financial intermediaries for as long as the distribution plan continues. The Fund may reduce or discontinue payments at any time.
The Fund pays a service fee to participating insurance companies or other financial intermediaries that provide sub-recordkeeping and other services to Contract owners, Qualified Plan participants and the separate accounts.
Financial Intermediary Compensation
The Distributor, the Investment Manager and their affiliates make payments, from their own resources, to financial intermediaries, primarily to affiliated and unaffiliated insurance companies, for marketing/sales support services relating to the Fund (Marketing Support Payments). Such payments are generally based upon one or more of the following factors: average net assets of the Columbia Funds sold by the Distributor attributable to that financial intermediary; gross sales of the Columbia Funds distributed by the Distributor attributable to that financial intermediary; or a negotiated lump sum payment. While the financial arrangements may vary for each financial intermediary, the Marketing Support Payments to any one financial intermediary are generally between 0.05% and 0.40% on an annual basis for payments based on average net assets of the Fund attributable to the financial intermediary, and between 0.05% and 0.25% on an annual basis for a financial intermediary receiving a payment based on gross sales of the Columbia Funds attributable to the financial intermediary.
Prospectus 2026
19
CTIVP® – CenterSquare Real Estate Fund
About Fund Shares and Transactions (continued)
As employee compensation and business unit operating goals at all levels are generally tied to the success of Ameriprise Financial, employees of Ameriprise Financial and its affiliates, including employees of affiliated broker-dealers and insurance companies, are incented to include shares of the Columbia Funds in Contracts offered by affiliated insurance companies. Certain employees, directly or indirectly, receive higher compensation and other benefits as investment in the Columbia Funds increases. In addition, management, sales leaders and other employees may spend more of their time and resources promoting Ameriprise Financial and its subsidiary companies, including the Distributor and the Investment Manager, and the products they offer, including the Fund.
In addition, the Transfer Agent has certain arrangements in place to compensate financial intermediaries, primarily to affiliated and unaffiliated insurance companies, that hold Fund shares through networked and omnibus accounts, including omnibus retirement plans, for services that they provide to beneficial Fund shareholders (Shareholder Services). Shareholder Services and related fees vary by financial intermediary and may include sub-accounting, sub-transfer agency, participant recordkeeping, shareholder or participant reporting, shareholder or participant transaction processing, maintenance of shareholder records, preparation of account statements and provision of customer service, and are not intended to include services that are primarily intended to result in the sale of Fund shares. Payments for Shareholder Services generally are not expected, with certain limited exceptions, to exceed 0.40% of the average aggregate value of the Fund’s shares. Each Fund pays the Transfer Agent a service fee equal to the payments made by the Transfer Agent to participating insurance companies and other financial intermediaries that provide Shareholder Services up to the lesser of the amount charged by the financial intermediary or a contractual asset-based cap. Payments of amounts that exceed the amount paid by the Fund are borne by the Transfer Agent, the Investment Manager and/or their affiliates.
In addition to the payments described above, the Distributor, the Investment Manager and their affiliates typically make other payments or allow promotional incentives to certain broker-dealers to the extent permitted by SEC and Financial Industry Regulatory Authority (FINRA) rules and by other applicable laws and regulations.
Amounts paid by the Distributor, the Investment Manager and their affiliates are paid out of their own resources and do not increase the amount paid by you or the Fund. You can find further details in the SAI about the payments made by the Distributor, the Investment Manager and their affiliates, as well as a list of the financial intermediaries, including Ameriprise Financial affiliates, to which the Distributor, the Investment Manager or their affiliates have agreed to make Marketing Support Payments and fee payments for Shareholder Services.
Your financial intermediary may charge you fees and commissions in addition to those described in this prospectus. You should consult with your financial intermediary and review carefully any disclosure your financial intermediary provides regarding its services and compensation. Depending on the financial arrangement in place at any particular time, a financial intermediary and its financial advisors may have a conflict of interest or financial incentive with respect to recommendations regarding the Fund or any Contract or Qualified Plan that includes the Fund.
Share Price Determination
The price you pay or receive when you buy, sell or transfer shares is the Fund's next determined net asset value (or NAV) per share for a given share class. The Fund calculates the NAV per share for each class of shares of the Fund at the end of each business day, with the value of the Fund's shares based on the total value of all of the securities and other assets that it holds as of such specified time.
FUNDamentals
NAV Calculation
Each of the Fund's share classes calculates its NAV per share as follows:
NAV per share = (Value of assets of the share class) – (Liabilities of the share class)
Number of outstanding shares of the class
Number of outstanding shares of the class
20
Prospectus 2026
CTIVP® – CenterSquare Real Estate Fund
About Fund Shares and Transactions (continued)
FUNDamentals
Business Days
A business day is any day that the New York Stock Exchange (NYSE) is open. A business day typically ends at the close of regular trading on the NYSE, usually at 4:00 p.m. Eastern time. If the NYSE is scheduled to close early, the business day will be considered to end as of the time of the NYSE’s scheduled close. The Fund will not treat an intraday unscheduled disruption in NYSE trading or an intraday unscheduled closing as a close of regular trading on the NYSE for these purposes and will price its shares as of the regularly scheduled closing time for that day (typically, 4:00 p.m. Eastern time). Nonetheless, the NAV of Fund shares may be determined at such other time or times (in addition to or in lieu of the time set forth above) as the Fund’s Board may approve or ratify. On holidays and other days when the NYSE is closed, the Fund’s NAV is not calculated and the Fund does not accept buy or sell orders. However, the value of the Fund’s assets may still be affected on such days to the extent that the Fund holds foreign securities that trade on days that foreign securities markets are open.
Equity securities listed on an exchange are typically valued at the closing price or last trade on their primary exchange at the close of business of the NYSE. Equity securities without a readily available closing price or that are not listed on any exchange are typically valued at the mean between the closing bid and asked prices. Other equity securities, debt securities and other assets are valued differently. For instance, bank loans trading in the secondary market are fair valued unless market quotations are readily available, fixed income investments maturing in 60 days or less are valued primarily using the amortized cost method, unless this methodology results in a valuation that does not approximate the market value of these securities, and those maturing in excess of 60 days are valued based on prices obtained from a pricing service, if available (which may represent market values or fair values). Investments in other open-end funds are valued at their published NAVs. The value of the Fund’s portfolio securities is determined in accordance with the valuation policy approved by the Board (the Valuation Policy). Pursuant to Rule 2a-5 under the 1940 Act, the Board has designated the Investment Manager as the Fund’s valuation designee. The Investment Manager, in turn, has authorized its valuation committee to make fair value determinations and to carry out supervisory and certain other functions relating to the valuation of Fund portfolio securities, pursuant to the Valuation Policy.
If a market price is not readily available or is deemed not to reflect market value for a portfolio security, the Investment Manager will determine the price based on a determination of the security's fair value pursuant to the Valuation Policy. In addition, the Investment Manager may use fair valuation techniques to price securities that trade on a foreign exchange when a significant event has occurred after the foreign exchange closes but before the time at which the Fund’s share price is calculated. Foreign exchanges typically close before the time at which Fund share prices are calculated, and may be closed altogether on days when the Fund is open. Such significant events affecting a foreign security may include, but are not limited to: (1) corporate actions, earnings announcements, litigation or other events impacting a single issuer; (2) governmental action that affects securities in one sector or country; (3) natural disasters or armed conflicts affecting a country or region; or (4) significant domestic or foreign market fluctuations. The Fund uses various criteria, including an evaluation of U.S. market moves after the close of foreign markets, in determining whether a foreign security's market price is readily available and reflective of market value and, if not, the fair value of the security.
Fair valuation may have the effect of reducing stale pricing arbitrage opportunities presented by the pricing of Fund shares. However, when the Investment Manager uses fair valuation to price equity securities, it may value those securities higher or lower than another fund or manager would. Also, fair valuation of Fund holdings may cause the Fund's performance to diverge to a greater degree from the performance of various benchmark indices used to compare the Fund's performance because indices generally do not use fair valuation techniques. Because of the judgment involved in fair valuation decisions, there can be no assurance that the value ascribed to a particular security is accurate. The Fund has retained one or more independent fair valuation pricing services to assist in the fair valuation process for foreign securities.
Prospectus 2026
21
CTIVP® – CenterSquare Real Estate Fund
About Fund Shares and Transactions (continued)
Futures and options on futures are valued based upon the settlement price as determined by the principal exchange on which they are traded or, in the absence of a settlement price, at the mean of the closing bid and ask. Generally, over-the-counter derivatives, such as swaps and swaptions, are valued based on a price provided by an approved pricing service.
Shareholder Information
Each share class has its own cost structure and other features. Your product may not offer every share class. The Fund encourages you to consult with a financial advisor who can help you with your investment decisions and for more information about the share classes offered by the Fund and available under your product. Shares of the Fund are generally available for purchase only by participating insurance companies in connection with Contracts and Qualified Plan sponsors.
The Fund, the Distributor or the Transfer Agent may refuse any order to buy or transfer shares. If this happens, the Fund will return any money it received, but no interest will be paid on that money.
Shares of the Fund may not be purchased or sold directly by individual Contract owners or participants in a Qualified Plan. When you sell your shares through your Contract or Qualified Plan, the Fund is effectively buying them back. This is called a redemption. The right of redemption may be suspended or payment postponed whenever permitted by applicable laws and regulations, as described under Satisfying Fund Redemption Requests below.
Depending on the context, references to “you” or “your” herein refer either to the holder of a Contract, participant in a Qualified Plan or qualified institutional investor who may select Fund shares to fund his or her investment in the Contract or Qualified Plan or to the participating insurance company as the holder of Fund shares through one or more separate accounts or the Qualified Plan.
Satisfying Fund Redemption Requests
The Fund typically expects to send the redeeming participating insurance company or Qualified Plan sponsor payment for shares within two business days after your trade date. The Fund can suspend redemptions and/or delay payment of redemption proceeds for up to seven days. The Fund can also suspend redemptions and/or delay payment of redemption proceeds in excess of seven days under certain circumstances, including when the NYSE is closed or trading thereon is restricted or during emergency or other circumstances, including as determined by the SEC.
The Fund typically seeks to satisfy redemption requests from cash or cash equivalents held by the Fund, from the proceeds of orders to purchase Fund shares or from the proceeds of sales of Fund holdings effected in the normal course of managing the Fund. However, the Fund may have to sell Fund holdings, including in down markets, to meet heavier than usual redemption requests. For example, under stressed or abnormal market conditions or circumstances, including circumstances adversely affecting the liquidity of the Fund’s investments, the Fund may be more likely to be forced to sell Fund holdings to meet redemptions than under normal market circumstances. In these situations, the Fund’s portfolio managers may have to sell Fund holdings that would not otherwise be sold because, among other reasons, the current price to be received is less than the value of the holdings perceived by the Fund’s portfolio managers. The Fund may also, under certain circumstances (but more likely under stressed or abnormal market conditions or circumstances), borrow money under a credit facility to which the Fund and certain other Columbia Funds are parties or from other Columbia Funds under an interfund lending program (except for closed-end funds and money market funds, which are not eligible to borrow under the program). The Fund and the other Columbia Funds are limited as to the amount that each may individually and collectively borrow under the credit facility and the interfund lending program. As a result, borrowings available to the Fund under the credit facility and the interfund lending program might be insufficient, alone or in combination with the other strategies described herein, to satisfy Fund redemption requests. Please see About Fund Investments – Borrowings – Interfund Lending in the SAI for more information about the credit facility and interfund lending program. The Fund is also limited in the total amount it may borrow. The Fund may only borrow to the extent permitted by the 1940 Act, the rules and regulations thereunder, and any exemptive relief available to the Fund, which currently limit Fund borrowings to
22
Prospectus 2026
CTIVP® – CenterSquare Real Estate Fund
About Fund Shares and Transactions (continued)
33 1/3% of total assets (including any amounts borrowed) less liabilities (other than borrowings), plus an additional 5% of its total assets for temporary purposes (to be repaid within 60 days without extension or renewal), in each case determined at the time the borrowing is made.
In addition, the Fund reserves the right to honor redemption orders in whole or in part with in-kind distributions of Fund portfolio securities instead of cash if the Investment Manager, in its sole discretion, determines it to be in the best interest of the remaining shareholders. Such in-kind distributions typically represent a pro-rata portion of Fund portfolio assets subject to adjustments (e.g., for non-transferable securities, round lots and derivatives). In the event the Fund distributes portfolio securities in kind, shareholders may incur brokerage and other transaction costs associated with converting the portfolio securities into cash. Also, the portfolio securities may increase or decrease in value after they are distributed but before they are converted into cash. For U.S. federal income tax purposes, redemptions paid in securities are generally treated the same as redemptions paid in cash. If, during any 90-day period, you redeem shares in an amount greater than $250,000 or 1% of the Fund’s net assets (whichever is less), and if the Investment Manager determines it to be feasible and appropriate, the Fund may pay the redemption amount above such threshold by an in-kind distribution of Fund portfolio securities. Although shares of the Fund may not be purchased or sold by individual owners of Contracts or Qualified Plans, this policy applies indirectly to Contract and Qualified Plan owners.
Potential Conflicts of Interest – Mixed and Shared Funding
The Fund is available for purchase only through Contracts offered by participating insurance companies, Qualified Plans and other qualified institutional investors authorized by the Distributor. Due to differences in tax treatment and other considerations, the interests of various Contract owners, and the interests of Qualified Plan participants, if any, may conflict. The Fund does not foresee any disadvantages to investors arising from these potential conflicts of interest at this time. Nevertheless, the Board of the Fund intends to monitor events to identify any material irreconcilable conflicts which may arise, and to determine what action, if any, should be taken in response to any conflicts. If such a conflict were to arise, one or more separate accounts might be required to withdraw its investments in the Fund or shares of another mutual fund may be substituted. This might force the Fund to sell securities at disadvantageous prices.
Order Processing
Orders to buy and sell shares of the Fund that are placed by your participating insurance company or Qualified Plan sponsor are processed on business days. Orders received in “good form” by the Transfer Agent or a financial intermediary, including your participating insurance company or Qualified Plan sponsor, before the end of a business day are priced at the NAV per share of the Fund's applicable share class on that day. Orders received after the end of a business day will receive the next business day’s NAV per share. An order is in “good form” if the Transfer Agent or your financial intermediary has all of the information and documentation it deems necessary to effect your order. The market value of the Fund’s investments may change between the time you submit your order and the time the Fund next calculates its NAV per share. The business day that applies to your order is also called the trade date.
There is no sales charge associated with the purchase of Fund shares, but there may be charges associated with your Contract or Qualified Plan. Any charges that apply to your Contract or Qualified Plan, and any charges that apply to separate accounts of participating insurance companies or Qualified Plans that may own shares directly, are described in your separate Contract prospectus or Qualified Plan disclosure documents.
You may transfer all or part of your investment in the Fund to one or more of the other investment options available under your Contract or Qualified Plan. You may provide instructions to sell any amount allocated to the Fund. Proceeds will be mailed within seven days after your surrender or withdrawal request is received in good form by an authorized agent. The amount you receive may be more or less than the amount you invested.
Please refer to your Contract prospectus or Qualified Plan disclosure documents, as applicable, for more information about transfers as well as surrenders and withdrawals.
Prospectus 2026
23
CTIVP® – CenterSquare Real Estate Fund
About Fund Shares and Transactions (continued)
Information Sharing Agreements
As required by Rule 22c-2 under the 1940 Act, the Fund or certain of its service providers will enter into information sharing agreements with financial intermediaries, including participating life insurance companies and financial intermediaries that sponsor or offer retirement plans through which shares of the Fund are made available for purchase. Pursuant to Rule 22c-2, financial intermediaries are required, upon request, to: (i) provide shareholder account and transaction information; and (ii) execute instructions from the Fund to restrict or prohibit further purchases of Fund shares by shareholders who have been identified by the Fund as having engaged in transactions that violate the Fund's excessive trading policies and procedures.
Excessive Trading Practices Policy of Non-Money Market Funds
Right to Reject or Restrict Share Transaction Orders — The Fund is intended for investors with long-term investment purposes and is not intended as a vehicle for frequent trading activity (market timing) that is excessive. Investors should transact in Fund shares primarily for investment purposes. The Board has adopted excessive trading policies and procedures that are designed to deter excessive trading by investors (the Excessive Trading Policies and Procedures). The Fund discourages and does not accommodate excessive trading. Investments in a Fund by institutional investors in connection with redemptions in-kind are exempt from the Excessive Trading Policies and Procedures because they generally do not raise market timing or excessive trading concerns. Further discussion about the Fund’s use of redemptions in-kind is available under Satisfying Fund Redemption Requests.
The Fund reserves the right to reject, without any prior notice, any purchase or transfer order for any reason, and will not be liable for any loss resulting from rejected orders. For example, the Fund may in its sole discretion restrict or reject a purchase or transfer order even if the transaction is not subject to the specific limitation described below if the Fund or its agents determine that accepting the order could interfere with efficient management of the Fund's portfolio or is otherwise contrary to the Fund's best interests. The Excessive Trading Policies and Procedures apply equally to purchase or transfer transactions communicated directly to the Transfer Agent and to those received by financial intermediaries.
Specific Buying and Transferring Limitations — If the Fund detects that an investor has made two “material round trips” in any 28-day period, it will generally reject the investor's future purchase orders, including transfer buy orders, involving any Fund.
For these purposes, a “round trip” is a purchase or transfer into the Fund followed by a sale or transfer out of the Fund, or a sale or transfer out of the Fund followed by a purchase or transfer into the Fund. A “material” round trip is one that is deemed by the Fund to be material in terms of its amount or its potential detrimental impact on the Fund. Independent of this limit, the Fund may, in its sole discretion, reject future purchase orders by any person, group or account that appears to have engaged in any type of excessive trading activity.
These limits generally do not apply to automated transactions or transactions by registered investment companies in a “fund-of-funds” structure. These limits do not apply to payroll deduction contributions by retirement plan participants, transactions initiated by a retirement plan sponsor or certain other retirement plan transactions consisting of rollover transactions, loan repayments and disbursements, and required minimum distribution redemptions. They may be modified or rescinded for accounts held by certain retirement plans to conform to plan limits, for considerations relating to the Employee Retirement Income Security Act of 1974 or regulations of the Department of Labor, and for certain asset allocation or wrap programs. Accounts known to be under common ownership or control generally will be counted together, but accounts maintained or managed by a common intermediary generally will not be considered to be under common ownership or control. The Fund reserves the right to modify these restrictions at any time without prior notice to shareholders. In addition, the Fund may, in its sole discretion, reinstate trading privileges that have been revoked under the Fund's Excessive Trading Policies and Procedures.
Limitations on the Ability to Detect and Prevent Excessive Trading Practices — The Fund takes various steps designed to detect and prevent excessive trading, including daily review of available shareholder transaction information. However, the Fund receives buy, sell or transfer orders through financial intermediaries, and cannot always know of or reasonably detect excessive trading that may be facilitated by financial intermediaries or by the use of the
24
Prospectus 2026
CTIVP® – CenterSquare Real Estate Fund
About Fund Shares and Transactions (continued)
omnibus account arrangements they offer. Omnibus account arrangements are common forms of holding shares of mutual funds, particularly among certain financial intermediaries such as broker-dealers, retirement plans and variable insurance products. These arrangements often permit financial intermediaries to aggregate their clients' transactions and accounts, and in these circumstances, the identities of the financial intermediary clients that beneficially own Fund shares are often not known to the Fund.
Some financial intermediaries apply their own restrictions or policies to their clients’ transactions and accounts, which may be more or less restrictive than those described here. This may impact the Fund's ability to curtail excessive trading, even where it is identified. For these and other reasons, it is possible that excessive trading may occur despite the Fund's efforts to detect and prevent it.
Although these restrictions and policies involve judgments that are inherently subjective and may involve some selectivity in their application, the Fund seeks to act in a manner that it believes is consistent with the best interests of Fund shareholders in making any such judgments.
Risks of Excessive Trading — Excessive trading creates certain risks to the Fund's long-term shareholders and may create the following adverse effects:
■
negative impact on the Fund's performance;
■
potential dilution of the value of the Fund's shares;
■
interference with the efficient management of the Fund's portfolio, such as the need to maintain undesirably large cash positions, the need to use its line of credit or the need to buy or sell securities it otherwise would not have bought or sold;
■
losses on the sale of investments resulting from the need to sell securities at less favorable prices; and
■
increased brokerage and administrative costs.
To the extent that the Fund invests significantly in foreign securities traded on markets that close before the Fund's valuation time, it may be particularly susceptible to dilution, which may be exacerbated as a result of excessive trading. Because events may occur after the close of foreign markets and before the Fund's valuation time that influence the value of foreign securities, investors may seek to trade Fund shares in an effort to benefit from their understanding of the value of foreign securities as of the Fund's valuation time. This is often referred to as price arbitrage. The Fund has adopted procedures designed to adjust closing market prices of foreign securities under certain circumstances to reflect what the Fund believes to be the fair value of those securities as of its valuation time. To the extent the adjustments do not work fully, investors engaging in price arbitrage may cause dilution in the value of the Fund's shares held by other shareholders.
Similarly, to the extent that the Fund invests significantly in thinly traded securities and other debt instruments that are rated below investment grade (commonly called “high-yield” or “junk” bonds), equity securities of small-capitalization companies, floating rate loans, or tax-exempt or other securities that may trade infrequently, because these securities are often traded infrequently, investors may seek to trade Fund shares in an effort to benefit from their understanding of the value of these securities as of the Fund's valuation time. This is also a type of price arbitrage. Any such frequent trading strategies may interfere with efficient management of the Fund's portfolio to a greater degree than would be the case for mutual funds that invest only, or significantly, in highly liquid securities, in part because the Fund may have difficulty selling these particular investments at advantageous times or prices to satisfy large and/or frequent sell orders. Any successful price arbitrage may also cause dilution in the value of Fund shares held by non-redeeming shareholders.
Excessive Trading Practices Policy of Columbia Variable Portfolio - Government Money Market Fund
A money market fund is designed to offer investors a liquid cash option that they may buy and sell as often as they wish. Accordingly, the Board has not adopted policies and procedures designed to discourage excessive or short-term trading of Columbia Variable Portfolio - Government Money Market Fund shares. However, since frequent purchases and sales of Columbia Variable Portfolio - Government Money Market Fund shares could in certain instances harm shareholders in various ways, including reducing the returns to long-term shareholders by increasing
Prospectus 2026
25
CTIVP® – CenterSquare Real Estate Fund
About Fund Shares and Transactions (continued)
costs (such as spreads paid to dealers who trade money market instruments with Columbia Variable Portfolio - Government Money Market Fund) and disrupting portfolio management strategies, Columbia Variable Portfolio - Government Money Market Fund reserves the right, but has no obligation, to reject any purchase or transfer transaction at any time. Columbia Variable Portfolio - Government Money Market Fund has no limits on purchase or transfer transactions. In addition, Columbia Variable Portfolio - Government Money Market Fund reserves the right to impose or modify restrictions on purchases, transfers or trading of Fund shares at any time.
26
Prospectus 2026
CTIVP® – CenterSquare Real Estate Fund
Distributions and Taxes
Distributions to Shareholders
A mutual fund can make money two ways:
■
It can earn income on its investments. Examples of fund income are interest paid on money market instruments and bonds, and dividends paid on common stocks.
■
A mutual fund can also have capital gains if the value of its investments increases. While a fund continues to hold an investment, any gain is generally unrealized. If the fund sells an investment, it generally will realize a capital gain if it sells that investment for a higher price than its adjusted cost basis, and will generally realize a capital loss if it sells that investment for a lower price than its adjusted cost basis. Capital gains and losses are either short-term or long-term, depending on whether the fund holds the securities for one year or less (short-term) or more than one year (long-term).
Mutual funds make payments of fund earnings to shareholders, distributing them among all shareholders of the fund. As a shareholder, you are entitled to your portion of a fund's distributed income, including capital gains. Reinvesting your distributions buys you more shares of a fund — which lets you take advantage of the potential for compound growth. Putting the money you earn back into your investment means it, in turn, may earn even more money (or be exposed to additional losses, if the fund earns a negative return). Over time, the power of compounding has the potential to significantly increase the value of your investment. There is no assurance, however, that you'll earn more money if you reinvest your distributions rather than receive them in cash.
The Fund intends to pay out, in the form of distributions to shareholders, a sufficient amount of its income and gains so that the Fund will qualify for treatment as a regulated investment company and generally will not have to pay any federal income or excise tax. The Fund generally intends to distribute any net realized capital gain (whether long-term or short-term gain) at least once a year. Normally, the Fund will declare and pay distributions of net investment income according to the following schedule:
| Declaration and Distribution Schedule | |
| Declarations |
Annually |
| Distributions |
Annually |
The Fund may declare or pay distributions of net investment income more frequently.
Different share classes of the Fund usually pay different net investment income distribution amounts, because each class has different expenses. Each time a distribution is made, the NAV per share of the share class is reduced by the amount of the distribution.
The Fund will automatically reinvest distributions in additional shares of the same share class of the Fund unless you inform us you want to receive your distributions to be paid in cash.
Taxes and Your Investment
Taxation of the Fund: The Fund has elected and intends to qualify and to be eligible for treatment each year as a regulated investment company. A regulated investment company generally is not subject to tax at the fund level on income and gains from investments that are distributed to shareholders. However, the Fund’s failure to qualify and be eligible for treatment as a regulated investment company would result in fund-level taxation, and consequently, a reduction in income available for distribution to you.
Taxation of Fund Shares: Shares of the Fund are only offered to separate accounts of participating insurance companies, Qualified Plans, and certain other eligible persons or plans permitted to hold shares of the Fund pursuant to the applicable U.S. Treasury Regulations without impairing the ability of participating insurance companies to satisfy the diversification requirements of Section 817(h) of the Internal Revenue Code of 1986, as amended. Each participating insurance company, including each participating insurance company that is an affiliate of the Investment Manager, includes in its taxable income any net investment income derived from the investment of assets held in its separate accounts because the insurance company is considered the owner of these assets under federal income tax law. The insurance company may claim certain tax benefits associated with this investment
Prospectus 2026
27
CTIVP® – CenterSquare Real Estate Fund
Distributions and Taxes (continued)
income. These benefits, which may include foreign tax credits (which can reduce the insurance company’s U.S. taxes on foreign source income) and the corporate dividends-received deduction (which is a tax deduction for the insurance company attributable to certain dividends received from the Fund), are not passed on to Contract owners since the affiliated insurance company is the owner of the assets under federal tax law and is taxed on the investment income generated by the assets.
Taxation of Variable Annuity Contracts and Variable Life Insurance Policies: Your Contract may qualify for favorable tax treatment. Please refer to your Contract prospectus for more information about the tax implications of your investment in the Contract. As long as your Contract continues to qualify for such favorable tax treatment, you will not be taxed currently on your investment in the Fund through such Contract, even if the Fund makes distributions to the separate account and/or you change your investment options under the Contract. In order to qualify for such treatment, among other things, the separate accounts of participating insurance companies, which maintain and invest net proceeds from Contracts, must be “adequately diversified.” The Fund intends to operate in such a manner so that a separate account investing only in Fund shares on behalf of a holder of a Contract will be “adequately diversified.” If the Fund does not meet such requirements because its investments are not adequately diversified, your Contract could lose its favorable tax treatment, and income and gain allocable to your Contract could be taxable currently to you. This could also occur if Contract holders are found to have an impermissible level of control over the investments underlying their Contracts. You should consult with the participating insurance company that issued your Contract, plan sponsor, or other eligible investor through which your investment in the Fund is made regarding the U.S. federal income taxation of your investment.
FUNDamentals
Taxes
The information provided above is only a summary of how U.S. federal income taxes may affect your indirect investment in the Fund. It is not intended as a substitute for careful tax planning. Your investment in the Fund may have other tax implications. It does not apply to certain types of investors who may be subject to special rules, including foreign or tax-exempt investors or those holding Fund shares through a tax-advantaged account other than a Contract, such as a 401(k) plan or IRA. Please see the SAI for more detailed tax information. You should consult with your own tax advisor about the particular tax consequences to you of an investment in the Fund, including the effect of any foreign, state and local taxes, and the effect of possible changes in applicable tax laws.
28
Prospectus 2026
CTIVP® – CenterSquare Real Estate Fund
Financial Highlights
The financial highlights table is intended to help you understand the Fund’s financial performance for the past five fiscal years or, if shorter, the Fund’s period of operations. Certain information reflects financial results for a single Fund share. Per share net investment income (loss) amounts are calculated based on average shares outstanding during the period. The total return in the table represents the rate that an investor would have earned (or lost) on an investment in the Fund assuming all dividends and distributions had been reinvested. Total return does not reflect any fees and expenses imposed under your Contract and/or Qualified Plan, as applicable; such fees and expenses would reduce the total return for all periods shown. Total return and portfolio turnover are not annualized for periods of less than one year. The ratios of expenses and net investment income are annualized for periods of less than one year. The portfolio turnover rate is calculated without regard to purchase and sales transactions of short-term instruments and certain derivatives, if any. If such transactions were included, the Fund’s portfolio turnover rate may be higher. A zero balance may reflect an amount rounding to less than $0.01 or 0.01%. This information has been audited by PricewaterhouseCoopers LLP, an independent registered public accounting firm, whose report, along with the Fund’s financial statements, is included in the Fund’s Form N-CSR, which is available upon request.
Prospectus 2026
29
CTIVP® – CenterSquare Real Estate Fund
Financial Highlights (continued)
| |
Net asset value, beginning of period |
Net investment income |
Net realized and unrealized gain (loss) |
Total from investment operations |
Distributions from net investment income |
Distributions from net realized gains |
Total distributions to shareholders |
| Class 1 | |||||||
| Year Ended 12/31/2025 |
$6.82 |
0.15 |
(0.01)(c) |
0.14 |
(0.20) |
(0.35) |
(0.55) |
| Year Ended 12/31/2024 |
$6.34 |
0.14 |
0.51 |
0.65 |
(0.17) |
— |
(0.17) |
| Year Ended 12/31/2023 |
$6.10 |
0.16 |
0.65 |
0.81 |
(0.13) |
(0.44) |
(0.57) |
| Year Ended 12/31/2022 |
$10.08 |
0.14 |
(2.32) |
(2.18) |
(0.14) |
(1.66) |
(1.80) |
| Year Ended 12/31/2021 |
$7.94 |
0.11 |
3.07 |
3.18 |
(0.13) |
(0.91) |
(1.04) |
| Class 2 | |||||||
| Year Ended 12/31/2025 |
$6.74 |
0.13 |
0.00 |
0.13 |
(0.18) |
(0.35) |
(0.53) |
| Year Ended 12/31/2024 |
$6.28 |
0.13 |
0.48 |
0.61 |
(0.15) |
— |
(0.15) |
| Year Ended 12/31/2023 |
$6.04 |
0.14 |
0.65 |
0.79 |
(0.11) |
(0.44) |
(0.55) |
| Year Ended 12/31/2022 |
$10.00 |
0.12 |
(2.30) |
(2.18) |
(0.12) |
(1.66) |
(1.78) |
| Year Ended 12/31/2021 |
$7.88 |
0.09 |
3.05 |
3.14 |
(0.11) |
(0.91) |
(1.02) |
| Notes to Financial Highlights | |
| (a) |
In addition to the fees and expenses that the Fund bears directly, the Fund indirectly bears a pro rata share of the fees and expenses of any other funds in which it invests. Such indirect expenses are not included in the Fund's reported expense ratios. |
| (b) |
Total net expenses include the impact of certain fee waivers/expense reimbursements made by the Investment Manager and certain of its affiliates, if applicable. |
| (c) |
Calculation of the net gain (loss) per share (both realized and unrealized) does not correlate to the aggregate realized and unrealized gain (loss) presented in the Statement of Operations due to timing of Fund shares sold and redeemed in relation to fluctuations in the market value of the portfolio. For a new share class, the difference may be due to the timing of the commencement of operations for the share class. |
| (d) |
Ratios include interfund lending expense which is less than 0.01%. |
30
Prospectus 2026
CTIVP® – CenterSquare Real Estate Fund
Financial Highlights (continued)
| |
Net asset value, end of period |
Total return |
Total gross expense ratio to average net assets(a) |
Total net expense ratio to average net assets(a),(b) |
Net investment income ratio to average net assets |
Portfolio turnover |
Net assets, end of period (000's) |
| Class 1 | |||||||
| Year Ended 12/31/2025 |
$6.41 |
2.19% |
0.84% |
0.84% |
2.31% |
32% |
$118,254 |
| Year Ended 12/31/2024 |
$6.82 |
10.34% |
0.82%(d) |
0.82%(d) |
2.19% |
34% |
$117,137 |
| Year Ended 12/31/2023 |
$6.34 |
13.76% |
0.81% |
0.81% |
2.69% |
44% |
$169,900 |
| Year Ended 12/31/2022 |
$6.10 |
(24.12%) |
0.80%(d) |
0.80%(d) |
1.83% |
49% |
$158,574 |
| Year Ended 12/31/2021 |
$10.08 |
41.44% |
0.80%(d) |
0.80%(d) |
1.24% |
57% |
$229,250 |
| Class 2 | |||||||
| Year Ended 12/31/2025 |
$6.34 |
2.11% |
1.09% |
1.09% |
2.05% |
32% |
$25,425 |
| Year Ended 12/31/2024 |
$6.74 |
9.86% |
1.07%(d) |
1.07%(d) |
2.04% |
34% |
$26,644 |
| Year Ended 12/31/2023 |
$6.28 |
13.56% |
1.06% |
1.06% |
2.42% |
44% |
$26,283 |
| Year Ended 12/31/2022 |
$6.04 |
(24.33%) |
1.05%(d) |
1.05%(d) |
1.60% |
49% |
$26,266 |
| Year Ended 12/31/2021 |
$10.00 |
41.20% |
1.05%(d) |
1.05%(d) |
1.03% |
57% |
$35,012 |
Prospectus 2026
31
CTIVP® – CenterSquare Real Estate Fund

For More Information
The Fund is generally available only to owners of Contracts issued by participating insurance companies and participants in Qualified Plans. Please refer to your Contract prospectus or Qualified Plan disclosure documents for information about how to buy, sell and transfer shares of the Fund.
Additional Information About the Fund
Additional information about the Fund’s investments is available in the Fund’s annual and semiannual reports to shareholders and in Form N-CSR. In the Fund’s annual report, you will find a discussion of the market conditions and investment strategies that significantly affected the Fund’s performance during its last fiscal year. In the Fund’s Form N-CSR, you will find the Fund’s annual and semiannual financial statements. The SAI also provides additional information about the Fund and its policies. The SAI, which has been filed with the SEC, is legally part of this prospectus (incorporated by reference). To obtain these documents free of charge, to request other information about the Fund and to make shareholder inquiries, please contact the Fund as follows:
By Mail: Columbia Management Investment Services Corp.
P.O. Box 219104
Kansas City, MO 64121-9104
P.O. Box 219104
Kansas City, MO 64121-9104
By Telephone: 800.345.6611
Online: columbiathreadneedleus.com
Reports and other information about the Fund are also available in the EDGAR Database on the SEC’s website at http://www.sec.gov. You can receive copies of this information, for a duplication fee, by electronic request at the following e-mail address: publicinfo@sec.gov.
The investment company registration number of Columbia Funds Variable Series Trust II, of which the Fund is a series, is 811-22127.
Columbia Threadneedle Investments (Columbia Threadneedle) is the global brand name of the Columbia and Threadneedle group of companies.
The Fund is distributed by Columbia Management Investment Distributors, Inc., 290 Congress Street, Boston, MA 02210.
The Fund is distributed by Columbia Management Investment Distributors, Inc., 290 Congress Street, Boston, MA 02210.
© 2026 Columbia Threadneedle. All rights reserved.
PRO7030_12_E01_(05/26)

CTIVP® - Victory Sycamore Established Value Fund
Prospectus
May 1, 2026
As with all mutual funds, the Securities and Exchange Commission (SEC) has not approved or disapproved these securities or passed upon the adequacy of this prospectus. Any representation to the contrary is a criminal offense.

CTIVP® – Victory Sycamore Established Value Fund
Table of Contents
| 3 | |
| 3 | |
| 3 | |
| 4 | |
| 4 | |
| 6 | |
| 7 | |
| 7 | |
| 7 | |
| 8 | |
| 9 | |
| 9 | |
| 9 | |
| 9 | |
| 13 | |
| 17 | |
| 19 | |
| 20 | |
| 21 | |
| 21 | |
| 21 | |
| 22 | |
| 24 | |
| 29 | |
| 29 | |
| 29 | |
| 31 |
2
Prospectus 2026
CTIVP® – Victory Sycamore Established Value Fund
Summary of the Fund
Investment Objective
CTIVP® – Victory Sycamore Established Value Fund (the Fund) seeks to provide shareholders with long-term growth of capital.
Fees and Expenses of the Fund
This table describes the fees and expenses that you may pay as an investor in the Fund. The table does not reflect any fees or expenses imposed by your Contract or Qualified Plan, which are disclosed in your separate Contract prospectus or Qualified Plan disclosure documents. If the additional fees or expenses were reflected, the expenses set forth below would be higher.
| Annual Fund Operating Expenses (expenses that you pay each year as a percentage of the value of your investment) | |||
| |
Class 1 |
Class 2 |
Class 3 |
| Management fees |
% |
% |
% |
| Distribution and/or service (12b-1) fees |
% |
% |
% |
| Other expenses |
% |
% |
% |
| Total annual Fund operating expenses(a) |
% |
% |
% |
(a)
Example
The following example is intended to help you compare the cost of investing in the Fund with the cost of investing in other mutual funds. The example illustrates the hypothetical expenses that you would incur over the time periods indicated, and assumes that:
■
you invest $10,000 in the applicable class of Fund shares for the periods indicated,
■
your investment has a 5% return each year, and
■
the Fund’s total annual operating expenses remain the same as shown in the Annual Fund Operating Expenses table above.
The example does not reflect any fees and expenses that apply to your Contract or Qualified Plan. Inclusion of these charges would increase expenses for all periods shown.
Although your actual costs may be higher or lower, based on the assumptions listed above, your costs would be:
| |
1 year |
3 years |
5 years |
10 years |
| Class 1 (whether or not shares are redeemed) |
$ |
$ |
$ |
$ |
| Class 2 (whether or not shares are redeemed) |
$ |
$ |
$ |
$ |
| Class 3 (whether or not shares are redeemed) |
$ |
$ |
$ |
$ |
Portfolio Turnover
The Fund may pay transaction costs, such as commissions, when it buys and sells securities (or “turns over” its portfolio). A higher portfolio turnover rate may indicate higher transaction costs. These costs, which are not reflected in annual fund operating expenses or in the example, affect the Fund’s performance. During the most recent fiscal year, the Fund’s portfolio turnover rate was 58 % of the average value of its portfolio.
Prospectus 2026
3
CTIVP® – Victory Sycamore Established Value Fund
Summary of the Fund (continued)
Principal Investment Strategies
Under normal circumstances, the Fund invests at least 80% of its net assets (plus the amount of any borrowings for investment purposes) in equity securities of mid-capitalization companies. For these purposes, the Fund considers mid-cap companies to be those whose market capitalization falls within the range of the Russell Midcap® Value Index (the Capitalization Index). The market capitalization range of the companies included within the Capitalization Index was $134.5 million to $116.7 billion as of March 31, 2026. The market capitalization range and composition of companies in the Capitalization Index are subject to change. As such, the size of the companies in which the Fund invests may change. The Fund may continue to hold a security even if the company’s market capitalization is no longer within the range of the Capitalization Index. Under normal circumstances, the Fund also invests at least 80% of its net assets (plus the amount of any borrowings for investment purposes) in equity securities of “value” companies. The Fund considers “value” companies to be those companies that are either constituents of an index constructed by a third party to identify companies with various characteristics of value companies, or that have a higher book-to-price (B/P) ratio than the median ranked stock within the company’s GICS sector, have a higher EBITDA/EV (earnings before interest, taxes, depreciation and amortization-to-enterprise value) or have a lower price-to-earnings ratio than the median ranked stock within the company’s GICS sector. The third-party broad-based index currently used to identify value companies is the Russell 3000® Value Index, although the Fund may change the referenced index without prior notice. The Fund may invest in depositary receipts. As a result of the bottom-up stock selection process, Victory Capital Management Inc. from time to time may find more compelling investment opportunities in certain economic sectors, such as the industrials sector.
Principal Risks
An investment in the Fund involves risks, including Market Risk, Mid-Cap Stock Risk, and Value Securities Risk, among others. Descriptions of these and other principal risks of investing in the Fund are provided below. There is no assurance that the Fund will achieve its investment objective and you may lose money. The value of the Fund’s holdings may decline, and the Fund’s net asset value (NAV) and share price may go down. An investment in the Fund is not a bank deposit and is not insured or guaranteed by the Federal Deposit Insurance Corporation or any other government agency. The significance of any specific risk to an investment in the Fund will vary over time depending on the composition of the Fund's portfolio, market conditions, and other factors. You should read all of the risk information below carefully, because any one or more of these risks may result in losses to the Fund.
Active Management Risk. Due to its active management, the Fund could underperform its benchmark index and/or other funds with similar investment objectives and/or strategies.
Depositary Receipts Risk. Depositary receipts are receipts issued by a bank or trust company reflecting ownership of underlying securities issued by foreign companies. Some foreign securities are traded in the form of American Depositary Receipts and/or Global Depositary Receipts. Depositary receipts involve risks similar to the risks associated with investments in foreign securities, including those associated with an issuer’s (and any of its related companies’) country of organization and places of business operations, which may be related to the particular political, regulatory, economic, social and other conditions or events (including, for example, military confrontations and actions, war, other conflicts, terrorism and disease/virus outbreaks and epidemics) occurring in the country and fluctuations in such country’s currency, as well as market risk tied to the underlying foreign company. In addition, holders of depositary receipts may have limited voting rights, may not have the same rights afforded to stockholders of a typical domestic company in the event of a corporate action, such as an acquisition, merger or rights offering, and may experience difficulty in receiving company stockholder communications. There is no guarantee that a financial institution will continue to sponsor a depositary receipt, or that a depositary receipt will continue to trade on an exchange, either of which could adversely affect the liquidity, availability and pricing of the depositary receipt. Changes in foreign currency exchange rates will affect the value of depositary receipts and, therefore, may affect the value of your investment in the Fund.
Equity Securities Risk. Equity securities may experience significant volatility. Such securities may fall sharply in response to adverse events affecting overall markets, a particular industry or sector, or an individual company’s financial condition.
4
Prospectus 2026
CTIVP® – Victory Sycamore Established Value Fund
Summary of the Fund (continued)
Foreign Securities Risk. Investments in or exposure to securities of foreign companies may involve heightened risks relative to investments in or exposure to securities of U.S. companies. Investing in securities of foreign companies subjects the Fund to the risks associated with an issuer’s (and any of its related companies’) country of organization and places of business operations, including risks related to political, regulatory, economic, social, diplomatic and other conditions or events (including, for example, military confrontations and actions, war, other conflicts, terrorism and disease/virus outbreaks and epidemics) occurring in the country or region, as well as risks associated with less developed custody and settlement practices. Foreign securities may be more volatile and less liquid than securities of U.S. companies and are subject to the risks associated with potential imposition of economic and other sanctions against a particular foreign country, its nationals or industries or businesses within the country. In addition, foreign governments may impose withholding or other taxes on the Fund’s income, capital gains or proceeds from the disposition of foreign securities, which could reduce the Fund’s return on such securities. The performance of the Fund may also be negatively affected by fluctuations in a foreign currency's strength or weakness relative to the U.S. dollar, particularly to the extent the Fund invests a significant percentage of its assets in foreign securities or other assets denominated in currencies other than the U.S. dollar.
Issuer Risk. An issuer in which the Fund invests or to which it has exposure may perform poorly or below expectations, and the value of its securities may therefore decline, which may negatively affect the Fund’s performance. Underperformance of an issuer may be caused by poor management decisions, competitive pressures, breakthroughs in technology, reliance on suppliers, labor problems or shortages, corporate restructurings, fraudulent disclosures, natural disasters, military confrontations and actions, war, other conflicts, terrorism, disease/virus outbreaks, epidemics or other events, conditions and factors which may impair the value of your investment in the Fund.
■
Mid-Cap Stock Risk. Investments in mid-capitalization companies (mid-cap companies) often involve greater risks than investments in larger, more established companies (larger companies) because mid-cap companies tend to have less predictable earnings and may lack the management experience, financial resources, product diversification and competitive strengths of larger companies, and may be less liquid than the securities of larger companies.
Liquidity Risk. Liquidity risk is the risk associated with any event, circumstance, or characteristic of an investment or market that negatively impacts the Fund’s ability to sell, or realize the proceeds from the sale of, an investment at a desirable time or price. Liquidity risk may arise because of, for example, a lack of marketability of the investment, which means that when seeking to sell its portfolio investments, the Fund could find that selling is more difficult than anticipated, especially during times of high market volatility. Market participants attempting to sell the same or a similar instrument at the same time as the Fund could exacerbate the Fund’s exposure to liquidity risk. The Fund may have to accept a lower selling price for the holding, sell other liquid or more liquid investments that it might otherwise prefer to hold (thereby increasing the proportion of the Fund’s investments in less liquid or illiquid securities), or forego another more appealing investment opportunity. The liquidity of Fund investments may change significantly over time and certain investments that were liquid when purchased by the Fund may later become illiquid, particularly in times of overall economic distress. Changing regulatory, market or other conditions or environments (for example, the interest rate or credit environments) may also adversely affect the liquidity and the price of the Fund's investments. Judgment plays a larger role in valuing illiquid or less liquid investments as compared to valuing liquid or more liquid investments. Price volatility may be higher for illiquid or less liquid investments as a result of, for example, the relatively less frequent pricing of such securities (as compared to liquid or more liquid investments). Generally, the less liquid the market at the time the Fund sells a portfolio investment, the greater the risk of loss or decline of value to the Fund. Overall market liquidity and other factors can lead to an increase in redemptions, which may negatively impact Fund performance and NAV, including, for example, if the Fund is forced to sell investments in a down market.
Market Risk. The Fund may incur losses due to declines in the value of one or more securities in which it invests. These declines may be due to factors affecting a particular issuer, or the result of, among other things, political, regulatory, market, economic or social developments affecting the relevant market(s) more generally. In addition, turbulence in financial markets and reduced liquidity in equity, credit and/or fixed income markets may negatively affect many issuers, which could adversely affect the Fund’s ability to price or value hard-to-value assets in thinly
Prospectus 2026
5
CTIVP® – Victory Sycamore Established Value Fund
Summary of the Fund (continued)
traded and closed markets and could cause significant redemptions and operational challenges. Global economies and financial markets are increasingly interconnected, and conditions and events in one country, region or financial market may adversely impact issuers in a different country, region or financial market. These risks may be magnified if certain events or developments adversely interrupt the global supply chain; in these and other circumstances, such risks might affect companies worldwide. As a result, local, regional or global events such as terrorism, war, other conflicts, natural disasters, disease/virus outbreaks and epidemics or other public health issues, recessions, depressions or other events – or the potential for such events – could have a significant negative impact on global economic and market conditions.
Sector Risk. At times, the Fund may have a significant portion of its assets invested in securities of companies conducting business in a related group of industries within one or more economic sectors, including the industrials sector. Companies in the same sector may be similarly affected by economic, regulatory, political or market events or conditions, which may make the Fund vulnerable to unfavorable developments in that group of industries or economic sector.
■
Industrials Sector. The Fund is vulnerable to the particular risks that may affect companies in the industrials sector. Companies in the industrials sector are subject to certain risks, including changes in supply and demand for their specific product or service and for industrial sector products in general, including decline in demand for such products due to rapid technological developments and frequent new product introduction. Performance of such companies may be affected by factors including government regulation, world events, economic conditions and risks for environmental damage and product liability claims.
Value Securities Risk. Value securities are securities of companies that may have experienced, for example, adverse business, industry or other developments or may be subject to special risks that have caused the securities to be out of favor and, in turn, potentially undervalued. The market value of a portfolio security may not meet the perceived value assessment of that security as determined by the portfolio managers, or may decline in price, even though the securities are already believed to be undervalued by the portfolio managers. There is also a risk that it may take longer than expected for the value of these investments to rise to the perceived value as determined by the portfolio managers. In addition, value securities, at times, may not perform as well as growth securities or the stock market in general, and may be out of favor with investors for varying periods of time.
Performance Information
The following bar chart and table show you how the Fund has performed in the past, and can help you understand the risks of investing in the Fund. The bar chart shows how the Fund’s Class 2 share performance has varied for each full calendar year shown. The table below the bar chart compares the Fund’s returns for the periods shown with a broad measure of market performance, as well as another measure of performance for markets in which the Fund may invest.
Except for differences in annual returns resulting from differences in expenses (where applicable), the share classes of the Fund would have substantially similar annual returns because all share classes of the Fund invest in the same portfolio of securities.
The returns shown do not reflect any fees and expenses imposed under your Contract or Qualified Plan and would be lower if they did.
6
Prospectus 2026
CTIVP® – Victory Sycamore Established Value Fund
Summary of the Fund (continued)
| Year by Year Total Return (%) as of December 31 Each Year |
Best and Worst Quarterly Returns During the Period Shown in the Bar Chart | ||
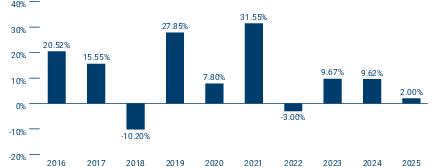 |
|
|
|
| |
|
- | |
Average Annual Total Returns (for periods ended December 31, 2025)
| |
Share Class Inception Date |
1 Year |
5 Years |
10 Years |
| Class 1 |
|
|
|
|
| Class 2 |
|
|
|
|
| Class 3 |
|
|
|
|
| Russell Midcap® Value Index (reflects no deductions for fees, expenses or taxes) |
|
|
|
|
| Russell 3000® Index (reflects no deductions for fees, expenses or taxes) |
|
|
|
|
Fund Management
Investment Manager: Columbia Management Investment Advisers, LLC
Subadviser: Victory Capital Management Inc. (Victory Capital)
| Portfolio Management |
Title |
Role with Fund |
Managed Fund Since |
| Gary Miller |
Chief Investment Officer of Victory Capital’s Sycamore Capital |
Lead Portfolio Manager |
2012 |
| Gregory Conners |
Portfolio Manager of Victory Capital’s Sycamore Capital |
Portfolio Manager |
2012 |
| James Albers, CFA |
Portfolio Manager of Victory Capital’s Sycamore Capital |
Portfolio Manager |
2012 |
| Michael Rodarte, CFA |
Portfolio Manager of Victory Capital’s Sycamore Capital |
Portfolio Manager |
2012 |
Purchase and Sale of Fund Shares
The Fund is available for purchase through Contracts offered by the separate accounts of participating insurance companies or Qualified Plans or by other eligible investors authorized by Columbia Management Investment Distributors, Inc. (the Distributor). Shares of the Fund may not be purchased or sold by individual owners of Contracts or Qualified Plans. If you are a Contract holder or Qualified Plan participant, please refer to your separate Contract prospectus or Qualified Plan disclosure documents for information about minimum investment requirements and how to purchase and redeem shares of the Fund on days the Fund is open for business.
Tax Information
The Fund expects to be treated as a partnership for U.S. federal income tax purposes, and does not expect to make regular distributions (other than in redemption of Fund shares) to shareholders which are generally the participating insurance companies investing in the Fund through separate accounts or Qualified Plans or certain other eligible
Prospectus 2026
7
CTIVP® – Victory Sycamore Established Value Fund
Summary of the Fund (continued)
investors authorized by the Distributor. You should consult with the participating insurance company that issued your Contract, plan sponsor or other eligible investor through which your investment in the Fund is made regarding the U.S. federal income taxation of your investment.
Payments to Broker-Dealers and Other Financial Intermediaries
If you make allocations to the Fund, the Fund, its Distributor or other related companies may pay participating insurance companies or other financial intermediaries for the allocation (sale) of Fund shares and related services in connection with such allocations to the Fund. These payments may create a conflict of interest by influencing the participating insurance company, other financial intermediary or your salesperson to recommend an allocation to the Fund over another fund or other investment option. Ask your financial advisor or salesperson or visit your financial intermediary’s website for more information.
8
Prospectus 2026
CTIVP® – Victory Sycamore Established Value Fund
More Information About the Fund
Investment Objective
CTIVP® – Victory Sycamore Established Value Fund (the Fund) seeks to provide shareholders with long-term growth of capital. Only shareholders can change the Fund’s investment objective. Because any investment involves risk, there is no assurance the Fund’s investment objective will be achieved.
Principal Investment Strategies
Under normal circumstances, the Fund invests at least 80% of its net assets (plus the amount of any borrowings for investment purposes) in equity securities of mid-capitalization companies. For these purposes, the Fund considers mid-cap companies to be those whose market capitalization falls within the range of the Russell Midcap® Value Index (the Capitalization Index). The market capitalization range of the companies included within the Capitalization Index was $134.5 million to $116.7 billion as of March 31, 2026. The market capitalization range and composition of companies in the Capitalization Index are subject to change. As such, the size of the companies in which the Fund invests may change. The Fund may continue to hold a security even if the company’s market capitalization is no longer within the range of the Capitalization Index. Under normal circumstances, the Fund also invests at least 80% of its net assets (plus the amount of any borrowings for investment purposes) in equity securities of “value” companies. The Fund considers “value” companies to be those companies that are either constituents of an index constructed by a third party to identify companies with various characteristics of value companies, or that have a higher book-to-price (B/P) ratio than the median ranked stock within the company’s GICS sector, have a higher EBITDA/EV (earnings before interest, taxes, depreciation and amortization-to-enterprise value) or have a lower price-to-earnings ratio than the median ranked stock within the company’s GICS sector. The third-party broad-based index currently used to identify value companies is the Russell 3000® Value Index, although the Fund may change the referenced index without prior notice. The Fund may invest in depositary receipts. Depositary receipts are receipts issued by a bank or trust company reflecting ownership of underlying securities issued by foreign companies. As a result of the bottom-up stock selection process, Victory Capital Management Inc. from time to time may find more compelling investment opportunities in certain economic sectors, such as the industrials sector.
Columbia Management Investment Advisers, LLC (Columbia Management or the Investment Manager) serves as the investment manager to the Fund and is responsible for the oversight of, including the establishment of risk management parameters for, the Fund’s subadviser, Victory Capital Management Inc. (Victory Capital or the Subadviser), which provides day-to-day portfolio management to the Fund.
The Fund invests in companies that are expected to benefit from either macroeconomic or company-specific factors, and that are attractively priced relative to their fundamentals.
The Fund invests in companies that Victory Capital believes to be of high quality based on criteria such as market share position, profitability, balance sheet strength, competitive advantages, management competence and the ability to generate excess cash flow. Victory Capital uses a bottom-up investment process in conducting fundamental analysis to identify companies trading below Victory Capital’s assessment of intrinsic value that have sustainable returns and prospects for an inflection in business fundamentals that will enable the stock price to be revalued higher.
Victory Capital may sell a security if it believes the stock has reached its fair value estimate, if more attractive opportunities are identified, or if the fundamentals of the company deteriorate.
The Fund’s investment policies with respect to 80% of its net assets may be changed by the Fund’s Board of Trustees without shareholder approval as long as shareholders are given 60 days’ advance written notice of the change.
Principal Risks
An investment in the Fund involves risks, including Market Risk, Mid-Cap Stock Risk, and Value Securities Risk, among others. Descriptions of these and other principal risks of investing in the Fund are provided below. There is no assurance that the Fund will achieve its investment objective and you may lose money. The value of the Fund’s holdings may decline, and the Fund’s net asset value (NAV) and share price may go down. An investment in the Fund is not a bank deposit and is not insured or guaranteed by the Federal Deposit Insurance Corporation or any other
Prospectus 2026
9
CTIVP® – Victory Sycamore Established Value Fund
More Information About the Fund (continued)
government agency. The significance of any specific risk to an investment in the Fund will vary over time depending on the composition of the Fund's portfolio, market conditions, and other factors. You should read all of the risk information below carefully, because any one or more of these risks may result in losses to the Fund.
Active Management Risk. The Fund is actively managed and its performance therefore will reflect, in part, the ability of the portfolio managers to make investment decisions that seek to achieve the Fund’s investment objective. Due to its active management, the Fund could underperform its benchmark index and/or other funds with similar investment objectives and/or strategies.
Depositary Receipts Risk. Depositary receipts are receipts issued by a bank or trust company reflecting ownership of underlying securities issued by foreign companies. Some foreign securities are traded in the form of American Depositary Receipts and/or Global Depositary Receipts. Depositary receipts involve risks similar to the risks associated with investments in foreign securities, including those associated with an issuer’s (and any of its related companies’) country of organization and places of business operations, which may be related to the particular political, regulatory, economic, social and other conditions or events (including, for example, military confrontations and actions, war, other conflicts, terrorism and disease/virus outbreaks and epidemics) occurring in the country and fluctuations in such country’s currency, as well as market risk tied to the underlying foreign company. In addition, holders of depositary receipts may have limited voting rights, may not have the same rights afforded to stockholders of a typical domestic company in the event of a corporate action, such as an acquisition, merger or rights offering, and may experience difficulty in receiving company stockholder communications. There is no guarantee that a financial institution will continue to sponsor a depositary receipt, or that a depositary receipt will continue to trade on an exchange, either of which could adversely affect the liquidity, availability and pricing of the depositary receipt. Changes in foreign currency exchange rates will affect the value of depositary receipts and, therefore, may affect the value of your investment in the Fund.
Equity Securities Risk. Investments in equity securities represent ownership in a company that fluctuates in value with changes in the company’s financial condition. Equity markets may experience significant volatility at times and may fall sharply in response to adverse events. Certain segments of the equity market may react differently than other segments and U.S. markets may react differently than foreign markets. Individual equity prices also may experience dramatic movements in price. Price movements may result from factors affecting individual companies, sectors, or industries selected for the Fund’s portfolio or the securities market as a whole, including periods of slower growth or recessionary economic conditions, future expectations of poor economic conditions, changes in political or social conditions, and lack of investor confidence. In addition, individual equity interests may be adversely affected by factors such as reduced sales, increased costs, or a negative outlook for the future performance of the company. As compared with preferred stock and debt, common stock generally involves greater risk and has lower priority when liquidation, bankruptcy, and dividend payments are made. Preferred stock may be subordinated to bonds or other debt instruments in a company’s capital structure and is typically less liquid than common stock.
Foreign Securities Risk. Investments in or exposure to securities of foreign companies may involve heightened risks relative to investments in or exposure to securities of U.S. companies. For example, foreign markets can be extremely volatile. Foreign securities may also be less liquid, making them more difficult to trade, than securities of U.S. companies so that the Fund may, at times, be unable to sell foreign securities at desirable times or prices. Brokerage commissions, custodial costs and other fees are also generally higher for foreign securities. The Fund may have limited or no legal recourse in the event of default with respect to certain foreign securities, including those issued by foreign governments. In addition, foreign governments may impose withholding or other taxes on the Fund’s income, capital gains or proceeds from the disposition of foreign securities, which could reduce the Fund’s return on such securities. In some cases, such withholding or other taxes could potentially be confiscatory. Other risks include: possible delays in the settlement of transactions or in the payment of income; generally less publicly available information about foreign companies; the impact of economic, political, social, diplomatic or other conditions or events (including, for example, military confrontations and actions, war, other conflicts, terrorism and disease/virus outbreaks and epidemics), possible seizure, expropriation or nationalization of a company or its assets or the assets of a particular investor or category of investors; accounting, auditing and financial reporting standards that may be less comprehensive and stringent than those applicable to domestic companies; the imposition of economic and other sanctions against a particular foreign country, its nationals or industries or businesses within
10
Prospectus 2026
CTIVP® – Victory Sycamore Established Value Fund
More Information About the Fund (continued)
the country; and the generally less stringent standard of care to which local agents may be held in the local markets. In addition, it may be difficult to obtain reliable information about the securities and business operations of certain foreign issuers. Governments or trade groups may compel local agents to hold securities in designated depositories that are not subject to independent evaluation. The less developed a country’s securities market is, the greater the level of risks. Economic sanctions may be, and have been, imposed against certain countries, organizations, companies, entities and/or individuals. Economic sanctions and other similar governmental actions could, among other things, effectively restrict or eliminate the Fund’s ability to purchase or sell securities, and thus may make the Fund’s investments in such securities less liquid or more difficult to value. In addition, as a result of economic sanctions, the Fund may be forced to sell or otherwise dispose of investments at inopportune times or prices, which could result in losses to the Fund and increased transaction costs. These conditions may be in place for a substantial period of time and enacted with limited advance notice to the Fund. The risks posed by sanctions against a particular foreign country, its nationals or industries or businesses within the country may be heightened to the extent the Fund invests significantly in the affected country or region or in issuers from the affected country that depend on global markets. Additionally, investments in certain countries may subject the Fund to a number of tax rules, the application of which may be uncertain. Countries may amend or revise their existing tax laws, regulations and/or procedures in the future, possibly with retroactive effect. Changes in or uncertainties regarding the laws, regulations or procedures of a country could reduce the after-tax profits of the Fund, directly or indirectly, including by reducing the after-tax profits of companies located in such countries in which the Fund invests, or result in unexpected tax liabilities for the Fund. The performance of the Fund may also be negatively affected by fluctuations in a foreign currency's strength or weakness relative to the U.S. dollar, particularly to the extent the Fund invests a significant percentage of its assets in foreign securities or other assets denominated in currencies other than the U.S. dollar. Currency rates in foreign countries may fluctuate significantly over short or long periods of time for a number of reasons, including changes in interest rates, imposition of currency exchange controls and economic or political developments in the U.S. or abroad. The Fund may also incur currency conversion costs when converting foreign currencies into U.S. dollars and vice versa.
Issuer Risk. An issuer in which the Fund invests or to which it has exposure may perform poorly or below expectations, and the value of its securities may therefore decline, which may negatively affect the Fund’s performance. Underperformance of an issuer may be caused by poor management decisions, competitive pressures, breakthroughs in technology, reliance on suppliers, labor problems or shortages, corporate restructurings, fraudulent disclosures, natural disasters, military confrontations and actions, war, other conflicts, terrorism, disease/virus outbreaks, epidemics or other events, conditions and factors which may impair the value of your investment in the Fund.
■
Mid-Cap Stock Risk. Securities of mid-cap companies can, in certain circumstances, have more risk than securities of larger companies. For example, mid-cap companies may be more vulnerable to market downturns and adverse business or economic events than larger companies because they may have more limited financial resources and business operations. Mid-cap companies are also more likely than larger companies to have more limited product lines and operating histories and to depend on smaller and generally less experienced management teams. Securities of mid-cap companies may trade less frequently and in smaller volumes and may fluctuate more sharply in value than securities of larger companies. When the Fund takes significant positions in mid-cap companies with limited trading volumes, the liquidation of those positions, particularly in a distressed market, could be difficult and result in Fund investment losses that would affect the value of your investment in the Fund. In addition, some mid-cap companies may not be widely followed by the investment community, which can lower the demand for their stocks.
Liquidity Risk. Liquidity risk is the risk associated with any event, circumstance, or characteristic of an investment or market that negatively impacts the Fund’s ability to sell, or realize the proceeds from the sale of, an investment at a desirable time or price. Liquidity risk may arise because of, for example, a lack of marketability of the investment, which means that when seeking to sell its portfolio investments, the Fund could find that selling is more difficult than anticipated, especially during times of high market volatility. Market participants attempting to sell the same or a similar instrument at the same time as the Fund could exacerbate the Fund’s exposure to liquidity risk. The Fund may have to accept a lower selling price for the holding, sell other liquid or more liquid investments that it might
Prospectus 2026
11
CTIVP® – Victory Sycamore Established Value Fund
More Information About the Fund (continued)
otherwise prefer to hold (thereby increasing the proportion of the Fund’s investments in less liquid or illiquid securities), or forego another more appealing investment opportunity. The liquidity of Fund investments may change significantly over time and certain investments that were liquid when purchased by the Fund may later become illiquid, particularly in times of overall economic distress. Changing regulatory, market or other conditions or environments (for example, the interest rate or credit environments) may also adversely affect the liquidity and the price of the Fund's investments. Judgment plays a larger role in valuing illiquid or less liquid investments as compared to valuing liquid or more liquid investments. Price volatility may be higher for illiquid or less liquid investments as a result of, for example, the relatively less frequent pricing of such securities (as compared to liquid or more liquid investments). Generally, the less liquid the market at the time the Fund sells a portfolio investment, the greater the risk of loss or decline of value to the Fund. Overall market liquidity and other factors can lead to an increase in redemptions, which may negatively impact Fund performance and NAV, including, for example, if the Fund is forced to sell investments in a down market.
Market Risk. The Fund may incur losses due to declines in the value of one or more securities in which it invests. These declines may be due to factors affecting a particular issuer, or the result of, among other things, political, regulatory, market, economic or social developments affecting the relevant market(s) more generally. In addition, turbulence in financial markets and reduced liquidity in equity, credit and/or fixed income markets may negatively affect many issuers, which could adversely affect the Fund’s ability to price or value hard-to-value assets in thinly traded and closed markets and could cause significant redemptions and operational challenges. Global economies and financial markets are increasingly interconnected, and conditions and events in one country, region or financial market may adversely impact issuers in a different country, region or financial market. These risks may be magnified if certain events or developments adversely interrupt the global supply chain; in these and other circumstances, such risks might affect companies worldwide. As a result, local, regional or global events such as terrorism, war, other conflicts, natural disasters, disease/virus outbreaks and epidemics or other public health issues, recessions, depressions or other events – or the potential for such events – could have a significant negative impact on global economic and market conditions.
The large-scale invasion of Ukraine by Russia in February 2022 has resulted in sanctions and market disruptions, including declines in regional and global stock markets, unusual volatility in global commodity markets and significant devaluations of Russian currency. In addition, the Iranian conflict that commenced in February 2026 may result in similar, and potentially more severe, disruptions. Escalation of hostilities in the Middle East region could disrupt energy production or transportation, including through key shipping routes, which may lead to increased volatility in energy and other commodity prices. The extent and duration of these conflicts are impossible to predict but could continue to be significant. Market disruption caused by these conflicts, and any countermeasures or responses thereto (including international sanctions, a downgrade in a country’s credit rating, purchasing and financing restrictions, boycotts, tariffs, changes in consumer or purchaser preferences, cyberattacks and espionage) could continue to have severe adverse impacts on regional and/or global securities and commodities markets, including markets for oil and natural gas. These impacts may include reduced market liquidity, distress in credit markets, further disruption of global supply chains, increased risk of inflation, and limited access to investments in certain international markets and/or issuers. These developments and other related events could negatively impact Fund performance.
Sector Risk. At times, the Fund may have a significant portion of its assets invested in securities of companies conducting business in a related group of industries within one or more economic sectors, including the industrials sector. Companies in the same sector may be similarly affected by economic, regulatory, political or market events or conditions, which may make the Fund vulnerable to unfavorable developments in that group of industries or economic sector.
■
Industrials Sector. The Fund is vulnerable to the particular risks that may affect companies in the industrials sector. Companies in the industrials sector are subject to certain risks, including changes in supply and demand for their specific product or service and for industrial sector products in general, including decline in demand for such products due to rapid technological developments and frequent new product introduction. Performance of such companies may be affected by factors including government regulation, world events, economic conditions and risks for environmental damage and product liability claims.
12
Prospectus 2026
CTIVP® – Victory Sycamore Established Value Fund
More Information About the Fund (continued)
Value Securities Risk. Value securities are securities of companies that may have experienced, for example, adverse business, industry or other developments or may be subject to special risks that have caused the securities to be out of favor and, in turn, potentially undervalued. The market value of a portfolio security may not meet the perceived value assessment of that security as determined by the portfolio managers, or may decline in price, even though the securities are already believed to be undervalued by the portfolio managers. There is also a risk that it may take longer than expected for the value of these investments to rise to the perceived value as determined by the portfolio managers. In addition, value securities, at times, may not perform as well as growth securities or the stock market in general, and may be out of favor with investors for varying periods of time.
Additional Investment Strategies and Policies
This section describes certain investment strategies and policies that the Fund may utilize in pursuit of its investment objective and some additional factors and risks involved with investing in the Fund.
Investment Guidelines
As a general matter, and except as specifically described in the discussion of the Fund's principal investment strategies in this prospectus or as otherwise required by the Investment Company Act of 1940, as amended (the 1940 Act), the rules and regulations thereunder and any applicable exemptive relief, whenever an investment policy or limitation states a percentage of the Fund's assets that may be invested in any security or other asset or sets forth a policy regarding an investment standard, compliance with that percentage limitation or standard will be determined solely at the time of the Fund's investment in the security or asset.
Holding Other Kinds of Investments
The Fund may hold other investments that are not part of its principal investment strategies. These investments and their risks are described below and/or in the Statement of Additional Information (SAI). The Fund may choose not to invest in certain securities described in this prospectus and in the SAI, although it has the ability to do so. Information on the Fund’s holdings can be found in the Fund’s Form N-CSR or by visiting columbiathreadneedleus.com.
Transactions in Derivatives
The Fund may enter into derivative transactions or otherwise have exposure to derivative transactions through underlying investments. Derivatives are financial contracts whose values are, for example, based on (or “derived” from) traditional securities (such as a stock or bond), assets (such as a commodity like gold or a foreign currency), reference rates (such as the Secured Overnight Financing Rate (commonly known as SOFR)) or market indices (such as the Standard & Poor’s 500® Index). The use of derivatives is a highly specialized activity which involves investment techniques and risks different from those associated with ordinary portfolio securities transactions. Derivatives involve special risks and may result in losses or may limit the Fund’s potential gain from favorable market movements. Derivative strategies often involve leverage, which may exaggerate a loss, potentially causing the Fund to lose more money than it would have lost had it invested in the underlying security or other asset directly. The values of derivatives may move in unexpected ways, especially in unusual market conditions, and may result in increased volatility in the value of the derivative and/or the Fund’s shares, among other consequences. Other risks arise from the Fund’s potential inability to terminate or to sell derivative positions. A liquid secondary market may not always exist for the Fund’s derivative positions at times when the Fund might wish to terminate or to sell such positions. Over-the-counter instruments (investments not traded on an exchange) may be illiquid, and transactions in derivatives traded in the over-the-counter market are subject to the risk that the other party will not meet its obligations. The use of derivatives also involves the risks of mispricing or improper valuation and that changes in the value of the derivative may not correlate perfectly with the underlying security, asset, reference rate or index. The Fund also may not be able to find a suitable derivative transaction counterparty, and thus may be unable to engage in derivative transactions when it is deemed favorable to do so, or at all. The U.S. government and the European Union (and some other jurisdictions) have enacted regulations and similar requirements that prescribe clearing, margin, reporting and registration requirements for participants in the derivatives market. These requirements are evolving and their ultimate impact on the Fund remains unclear, but such impact could include restricting and/or imposing
Prospectus 2026
13
CTIVP® – Victory Sycamore Established Value Fund
More Information About the Fund (continued)
significant costs or other burdens upon the Fund’s participation in derivatives transactions. Additionally, regulations governing the use of derivatives by registered investment companies, such as the Fund, require, among other things, that a fund that invests in derivative instruments beyond a specified limited amount apply a value-at-risk-based limit to its portfolio and establish a comprehensive derivatives risk management program. As of the date of this prospectus, the Fund is not required to maintain a comprehensive derivatives risk management program given its more limited use of derivatives. For more information on the risks of derivative investments and strategies, see the SAI.
Affiliated Fund Investing
The Investment Manager or an affiliate serves as investment adviser to funds using the Columbia brand (Columbia Funds), including those that are structured as “fund-of-funds”, and provides asset-allocation services to (i) shareholders by investing in shares of other Columbia Funds, which may include the Fund (collectively referred to in this section as Underlying Funds), and (ii) discretionary managed accounts (collectively referred to as affiliated products) that invest exclusively in Underlying Funds. These affiliated products, individually or collectively, may own a significant percentage of the outstanding shares of one or more Underlying Funds, and the Investment Manager seeks to balance potential conflicts of interest between the affiliated products and the Underlying Funds in which they invest. The affiliated products’ investment in the Underlying Funds may have the effect of creating economies of scale, possibly resulting in lower expense ratios for the Underlying Funds, because the affiliated products may own substantial portions of the shares of Underlying Funds. However, redemption of Underlying Fund shares by one or more affiliated products could cause the expense ratio of an Underlying Fund to increase, as its fixed costs would be spread over a smaller asset base. Because of large positions of certain affiliated products, the Underlying Funds may experience relatively large inflows and outflows of cash due to affiliated products’ purchases and sales of Underlying Fund shares. Although the Investment Manager or its affiliate may seek to minimize the impact of these transactions where possible, for example, by structuring them over a reasonable period of time or through other measures, Underlying Funds may experience increased expenses as they buy and sell portfolio securities to manage the cash flow effect related to these transactions. Further, when the Investment Manager or its affiliate structures transactions over a reasonable period of time in order to manage the potential impact of the buy and sell decisions for the affiliated products, those affiliated products, including funds-of-funds, may pay more or less (for purchase activity), or receive more or less (for redemption activity), for shares of the Underlying Funds than if the transactions were executed in one transaction. In addition, substantial redemptions by affiliated products within a short period of time could require the Underlying Fund to liquidate positions more rapidly than would otherwise be desirable, which may have the effect of reducing or eliminating potential gain or causing it to realize a loss. In order to meet such redemptions, an Underlying Fund may be forced to sell its liquid (or more liquid) positions, leaving the Underlying Fund holding, post-redemption, a relatively larger position in illiquid investments (i.e., any investment that the Fund reasonably expects cannot be sold or disposed of in current market conditions in seven calendar days or less without the sale or disposition significantly changing the market value of the investment) or less liquid securities. Substantial redemptions may also adversely affect the ability of the Underlying Fund to implement its investment strategy. The Investment Manager or its affiliate also has a conflict of interest in determining the allocation of affiliated products’ assets among the Underlying Funds, as it earns different fees from the various Underlying Funds.
Investing in Money Market Funds
The Fund may invest cash in, or hold as collateral for certain investments, shares of registered or unregistered money market funds, including funds advised by the Investment Manager or its affiliates. These funds are not insured or guaranteed by the Federal Deposit Insurance Corporation (FDIC) or any other government agency. The Fund and its shareholders indirectly bear a portion of the expenses of any money market fund or other fund in which the Fund may invest.
14
Prospectus 2026
CTIVP® – Victory Sycamore Established Value Fund
More Information About the Fund (continued)
Investing Defensively
The Fund may from time to time take temporary defensive investment positions that may be inconsistent with the Fund’s principal investment strategies in attempting to respond to adverse market, economic, political, social or other conditions, including, without limitation, investing some or all of its assets in money market instruments or shares of affiliated or unaffiliated money market funds or holding some or all of its assets in cash or cash equivalents. The Fund may take such defensive investment positions for as long a period as deemed necessary.
The Fund may not achieve its investment objective while it is investing defensively. Investing defensively may adversely affect Fund performance. During these times, the portfolio managers may make frequent portfolio holding changes, which could result in increased trading expenses and decreased Fund performance. See also Investing in Money Market Funds above for more information.
Other Strategic and Investment Measures
The Fund may also from time to time take temporary portfolio positions that may or may not be consistent with the Fund’s principal investment strategies in attempting to respond to adverse market, economic, political, social or other conditions, including, without limitation, investing in derivatives, such as forward contracts, futures contracts, options, structured investments and swaps, for various purposes, including among others, investing in particular derivatives in seeking to reduce investment exposures, or in seeking to achieve indirect investment exposures, to a sector, country, region or currency where the Investment Manager believes such positioning is appropriate. The Fund may take such portfolio positions for as long a period as deemed necessary. While the Fund is so positioned, derivatives could comprise a substantial portion of the Fund’s investments and the Fund may not achieve its investment objective. Investing in this manner may adversely affect Fund performance. During these times, the portfolio managers may make frequent portfolio holding changes, which could result in increased trading expenses and decreased Fund performance. For information on the risks of investing in derivatives, see Transactions in Derivatives above.
Portfolio Holdings Disclosure
The Board has adopted policies and procedures that govern the timing and circumstances of disclosure to shareholders and third parties of information regarding the securities owned by the Fund. A description of these policies and procedures is included in the SAI. Fund policy generally permits the disclosure of portfolio holdings information on the Fund's website (columbiathreadneedleus.com) only after a certain amount of time has passed, as described in the SAI.
Purchases and sales of portfolio securities can take place at any time, so the portfolio holdings information available on the Fund's website may not always be current.
FUNDamentals
Portfolio Holdings Versus the Benchmarks
The Fund does not limit its investments to the securities within its benchmark(s), and accordingly the Fund's holdings may diverge from those of its benchmark(s). In addition, the Fund may invest in securities outside any industry and geographic sectors represented in its benchmark(s). The Fund's weightings in individual securities, and in industry or geographic sectors, may also vary considerably from those of its benchmark(s).
Cash Flows
The timing and magnitude of cash inflows from investors buying Fund shares could prevent the Fund from always being fully invested. Conversely, the timing and magnitude of cash outflows to shareholders redeeming Fund shares could require the Fund to sell portfolio securities at less than opportune times or to hold ready reserves of uninvested cash in amounts larger than might otherwise be the case to meet shareholder redemptions. Either situation could adversely impact the Fund’s performance.
Prospectus 2026
15
CTIVP® – Victory Sycamore Established Value Fund
More Information About the Fund (continued)
Understanding Annual Fund Operating Expenses
The Fund’s annual operating expenses, as presented in the Annual Fund Operating Expenses table in the Fees and Expenses of the Fund section of this prospectus, generally are based on expenses incurred during the Fund’s most recently completed fiscal year, may vary by share class and are expressed as a percentage (expense ratio) of the Fund’s average net assets during that fiscal year. The expense ratios reflect the Fund’s fee arrangements as of the date of this prospectus and, unless indicated otherwise, are based on expenses incurred during the Fund’s most recent fiscal year. The Fund’s assets will fluctuate, but unless indicated otherwise in the Annual Fund Operating Expenses table, no adjustments have been or will be made to the expense ratios to reflect any differences in the Fund’s average net assets between the most recently completed fiscal year and the date of this prospectus or a later date. In general, the Fund’s expense ratios will increase as its net assets decrease, such that the Fund’s actual expense ratios may be higher than the expense ratios presented in the Annual Fund Operating Expenses table if assets fall. Any commitment by the Investment Manager and/or its affiliates to waive fees and/or cap (reimburse) expenses is expected, in part, to limit the impact of any increase in the Fund’s expense ratios that would otherwise result because of a decrease in the Fund’s assets in the current fiscal year. The Fund’s annual operating expenses are comprised of (i) investment management fees, (ii) distribution and/or service fees, and (iii) other expenses. Management fees do not vary by class, but distribution and/or service fees and other expenses may vary by class.
FUNDamentals
Other Expenses
“Other expenses” consist of the fees the Fund pays to its custodian, transfer agent, auditors, lawyers and trustees, costs relating to compliance and miscellaneous expenses. Generally, these expenses are allocated on a pro rata basis across all share classes. These fees include certain sub-transfer agency and shareholder servicing fees. For more information on these fees, see About Fund Shares and Transactions — Financial Intermediary Compensation.
Fee Waiver/Expense Reimbursement Arrangements and Impact on Past Performance
The Investment Manager and certain of its affiliates have contractually agreed to waive fees and/or reimburse expenses (excluding certain fees and expenses described below) through April 30, 2027, unless sooner terminated at the sole discretion of the Fund's Board, so that the Fund’s net operating expenses, after giving effect to fees waived/expenses reimbursed and any balance credits and/or overdraft charges from the Fund’s custodian, do not exceed the annual rates of:
| CTIVP® - Victory Sycamore Established Value Fund | |
| Class 1 |
0.82% |
| Class 2 |
1.07% |
| Class 3 |
0.945% |
Under the agreement, the following fees and expenses are excluded from the Fund’s operating expenses when calculating the waiver/reimbursement commitment, and therefore will be paid by the Fund, if applicable: taxes (including foreign transaction taxes), expenses associated with investment in affiliated and non-affiliated pooled investment vehicles (including mutual funds and exchange-traded funds), transaction costs and brokerage commissions, costs related to any securities lending program, dividend expenses associated with securities sold short, inverse floater program fees and expenses, transaction charges and interest on borrowed money, interest, costs associated with shareholder meetings, infrequent and/or unusual expenses and any other expenses the exclusion of which is specifically approved by the Fund’s Board. This agreement may be modified or amended only with approval from all parties.
16
Prospectus 2026
CTIVP® – Victory Sycamore Established Value Fund
More Information About the Fund (continued)
Effect of Fee Waivers and/or Expense Reimbursements on Past Performance. The Fund’s returns shown in the Performance Information section of this prospectus reflect the effect of any fee waivers and/or reimbursements of Fund expenses by the Investment Manager and/or any of its affiliates that were in place during the performance period shown. Without such fee waivers/expense reimbursements, the Fund’s returns might have been lower.
Primary Service Provider Contracts
The Fund enters into contractual arrangements (Service Provider Contracts) with various service providers, including, among others, the Investment Manager, the Distributor, Columbia Management Investment Services Corp. (the Transfer Agent) and the Fund’s custodian. The Fund’s Service Provider Contracts are solely among the parties thereto. Shareholders are not parties to, or intended to be third-party beneficiaries of, any Service Provider Contracts. Further, this prospectus, the SAI and any Service Provider Contracts are not intended to give rise to any agreement, duty, special relationship or other obligation between the Fund and any investor, or give rise to any contractual, tort or other rights in any individual shareholder, group of shareholders or other person, including any right to assert a fiduciary or other duty, enforce the Service Provider Contracts against the parties or to seek any remedy thereunder, either directly or on behalf of the Fund. Nothing in the previous sentence should be read to suggest any waiver of any rights under federal or state securities laws.
The Investment Manager, the Distributor, and the Transfer Agent are all affiliates of Ameriprise Financial, Inc. (Ameriprise Financial). They and their affiliates currently provide key services, including investment advisory, administration, distribution, shareholder servicing and transfer agency services, to the Fund and various other funds, including the Columbia Funds, and are paid for providing these services. These service relationships are described below.
The Investment Manager
Columbia Management Investment Advisers, LLC is located at 290 Congress Street, Boston, MA 02210 and serves as investment adviser and administrator to the Columbia Funds. The Investment Manager is a registered investment adviser and a wholly-owned subsidiary of Ameriprise Financial. The Investment Manager’s management experience covers all major asset classes, including equity securities, debt instruments and money market instruments. In addition to serving as an investment adviser to traditional mutual funds, exchange-traded funds and closed-end funds, the Investment Manager acts as an investment adviser for itself, its affiliates, individuals, corporations, retirement plans, private investment companies and financial intermediaries.
Subject to oversight by the Board, the Investment Manager manages the day-to-day operations of the Fund. The Investment Manager is responsible for the investment management of the Fund, but has delegated certain of its duties, including day-to-day portfolio management of all or a portion of the Fund’s assets to one or more investment subadvisers that determine what securities and other investments the Fund should buy or sell. The Investment Manager is also responsible for overseeing the administrative operations of the Fund, including the general supervision of the Fund’s operations, the coordination of the Fund’s other service providers and the provision of related clerical and administrative services.
The SEC has issued an order that permits the Investment Manager, subject to the approval of the Board, to appoint unaffiliated subadvisers by entering into subadvisory agreements with them, and to change in material respects the terms of those subadvisory agreements, including the fees paid thereunder, for the Fund without first obtaining shareholder approval, thereby avoiding the expense and delays typically associated with obtaining shareholder approval. The Fund furnishes shareholders with information about new subadvisers retained in reliance on the order within 90 days after hiring the subadviser. The Investment Manager and its affiliates may have other relationships, including significant financial relationships, with current or potential subadvisers or their affiliates, which may create certain conflicts of interest. When making recommendations to the Board to appoint or to change a subadviser, or to change the terms of a subadvisory agreement, the Investment Manager discloses to the Board the nature of any such material relationships. The SEC has issued a separate order that permits the Board to approve new subadvisory agreements or material changes to existing subadvisory agreements at a meeting that is not in person, provided that the Trustees are able to participate in the meeting using a means of communication that allows them to hear each other simultaneously during the meeting and other conditions of the order are satisfied.
Prospectus 2026
17
CTIVP® – Victory Sycamore Established Value Fund
More Information About the Fund (continued)
The Fund pays the Investment Manager a fee for its management services, which include investment advisory services and administrative services. The fee is calculated as a percentage of the daily net assets of the Fund and is paid monthly. For the Fund’s most recent fiscal year, management services fees paid to the Investment Manager by the Fund amounted to 0.77% of average daily net assets of the Fund, before any applicable reimbursements.
A discussion regarding the basis for the Board’s approval of the renewal of the Fund's management agreement is available in the Fund’s Form N-CSR for the fiscal period ended June 30, 2025.
The Investment Manager has, with the approval of the Board, engaged an investment subadviser(s) to make the day-to-day investment decisions for the Fund. The Investment Manager pays the subadviser(s) for investment advisory services and retains ultimate responsibility (subject to Board oversight) for overseeing any subadviser it engages and for evaluating the Fund’s needs and the subadvisers’ skills and abilities on an ongoing basis. Based on its evaluations, the Investment Manager may at times recommend to the Board that the Fund change, add or terminate one or more subadvisers; continue to retain a subadviser even though the subadviser’s ownership or corporate structure has changed; or materially change a subadvisory agreement with a subadviser. A discussion regarding the basis for the Board’s approval of the renewal of the investment subadvisory agreement with Victory Capital is available in the Fund’s Form N-CSR for the fiscal period ended June 30, 2025.
Subadviser
Victory Capital, which has served as Subadviser to the Fund since November 2012, is located at 15935 La Cantera Parkway, San Antonio, TX 78256. Victory Capital, subject to the supervision of Columbia Management, provides day-to-day management of the Fund’s portfolio, as well as investment research and statistical information, under a subadvisory agreement with Columbia Management. Victory Capital is a diversified global asset manager comprised of multiple investment teams, referred to as investment franchises, each of which utilizes an independent approach to investing. Sycamore Capital is the investment franchise responsible for management of the Fund. The portfolio managers listed below are members of Victory Capital’s Sycamore Capital investment franchise.
Portfolio Managers
Information about the portfolio managers primarily responsible for overseeing the Fund’s investments is shown below. The SAI provides additional information about the portfolio managers, including information relating to compensation, other accounts managed by the portfolio managers, and ownership by the portfolio managers of Fund shares.
Subadviser: Victory Capital Management Inc. (Victory Capital)
| Portfolio Management |
Title |
Role with Fund |
Managed Fund Since |
| Gary Miller |
Chief Investment Officer of Victory Capital’s Sycamore Capital |
Lead Portfolio Manager |
2012 |
| Gregory Conners |
Portfolio Manager of Victory Capital’s Sycamore Capital |
Portfolio Manager |
2012 |
| James Albers, CFA |
Portfolio Manager of Victory Capital’s Sycamore Capital |
Portfolio Manager |
2012 |
| Michael Rodarte, CFA |
Portfolio Manager of Victory Capital’s Sycamore Capital |
Portfolio Manager |
2012 |
Mr. Miller has been associated with Victory Capital since 1987. Mr. Miller is Chief Investment Officer of Sycamore Capital. Mr. Miller began his investment career in 1987 and earned a B.B.A. from the University of Cincinnati and an M.B.A. from Xavier University.
Mr. Conners has been associated with Victory Capital since 1999. Mr. Conners began his investment career in 1994 and earned a B.S. from the College of Mount St. Joseph and an M.B.A. from Xavier University.
Mr. Albers has been associated with Victory Capital since 2005. Mr. Albers began his investment career in 1997 and earned a B.S. and a M.S. from the University of Wisconsin.
Mr. Rodarte has been associated with Victory Capital since 2006. Mr. Rodarte began his investment career in 2006 and earned a B.B.A. from Ohio University.
18
Prospectus 2026
CTIVP® – Victory Sycamore Established Value Fund
More Information About the Fund (continued)
The Distributor
Shares of the Fund are distributed by Columbia Management Investment Distributors, Inc., which is located at 290 Congress Street, Boston, MA 02210. The Distributor is a registered broker-dealer and an indirect, wholly-owned subsidiary of Ameriprise Financial. The Distributor and its affiliates may pay commissions, distribution and service fees and/or other compensation to entities, including Ameriprise Financial affiliates, for selling shares and providing services to investors.
The Transfer Agent
Columbia Management Investment Services Corp. is a registered transfer agent and wholly-owned subsidiary of Ameriprise Financial. The Transfer Agent is located at 290 Congress Street, Boston, MA 02210, and its responsibilities include processing purchases, redemptions and transfers of Fund shares, calculating and paying distributions, maintaining shareholder records, preparing account statements and providing customer service. The Transfer Agent has engaged SS&C GIDS, Inc. to provide various sub-transfer agency services. The Fund pays a service fee to participating insurance companies or other financial intermediaries that provide sub-recordkeeping and other services to Contract owners and the separate accounts. The Transfer Agent may retain as compensation for its services revenues for fees for wire, telephone and redemption orders, account transcripts due the Transfer Agent from Fund shareholders and interest (net of bank charges) earned with respect to balances in accounts the Transfer Agent maintains in connection with its services to the Fund.
Other Roles and Relationships of Ameriprise Financial and its Affiliates — Certain Conflicts of Interest
The Investment Manager, Distributor and Transfer Agent, all affiliates of Ameriprise Financial, provide various services to the Fund and other Columbia Funds for which they are compensated. Ameriprise Financial and its other affiliates may also provide other services to these funds and be compensated for them.
The Investment Manager and its affiliates may provide investment advisory and other services to other clients and customers substantially similar to those provided to the Columbia Funds. These activities, and other financial services activities of Ameriprise Financial and its affiliates, may present actual and potential conflicts of interest and introduce certain investment constraints.
Ameriprise Financial is a major financial services company, engaged in a broad range of financial activities beyond the fund-related activities of the Investment Manager, including, among others, insurance, broker-dealer (sales and trading), asset management, banking and other financial activities. These additional activities may involve multiple advisory, financial, insurance and other interests in securities and other instruments, and in companies that issue securities and other instruments, that may be bought, sold or held by the Columbia Funds.
Conflicts of interest and limitations that could affect a Columbia Fund may arise from, for example, the following:
■
compensation and other benefits received by the Investment Manager and other Ameriprise Financial affiliates related to the management/administration of a Columbia Fund and the sale of its shares;
■
the allocation of, and competition for, investment opportunities among the Fund, other funds and accounts advised/managed by the Investment Manager and other Ameriprise Financial affiliates, or Ameriprise Financial itself and its affiliates;
■
separate and potentially divergent management of a Columbia Fund and other funds and accounts advised/managed by the Investment Manager and other Ameriprise Financial affiliates;
■
regulatory and other investment restrictions on investment activities of the Investment Manager and other Ameriprise Financial affiliates and accounts advised/managed by them;
■
insurance and other relationships of Ameriprise Financial affiliates with companies and other entities in which a Columbia Fund invests;
■
regulatory and other restrictions relating to the sharing of information between Ameriprise Financial and its affiliates, including the Investment Manager, and a Columbia Fund; and
Prospectus 2026
19
CTIVP® – Victory Sycamore Established Value Fund
More Information About the Fund (continued)
■
insurance companies investing in the Fund may be affiliates of Ameriprise Financial; these affiliated insurance companies, individually and collectively, may hold through separate accounts a significant portion of the Fund's shares and may also invest in separate accounts managed by the Investment Manager that have the same or substantially similar investment objectives and strategies as the Fund.
The Investment Manager and Ameriprise Financial have adopted various policies and procedures that are intended to identify, monitor and address conflicts of interest. However, there is no assurance that these policies, procedures and disclosures will be effective.
Additional information about Ameriprise Financial and the types of conflicts of interest and other matters referenced above is set forth in the Investment Management and Other Services — Other Roles and Relationships of Ameriprise Financial and its Affiliates — Certain Conflicts of Interest section of the SAI. Investors in the Columbia Funds should carefully review these disclosures and consult with their financial advisor if they have any questions.
Certain Legal Matters
Ameriprise Financial and certain of its affiliates are involved, in the normal course of business, in legal proceedings that include regulatory inquiries, arbitration and litigation (including class actions) concerning matters arising in connection with the conduct of their activities as part of a diversified financial services firm. Ameriprise Financial believes that the Fund is not currently the subject of, and that neither Ameriprise Financial nor any of its affiliates are the subject of, any pending legal, arbitration or regulatory proceedings that are likely to have a material adverse effect on the Fund or the ability of Ameriprise Financial or its affiliates to perform under their contracts with the Fund. Information regarding certain pending and settled legal proceedings may be found in the Fund’s Form N-CSR and in the SAI. Additionally, Ameriprise Financial is required to make quarterly (10-Q), annual (10-K) and, as necessary, 8-K filings with the SEC on legal and regulatory matters that relate to Ameriprise Financial and its affiliates. Copies of these filings may be obtained by accessing the SEC website at sec.gov.
20
Prospectus 2026
CTIVP® – Victory Sycamore Established Value Fund
About Fund Shares and Transactions
Description of the Share Classes
Share Class Features
The Fund offers the classes of shares set forth on the cover of this prospectus. Each share class has its own cost structure and other features. The following summarizes the primary features of the Class 1, Class 2 and Class 3 shares.
| |
Class 1 Shares |
Class 2 Shares |
Class 3 Shares |
| Eligible Investors |
Shares of the Fund are available only to separate accounts of participating insurance companies as underlying investments for variable annuity contracts and/or variable life insurance policies (collectively, Contracts) or qualified pension and retirement plans (Qualified Plans) or other eligible investors authorized by the Distributor. | ||
| Investment Limits |
none |
none |
none |
| Conversion Features |
none |
none |
none |
| Front-End Sales Charges |
none |
none |
none |
| Contingent Deferred Sales Charges (CDSCs) |
none |
none |
none |
| Maximum Distribution and/or Service Fees |
none |
0.25% |
0.125% |
FUNDamentals
Financial Intermediaries
The term “financial intermediary” refers to the insurance company that issued your contract, qualified pension or retirement plan sponsors or the financial intermediary that employs your financial advisor. Financial intermediaries also include broker-dealers and financial advisors as well as firms that employ broker-dealers and financial advisors, including, for example, brokerage firms, banks, investment advisers, third party administrators and other firms in the financial services industry, including Ameriprise Financial and its affiliates.
Distribution and/or Service Fees
Pursuant to Rule 12b-1 under the Investment Company Act of 1940, as amended (the 1940 Act), the Board has approved, and the Fund has adopted, a distribution plan which sets the distribution fees that are periodically deducted from the Fund’s assets for Class 2 and Class 3 shares. The distribution fee for Class 2 shares is 0.25% and the distribution fee for Class 3 shares is 0.125%. These fees are calculated daily, may vary by share class and are intended to compensate the Distributor and/or financial intermediaries for selling shares of the Fund and/or providing services to investors. Because the fees are paid out of the Fund’s assets on an ongoing basis, they will increase the cost of your investment over time.
The Fund will pay these fees to the Distributor and/or to eligible financial intermediaries for as long as the distribution plan continues. The Fund may reduce or discontinue payments at any time.
The Fund pays a service fee to participating insurance companies or other financial intermediaries that provide sub-recordkeeping and other services to Contract owners, Qualified Plan participants and the separate accounts.
Financial Intermediary Compensation
The Distributor, the Investment Manager and their affiliates make payments, from their own resources, to financial intermediaries, primarily to affiliated and unaffiliated insurance companies, for marketing/sales support services relating to the Fund (Marketing Support Payments). Such payments are generally based upon one or more of the following factors: average net assets of the Columbia Funds sold by the Distributor attributable to that financial intermediary; gross sales of the Columbia Funds distributed by the Distributor attributable to that financial intermediary; or a negotiated lump sum payment. While the financial arrangements may vary for each financial intermediary, the Marketing Support Payments to any one financial intermediary are generally between 0.05% and
Prospectus 2026
21
CTIVP® – Victory Sycamore Established Value Fund
About Fund Shares and Transactions (continued)
0.40% on an annual basis for payments based on average net assets of the Fund attributable to the financial intermediary, and between 0.05% and 0.25% on an annual basis for a financial intermediary receiving a payment based on gross sales of the Columbia Funds attributable to the financial intermediary.
As employee compensation and business unit operating goals at all levels are generally tied to the success of Ameriprise Financial, employees of Ameriprise Financial and its affiliates, including employees of affiliated broker-dealers and insurance companies, are incented to include shares of the Columbia Funds in Contracts offered by affiliated insurance companies. Certain employees, directly or indirectly, receive higher compensation and other benefits as investment in the Columbia Funds increases. In addition, management, sales leaders and other employees may spend more of their time and resources promoting Ameriprise Financial and its subsidiary companies, including the Distributor and the Investment Manager, and the products they offer, including the Fund.
In addition, the Transfer Agent has certain arrangements in place to compensate financial intermediaries, primarily to affiliated and unaffiliated insurance companies, that hold Fund shares through networked and omnibus accounts, including omnibus retirement plans, for services that they provide to beneficial Fund shareholders (Shareholder Services). Shareholder Services and related fees vary by financial intermediary and may include sub-accounting, sub-transfer agency, participant recordkeeping, shareholder or participant reporting, shareholder or participant transaction processing, maintenance of shareholder records, preparation of account statements and provision of customer service, and are not intended to include services that are primarily intended to result in the sale of Fund shares. Payments for Shareholder Services generally are not expected, with certain limited exceptions, to exceed 0.40% of the average aggregate value of the Fund’s shares. Each Fund pays the Transfer Agent a service fee equal to the payments made by the Transfer Agent to participating insurance companies and other financial intermediaries that provide Shareholder Services up to the lesser of the amount charged by the financial intermediary or a contractual asset-based cap. Payments of amounts that exceed the amount paid by the Fund are borne by the Transfer Agent, the Investment Manager and/or their affiliates.
In addition to the payments described above, the Distributor, the Investment Manager and their affiliates typically make other payments or allow promotional incentives to certain broker-dealers to the extent permitted by SEC and Financial Industry Regulatory Authority (FINRA) rules and by other applicable laws and regulations.
Amounts paid by the Distributor, the Investment Manager and their affiliates are paid out of their own resources and do not increase the amount paid by you or the Fund. You can find further details in the SAI about the payments made by the Distributor, the Investment Manager and their affiliates, as well as a list of the financial intermediaries, including Ameriprise Financial affiliates, to which the Distributor, the Investment Manager or their affiliates have agreed to make Marketing Support Payments and fee payments for Shareholder Services.
Your financial intermediary may charge you fees and commissions in addition to those described in this prospectus. You should consult with your financial intermediary and review carefully any disclosure your financial intermediary provides regarding its services and compensation. Depending on the financial arrangement in place at any particular time, a financial intermediary and its financial advisors may have a conflict of interest or financial incentive with respect to recommendations regarding the Fund or any Contract or Qualified Plan that includes the Fund.
Share Price Determination
The price you pay or receive when you buy, sell or transfer shares is the Fund's next determined net asset value (or NAV) per share for a given share class. The Fund calculates the NAV per share for each class of shares of the Fund at the end of each business day, with the value of the Fund's shares based on the total value of all of the securities and other assets that it holds as of such specified time.
22
Prospectus 2026
CTIVP® – Victory Sycamore Established Value Fund
About Fund Shares and Transactions (continued)
FUNDamentals
NAV Calculation
Each of the Fund's share classes calculates its NAV per share as follows:
NAV per share = (Value of assets of the share class) – (Liabilities of the share class)
Number of outstanding shares of the class
Number of outstanding shares of the class
FUNDamentals
Business Days
A business day is any day that the New York Stock Exchange (NYSE) is open. A business day typically ends at the close of regular trading on the NYSE, usually at 4:00 p.m. Eastern time. If the NYSE is scheduled to close early, the business day will be considered to end as of the time of the NYSE’s scheduled close. The Fund will not treat an intraday unscheduled disruption in NYSE trading or an intraday unscheduled closing as a close of regular trading on the NYSE for these purposes and will price its shares as of the regularly scheduled closing time for that day (typically, 4:00 p.m. Eastern time). Nonetheless, the NAV of Fund shares may be determined at such other time or times (in addition to or in lieu of the time set forth above) as the Fund’s Board may approve or ratify. On holidays and other days when the NYSE is closed, the Fund’s NAV is not calculated and the Fund does not accept buy or sell orders. However, the value of the Fund’s assets may still be affected on such days to the extent that the Fund holds foreign securities that trade on days that foreign securities markets are open.
Equity securities listed on an exchange are typically valued at the closing price or last trade on their primary exchange at the close of business of the NYSE. Equity securities without a readily available closing price or that are not listed on any exchange are typically valued at the mean between the closing bid and asked prices. Other equity securities, debt securities and other assets are valued differently. For instance, bank loans trading in the secondary market are fair valued unless market quotations are readily available, fixed income investments maturing in 60 days or less are valued primarily using the amortized cost method, unless this methodology results in a valuation that does not approximate the market value of these securities, and those maturing in excess of 60 days are valued based on prices obtained from a pricing service, if available (which may represent market values or fair values). Investments in other open-end funds are valued at their published NAVs. The value of the Fund’s portfolio securities is determined in accordance with the valuation policy approved by the Board (the Valuation Policy). Pursuant to Rule 2a-5 under the 1940 Act, the Board has designated the Investment Manager as the Fund’s valuation designee. The Investment Manager, in turn, has authorized its valuation committee to make fair value determinations and to carry out supervisory and certain other functions relating to the valuation of Fund portfolio securities, pursuant to the Valuation Policy.
If a market price is not readily available or is deemed not to reflect market value for a portfolio security, the Investment Manager will determine the price based on a determination of the security's fair value pursuant to the Valuation Policy. In addition, the Investment Manager may use fair valuation techniques to price securities that trade on a foreign exchange when a significant event has occurred after the foreign exchange closes but before the time at which the Fund’s share price is calculated. Foreign exchanges typically close before the time at which Fund share prices are calculated, and may be closed altogether on days when the Fund is open. Such significant events affecting a foreign security may include, but are not limited to: (1) corporate actions, earnings announcements, litigation or other events impacting a single issuer; (2) governmental action that affects securities in one sector or country; (3) natural disasters or armed conflicts affecting a country or region; or (4) significant domestic or foreign market fluctuations. The Fund uses various criteria, including an evaluation of U.S. market moves after the close of foreign markets, in determining whether a foreign security's market price is readily available and reflective of market value and, if not, the fair value of the security.
Prospectus 2026
23
CTIVP® – Victory Sycamore Established Value Fund
About Fund Shares and Transactions (continued)
Fair valuation may have the effect of reducing stale pricing arbitrage opportunities presented by the pricing of Fund shares. However, when the Investment Manager uses fair valuation to price equity securities, it may value those securities higher or lower than another fund or manager would. Also, fair valuation of Fund holdings may cause the Fund's performance to diverge to a greater degree from the performance of various benchmark indices used to compare the Fund's performance because indices generally do not use fair valuation techniques. Because of the judgment involved in fair valuation decisions, there can be no assurance that the value ascribed to a particular security is accurate. The Fund has retained one or more independent fair valuation pricing services to assist in the fair valuation process for foreign securities.
Futures and options on futures are valued based upon the settlement price as determined by the principal exchange on which they are traded or, in the absence of a settlement price, at the mean of the closing bid and ask. Generally, over-the-counter derivatives, such as swaps and swaptions, are valued based on a price provided by an approved pricing service.
Shareholder Information
Each share class has its own cost structure and other features. Your product may not offer every share class. The Fund encourages you to consult with a financial advisor who can help you with your investment decisions and for more information about the share classes offered by the Fund and available under your product. Shares of the Fund are generally available for purchase only by participating insurance companies in connection with Contracts and Qualified Plan sponsors.
The Fund, the Distributor or the Transfer Agent may refuse any order to buy or transfer shares. If this happens, the Fund will return any money it received, but no interest will be paid on that money.
Shares of the Fund may not be purchased or sold directly by individual Contract owners or participants in a Qualified Plan. When you sell your shares through your Contract or Qualified Plan, the Fund is effectively buying them back. This is called a redemption. The right of redemption may be suspended or payment postponed whenever permitted by applicable laws and regulations, as described under Satisfying Fund Redemption Requests below.
Depending on the context, references to “you” or “your” herein refer either to the holder of a Contract, participant in a Qualified Plan or qualified institutional investor who may select Fund shares to fund his or her investment in the Contract or Qualified Plan or to the participating insurance company as the holder of Fund shares through one or more separate accounts or the Qualified Plan.
Satisfying Fund Redemption Requests
The Fund typically expects to send the redeeming participating insurance company or Qualified Plan sponsor payment for shares within two business days after your trade date. The Fund can suspend redemptions and/or delay payment of redemption proceeds for up to seven days. The Fund can also suspend redemptions and/or delay payment of redemption proceeds in excess of seven days under certain circumstances, including when the NYSE is closed or trading thereon is restricted or during emergency or other circumstances, including as determined by the SEC.
The Fund typically seeks to satisfy redemption requests from cash or cash equivalents held by the Fund, from the proceeds of orders to purchase Fund shares or from the proceeds of sales of Fund holdings effected in the normal course of managing the Fund. However, the Fund may have to sell Fund holdings, including in down markets, to meet heavier than usual redemption requests. For example, under stressed or abnormal market conditions or circumstances, including circumstances adversely affecting the liquidity of the Fund’s investments, the Fund may be more likely to be forced to sell Fund holdings to meet redemptions than under normal market circumstances. In these situations, the Fund’s portfolio managers may have to sell Fund holdings that would not otherwise be sold because, among other reasons, the current price to be received is less than the value of the holdings perceived by the Fund’s portfolio managers. The Fund may also, under certain circumstances (but more likely under stressed or abnormal market conditions or circumstances), borrow money under a credit facility to which the Fund and certain other Columbia Funds are parties or from other Columbia Funds under an interfund lending program (except for closed-end funds and money market funds, which are not eligible to borrow under the program). The Fund and the
24
Prospectus 2026
CTIVP® – Victory Sycamore Established Value Fund
About Fund Shares and Transactions (continued)
other Columbia Funds are limited as to the amount that each may individually and collectively borrow under the credit facility and the interfund lending program. As a result, borrowings available to the Fund under the credit facility and the interfund lending program might be insufficient, alone or in combination with the other strategies described herein, to satisfy Fund redemption requests. Please see About Fund Investments – Borrowings – Interfund Lending in the SAI for more information about the credit facility and interfund lending program. The Fund is also limited in the total amount it may borrow. The Fund may only borrow to the extent permitted by the 1940 Act, the rules and regulations thereunder, and any exemptive relief available to the Fund, which currently limit Fund borrowings to 33 1/3% of total assets (including any amounts borrowed) less liabilities (other than borrowings), plus an additional 5% of its total assets for temporary purposes (to be repaid within 60 days without extension or renewal), in each case determined at the time the borrowing is made.
In addition, the Fund reserves the right to honor redemption orders in whole or in part with in-kind distributions of Fund portfolio securities instead of cash if the Investment Manager, in its sole discretion, determines it to be in the best interest of the remaining shareholders. Such in-kind distributions typically represent a pro-rata portion of Fund portfolio assets subject to adjustments (e.g., for non-transferable securities, round lots and derivatives). In the event the Fund distributes portfolio securities in kind, shareholders may incur brokerage and other transaction costs associated with converting the portfolio securities into cash. Also, the portfolio securities may increase or decrease in value after they are distributed but before they are converted into cash. For U.S. federal income tax purposes, redemptions paid in securities are generally treated the same as redemptions paid in cash. If, during any 90-day period, you redeem shares in an amount greater than $250,000 or 1% of the Fund’s net assets (whichever is less), and if the Investment Manager determines it to be feasible and appropriate, the Fund may pay the redemption amount above such threshold by an in-kind distribution of Fund portfolio securities. Although shares of the Fund may not be purchased or sold by individual owners of Contracts or Qualified Plans, this policy applies indirectly to Contract and Qualified Plan owners.
Potential Conflicts of Interest – Mixed and Shared Funding
The Fund is available for purchase only through Contracts offered by participating insurance companies, Qualified Plans and other qualified institutional investors authorized by the Distributor. Due to differences in tax treatment and other considerations, the interests of various Contract owners, and the interests of Qualified Plan participants, if any, may conflict. The Fund does not foresee any disadvantages to investors arising from these potential conflicts of interest at this time. Nevertheless, the Board of the Fund intends to monitor events to identify any material irreconcilable conflicts which may arise, and to determine what action, if any, should be taken in response to any conflicts. If such a conflict were to arise, one or more separate accounts might be required to withdraw its investments in the Fund or shares of another mutual fund may be substituted. This might force the Fund to sell securities at disadvantageous prices.
Order Processing
Orders to buy and sell shares of the Fund that are placed by your participating insurance company or Qualified Plan sponsor are processed on business days. Orders received in “good form” by the Transfer Agent or a financial intermediary, including your participating insurance company or Qualified Plan sponsor, before the end of a business day are priced at the NAV per share of the Fund's applicable share class on that day. Orders received after the end of a business day will receive the next business day’s NAV per share. An order is in “good form” if the Transfer Agent or your financial intermediary has all of the information and documentation it deems necessary to effect your order. The market value of the Fund’s investments may change between the time you submit your order and the time the Fund next calculates its NAV per share. The business day that applies to your order is also called the trade date.
There is no sales charge associated with the purchase of Fund shares, but there may be charges associated with your Contract or Qualified Plan. Any charges that apply to your Contract or Qualified Plan, and any charges that apply to separate accounts of participating insurance companies or Qualified Plans that may own shares directly, are described in your separate Contract prospectus or Qualified Plan disclosure documents.
Prospectus 2026
25
CTIVP® – Victory Sycamore Established Value Fund
About Fund Shares and Transactions (continued)
You may transfer all or part of your investment in the Fund to one or more of the other investment options available under your Contract or Qualified Plan. You may provide instructions to sell any amount allocated to the Fund. Proceeds will be mailed within seven days after your surrender or withdrawal request is received in good form by an authorized agent. The amount you receive may be more or less than the amount you invested.
Please refer to your Contract prospectus or Qualified Plan disclosure documents, as applicable, for more information about transfers as well as surrenders and withdrawals.
Information Sharing Agreements
As required by Rule 22c-2 under the 1940 Act, the Fund or certain of its service providers will enter into information sharing agreements with financial intermediaries, including participating life insurance companies and financial intermediaries that sponsor or offer retirement plans through which shares of the Fund are made available for purchase. Pursuant to Rule 22c-2, financial intermediaries are required, upon request, to: (i) provide shareholder account and transaction information; and (ii) execute instructions from the Fund to restrict or prohibit further purchases of Fund shares by shareholders who have been identified by the Fund as having engaged in transactions that violate the Fund's excessive trading policies and procedures.
Excessive Trading Practices Policy of Non-Money Market Funds
Right to Reject or Restrict Share Transaction Orders — The Fund is intended for investors with long-term investment purposes and is not intended as a vehicle for frequent trading activity (market timing) that is excessive. Investors should transact in Fund shares primarily for investment purposes. The Board has adopted excessive trading policies and procedures that are designed to deter excessive trading by investors (the Excessive Trading Policies and Procedures). The Fund discourages and does not accommodate excessive trading. Investments in a Fund by institutional investors in connection with redemptions in-kind are exempt from the Excessive Trading Policies and Procedures because they generally do not raise market timing or excessive trading concerns. Further discussion about the Fund’s use of redemptions in-kind is available under Satisfying Fund Redemption Requests.
The Fund reserves the right to reject, without any prior notice, any purchase or transfer order for any reason, and will not be liable for any loss resulting from rejected orders. For example, the Fund may in its sole discretion restrict or reject a purchase or transfer order even if the transaction is not subject to the specific limitation described below if the Fund or its agents determine that accepting the order could interfere with efficient management of the Fund's portfolio or is otherwise contrary to the Fund's best interests. The Excessive Trading Policies and Procedures apply equally to purchase or transfer transactions communicated directly to the Transfer Agent and to those received by financial intermediaries.
Specific Buying and Transferring Limitations — If the Fund detects that an investor has made two “material round trips” in any 28-day period, it will generally reject the investor's future purchase orders, including transfer buy orders, involving any Fund.
For these purposes, a “round trip” is a purchase or transfer into the Fund followed by a sale or transfer out of the Fund, or a sale or transfer out of the Fund followed by a purchase or transfer into the Fund. A “material” round trip is one that is deemed by the Fund to be material in terms of its amount or its potential detrimental impact on the Fund. Independent of this limit, the Fund may, in its sole discretion, reject future purchase orders by any person, group or account that appears to have engaged in any type of excessive trading activity.
These limits generally do not apply to automated transactions or transactions by registered investment companies in a “fund-of-funds” structure. These limits do not apply to payroll deduction contributions by retirement plan participants, transactions initiated by a retirement plan sponsor or certain other retirement plan transactions consisting of rollover transactions, loan repayments and disbursements, and required minimum distribution redemptions. They may be modified or rescinded for accounts held by certain retirement plans to conform to plan limits, for considerations relating to the Employee Retirement Income Security Act of 1974 or regulations of the Department of Labor, and for certain asset allocation or wrap programs. Accounts known to be under common ownership or control generally will be counted together, but accounts maintained or managed by a common
26
Prospectus 2026
CTIVP® – Victory Sycamore Established Value Fund
About Fund Shares and Transactions (continued)
intermediary generally will not be considered to be under common ownership or control. The Fund reserves the right to modify these restrictions at any time without prior notice to shareholders. In addition, the Fund may, in its sole discretion, reinstate trading privileges that have been revoked under the Fund's Excessive Trading Policies and Procedures.
Limitations on the Ability to Detect and Prevent Excessive Trading Practices — The Fund takes various steps designed to detect and prevent excessive trading, including daily review of available shareholder transaction information. However, the Fund receives buy, sell or transfer orders through financial intermediaries, and cannot always know of or reasonably detect excessive trading that may be facilitated by financial intermediaries or by the use of the omnibus account arrangements they offer. Omnibus account arrangements are common forms of holding shares of mutual funds, particularly among certain financial intermediaries such as broker-dealers, retirement plans and variable insurance products. These arrangements often permit financial intermediaries to aggregate their clients' transactions and accounts, and in these circumstances, the identities of the financial intermediary clients that beneficially own Fund shares are often not known to the Fund.
Some financial intermediaries apply their own restrictions or policies to their clients’ transactions and accounts, which may be more or less restrictive than those described here. This may impact the Fund's ability to curtail excessive trading, even where it is identified. For these and other reasons, it is possible that excessive trading may occur despite the Fund's efforts to detect and prevent it.
Although these restrictions and policies involve judgments that are inherently subjective and may involve some selectivity in their application, the Fund seeks to act in a manner that it believes is consistent with the best interests of Fund shareholders in making any such judgments.
Risks of Excessive Trading — Excessive trading creates certain risks to the Fund's long-term shareholders and may create the following adverse effects:
■
negative impact on the Fund's performance;
■
potential dilution of the value of the Fund's shares;
■
interference with the efficient management of the Fund's portfolio, such as the need to maintain undesirably large cash positions, the need to use its line of credit or the need to buy or sell securities it otherwise would not have bought or sold;
■
losses on the sale of investments resulting from the need to sell securities at less favorable prices; and
■
increased brokerage and administrative costs.
To the extent that the Fund invests significantly in foreign securities traded on markets that close before the Fund's valuation time, it may be particularly susceptible to dilution, which may be exacerbated as a result of excessive trading. Because events may occur after the close of foreign markets and before the Fund's valuation time that influence the value of foreign securities, investors may seek to trade Fund shares in an effort to benefit from their understanding of the value of foreign securities as of the Fund's valuation time. This is often referred to as price arbitrage. The Fund has adopted procedures designed to adjust closing market prices of foreign securities under certain circumstances to reflect what the Fund believes to be the fair value of those securities as of its valuation time. To the extent the adjustments do not work fully, investors engaging in price arbitrage may cause dilution in the value of the Fund's shares held by other shareholders.
Similarly, to the extent that the Fund invests significantly in thinly traded securities and other debt instruments that are rated below investment grade (commonly called “high-yield” or “junk” bonds), equity securities of small-capitalization companies, floating rate loans, or tax-exempt or other securities that may trade infrequently, because these securities are often traded infrequently, investors may seek to trade Fund shares in an effort to benefit from their understanding of the value of these securities as of the Fund's valuation time. This is also a type of price arbitrage. Any such frequent trading strategies may interfere with efficient management of the Fund's portfolio to a greater degree than would be the case for mutual funds that invest only, or significantly, in highly liquid securities, in part because the Fund may have difficulty selling these particular investments at advantageous times or prices to satisfy large and/or frequent sell orders. Any successful price arbitrage may also cause dilution in the value of Fund shares held by non-redeeming shareholders.
Prospectus 2026
27
CTIVP® – Victory Sycamore Established Value Fund
About Fund Shares and Transactions (continued)
Excessive Trading Practices Policy of Columbia Variable Portfolio - Government Money Market Fund
A money market fund is designed to offer investors a liquid cash option that they may buy and sell as often as they wish. Accordingly, the Board has not adopted policies and procedures designed to discourage excessive or short-term trading of Columbia Variable Portfolio - Government Money Market Fund shares. However, since frequent purchases and sales of Columbia Variable Portfolio - Government Money Market Fund shares could in certain instances harm shareholders in various ways, including reducing the returns to long-term shareholders by increasing costs (such as spreads paid to dealers who trade money market instruments with Columbia Variable Portfolio - Government Money Market Fund) and disrupting portfolio management strategies, Columbia Variable Portfolio - Government Money Market Fund reserves the right, but has no obligation, to reject any purchase or transfer transaction at any time. Columbia Variable Portfolio - Government Money Market Fund has no limits on purchase or transfer transactions. In addition, Columbia Variable Portfolio - Government Money Market Fund reserves the right to impose or modify restrictions on purchases, transfers or trading of Fund shares at any time.
28
Prospectus 2026
CTIVP® – Victory Sycamore Established Value Fund
Distributions and Taxes
Distributions to Shareholders
A mutual fund can make money two ways:
■
It can earn income on its investments. Examples of fund income are interest paid on money market instruments and bonds, and dividends paid on common stocks.
■
A mutual fund can also have capital gains if the value of its investments increases.
In the case of the Fund, because the Fund expects to be treated as a partnership for tax purposes, it is not required to and does not expect to make regular distributions to its shareholders (other than in redemption of Fund shares), but may do so in the sole discretion of the Fund’s Board of Trustees (or its delegates).
Taxes and Your Investment
Taxation of the Fund: The Fund is currently treated and expects to continue to be treated as a partnership that is not a “publicly traded partnership” for U.S. federal income tax purposes. If the Fund were not to qualify for such treatment, the Fund could be subject to U.S. federal income tax at the Fund level, which would reduce the value of an investment in the Fund.
As a partnership that is not a “publicly traded partnership,” the Fund is generally not itself subject to U.S. federal income tax. Instead, each shareholder will be required to take into account for U.S. federal income tax purposes its allocable share of the Fund’s income, gains, losses, deductions, credits, and other tax items, without regard to whether such shareholder has received or will receive corresponding distributions from the Fund. In addition, unlike mutual funds that intend to be treated as regulated investment companies for U.S. federal income tax purposes, the Fund is not required to meet any specific qualifying income or distribution requirements, although to the extent regulated investment companies invest in the Fund, such requirements will be taken into account by the Fund.
Certain Fund income may be subject to tax in other countries, including withholding or other taxes on dividends, interest or capital gains. Tax conventions between certain countries and the United States may reduce or eliminate such taxes. In certain countries the Fund may incur a higher rate of tax on dividends than it would have incurred if the Fund had been treated as a regulated investment company.
As a partnership that is not a “publicly traded partnership,” the Fund is generally not itself subject to U.S. federal income tax. Instead, each shareholder will be required to take into account for U.S. federal income tax purposes its allocable share of the Fund’s income, gains, losses, deductions, credits, and other tax items, without regard to whether such shareholder has received or will receive corresponding distributions from the Fund. In addition, unlike mutual funds that intend to be treated as regulated investment companies for U.S. federal income tax purposes, the Fund is not required to meet any specific qualifying income or distribution requirements, although to the extent regulated investment companies invest in the Fund, such requirements will be taken into account by the Fund.
Certain Fund income may be subject to tax in other countries, including withholding or other taxes on dividends, interest or capital gains. Tax conventions between certain countries and the United States may reduce or eliminate such taxes. In certain countries the Fund may incur a higher rate of tax on dividends than it would have incurred if the Fund had been treated as a regulated investment company.
Taxation of Fund Shares: Shares of the Fund are only offered to separate accounts of participating insurance companies, Qualified Plans, and certain other eligible persons or plans permitted to hold shares of the Fund pursuant to the applicable U.S. Treasury Regulations without impairing the ability of participating insurance companies to satisfy the diversification requirements of Section 817(h) of the Internal Revenue Code of 1986, as amended. Each participating insurance company, including each participating insurance company that is an affiliate of the Investment Manager, includes in its taxable income any net investment income derived from the investment of assets held in its separate accounts because the insurance company is considered the owner of these assets under federal income tax law. The insurance company may claim certain tax benefits associated with this investment income, which benefits may be greater with respect to the Fund than if the Fund were treated as a regulated investment company for U.S. federal income tax purposes. These benefits, which may include foreign tax credits (which can reduce the insurance company’s U.S. taxes on foreign source income) and the corporate dividends-received deduction (which is a tax deduction for the insurance company attributable to certain dividends received by the Fund), are not passed on to Contract owners since the affiliated insurance company is the owner of the assets under federal tax law and is taxed on the investment income generated by the assets.
Taxation of Variable Annuity Contracts and Variable Life Insurance Policies: Your Contract may qualify for favorable tax treatment. Please refer to your Contract prospectus for more information about the tax implications of your investment in the Contract. As long as your Contract continues to qualify for such favorable tax treatment, you will not be taxed currently on your investment in the Fund through such Contract, even if the Fund makes allocations or distributions to the separate account and/or you change your investment options under the Contract. In order to qualify for such treatment, among other things, the separate accounts of participating insurance companies, which maintain and invest net proceeds from Contracts, must be “adequately diversified.” The Fund intends to operate in such a manner so that a separate account investing only in Fund shares on behalf of a holder of a Contract will be “adequately diversified.” If the Fund does not meet such requirements because its investments are not adequately
Prospectus 2026
29
CTIVP® – Victory Sycamore Established Value Fund
Distributions and Taxes (continued)
diversified, your Contract could lose its favorable tax treatment, and income and gain allocable to your Contract could be taxable currently to you. This could also occur if Contract holders are found to have an impermissible level of control over the investments underlying their Contracts or if the Fund does not qualify for treatment as a partnership that is not a “publicly traded partnership.” You should consult with the participating insurance company that issued your Contract, plan sponsor, or other eligible investor through which your investment in the Fund is made regarding the U.S. federal income taxation of your investment.
FUNDamentals
Taxes
The information provided above is only a summary of how U.S. federal income taxes may affect your indirect investment in the Fund. It is not intended as a substitute for careful tax planning. Your investment in the Fund may have other tax implications. It does not apply to certain types of investors who may be subject to special rules, including foreign or tax-exempt investors or those holding Fund shares through a tax-advantaged account other than a Contract, such as a 401(k) plan or IRA. Please see the SAI for more detailed tax information. You should consult with your own tax advisor about the particular tax consequences to you of an investment in the Fund, including the effect of any foreign, state and local taxes, and the effect of possible changes in applicable tax laws.
30
Prospectus 2026
CTIVP® – Victory Sycamore Established Value Fund
Financial Highlights
The financial highlights table is intended to help you understand the Fund’s financial performance for the past five fiscal years or, if shorter, the Fund’s period of operations. Certain information reflects financial results for a single Fund share. Per share net investment income (loss) amounts are calculated based on average shares outstanding during the period. The total return in the table represents the rate that an investor would have earned (or lost) on an investment in the Fund assuming all dividends and distributions had been reinvested. Total return does not reflect any fees and expenses imposed under your Contract and/or Qualified Plan, as applicable; such fees and expenses would reduce the total return for all periods shown. Total return and portfolio turnover are not annualized for periods of less than one year. The ratios of expenses and net investment income are annualized for periods of less than one year. The portfolio turnover rate is calculated without regard to purchase and sales transactions of short-term instruments and certain derivatives, if any. If such transactions were included, the Fund’s portfolio turnover rate may be higher. A zero balance may reflect an amount rounding to less than $0.01 or 0.01%. This information has been audited by PricewaterhouseCoopers LLP, an independent registered public accounting firm, whose report, along with the Fund’s financial statements, is included in the Fund’s Form N-CSR, which is available upon request.
Prospectus 2026
31
CTIVP® – Victory Sycamore Established Value Fund
Financial Highlights (continued)
| |
Net asset value, beginning of period |
Net investment income |
Net realized and unrealized gain (loss) |
Total from investment operations |
| Class 1 | ||||
| Year Ended 12/31/2025 |
$50.76 |
0.58 |
0.58 |
1.16 |
| Year Ended 12/31/2024 |
$46.19 |
0.53 |
4.04 |
4.57 |
| Year Ended 12/31/2023 |
$42.02 |
0.55 |
3.62 |
4.17 |
| Year Ended 12/31/2022 |
$43.21 |
0.56 |
(1.75) |
(1.19) |
| Year Ended 12/31/2021 |
$32.76 |
0.58(c) |
9.87 |
10.45 |
| Class 2 | ||||
| Year Ended 12/31/2025 |
$48.97 |
0.44 |
0.54 |
0.98 |
| Year Ended 12/31/2024 |
$44.67 |
0.39 |
3.91 |
4.30 |
| Year Ended 12/31/2023 |
$40.73 |
0.44 |
3.50 |
3.94 |
| Year Ended 12/31/2022 |
$41.99 |
0.45 |
(1.71) |
(1.26) |
| Year Ended 12/31/2021 |
$31.92 |
0.50(c) |
9.57 |
10.07 |
| Class 3 | ||||
| Year Ended 12/31/2025 |
$49.89 |
0.51 |
0.55 |
1.06 |
| Year Ended 12/31/2024 |
$45.45 |
0.46 |
3.98 |
4.44 |
| Year Ended 12/31/2023 |
$41.39 |
0.49 |
3.57 |
4.06 |
| Year Ended 12/31/2022 |
$42.62 |
0.51 |
(1.74) |
(1.23) |
| Year Ended 12/31/2021 |
$32.35 |
0.55(c) |
9.72 |
10.27 |
| Notes to Financial Highlights | |
| (a) |
In addition to the fees and expenses that the Fund bears directly, the Fund indirectly bears a pro rata share of the fees and expenses of any other funds in which it invests. Such indirect expenses are not included in the Fund's reported expense ratios. |
| (b) |
Total net expenses include the impact of certain fee waivers/expense reimbursements made by the Investment Manager and certain of its affiliates, if applicable. |
| (c) |
Net investment income per share includes special dividends. The effect of these dividends amounted to $0.15 per share. |
32
Prospectus 2026
CTIVP® – Victory Sycamore Established Value Fund
Financial Highlights (continued)
| |
Net asset value, end of period |
Total return |
Total gross expense ratio to average net assets(a) |
Total net expense ratio to average net assets(a),(b) |
Net investment income ratio to average net assets |
Portfolio turnover |
Net assets, end of period (000's) |
| Class 1 | |||||||
| Year Ended 12/31/2025 |
$51.92 |
2.29% |
0.82% |
0.82% |
1.14% |
58% |
$238,926 |
| Year Ended 12/31/2024 |
$50.76 |
9.90% |
0.82% |
0.82% |
1.06% |
36% |
$279,263 |
| Year Ended 12/31/2023 |
$46.19 |
9.92% |
0.82% |
0.82% |
1.29% |
29% |
$301,914 |
| Year Ended 12/31/2022 |
$42.02 |
(2.75%) |
0.81% |
0.81% |
1.37% |
30% |
$318,668 |
| Year Ended 12/31/2021 |
$43.21 |
31.90% |
0.80% |
0.80% |
1.48% |
24% |
$403,832 |
| Class 2 | |||||||
| Year Ended 12/31/2025 |
$49.95 |
2.00% |
1.07% |
1.07% |
0.90% |
58% |
$80,818 |
| Year Ended 12/31/2024 |
$48.97 |
9.62% |
1.07% |
1.07% |
0.81% |
36% |
$85,967 |
| Year Ended 12/31/2023 |
$44.67 |
9.67% |
1.07% |
1.07% |
1.05% |
29% |
$80,372 |
| Year Ended 12/31/2022 |
$40.73 |
(3.00%) |
1.06% |
1.06% |
1.13% |
30% |
$74,701 |
| Year Ended 12/31/2021 |
$41.99 |
31.55% |
1.05% |
1.05% |
1.28% |
24% |
$74,122 |
| Class 3 | |||||||
| Year Ended 12/31/2025 |
$50.95 |
2.12% |
0.95% |
0.95% |
1.02% |
58% |
$73,760 |
| Year Ended 12/31/2024 |
$49.89 |
9.77% |
0.95% |
0.95% |
0.93% |
36% |
$85,465 |
| Year Ended 12/31/2023 |
$45.45 |
9.81% |
0.94% |
0.94% |
1.17% |
29% |
$85,814 |
| Year Ended 12/31/2022 |
$41.39 |
(2.89%) |
0.93% |
0.93% |
1.26% |
30% |
$84,045 |
| Year Ended 12/31/2021 |
$42.62 |
31.75% |
0.93% |
0.93% |
1.41% |
24% |
$87,819 |
Prospectus 2026
33
CTIVP® – Victory Sycamore Established Value Fund

For More Information
The Fund is generally available only to owners of Contracts issued by participating insurance companies and participants in Qualified Plans. Please refer to your Contract prospectus or Qualified Plan disclosure documents for information about how to buy, sell and transfer shares of the Fund.
Additional Information About the Fund
Additional information about the Fund’s investments is available in the Fund’s annual and semiannual reports to shareholders and in Form N-CSR. In the Fund’s annual report, you will find a discussion of the market conditions and investment strategies that significantly affected the Fund’s performance during its last fiscal year. In the Fund’s Form N-CSR, you will find the Fund’s annual and semiannual financial statements. The SAI also provides additional information about the Fund and its policies. The SAI, which has been filed with the SEC, is legally part of this prospectus (incorporated by reference). To obtain these documents free of charge, to request other information about the Fund and to make shareholder inquiries, please contact the Fund as follows:
By Mail: Columbia Management Investment Services Corp.
P.O. Box 219104
Kansas City, MO 64121-9104
P.O. Box 219104
Kansas City, MO 64121-9104
By Telephone: 800.345.6611
Online: columbiathreadneedleus.com
Reports and other information about the Fund are also available in the EDGAR Database on the SEC’s website at http://www.sec.gov. You can receive copies of this information, for a duplication fee, by electronic request at the following e-mail address: publicinfo@sec.gov.
The investment company registration number of Columbia Funds Variable Series Trust II, of which the Fund is a series, is 811-22127.
Columbia Threadneedle Investments (Columbia Threadneedle) is the global brand name of the Columbia and Threadneedle group of companies.
The Fund is distributed by Columbia Management Investment Distributors, Inc., 290 Congress Street, Boston, MA 02210.
The Fund is distributed by Columbia Management Investment Distributors, Inc., 290 Congress Street, Boston, MA 02210.
© 2026 Columbia Threadneedle. All rights reserved.
PRO7038_12_E01_(05/26)

CTIVP® - Westfield Mid Cap Growth Fund
Prospectus
May 1, 2026
As with all mutual funds, the Securities and Exchange Commission (SEC) has not approved or disapproved these securities or passed upon the adequacy of this prospectus. Any representation to the contrary is a criminal offense.

CTIVP® – Westfield Mid Cap Growth Fund
Table of Contents
| 3 | |
| 3 | |
| 3 | |
| 4 | |
| 4 | |
| 6 | |
| 7 | |
| 7 | |
| 7 | |
| 8 | |
| 9 | |
| 9 | |
| 9 | |
| 9 | |
| 12 | |
| 16 | |
| 18 | |
| 19 | |
| 20 | |
| 20 | |
| 20 | |
| 21 | |
| 23 | |
| 28 | |
| 28 | |
| 28 | |
| 31 |
2
Prospectus 2026
CTIVP® – Westfield Mid Cap Growth Fund
Summary of the Fund
Investment Objective
CTIVP® – Westfield Mid Cap Growth Fund (the Fund) seeks to provide shareholders with long-term capital growth.
Fees and Expenses of the Fund
This table describes the fees and expenses that you may pay as an investor in the Fund. The table does not reflect any fees or expenses imposed by your Contract or Qualified Plan, which are disclosed in your separate Contract prospectus or Qualified Plan disclosure documents. If the additional fees or expenses were reflected, the expenses set forth below would be higher.
| Annual Fund Operating Expenses (expenses that you pay each year as a percentage of the value of your investment) | ||
| |
Class 1 |
Class 2 |
| Management fees |
% |
% |
| Distribution and/or service (12b-1) fees |
% |
% |
| Other expenses |
% |
% |
| Total annual Fund operating expenses(a) |
% |
% |
| Less: Fee waivers and/or expense reimbursements(b) |
( %) |
( %) |
| Total annual Fund operating expenses after fee waivers and/or expense reimbursements |
% |
% |
(a)
(b)
Example
The following example is intended to help you compare the cost of investing in the Fund with the cost of investing in other mutual funds. The example illustrates the hypothetical expenses that you would incur over the time periods indicated, and assumes that:
■
you invest $10,000 in the applicable class of Fund shares for the periods indicated,
■
your investment has a 5% return each year, and
■
the Fund’s total annual operating expenses remain the same as shown in the Annual Fund Operating Expenses table above.
The example does not reflect any fees and expenses that apply to your Contract or Qualified Plan. Inclusion of these charges would increase expenses for all periods shown.
Since the waivers and/or reimbursements shown in the Annual Fund Operating Expenses table above expire as indicated in the preceding table, they are only reflected in the 1 year example and the first year of the other examples. Although your actual costs may be higher or lower, based on the assumptions listed above, your costs would be:
| |
1 year |
3 years |
5 years |
10 years |
| Class 1 (whether or not shares are redeemed) |
$ |
$ |
$ |
$ |
| Class 2 (whether or not shares are redeemed) |
$ |
$ |
$ |
$ |
Prospectus 2026
3
CTIVP® – Westfield Mid Cap Growth Fund
Summary of the Fund (continued)
Portfolio Turnover
The Fund may pay transaction costs, such as commissions, when it buys and sells securities (or “turns over” its portfolio). A higher portfolio turnover rate may indicate higher transaction costs. These costs, which are not reflected in annual fund operating expenses or in the example, affect the Fund’s performance. During the most recent fiscal year, the Fund’s portfolio turnover rate was 80 % of the average value of its portfolio.
Principal Investment Strategies
Under normal circumstances, the Fund invests at least 80% of its net assets (plus the amount of any borrowings for investment purposes) in equity securities of mid-capitalization companies. The Fund defines mid-capitalization companies as those companies with a market capitalization that falls within the range of the companies that comprise the Russell Midcap® Growth Index (the Capitalization Index). The market capitalization range of the companies included within the Capitalization Index was $134.5 million to $95.9 billion as of March 31, 2026. The market capitalization range and composition of companies in the Capitalization Index are subject to change. As such, the size of the companies in which the Fund invests may change. The Fund may continue to hold a security even if the company’s market capitalization is no longer within the range of the Capitalization Index. Under normal circumstances, the Fund also invests at least 80% of its net assets (plus the amount of any borrowings for investment purposes) in equity securities of “growth” companies. The Fund considers “growth” companies to be those companies that are either constituents of an index constructed by a third party to identify companies with various characteristics of growth companies, have a higher Institutional Brokers' Estimate System (I/B/E/S) medium-term growth forecast (two year) than the median ranked stock within the company’s GICS sector, or have a higher sales per share historical growth rate (five year) than the median ranked stock within the company’s GICS sector. The third-party broad-based index currently used to identify growth companies is the Russell 3000® Growth Index, although the Fund may change this index without prior notice. The I/B/E/S is a database used by brokers and investors to access the estimates made by stock analysts regarding the future earnings of publicly traded American companies. The I/B/E/S medium term growth forecast is a measure of the average annualized EPS (earnings per share) growth forecast of contributing analysts/estimators for the forthcoming two years. The Fund may at times emphasize one or more sectors in selecting its investments, including the consumer discretionary, health care, industrials, and information technology sectors.
Principal Risks
An investment in the Fund involves risks, including Mid-Cap Stock Risk, Growth Securities Risk, and Market Risk, among others. Descriptions of these and other principal risks of investing in the Fund are provided below. There is no assurance that the Fund will achieve its investment objective and you may lose money. The value of the Fund’s holdings may decline, and the Fund’s net asset value (NAV) and share price may go down. An investment in the Fund is not a bank deposit and is not insured or guaranteed by the Federal Deposit Insurance Corporation or any other government agency. The significance of any specific risk to an investment in the Fund will vary over time depending on the composition of the Fund's portfolio, market conditions, and other factors. You should read all of the risk information below carefully, because any one or more of these risks may result in losses to the Fund.
Active Management Risk. Due to its active management, the Fund could underperform its benchmark index and/or other funds with similar investment objectives and/or strategies.
Equity Securities Risk. Equity securities may experience significant volatility. Such securities may fall sharply in response to adverse events affecting overall markets, a particular industry or sector, or an individual company’s financial condition.
Growth Securities Risk. Growth securities typically trade at a higher multiple of earnings than other types of equity securities. Accordingly, the market values of growth securities may never reach their expected market value and may decline in price. In addition, growth securities, at times, may not perform as well as value securities or the stock market in general, and may be out of favor with investors for varying periods of time. Growth securities may also be sensitive to movements in interest rates.
4
Prospectus 2026
CTIVP® – Westfield Mid Cap Growth Fund
Summary of the Fund (continued)
Issuer Risk. An issuer in which the Fund invests or to which it has exposure may perform poorly or below expectations, and the value of its securities may therefore decline, which may negatively affect the Fund’s performance. Underperformance of an issuer may be caused by poor management decisions, competitive pressures, breakthroughs in technology, reliance on suppliers, labor problems or shortages, corporate restructurings, fraudulent disclosures, natural disasters, military confrontations and actions, war, other conflicts, terrorism, disease/virus outbreaks, epidemics or other events, conditions and factors which may impair the value of your investment in the Fund.
■
Mid-Cap Stock Risk. Investments in mid-capitalization companies (mid-cap companies) often involve greater risks than investments in larger, more established companies (larger companies) because mid-cap companies tend to have less predictable earnings and may lack the management experience, financial resources, product diversification and competitive strengths of larger companies, and may be less liquid than the securities of larger companies.
Market Risk. The Fund may incur losses due to declines in the value of one or more securities in which it invests. These declines may be due to factors affecting a particular issuer, or the result of, among other things, political, regulatory, market, economic or social developments affecting the relevant market(s) more generally. In addition, turbulence in financial markets and reduced liquidity in equity, credit and/or fixed income markets may negatively affect many issuers, which could adversely affect the Fund’s ability to price or value hard-to-value assets in thinly traded and closed markets and could cause significant redemptions and operational challenges. Global economies and financial markets are increasingly interconnected, and conditions and events in one country, region or financial market may adversely impact issuers in a different country, region or financial market. These risks may be magnified if certain events or developments adversely interrupt the global supply chain; in these and other circumstances, such risks might affect companies worldwide. As a result, local, regional or global events such as terrorism, war, other conflicts, natural disasters, disease/virus outbreaks and epidemics or other public health issues, recessions, depressions or other events – or the potential for such events – could have a significant negative impact on global economic and market conditions.
Sector Risk. At times, the Fund may have a significant portion of its assets invested in securities of companies conducting business in a related group of industries within one or more economic sectors, including the consumer discretionary, health care, industrials, and information technology sectors. Companies in the same sector may be similarly affected by economic, regulatory, political or market events or conditions, which may make the Fund vulnerable to unfavorable developments in that group of industries or economic sector.
■
Consumer Discretionary Sector. The Fund is vulnerable to the particular risks that may affect companies in the consumer discretionary sector. Companies in the consumer discretionary sector are subject to certain risks, including fluctuations in the performance of the overall domestic and international economies, interest rate changes, increased competition and consumer confidence. Performance of such companies may be affected by factors including reduced disposable household income, reduced consumer spending, and changing demographics and consumer tastes.
■
Health Care Sector. The Fund is vulnerable to the particular risks that may affect companies in the health care sector. Companies in the health care sector are subject to certain risks, including restrictions on government reimbursement for medical expenses, government approval of medical products and services, competitive pricing pressures, and the rising cost of medical products and services (especially for companies dependent upon a relatively limited number of products or services), among others. Performance of such companies may be affected by factors including government regulation, obtaining and protecting patents (or the failure to do so), product liability and other similar litigation as well as product obsolescence.
■
Industrials Sector. The Fund is vulnerable to the particular risks that may affect companies in the industrials sector. Companies in the industrials sector are subject to certain risks, including changes in supply and demand for their specific product or service and for industrial sector products in general, including decline in demand for such products due to rapid technological developments and frequent new product introduction. Performance of such companies may be affected by factors including government regulation, world events, economic conditions and risks for environmental damage and product liability claims.
Prospectus 2026
5
CTIVP® – Westfield Mid Cap Growth Fund
Summary of the Fund (continued)
■
Information Technology Sector. The Fund is vulnerable to the particular risks that may affect companies in the information technology sector. Companies in the information technology sector are subject to certain risks, including the risk that new services, equipment or technologies will not be accepted by consumers and businesses or will become rapidly obsolete. Performance of such companies may be affected by factors including obtaining and protecting patents (or the failure to do so) and significant competitive pressures, including aggressive pricing of their products or services, new market entrants, competition for market share and short product cycles due to an accelerated rate of technological developments. Such competitive pressures may lead to limited earnings and/or falling profit margins. As a result, the value of their securities may fall or fail to rise. In addition, many information technology sector companies have limited operating histories and prices of these companies’ securities historically have been more volatile than other securities, especially over the short term. Some companies in the information technology sector are facing increased government and regulatory scrutiny and may be subject to adverse government or regulatory action, which could negatively impact the value of their securities.
Performance Information
The following bar chart and table show you how the Fund has performed in the past, and can help you understand the risks of investing in the Fund. The bar chart shows how the Fund’s Class 2 share performance has varied for each full calendar year shown. The table below the bar chart compares the Fund’s returns for the periods shown with a broad measure of market performance, as well as another measure of performance for markets in which the Fund may invest.
Except for differences in annual returns resulting from differences in expenses (where applicable), the share classes of the Fund would have substantially similar annual returns because all share classes of the Fund invest in the same portfolio of securities.
The returns shown do not reflect any fees and expenses imposed under your Contract or Qualified Plan and would be lower if they did.
The Fund’s performance prior to September 2017 reflects returns achieved by one or more different subadvisers. If the Fund’s current subadviser had been in place for the prior periods, results shown may have been different.
| Year by Year Total Return (%) as of December 31 Each Year |
Best and Worst Quarterly Returns During the Period Shown in the Bar Chart | ||
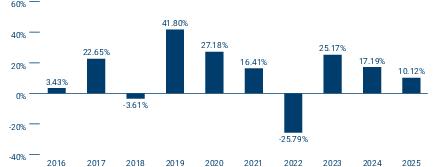 |
|
|
|
| |
|
- | |
6
Prospectus 2026
CTIVP® – Westfield Mid Cap Growth Fund
Summary of the Fund (continued)
Average Annual Total Returns (for periods ended December 31, 2025)
| |
Share Class Inception Date |
1 Year |
5 Years |
10 Years |
| Class 1 |
|
|
|
|
| Class 2 |
|
|
|
|
| Russell Midcap® Growth Index (reflects no deductions for fees, expenses or taxes) |
|
|
|
|
| Russell 3000® Index (reflects no deductions for fees, expenses or taxes) |
|
|
|
|
Fund Management
Investment Manager: Columbia Management Investment Advisers, LLC
Subadviser: Westfield Capital Management Company, L.P. (Westfield)
The Westfield Investment Committee (the “Committee”) is jointly and primarily responsible for the day-to-day investment decision making for the Fund. Investment decisions for the Fund are made by consensus of the Committee, which is chaired by William A. Muggia. Although the Committee collectively acts as portfolio manager for the Fund, Westfield lists the following Committee members, based on seniority and role within the Committee, as having day-to-day management responsibilities for the Fund.
| Portfolio Management |
Title |
Role with Fund |
Managed Fund Since |
| William Muggia |
Chief Executive Officer, Chief Investment Officer, and Managing Partner of Westfield |
Co-Portfolio Manager |
2017 |
| Richard Lee, CFA |
Chief Investment Officer and Managing Partner of Westfield |
Co-Portfolio Manager |
2017 |
| Matthew Renna |
Managing Partner of Westfield |
Co-Portfolio Manager |
May 2025 |
| Edward Richardson |
Partner of Westfield |
Co-Portfolio Manager |
May 2025 |
Purchase and Sale of Fund Shares
The Fund is available for purchase through Contracts offered by the separate accounts of participating insurance companies or Qualified Plans or by other eligible investors authorized by Columbia Management Investment Distributors, Inc. (the Distributor). Shares of the Fund may not be purchased or sold by individual owners of Contracts or Qualified Plans. If you are a Contract holder or Qualified Plan participant, please refer to your separate Contract prospectus or Qualified Plan disclosure documents for information about minimum investment requirements and how to purchase and redeem shares of the Fund on days the Fund is open for business.
Tax Information
The Fund expects to be treated as a partnership for U.S. federal income tax purposes, and does not expect to make regular distributions (other than in redemption of Fund shares) to shareholders which are generally the participating insurance companies investing in the Fund through separate accounts or Qualified Plans or certain other eligible investors authorized by the Distributor. You should consult with the participating insurance company that issued your Contract, plan sponsor or other eligible investor through which your investment in the Fund is made regarding the U.S. federal income taxation of your investment.
Prospectus 2026
7
CTIVP® – Westfield Mid Cap Growth Fund
Summary of the Fund (continued)
Payments to Broker-Dealers and Other Financial Intermediaries
If you make allocations to the Fund, the Fund, its Distributor or other related companies may pay participating insurance companies or other financial intermediaries for the allocation (sale) of Fund shares and related services in connection with such allocations to the Fund. These payments may create a conflict of interest by influencing the participating insurance company, other financial intermediary or your salesperson to recommend an allocation to the Fund over another fund or other investment option. Ask your financial advisor or salesperson or visit your financial intermediary’s website for more information.
8
Prospectus 2026
CTIVP® – Westfield Mid Cap Growth Fund
More Information About the Fund
Investment Objective
CTIVP® – Westfield Mid Cap Growth Fund (the Fund) seeks to provide shareholders with long-term capital growth. The Fund’s investment objective is not a fundamental policy and may be changed by the Fund’s Board of Trustees without shareholder approval as long as shareholders are given 60 days’ advance written notice of the change. Because any investment involves risk, there is no assurance the Fund’s investment objective will be achieved.
Principal Investment Strategies
Under normal circumstances, the Fund invests at least 80% of its net assets (plus the amount of any borrowings for investment purposes) in equity securities of mid-capitalization companies. The Fund defines mid-capitalization companies as those companies with a market capitalization that falls within the range of the companies that comprise the Russell Midcap® Growth Index (the Capitalization Index). The market capitalization range of the companies included within the Capitalization Index was $134.5 million to $95.9 billion as of March 31, 2026. The market capitalization range and composition of companies in the Capitalization Index are subject to change. As such, the size of the companies in which the Fund invests may change. The Fund may continue to hold a security even if the company’s market capitalization is no longer within the range of the Capitalization Index. Under normal circumstances, the Fund also invests at least 80% of its net assets (plus the amount of any borrowings for investment purposes) in equity securities of “growth” companies. The Fund considers “growth” companies to be those companies that are either constituents of an index constructed by a third party to identify companies with various characteristics of growth companies, have a higher Institutional Brokers' Estimate System (I/B/E/S) medium-term growth forecast (two year) than the median ranked stock within the company’s GICS sector, or have a higher sales per share historical growth rate (five year) than the median ranked stock within the company’s GICS sector. The third-party broad-based index currently used to identify growth companies is the Russell 3000® Growth Index, although the Fund may change this index without prior notice. The I/B/E/S is a database used by brokers and investors to access the estimates made by stock analysts regarding the future earnings of publicly traded American companies. The I/B/E/S medium term growth forecast is a measure of the average annualized EPS (earnings per share) growth forecast of contributing analysts/estimators for the forthcoming two years. The Fund may at times emphasize one or more sectors in selecting its investments, including the consumer discretionary, health care, industrials, and information technology sectors.
Columbia Management Investment Advisers, LLC (Columbia Management or the Investment Manager) serves as the investment manager to the Fund and is responsible for the oversight of, including the establishment of risk management parameters for, the Fund’s subadviser, Westfield Capital Management Company, L.P. (Westfield or the Subadviser), which provides day-to-day portfolio management to the Fund.
The Fund invests primarily in stocks of domestic growth companies that Westfield believes have a demonstrated record of achievement with excellent prospects for earnings growth over a 1- to 3-year period.
In choosing securities, Westfield looks for companies that it believes are reasonably priced with high forecasted earnings potential. The Fund will invest in companies that Westfield believes have shown above-average and consistent long-term growth in earnings and have excellent prospects for future growth.
The Fund generally will sell a security if one or more of the following occurs: Westfield’s predetermined price target objective is exceeded; there is an alteration to the original investment case; valuation relative to the stock’s peer group is no longer attractive; or Westfield believes better risk/reward opportunities may be found in other stocks.
The Fund’s investment policies with respect to 80% of its net assets may be changed by the Fund’s Board of Trustees without shareholder approval as long as shareholders are given 60 days’ advance written notice of the change.
Principal Risks
An investment in the Fund involves risks, including Mid-Cap Stock Risk, Growth Securities Risk, and Market Risk, among others. Descriptions of these and other principal risks of investing in the Fund are provided below. There is no assurance that the Fund will achieve its investment objective and you may lose money. The value of the Fund’s holdings may decline, and the Fund’s net asset value (NAV) and share price may go down. An investment in the Fund
Prospectus 2026
9
CTIVP® – Westfield Mid Cap Growth Fund
More Information About the Fund (continued)
is not a bank deposit and is not insured or guaranteed by the Federal Deposit Insurance Corporation or any other government agency. The significance of any specific risk to an investment in the Fund will vary over time depending on the composition of the Fund's portfolio, market conditions, and other factors. You should read all of the risk information below carefully, because any one or more of these risks may result in losses to the Fund.
Active Management Risk. The Fund is actively managed and its performance therefore will reflect, in part, the ability of the portfolio managers to make investment decisions that seek to achieve the Fund’s investment objective. Due to its active management, the Fund could underperform its benchmark index and/or other funds with similar investment objectives and/or strategies.
Equity Securities Risk. Investments in equity securities represent ownership in a company that fluctuates in value with changes in the company’s financial condition. Equity markets may experience significant volatility at times and may fall sharply in response to adverse events. Certain segments of the equity market may react differently than other segments and U.S. markets may react differently than foreign markets. Individual equity prices also may experience dramatic movements in price. Price movements may result from factors affecting individual companies, sectors, or industries selected for the Fund’s portfolio or the securities market as a whole, including periods of slower growth or recessionary economic conditions, future expectations of poor economic conditions, changes in political or social conditions, and lack of investor confidence. In addition, individual equity interests may be adversely affected by factors such as reduced sales, increased costs, or a negative outlook for the future performance of the company. As compared with preferred stock and debt, common stock generally involves greater risk and has lower priority when liquidation, bankruptcy, and dividend payments are made. Preferred stock may be subordinated to bonds or other debt instruments in a company’s capital structure and is typically less liquid than common stock.
Growth Securities Risk. Growth securities typically trade at a higher multiple of earnings than other types of equity securities. Accordingly, the market values of growth securities may never reach their expected market value and may decline in price. In addition, growth securities, at times, may not perform as well as value securities or the stock market in general, and may be out of favor with investors for varying periods of time. Growth securities may also be sensitive to movements in interest rates.
Issuer Risk. An issuer in which the Fund invests or to which it has exposure may perform poorly or below expectations, and the value of its securities may therefore decline, which may negatively affect the Fund’s performance. Underperformance of an issuer may be caused by poor management decisions, competitive pressures, breakthroughs in technology, reliance on suppliers, labor problems or shortages, corporate restructurings, fraudulent disclosures, natural disasters, military confrontations and actions, war, other conflicts, terrorism, disease/virus outbreaks, epidemics or other events, conditions and factors which may impair the value of your investment in the Fund.
■
Mid-Cap Stock Risk. Securities of mid-cap companies can, in certain circumstances, have more risk than securities of larger companies. For example, mid-cap companies may be more vulnerable to market downturns and adverse business or economic events than larger companies because they may have more limited financial resources and business operations. Mid-cap companies are also more likely than larger companies to have more limited product lines and operating histories and to depend on smaller and generally less experienced management teams. Securities of mid-cap companies may trade less frequently and in smaller volumes and may fluctuate more sharply in value than securities of larger companies. When the Fund takes significant positions in mid-cap companies with limited trading volumes, the liquidation of those positions, particularly in a distressed market, could be difficult and result in Fund investment losses that would affect the value of your investment in the Fund. In addition, some mid-cap companies may not be widely followed by the investment community, which can lower the demand for their stocks.
Market Risk. The Fund may incur losses due to declines in the value of one or more securities in which it invests. These declines may be due to factors affecting a particular issuer, or the result of, among other things, political, regulatory, market, economic or social developments affecting the relevant market(s) more generally. In addition, turbulence in financial markets and reduced liquidity in equity, credit and/or fixed income markets may negatively affect many issuers, which could adversely affect the Fund’s ability to price or value hard-to-value assets in thinly traded and closed markets and could cause significant redemptions and operational challenges. Global economies
10
Prospectus 2026
CTIVP® – Westfield Mid Cap Growth Fund
More Information About the Fund (continued)
and financial markets are increasingly interconnected, and conditions and events in one country, region or financial market may adversely impact issuers in a different country, region or financial market. These risks may be magnified if certain events or developments adversely interrupt the global supply chain; in these and other circumstances, such risks might affect companies worldwide. As a result, local, regional or global events such as terrorism, war, other conflicts, natural disasters, disease/virus outbreaks and epidemics or other public health issues, recessions, depressions or other events – or the potential for such events – could have a significant negative impact on global economic and market conditions.
The large-scale invasion of Ukraine by Russia in February 2022 has resulted in sanctions and market disruptions, including declines in regional and global stock markets, unusual volatility in global commodity markets and significant devaluations of Russian currency. In addition, the Iranian conflict that commenced in February 2026 may result in similar, and potentially more severe, disruptions. Escalation of hostilities in the Middle East region could disrupt energy production or transportation, including through key shipping routes, which may lead to increased volatility in energy and other commodity prices. The extent and duration of these conflicts are impossible to predict but could continue to be significant. Market disruption caused by these conflicts, and any countermeasures or responses thereto (including international sanctions, a downgrade in a country’s credit rating, purchasing and financing restrictions, boycotts, tariffs, changes in consumer or purchaser preferences, cyberattacks and espionage) could continue to have severe adverse impacts on regional and/or global securities and commodities markets, including markets for oil and natural gas. These impacts may include reduced market liquidity, distress in credit markets, further disruption of global supply chains, increased risk of inflation, and limited access to investments in certain international markets and/or issuers. These developments and other related events could negatively impact Fund performance.
Sector Risk. At times, the Fund may have a significant portion of its assets invested in securities of companies conducting business in a related group of industries within one or more economic sectors, including the consumer discretionary, health care, industrials, and information technology sectors. Companies in the same sector may be similarly affected by economic, regulatory, political or market events or conditions, which may make the Fund vulnerable to unfavorable developments in that group of industries or economic sector.
■
Consumer Discretionary Sector. The Fund is vulnerable to the particular risks that may affect companies in the consumer discretionary sector. Companies in the consumer discretionary sector are subject to certain risks, including fluctuations in the performance of the overall domestic and international economies, interest rate changes, increased competition and consumer confidence. Performance of such companies may be affected by factors including reduced disposable household income, reduced consumer spending, and changing demographics and consumer tastes.
■
Health Care Sector. The Fund is vulnerable to the particular risks that may affect companies in the health care sector. Companies in the health care sector are subject to certain risks, including restrictions on government reimbursement for medical expenses, government approval of medical products and services, competitive pricing pressures, and the rising cost of medical products and services (especially for companies dependent upon a relatively limited number of products or services), among others. Performance of such companies may be affected by factors including government regulation, obtaining and protecting patents (or the failure to do so), product liability and other similar litigation as well as product obsolescence.
■
Industrials Sector. The Fund is vulnerable to the particular risks that may affect companies in the industrials sector. Companies in the industrials sector are subject to certain risks, including changes in supply and demand for their specific product or service and for industrial sector products in general, including decline in demand for such products due to rapid technological developments and frequent new product introduction. Performance of such companies may be affected by factors including government regulation, world events, economic conditions and risks for environmental damage and product liability claims.
■
Information Technology Sector. The Fund is vulnerable to the particular risks that may affect companies in the information technology sector. Companies in the information technology sector are subject to certain risks, including the risk that new services, equipment or technologies will not be accepted by consumers and businesses or will become rapidly obsolete. Performance of such companies may be affected by factors including
Prospectus 2026
11
CTIVP® – Westfield Mid Cap Growth Fund
More Information About the Fund (continued)
obtaining and protecting patents (or the failure to do so) and significant competitive pressures, including aggressive pricing of their products or services, new market entrants, competition for market share and short product cycles due to an accelerated rate of technological developments. Such competitive pressures may lead to limited earnings and/or falling profit margins. As a result, the value of their securities may fall or fail to rise. In addition, many information technology sector companies have limited operating histories and prices of these companies’ securities historically have been more volatile than other securities, especially over the short term. Some companies in the information technology sector are facing increased government and regulatory scrutiny and may be subject to adverse government or regulatory action, which could negatively impact the value of their securities.
Additional Investment Strategies and Policies
This section describes certain investment strategies and policies that the Fund may utilize in pursuit of its investment objective and some additional factors and risks involved with investing in the Fund.
Investment Guidelines
As a general matter, and except as specifically described in the discussion of the Fund's principal investment strategies in this prospectus or as otherwise required by the Investment Company Act of 1940, as amended (the 1940 Act), the rules and regulations thereunder and any applicable exemptive relief, whenever an investment policy or limitation states a percentage of the Fund's assets that may be invested in any security or other asset or sets forth a policy regarding an investment standard, compliance with that percentage limitation or standard will be determined solely at the time of the Fund's investment in the security or asset.
Holding Other Kinds of Investments
The Fund may hold other investments that are not part of its principal investment strategies. These investments and their risks are described below and/or in the Statement of Additional Information (SAI). The Fund may choose not to invest in certain securities described in this prospectus and in the SAI, although it has the ability to do so. Information on the Fund’s holdings can be found in the Fund’s Form N-CSR or by visiting columbiathreadneedleus.com.
Transactions in Derivatives
The Fund may enter into derivative transactions or otherwise have exposure to derivative transactions through underlying investments. Derivatives are financial contracts whose values are, for example, based on (or “derived” from) traditional securities (such as a stock or bond), assets (such as a commodity like gold or a foreign currency), reference rates (such as the Secured Overnight Financing Rate (commonly known as SOFR)) or market indices (such as the Standard & Poor’s 500® Index). The use of derivatives is a highly specialized activity which involves investment techniques and risks different from those associated with ordinary portfolio securities transactions. Derivatives involve special risks and may result in losses or may limit the Fund’s potential gain from favorable market movements. Derivative strategies often involve leverage, which may exaggerate a loss, potentially causing the Fund to lose more money than it would have lost had it invested in the underlying security or other asset directly. The values of derivatives may move in unexpected ways, especially in unusual market conditions, and may result in increased volatility in the value of the derivative and/or the Fund’s shares, among other consequences. Other risks arise from the Fund’s potential inability to terminate or to sell derivative positions. A liquid secondary market may not always exist for the Fund’s derivative positions at times when the Fund might wish to terminate or to sell such positions. Over-the-counter instruments (investments not traded on an exchange) may be illiquid, and transactions in derivatives traded in the over-the-counter market are subject to the risk that the other party will not meet its obligations. The use of derivatives also involves the risks of mispricing or improper valuation and that changes in the value of the derivative may not correlate perfectly with the underlying security, asset, reference rate or index. The Fund also may not be able to find a suitable derivative transaction counterparty, and thus may be unable to engage in derivative transactions when it is deemed favorable to do so, or at all. The U.S. government and the European Union (and some other jurisdictions) have enacted regulations and similar requirements that prescribe clearing, margin, reporting and registration requirements for participants in the derivatives market. These requirements are evolving
12
Prospectus 2026
CTIVP® – Westfield Mid Cap Growth Fund
More Information About the Fund (continued)
and their ultimate impact on the Fund remains unclear, but such impact could include restricting and/or imposing significant costs or other burdens upon the Fund’s participation in derivatives transactions. Additionally, regulations governing the use of derivatives by registered investment companies, such as the Fund, require, among other things, that a fund that invests in derivative instruments beyond a specified limited amount apply a value-at-risk-based limit to its portfolio and establish a comprehensive derivatives risk management program. As of the date of this prospectus, the Fund is not required to maintain a comprehensive derivatives risk management program given its more limited use of derivatives. For more information on the risks of derivative investments and strategies, see the SAI.
Affiliated Fund Investing
The Investment Manager or an affiliate serves as investment adviser to funds using the Columbia brand (Columbia Funds), including those that are structured as “fund-of-funds”, and provides asset-allocation services to (i) shareholders by investing in shares of other Columbia Funds, which may include the Fund (collectively referred to in this section as Underlying Funds), and (ii) discretionary managed accounts (collectively referred to as affiliated products) that invest exclusively in Underlying Funds. These affiliated products, individually or collectively, may own a significant percentage of the outstanding shares of one or more Underlying Funds, and the Investment Manager seeks to balance potential conflicts of interest between the affiliated products and the Underlying Funds in which they invest. The affiliated products’ investment in the Underlying Funds may have the effect of creating economies of scale, possibly resulting in lower expense ratios for the Underlying Funds, because the affiliated products may own substantial portions of the shares of Underlying Funds. However, redemption of Underlying Fund shares by one or more affiliated products could cause the expense ratio of an Underlying Fund to increase, as its fixed costs would be spread over a smaller asset base. Because of large positions of certain affiliated products, the Underlying Funds may experience relatively large inflows and outflows of cash due to affiliated products’ purchases and sales of Underlying Fund shares. Although the Investment Manager or its affiliate may seek to minimize the impact of these transactions where possible, for example, by structuring them over a reasonable period of time or through other measures, Underlying Funds may experience increased expenses as they buy and sell portfolio securities to manage the cash flow effect related to these transactions. Further, when the Investment Manager or its affiliate structures transactions over a reasonable period of time in order to manage the potential impact of the buy and sell decisions for the affiliated products, those affiliated products, including funds-of-funds, may pay more or less (for purchase activity), or receive more or less (for redemption activity), for shares of the Underlying Funds than if the transactions were executed in one transaction. In addition, substantial redemptions by affiliated products within a short period of time could require the Underlying Fund to liquidate positions more rapidly than would otherwise be desirable, which may have the effect of reducing or eliminating potential gain or causing it to realize a loss. In order to meet such redemptions, an Underlying Fund may be forced to sell its liquid (or more liquid) positions, leaving the Underlying Fund holding, post-redemption, a relatively larger position in illiquid investments (i.e., any investment that the Fund reasonably expects cannot be sold or disposed of in current market conditions in seven calendar days or less without the sale or disposition significantly changing the market value of the investment) or less liquid securities. Substantial redemptions may also adversely affect the ability of the Underlying Fund to implement its investment strategy. The Investment Manager or its affiliate also has a conflict of interest in determining the allocation of affiliated products’ assets among the Underlying Funds, as it earns different fees from the various Underlying Funds.
Investing in Money Market Funds
The Fund may invest cash in, or hold as collateral for certain investments, shares of registered or unregistered money market funds, including funds advised by the Investment Manager or its affiliates. These funds are not insured or guaranteed by the Federal Deposit Insurance Corporation (FDIC) or any other government agency. The Fund and its shareholders indirectly bear a portion of the expenses of any money market fund or other fund in which the Fund may invest.
Prospectus 2026
13
CTIVP® – Westfield Mid Cap Growth Fund
More Information About the Fund (continued)
Investing Defensively
The Fund may from time to time take temporary defensive investment positions that may be inconsistent with the Fund’s principal investment strategies in attempting to respond to adverse market, economic, political, social or other conditions, including, without limitation, investing some or all of its assets in money market instruments or shares of affiliated or unaffiliated money market funds or holding some or all of its assets in cash or cash equivalents. The Fund may take such defensive investment positions for as long a period as deemed necessary.
The Fund may not achieve its investment objective while it is investing defensively. Investing defensively may adversely affect Fund performance. During these times, the portfolio managers may make frequent portfolio holding changes, which could result in increased trading expenses and decreased Fund performance. See also Investing in Money Market Funds above for more information.
Other Strategic and Investment Measures
The Fund may also from time to time take temporary portfolio positions that may or may not be consistent with the Fund’s principal investment strategies in attempting to respond to adverse market, economic, political, social or other conditions, including, without limitation, investing in derivatives, such as forward contracts, futures contracts, options, structured investments and swaps, for various purposes, including among others, investing in particular derivatives in seeking to reduce investment exposures, or in seeking to achieve indirect investment exposures, to a sector, country, region or currency where the Investment Manager believes such positioning is appropriate. The Fund may take such portfolio positions for as long a period as deemed necessary. While the Fund is so positioned, derivatives could comprise a substantial portion of the Fund’s investments and the Fund may not achieve its investment objective. Investing in this manner may adversely affect Fund performance. During these times, the portfolio managers may make frequent portfolio holding changes, which could result in increased trading expenses and decreased Fund performance. For information on the risks of investing in derivatives, see Transactions in Derivatives above.
Portfolio Holdings Disclosure
The Board has adopted policies and procedures that govern the timing and circumstances of disclosure to shareholders and third parties of information regarding the securities owned by the Fund. A description of these policies and procedures is included in the SAI. Fund policy generally permits the disclosure of portfolio holdings information on the Fund's website (columbiathreadneedleus.com) only after a certain amount of time has passed, as described in the SAI.
Purchases and sales of portfolio securities can take place at any time, so the portfolio holdings information available on the Fund's website may not always be current.
FUNDamentals
Portfolio Holdings Versus the Benchmarks
The Fund does not limit its investments to the securities within its benchmark(s), and accordingly the Fund's holdings may diverge from those of its benchmark(s). In addition, the Fund may invest in securities outside any industry and geographic sectors represented in its benchmark(s). The Fund's weightings in individual securities, and in industry or geographic sectors, may also vary considerably from those of its benchmark(s).
Cash Flows
The timing and magnitude of cash inflows from investors buying Fund shares could prevent the Fund from always being fully invested. Conversely, the timing and magnitude of cash outflows to shareholders redeeming Fund shares could require the Fund to sell portfolio securities at less than opportune times or to hold ready reserves of uninvested cash in amounts larger than might otherwise be the case to meet shareholder redemptions. Either situation could adversely impact the Fund’s performance.
14
Prospectus 2026
CTIVP® – Westfield Mid Cap Growth Fund
More Information About the Fund (continued)
Understanding Annual Fund Operating Expenses
The Fund’s annual operating expenses, as presented in the Annual Fund Operating Expenses table in the Fees and Expenses of the Fund section of this prospectus, generally are based on expenses incurred during the Fund’s most recently completed fiscal year, may vary by share class and are expressed as a percentage (expense ratio) of the Fund’s average net assets during that fiscal year. The expense ratios reflect the Fund’s fee arrangements as of the date of this prospectus and, unless indicated otherwise, are based on expenses incurred during the Fund’s most recent fiscal year. The Fund’s assets will fluctuate, but unless indicated otherwise in the Annual Fund Operating Expenses table, no adjustments have been or will be made to the expense ratios to reflect any differences in the Fund’s average net assets between the most recently completed fiscal year and the date of this prospectus or a later date. In general, the Fund’s expense ratios will increase as its net assets decrease, such that the Fund’s actual expense ratios may be higher than the expense ratios presented in the Annual Fund Operating Expenses table if assets fall. Any commitment by the Investment Manager and/or its affiliates to waive fees and/or cap (reimburse) expenses is expected, in part, to limit the impact of any increase in the Fund’s expense ratios that would otherwise result because of a decrease in the Fund’s assets in the current fiscal year. The Fund’s annual operating expenses are comprised of (i) investment management fees, (ii) distribution and/or service fees, and (iii) other expenses. Management fees do not vary by class, but distribution and/or service fees and other expenses may vary by class.
FUNDamentals
Other Expenses
“Other expenses” consist of the fees the Fund pays to its custodian, transfer agent, auditors, lawyers and trustees, costs relating to compliance and miscellaneous expenses. Generally, these expenses are allocated on a pro rata basis across all share classes. These fees include certain sub-transfer agency and shareholder servicing fees. For more information on these fees, see About Fund Shares and Transactions — Financial Intermediary Compensation.
Fee Waiver/Expense Reimbursement Arrangements and Impact on Past Performance
The Investment Manager and certain of its affiliates have contractually agreed to waive fees and/or reimburse expenses (excluding certain fees and expenses described below) through April 30, 2027, unless sooner terminated at the sole discretion of the Fund's Board, so that the Fund’s net operating expenses, after giving effect to fees waived/expenses reimbursed and any balance credits and/or overdraft charges from the Fund’s custodian, do not exceed the annual rates of:
| CTIVP® – Westfield Mid Cap Growth Fund | |
| Class 1 |
0.83% |
| Class 2 |
1.08% |
Under the agreement, the following fees and expenses are excluded from the Fund’s operating expenses when calculating the waiver/reimbursement commitment, and therefore will be paid by the Fund, if applicable: taxes (including foreign transaction taxes), expenses associated with investment in affiliated and non-affiliated pooled investment vehicles (including mutual funds and exchange-traded funds), transaction costs and brokerage commissions, costs related to any securities lending program, dividend expenses associated with securities sold short, inverse floater program fees and expenses, transaction charges and interest on borrowed money, interest, costs associated with shareholder meetings, infrequent and/or unusual expenses and any other expenses the exclusion of which is specifically approved by the Fund’s Board. This agreement may be modified or amended only with approval from all parties.
Effect of Fee Waivers and/or Expense Reimbursements on Past Performance. The Fund’s returns shown in the Performance Information section of this prospectus reflect the effect of any fee waivers and/or reimbursements of Fund expenses by the Investment Manager and/or any of its affiliates that were in place during the performance period shown. Without such fee waivers/expense reimbursements, the Fund’s returns might have been lower.
Prospectus 2026
15
CTIVP® – Westfield Mid Cap Growth Fund
More Information About the Fund (continued)
Primary Service Provider Contracts
The Fund enters into contractual arrangements (Service Provider Contracts) with various service providers, including, among others, the Investment Manager, the Distributor, Columbia Management Investment Services Corp. (the Transfer Agent) and the Fund’s custodian. The Fund’s Service Provider Contracts are solely among the parties thereto. Shareholders are not parties to, or intended to be third-party beneficiaries of, any Service Provider Contracts. Further, this prospectus, the SAI and any Service Provider Contracts are not intended to give rise to any agreement, duty, special relationship or other obligation between the Fund and any investor, or give rise to any contractual, tort or other rights in any individual shareholder, group of shareholders or other person, including any right to assert a fiduciary or other duty, enforce the Service Provider Contracts against the parties or to seek any remedy thereunder, either directly or on behalf of the Fund. Nothing in the previous sentence should be read to suggest any waiver of any rights under federal or state securities laws.
The Investment Manager, the Distributor, and the Transfer Agent are all affiliates of Ameriprise Financial, Inc. (Ameriprise Financial). They and their affiliates currently provide key services, including investment advisory, administration, distribution, shareholder servicing and transfer agency services, to the Fund and various other funds, including the Columbia Funds, and are paid for providing these services. These service relationships are described below.
The Investment Manager
Columbia Management Investment Advisers, LLC is located at 290 Congress Street, Boston, MA 02210 and serves as investment adviser and administrator to the Columbia Funds. The Investment Manager is a registered investment adviser and a wholly-owned subsidiary of Ameriprise Financial. The Investment Manager’s management experience covers all major asset classes, including equity securities, debt instruments and money market instruments. In addition to serving as an investment adviser to traditional mutual funds, exchange-traded funds and closed-end funds, the Investment Manager acts as an investment adviser for itself, its affiliates, individuals, corporations, retirement plans, private investment companies and financial intermediaries.
Subject to oversight by the Board, the Investment Manager manages the day-to-day operations of the Fund. The Investment Manager is responsible for the investment management of the Fund, but has delegated certain of its duties, including day-to-day portfolio management of all or a portion of the Fund’s assets to one or more investment subadvisers that determine what securities and other investments the Fund should buy or sell. The Investment Manager is also responsible for overseeing the administrative operations of the Fund, including the general supervision of the Fund’s operations, the coordination of the Fund’s other service providers and the provision of related clerical and administrative services.
The SEC has issued an order that permits the Investment Manager, subject to the approval of the Board, to appoint unaffiliated subadvisers by entering into subadvisory agreements with them, and to change in material respects the terms of those subadvisory agreements, including the fees paid thereunder, for the Fund without first obtaining shareholder approval, thereby avoiding the expense and delays typically associated with obtaining shareholder approval. The Fund furnishes shareholders with information about new subadvisers retained in reliance on the order within 90 days after hiring the subadviser. The Investment Manager and its affiliates may have other relationships, including significant financial relationships, with current or potential subadvisers or their affiliates, which may create certain conflicts of interest. When making recommendations to the Board to appoint or to change a subadviser, or to change the terms of a subadvisory agreement, the Investment Manager discloses to the Board the nature of any such material relationships. The SEC has issued a separate order that permits the Board to approve new subadvisory agreements or material changes to existing subadvisory agreements at a meeting that is not in person, provided that the Trustees are able to participate in the meeting using a means of communication that allows them to hear each other simultaneously during the meeting and other conditions of the order are satisfied.
The Fund pays the Investment Manager a fee for its management services, which include investment advisory services and administrative services. The fee is calculated as a percentage of the daily net assets of the Fund and is paid monthly. For the Fund’s most recent fiscal year, management services fees paid to the Investment Manager by the Fund amounted to 0.81% of average daily net assets of the Fund, before any applicable reimbursements.
16
Prospectus 2026
CTIVP® – Westfield Mid Cap Growth Fund
More Information About the Fund (continued)
A discussion regarding the basis for the Board’s approval of the renewal of the Fund's management agreement is available in the Fund’s Form N-CSR for the fiscal period ended June 30, 2025.
The Investment Manager has, with the approval of the Board, engaged an investment subadviser(s) to make the day-to-day investment decisions for the Fund. The Investment Manager pays the subadviser(s) for investment advisory services and retains ultimate responsibility (subject to Board oversight) for overseeing any subadviser it engages and for evaluating the Fund’s needs and the subadvisers’ skills and abilities on an ongoing basis. Based on its evaluations, the Investment Manager may at times recommend to the Board that the Fund change, add or terminate one or more subadvisers; continue to retain a subadviser even though the subadviser’s ownership or corporate structure has changed; or materially change a subadvisory agreement with a subadviser. A discussion regarding the basis for the Board’s approval of the renewal of the investment subadvisory agreement with Westfield is available in the Fund’s Form N-CSR for the fiscal period ended June 30, 2025.
The date the Subadviser began serving the Fund is set forth under Subadviser below. Any performance of the Fund prior to the date the Subadviser began serving was achieved by one or more different subadvisers. Similarly, the portfolio turnover rate for periods prior to the Subadviser’s management of the Fund was the result of management by one or more different subadvisers. A change in subadvisers may result in increased portfolio turnover.
Subadviser
Westfield, which has served as Subadviser to the Fund since September 2017, is located at One Financial Center, Boston, MA 02111. Westfield, subject to the supervision of Columbia Management, provides day-to-day portfolio management to the Fund, as well as investment research and statistical information under a subadvisory agreement with Columbia Management. Westfield was founded in, and has been a registered investment adviser since, 1989 and provides separate account investment management services for institutions and high net worth individuals.
Portfolio Managers
The Westfield Investment Committee (the “Committee”) is jointly and primarily responsible for the day-to-day investment decision making for the Fund. Investment decisions for the Fund are made by consensus of the Committee, which is chaired by William A. Muggia. Although the Committee collectively acts as portfolio manager for the Fund, Westfield lists the following Committee members, based on seniority and role within the Committee, as having day-to-day management responsibilities for the Fund.
Information about the portfolio managers primarily responsible for overseeing the Fund’s investments is shown below. The SAI provides additional information about the portfolio managers, including information relating to compensation, other accounts managed by the portfolio managers, and ownership by the portfolio managers of Fund shares.
Subadviser: Westfield Capital Management Company, L.P. (Westfield)
| Portfolio Management |
Title |
Role with Fund |
Managed Fund Since |
| William Muggia |
Chief Executive Officer, Chief Investment Officer, and Managing Partner of Westfield |
Co-Portfolio Manager |
2017 |
| Richard Lee, CFA |
Chief Investment Officer and Managing Partner of Westfield |
Co-Portfolio Manager |
2017 |
| Matthew Renna |
Managing Partner of Westfield |
Co-Portfolio Manager |
May 2025 |
| Edward Richardson |
Partner of Westfield |
Co-Portfolio Manager |
May 2025 |
Mr. Muggia joined Westfield in 1994. Mr. Muggia began his investment career in 1983 and earned a B.A. from Middlebury College and an M.B.A. from Harvard Business School.
Mr. Lee joined Westfield in 2004. Mr. Lee began his investment career in 1994 and earned an A.B. from Harvard College.
Mr. Renna joined Westfield in 2013. Mr. Renna began his investment career in 2004 and earned a B.S. and M.S. from Boston University and an M.B.A. from Boston College Carroll School of Management.
Prospectus 2026
17
CTIVP® – Westfield Mid Cap Growth Fund
More Information About the Fund (continued)
Mr. Richardson joined Westfield in 2014. Mr. Richardson began his investment career in 2005 and earned a B.A. from Trinity College and an M.B.A. from Cornell University.
The Distributor
Shares of the Fund are distributed by Columbia Management Investment Distributors, Inc., which is located at 290 Congress Street, Boston, MA 02210. The Distributor is a registered broker-dealer and an indirect, wholly-owned subsidiary of Ameriprise Financial. The Distributor and its affiliates may pay commissions, distribution and service fees and/or other compensation to entities, including Ameriprise Financial affiliates, for selling shares and providing services to investors.
The Transfer Agent
Columbia Management Investment Services Corp. is a registered transfer agent and wholly-owned subsidiary of Ameriprise Financial. The Transfer Agent is located at 290 Congress Street, Boston, MA 02210, and its responsibilities include processing purchases, redemptions and transfers of Fund shares, calculating and paying distributions, maintaining shareholder records, preparing account statements and providing customer service. The Transfer Agent has engaged SS&C GIDS, Inc. to provide various sub-transfer agency services. The Fund pays a service fee to participating insurance companies or other financial intermediaries that provide sub-recordkeeping and other services to Contract owners and the separate accounts. The Transfer Agent may retain as compensation for its services revenues for fees for wire, telephone and redemption orders, account transcripts due the Transfer Agent from Fund shareholders and interest (net of bank charges) earned with respect to balances in accounts the Transfer Agent maintains in connection with its services to the Fund.
Other Roles and Relationships of Ameriprise Financial and its Affiliates — Certain Conflicts of Interest
The Investment Manager, Distributor and Transfer Agent, all affiliates of Ameriprise Financial, provide various services to the Fund and other Columbia Funds for which they are compensated. Ameriprise Financial and its other affiliates may also provide other services to these funds and be compensated for them.
The Investment Manager and its affiliates may provide investment advisory and other services to other clients and customers substantially similar to those provided to the Columbia Funds. These activities, and other financial services activities of Ameriprise Financial and its affiliates, may present actual and potential conflicts of interest and introduce certain investment constraints.
Ameriprise Financial is a major financial services company, engaged in a broad range of financial activities beyond the fund-related activities of the Investment Manager, including, among others, insurance, broker-dealer (sales and trading), asset management, banking and other financial activities. These additional activities may involve multiple advisory, financial, insurance and other interests in securities and other instruments, and in companies that issue securities and other instruments, that may be bought, sold or held by the Columbia Funds.
Conflicts of interest and limitations that could affect a Columbia Fund may arise from, for example, the following:
■
compensation and other benefits received by the Investment Manager and other Ameriprise Financial affiliates related to the management/administration of a Columbia Fund and the sale of its shares;
■
the allocation of, and competition for, investment opportunities among the Fund, other funds and accounts advised/managed by the Investment Manager and other Ameriprise Financial affiliates, or Ameriprise Financial itself and its affiliates;
■
separate and potentially divergent management of a Columbia Fund and other funds and accounts advised/managed by the Investment Manager and other Ameriprise Financial affiliates;
■
regulatory and other investment restrictions on investment activities of the Investment Manager and other Ameriprise Financial affiliates and accounts advised/managed by them;
■
insurance and other relationships of Ameriprise Financial affiliates with companies and other entities in which a Columbia Fund invests;
18
Prospectus 2026
CTIVP® – Westfield Mid Cap Growth Fund
More Information About the Fund (continued)
■
regulatory and other restrictions relating to the sharing of information between Ameriprise Financial and its affiliates, including the Investment Manager, and a Columbia Fund; and
■
insurance companies investing in the Fund may be affiliates of Ameriprise Financial; these affiliated insurance companies, individually and collectively, may hold through separate accounts a significant portion of the Fund's shares and may also invest in separate accounts managed by the Investment Manager that have the same or substantially similar investment objectives and strategies as the Fund.
The Investment Manager and Ameriprise Financial have adopted various policies and procedures that are intended to identify, monitor and address conflicts of interest. However, there is no assurance that these policies, procedures and disclosures will be effective.
Additional information about Ameriprise Financial and the types of conflicts of interest and other matters referenced above is set forth in the Investment Management and Other Services — Other Roles and Relationships of Ameriprise Financial and its Affiliates — Certain Conflicts of Interest section of the SAI. Investors in the Columbia Funds should carefully review these disclosures and consult with their financial advisor if they have any questions.
Certain Legal Matters
Ameriprise Financial and certain of its affiliates are involved, in the normal course of business, in legal proceedings that include regulatory inquiries, arbitration and litigation (including class actions) concerning matters arising in connection with the conduct of their activities as part of a diversified financial services firm. Ameriprise Financial believes that the Fund is not currently the subject of, and that neither Ameriprise Financial nor any of its affiliates are the subject of, any pending legal, arbitration or regulatory proceedings that are likely to have a material adverse effect on the Fund or the ability of Ameriprise Financial or its affiliates to perform under their contracts with the Fund. Information regarding certain pending and settled legal proceedings may be found in the Fund’s Form N-CSR and in the SAI. Additionally, Ameriprise Financial is required to make quarterly (10-Q), annual (10-K) and, as necessary, 8-K filings with the SEC on legal and regulatory matters that relate to Ameriprise Financial and its affiliates. Copies of these filings may be obtained by accessing the SEC website at sec.gov.
Prospectus 2026
19
CTIVP® – Westfield Mid Cap Growth Fund
About Fund Shares and Transactions
Description of the Share Classes
Share Class Features
The Fund offers the classes of shares set forth on the cover of this prospectus. Each share class has its own cost structure and other features. The following summarizes the primary features of the Class 1 and Class 2 shares.
| |
Class 1 Shares |
Class 2 Shares |
| Eligible Investors |
Shares of the Fund are available only to separate accounts of participating insurance companies as underlying investments for variable annuity contracts and/or variable life insurance policies (collectively, Contracts) or qualified pension and retirement plans (Qualified Plans) or other eligible investors authorized by the Distributor. | |
| Investment Limits |
none |
none |
| Conversion Features |
none |
none |
| Front-End Sales Charges |
none |
none |
| Contingent Deferred Sales Charges (CDSCs) |
none |
none |
| Maximum Distribution and/or Service Fees |
none |
0.25% |
FUNDamentals
Financial Intermediaries
The term “financial intermediary” refers to the insurance company that issued your contract, qualified pension or retirement plan sponsors or the financial intermediary that employs your financial advisor. Financial intermediaries also include broker-dealers and financial advisors as well as firms that employ broker-dealers and financial advisors, including, for example, brokerage firms, banks, investment advisers, third party administrators and other firms in the financial services industry, including Ameriprise Financial and its affiliates.
Distribution and/or Service Fees
Pursuant to Rule 12b-1 under the Investment Company Act of 1940, as amended (the 1940 Act), the Board has approved, and the Fund has adopted, a distribution plan which sets the distribution fees that are periodically deducted from the Fund’s assets for Class 2 shares. The distribution fee for Class 2 shares is 0.25%. These fees are calculated daily, may vary by share class and are intended to compensate the Distributor and/or financial intermediaries for selling shares of the Fund and/or providing services to investors. Because the fees are paid out of the Fund’s assets on an ongoing basis, they will increase the cost of your investment over time.
The Fund will pay these fees to the Distributor and/or to eligible financial intermediaries for as long as the distribution plan continues. The Fund may reduce or discontinue payments at any time.
The Fund pays a service fee to participating insurance companies or other financial intermediaries that provide sub-recordkeeping and other services to Contract owners, Qualified Plan participants and the separate accounts.
Financial Intermediary Compensation
The Distributor, the Investment Manager and their affiliates make payments, from their own resources, to financial intermediaries, primarily to affiliated and unaffiliated insurance companies, for marketing/sales support services relating to the Fund (Marketing Support Payments). Such payments are generally based upon one or more of the following factors: average net assets of the Columbia Funds sold by the Distributor attributable to that financial intermediary; gross sales of the Columbia Funds distributed by the Distributor attributable to that financial intermediary; or a negotiated lump sum payment. While the financial arrangements may vary for each financial intermediary, the Marketing Support Payments to any one financial intermediary are generally between 0.05% and 0.40% on an annual basis for payments based on average net assets of the Fund attributable to the financial intermediary, and between 0.05% and 0.25% on an annual basis for a financial intermediary receiving a payment based on gross sales of the Columbia Funds attributable to the financial intermediary.
20
Prospectus 2026
CTIVP® – Westfield Mid Cap Growth Fund
About Fund Shares and Transactions (continued)
As employee compensation and business unit operating goals at all levels are generally tied to the success of Ameriprise Financial, employees of Ameriprise Financial and its affiliates, including employees of affiliated broker-dealers and insurance companies, are incented to include shares of the Columbia Funds in Contracts offered by affiliated insurance companies. Certain employees, directly or indirectly, receive higher compensation and other benefits as investment in the Columbia Funds increases. In addition, management, sales leaders and other employees may spend more of their time and resources promoting Ameriprise Financial and its subsidiary companies, including the Distributor and the Investment Manager, and the products they offer, including the Fund.
In addition, the Transfer Agent has certain arrangements in place to compensate financial intermediaries, primarily to affiliated and unaffiliated insurance companies, that hold Fund shares through networked and omnibus accounts, including omnibus retirement plans, for services that they provide to beneficial Fund shareholders (Shareholder Services). Shareholder Services and related fees vary by financial intermediary and may include sub-accounting, sub-transfer agency, participant recordkeeping, shareholder or participant reporting, shareholder or participant transaction processing, maintenance of shareholder records, preparation of account statements and provision of customer service, and are not intended to include services that are primarily intended to result in the sale of Fund shares. Payments for Shareholder Services generally are not expected, with certain limited exceptions, to exceed 0.40% of the average aggregate value of the Fund’s shares. Each Fund pays the Transfer Agent a service fee equal to the payments made by the Transfer Agent to participating insurance companies and other financial intermediaries that provide Shareholder Services up to the lesser of the amount charged by the financial intermediary or a contractual asset-based cap. Payments of amounts that exceed the amount paid by the Fund are borne by the Transfer Agent, the Investment Manager and/or their affiliates.
In addition to the payments described above, the Distributor, the Investment Manager and their affiliates typically make other payments or allow promotional incentives to certain broker-dealers to the extent permitted by SEC and Financial Industry Regulatory Authority (FINRA) rules and by other applicable laws and regulations.
Amounts paid by the Distributor, the Investment Manager and their affiliates are paid out of their own resources and do not increase the amount paid by you or the Fund. You can find further details in the SAI about the payments made by the Distributor, the Investment Manager and their affiliates, as well as a list of the financial intermediaries, including Ameriprise Financial affiliates, to which the Distributor, the Investment Manager or their affiliates have agreed to make Marketing Support Payments and fee payments for Shareholder Services.
Your financial intermediary may charge you fees and commissions in addition to those described in this prospectus. You should consult with your financial intermediary and review carefully any disclosure your financial intermediary provides regarding its services and compensation. Depending on the financial arrangement in place at any particular time, a financial intermediary and its financial advisors may have a conflict of interest or financial incentive with respect to recommendations regarding the Fund or any Contract or Qualified Plan that includes the Fund.
Share Price Determination
The price you pay or receive when you buy, sell or transfer shares is the Fund's next determined net asset value (or NAV) per share for a given share class. The Fund calculates the NAV per share for each class of shares of the Fund at the end of each business day, with the value of the Fund's shares based on the total value of all of the securities and other assets that it holds as of such specified time.
FUNDamentals
NAV Calculation
Each of the Fund's share classes calculates its NAV per share as follows:
NAV per share = (Value of assets of the share class) – (Liabilities of the share class)
Number of outstanding shares of the class
Number of outstanding shares of the class
Prospectus 2026
21
CTIVP® – Westfield Mid Cap Growth Fund
About Fund Shares and Transactions (continued)
FUNDamentals
Business Days
A business day is any day that the New York Stock Exchange (NYSE) is open. A business day typically ends at the close of regular trading on the NYSE, usually at 4:00 p.m. Eastern time. If the NYSE is scheduled to close early, the business day will be considered to end as of the time of the NYSE’s scheduled close. The Fund will not treat an intraday unscheduled disruption in NYSE trading or an intraday unscheduled closing as a close of regular trading on the NYSE for these purposes and will price its shares as of the regularly scheduled closing time for that day (typically, 4:00 p.m. Eastern time). Nonetheless, the NAV of Fund shares may be determined at such other time or times (in addition to or in lieu of the time set forth above) as the Fund’s Board may approve or ratify. On holidays and other days when the NYSE is closed, the Fund’s NAV is not calculated and the Fund does not accept buy or sell orders. However, the value of the Fund’s assets may still be affected on such days to the extent that the Fund holds foreign securities that trade on days that foreign securities markets are open.
Equity securities listed on an exchange are typically valued at the closing price or last trade on their primary exchange at the close of business of the NYSE. Equity securities without a readily available closing price or that are not listed on any exchange are typically valued at the mean between the closing bid and asked prices. Other equity securities, debt securities and other assets are valued differently. For instance, bank loans trading in the secondary market are fair valued unless market quotations are readily available, fixed income investments maturing in 60 days or less are valued primarily using the amortized cost method, unless this methodology results in a valuation that does not approximate the market value of these securities, and those maturing in excess of 60 days are valued based on prices obtained from a pricing service, if available (which may represent market values or fair values). Investments in other open-end funds are valued at their published NAVs. The value of the Fund’s portfolio securities is determined in accordance with the valuation policy approved by the Board (the Valuation Policy). Pursuant to Rule 2a-5 under the 1940 Act, the Board has designated the Investment Manager as the Fund’s valuation designee. The Investment Manager, in turn, has authorized its valuation committee to make fair value determinations and to carry out supervisory and certain other functions relating to the valuation of Fund portfolio securities, pursuant to the Valuation Policy.
If a market price is not readily available or is deemed not to reflect market value for a portfolio security, the Investment Manager will determine the price based on a determination of the security's fair value pursuant to the Valuation Policy. In addition, the Investment Manager may use fair valuation techniques to price securities that trade on a foreign exchange when a significant event has occurred after the foreign exchange closes but before the time at which the Fund’s share price is calculated. Foreign exchanges typically close before the time at which Fund share prices are calculated, and may be closed altogether on days when the Fund is open. Such significant events affecting a foreign security may include, but are not limited to: (1) corporate actions, earnings announcements, litigation or other events impacting a single issuer; (2) governmental action that affects securities in one sector or country; (3) natural disasters or armed conflicts affecting a country or region; or (4) significant domestic or foreign market fluctuations. The Fund uses various criteria, including an evaluation of U.S. market moves after the close of foreign markets, in determining whether a foreign security's market price is readily available and reflective of market value and, if not, the fair value of the security.
Fair valuation may have the effect of reducing stale pricing arbitrage opportunities presented by the pricing of Fund shares. However, when the Investment Manager uses fair valuation to price equity securities, it may value those securities higher or lower than another fund or manager would. Also, fair valuation of Fund holdings may cause the Fund's performance to diverge to a greater degree from the performance of various benchmark indices used to compare the Fund's performance because indices generally do not use fair valuation techniques. Because of the judgment involved in fair valuation decisions, there can be no assurance that the value ascribed to a particular security is accurate. The Fund has retained one or more independent fair valuation pricing services to assist in the fair valuation process for foreign securities.
22
Prospectus 2026
CTIVP® – Westfield Mid Cap Growth Fund
About Fund Shares and Transactions (continued)
Futures and options on futures are valued based upon the settlement price as determined by the principal exchange on which they are traded or, in the absence of a settlement price, at the mean of the closing bid and ask. Generally, over-the-counter derivatives, such as swaps and swaptions, are valued based on a price provided by an approved pricing service.
Shareholder Information
Each share class has its own cost structure and other features. Your product may not offer every share class. The Fund encourages you to consult with a financial advisor who can help you with your investment decisions and for more information about the share classes offered by the Fund and available under your product. Shares of the Fund are generally available for purchase only by participating insurance companies in connection with Contracts and Qualified Plan sponsors.
The Fund, the Distributor or the Transfer Agent may refuse any order to buy or transfer shares. If this happens, the Fund will return any money it received, but no interest will be paid on that money.
Shares of the Fund may not be purchased or sold directly by individual Contract owners or participants in a Qualified Plan. When you sell your shares through your Contract or Qualified Plan, the Fund is effectively buying them back. This is called a redemption. The right of redemption may be suspended or payment postponed whenever permitted by applicable laws and regulations, as described under Satisfying Fund Redemption Requests below.
Depending on the context, references to “you” or “your” herein refer either to the holder of a Contract, participant in a Qualified Plan or qualified institutional investor who may select Fund shares to fund his or her investment in the Contract or Qualified Plan or to the participating insurance company as the holder of Fund shares through one or more separate accounts or the Qualified Plan.
Satisfying Fund Redemption Requests
The Fund typically expects to send the redeeming participating insurance company or Qualified Plan sponsor payment for shares within two business days after your trade date. The Fund can suspend redemptions and/or delay payment of redemption proceeds for up to seven days. The Fund can also suspend redemptions and/or delay payment of redemption proceeds in excess of seven days under certain circumstances, including when the NYSE is closed or trading thereon is restricted or during emergency or other circumstances, including as determined by the SEC.
The Fund typically seeks to satisfy redemption requests from cash or cash equivalents held by the Fund, from the proceeds of orders to purchase Fund shares or from the proceeds of sales of Fund holdings effected in the normal course of managing the Fund. However, the Fund may have to sell Fund holdings, including in down markets, to meet heavier than usual redemption requests. For example, under stressed or abnormal market conditions or circumstances, including circumstances adversely affecting the liquidity of the Fund’s investments, the Fund may be more likely to be forced to sell Fund holdings to meet redemptions than under normal market circumstances. In these situations, the Fund’s portfolio managers may have to sell Fund holdings that would not otherwise be sold because, among other reasons, the current price to be received is less than the value of the holdings perceived by the Fund’s portfolio managers. The Fund may also, under certain circumstances (but more likely under stressed or abnormal market conditions or circumstances), borrow money under a credit facility to which the Fund and certain other Columbia Funds are parties or from other Columbia Funds under an interfund lending program (except for closed-end funds and money market funds, which are not eligible to borrow under the program). The Fund and the other Columbia Funds are limited as to the amount that each may individually and collectively borrow under the credit facility and the interfund lending program. As a result, borrowings available to the Fund under the credit facility and the interfund lending program might be insufficient, alone or in combination with the other strategies described herein, to satisfy Fund redemption requests. Please see About Fund Investments – Borrowings – Interfund Lending in the SAI for more information about the credit facility and interfund lending program. The Fund is also limited in the total amount it may borrow. The Fund may only borrow to the extent permitted by the 1940 Act, the rules and regulations thereunder, and any exemptive relief available to the Fund, which currently limit Fund borrowings to
Prospectus 2026
23
CTIVP® – Westfield Mid Cap Growth Fund
About Fund Shares and Transactions (continued)
33 1/3% of total assets (including any amounts borrowed) less liabilities (other than borrowings), plus an additional 5% of its total assets for temporary purposes (to be repaid within 60 days without extension or renewal), in each case determined at the time the borrowing is made.
In addition, the Fund reserves the right to honor redemption orders in whole or in part with in-kind distributions of Fund portfolio securities instead of cash if the Investment Manager, in its sole discretion, determines it to be in the best interest of the remaining shareholders. Such in-kind distributions typically represent a pro-rata portion of Fund portfolio assets subject to adjustments (e.g., for non-transferable securities, round lots and derivatives). In the event the Fund distributes portfolio securities in kind, shareholders may incur brokerage and other transaction costs associated with converting the portfolio securities into cash. Also, the portfolio securities may increase or decrease in value after they are distributed but before they are converted into cash. For U.S. federal income tax purposes, redemptions paid in securities are generally treated the same as redemptions paid in cash. If, during any 90-day period, you redeem shares in an amount greater than $250,000 or 1% of the Fund’s net assets (whichever is less), and if the Investment Manager determines it to be feasible and appropriate, the Fund may pay the redemption amount above such threshold by an in-kind distribution of Fund portfolio securities. Although shares of the Fund may not be purchased or sold by individual owners of Contracts or Qualified Plans, this policy applies indirectly to Contract and Qualified Plan owners.
Potential Conflicts of Interest – Mixed and Shared Funding
The Fund is available for purchase only through Contracts offered by participating insurance companies, Qualified Plans and other qualified institutional investors authorized by the Distributor. Due to differences in tax treatment and other considerations, the interests of various Contract owners, and the interests of Qualified Plan participants, if any, may conflict. The Fund does not foresee any disadvantages to investors arising from these potential conflicts of interest at this time. Nevertheless, the Board of the Fund intends to monitor events to identify any material irreconcilable conflicts which may arise, and to determine what action, if any, should be taken in response to any conflicts. If such a conflict were to arise, one or more separate accounts might be required to withdraw its investments in the Fund or shares of another mutual fund may be substituted. This might force the Fund to sell securities at disadvantageous prices.
Order Processing
Orders to buy and sell shares of the Fund that are placed by your participating insurance company or Qualified Plan sponsor are processed on business days. Orders received in “good form” by the Transfer Agent or a financial intermediary, including your participating insurance company or Qualified Plan sponsor, before the end of a business day are priced at the NAV per share of the Fund's applicable share class on that day. Orders received after the end of a business day will receive the next business day’s NAV per share. An order is in “good form” if the Transfer Agent or your financial intermediary has all of the information and documentation it deems necessary to effect your order. The market value of the Fund’s investments may change between the time you submit your order and the time the Fund next calculates its NAV per share. The business day that applies to your order is also called the trade date.
There is no sales charge associated with the purchase of Fund shares, but there may be charges associated with your Contract or Qualified Plan. Any charges that apply to your Contract or Qualified Plan, and any charges that apply to separate accounts of participating insurance companies or Qualified Plans that may own shares directly, are described in your separate Contract prospectus or Qualified Plan disclosure documents.
You may transfer all or part of your investment in the Fund to one or more of the other investment options available under your Contract or Qualified Plan. You may provide instructions to sell any amount allocated to the Fund. Proceeds will be mailed within seven days after your surrender or withdrawal request is received in good form by an authorized agent. The amount you receive may be more or less than the amount you invested.
Please refer to your Contract prospectus or Qualified Plan disclosure documents, as applicable, for more information about transfers as well as surrenders and withdrawals.
24
Prospectus 2026
CTIVP® – Westfield Mid Cap Growth Fund
About Fund Shares and Transactions (continued)
Information Sharing Agreements
As required by Rule 22c-2 under the 1940 Act, the Fund or certain of its service providers will enter into information sharing agreements with financial intermediaries, including participating life insurance companies and financial intermediaries that sponsor or offer retirement plans through which shares of the Fund are made available for purchase. Pursuant to Rule 22c-2, financial intermediaries are required, upon request, to: (i) provide shareholder account and transaction information; and (ii) execute instructions from the Fund to restrict or prohibit further purchases of Fund shares by shareholders who have been identified by the Fund as having engaged in transactions that violate the Fund's excessive trading policies and procedures.
Excessive Trading Practices Policy of Non-Money Market Funds
Right to Reject or Restrict Share Transaction Orders — The Fund is intended for investors with long-term investment purposes and is not intended as a vehicle for frequent trading activity (market timing) that is excessive. Investors should transact in Fund shares primarily for investment purposes. The Board has adopted excessive trading policies and procedures that are designed to deter excessive trading by investors (the Excessive Trading Policies and Procedures). The Fund discourages and does not accommodate excessive trading. Investments in a Fund by institutional investors in connection with redemptions in-kind are exempt from the Excessive Trading Policies and Procedures because they generally do not raise market timing or excessive trading concerns. Further discussion about the Fund’s use of redemptions in-kind is available under Satisfying Fund Redemption Requests.
The Fund reserves the right to reject, without any prior notice, any purchase or transfer order for any reason, and will not be liable for any loss resulting from rejected orders. For example, the Fund may in its sole discretion restrict or reject a purchase or transfer order even if the transaction is not subject to the specific limitation described below if the Fund or its agents determine that accepting the order could interfere with efficient management of the Fund's portfolio or is otherwise contrary to the Fund's best interests. The Excessive Trading Policies and Procedures apply equally to purchase or transfer transactions communicated directly to the Transfer Agent and to those received by financial intermediaries.
Specific Buying and Transferring Limitations — If the Fund detects that an investor has made two “material round trips” in any 28-day period, it will generally reject the investor's future purchase orders, including transfer buy orders, involving any Fund.
For these purposes, a “round trip” is a purchase or transfer into the Fund followed by a sale or transfer out of the Fund, or a sale or transfer out of the Fund followed by a purchase or transfer into the Fund. A “material” round trip is one that is deemed by the Fund to be material in terms of its amount or its potential detrimental impact on the Fund. Independent of this limit, the Fund may, in its sole discretion, reject future purchase orders by any person, group or account that appears to have engaged in any type of excessive trading activity.
These limits generally do not apply to automated transactions or transactions by registered investment companies in a “fund-of-funds” structure. These limits do not apply to payroll deduction contributions by retirement plan participants, transactions initiated by a retirement plan sponsor or certain other retirement plan transactions consisting of rollover transactions, loan repayments and disbursements, and required minimum distribution redemptions. They may be modified or rescinded for accounts held by certain retirement plans to conform to plan limits, for considerations relating to the Employee Retirement Income Security Act of 1974 or regulations of the Department of Labor, and for certain asset allocation or wrap programs. Accounts known to be under common ownership or control generally will be counted together, but accounts maintained or managed by a common intermediary generally will not be considered to be under common ownership or control. The Fund reserves the right to modify these restrictions at any time without prior notice to shareholders. In addition, the Fund may, in its sole discretion, reinstate trading privileges that have been revoked under the Fund's Excessive Trading Policies and Procedures.
Limitations on the Ability to Detect and Prevent Excessive Trading Practices — The Fund takes various steps designed to detect and prevent excessive trading, including daily review of available shareholder transaction information. However, the Fund receives buy, sell or transfer orders through financial intermediaries, and cannot always know of or reasonably detect excessive trading that may be facilitated by financial intermediaries or by the use of the
Prospectus 2026
25
CTIVP® – Westfield Mid Cap Growth Fund
About Fund Shares and Transactions (continued)
omnibus account arrangements they offer. Omnibus account arrangements are common forms of holding shares of mutual funds, particularly among certain financial intermediaries such as broker-dealers, retirement plans and variable insurance products. These arrangements often permit financial intermediaries to aggregate their clients' transactions and accounts, and in these circumstances, the identities of the financial intermediary clients that beneficially own Fund shares are often not known to the Fund.
Some financial intermediaries apply their own restrictions or policies to their clients’ transactions and accounts, which may be more or less restrictive than those described here. This may impact the Fund's ability to curtail excessive trading, even where it is identified. For these and other reasons, it is possible that excessive trading may occur despite the Fund's efforts to detect and prevent it.
Although these restrictions and policies involve judgments that are inherently subjective and may involve some selectivity in their application, the Fund seeks to act in a manner that it believes is consistent with the best interests of Fund shareholders in making any such judgments.
Risks of Excessive Trading — Excessive trading creates certain risks to the Fund's long-term shareholders and may create the following adverse effects:
■
negative impact on the Fund's performance;
■
potential dilution of the value of the Fund's shares;
■
interference with the efficient management of the Fund's portfolio, such as the need to maintain undesirably large cash positions, the need to use its line of credit or the need to buy or sell securities it otherwise would not have bought or sold;
■
losses on the sale of investments resulting from the need to sell securities at less favorable prices; and
■
increased brokerage and administrative costs.
To the extent that the Fund invests significantly in foreign securities traded on markets that close before the Fund's valuation time, it may be particularly susceptible to dilution, which may be exacerbated as a result of excessive trading. Because events may occur after the close of foreign markets and before the Fund's valuation time that influence the value of foreign securities, investors may seek to trade Fund shares in an effort to benefit from their understanding of the value of foreign securities as of the Fund's valuation time. This is often referred to as price arbitrage. The Fund has adopted procedures designed to adjust closing market prices of foreign securities under certain circumstances to reflect what the Fund believes to be the fair value of those securities as of its valuation time. To the extent the adjustments do not work fully, investors engaging in price arbitrage may cause dilution in the value of the Fund's shares held by other shareholders.
Similarly, to the extent that the Fund invests significantly in thinly traded securities and other debt instruments that are rated below investment grade (commonly called “high-yield” or “junk” bonds), equity securities of small-capitalization companies, floating rate loans, or tax-exempt or other securities that may trade infrequently, because these securities are often traded infrequently, investors may seek to trade Fund shares in an effort to benefit from their understanding of the value of these securities as of the Fund's valuation time. This is also a type of price arbitrage. Any such frequent trading strategies may interfere with efficient management of the Fund's portfolio to a greater degree than would be the case for mutual funds that invest only, or significantly, in highly liquid securities, in part because the Fund may have difficulty selling these particular investments at advantageous times or prices to satisfy large and/or frequent sell orders. Any successful price arbitrage may also cause dilution in the value of Fund shares held by non-redeeming shareholders.
Excessive Trading Practices Policy of Columbia Variable Portfolio - Government Money Market Fund
A money market fund is designed to offer investors a liquid cash option that they may buy and sell as often as they wish. Accordingly, the Board has not adopted policies and procedures designed to discourage excessive or short-term trading of Columbia Variable Portfolio - Government Money Market Fund shares. However, since frequent purchases and sales of Columbia Variable Portfolio - Government Money Market Fund shares could in certain instances harm shareholders in various ways, including reducing the returns to long-term shareholders by increasing
26
Prospectus 2026
CTIVP® – Westfield Mid Cap Growth Fund
About Fund Shares and Transactions (continued)
costs (such as spreads paid to dealers who trade money market instruments with Columbia Variable Portfolio - Government Money Market Fund) and disrupting portfolio management strategies, Columbia Variable Portfolio - Government Money Market Fund reserves the right, but has no obligation, to reject any purchase or transfer transaction at any time. Columbia Variable Portfolio - Government Money Market Fund has no limits on purchase or transfer transactions. In addition, Columbia Variable Portfolio - Government Money Market Fund reserves the right to impose or modify restrictions on purchases, transfers or trading of Fund shares at any time.
Prospectus 2026
27
CTIVP® – Westfield Mid Cap Growth Fund
Distributions and Taxes
Distributions to Shareholders
A mutual fund can make money two ways:
■
It can earn income on its investments. Examples of fund income are interest paid on money market instruments and bonds, and dividends paid on common stocks.
■
A mutual fund can also have capital gains if the value of its investments increases.
In the case of the Fund, because the Fund expects to be treated as a partnership for tax purposes, it is not required to and does not expect to make regular distributions to its shareholders (other than in redemption of Fund shares), but may do so in the sole discretion of the Fund’s Board of Trustees (or its delegates).
Taxes and Your Investment
Taxation of the Fund: The Fund is currently treated and expects to continue to be treated as a partnership that is not a “publicly traded partnership” for U.S. federal income tax purposes. If the Fund were not to qualify for such treatment, the Fund could be subject to U.S. federal income tax at the Fund level, which would reduce the value of an investment in the Fund.
As a partnership that is not a “publicly traded partnership,” the Fund is generally not itself subject to U.S. federal income tax. Instead, each shareholder will be required to take into account for U.S. federal income tax purposes its allocable share of the Fund’s income, gains, losses, deductions, credits, and other tax items, without regard to whether such shareholder has received or will receive corresponding distributions from the Fund. In addition, unlike mutual funds that intend to be treated as regulated investment companies for U.S. federal income tax purposes, the Fund is not required to meet any specific qualifying income or distribution requirements, although to the extent regulated investment companies invest in the Fund, such requirements will be taken into account by the Fund.
Certain Fund income may be subject to tax in other countries, including withholding or other taxes on dividends, interest or capital gains. Tax conventions between certain countries and the United States may reduce or eliminate such taxes. In certain countries the Fund may incur a higher rate of tax on dividends than it would have incurred if the Fund had been treated as a regulated investment company.
As a partnership that is not a “publicly traded partnership,” the Fund is generally not itself subject to U.S. federal income tax. Instead, each shareholder will be required to take into account for U.S. federal income tax purposes its allocable share of the Fund’s income, gains, losses, deductions, credits, and other tax items, without regard to whether such shareholder has received or will receive corresponding distributions from the Fund. In addition, unlike mutual funds that intend to be treated as regulated investment companies for U.S. federal income tax purposes, the Fund is not required to meet any specific qualifying income or distribution requirements, although to the extent regulated investment companies invest in the Fund, such requirements will be taken into account by the Fund.
Certain Fund income may be subject to tax in other countries, including withholding or other taxes on dividends, interest or capital gains. Tax conventions between certain countries and the United States may reduce or eliminate such taxes. In certain countries the Fund may incur a higher rate of tax on dividends than it would have incurred if the Fund had been treated as a regulated investment company.
Taxation of Fund Shares: Shares of the Fund are only offered to separate accounts of participating insurance companies, Qualified Plans, and certain other eligible persons or plans permitted to hold shares of the Fund pursuant to the applicable U.S. Treasury Regulations without impairing the ability of participating insurance companies to satisfy the diversification requirements of Section 817(h) of the Internal Revenue Code of 1986, as amended. Each participating insurance company, including each participating insurance company that is an affiliate of the Investment Manager, includes in its taxable income any net investment income derived from the investment of assets held in its separate accounts because the insurance company is considered the owner of these assets under federal income tax law. The insurance company may claim certain tax benefits associated with this investment income, which benefits may be greater with respect to the Fund than if the Fund were treated as a regulated investment company for U.S. federal income tax purposes. These benefits, which may include foreign tax credits (which can reduce the insurance company’s U.S. taxes on foreign source income) and the corporate dividends-received deduction (which is a tax deduction for the insurance company attributable to certain dividends received by the Fund), are not passed on to Contract owners since the affiliated insurance company is the owner of the assets under federal tax law and is taxed on the investment income generated by the assets.
Taxation of Variable Annuity Contracts and Variable Life Insurance Policies: Your Contract may qualify for favorable tax treatment. Please refer to your Contract prospectus for more information about the tax implications of your investment in the Contract. As long as your Contract continues to qualify for such favorable tax treatment, you will not be taxed currently on your investment in the Fund through such Contract, even if the Fund makes allocations or distributions to the separate account and/or you change your investment options under the Contract. In order to qualify for such treatment, among other things, the separate accounts of participating insurance companies, which maintain and invest net proceeds from Contracts, must be “adequately diversified.” The Fund intends to operate in such a manner so that a separate account investing only in Fund shares on behalf of a holder of a Contract will be “adequately diversified.” If the Fund does not meet such requirements because its investments are not adequately
28
Prospectus 2026
CTIVP® – Westfield Mid Cap Growth Fund
Distributions and Taxes (continued)
diversified, your Contract could lose its favorable tax treatment, and income and gain allocable to your Contract could be taxable currently to you. This could also occur if Contract holders are found to have an impermissible level of control over the investments underlying their Contracts or if the Fund does not qualify for treatment as a partnership that is not a “publicly traded partnership.” You should consult with the participating insurance company that issued your Contract, plan sponsor, or other eligible investor through which your investment in the Fund is made regarding the U.S. federal income taxation of your investment.
FUNDamentals
Taxes
The information provided above is only a summary of how U.S. federal income taxes may affect your indirect investment in the Fund. It is not intended as a substitute for careful tax planning. Your investment in the Fund may have other tax implications. It does not apply to certain types of investors who may be subject to special rules, including foreign or tax-exempt investors or those holding Fund shares through a tax-advantaged account other than a Contract, such as a 401(k) plan or IRA. Please see the SAI for more detailed tax information. You should consult with your own tax advisor about the particular tax consequences to you of an investment in the Fund, including the effect of any foreign, state and local taxes, and the effect of possible changes in applicable tax laws.
Prospectus 2026
29
CTIVP® – Westfield Mid Cap Growth Fund
Financial Highlights
The financial highlights table is intended to help you understand the Fund’s financial performance for the past five fiscal years or, if shorter, the Fund’s period of operations. Certain information reflects financial results for a single Fund share. Per share net investment income (loss) amounts are calculated based on average shares outstanding during the period. The total return in the table represents the rate that an investor would have earned (or lost) on an investment in the Fund assuming all dividends and distributions had been reinvested. Total return does not reflect any fees and expenses imposed under your Contract and/or Qualified Plan, as applicable; such fees and expenses would reduce the total return for all periods shown. Total return and portfolio turnover are not annualized for periods of less than one year. The ratios of expenses and net investment income are annualized for periods of less than one year. The portfolio turnover rate is calculated without regard to purchase and sales transactions of short-term instruments and certain derivatives, if any. If such transactions were included, the Fund’s portfolio turnover rate may be higher. A zero balance may reflect an amount rounding to less than $0.01 or 0.01%. This information has been audited by PricewaterhouseCoopers LLP, an independent registered public accounting firm, whose report, along with the Fund’s financial statements, is included in the Fund’s Form N-CSR, which is available upon request.
Prospectus 2026
31
CTIVP® – Westfield Mid Cap Growth Fund
Financial Highlights (continued)
| |
Net asset value, beginning of period |
Net investment income (loss) |
Net realized and unrealized gain (loss) |
Total from investment operations |
| Class 1 | ||||
| Year Ended 12/31/2025 |
$52.53 |
(0.21) |
5.67 |
5.46 |
| Year Ended 12/31/2024 |
$44.71 |
(0.10) |
7.92 |
7.82 |
| Year Ended 12/31/2023 |
$35.63 |
0.06 |
9.02 |
9.08 |
| Year Ended 12/31/2022 |
$47.89 |
0.02 |
(12.28) |
(12.26) |
| Year Ended 12/31/2021 |
$41.03 |
(0.14) |
7.00 |
6.86 |
| Class 2 | ||||
| Year Ended 12/31/2025 |
$50.58 |
(0.33) |
5.45 |
5.12 |
| Year Ended 12/31/2024 |
$43.16 |
(0.21) |
7.63 |
7.42 |
| Year Ended 12/31/2023 |
$34.48 |
(0.03) |
8.71 |
8.68 |
| Year Ended 12/31/2022 |
$46.46 |
(0.07) |
(11.91) |
(11.98) |
| Year Ended 12/31/2021 |
$39.91 |
(0.24) |
6.79 |
6.55 |
| Notes to Financial Highlights | |
| (a) |
In addition to the fees and expenses that the Fund bears directly, the Fund indirectly bears a pro rata share of the fees and expenses of any other funds in which it invests. Such indirect expenses are not included in the Fund's reported expense ratios. |
| (b) |
Total net expenses include the impact of certain fee waivers/expense reimbursements made by the Investment Manager and certain of its affiliates, if applicable. |
| (c) |
Ratios include interfund lending expense which is less than 0.01%. |
32
Prospectus 2026
CTIVP® – Westfield Mid Cap Growth Fund
Financial Highlights (continued)
| |
Net asset value, end of period |
Total return |
Total gross expense ratio to average net assets(a) |
Total net expense ratio to average net assets(a),(b) |
Net investment income (loss) ratio to average net assets |
Portfolio turnover |
Net assets, end of period (000's) |
| Class 1 | |||||||
| Year Ended 12/31/2025 |
$57.99 |
10.40% |
0.86%(c) |
0.82%(c) |
(0.38%) |
80% |
$217,987 |
| Year Ended 12/31/2024 |
$52.53 |
17.49% |
0.86%(c) |
0.82%(c) |
(0.20%) |
72% |
$270,828 |
| Year Ended 12/31/2023 |
$44.71 |
25.48% |
0.85%(c) |
0.83%(c) |
0.15% |
64% |
$300,065 |
| Year Ended 12/31/2022 |
$35.63 |
(25.60%) |
0.84% |
0.84% |
0.06% |
60% |
$291,820 |
| Year Ended 12/31/2021 |
$47.89 |
16.72% |
0.84%(c) |
0.84%(c) |
(0.32%) |
58% |
$391,573 |
| Class 2 | |||||||
| Year Ended 12/31/2025 |
$55.70 |
10.12% |
1.11%(c) |
1.07%(c) |
(0.62%) |
80% |
$35,727 |
| Year Ended 12/31/2024 |
$50.58 |
17.19% |
1.12%(c) |
1.07%(c) |
(0.45%) |
72% |
$35,327 |
| Year Ended 12/31/2023 |
$43.16 |
25.17% |
1.10%(c) |
1.08%(c) |
(0.08%) |
64% |
$32,950 |
| Year Ended 12/31/2022 |
$34.48 |
(25.79%) |
1.09% |
1.09% |
(0.19%) |
60% |
$26,110 |
| Year Ended 12/31/2021 |
$46.46 |
16.41% |
1.09%(c) |
1.09%(c) |
(0.56%) |
58% |
$34,861 |
Prospectus 2026
33
CTIVP® – Westfield Mid Cap Growth Fund

For More Information
The Fund is generally available only to owners of Contracts issued by participating insurance companies and participants in Qualified Plans. Please refer to your Contract prospectus or Qualified Plan disclosure documents for information about how to buy, sell and transfer shares of the Fund.
Additional Information About the Fund
Additional information about the Fund’s investments is available in the Fund’s annual and semiannual reports to shareholders and in Form N-CSR. In the Fund’s annual report, you will find a discussion of the market conditions and investment strategies that significantly affected the Fund’s performance during its last fiscal year. In the Fund’s Form N-CSR, you will find the Fund’s annual and semiannual financial statements. The SAI also provides additional information about the Fund and its policies. The SAI, which has been filed with the SEC, is legally part of this prospectus (incorporated by reference). To obtain these documents free of charge, to request other information about the Fund and to make shareholder inquiries, please contact the Fund as follows:
By Mail: Columbia Management Investment Services Corp.
P.O. Box 219104
Kansas City, MO 64121-9104
P.O. Box 219104
Kansas City, MO 64121-9104
By Telephone: 800.345.6611
Online: columbiathreadneedleus.com
Reports and other information about the Fund are also available in the EDGAR Database on the SEC’s website at http://www.sec.gov. You can receive copies of this information, for a duplication fee, by electronic request at the following e-mail address: publicinfo@sec.gov.
The investment company registration number of Columbia Funds Variable Series Trust II, of which the Fund is a series, is 811-22127.
Columbia Threadneedle Investments (Columbia Threadneedle) is the global brand name of the Columbia and Threadneedle group of companies.
The Fund is distributed by Columbia Management Investment Distributors, Inc., 290 Congress Street, Boston, MA 02210.
The Fund is distributed by Columbia Management Investment Distributors, Inc., 290 Congress Street, Boston, MA 02210.
© 2026 Columbia Threadneedle. All rights reserved.
PRO7040_12_E01_(05/26)

CTIVP® - Westfield Select Large Cap Growth Fund
Prospectus
May 1, 2026
As with all mutual funds, the Securities and Exchange Commission (SEC) has not approved or disapproved these securities or passed upon the adequacy of this prospectus. Any representation to the contrary is a criminal offense.

CTIVP® – Westfield Select Large Cap Growth Fund
Table of Contents
| 3 | |
| 3 | |
| 3 | |
| 3 | |
| 4 | |
| 6 | |
| 7 | |
| 7 | |
| 7 | |
| 8 | |
| 9 | |
| 9 | |
| 9 | |
| 10 | |
| 13 | |
| 16 | |
| 19 | |
| 19 | |
| 21 | |
| 21 | |
| 21 | |
| 22 | |
| 24 | |
| 29 | |
| 29 | |
| 29 | |
| 31 |
2
Prospectus 2026
CTIVP® – Westfield Select Large Cap Growth Fund
Summary of the Fund
Investment Objective
CTIVP® – Westfield Select Large Cap Growth Fund (the Fund) seeks to provide shareholders with long-term capital growth.
Fees and Expenses of the Fund
This table describes the fees and expenses that you may pay as an investor in the Fund. The table does not reflect any fees or expenses imposed by your Contract or Qualified Plan, which are disclosed in your separate Contract prospectus or Qualified Plan disclosure documents. If the additional fees or expenses were reflected, the expenses set forth below would be higher.
| Annual Fund Operating Expenses (expenses that you pay each year as a percentage of the value of your investment) | ||
| |
Class 1 |
Class 2 |
| Management fees |
% |
% |
| Distribution and/or service (12b-1) fees |
% |
% |
| Other expenses |
% |
% |
| Total annual Fund operating expenses(a) |
% |
% |
(a)
The following example is intended to help you compare the cost of investing in the Fund with the cost of investing in other mutual funds. The example illustrates the hypothetical expenses that you would incur over the time periods indicated, and assumes that:
■
you invest $10,000 in the applicable class of Fund shares for the periods indicated,
■
your investment has a 5% return each year, and
■
the Fund’s total annual operating expenses remain the same as shown in the Annual Fund Operating Expenses table above.
The example does not reflect any fees and expenses that apply to your Contract or Qualified Plan. Inclusion of these charges would increase expenses for all periods shown.
Although your actual costs may be higher or lower, based on the assumptions listed above, your costs would be:
| |
1 year |
3 years |
5 years |
10 years |
| Class 1 (whether or not shares are redeemed) |
$ |
$ |
$ |
$ |
| Class 2 (whether or not shares are redeemed) |
$ |
$ |
$ |
$ |
Portfolio Turnover
The Fund may pay transaction costs, such as commissions, when it buys and sells securities (or “turns over” its portfolio). A higher portfolio turnover rate may indicate higher transaction costs. These costs, which are not reflected in annual fund operating expenses or in the example, affect the Fund’s performance. During the most recent fiscal year, the Fund’s portfolio turnover rate was 68 % of the average value of its portfolio.
Principal Investment Strategies
Under normal circumstances, the Fund invests at least 80% of its net assets (plus the amount of any borrowings for investment purposes) in equity securities of large-capitalization companies. The Fund defines large-capitalization companies as those companies with a market capitalization that falls within the range of the companies that
Prospectus 2026
3
CTIVP® – Westfield Select Large Cap Growth Fund
Summary of the Fund (continued)
comprise the Russell 1000® Growth Index (the Capitalization Index). The market capitalization range of the companies included within the Capitalization Index was $134.5 million to $4.2 trillion as of March 31, 2026. The market capitalization range and composition of companies in the Capitalization Index are subject to change. As such, the size of the companies in which the Fund invests may change. The Fund may continue to hold a security even if the company’s market capitalization is no longer within the range of the Capitalization Index. Under normal circumstances, the Fund also invests at least 80% of its net assets (plus the amount of any borrowings for investment purposes) in equity securities of “growth” companies. The Fund considers “growth” companies to be those companies that are either constituents of an index constructed by a third party to identify companies with various characteristics of growth companies, have a higher Institutional Brokers' Estimate System (I/B/E/S) medium-term growth forecast (two year) than the median ranked stock within the company’s GICS sector, or have a higher sales per share historical growth rate (five year) than the median ranked stock within the company’s GICS sector. The third-party broad-based index currently used to identify growth companies is the Russell 3000® Growth Index, although the Fund may change this index without prior notice. The I/B/E/S is a database used by brokers and investors to access the estimates made by stock analysts regarding the future earnings of publicly traded American companies. The I/B/E/S medium term growth forecast is a measure of the average annualized EPS (earnings per share) growth forecast of contributing analysts/estimators for the forthcoming two years.
The Fund may at times emphasize one or more sectors in selecting its investments, including the industrials and information technology sectors. The Fund typically employs a focused portfolio investing style, which results in fewer holdings than a fund that seeks to achieve its investment objective by investing in a greater number of issuers.
Principal Risks
An investment in the Fund involves risks, including Market Risk, Large-Cap Stock Risk, Growth Securities Risk, Sector Risk, and Focused Portfolio Risk, among others. Descriptions of these and other principal risks of investing in the Fund are provided below. There is no assurance that the Fund will achieve its investment objective and you may lose money . The value of the Fund’s holdings may decline, and the Fund’s net asset value (NAV) and share price may go down. An investment in the Fund is not a bank deposit and is not insured or guaranteed by the Federal Deposit Insurance Corporation or any other government agency. The significance of any specific risk to an investment in the Fund will vary over time depending on the composition of the Fund's portfolio, market conditions, and other factors. You should read all of the risk information below carefully, because any one or more of these risks may result in losses to the Fund.
Active Management Risk. Due to its active management, the Fund could underperform its benchmark index and/or other funds with similar investment objectives and/or strategies.
Depositary Receipts Risk. Depositary receipts are receipts issued by a bank or trust company reflecting ownership of underlying securities issued by foreign companies. Some foreign securities are traded in the form of American Depositary Receipts and/or Global Depositary Receipts. Depositary receipts involve risks similar to the risks associated with investments in foreign securities, including those associated with an issuer’s (and any of its related companies’) country of organization and places of business operations, which may be related to the particular political, regulatory, economic, social and other conditions or events (including, for example, military confrontations and actions, war, other conflicts, terrorism and disease/virus outbreaks and epidemics) occurring in the country and fluctuations in such country’s currency, as well as market risk tied to the underlying foreign company. In addition, holders of depositary receipts may have limited voting rights, may not have the same rights afforded to stockholders of a typical domestic company in the event of a corporate action, such as an acquisition, merger or rights offering, and may experience difficulty in receiving company stockholder communications. There is no guarantee that a financial institution will continue to sponsor a depositary receipt, or that a depositary receipt will continue to trade on an exchange, either of which could adversely affect the liquidity, availability and pricing of the depositary receipt. Changes in foreign currency exchange rates will affect the value of depositary receipts and, therefore, may affect the value of your investment in the Fund.
Equity Securities Risk. Equity securities may experience significant volatility. Such securities may fall sharply in response to adverse events affecting overall markets, a particular industry or sector, or an individual company’s financial condition.
4
Prospectus 2026
CTIVP® – Westfield Select Large Cap Growth Fund
Summary of the Fund (continued)
Focused Portfolio Risk. Because the Fund may invest in a limited number of companies, the Fund as a whole is subject to greater risk of loss if any of those securities decline in price.
Foreign Securities Risk. Investments in or exposure to securities of foreign companies may involve heightened risks relative to investments in or exposure to securities of U.S. companies. Investing in securities of foreign companies subjects the Fund to the risks associated with an issuer’s (and any of its related companies’) country of organization and places of business operations, including risks related to political, regulatory, economic, social, diplomatic and other conditions or events (including, for example, military confrontations and actions, war, other conflicts, terrorism and disease/virus outbreaks and epidemics) occurring in the country or region, as well as risks associated with less developed custody and settlement practices. Foreign securities may be more volatile and less liquid than securities of U.S. companies and are subject to the risks associated with potential imposition of economic and other sanctions against a particular foreign country, its nationals or industries or businesses within the country. In addition, foreign governments may impose withholding or other taxes on the Fund’s income, capital gains or proceeds from the disposition of foreign securities, which could reduce the Fund’s return on such securities. The performance of the Fund may also be negatively affected by fluctuations in a foreign currency's strength or weakness relative to the U.S. dollar, particularly to the extent the Fund invests a significant percentage of its assets in foreign securities or other assets denominated in currencies other than the U.S. dollar.
Growth Securities Risk. Growth securities typically trade at a higher multiple of earnings than other types of equity securities. Accordingly, the market values of growth securities may never reach their expected market value and may decline in price. In addition, growth securities, at times, may not perform as well as value securities or the stock market in general, and may be out of favor with investors for varying periods of time. Growth securities may also be sensitive to movements in interest rates.
Issuer Risk. An issuer in which the Fund invests or to which it has exposure may perform poorly or below expectations, and the value of its securities may therefore decline, which may negatively affect the Fund’s performance. Underperformance of an issuer may be caused by poor management decisions, competitive pressures, breakthroughs in technology, reliance on suppliers, labor problems or shortages, corporate restructurings, fraudulent disclosures, natural disasters, military confrontations and actions, war, other conflicts, terrorism, disease/virus outbreaks, epidemics or other events, conditions and factors which may impair the value of your investment in the Fund.
■
Large-Cap Stock Risk. Investments in larger, more established companies (larger companies) may involve certain risks associated with their larger size. For instance, larger companies may be less able to respond quickly to new competitive challenges, such as changes in consumer tastes or innovation from smaller competitors. Also, larger companies are sometimes less able to achieve as high growth rates as successful smaller companies, especially during extended periods of economic expansion.
Market Risk. The Fund may incur losses due to declines in the value of one or more securities in which it invests. These declines may be due to factors affecting a particular issuer, or the result of, among other things, political, regulatory, market, economic or social developments affecting the relevant market(s) more generally. In addition, turbulence in financial markets and reduced liquidity in equity, credit and/or fixed income markets may negatively affect many issuers, which could adversely affect the Fund’s ability to price or value hard-to-value assets in thinly traded and closed markets and could cause significant redemptions and operational challenges. Global economies and financial markets are increasingly interconnected, and conditions and events in one country, region or financial market may adversely impact issuers in a different country, region or financial market. These risks may be magnified if certain events or developments adversely interrupt the global supply chain; in these and other circumstances, such risks might affect companies worldwide. As a result, local, regional or global events such as terrorism, war, other conflicts, natural disasters, disease/virus outbreaks and epidemics or other public health issues, recessions, depressions or other events – or the potential for such events – could have a significant negative impact on global economic and market conditions.
Prospectus 2026
5
CTIVP® – Westfield Select Large Cap Growth Fund
Summary of the Fund (continued)
Sector Risk. At times, the Fund may have a significant portion of its assets invested in securities of companies conducting business in a related group of industries within one or more economic sectors, including the industrials and information technology sectors. Companies in the same sector may be similarly affected by economic, regulatory, political or market events or conditions, which may make the Fund vulnerable to unfavorable developments in that group of industries or economic sector.
■
Industrials Sector. The Fund is vulnerable to the particular risks that may affect companies in the industrials sector. Companies in the industrials sector are subject to certain risks, including changes in supply and demand for their specific product or service and for industrial sector products in general, including decline in demand for such products due to rapid technological developments and frequent new product introduction. Performance of such companies may be affected by factors including government regulation, world events, economic conditions and risks for environmental damage and product liability claims.
■
Information Technology Sector. The Fund is vulnerable to the particular risks that may affect companies in the information technology sector. Companies in the information technology sector are subject to certain risks, including the risk that new services, equipment or technologies will not be accepted by consumers and businesses or will become rapidly obsolete. Performance of such companies may be affected by factors including obtaining and protecting patents (or the failure to do so) and significant competitive pressures, including aggressive pricing of their products or services, new market entrants, competition for market share and short product cycles due to an accelerated rate of technological developments. Such competitive pressures may lead to limited earnings and/or falling profit margins. As a result, the value of their securities may fall or fail to rise. In addition, many information technology sector companies have limited operating histories and prices of these companies’ securities historically have been more volatile than other securities, especially over the short term. Some companies in the information technology sector are facing increased government and regulatory scrutiny and may be subject to adverse government or regulatory action, which could negatively impact the value of their securities.
Performance Information
The following bar chart and table show you how the Fund has performed in the past, and can help you understand the risks of investing in the Fund. The bar chart shows how the Fund’s Class 2 share performance has varied for each full calendar year shown. The table below the bar chart compares the Fund’s returns for the periods shown with a broad measure of market performance, as well as another measure of performance for markets in which the Fund may invest.
Except for differences in annual returns resulting from differences in expenses (where applicable), the share classes of the Fund would have substantially similar annual returns because all share classes of the Fund invest in the same portfolio of securities.
The returns shown do not reflect any fees and expenses imposed under your Contract or Qualified Plan and would be lower if they did.
The Fund’s performance prior to May 2024 reflects returns achieved by one or more different subadviser(s) that managed the Fund according to different principal investment strategies. If the Fund’s current subadviser and strategies had been in place for the prior periods, results shown may have been different.
6
Prospectus 2026
CTIVP® – Westfield Select Large Cap Growth Fund
Summary of the Fund (continued)
| |
Best and Worst Quarterly Returns During the Period Shown in the Bar Chart | ||
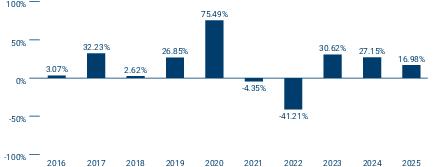 |
|
|
|
| |
|
- | |
| |
Share Class Inception Date |
1 Year |
5 Years |
10 Years |
| Class 1 |
|
|
|
|
| Class 2 |
|
|
|
|
| Russell 1000® Growth Index (reflects no deductions for fees, expenses or taxes) |
|
|
|
|
| Russell 1000® Index (reflects no deductions for fees, expenses or taxes) |
|
|
|
|
Fund Management
Investment Manager: Columbia Management Investment Advisers, LLC
Subadviser: Westfield Capital Management Company, L.P. (Westfield)
| Portfolio Management |
Title |
Role with Fund |
Managed Fund Since |
| William Muggia |
Chief Executive Officer, Chief Investment Officer, and Managing Partner of Westfield |
Portfolio Manager |
2024 |
Purchase and Sale of Fund Shares
The Fund is available for purchase through Contracts offered by the separate accounts of participating insurance companies or Qualified Plans or by other eligible investors authorized by Columbia Management Investment Distributors, Inc. (the Distributor). Shares of the Fund may not be purchased or sold by individual owners of Contracts or Qualified Plans. If you are a Contract holder or Qualified Plan participant, please refer to your separate Contract prospectus or Qualified Plan disclosure documents for information about minimum investment requirements and how to purchase and redeem shares of the Fund on days the Fund is open for business.
Tax Information
The Fund expects to be treated as a partnership for U.S. federal income tax purposes, and does not expect to make regular distributions (other than in redemption of Fund shares) to shareholders which are generally the participating insurance companies investing in the Fund through separate accounts or Qualified Plans or certain other eligible investors authorized by the Distributor. You should consult with the participating insurance company that issued your Contract, plan sponsor or other eligible investor through which your investment in the Fund is made regarding the U.S. federal income taxation of your investment.
Prospectus 2026
7
CTIVP® – Westfield Select Large Cap Growth Fund
Summary of the Fund (continued)
Payments to Broker-Dealers and Other Financial Intermediaries
If you make allocations to the Fund, the Fund, its Distributor or other related companies may pay participating insurance companies or other financial intermediaries for the allocation (sale) of Fund shares and related services in connection with such allocations to the Fund. These payments may create a conflict of interest by influencing the participating insurance company, other financial intermediary or your salesperson to recommend an allocation to the Fund over another fund or other investment option. Ask your financial advisor or salesperson or visit your financial intermediary’s website for more information.
8
Prospectus 2026
CTIVP® – Westfield Select Large Cap Growth Fund
More Information About the Fund
Investment Objective
CTIVP® – Westfield Select Large Cap Growth Fund (the Fund) seeks to provide shareholders with long-term capital growth. The Fund’s investment objective is not a fundamental policy and may be changed by the Fund’s Board of Trustees without shareholder approval as long as shareholders are given 60 days’ advance written notice of the change. Because any investment involves risk, there is no assurance the Fund’s investment objective will be achieved.
Principal Investment Strategies
Under normal circumstances, the Fund invests at least 80% of its net assets (plus the amount of any borrowings for investment purposes) in equity securities of large-capitalization companies. The Fund defines large-capitalization companies as those companies with a market capitalization that falls within the range of the companies that comprise the Russell 1000® Growth Index (the Capitalization Index). The market capitalization range of the companies included within the Capitalization Index was $134.5 million to $4.2 trillion as of March 31, 2026. The market capitalization range and composition of companies in the Capitalization Index are subject to change. As such, the size of the companies in which the Fund invests may change. The Fund may continue to hold a security even if the company’s market capitalization is no longer within the range of the Capitalization Index. Under normal circumstances, the Fund also invests at least 80% of its net assets (plus the amount of any borrowings for investment purposes) in equity securities of “growth” companies. The Fund considers “growth” companies to be those companies that are either constituents of an index constructed by a third party to identify companies with various characteristics of growth companies, have a higher Institutional Brokers' Estimate System (I/B/E/S) medium-term growth forecast (two year) than the median ranked stock within the company’s GICS sector, or have a higher sales per share historical growth rate (five year) than the median ranked stock within the company’s GICS sector. The third-party broad-based index currently used to identify growth companies is the Russell 3000® Growth Index, although the Fund may change this index without prior notice. The I/B/E/S is a database used by brokers and investors to access the estimates made by stock analysts regarding the future earnings of publicly traded American companies. The I/B/E/S medium term growth forecast is a measure of the average annualized EPS (earnings per share) growth forecast of contributing analysts/estimators for the forthcoming two years.
The Fund may at times emphasize one or more sectors in selecting its investments, including the industrials and information technology sectors. The Fund typically employs a focused portfolio investing style, which results in fewer holdings than a fund that seeks to achieve its investment objective by investing in a greater number of issuers.
Columbia Management Investment Advisers, LLC (Columbia Management or the Investment Manager) serves as the investment manager to the Fund and is responsible for the oversight of, including the establishment of risk management parameters for, the Fund’s subadviser, Westfield Capital Management Company, L.P. (Westfield or the Subadviser), which provides day-to-day portfolio management to the Fund.
The Fund invests primarily in stocks of growth companies that Westfield believes have a demonstrated record of achievement with excellent prospects for earnings growth over a 1- to 3-year period.
In choosing securities, Westfield looks for companies with underappreciated earnings growth, given their belief that stock prices ultimately follow earnings growth, and asymmetrical risk/rewards. The Fund invests in companies that Westfield believes have shown above average and consistent long-term growth in earnings, excellent prospects for future growth, a durable competitive advantage and/or reasonable valuation.
The Fund generally will sell a security if one or more of the following occurs: Westfield’s predetermined price target objective is exceeded; there is an alteration to the original investment case; deteriorating fundamental trends changed Westfield’s outlook; or Westfield believes better risk/reward opportunities may be found in other stocks.
The Fund’s investment policies with respect to 80% of its net assets may be changed by the Fund’s Board of Trustees without shareholder approval as long as shareholders are given 60 days’ advance written notice of the change.
Prospectus 2026
9
CTIVP® – Westfield Select Large Cap Growth Fund
More Information About the Fund (continued)
Principal Risks
An investment in the Fund involves risks, including Market Risk, Large-Cap Stock Risk, Growth Securities Risk, Sector Risk, and Focused Portfolio Risk, among others. Descriptions of these and other principal risks of investing in the Fund are provided below. There is no assurance that the Fund will achieve its investment objective and you may lose money. The value of the Fund’s holdings may decline, and the Fund’s net asset value (NAV) and share price may go down. An investment in the Fund is not a bank deposit and is not insured or guaranteed by the Federal Deposit Insurance Corporation or any other government agency. The significance of any specific risk to an investment in the Fund will vary over time depending on the composition of the Fund's portfolio, market conditions, and other factors. You should read all of the risk information below carefully, because any one or more of these risks may result in losses to the Fund.
Active Management Risk. The Fund is actively managed and its performance therefore will reflect, in part, the ability of the portfolio manager to make investment decisions that seek to achieve the Fund’s investment objective. Due to its active management, the Fund could underperform its benchmark index and/or other funds with similar investment objectives and/or strategies.
Depositary Receipts Risk. Depositary receipts are receipts issued by a bank or trust company reflecting ownership of underlying securities issued by foreign companies. Some foreign securities are traded in the form of American Depositary Receipts and/or Global Depositary Receipts. Depositary receipts involve risks similar to the risks associated with investments in foreign securities, including those associated with an issuer’s (and any of its related companies’) country of organization and places of business operations, which may be related to the particular political, regulatory, economic, social and other conditions or events (including, for example, military confrontations and actions, war, other conflicts, terrorism and disease/virus outbreaks and epidemics) occurring in the country and fluctuations in such country’s currency, as well as market risk tied to the underlying foreign company. In addition, holders of depositary receipts may have limited voting rights, may not have the same rights afforded to stockholders of a typical domestic company in the event of a corporate action, such as an acquisition, merger or rights offering, and may experience difficulty in receiving company stockholder communications. There is no guarantee that a financial institution will continue to sponsor a depositary receipt, or that a depositary receipt will continue to trade on an exchange, either of which could adversely affect the liquidity, availability and pricing of the depositary receipt. Changes in foreign currency exchange rates will affect the value of depositary receipts and, therefore, may affect the value of your investment in the Fund.
Equity Securities Risk. Investments in equity securities represent ownership in a company that fluctuates in value with changes in the company’s financial condition. Equity markets may experience significant volatility at times and may fall sharply in response to adverse events. Certain segments of the equity market may react differently than other segments and U.S. markets may react differently than foreign markets. Individual equity prices also may experience dramatic movements in price. Price movements may result from factors affecting individual companies, sectors, or industries selected for the Fund’s portfolio or the securities market as a whole, including periods of slower growth or recessionary economic conditions, future expectations of poor economic conditions, changes in political or social conditions, and lack of investor confidence. In addition, individual equity interests may be adversely affected by factors such as reduced sales, increased costs, or a negative outlook for the future performance of the company. As compared with preferred stock and debt, common stock generally involves greater risk and has lower priority when liquidation, bankruptcy, and dividend payments are made. Preferred stock may be subordinated to bonds or other debt instruments in a company’s capital structure and is typically less liquid than common stock.
Focused Portfolio Risk. The Fund, because it may invest in a limited number of companies, may have more volatility in its NAV and is considered to have more risk than a fund that invests in a greater number of companies because changes in the value of a single security may have a more significant effect, either negative or positive, on the Fund’s NAV. To the extent the Fund invests its assets in fewer securities, the Fund is subject to greater risk of loss if any of those securities decline in price.
Foreign Securities Risk. Investments in or exposure to securities of foreign companies may involve heightened risks relative to investments in or exposure to securities of U.S. companies. For example, foreign markets can be extremely volatile. Foreign securities may also be less liquid, making them more difficult to trade, than securities of
10
Prospectus 2026
CTIVP® – Westfield Select Large Cap Growth Fund
More Information About the Fund (continued)
U.S. companies so that the Fund may, at times, be unable to sell foreign securities at desirable times or prices. Brokerage commissions, custodial costs and other fees are also generally higher for foreign securities. The Fund may have limited or no legal recourse in the event of default with respect to certain foreign securities, including those issued by foreign governments. In addition, foreign governments may impose withholding or other taxes on the Fund’s income, capital gains or proceeds from the disposition of foreign securities, which could reduce the Fund’s return on such securities. In some cases, such withholding or other taxes could potentially be confiscatory. Other risks include: possible delays in the settlement of transactions or in the payment of income; generally less publicly available information about foreign companies; the impact of economic, political, social, diplomatic or other conditions or events (including, for example, military confrontations and actions, war, other conflicts, terrorism and disease/virus outbreaks and epidemics), possible seizure, expropriation or nationalization of a company or its assets or the assets of a particular investor or category of investors; accounting, auditing and financial reporting standards that may be less comprehensive and stringent than those applicable to domestic companies; the imposition of economic and other sanctions against a particular foreign country, its nationals or industries or businesses within the country; and the generally less stringent standard of care to which local agents may be held in the local markets. In addition, it may be difficult to obtain reliable information about the securities and business operations of certain foreign issuers. Governments or trade groups may compel local agents to hold securities in designated depositories that are not subject to independent evaluation. The less developed a country’s securities market is, the greater the level of risks. Economic sanctions may be, and have been, imposed against certain countries, organizations, companies, entities and/or individuals. Economic sanctions and other similar governmental actions could, among other things, effectively restrict or eliminate the Fund’s ability to purchase or sell securities, and thus may make the Fund’s investments in such securities less liquid or more difficult to value. In addition, as a result of economic sanctions, the Fund may be forced to sell or otherwise dispose of investments at inopportune times or prices, which could result in losses to the Fund and increased transaction costs. These conditions may be in place for a substantial period of time and enacted with limited advance notice to the Fund. The risks posed by sanctions against a particular foreign country, its nationals or industries or businesses within the country may be heightened to the extent the Fund invests significantly in the affected country or region or in issuers from the affected country that depend on global markets. Additionally, investments in certain countries may subject the Fund to a number of tax rules, the application of which may be uncertain. Countries may amend or revise their existing tax laws, regulations and/or procedures in the future, possibly with retroactive effect. Changes in or uncertainties regarding the laws, regulations or procedures of a country could reduce the after-tax profits of the Fund, directly or indirectly, including by reducing the after-tax profits of companies located in such countries in which the Fund invests, or result in unexpected tax liabilities for the Fund. The performance of the Fund may also be negatively affected by fluctuations in a foreign currency's strength or weakness relative to the U.S. dollar, particularly to the extent the Fund invests a significant percentage of its assets in foreign securities or other assets denominated in currencies other than the U.S. dollar. Currency rates in foreign countries may fluctuate significantly over short or long periods of time for a number of reasons, including changes in interest rates, imposition of currency exchange controls and economic or political developments in the U.S. or abroad. The Fund may also incur currency conversion costs when converting foreign currencies into U.S. dollars and vice versa.
Growth Securities Risk. Growth securities typically trade at a higher multiple of earnings than other types of equity securities. Accordingly, the market values of growth securities may never reach their expected market value and may decline in price. In addition, growth securities, at times, may not perform as well as value securities or the stock market in general, and may be out of favor with investors for varying periods of time. Growth securities may also be sensitive to movements in interest rates.
Issuer Risk. An issuer in which the Fund invests or to which it has exposure may perform poorly or below expectations, and the value of its securities may therefore decline, which may negatively affect the Fund’s performance. Underperformance of an issuer may be caused by poor management decisions, competitive pressures, breakthroughs in technology, reliance on suppliers, labor problems or shortages, corporate restructurings, fraudulent disclosures, natural disasters, military confrontations and actions, war, other conflicts, terrorism, disease/virus outbreaks, epidemics or other events, conditions and factors which may impair the value of your investment in the Fund.
Prospectus 2026
11
CTIVP® – Westfield Select Large Cap Growth Fund
More Information About the Fund (continued)
■
Large-Cap Stock Risk. Investments in larger, more established companies (larger companies) may involve certain risks associated with their larger size. For instance, larger companies may be less able to respond quickly to new competitive challenges, such as changes in consumer tastes or innovation from smaller competitors. Also, larger companies are sometimes less able to achieve as high growth rates as successful smaller companies, especially during extended periods of economic expansion.
Market Risk. The Fund may incur losses due to declines in the value of one or more securities in which it invests. These declines may be due to factors affecting a particular issuer, or the result of, among other things, political, regulatory, market, economic or social developments affecting the relevant market(s) more generally. In addition, turbulence in financial markets and reduced liquidity in equity, credit and/or fixed income markets may negatively affect many issuers, which could adversely affect the Fund’s ability to price or value hard-to-value assets in thinly traded and closed markets and could cause significant redemptions and operational challenges. Global economies and financial markets are increasingly interconnected, and conditions and events in one country, region or financial market may adversely impact issuers in a different country, region or financial market. These risks may be magnified if certain events or developments adversely interrupt the global supply chain; in these and other circumstances, such risks might affect companies worldwide. As a result, local, regional or global events such as terrorism, war, other conflicts, natural disasters, disease/virus outbreaks and epidemics or other public health issues, recessions, depressions or other events – or the potential for such events – could have a significant negative impact on global economic and market conditions.
The large-scale invasion of Ukraine by Russia in February 2022 has resulted in sanctions and market disruptions, including declines in regional and global stock markets, unusual volatility in global commodity markets and significant devaluations of Russian currency. In addition, the Iranian conflict that commenced in February 2026 may result in similar, and potentially more severe, disruptions. Escalation of hostilities in the Middle East region could disrupt energy production or transportation, including through key shipping routes, which may lead to increased volatility in energy and other commodity prices. The extent and duration of these conflicts are impossible to predict but could continue to be significant. Market disruption caused by these conflicts, and any countermeasures or responses thereto (including international sanctions, a downgrade in a country’s credit rating, purchasing and financing restrictions, boycotts, tariffs, changes in consumer or purchaser preferences, cyberattacks and espionage) could continue to have severe adverse impacts on regional and/or global securities and commodities markets, including markets for oil and natural gas. These impacts may include reduced market liquidity, distress in credit markets, further disruption of global supply chains, increased risk of inflation, and limited access to investments in certain international markets and/or issuers. These developments and other related events could negatively impact Fund performance.
Sector Risk. At times, the Fund may have a significant portion of its assets invested in securities of companies conducting business in a related group of industries within one or more economic sectors, including the industrials and information technology sectors. Companies in the same sector may be similarly affected by economic, regulatory, political or market events or conditions, which may make the Fund vulnerable to unfavorable developments in that group of industries or economic sector.
■
Industrials Sector. The Fund is vulnerable to the particular risks that may affect companies in the industrials sector. Companies in the industrials sector are subject to certain risks, including changes in supply and demand for their specific product or service and for industrial sector products in general, including decline in demand for such products due to rapid technological developments and frequent new product introduction. Performance of such companies may be affected by factors including government regulation, world events, economic conditions and risks for environmental damage and product liability claims.
■
Information Technology Sector. The Fund is vulnerable to the particular risks that may affect companies in the information technology sector. Companies in the information technology sector are subject to certain risks, including the risk that new services, equipment or technologies will not be accepted by consumers and businesses or will become rapidly obsolete. Performance of such companies may be affected by factors including obtaining and protecting patents (or the failure to do so) and significant competitive pressures, including aggressive pricing of their products or services, new market entrants, competition for market share and short product cycles due to an accelerated rate of technological developments. Such competitive pressures may lead to
12
Prospectus 2026
CTIVP® – Westfield Select Large Cap Growth Fund
More Information About the Fund (continued)
limited earnings and/or falling profit margins. As a result, the value of their securities may fall or fail to rise. In addition, many information technology sector companies have limited operating histories and prices of these companies’ securities historically have been more volatile than other securities, especially over the short term. Some companies in the information technology sector are facing increased government and regulatory scrutiny and may be subject to adverse government or regulatory action, which could negatively impact the value of their securities.
Additional Investment Strategies and Policies
This section describes certain investment strategies and policies that the Fund may utilize in pursuit of its investment objective and some additional factors and risks involved with investing in the Fund.
Investment Guidelines
As a general matter, and except as specifically described in the discussion of the Fund's principal investment strategies in this prospectus or as otherwise required by the Investment Company Act of 1940, as amended (the 1940 Act), the rules and regulations thereunder and any applicable exemptive relief, whenever an investment policy or limitation states a percentage of the Fund's assets that may be invested in any security or other asset or sets forth a policy regarding an investment standard, compliance with that percentage limitation or standard will be determined solely at the time of the Fund's investment in the security or asset.
Holding Other Kinds of Investments
The Fund may hold other investments that are not part of its principal investment strategies. These investments and their risks are described below and/or in the Statement of Additional Information (SAI). The Fund may choose not to invest in certain securities described in this prospectus and in the SAI, although it has the ability to do so. Information on the Fund’s holdings can be found in the Fund’s Form N-CSR or by visiting columbiathreadneedleus.com.
Transactions in Derivatives
The Fund may enter into derivative transactions or otherwise have exposure to derivative transactions through underlying investments. Derivatives are financial contracts whose values are, for example, based on (or “derived” from) traditional securities (such as a stock or bond), assets (such as a commodity like gold or a foreign currency), reference rates (such as the Secured Overnight Financing Rate (commonly known as SOFR)) or market indices (such as the Standard & Poor’s 500® Index). The use of derivatives is a highly specialized activity which involves investment techniques and risks different from those associated with ordinary portfolio securities transactions. Derivatives involve special risks and may result in losses or may limit the Fund’s potential gain from favorable market movements. Derivative strategies often involve leverage, which may exaggerate a loss, potentially causing the Fund to lose more money than it would have lost had it invested in the underlying security or other asset directly. The values of derivatives may move in unexpected ways, especially in unusual market conditions, and may result in increased volatility in the value of the derivative and/or the Fund’s shares, among other consequences. Other risks arise from the Fund’s potential inability to terminate or to sell derivative positions. A liquid secondary market may not always exist for the Fund’s derivative positions at times when the Fund might wish to terminate or to sell such positions. Over-the-counter instruments (investments not traded on an exchange) may be illiquid, and transactions in derivatives traded in the over-the-counter market are subject to the risk that the other party will not meet its obligations. The use of derivatives also involves the risks of mispricing or improper valuation and that changes in the value of the derivative may not correlate perfectly with the underlying security, asset, reference rate or index. The Fund also may not be able to find a suitable derivative transaction counterparty, and thus may be unable to engage in derivative transactions when it is deemed favorable to do so, or at all. The U.S. government and the European Union (and some other jurisdictions) have enacted regulations and similar requirements that prescribe clearing, margin, reporting and registration requirements for participants in the derivatives market. These requirements are evolving and their ultimate impact on the Fund remains unclear, but such impact could include restricting and/or imposing significant costs or other burdens upon the Fund’s participation in derivatives transactions. Additionally, regulations governing the use of derivatives by registered investment companies, such as the Fund, require, among other things,
Prospectus 2026
13
CTIVP® – Westfield Select Large Cap Growth Fund
More Information About the Fund (continued)
that a fund that invests in derivative instruments beyond a specified limited amount apply a value-at-risk-based limit to its portfolio and establish a comprehensive derivatives risk management program. As of the date of this prospectus, the Fund is not required to maintain a comprehensive derivatives risk management program given its more limited use of derivatives. For more information on the risks of derivative investments and strategies, see the SAI.
Affiliated Fund Investing
The Investment Manager or an affiliate serves as investment adviser to funds using the Columbia brand (Columbia Funds), including those that are structured as “fund-of-funds”, and provides asset-allocation services to (i) shareholders by investing in shares of other Columbia Funds, which may include the Fund (collectively referred to in this section as Underlying Funds), and (ii) discretionary managed accounts (collectively referred to as affiliated products) that invest exclusively in Underlying Funds. These affiliated products, individually or collectively, may own a significant percentage of the outstanding shares of one or more Underlying Funds, and the Investment Manager seeks to balance potential conflicts of interest between the affiliated products and the Underlying Funds in which they invest. The affiliated products’ investment in the Underlying Funds may have the effect of creating economies of scale, possibly resulting in lower expense ratios for the Underlying Funds, because the affiliated products may own substantial portions of the shares of Underlying Funds. However, redemption of Underlying Fund shares by one or more affiliated products could cause the expense ratio of an Underlying Fund to increase, as its fixed costs would be spread over a smaller asset base. Because of large positions of certain affiliated products, the Underlying Funds may experience relatively large inflows and outflows of cash due to affiliated products’ purchases and sales of Underlying Fund shares. Although the Investment Manager or its affiliate may seek to minimize the impact of these transactions where possible, for example, by structuring them over a reasonable period of time or through other measures, Underlying Funds may experience increased expenses as they buy and sell portfolio securities to manage the cash flow effect related to these transactions. Further, when the Investment Manager or its affiliate structures transactions over a reasonable period of time in order to manage the potential impact of the buy and sell decisions for the affiliated products, those affiliated products, including funds-of-funds, may pay more or less (for purchase activity), or receive more or less (for redemption activity), for shares of the Underlying Funds than if the transactions were executed in one transaction. In addition, substantial redemptions by affiliated products within a short period of time could require the Underlying Fund to liquidate positions more rapidly than would otherwise be desirable, which may have the effect of reducing or eliminating potential gain or causing it to realize a loss. In order to meet such redemptions, an Underlying Fund may be forced to sell its liquid (or more liquid) positions, leaving the Underlying Fund holding, post-redemption, a relatively larger position in illiquid investments (i.e., any investment that the Fund reasonably expects cannot be sold or disposed of in current market conditions in seven calendar days or less without the sale or disposition significantly changing the market value of the investment) or less liquid securities. Substantial redemptions may also adversely affect the ability of the Underlying Fund to implement its investment strategy. The Investment Manager or its affiliate also has a conflict of interest in determining the allocation of affiliated products’ assets among the Underlying Funds, as it earns different fees from the various Underlying Funds.
Investing in Money Market Funds
The Fund may invest cash in, or hold as collateral for certain investments, shares of registered or unregistered money market funds, including funds advised by the Investment Manager or its affiliates. These funds are not insured or guaranteed by the Federal Deposit Insurance Corporation (FDIC) or any other government agency. The Fund and its shareholders indirectly bear a portion of the expenses of any money market fund or other fund in which the Fund may invest.
Investing Defensively
The Fund may from time to time take temporary defensive investment positions that may be inconsistent with the Fund’s principal investment strategies in attempting to respond to adverse market, economic, political, social or other conditions, including, without limitation, investing some or all of its assets in money market instruments or shares of affiliated or unaffiliated money market funds or holding some or all of its assets in cash or cash equivalents. The Fund may take such defensive investment positions for as long a period as deemed necessary.
14
Prospectus 2026
CTIVP® – Westfield Select Large Cap Growth Fund
More Information About the Fund (continued)
The Fund may not achieve its investment objective while it is investing defensively. Investing defensively may adversely affect Fund performance. During these times, the portfolio manager may make frequent portfolio holding changes, which could result in increased trading expenses and decreased Fund performance. See also Investing in Money Market Funds above for more information.
Other Strategic and Investment Measures
The Fund may also from time to time take temporary portfolio positions that may or may not be consistent with the Fund’s principal investment strategies in attempting to respond to adverse market, economic, political, social or other conditions, including, without limitation, investing in derivatives, such as forward contracts, futures contracts, options, structured investments and swaps, for various purposes, including among others, investing in particular derivatives in seeking to reduce investment exposures, or in seeking to achieve indirect investment exposures, to a sector, country, region or currency where the Investment Manager believes such positioning is appropriate. The Fund may take such portfolio positions for as long a period as deemed necessary. While the Fund is so positioned, derivatives could comprise a substantial portion of the Fund’s investments and the Fund may not achieve its investment objective. Investing in this manner may adversely affect Fund performance. During these times, the portfolio manager may make frequent portfolio holding changes, which could result in increased trading expenses and decreased Fund performance. For information on the risks of investing in derivatives, see Transactions in Derivatives above.
Portfolio Holdings Disclosure
The Board has adopted policies and procedures that govern the timing and circumstances of disclosure to shareholders and third parties of information regarding the securities owned by the Fund. A description of these policies and procedures is included in the SAI. Fund policy generally permits the disclosure of portfolio holdings information on the Fund's website (columbiathreadneedleus.com) only after a certain amount of time has passed, as described in the SAI.
Purchases and sales of portfolio securities can take place at any time, so the portfolio holdings information available on the Fund's website may not always be current.
FUNDamentals
Portfolio Holdings Versus the Benchmarks
The Fund does not limit its investments to the securities within its benchmark(s), and accordingly the Fund's holdings may diverge from those of its benchmark(s). In addition, the Fund may invest in securities outside any industry and geographic sectors represented in its benchmark(s). The Fund's weightings in individual securities, and in industry or geographic sectors, may also vary considerably from those of its benchmark(s).
Cash Flows
The timing and magnitude of cash inflows from investors buying Fund shares could prevent the Fund from always being fully invested. Conversely, the timing and magnitude of cash outflows to shareholders redeeming Fund shares could require the Fund to sell portfolio securities at less than opportune times or to hold ready reserves of uninvested cash in amounts larger than might otherwise be the case to meet shareholder redemptions. Either situation could adversely impact the Fund’s performance.
Understanding Annual Fund Operating Expenses
The Fund’s annual operating expenses, as presented in the Annual Fund Operating Expenses table in the Fees and Expenses of the Fund section of this prospectus, generally are based on expenses incurred during the Fund’s most recently completed fiscal year, may vary by share class and are expressed as a percentage (expense ratio) of the Fund’s average net assets during that fiscal year. The expense ratios reflect the Fund’s fee arrangements as of the date of this prospectus and, unless indicated otherwise, are based on expenses incurred during the Fund’s most recent fiscal year. The Fund’s assets will fluctuate, but unless indicated otherwise in the Annual Fund Operating
Prospectus 2026
15
CTIVP® – Westfield Select Large Cap Growth Fund
More Information About the Fund (continued)
Expenses table, no adjustments have been or will be made to the expense ratios to reflect any differences in the Fund’s average net assets between the most recently completed fiscal year and the date of this prospectus or a later date. In general, the Fund’s expense ratios will increase as its net assets decrease, such that the Fund’s actual expense ratios may be higher than the expense ratios presented in the Annual Fund Operating Expenses table if assets fall. Any commitment by the Investment Manager and/or its affiliates to waive fees and/or cap (reimburse) expenses is expected, in part, to limit the impact of any increase in the Fund’s expense ratios that would otherwise result because of a decrease in the Fund’s assets in the current fiscal year. The Fund’s annual operating expenses are comprised of (i) investment management fees, (ii) distribution and/or service fees, and (iii) other expenses. Management fees do not vary by class, but distribution and/or service fees and other expenses may vary by class.
FUNDamentals
Other Expenses
“Other expenses” consist of the fees the Fund pays to its custodian, transfer agent, auditors, lawyers and trustees, costs relating to compliance and miscellaneous expenses. Generally, these expenses are allocated on a pro rata basis across all share classes. These fees include certain sub-transfer agency and shareholder servicing fees. For more information on these fees, see About Fund Shares and Transactions — Financial Intermediary Compensation.
Fee Waiver/Expense Reimbursement Arrangements and Impact on Past Performance
The Investment Manager and certain of its affiliates have contractually agreed to waive fees and/or reimburse expenses (excluding certain fees and expenses described below) through April 30, 2027, unless sooner terminated at the sole discretion of the Fund's Board, so that the Fund’s net operating expenses, after giving effect to fees waived/expenses reimbursed and any balance credits and/or overdraft charges from the Fund’s custodian, do not exceed the annual rates of:
| CTIVP® - Westfield Select Large Cap Growth Fund | |
| Class 1 |
0.70% |
| Class 2 |
0.95% |
Under the agreement, the following fees and expenses are excluded from the Fund’s operating expenses when calculating the waiver/reimbursement commitment, and therefore will be paid by the Fund, if applicable: taxes (including foreign transaction taxes), expenses associated with investment in affiliated and non-affiliated pooled investment vehicles (including mutual funds and exchange-traded funds), transaction costs and brokerage commissions, costs related to any securities lending program, dividend expenses associated with securities sold short, inverse floater program fees and expenses, transaction charges and interest on borrowed money, interest, costs associated with shareholder meetings, infrequent and/or unusual expenses and any other expenses the exclusion of which is specifically approved by the Fund’s Board. This agreement may be modified or amended only with approval from all parties.
Effect of Fee Waivers and/or Expense Reimbursements on Past Performance. The Fund’s returns shown in the Performance Information section of this prospectus reflect the effect of any fee waivers and/or reimbursements of Fund expenses by the Investment Manager and/or any of its affiliates that were in place during the performance period shown. Without such fee waivers/expense reimbursements, the Fund’s returns might have been lower.
Primary Service Provider Contracts
The Fund enters into contractual arrangements (Service Provider Contracts) with various service providers, including, among others, the Investment Manager, the Distributor, Columbia Management Investment Services Corp. (the Transfer Agent) and the Fund’s custodian. The Fund’s Service Provider Contracts are solely among the parties thereto. Shareholders are not parties to, or intended to be third-party beneficiaries of, any Service Provider Contracts. Further, this prospectus, the SAI and any Service Provider Contracts are not intended to give rise to any agreement,
16
Prospectus 2026
CTIVP® – Westfield Select Large Cap Growth Fund
More Information About the Fund (continued)
duty, special relationship or other obligation between the Fund and any investor, or give rise to any contractual, tort or other rights in any individual shareholder, group of shareholders or other person, including any right to assert a fiduciary or other duty, enforce the Service Provider Contracts against the parties or to seek any remedy thereunder, either directly or on behalf of the Fund. Nothing in the previous sentence should be read to suggest any waiver of any rights under federal or state securities laws.
The Investment Manager, the Distributor, and the Transfer Agent are all affiliates of Ameriprise Financial, Inc. (Ameriprise Financial). They and their affiliates currently provide key services, including investment advisory, administration, distribution, shareholder servicing and transfer agency services, to the Fund and various other funds, including the Columbia Funds, and are paid for providing these services. These service relationships are described below.
The Investment Manager
Columbia Management Investment Advisers, LLC is located at 290 Congress Street, Boston, MA 02210 and serves as investment adviser and administrator to the Columbia Funds. The Investment Manager is a registered investment adviser and a wholly-owned subsidiary of Ameriprise Financial. The Investment Manager’s management experience covers all major asset classes, including equity securities, debt instruments and money market instruments. In addition to serving as an investment adviser to traditional mutual funds, exchange-traded funds and closed-end funds, the Investment Manager acts as an investment adviser for itself, its affiliates, individuals, corporations, retirement plans, private investment companies and financial intermediaries.
Subject to oversight by the Board, the Investment Manager manages the day-to-day operations of the Fund. The Investment Manager is responsible for the investment management of the Fund, but has delegated certain of its duties, including day-to-day portfolio management of all or a portion of the Fund’s assets to one or more investment subadvisers that determine what securities and other investments the Fund should buy or sell. The Investment Manager is also responsible for overseeing the administrative operations of the Fund, including the general supervision of the Fund’s operations, the coordination of the Fund’s other service providers and the provision of related clerical and administrative services.
The SEC has issued an order that permits the Investment Manager, subject to the approval of the Board, to appoint unaffiliated subadvisers by entering into subadvisory agreements with them, and to change in material respects the terms of those subadvisory agreements, including the fees paid thereunder, for the Fund without first obtaining shareholder approval, thereby avoiding the expense and delays typically associated with obtaining shareholder approval. The Fund furnishes shareholders with information about new subadvisers retained in reliance on the order within 90 days after hiring the subadviser. The Investment Manager and its affiliates may have other relationships, including significant financial relationships, with current or potential subadvisers or their affiliates, which may create certain conflicts of interest. When making recommendations to the Board to appoint or to change a subadviser, or to change the terms of a subadvisory agreement, the Investment Manager discloses to the Board the nature of any such material relationships. The SEC has issued a separate order that permits the Board to approve new subadvisory agreements or material changes to existing subadvisory agreements at a meeting that is not in person, provided that the Trustees are able to participate in the meeting using a means of communication that allows them to hear each other simultaneously during the meeting and other conditions of the order are satisfied.
The Fund pays the Investment Manager a fee for its management services, which include investment advisory services and administrative services. The fee is calculated as a percentage of the daily net assets of the Fund and is paid monthly. For the Fund’s most recent fiscal year, management services fees paid to the Investment Manager by the Fund amounted to 0.68% of average daily net assets of the Fund, before any applicable reimbursements.
A discussion regarding the basis for the Board’s approval of the renewal of the Fund's management agreement is available in the Fund’s Form N-CSR for the fiscal period ended June 30, 2025.
The Investment Manager has, with the approval of the Board, engaged an investment subadviser(s) to make the day-to-day investment decisions for the Fund. The Investment Manager pays the subadviser(s) for investment advisory services and retains ultimate responsibility (subject to Board oversight) for overseeing any subadviser it engages and for evaluating the Fund’s needs and the subadvisers’ skills and abilities on an ongoing basis. Based on its
Prospectus 2026
17
CTIVP® – Westfield Select Large Cap Growth Fund
More Information About the Fund (continued)
evaluations, the Investment Manager may at times recommend to the Board that the Fund change, add or terminate one or more subadvisers; continue to retain a subadviser even though the subadviser’s ownership or corporate structure has changed; or materially change a subadvisory agreement with a subadviser. A discussion regarding the basis for the Board’s approval of the investment subadvisory agreement with Westfield is available in the Fund’s Form N-CSR for the fiscal period ended June 30, 2025.
The date the Subadviser began serving the Fund is set forth under Subadviser below. Any performance of the Fund prior to the date the Subadviser began serving was achieved by one or more different subadvisers. Similarly, the portfolio turnover rate for periods prior to the Subadviser’s management of the Fund was the result of management by one or more different subadvisers. A change in subadvisers may result in increased portfolio turnover.
Subadviser
Westfield, which has served as Subadviser to the Fund since May 2024, is located at One Financial Center, Boston, MA 02111. Westfield, subject to the supervision of Columbia Management, provides day-to-day portfolio management to the Fund, as well as investment research and statistical information under a subadvisory agreement with Columbia Management. Westfield was founded in, and has been a registered investment adviser since, 1989 and provides separate account investment management services for institutions and high net worth individuals.
Portfolio Manager
Information about the portfolio manager primarily responsible for overseeing the Fund’s investments is shown below. The SAI provides additional information about the portfolio manager, including information relating to compensation, other accounts managed by the portfolio manager, and ownership by the portfolio manager of Fund shares.
Subadviser: Westfield Capital Management Company, L.P. (Westfield)
| Portfolio Management |
Title |
Role with Fund |
Managed Fund Since |
| William Muggia |
Chief Executive Officer, Chief Investment Officer, and Managing Partner of Westfield |
Portfolio Manager |
2024 |
Mr. Muggia joined Westfield in 1994. Mr. Muggia began his investment career in 1983 and earned a B.A. from Middlebury College and an M.B.A. from Harvard Business School.
The Distributor
Shares of the Fund are distributed by Columbia Management Investment Distributors, Inc., which is located at 290 Congress Street, Boston, MA 02210. The Distributor is a registered broker-dealer and an indirect, wholly-owned subsidiary of Ameriprise Financial. The Distributor and its affiliates may pay commissions, distribution and service fees and/or other compensation to entities, including Ameriprise Financial affiliates, for selling shares and providing services to investors.
The Transfer Agent
Columbia Management Investment Services Corp. is a registered transfer agent and wholly-owned subsidiary of Ameriprise Financial. The Transfer Agent is located at 290 Congress Street, Boston, MA 02210, and its responsibilities include processing purchases, redemptions and transfers of Fund shares, calculating and paying distributions, maintaining shareholder records, preparing account statements and providing customer service. The Transfer Agent has engaged SS&C GIDS, Inc. to provide various sub-transfer agency services. The Fund pays a service fee to participating insurance companies or other financial intermediaries that provide sub-recordkeeping and other services to Contract owners and the separate accounts. The Transfer Agent may retain as compensation for its services revenues for fees for wire, telephone and redemption orders, account transcripts due the Transfer Agent from Fund shareholders and interest (net of bank charges) earned with respect to balances in accounts the Transfer Agent maintains in connection with its services to the Fund.
18
Prospectus 2026
CTIVP® – Westfield Select Large Cap Growth Fund
More Information About the Fund (continued)
Other Roles and Relationships of Ameriprise Financial and its Affiliates — Certain Conflicts of Interest
The Investment Manager, Distributor and Transfer Agent, all affiliates of Ameriprise Financial, provide various services to the Fund and other Columbia Funds for which they are compensated. Ameriprise Financial and its other affiliates may also provide other services to these funds and be compensated for them.
The Investment Manager and its affiliates may provide investment advisory and other services to other clients and customers substantially similar to those provided to the Columbia Funds. These activities, and other financial services activities of Ameriprise Financial and its affiliates, may present actual and potential conflicts of interest and introduce certain investment constraints.
Ameriprise Financial is a major financial services company, engaged in a broad range of financial activities beyond the fund-related activities of the Investment Manager, including, among others, insurance, broker-dealer (sales and trading), asset management, banking and other financial activities. These additional activities may involve multiple advisory, financial, insurance and other interests in securities and other instruments, and in companies that issue securities and other instruments, that may be bought, sold or held by the Columbia Funds.
Conflicts of interest and limitations that could affect a Columbia Fund may arise from, for example, the following:
■
compensation and other benefits received by the Investment Manager and other Ameriprise Financial affiliates related to the management/administration of a Columbia Fund and the sale of its shares;
■
the allocation of, and competition for, investment opportunities among the Fund, other funds and accounts advised/managed by the Investment Manager and other Ameriprise Financial affiliates, or Ameriprise Financial itself and its affiliates;
■
separate and potentially divergent management of a Columbia Fund and other funds and accounts advised/managed by the Investment Manager and other Ameriprise Financial affiliates;
■
regulatory and other investment restrictions on investment activities of the Investment Manager and other Ameriprise Financial affiliates and accounts advised/managed by them;
■
insurance and other relationships of Ameriprise Financial affiliates with companies and other entities in which a Columbia Fund invests;
■
regulatory and other restrictions relating to the sharing of information between Ameriprise Financial and its affiliates, including the Investment Manager, and a Columbia Fund; and
■
insurance companies investing in the Fund may be affiliates of Ameriprise Financial; these affiliated insurance companies, individually and collectively, may hold through separate accounts a significant portion of the Fund's shares and may also invest in separate accounts managed by the Investment Manager that have the same or substantially similar investment objectives and strategies as the Fund.
The Investment Manager and Ameriprise Financial have adopted various policies and procedures that are intended to identify, monitor and address conflicts of interest. However, there is no assurance that these policies, procedures and disclosures will be effective.
Additional information about Ameriprise Financial and the types of conflicts of interest and other matters referenced above is set forth in the Investment Management and Other Services — Other Roles and Relationships of Ameriprise Financial and its Affiliates — Certain Conflicts of Interest section of the SAI. Investors in the Columbia Funds should carefully review these disclosures and consult with their financial advisor if they have any questions.
Certain Legal Matters
Ameriprise Financial and certain of its affiliates are involved, in the normal course of business, in legal proceedings that include regulatory inquiries, arbitration and litigation (including class actions) concerning matters arising in connection with the conduct of their activities as part of a diversified financial services firm. Ameriprise Financial believes that the Fund is not currently the subject of, and that neither Ameriprise Financial nor any of its affiliates are the subject of, any pending legal, arbitration or regulatory proceedings that are likely to have a material adverse
Prospectus 2026
19
CTIVP® – Westfield Select Large Cap Growth Fund
More Information About the Fund (continued)
effect on the Fund or the ability of Ameriprise Financial or its affiliates to perform under their contracts with the Fund. Information regarding certain pending and settled legal proceedings may be found in the Fund’s Form N-CSR and in the SAI. Additionally, Ameriprise Financial is required to make quarterly (10-Q), annual (10-K) and, as necessary, 8-K filings with the SEC on legal and regulatory matters that relate to Ameriprise Financial and its affiliates. Copies of these filings may be obtained by accessing the SEC website at sec.gov.
20
Prospectus 2026
CTIVP® – Westfield Select Large Cap Growth Fund
About Fund Shares and Transactions
Description of the Share Classes
Share Class Features
The Fund offers the classes of shares set forth on the cover of this prospectus. Each share class has its own cost structure and other features. The following summarizes the primary features of the Class 1 and Class 2 shares.
| |
Class 1 Shares |
Class 2 Shares |
| Eligible Investors |
Shares of the Fund are available only to separate accounts of participating insurance companies as underlying investments for variable annuity contracts and/or variable life insurance policies (collectively, Contracts) or qualified pension and retirement plans (Qualified Plans) or other eligible investors authorized by the Distributor. | |
| Investment Limits |
none |
none |
| Conversion Features |
none |
none |
| Front-End Sales Charges |
none |
none |
| Contingent Deferred Sales Charges (CDSCs) |
none |
none |
| Maximum Distribution and/or Service Fees |
none |
0.25% |
FUNDamentals
Financial Intermediaries
The term “financial intermediary” refers to the insurance company that issued your contract, qualified pension or retirement plan sponsors or the financial intermediary that employs your financial advisor. Financial intermediaries also include broker-dealers and financial advisors as well as firms that employ broker-dealers and financial advisors, including, for example, brokerage firms, banks, investment advisers, third party administrators and other firms in the financial services industry, including Ameriprise Financial and its affiliates.
Distribution and/or Service Fees
Pursuant to Rule 12b-1 under the Investment Company Act of 1940, as amended (the 1940 Act), the Board has approved, and the Fund has adopted, a distribution plan which sets the distribution fees that are periodically deducted from the Fund’s assets for Class 2 shares. The distribution fee for Class 2 shares is 0.25%. These fees are calculated daily, may vary by share class and are intended to compensate the Distributor and/or financial intermediaries for selling shares of the Fund and/or providing services to investors. Because the fees are paid out of the Fund’s assets on an ongoing basis, they will increase the cost of your investment over time.
The Fund will pay these fees to the Distributor and/or to eligible financial intermediaries for as long as the distribution plan continues. The Fund may reduce or discontinue payments at any time.
The Fund pays a service fee to participating insurance companies or other financial intermediaries that provide sub-recordkeeping and other services to Contract owners, Qualified Plan participants and the separate accounts.
Financial Intermediary Compensation
The Distributor, the Investment Manager and their affiliates make payments, from their own resources, to financial intermediaries, primarily to affiliated and unaffiliated insurance companies, for marketing/sales support services relating to the Fund (Marketing Support Payments). Such payments are generally based upon one or more of the following factors: average net assets of the Columbia Funds sold by the Distributor attributable to that financial intermediary; gross sales of the Columbia Funds distributed by the Distributor attributable to that financial intermediary; or a negotiated lump sum payment. While the financial arrangements may vary for each financial intermediary, the Marketing Support Payments to any one financial intermediary are generally between 0.05% and 0.40% on an annual basis for payments based on average net assets of the Fund attributable to the financial intermediary, and between 0.05% and 0.25% on an annual basis for a financial intermediary receiving a payment based on gross sales of the Columbia Funds attributable to the financial intermediary.
Prospectus 2026
21
CTIVP® – Westfield Select Large Cap Growth Fund
About Fund Shares and Transactions (continued)
As employee compensation and business unit operating goals at all levels are generally tied to the success of Ameriprise Financial, employees of Ameriprise Financial and its affiliates, including employees of affiliated broker-dealers and insurance companies, are incented to include shares of the Columbia Funds in Contracts offered by affiliated insurance companies. Certain employees, directly or indirectly, receive higher compensation and other benefits as investment in the Columbia Funds increases. In addition, management, sales leaders and other employees may spend more of their time and resources promoting Ameriprise Financial and its subsidiary companies, including the Distributor and the Investment Manager, and the products they offer, including the Fund.
In addition, the Transfer Agent has certain arrangements in place to compensate financial intermediaries, primarily to affiliated and unaffiliated insurance companies, that hold Fund shares through networked and omnibus accounts, including omnibus retirement plans, for services that they provide to beneficial Fund shareholders (Shareholder Services). Shareholder Services and related fees vary by financial intermediary and may include sub-accounting, sub-transfer agency, participant recordkeeping, shareholder or participant reporting, shareholder or participant transaction processing, maintenance of shareholder records, preparation of account statements and provision of customer service, and are not intended to include services that are primarily intended to result in the sale of Fund shares. Payments for Shareholder Services generally are not expected, with certain limited exceptions, to exceed 0.40% of the average aggregate value of the Fund’s shares. Each Fund pays the Transfer Agent a service fee equal to the payments made by the Transfer Agent to participating insurance companies and other financial intermediaries that provide Shareholder Services up to the lesser of the amount charged by the financial intermediary or a contractual asset-based cap. Payments of amounts that exceed the amount paid by the Fund are borne by the Transfer Agent, the Investment Manager and/or their affiliates.
In addition to the payments described above, the Distributor, the Investment Manager and their affiliates typically make other payments or allow promotional incentives to certain broker-dealers to the extent permitted by SEC and Financial Industry Regulatory Authority (FINRA) rules and by other applicable laws and regulations.
Amounts paid by the Distributor, the Investment Manager and their affiliates are paid out of their own resources and do not increase the amount paid by you or the Fund. You can find further details in the SAI about the payments made by the Distributor, the Investment Manager and their affiliates, as well as a list of the financial intermediaries, including Ameriprise Financial affiliates, to which the Distributor, the Investment Manager or their affiliates have agreed to make Marketing Support Payments and fee payments for Shareholder Services.
Your financial intermediary may charge you fees and commissions in addition to those described in this prospectus. You should consult with your financial intermediary and review carefully any disclosure your financial intermediary provides regarding its services and compensation. Depending on the financial arrangement in place at any particular time, a financial intermediary and its financial advisors may have a conflict of interest or financial incentive with respect to recommendations regarding the Fund or any Contract or Qualified Plan that includes the Fund.
Share Price Determination
The price you pay or receive when you buy, sell or transfer shares is the Fund's next determined net asset value (or NAV) per share for a given share class. The Fund calculates the NAV per share for each class of shares of the Fund at the end of each business day, with the value of the Fund's shares based on the total value of all of the securities and other assets that it holds as of such specified time.
FUNDamentals
NAV Calculation
Each of the Fund's share classes calculates its NAV per share as follows:
NAV per share = (Value of assets of the share class) – (Liabilities of the share class)
Number of outstanding shares of the class
Number of outstanding shares of the class
22
Prospectus 2026
CTIVP® – Westfield Select Large Cap Growth Fund
About Fund Shares and Transactions (continued)
FUNDamentals
Business Days
A business day is any day that the New York Stock Exchange (NYSE) is open. A business day typically ends at the close of regular trading on the NYSE, usually at 4:00 p.m. Eastern time. If the NYSE is scheduled to close early, the business day will be considered to end as of the time of the NYSE’s scheduled close. The Fund will not treat an intraday unscheduled disruption in NYSE trading or an intraday unscheduled closing as a close of regular trading on the NYSE for these purposes and will price its shares as of the regularly scheduled closing time for that day (typically, 4:00 p.m. Eastern time). Nonetheless, the NAV of Fund shares may be determined at such other time or times (in addition to or in lieu of the time set forth above) as the Fund’s Board may approve or ratify. On holidays and other days when the NYSE is closed, the Fund’s NAV is not calculated and the Fund does not accept buy or sell orders. However, the value of the Fund’s assets may still be affected on such days to the extent that the Fund holds foreign securities that trade on days that foreign securities markets are open.
Equity securities listed on an exchange are typically valued at the closing price or last trade on their primary exchange at the close of business of the NYSE. Equity securities without a readily available closing price or that are not listed on any exchange are typically valued at the mean between the closing bid and asked prices. Other equity securities, debt securities and other assets are valued differently. For instance, bank loans trading in the secondary market are fair valued unless market quotations are readily available, fixed income investments maturing in 60 days or less are valued primarily using the amortized cost method, unless this methodology results in a valuation that does not approximate the market value of these securities, and those maturing in excess of 60 days are valued based on prices obtained from a pricing service, if available (which may represent market values or fair values). Investments in other open-end funds are valued at their published NAVs. The value of the Fund’s portfolio securities is determined in accordance with the valuation policy approved by the Board (the Valuation Policy). Pursuant to Rule 2a-5 under the 1940 Act, the Board has designated the Investment Manager as the Fund’s valuation designee. The Investment Manager, in turn, has authorized its valuation committee to make fair value determinations and to carry out supervisory and certain other functions relating to the valuation of Fund portfolio securities, pursuant to the Valuation Policy.
If a market price is not readily available or is deemed not to reflect market value for a portfolio security, the Investment Manager will determine the price based on a determination of the security's fair value pursuant to the Valuation Policy. In addition, the Investment Manager may use fair valuation techniques to price securities that trade on a foreign exchange when a significant event has occurred after the foreign exchange closes but before the time at which the Fund’s share price is calculated. Foreign exchanges typically close before the time at which Fund share prices are calculated, and may be closed altogether on days when the Fund is open. Such significant events affecting a foreign security may include, but are not limited to: (1) corporate actions, earnings announcements, litigation or other events impacting a single issuer; (2) governmental action that affects securities in one sector or country; (3) natural disasters or armed conflicts affecting a country or region; or (4) significant domestic or foreign market fluctuations. The Fund uses various criteria, including an evaluation of U.S. market moves after the close of foreign markets, in determining whether a foreign security's market price is readily available and reflective of market value and, if not, the fair value of the security.
Fair valuation may have the effect of reducing stale pricing arbitrage opportunities presented by the pricing of Fund shares. However, when the Investment Manager uses fair valuation to price equity securities, it may value those securities higher or lower than another fund or manager would. Also, fair valuation of Fund holdings may cause the Fund's performance to diverge to a greater degree from the performance of various benchmark indices used to compare the Fund's performance because indices generally do not use fair valuation techniques. Because of the judgment involved in fair valuation decisions, there can be no assurance that the value ascribed to a particular security is accurate. The Fund has retained one or more independent fair valuation pricing services to assist in the fair valuation process for foreign securities.
Prospectus 2026
23
CTIVP® – Westfield Select Large Cap Growth Fund
About Fund Shares and Transactions (continued)
Futures and options on futures are valued based upon the settlement price as determined by the principal exchange on which they are traded or, in the absence of a settlement price, at the mean of the closing bid and ask. Generally, over-the-counter derivatives, such as swaps and swaptions, are valued based on a price provided by an approved pricing service.
Shareholder Information
Each share class has its own cost structure and other features. Your product may not offer every share class. The Fund encourages you to consult with a financial advisor who can help you with your investment decisions and for more information about the share classes offered by the Fund and available under your product. Shares of the Fund are generally available for purchase only by participating insurance companies in connection with Contracts and Qualified Plan sponsors.
The Fund, the Distributor or the Transfer Agent may refuse any order to buy or transfer shares. If this happens, the Fund will return any money it received, but no interest will be paid on that money.
Shares of the Fund may not be purchased or sold directly by individual Contract owners or participants in a Qualified Plan. When you sell your shares through your Contract or Qualified Plan, the Fund is effectively buying them back. This is called a redemption. The right of redemption may be suspended or payment postponed whenever permitted by applicable laws and regulations, as described under Satisfying Fund Redemption Requests below.
Depending on the context, references to “you” or “your” herein refer either to the holder of a Contract, participant in a Qualified Plan or qualified institutional investor who may select Fund shares to fund his or her investment in the Contract or Qualified Plan or to the participating insurance company as the holder of Fund shares through one or more separate accounts or the Qualified Plan.
Satisfying Fund Redemption Requests
The Fund typically expects to send the redeeming participating insurance company or Qualified Plan sponsor payment for shares within two business days after your trade date. The Fund can suspend redemptions and/or delay payment of redemption proceeds for up to seven days. The Fund can also suspend redemptions and/or delay payment of redemption proceeds in excess of seven days under certain circumstances, including when the NYSE is closed or trading thereon is restricted or during emergency or other circumstances, including as determined by the SEC.
The Fund typically seeks to satisfy redemption requests from cash or cash equivalents held by the Fund, from the proceeds of orders to purchase Fund shares or from the proceeds of sales of Fund holdings effected in the normal course of managing the Fund. However, the Fund may have to sell Fund holdings, including in down markets, to meet heavier than usual redemption requests. For example, under stressed or abnormal market conditions or circumstances, including circumstances adversely affecting the liquidity of the Fund’s investments, the Fund may be more likely to be forced to sell Fund holdings to meet redemptions than under normal market circumstances. In these situations, the Fund’s portfolio manager may have to sell Fund holdings that would not otherwise be sold because, among other reasons, the current price to be received is less than the value of the holdings perceived by the Fund’s portfolio manager. The Fund may also, under certain circumstances (but more likely under stressed or abnormal market conditions or circumstances), borrow money under a credit facility to which the Fund and certain other Columbia Funds are parties or from other Columbia Funds under an interfund lending program (except for closed-end funds and money market funds, which are not eligible to borrow under the program). The Fund and the other Columbia Funds are limited as to the amount that each may individually and collectively borrow under the credit facility and the interfund lending program. As a result, borrowings available to the Fund under the credit facility and the interfund lending program might be insufficient, alone or in combination with the other strategies described herein, to satisfy Fund redemption requests. Please see About Fund Investments – Borrowings – Interfund Lending in the SAI for more information about the credit facility and interfund lending program. The Fund is also limited in the total amount it may borrow. The Fund may only borrow to the extent permitted by the 1940 Act, the rules and regulations thereunder, and any exemptive relief available to the Fund, which currently limit Fund borrowings to
24
Prospectus 2026
CTIVP® – Westfield Select Large Cap Growth Fund
About Fund Shares and Transactions (continued)
33 1/3% of total assets (including any amounts borrowed) less liabilities (other than borrowings), plus an additional 5% of its total assets for temporary purposes (to be repaid within 60 days without extension or renewal), in each case determined at the time the borrowing is made.
In addition, the Fund reserves the right to honor redemption orders in whole or in part with in-kind distributions of Fund portfolio securities instead of cash if the Investment Manager, in its sole discretion, determines it to be in the best interest of the remaining shareholders. Such in-kind distributions typically represent a pro-rata portion of Fund portfolio assets subject to adjustments (e.g., for non-transferable securities, round lots and derivatives). In the event the Fund distributes portfolio securities in kind, shareholders may incur brokerage and other transaction costs associated with converting the portfolio securities into cash. Also, the portfolio securities may increase or decrease in value after they are distributed but before they are converted into cash. For U.S. federal income tax purposes, redemptions paid in securities are generally treated the same as redemptions paid in cash. If, during any 90-day period, you redeem shares in an amount greater than $250,000 or 1% of the Fund’s net assets (whichever is less), and if the Investment Manager determines it to be feasible and appropriate, the Fund may pay the redemption amount above such threshold by an in-kind distribution of Fund portfolio securities. Although shares of the Fund may not be purchased or sold by individual owners of Contracts or Qualified Plans, this policy applies indirectly to Contract and Qualified Plan owners.
Potential Conflicts of Interest – Mixed and Shared Funding
The Fund is available for purchase only through Contracts offered by participating insurance companies, Qualified Plans and other qualified institutional investors authorized by the Distributor. Due to differences in tax treatment and other considerations, the interests of various Contract owners, and the interests of Qualified Plan participants, if any, may conflict. The Fund does not foresee any disadvantages to investors arising from these potential conflicts of interest at this time. Nevertheless, the Board of the Fund intends to monitor events to identify any material irreconcilable conflicts which may arise, and to determine what action, if any, should be taken in response to any conflicts. If such a conflict were to arise, one or more separate accounts might be required to withdraw its investments in the Fund or shares of another mutual fund may be substituted. This might force the Fund to sell securities at disadvantageous prices.
Order Processing
Orders to buy and sell shares of the Fund that are placed by your participating insurance company or Qualified Plan sponsor are processed on business days. Orders received in “good form” by the Transfer Agent or a financial intermediary, including your participating insurance company or Qualified Plan sponsor, before the end of a business day are priced at the NAV per share of the Fund's applicable share class on that day. Orders received after the end of a business day will receive the next business day’s NAV per share. An order is in “good form” if the Transfer Agent or your financial intermediary has all of the information and documentation it deems necessary to effect your order. The market value of the Fund’s investments may change between the time you submit your order and the time the Fund next calculates its NAV per share. The business day that applies to your order is also called the trade date.
There is no sales charge associated with the purchase of Fund shares, but there may be charges associated with your Contract or Qualified Plan. Any charges that apply to your Contract or Qualified Plan, and any charges that apply to separate accounts of participating insurance companies or Qualified Plans that may own shares directly, are described in your separate Contract prospectus or Qualified Plan disclosure documents.
You may transfer all or part of your investment in the Fund to one or more of the other investment options available under your Contract or Qualified Plan. You may provide instructions to sell any amount allocated to the Fund. Proceeds will be mailed within seven days after your surrender or withdrawal request is received in good form by an authorized agent. The amount you receive may be more or less than the amount you invested.
Please refer to your Contract prospectus or Qualified Plan disclosure documents, as applicable, for more information about transfers as well as surrenders and withdrawals.
Prospectus 2026
25
CTIVP® – Westfield Select Large Cap Growth Fund
About Fund Shares and Transactions (continued)
Information Sharing Agreements
As required by Rule 22c-2 under the 1940 Act, the Fund or certain of its service providers will enter into information sharing agreements with financial intermediaries, including participating life insurance companies and financial intermediaries that sponsor or offer retirement plans through which shares of the Fund are made available for purchase. Pursuant to Rule 22c-2, financial intermediaries are required, upon request, to: (i) provide shareholder account and transaction information; and (ii) execute instructions from the Fund to restrict or prohibit further purchases of Fund shares by shareholders who have been identified by the Fund as having engaged in transactions that violate the Fund's excessive trading policies and procedures.
Excessive Trading Practices Policy of Non-Money Market Funds
Right to Reject or Restrict Share Transaction Orders — The Fund is intended for investors with long-term investment purposes and is not intended as a vehicle for frequent trading activity (market timing) that is excessive. Investors should transact in Fund shares primarily for investment purposes. The Board has adopted excessive trading policies and procedures that are designed to deter excessive trading by investors (the Excessive Trading Policies and Procedures). The Fund discourages and does not accommodate excessive trading. Investments in a Fund by institutional investors in connection with redemptions in-kind are exempt from the Excessive Trading Policies and Procedures because they generally do not raise market timing or excessive trading concerns. Further discussion about the Fund’s use of redemptions in-kind is available under Satisfying Fund Redemption Requests.
The Fund reserves the right to reject, without any prior notice, any purchase or transfer order for any reason, and will not be liable for any loss resulting from rejected orders. For example, the Fund may in its sole discretion restrict or reject a purchase or transfer order even if the transaction is not subject to the specific limitation described below if the Fund or its agents determine that accepting the order could interfere with efficient management of the Fund's portfolio or is otherwise contrary to the Fund's best interests. The Excessive Trading Policies and Procedures apply equally to purchase or transfer transactions communicated directly to the Transfer Agent and to those received by financial intermediaries.
Specific Buying and Transferring Limitations — If the Fund detects that an investor has made two “material round trips” in any 28-day period, it will generally reject the investor's future purchase orders, including transfer buy orders, involving any Fund.
For these purposes, a “round trip” is a purchase or transfer into the Fund followed by a sale or transfer out of the Fund, or a sale or transfer out of the Fund followed by a purchase or transfer into the Fund. A “material” round trip is one that is deemed by the Fund to be material in terms of its amount or its potential detrimental impact on the Fund. Independent of this limit, the Fund may, in its sole discretion, reject future purchase orders by any person, group or account that appears to have engaged in any type of excessive trading activity.
These limits generally do not apply to automated transactions or transactions by registered investment companies in a “fund-of-funds” structure. These limits do not apply to payroll deduction contributions by retirement plan participants, transactions initiated by a retirement plan sponsor or certain other retirement plan transactions consisting of rollover transactions, loan repayments and disbursements, and required minimum distribution redemptions. They may be modified or rescinded for accounts held by certain retirement plans to conform to plan limits, for considerations relating to the Employee Retirement Income Security Act of 1974 or regulations of the Department of Labor, and for certain asset allocation or wrap programs. Accounts known to be under common ownership or control generally will be counted together, but accounts maintained or managed by a common intermediary generally will not be considered to be under common ownership or control. The Fund reserves the right to modify these restrictions at any time without prior notice to shareholders. In addition, the Fund may, in its sole discretion, reinstate trading privileges that have been revoked under the Fund's Excessive Trading Policies and Procedures.
Limitations on the Ability to Detect and Prevent Excessive Trading Practices — The Fund takes various steps designed to detect and prevent excessive trading, including daily review of available shareholder transaction information. However, the Fund receives buy, sell or transfer orders through financial intermediaries, and cannot always know of or reasonably detect excessive trading that may be facilitated by financial intermediaries or by the use of the
26
Prospectus 2026
CTIVP® – Westfield Select Large Cap Growth Fund
About Fund Shares and Transactions (continued)
omnibus account arrangements they offer. Omnibus account arrangements are common forms of holding shares of mutual funds, particularly among certain financial intermediaries such as broker-dealers, retirement plans and variable insurance products. These arrangements often permit financial intermediaries to aggregate their clients' transactions and accounts, and in these circumstances, the identities of the financial intermediary clients that beneficially own Fund shares are often not known to the Fund.
Some financial intermediaries apply their own restrictions or policies to their clients’ transactions and accounts, which may be more or less restrictive than those described here. This may impact the Fund's ability to curtail excessive trading, even where it is identified. For these and other reasons, it is possible that excessive trading may occur despite the Fund's efforts to detect and prevent it.
Although these restrictions and policies involve judgments that are inherently subjective and may involve some selectivity in their application, the Fund seeks to act in a manner that it believes is consistent with the best interests of Fund shareholders in making any such judgments.
Risks of Excessive Trading — Excessive trading creates certain risks to the Fund's long-term shareholders and may create the following adverse effects:
■
negative impact on the Fund's performance;
■
potential dilution of the value of the Fund's shares;
■
interference with the efficient management of the Fund's portfolio, such as the need to maintain undesirably large cash positions, the need to use its line of credit or the need to buy or sell securities it otherwise would not have bought or sold;
■
losses on the sale of investments resulting from the need to sell securities at less favorable prices; and
■
increased brokerage and administrative costs.
To the extent that the Fund invests significantly in foreign securities traded on markets that close before the Fund's valuation time, it may be particularly susceptible to dilution, which may be exacerbated as a result of excessive trading. Because events may occur after the close of foreign markets and before the Fund's valuation time that influence the value of foreign securities, investors may seek to trade Fund shares in an effort to benefit from their understanding of the value of foreign securities as of the Fund's valuation time. This is often referred to as price arbitrage. The Fund has adopted procedures designed to adjust closing market prices of foreign securities under certain circumstances to reflect what the Fund believes to be the fair value of those securities as of its valuation time. To the extent the adjustments do not work fully, investors engaging in price arbitrage may cause dilution in the value of the Fund's shares held by other shareholders.
Similarly, to the extent that the Fund invests significantly in thinly traded securities and other debt instruments that are rated below investment grade (commonly called “high-yield” or “junk” bonds), equity securities of small-capitalization companies, floating rate loans, or tax-exempt or other securities that may trade infrequently, because these securities are often traded infrequently, investors may seek to trade Fund shares in an effort to benefit from their understanding of the value of these securities as of the Fund's valuation time. This is also a type of price arbitrage. Any such frequent trading strategies may interfere with efficient management of the Fund's portfolio to a greater degree than would be the case for mutual funds that invest only, or significantly, in highly liquid securities, in part because the Fund may have difficulty selling these particular investments at advantageous times or prices to satisfy large and/or frequent sell orders. Any successful price arbitrage may also cause dilution in the value of Fund shares held by non-redeeming shareholders.
Excessive Trading Practices Policy of Columbia Variable Portfolio - Government Money Market Fund
A money market fund is designed to offer investors a liquid cash option that they may buy and sell as often as they wish. Accordingly, the Board has not adopted policies and procedures designed to discourage excessive or short-term trading of Columbia Variable Portfolio - Government Money Market Fund shares. However, since frequent purchases and sales of Columbia Variable Portfolio - Government Money Market Fund shares could in certain instances harm shareholders in various ways, including reducing the returns to long-term shareholders by increasing
Prospectus 2026
27
CTIVP® – Westfield Select Large Cap Growth Fund
About Fund Shares and Transactions (continued)
costs (such as spreads paid to dealers who trade money market instruments with Columbia Variable Portfolio - Government Money Market Fund) and disrupting portfolio management strategies, Columbia Variable Portfolio - Government Money Market Fund reserves the right, but has no obligation, to reject any purchase or transfer transaction at any time. Columbia Variable Portfolio - Government Money Market Fund has no limits on purchase or transfer transactions. In addition, Columbia Variable Portfolio - Government Money Market Fund reserves the right to impose or modify restrictions on purchases, transfers or trading of Fund shares at any time.
28
Prospectus 2026
CTIVP® – Westfield Select Large Cap Growth Fund
Distributions and Taxes
Distributions to Shareholders
A mutual fund can make money two ways:
■
It can earn income on its investments. Examples of fund income are interest paid on money market instruments and bonds, and dividends paid on common stocks.
■
A mutual fund can also have capital gains if the value of its investments increases.
In the case of the Fund, because the Fund expects to be treated as a partnership for tax purposes, it is not required to and does not expect to make regular distributions to its shareholders (other than in redemption of Fund shares), but may do so in the sole discretion of the Fund’s Board of Trustees (or its delegates).
Taxes and Your Investment
Taxation of the Fund: The Fund is currently treated and expects to continue to be treated as a partnership that is not a “publicly traded partnership” for U.S. federal income tax purposes. If the Fund were not to qualify for such treatment, the Fund could be subject to U.S. federal income tax at the Fund level, which would reduce the value of an investment in the Fund.
As a partnership that is not a “publicly traded partnership,” the Fund is generally not itself subject to U.S. federal income tax. Instead, each shareholder will be required to take into account for U.S. federal income tax purposes its allocable share of the Fund’s income, gains, losses, deductions, credits, and other tax items, without regard to whether such shareholder has received or will receive corresponding distributions from the Fund. In addition, unlike mutual funds that intend to be treated as regulated investment companies for U.S. federal income tax purposes, the Fund is not required to meet any specific qualifying income or distribution requirements, although to the extent regulated investment companies invest in the Fund, such requirements will be taken into account by the Fund.
Certain Fund income may be subject to tax in other countries, including withholding or other taxes on dividends, interest or capital gains. Tax conventions between certain countries and the United States may reduce or eliminate such taxes. In certain countries the Fund may incur a higher rate of tax on dividends than it would have incurred if the Fund had been treated as a regulated investment company.
As a partnership that is not a “publicly traded partnership,” the Fund is generally not itself subject to U.S. federal income tax. Instead, each shareholder will be required to take into account for U.S. federal income tax purposes its allocable share of the Fund’s income, gains, losses, deductions, credits, and other tax items, without regard to whether such shareholder has received or will receive corresponding distributions from the Fund. In addition, unlike mutual funds that intend to be treated as regulated investment companies for U.S. federal income tax purposes, the Fund is not required to meet any specific qualifying income or distribution requirements, although to the extent regulated investment companies invest in the Fund, such requirements will be taken into account by the Fund.
Certain Fund income may be subject to tax in other countries, including withholding or other taxes on dividends, interest or capital gains. Tax conventions between certain countries and the United States may reduce or eliminate such taxes. In certain countries the Fund may incur a higher rate of tax on dividends than it would have incurred if the Fund had been treated as a regulated investment company.
Taxation of Fund Shares: Shares of the Fund are only offered to separate accounts of participating insurance companies, Qualified Plans, and certain other eligible persons or plans permitted to hold shares of the Fund pursuant to the applicable U.S. Treasury Regulations without impairing the ability of participating insurance companies to satisfy the diversification requirements of Section 817(h) of the Internal Revenue Code of 1986, as amended. Each participating insurance company, including each participating insurance company that is an affiliate of the Investment Manager, includes in its taxable income any net investment income derived from the investment of assets held in its separate accounts because the insurance company is considered the owner of these assets under federal income tax law. The insurance company may claim certain tax benefits associated with this investment income, which benefits may be greater with respect to the Fund than if the Fund were treated as a regulated investment company for U.S. federal income tax purposes. These benefits, which may include foreign tax credits (which can reduce the insurance company’s U.S. taxes on foreign source income) and the corporate dividends-received deduction (which is a tax deduction for the insurance company attributable to certain dividends received by the Fund), are not passed on to Contract owners since the affiliated insurance company is the owner of the assets under federal tax law and is taxed on the investment income generated by the assets.
Taxation of Variable Annuity Contracts and Variable Life Insurance Policies: Your Contract may qualify for favorable tax treatment. Please refer to your Contract prospectus for more information about the tax implications of your investment in the Contract. As long as your Contract continues to qualify for such favorable tax treatment, you will not be taxed currently on your investment in the Fund through such Contract, even if the Fund makes allocations or distributions to the separate account and/or you change your investment options under the Contract. In order to qualify for such treatment, among other things, the separate accounts of participating insurance companies, which maintain and invest net proceeds from Contracts, must be “adequately diversified.” The Fund intends to operate in such a manner so that a separate account investing only in Fund shares on behalf of a holder of a Contract will be “adequately diversified.” If the Fund does not meet such requirements because its investments are not adequately
Prospectus 2026
29
CTIVP® – Westfield Select Large Cap Growth Fund
Distributions and Taxes (continued)
diversified, your Contract could lose its favorable tax treatment, and income and gain allocable to your Contract could be taxable currently to you. This could also occur if Contract holders are found to have an impermissible level of control over the investments underlying their Contracts or if the Fund does not qualify for treatment as a partnership that is not a “publicly traded partnership.” You should consult with the participating insurance company that issued your Contract, plan sponsor, or other eligible investor through which your investment in the Fund is made regarding the U.S. federal income taxation of your investment.
FUNDamentals
Taxes
The information provided above is only a summary of how U.S. federal income taxes may affect your indirect investment in the Fund. It is not intended as a substitute for careful tax planning. Your investment in the Fund may have other tax implications. It does not apply to certain types of investors who may be subject to special rules, including foreign or tax-exempt investors or those holding Fund shares through a tax-advantaged account other than a Contract, such as a 401(k) plan or IRA. Please see the SAI for more detailed tax information. You should consult with your own tax advisor about the particular tax consequences to you of an investment in the Fund, including the effect of any foreign, state and local taxes, and the effect of possible changes in applicable tax laws.
30
Prospectus 2026
CTIVP® – Westfield Select Large Cap Growth Fund
Financial Highlights
The financial highlights table is intended to help you understand the Fund’s financial performance for the past five fiscal years or, if shorter, the Fund’s period of operations. Certain information reflects financial results for a single Fund share. Per share net investment income (loss) amounts are calculated based on average shares outstanding during the period. The total return in the table represents the rate that an investor would have earned (or lost) on an investment in the Fund assuming all dividends and distributions had been reinvested. Total return does not reflect any fees and expenses imposed under your Contract and/or Qualified Plan, as applicable; such fees and expenses would reduce the total return for all periods shown. Total return and portfolio turnover are not annualized for periods of less than one year. The ratios of expenses and net investment income are annualized for periods of less than one year. The portfolio turnover rate is calculated without regard to purchase and sales transactions of short-term instruments and certain derivatives, if any. If such transactions were included, the Fund’s portfolio turnover rate may be higher. A zero balance may reflect an amount rounding to less than $0.01 or 0.01%. This information has been audited by PricewaterhouseCoopers LLP, an independent registered public accounting firm, whose report, along with the Fund’s financial statements, is included in the Fund’s Form N-CSR, which is available upon request.
Prospectus 2026
31
CTIVP® – Westfield Select Large Cap Growth Fund
Financial Highlights (continued)
| |
Net asset value, beginning of period |
Net investment income (loss) |
Net realized and unrealized gain (loss) |
Total from investment operations |
| Class 1 | ||||
| Year Ended 12/31/2025 |
$59.06 |
(0.16) |
10.36 |
10.20 |
| Year Ended 12/31/2024 |
$46.32 |
0.01 |
12.73 |
12.74 |
| Year Ended 12/31/2023 |
$35.36 |
(0.03) |
10.99 |
10.96 |
| Year Ended 12/31/2022 |
$60.00 |
(0.07) |
(24.57) |
(24.64) |
| Year Ended 12/31/2021 |
$62.57 |
(0.36) |
(2.21) |
(2.57) |
| Class 2 | ||||
| Year Ended 12/31/2025 |
$56.90 |
(0.30) |
9.96 |
9.66 |
| Year Ended 12/31/2024 |
$44.75 |
(0.19) |
12.34 |
12.15 |
| Year Ended 12/31/2023 |
$34.26 |
(0.09) |
10.58 |
10.49 |
| Year Ended 12/31/2022 |
$58.28 |
(0.17) |
(23.85) |
(24.02) |
| Year Ended 12/31/2021 |
$60.93 |
(0.51) |
(2.14) |
(2.65) |
| Notes to Financial Highlights | |
| (a) |
In addition to the fees and expenses that the Fund bears directly, the Fund indirectly bears a pro rata share of the fees and expenses of any other funds in which it invests. Such indirect expenses are not included in the Fund's reported expense ratios. |
| (b) |
Total net expenses include the impact of certain fee waivers/expense reimbursements made by the Investment Manager and certain of its affiliates, if applicable. |
| (c) |
Ratios include interfund lending expense which is less than 0.01%. |
32
Prospectus 2026
CTIVP® – Westfield Select Large Cap Growth Fund
Financial Highlights (continued)
| |
Net asset value, end of period |
Total return |
Total gross expense ratio to average net assets(a) |
Total net expense ratio to average net assets(a),(b) |
Net investment income (loss) ratio to average net assets |
Portfolio turnover |
Net assets, end of period (000's) |
| Class 1 | |||||||
| Year Ended 12/31/2025 |
$69.26 |
17.27% |
0.69%(c) |
0.69%(c) |
(0.26%) |
68% |
$1,647,113 |
| Year Ended 12/31/2024 |
$59.06 |
27.50% |
0.69% |
0.69% |
0.01% |
106% |
$1,771,559 |
| Year Ended 12/31/2023 |
$46.32 |
31.00% |
0.70% |
0.70% |
(0.07%) |
28% |
$65,041 |
| Year Ended 12/31/2022 |
$35.36 |
(41.07%) |
0.70% |
0.70% |
(0.16%) |
82% |
$1,183,777 |
| Year Ended 12/31/2021 |
$60.00 |
(4.11%) |
0.67% |
0.67% |
(0.55%) |
73% |
$1,941,145 |
| Class 2 | |||||||
| Year Ended 12/31/2025 |
$66.56 |
16.98% |
0.94%(c) |
0.94%(c) |
(0.50%) |
68% |
$33,493 |
| Year Ended 12/31/2024 |
$56.90 |
27.15% |
0.95% |
0.95% |
(0.38%) |
106% |
$31,603 |
| Year Ended 12/31/2023 |
$44.75 |
30.62% |
0.99% |
0.95% |
(0.23%) |
28% |
$28,970 |
| Year Ended 12/31/2022 |
$34.26 |
(41.21%) |
0.95% |
0.95% |
(0.42%) |
82% |
$24,065 |
| Year Ended 12/31/2021 |
$58.28 |
(4.35%) |
0.92% |
0.92% |
(0.80%) |
73% |
$45,239 |
Prospectus 2026
33
CTIVP® – Westfield Select Large Cap Growth Fund

For More Information
The Fund is generally available only to owners of Contracts issued by participating insurance companies and participants in Qualified Plans. Please refer to your Contract prospectus or Qualified Plan disclosure documents for information about how to buy, sell and transfer shares of the Fund.
Additional Information About the Fund
Additional information about the Fund’s investments is available in the Fund’s annual and semiannual reports to shareholders and in Form N-CSR. In the Fund’s annual report, you will find a discussion of the market conditions and investment strategies that significantly affected the Fund’s performance during its last fiscal year. In the Fund’s Form N-CSR, you will find the Fund’s annual and semiannual financial statements. The SAI also provides additional information about the Fund and its policies. The SAI, which has been filed with the SEC, is legally part of this prospectus (incorporated by reference). To obtain these documents free of charge, to request other information about the Fund and to make shareholder inquiries, please contact the Fund as follows:
By Mail: Columbia Management Investment Services Corp.
P.O. Box 219104
Kansas City, MO 64121-9104
P.O. Box 219104
Kansas City, MO 64121-9104
By Telephone: 800.345.6611
Online: columbiathreadneedleus.com
Reports and other information about the Fund are also available in the EDGAR Database on the SEC’s website at http://www.sec.gov. You can receive copies of this information, for a duplication fee, by electronic request at the following e-mail address: publicinfo@sec.gov.
The investment company registration number of Columbia Funds Variable Series Trust II, of which the Fund is a series, is 811-22127.
Columbia Threadneedle Investments (Columbia Threadneedle) is the global brand name of the Columbia and Threadneedle group of companies.
The Fund is distributed by Columbia Management Investment Distributors, Inc., 290 Congress Street, Boston, MA 02210.
The Fund is distributed by Columbia Management Investment Distributors, Inc., 290 Congress Street, Boston, MA 02210.
© 2026 Columbia Threadneedle. All rights reserved.
PRO7035_12_E01_(05/26)

Variable Portfolio – Partners Core Bond Fund
Prospectus
May 1, 2026
As with all mutual funds, the Securities and Exchange Commission (SEC) has not approved or disapproved these securities or passed upon the adequacy of this prospectus. Any representation to the contrary is a criminal offense.

Variable Portfolio – Partners Core Bond Fund
Table of Contents
| 3 | |
| 3 | |
| 3 | |
| 3 | |
| 4 | |
| 10 | |
| 11 | |
| 11 | |
| 11 | |
| 11 | |
| 12 | |
| 12 | |
| 12 | |
| 13 | |
| 22 | |
| 25 | |
| 29 | |
| 29 | |
| 31 | |
| 31 | |
| 31 | |
| 32 | |
| 34 | |
| 39 | |
| 39 | |
| 39 | |
| 41 |
2
Prospectus 2026
Variable Portfolio – Partners Core Bond Fund
Summary of the Fund
Investment Objective
Variable Portfolio – Partners Core Bond Fund (the Fund) seeks to provide shareholders with a high level of current income while conserving the value of the investment for the longest period of time.
Fees and Expenses of the Fund
This table describes the fees and expenses that you may pay as an investor in the Fund. The table does not reflect any fees or expenses imposed by your Contract or Qualified Plan, which are disclosed in your separate Contract prospectus or Qualified Plan disclosure documents. If the additional fees or expenses were reflected, the expenses set forth below would be higher.
| Annual Fund Operating Expenses (expenses that you pay each year as a percentage of the value of your investment) | ||
| |
Class 1 |
Class 2 |
| Management fees |
% |
% |
| Distribution and/or service (12b-1) fees |
% |
% |
| Other expenses |
% |
% |
| Total annual Fund operating expenses(a) |
% |
% |
(a)
The following example is intended to help you compare the cost of investing in the Fund with the cost of investing in other mutual funds. The example illustrates the hypothetical expenses that you would incur over the time periods indicated, and assumes that:
■
you invest $10,000 in the applicable class of Fund shares for the periods indicated,
■
your investment has a 5% return each year, and
■
the Fund’s total annual operating expenses remain the same as shown in the Annual Fund Operating Expenses table above.
The example does not reflect any fees and expenses that apply to your Contract or Qualified Plan. Inclusion of these charges would increase expenses for all periods shown.
Although your actual costs may be higher or lower, based on the assumptions listed above, your costs would be:
| |
1 year |
3 years |
5 years |
10 years |
| Class 1 (whether or not shares are redeemed) |
$ |
$ |
$ |
$ |
| Class 2 (whether or not shares are redeemed) |
$ |
$ |
$ |
$ |
Portfolio Turnover
The Fund may pay transaction costs, such as commissions, when it buys and sells securities (or “turns over” its portfolio). A higher portfolio turnover rate may indicate higher transaction costs. These costs, which are not reflected in annual fund operating expenses or in the example, affect the Fund’s performance. During the most recent fiscal year, the Fund’s portfolio turnover rate was 225 % of the average value of its portfolio.
Principal Investment Strategies
Under normal circumstances, the Fund invests at least 80% of its net assets (plus the amount of any borrowings for investment purposes) in U.S. dollar-denominated bonds and other debt instruments of investment grade quality (referred to as core bonds), like those included in the Bloomberg U.S. Aggregate Bond Index (the Index). The Index
Prospectus 2026
3
Variable Portfolio – Partners Core Bond Fund
Summary of the Fund (continued)
includes securities issued by the U.S. Government and its agencies and instrumentalities, corporate bonds, and mortgage- and asset-backed securities. The Fund may invest in mortgage dollar rolls and reverse repurchase agreements. The Fund may also invest in foreign debt instruments denominated in U.S. dollars or in foreign currencies. The Fund may also invest in loans and loan participations. The Fund considers a bond or other debt instrument to be of investment grade quality if it is rated investment grade by a nationally recognized statistical rating organization or, if unrated, determined by the investment manager to be of comparable quality.
The Fund may invest in debt instruments that, at the time of purchase, are rated below investment grade or are unrated but determined to be of comparable quality (commonly referred to as “high-yield” investments or “junk” bonds).
The Fund may invest in derivatives, such as futures (including interest rate futures to manage duration and curve risk), options (including options on futures for hedging interest rates), swaps (including credit default swaps) and forwards (including foreign exchange forwards for hedging and/or investment purposes).
The Fund may purchase or sell securities on a when-issued, delayed delivery or forward commitment basis. Such securities may include mortgage-backed securities acquired or sold in the “to be announced” (TBA) market and those in a dollar roll transaction.
The Fund may invest in privately placed and other securities or instruments that are purchased and sold pursuant to Rule 144A or other exemptions under the Securities Act of 1933, as amended, subject to certain regulatory restrictions.
The Fund’s investment strategy may involve the frequent trading of portfolio securities.
Multiple subadvisers provide the day-to-day management of the Fund’s portfolio.
Principal Risks
An investment in the Fund involves risks, including Interest Rate Risk, Mortgage- and Other Asset-Backed Securities Risk, Credit Risk, Market Risk, Multi-Adviser Risk, and Changing Distribution Level Risk, among others. Descriptions of these and other principal risks of investing in the Fund are provided below. There is no assurance that the Fund will achieve its investment objective and you may lose money . The value of the Fund’s holdings may decline, and the Fund’s net asset value (NAV) and share price may go down. An investment in the Fund is not a bank deposit and is not insured or guaranteed by the Federal Deposit Insurance Corporation or any other government agency. The significance of any specific risk to an investment in the Fund will vary over time depending on the composition of the Fund's portfolio, market conditions, and other factors. You should read all of the risk information below carefully, because any one or more of these risks may result in losses to the Fund.
Active Management Risk. Due to its active management, the Fund could underperform its benchmark index and/or other funds with similar investment objectives and/or strategies.
Changing Distribution Level Risk. The Fund normally expects to receive income which may include interest, dividends and/or capital gains, depending upon its investments. The distribution amounts paid by the Fund will vary and generally depend on the amount of income the Fund earns (less expenses) on its portfolio holdings, and capital gains or losses it recognizes. A decline in the Fund’s income or net capital gains arising from its investments may reduce its distribution level.
Counterparty Risk. Counterparty risk is the risk that a counterparty to a transaction in a financial instrument held by the Fund or by a special purpose or structured vehicle invested in by the Fund may become insolvent or otherwise fail to perform its obligations. As a result, the Fund may obtain no or limited recovery of its investment, and any recovery may be significantly delayed.
Credit Risk. Credit risk is the risk that the value of loans or other debt instruments may decline if the borrower or the issuer thereof defaults or otherwise becomes unable or unwilling, or is perceived to be unable or unwilling, to honor its financial obligations, such as making payments to the Fund when due. Credit rating agencies, such as S&P Global Ratings, Moody’s Investors Service, Inc. (Moody’s Ratings), Fitch Ratings, Inc. (Fitch), Morningstar DBRS (DBRS) and Kroll Bond Rating Agency, LLC (KBRA), assign credit ratings to certain loans and debt instruments to indicate their credit risk. A rating downgrade by such agencies can negatively impact the value of such instruments. Lower-rated
4
Prospectus 2026
Variable Portfolio – Partners Core Bond Fund
Summary of the Fund (continued)
or unrated loans or instruments held by the Fund may present increased credit risk as compared to higher-rated loans or instruments. Non-investment grade loans or debt instruments may be subject to greater price fluctuations and are more likely to experience a default than investment grade loans or debt instruments and therefore may expose the Fund to increased credit risk. If the Fund purchases unrated loans or instruments, or if the ratings of loans or instruments held by the Fund are lowered after purchase, the Fund will depend on analysis of credit risk more heavily than usual.
Derivatives Risk. Derivatives may involve significant risks. Derivatives are financial instruments with a value in relation to, or derived from, the value of an underlying asset(s) or other reference, such as an index, rate or other economic indicator (each an underlying reference). Derivatives may include those that are privately placed or otherwise exempt from SEC registration, including certain Rule 144A eligible securities. Derivatives could result in Fund losses if the underlying reference does not perform as anticipated. Use of derivatives is a highly specialized activity that can involve investment techniques, risks, and tax planning different from those associated with more traditional investment instruments. The Fund’s derivatives strategy may not be successful, and use of certain derivatives could result in substantial, potentially unlimited, losses to the Fund regardless of the Fund’s actual investment. A relatively small movement in the price, rate or other economic indicator associated with the underlying reference may result in substantial losses for the Fund. Derivatives may be more volatile than other types of investments. The value of derivatives may be influenced by a variety of factors, including national and international political and economic developments. Potential changes to the regulation of the derivatives markets may make derivatives more costly, may limit the market for derivatives, or may otherwise adversely affect the value or performance of derivatives. Derivatives can increase the Fund’s risk exposure to underlying references and their attendant risks, such as credit risk, market risk, foreign currency risk and interest rate risk, while potentially exposing the Fund to correlation risk, counterparty risk, hedging risk, inflation risk, leverage risk, liquidity risk, pricing risk and volatility risk.
Derivatives Risk – Forward Contracts Risk. A forward contract is an over-the-counter derivative transaction between two parties to buy or sell a specified amount of an underlying reference at a specified price (or rate) on a specified date in the future. Forward contracts are negotiated on an individual basis and are not standardized or traded on exchanges. The market for forward contracts is substantially unregulated and can experience lengthy periods of illiquidity, unusually high trading volume and other negative impacts, such as political intervention, which may result in volatility or disruptions in such markets. A relatively small price movement in a forward contract may result in substantial losses to the Fund, exceeding the amount of the margin paid. Forward contracts can increase the Fund’s risk exposure to underlying references and their attendant risks, such as credit risk, market risk, foreign currency risk and interest rate risk, while potentially exposing the Fund to correlation risk, counterparty risk, hedging risk, inflation risk, leverage risk, liquidity risk, pricing risk and volatility risk.
Derivatives Risk – Futures Contracts Risk. A futures contract is an exchange-traded derivative transaction between two parties in which a buyer (holding the “long” position) agrees to pay a fixed price (or rate) at a specified future date for delivery of an underlying reference from a seller (holding the “short” position). The seller hopes that the market price on the delivery date is less than the agreed upon price, while the buyer hopes for the contrary. Certain futures contract markets are highly volatile, and futures contracts may be illiquid. Futures exchanges may limit fluctuations in futures contract prices by imposing a maximum permissible daily price movement. The Fund may be disadvantaged if it is prohibited from executing a trade outside the daily permissible price movement. At or prior to maturity of a futures contract, the Fund may enter into an offsetting contract and may incur a loss to the extent there has been adverse movement in futures contract prices. The liquidity of the futures markets depends on participants entering into offsetting transactions rather than making or taking delivery. To the extent participants make or take delivery, liquidity in the futures market could be reduced. As a result, a relatively small price movement in a futures contract may result in substantial losses to the Fund, exceeding the amount of the margin paid. For certain types of futures contracts, losses are potentially unlimited. Futures markets are highly volatile, and the use of futures may increase the volatility of the Fund’s NAV. Futures contracts executed (if any) on foreign exchanges may not provide the same protection as U.S. exchanges. Futures contracts can increase the Fund’s risk exposure to underlying
Prospectus 2026
5
Variable Portfolio – Partners Core Bond Fund
Summary of the Fund (continued)
references and their attendant risks, such as credit risk, market risk, foreign currency risk and interest rate risk, while potentially exposing the Fund to correlation risk, counterparty risk, hedging risk, inflation risk, leverage risk, liquidity risk, pricing risk and volatility risk.
Derivatives Risk – Options Risk. Options are derivatives that give the purchaser the option to buy (call) or sell (put) an underlying reference from or to a counterparty at a specified price (the strike price) on or before an expiration date. When writing options, the Fund is exposed to the risk that it may be required to buy or sell the underlying reference at a disadvantageous price on or before the expiration date. Options may involve economic leverage, which could result in greater volatility in price movement. The Fund's losses could be significant and are potentially unlimited for certain types of options. Options may be traded on a securities exchange or in the over-the-counter market. At or prior to maturity of an options contract, the Fund may enter into an offsetting contract and may incur a loss to the extent there has been adverse movement in options prices. Options can increase the Fund’s risk exposure to underlying references and their attendant risks, such as credit risk, market risk, foreign currency risk and interest rate risk, while potentially exposing the Fund to correlation risk, counterparty risk, hedging risk, inflation risk, leverage risk, liquidity risk, pricing risk and volatility risk.
Derivatives Risk – Swaps Risk. In a typical swap transaction, two parties agree to exchange the return earned on a specified underlying reference for a fixed return or the return from another underlying reference during a specified period of time. Swaps may be difficult to value and may be illiquid. Swaps could result in Fund losses if the underlying asset or reference does not perform as anticipated. Swaps create significant investment leverage such that a relatively small price movement in a swap may result in immediate and substantial losses to the Fund. The Fund may only close out a swap with its particular counterparty and may only transfer a position with the consent of that counterparty. Certain swaps, such as short swap transactions and total return swaps, have the potential for unlimited losses, regardless of the size of the initial position. Swaps can increase the Fund’s risk exposure to underlying references and their attendant risks, such as credit risk, market risk, foreign currency risk and interest rate risk, while potentially exposing the Fund to correlation risk, counterparty risk, hedging risk, inflation risk, leverage risk, liquidity risk, pricing risk and volatility risk.
Fixed Income Instruments Risk. The Fund is subject to the general risks and considerations associated with investing in debt securities, including the risk that issuers will fail to make timely payments of principal or interest or default altogether. Lower-rated securities in which the Fund may invest may be more volatile and may decline more in price in response to negative issuer developments or general economic news than higher rated securities. In addition, as interest rates rise, the Fund’s investments typically will lose value.
Foreign Securities Risk. Investments in or exposure to securities of foreign companies may involve heightened risks relative to investments in or exposure to securities of U.S. companies. Investing in securities of foreign companies subjects the Fund to the risks associated with an issuer’s (and any of its related companies’) country of organization and places of business operations, including risks related to political, regulatory, economic, social, diplomatic and other conditions or events (including, for example, military confrontations and actions, war, other conflicts, terrorism and disease/virus outbreaks and epidemics) occurring in the country or region, as well as risks associated with less developed custody and settlement practices. Foreign securities may be more volatile and less liquid than securities of U.S. companies and are subject to the risks associated with potential imposition of economic and other sanctions against a particular foreign country, its nationals or industries or businesses within the country. In addition, foreign governments may impose withholding or other taxes on the Fund’s income, capital gains or proceeds from the disposition of foreign securities, which could reduce the Fund’s return on such securities.
Forward Commitments on Mortgage-Backed Securities (including Dollar Rolls) Risk. When purchasing mortgage-backed securities in the “to be announced” (TBA) market (MBS TBAs), the seller agrees to deliver mortgage-backed securities for an agreed upon price on an agreed upon date, but may make no guarantee as to the specific securities to be delivered. In lieu of taking delivery of mortgage-backed securities, the Fund could enter into dollar rolls, which are transactions in which the Fund sells securities to a counterparty and simultaneously agrees to purchase those or similar securities in the future at a predetermined price. Dollar rolls involve the risk that the market value of the securities the Fund is obligated to repurchase may decline below the repurchase price, or that the counterparty may default on its obligations. These transactions may also increase the Fund’s portfolio turnover rate. If the Fund
6
Prospectus 2026
Variable Portfolio – Partners Core Bond Fund
Summary of the Fund (continued)
reinvests the proceeds of the security sold, the Fund will also be subject to the risk that the investments purchased with such proceeds will decline in value (a form of leverage risk). MBS TBAs and dollar rolls are subject to the risk that the counterparty to the transaction may not perform or be unable to perform in accordance with the terms of the instrument.
Frequent Trading Risk. The portfolio managers may actively and frequently trade investments in the Fund's portfolio to carry out its investment strategies. Frequent trading can also mean higher brokerage and other transaction costs, which could reduce the Fund's return. The trading costs associated with portfolio turnover may adversely affect the Fund’s performance.
High-Yield Investments Risk. Securities and other debt instruments held by the Fund that are rated below investment grade (commonly called “high-yield” or “junk” bonds) and unrated debt instruments of comparable quality expose the Fund to a greater risk of loss of principal and income than a fund that invests solely or primarily in investment grade debt instruments. In addition, these investments have greater price fluctuations, are less liquid and are more likely to experience a default than higher-rated debt instruments. High-yield debt instruments are considered to be predominantly speculative with respect to the issuer’s capacity to pay interest and repay principal.
Impairment of Collateral Risk. The value of collateral, if any, securing a loan can decline, and may be insufficient to meet the borrower’s obligations or difficult or costly to liquidate. In addition, the Fund’s access to collateral may be limited by bankruptcy or other insolvency laws. Further, certain floating rate and other loans may not be fully collateralized and may decline in value.
Interest Rate Risk. Interest rate risk is the risk of losses attributable to changes in interest rates. In general, if interest rates rise, the values of loans and other debt instruments tend to fall, and if interest rates fall, the values of loans and other debt instruments tend to rise. Changes in the value of a debt instrument usually will not affect the amount of income the Fund receives from it but will generally affect the value of your investment in the Fund. Changes in interest rates may also affect the liquidity of the Fund’s investments in debt instruments. In general, the longer the maturity or duration of a debt instrument, the greater its sensitivity to changes in interest rates. For example, a three-year duration means a bond is expected to decrease in value by 3% if interest rates rise 1% and increase in value by 3% if interest rates fall 1%. Interest rate declines also may increase prepayments of debt obligations, which, in turn, would increase prepayment risk. The Fund is subject to the risk that the income generated by its investments may not keep pace with inflation. Actions by governments and central banking authorities can result in increases or decreases in interest rates. Higher periods of inflation could lead such authorities to raise interest rates. Such actions may negatively affect the value of debt instruments held by the Fund, resulting in a negative impact on the Fund's performance and NAV. Any interest rate increases could cause the value of the Fund’s investments in debt instruments to decrease. Rising interest rates may prompt redemptions from the Fund, which may force the Fund to sell investments at a time when it is not advantageous to do so, which could result in losses.
Issuer Risk. An issuer in which the Fund invests or to which it has exposure may perform poorly or below expectations, and the value of its loans or securities may therefore decline, which may negatively affect the Fund’s performance. Underperformance of an issuer may be caused by poor management decisions, competitive pressures, breakthroughs in technology, reliance on suppliers, labor problems or shortages, corporate restructurings, fraudulent disclosures, natural disasters, military confrontations and actions, war, other conflicts, terrorism, disease/virus outbreaks, epidemics or other events, conditions and factors which may impair the value of your investment in the Fund.
Liquidity Risk. Liquidity risk is the risk associated with any event, circumstance, or characteristic of an investment or market that negatively impacts the Fund’s ability to sell, or realize the proceeds from the sale of, an investment at a desirable time or price. Liquidity risk may arise because of, for example, a lack of marketability of the investment, which means that when seeking to sell its portfolio investments, the Fund could find that selling is more difficult than anticipated, especially during times of high market volatility. Decreases in the number of financial institutions, including banks and broker-dealers, willing to make markets (match up sellers and buyers) in the Fund’s investments or decreases in their capacity or willingness to trade such investments may increase the Fund’s exposure to this risk. The debt market has experienced considerable growth, and financial institutions making markets in instruments purchased and sold by the Fund (e.g., bond dealers) have been subject to increased regulation. The impact of that
Prospectus 2026
7
Variable Portfolio – Partners Core Bond Fund
Summary of the Fund (continued)
growth and regulation on the ability and willingness of financial institutions to engage in trading or “making a market” in such instruments remains unsettled. Certain types of investments, such as lower-rated securities or those that are purchased and sold in over-the-counter markets, may be especially subject to liquidity risk. Securities or other assets in which the Fund invests may be traded in the over-the-counter market rather than on an exchange and therefore may be more difficult to purchase or sell at a fair price, which may have a negative impact on the Fund’s performance. Market participants attempting to sell the same or a similar instrument at the same time as the Fund could exacerbate the Fund’s exposure to liquidity risk. The Fund may have to accept a lower selling price for the holding, sell other liquid or more liquid investments that it might otherwise prefer to hold (thereby increasing the proportion of the Fund’s investments in less liquid or illiquid securities), or forego another more appealing investment opportunity. The liquidity of Fund investments may change significantly over time and certain investments that were liquid when purchased by the Fund may later become illiquid, particularly in times of overall economic distress. Changing regulatory, market or other conditions or environments (for example, the interest rate or credit environments) may also adversely affect the liquidity and the price of the Fund's investments. Judgment plays a larger role in valuing illiquid or less liquid investments as compared to valuing liquid or more liquid investments. Price volatility may be higher for illiquid or less liquid investments as a result of, for example, the relatively less frequent pricing of such securities (as compared to liquid or more liquid investments). Generally, the less liquid the market at the time the Fund sells a portfolio investment, the greater the risk of loss or decline of value to the Fund. Overall market liquidity and other factors can lead to an increase in redemptions, which may negatively impact Fund performance and NAV, including, for example, if the Fund is forced to sell investments in a down market. Floating rate loans generally are subject to legal or contractual restrictions on resale, may trade infrequently, their value may be impaired when the Fund needs to liquidate such loans, and are typically subject to extended settlement periods, each of which gives rise to liquidity risk.
Loan Assignment/Loan Participation Risk. If a bank loan is acquired through an assignment, the Fund may not be able to unilaterally enforce all rights and remedies under the loan and with regard to any associated collateral. If a bank loan is acquired through a participation, the Fund generally will have no right to enforce compliance by the borrower with the terms of the loan agreement, and the Fund may not benefit from the collateral supporting the debt obligation in which it has purchased the participation. As a result, the Fund will be exposed to the credit risk of both the borrower and the institution selling the participation.
Market Risk. The Fund may incur losses due to declines in the value of one or more securities in which it invests. These declines may be due to factors affecting a particular issuer, or the result of, among other things, political, regulatory, market, economic or social developments affecting the relevant market(s) more generally. In addition, turbulence in financial markets and reduced liquidity in equity, credit and/or fixed income markets may negatively affect many issuers, which could adversely affect the Fund’s ability to price or value hard-to-value assets in thinly traded and closed markets and could cause significant redemptions and operational challenges. Global economies and financial markets are increasingly interconnected, and conditions and events in one country, region or financial market may adversely impact issuers in a different country, region or financial market. These risks may be magnified if certain events or developments adversely interrupt the global supply chain; in these and other circumstances, such risks might affect companies worldwide. As a result, local, regional or global events such as terrorism, war, other conflicts, natural disasters, disease/virus outbreaks and epidemics or other public health issues, recessions, depressions or other events – or the potential for such events – could have a significant negative impact on global economic and market conditions.
Mortgage- and Other Asset-Backed Securities Risk. The value of any mortgage-backed and other asset-backed securities including collateralized debt obligations and collateralized loan obligations, if any, held by the Fund may be affected by, among other things, changes or perceived changes in: interest rates; factors concerning the interests in and structure of the issuer or the originator of the mortgages or other assets; the creditworthiness of the entities that provide any supporting letters of credit, surety bonds or other credit enhancements; or the market's assessment of the quality of underlying assets. Payment of principal and interest on some mortgage-backed securities (but not the market value of the securities themselves) may be guaranteed by the full faith and credit of a particular U.S. Government agency, authority, enterprise or instrumentality, and some, but not all, are also insured or guaranteed by the U.S. Government. Mortgage-backed securities issued by non-governmental issuers (such as commercial banks,
8
Prospectus 2026
Variable Portfolio – Partners Core Bond Fund
Summary of the Fund (continued)
savings and loan institutions, private mortgage insurance companies, mortgage bankers and other secondary market issuers) may entail greater risk than obligations guaranteed by the U.S. Government. Mortgage- and other asset-backed securities are subject to liquidity risk and prepayment risk. A decline or flattening of housing values may cause delinquencies in mortgages underlying mortgage-backed securities and thereby adversely affect the ability of the mortgage-backed securities issuer to make principal and/or interest payments to mortgage-backed securities holders, including the Fund. Rising or high interest rates tend to extend the duration of mortgage- and other asset-backed securities, making their prices more volatile and more sensitive to changes in interest rates.
Multi-Adviser Risk. The Fund has multiple advisory firms that each manage a portion of the Fund’s net assets on a daily basis. Each adviser makes investment decisions independently from the other adviser(s). It is possible that the security selection process of one adviser will not complement or may conflict or even contradict that of the other adviser(s), including making off-setting trades that have no net effect to the Fund, but which may increase Fund expenses. As a result, the Fund's exposure to a given security, industry, sector or market capitalization could be smaller or larger than if the Fund were managed by a single adviser, which could adversely affect the Fund's performance.
Prepayment and Extension Risk. Prepayment and extension risk is the risk that a loan, bond or other security or investment might, in the case of prepayment risk, be called or otherwise converted, prepaid or redeemed before maturity and, in the case of extension risk, that the investment might not be called as expected. In the case of prepayment risk, if the investment is converted, prepaid or redeemed before maturity, the portfolio managers may not be able to invest the proceeds in other investments providing as high a level of income, resulting in a reduced yield to the Fund. As interest rates decrease or spreads narrow on such investments, the likelihood of prepayment increases. Conversely, extension risk is the risk that an unexpected rise in interest rates will extend the life of an investment beyond the prepayment time. If the Fund’s investments are locked in at a lower interest rate for a longer period of time, the portfolio managers may be unable to capitalize on investments with higher interest rates or wider spreads.
Reinvestment Risk. Reinvestment risk arises when the Fund is unable to reinvest income or principal at the same or at least the same return it is currently earning.
Reverse Repurchase Agreements Risk. Reverse repurchase agreements are agreements in which a Fund sells a security to a counterparty, such as a bank or broker-dealer, in return for cash and agrees to repurchase that security at a mutually agreed upon price and time. Reverse repurchase agreements carry the risk that the market value of the security sold by the Fund may decline below the price at which the Fund must repurchase the security. Reverse repurchase agreements also may be viewed as a form of borrowing, and borrowed assets used for investment creates leverage risk (the risk that losses may be greater than the amount invested). Leverage can create an interest expense that may lower the Fund's overall returns. Leverage presents the opportunity for increased net income and capital gains, but may also exaggerate the Fund’s volatility and risk of loss. There can be no guarantee that this strategy will be successful.
Rule 144A and Other Exempted Securities Risk. The Fund may invest in privately placed and other securities or instruments exempt from SEC registration (collectively “private placements”), subject to certain regulatory restrictions. In the U.S. market, private placements are typically sold only to qualified institutional buyers, or qualified purchasers, as applicable. An insufficient number of buyers interested in purchasing private placements at a particular time could adversely affect the marketability of such investments and the Fund might be unable to dispose of them promptly or at reasonable prices, subjecting the Fund to liquidity risk. The Fund’s holdings of private placements may increase the level of Fund illiquidity if eligible buyers are unable or unwilling to purchase them at a particular time. Issuers of Rule 144A eligible securities are required to furnish information to potential investors upon request. However, the required disclosure is much less extensive than that required of public companies and is not publicly available since the offering information is not filed with the SEC. Further, issuers of Rule 144A eligible securities can require recipients of the offering information (such as the Fund) to agree contractually to keep the information confidential, which could also adversely affect the Fund’s ability to dispose of the security.
Prospectus 2026
9
Variable Portfolio – Partners Core Bond Fund
Summary of the Fund (continued)
U.S. Government Obligations Risk. While U.S. Treasury obligations are backed by the “full faith and credit” of the U.S. Government, such securities are nonetheless subject to credit risk (i.e., the risk that the U.S. Government may be, or be perceived to be, unable or unwilling to honor its financial obligations, such as making payments). Securities issued or guaranteed by federal agencies or authorities and U.S. Government-sponsored instrumentalities or enterprises may or may not be backed by the full faith and credit of the U.S. Government.
Unrated Securities Risk. The Fund may purchase unrated securities which are not rated by a rating agency. Unrated securities may be less liquid than comparable rated securities and involve the risk that the Investment Manager may not accurately evaluate the security’s comparative credit rating. Analysis of creditworthiness of issuers of high yield securities may be more complex than for issuers of higher-quality debt securities. To the extent that the Fund purchases unrated securities, the Fund’s success in achieving its investment objective may depend more heavily on the Investment Manager’s creditworthiness analysis than if the Fund invested exclusively in rated securities.
Performance Information
The following bar chart and table show you how the Fund has performed in the past, and can help you understand the risks of investing in the Fund. The bar chart shows how the Fund’s Class 2 share performance has varied for each full calendar year shown. The table below the bar chart compares the Fund’s returns for the periods shown with a broad measure of market performance.
Except for differences in annual returns resulting from differences in expenses (where applicable), the share classes of the Fund would have substantially similar annual returns because all share classes of the Fund invest in the same portfolio of securities.
The returns shown do not reflect any fees and expenses imposed under your Contract or Qualified Plan and would be lower if they did.
The Fund’s performance prior to May 2017 reflects returns achieved by one or more different subadvisers. If the Fund’s current subadvisers had been in place for the prior periods, results shown may have been different.
| Year by Year Total Return (%) as of December 31 Each Year |
Best and Worst Quarterly Returns During the Period Shown in the Bar Chart | ||
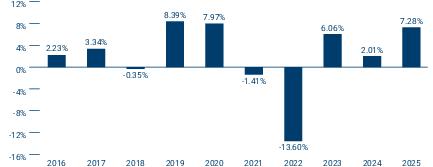 |
|
|
|
| |
|
- | |
| |
Share Class Inception Date |
1 Year |
5 Years |
10 Years |
| Class 1 |
|
|
|
|
| Class 2 |
|
|
- |
|
| Bloomberg U.S. Aggregate Bond Index (reflects no deductions for fees, expenses or taxes) |
|
|
- |
|
10
Prospectus 2026
Variable Portfolio – Partners Core Bond Fund
Summary of the Fund (continued)
Fund Management
Investment Manager: Columbia Management Investment Advisers, LLC
Subadviser: Allspring Global Investments, LLC (Allspring)
| Portfolio Management |
Title |
Role with Fund |
Managed Fund Since |
| Maulik Bhansali, CFA |
Senior Portfolio Manager and Co-Head of Core Fixed Income team at Allspring |
Co-Portfolio Manager |
2017 |
| Jarad Vasquez |
Senior Portfolio Manager and Co-Head of Core Fixed Income team at Allspring |
Co-Portfolio Manager |
2017 |
Subadviser: J.P. Morgan Investment Management Inc. (JPMIM)
| Portfolio Management |
Title |
Role with Fund |
Managed Fund Since |
| Richard Figuly |
Managing Director and Portfolio Manager of JPMIM |
Co-Portfolio Manager |
2016 |
| J. Andrew Norelli |
Managing Director and Portfolio Manager of JPMIM |
Co-Portfolio Manager |
2021 |
| Thomas Hauser, CFA |
Managing Director and Portfolio Manager of JPMIM |
Co-Portfolio Manager |
2021 |
| Kay Herr, CFA |
Managing Director and Portfolio Manager of JPMIM |
Co-Portfolio Manager |
2023 |
| Priya Misra |
Managing Director and Portfolio Manager of JPMIM |
Co-Portfolio Manager |
2024 |
| Vikas Panthani |
Managing Director and Portfolio Manager of JPMIM |
Co-Portfolio Manager |
2025 |
Purchase and Sale of Fund Shares
The Fund is available for purchase through Contracts offered by the separate accounts of participating insurance companies or Qualified Plans or by other eligible investors authorized by Columbia Management Investment Distributors, Inc. (the Distributor). Shares of the Fund may not be purchased or sold by individual owners of Contracts or Qualified Plans. If you are a Contract holder or Qualified Plan participant, please refer to your separate Contract prospectus or Qualified Plan disclosure documents for information about minimum investment requirements and how to purchase and redeem shares of the Fund on days the Fund is open for business.
Tax Information
The Fund normally distributes its net investment income and net realized capital gains, if any, to its shareholders, which are generally the participating insurance companies and Qualified Plans investing in the Fund through separate accounts. These distributions may not be taxable to you as the holder of a Contract or a participant in a Qualified Plan. Please consult the prospectus or other information provided to you by your participating insurance company and/or Qualified Plan regarding the U.S. federal income taxation of your contract, policy and/or plan.
Payments to Broker-Dealers and Other Financial Intermediaries
If you make allocations to the Fund, the Fund, its Distributor or other related companies may pay participating insurance companies or other financial intermediaries for the allocation (sale) of Fund shares and related services in connection with such allocations to the Fund. These payments may create a conflict of interest by influencing the participating insurance company, other financial intermediary or your salesperson to recommend an allocation to the Fund over another fund or other investment option. Ask your financial advisor or salesperson or visit your financial intermediary’s website for more information.
Prospectus 2026
11
Variable Portfolio – Partners Core Bond Fund
More Information About the Fund
Investment Objective
Variable Portfolio – Partners Core Bond Fund (the Fund) seeks to provide shareholders with a high level of current income while conserving the value of the investment for the longest period of time. The Fund’s investment objective is not a fundamental policy and may be changed by the Fund’s Board of Trustees without shareholder approval as long as shareholders are given 60 days’ advance written notice of the change. Because any investment involves risk, there is no assurance the Fund’s investment objective will be achieved.
Principal Investment Strategies
Under normal circumstances, the Fund invests at least 80% of its net assets (plus the amount of any borrowings for investment purposes) in U.S. dollar-denominated bonds and other debt instruments of investment grade quality (referred to as core bonds), like those included in the Bloomberg U.S. Aggregate Bond Index (the Index). The Index includes securities issued by the U.S. Government and its agencies and instrumentalities, corporate bonds, and mortgage- and asset-backed securities. The Fund may invest in mortgage dollar rolls and reverse repurchase agreements. The Fund may also invest in foreign debt instruments denominated in U.S. dollars or in foreign currencies. The Fund may also invest in loans and loan participations. The Fund considers a bond or other debt instrument to be of investment grade quality if it is rated investment grade by a nationally recognized statistical rating organization or, if unrated, determined by the investment manager to be of comparable quality.
The Fund may invest in debt instruments that, at the time of purchase, are rated below investment grade or are unrated but determined to be of comparable quality (commonly referred to as “high-yield” investments or “junk” bonds).
The Fund may invest in derivatives, such as futures (including interest rate futures to manage duration and curve risk), options (including options on futures for hedging interest rates), swaps (including credit default swaps) and forwards (including foreign exchange forwards for hedging and/or investment purposes).
The Fund may purchase or sell securities on a when-issued, delayed delivery or forward commitment basis. Such securities may include mortgage-backed securities acquired or sold in the “to be announced” (TBA) market and those in a dollar roll transaction.
The Fund may invest in privately placed and other securities or instruments that are purchased and sold pursuant to Rule 144A or other exemptions under the Securities Act of 1933, as amended, subject to certain regulatory restrictions.
The Fund’s investment strategy may involve the frequent trading of portfolio securities.
Columbia Management Investment Advisers, LLC (Columbia Management or the Investment Manager) serves as the investment manager to the Fund and is responsible for the oversight of, including the establishment of risk management parameters for, the Fund’s subadvisers: Allspring Global Investments, LLC (Allspring) and J.P. Morgan Investment Management Inc. (JPMIM) (Allspring and JPMIM, each a Subadviser and collectively, the Subadvisers). The Subadvisers provide day-to-day portfolio management to the Fund. The Investment Manager, subject to the oversight of the Fund’s Board of Trustees, decides the proportion of the Fund’s assets to be managed by each Subadviser, and may change these proportions at any time. Each Subadviser acts independently of any other Subadviser and uses its own methodology for selecting investments. Each Subadviser employs an active investment strategy.
Allspring
Allspring uses a bottom-up security selection process, focusing on the more liquid sectors of the bond market and active relative value management. Allspring manages portfolio duration and yield curve exposure relatively close to that of the benchmark, in order to ensure that security selection is the primary driver of performance.
12
Prospectus 2026
Variable Portfolio – Partners Core Bond Fund
More Information About the Fund (continued)
Allspring invests in debt securities that they believe offer competitive returns and are undervalued, offering additional income and/or price appreciation potential relative to other debt securities of similar credit quality and interest rate sensitivity. Allspring may sell a security that has achieved its desired return or if they believe the security or its sector has become overvalued. Allspring may also sell a security if a more attractive opportunity becomes available or if the security is no longer attractive due to its risk profile or as a result of changes in the overall market environment.
JPMIM
JPMIM analyzes four major factors in managing and constructing the Fund’s investment portfolio: duration, market sectors, maturity concentrations and individual securities. JPMIM looks for market sectors and individual securities that it believes will perform well over time. JPMIM selects individual securities after performing a risk/reward analysis that includes an evaluation of interest rate risk, credit risk and the complex legal and technical structure of the transaction.
JPMIM blends bottom-up security selection with a top-down macro overlay when managing fixed income investments, including:
■
identifying securities that it believes are priced inefficiently;
■
making sector allocation decisions based on a broad sector outlook, utilizing expected return and valuation analysis;
■
managing the yield curve, with an emphasis on evaluating relative risk/reward relationships along the yield curve; and
■
managing portfolio duration, primarily as a risk control measure.
The Fund’s investment policy with respect to 80% of its net assets may be changed by the Fund’s Board of Trustees without shareholder approval as long as shareholders are given 60 days’ advance written notice of the change.
Principal Risks
An investment in the Fund involves risks, including Interest Rate Risk, Mortgage- and Other Asset-Backed Securities Risk, Credit Risk, Market Risk, Multi-Adviser Risk, and Changing Distribution Level Risk, among others. Descriptions of these and other principal risks of investing in the Fund are provided below. There is no assurance that the Fund will achieve its investment objective and you may lose money. The value of the Fund’s holdings may decline, and the Fund’s net asset value (NAV) and share price may go down. An investment in the Fund is not a bank deposit and is not insured or guaranteed by the Federal Deposit Insurance Corporation or any other government agency. The significance of any specific risk to an investment in the Fund will vary over time depending on the composition of the Fund's portfolio, market conditions, and other factors. You should read all of the risk information below carefully, because any one or more of these risks may result in losses to the Fund.
Active Management Risk. The Fund is actively managed and its performance therefore will reflect, in part, the ability of the portfolio managers to make investment decisions that seek to achieve the Fund’s investment objective. Due to its active management, the Fund could underperform its benchmark index and/or other funds with similar investment objectives and/or strategies.
Changing Distribution Level Risk. The Fund normally expects to receive income which may include interest, dividends and/or capital gains, depending upon its investments. The distribution amounts paid by the Fund will vary and generally depend on the amount of income the Fund earns (less expenses) on its portfolio holdings, and capital gains or losses it recognizes. A decline in the Fund’s income or net capital gains arising from its investments may reduce its distribution level.
Counterparty Risk. The risk exists that a counterparty to a transaction in a financial instrument held by the Fund or by a special purpose or structured vehicle in which the Fund invests may become insolvent or otherwise fail to perform its obligations, including making payments to the Fund, due to financial difficulties. The Fund may obtain no or limited recovery in a bankruptcy or other reorganizational proceedings, and any recovery may be significantly delayed. Transactions that the Fund enters into may involve counterparties in the financials sector and, as a result, events affecting the financials sector may cause the Fund’s NAV to fluctuate.
Prospectus 2026
13
Variable Portfolio – Partners Core Bond Fund
More Information About the Fund (continued)
Credit Risk. Credit risk is the risk that the value of loans or other debt instruments may decline if the borrower or the issuer thereof defaults or otherwise becomes unable or unwilling, or is perceived to be unable or unwilling, to honor its financial obligations, such as making payments to the Fund when due. Various factors could affect the actual or perceived willingness or ability of the borrower or the issuer to make timely interest or principal payments, including changes in the financial condition of the borrower or the issuer or in general economic conditions. Credit rating agencies, such as S&P Global Ratings, Moody’s Ratings, Fitch, DBRS and KBRA, assign credit ratings to certain loans and debt instruments to indicate their credit risk. A rating downgrade by such agencies can negatively impact the value of such instruments. Lower-rated or unrated loans or instruments held by the Fund may present increased credit risk as compared to higher-rated loans or instruments. Non-investment grade loans or debt instruments may be subject to greater price fluctuations and are more likely to experience a default than investment grade loans or debt instruments and therefore may expose the Fund to increased credit risk. If the Fund purchases unrated loans or instruments, or if the ratings of loans or instruments held by the Fund are lowered after purchase, the Fund will depend on analysis of credit risk more heavily than usual.
Derivatives Risk. Derivatives may involve significant risks. Derivatives are financial instruments, traded on an exchange or in the over-the-counter (OTC) markets, with a value in relation to, or derived from, the value of an underlying asset(s) (such as a security, commodity or currency) or other reference, such as an index, rate or other economic indicator (each an underlying reference). Derivatives may include those that are privately placed or otherwise exempt from SEC registration, including certain Rule 144A eligible securities. Derivatives could result in Fund losses if the underlying reference does not perform as anticipated. Use of derivatives is a highly specialized activity that can involve investment techniques, risks, and tax planning different from those associated with more traditional investment instruments. The Fund’s derivatives strategy may not be successful, and use of certain derivatives could result in substantial, potentially unlimited, losses to the Fund regardless of the Fund’s actual investment. A relatively small movement in the price, rate or other economic indicator associated with the underlying reference may result in substantial losses for the Fund. Derivatives may be more volatile than other types of investments. Derivatives can increase the Fund’s risk exposure to underlying references and their attendant risks, including the risk of an adverse credit event associated with the underlying reference (credit risk), the risk of an adverse movement in the value, price or rate of the underlying reference (market risk), the risk of an adverse movement in the value of underlying currencies (foreign currency risk) and the risk of an adverse movement in underlying interest rates (interest rate risk). Derivatives may expose the Fund to additional risks, including the risk of loss due to a derivative position that is imperfectly correlated with the underlying reference it is intended to hedge or replicate (correlation risk), the risk that a counterparty will fail to perform as agreed (counterparty risk), the risk that a hedging strategy may fail to mitigate losses, and may offset gains (hedging risk), the risk that the return on an investment may not keep pace with inflation (inflation risk), the risk that losses may be greater than the amount invested (leverage risk), the risk that the Fund may be unable to sell an investment at an advantageous time or price (liquidity risk), the risk that the investment may be difficult to value (pricing risk), and the risk that the price or value of the investment fluctuates significantly over short periods of time (volatility risk). The value of derivatives may be influenced by a variety of factors, including national and international political and economic developments. Potential changes to the regulation of the derivatives markets may make derivatives more costly, may limit the market for derivatives, or may otherwise adversely affect the value or performance of derivatives.
Derivatives Risk – Forward Contracts Risk. A forward contract is an over-the-counter derivative transaction between two parties to buy or sell a specified amount of an underlying reference at a specified price (or rate) on a specified date in the future. Forward contracts are negotiated on an individual basis and are not standardized or traded on exchanges. The market for forward contracts is substantially unregulated (there is no limit on daily price movements and speculative position limits are not applicable). The principals who deal in certain forward contract markets are not required to continue to make markets in the underlying references in which they trade and these markets can experience periods of illiquidity, sometimes of significant duration. There have been periods during which certain participants in forward contract markets have refused to quote prices for certain underlying references or have quoted prices with an unusually wide spread between the price at which they were prepared to buy and that at which they were prepared to sell. At or prior to maturity of a forward contract, the Fund may enter into an offsetting contract and may incur a loss to the extent there has been adverse movement in forward contract prices. The liquidity of the markets for forward contracts depends on participants entering into offsetting transactions rather
14
Prospectus 2026
Variable Portfolio – Partners Core Bond Fund
More Information About the Fund (continued)
than making or taking delivery. To the extent participants make or take delivery, liquidity in the market for forwards could be reduced. A relatively small price movement in a forward contract may result in substantial losses to the Fund, exceeding the amount of the margin paid. Forward contracts can increase the Fund’s risk exposure to underlying references and their attendant risks, such as credit risk, market risk, foreign currency risk and interest rate risk, while potentially exposing the Fund to correlation risk, counterparty risk, hedging risk, inflation risk, leverage risk, liquidity risk, pricing risk and volatility risk.
■
A forward foreign currency contract is a derivative (forward contract) in which the underlying reference is a country's or region’s currency. The Fund may agree to buy or sell a country's or region’s currency at a specific price on a specific date in the future. These instruments may fall in value (sometimes dramatically) due to foreign market downswings or foreign currency value fluctuations, subjecting the Fund to foreign currency risk (the risk that Fund performance may be negatively impacted by foreign currency strength or weakness relative to the U.S. dollar, particularly if the Fund exposes a significant percentage of its assets to currencies other than the U.S. dollar). Unanticipated changes in the currency markets could result in reduced performance for the Fund. When the Fund converts its foreign currencies into U.S. dollars, it may incur currency conversion costs due to the spread between the prices at which it may buy and sell various currencies in the market.
Derivatives Risk – Futures Contracts Risk. A futures contract is an exchange-traded derivative transaction between two parties in which a buyer (holding the “long” position) agrees to pay a fixed price (or rate) at a specified future date for delivery of an underlying reference from a seller (holding the “short” position). The seller hopes that the market price on the delivery date is less than the agreed upon price, while the buyer hopes for the contrary. Certain futures contract markets are highly volatile, and futures contracts may be illiquid. Futures exchanges may limit fluctuations in futures contract prices by imposing a maximum permissible daily price movement. The Fund may be disadvantaged if it is prohibited from executing a trade outside the daily permissible price movement. At or prior to maturity of a futures contract, the Fund may enter into an offsetting contract and may incur a loss to the extent there has been adverse movement in futures contract prices. The liquidity of the futures markets depends on participants entering into offsetting transactions rather than making or taking delivery. To the extent participants make or take delivery, liquidity in the futures market could be reduced. Positions in futures contracts may be closed out only on the exchange on which they were entered into or through a linked exchange, and no secondary market exists for such contracts. Futures positions are marked to market each day, and variation margin payment must be paid to or by the Fund. As a result, a relatively small price movement in a futures contract may result in substantial losses to the Fund, exceeding the amount of the margin paid. For certain types of futures contracts, losses are potentially unlimited. Futures markets are highly volatile, and the use of futures may increase the volatility of the Fund’s NAV. Futures contracts executed (if any) on foreign exchanges may not provide the same protection as U.S. exchanges. Futures contracts can increase the Fund’s risk exposure to underlying references and their attendant risks, such as credit risk, market risk, foreign currency risk and interest rate risk, while potentially exposing the Fund to correlation risk, counterparty risk, hedging risk, inflation risk, leverage risk, liquidity risk, pricing risk and volatility risk.
■
An interest rate future is a derivative that is an agreement whereby the buyer and seller agree to the future delivery of an interest-bearing instrument on a specific date at a pre-determined price. Examples include Treasury-bill futures, Treasury-bond futures and Eurodollar futures.
Derivatives Risk – Options Risk. Options are derivatives that give the purchaser the option to buy (call) or sell (put) an underlying reference from or to a counterparty at a specified price (the strike price) on or before an expiration date. The Fund may purchase or write (i.e., sell) put and call options on an underlying reference it is otherwise permitted to invest in. When writing options, the Fund is exposed to the risk that it may be required to buy or sell the underlying reference at a disadvantageous price on or before the expiration date. If the Fund sells a put option, the Fund may be required to buy the underlying reference at a strike price that is above market price, resulting in a loss. If the Fund sells a call option, the Fund may be required to sell the underlying reference at a strike price that is below market price, resulting in a loss. If the Fund sells a call option that is not covered (it does not own the underlying reference), the Fund's losses are potentially unlimited. Options may involve economic leverage, which could result in greater volatility in price movement. Options may be traded on a securities exchange or in the over-the-counter market. At or prior to maturity of an options contract, the Fund may enter into an offsetting contract and may incur a loss to the extent there has been adverse movement in options prices. Options can increase the Fund’s risk exposure
Prospectus 2026
15
Variable Portfolio – Partners Core Bond Fund
More Information About the Fund (continued)
to underlying references and their attendant risks, such as credit risk, market risk, foreign currency risk and interest rate risk, while potentially exposing the Fund to correlation risk, counterparty risk, hedging risk, inflation risk, leverage risk, liquidity risk, pricing risk and volatility risk.
Derivatives Risk – Swaps Risk. In a typical swap transaction, two parties agree to exchange the return earned on a specified underlying reference for a fixed return or the return from another underlying reference during a specified period of time. Swaps may be difficult to value and may be illiquid. Swaps could result in Fund losses if the underlying asset or reference does not perform as anticipated. Swaps create significant investment leverage such that a relatively small price movement in a swap may result in immediate and substantial losses to the Fund. The Fund may only close out a swap with its particular counterparty and may only transfer a position with the consent of that counterparty. Certain swaps, such as short swap transactions and total return swaps, have the potential for unlimited losses, regardless of the size of the initial position. Swaps can increase the Fund’s risk exposure to underlying references and their attendant risks, such as credit risk, market risk, foreign currency risk and interest rate risk, while potentially exposing the Fund to correlation risk, counterparty risk, hedging risk, inflation risk, leverage risk, liquidity risk, pricing risk and volatility risk.
■
A credit default swap (including a swap on a credit default index, sometimes referred to as a credit default swap index) is a derivative and special type of swap where one party pays, in effect, an insurance premium through a stream of payments to another party in exchange for the right to receive a specified return upon the occurrence of a particular credit event by one or more third parties, such as bankruptcy, default or a similar event. A credit default swap may be embedded within a structured note or other derivative instrument. Credit default swaps enable an investor to buy or sell protection against such a credit event (such as an issuer’s bankruptcy, restructuring or failure to make timely payments of interest or principal). Credit default swap indices are indices that reflect the performance of a basket of credit default swaps and are subject to the same risks as credit default swaps. If such a default were to occur, any contractual remedies that the Fund may have may be subject to bankruptcy and insolvency laws, which could delay or limit the Fund's recovery. Thus, if the counterparty under a credit default swap defaults on its obligation to make payments thereunder, as a result of its bankruptcy or otherwise, the Fund may lose such payments altogether, or collect only a portion thereof, which collection could involve costs or delays. The Fund’s return from investment in a credit default swap index may not match the return of the referenced index. Further, investment in a credit default swap index could result in losses if the referenced index does not perform as expected. Unexpected changes in the composition of the index may also affect performance of the credit default swap index. If a referenced index has a dramatic intraday move that causes a material decline in the Fund’s net assets, the terms of the Fund’s credit default swap index may permit the counterparty to immediately close out the transaction. In that event, the Fund may be unable to enter into another credit default swap index or otherwise achieve desired exposure, even if the referenced index reverses all or a portion of its intraday move.
Fixed Income Instruments Risk. The Fund is subject to the general risks and considerations associated with investing in debt securities, including the risk that issuers will fail to make timely payments of principal or interest or default altogether. Typically, shorter-term bonds are less volatile than longer-term bonds; however, longer-term bonds typically offer higher yields and more stable interest income than shorter-term bonds due to their longer term and extended fixed payment schedule. Lower-rated securities in which the Fund may invest may be more volatile and may decline more in price in response to negative issuer developments or general economic news than higher rated securities. In addition, as interest rates rise, the Fund’s investments typically will lose value.
Foreign Securities Risk. Investments in or exposure to securities of foreign companies may involve heightened risks relative to investments in or exposure to securities of U.S. companies. For example, foreign markets can be extremely volatile. Foreign securities may also be less liquid, making them more difficult to trade, than securities of U.S. companies so that the Fund may, at times, be unable to sell foreign securities at desirable times or prices. Brokerage commissions, custodial costs and other fees are also generally higher for foreign securities. The Fund may have limited or no legal recourse in the event of default with respect to certain foreign securities, including those issued by foreign governments. In addition, foreign governments may impose withholding or other taxes on the Fund’s income, capital gains or proceeds from the disposition of foreign securities, which could reduce the Fund’s return on such securities. In some cases, such withholding or other taxes could potentially be confiscatory.
16
Prospectus 2026
Variable Portfolio – Partners Core Bond Fund
More Information About the Fund (continued)
Other risks include: possible delays in the settlement of transactions or in the payment of income; generally less publicly available information about foreign companies; the impact of economic, political, social, diplomatic or other conditions or events (including, for example, military confrontations and actions, war, other conflicts, terrorism and disease/virus outbreaks and epidemics), possible seizure, expropriation or nationalization of a company or its assets or the assets of a particular investor or category of investors; accounting, auditing and financial reporting standards that may be less comprehensive and stringent than those applicable to domestic companies; the imposition of economic and other sanctions against a particular foreign country, its nationals or industries or businesses within the country; and the generally less stringent standard of care to which local agents may be held in the local markets. In addition, it may be difficult to obtain reliable information about the securities and business operations of certain foreign issuers. Governments or trade groups may compel local agents to hold securities in designated depositories that are not subject to independent evaluation. The less developed a country’s securities market is, the greater the level of risks. Economic sanctions may be, and have been, imposed against certain countries, organizations, companies, entities and/or individuals. Economic sanctions and other similar governmental actions could, among other things, effectively restrict or eliminate the Fund’s ability to purchase or sell securities, and thus may make the Fund’s investments in such securities less liquid or more difficult to value. In addition, as a result of economic sanctions, the Fund may be forced to sell or otherwise dispose of investments at inopportune times or prices, which could result in losses to the Fund and increased transaction costs. These conditions may be in place for a substantial period of time and enacted with limited advance notice to the Fund. The risks posed by sanctions against a particular foreign country, its nationals or industries or businesses within the country may be heightened to the extent the Fund invests significantly in the affected country or region or in issuers from the affected country that depend on global markets. Additionally, investments in certain countries may subject the Fund to a number of tax rules, the application of which may be uncertain. Countries may amend or revise their existing tax laws, regulations and/or procedures in the future, possibly with retroactive effect. Changes in or uncertainties regarding the laws, regulations or procedures of a country could reduce the after-tax profits of the Fund, directly or indirectly, including by reducing the after-tax profits of companies located in such countries in which the Fund invests, or result in unexpected tax liabilities for the Fund.
Forward Commitments on Mortgage-Backed Securities (including Dollar Rolls) Risk. When purchasing mortgage-backed securities in the “to be announced” (TBA) market (MBS TBAs), the seller agrees to deliver mortgage-backed securities for an agreed upon price on an agreed upon date, but may make no guarantee as to the specific securities to be delivered. In lieu of taking delivery of mortgage-backed securities, the Fund could enter into dollar rolls, which are transactions in which the Fund sells securities to a counterparty and simultaneously agrees to purchase those or similar securities in the future at a predetermined price. Dollar rolls involve the risk that the market value of the securities the Fund is obligated to repurchase may decline below the repurchase price, or that the counterparty may default on its obligations. These transactions may also increase the Fund’s portfolio turnover rate. If the Fund reinvests the proceeds of the security sold, the Fund will also be subject to the risk that the investments purchased with such proceeds will decline in value (a form of leverage risk). MBS TBAs and dollar rolls are subject to the risk that the counterparty to the transaction may not perform or be unable to perform in accordance with the terms of the instrument.
Frequent Trading Risk. The portfolio managers may actively and frequently trade investments in the Fund's portfolio to carry out its investment strategies. Frequent trading can also mean higher brokerage and other transaction costs, which could reduce the Fund's return. The trading costs associated with portfolio turnover may adversely affect the Fund’s performance.
High-Yield Investments Risk. Securities and other debt instruments held by the Fund that are rated below investment grade (commonly called “high-yield” or “junk” bonds) and unrated debt instruments of comparable quality tend to be more sensitive to credit risk than higher-rated debt instruments and may experience greater price fluctuations in response to perceived changes in the ability of the issuing entity or obligor to pay interest and principal when due than to changes in interest rates. These investments are generally more likely to experience a default than higher-rated debt instruments. High-yield debt instruments are considered to be predominantly speculative with respect to the issuer’s capacity to pay interest and repay principal. These debt instruments typically pay a premium – a higher interest rate or yield – because of the increased risk of loss, including default. High-yield
Prospectus 2026
17
Variable Portfolio – Partners Core Bond Fund
More Information About the Fund (continued)
debt instruments may require a greater degree of judgment to establish a price, may be difficult to sell at the time and price the Fund desires, may carry high transaction costs, and also are generally less liquid than higher-rated debt instruments. The ratings provided by third party rating agencies are based on analyses by these ratings agencies of the credit quality of the debt instruments and may not take into account every risk related to whether interest or principal will be timely repaid. In adverse economic and other circumstances, issuers of lower-rated debt instruments are more likely to have difficulty making principal and interest payments than issuers of higher-rated debt instruments.
Impairment of Collateral Risk. The value of collateral, if any, securing a loan can decline, and may be insufficient to meet the borrower’s obligations or difficult or costly to liquidate. In addition, the Fund’s access to collateral may be limited by bankruptcy or other insolvency laws. Further, certain floating rate and other loans may not be fully collateralized and may decline in value.
Interest Rate Risk. Interest rate risk is the risk of losses attributable to changes in interest rates. In general, if interest rates rise, the values of loans and other debt instruments tend to fall, and if interest rates fall, the values of loans and other debt instruments tend to rise. Changes in the value of a debt instrument usually will not affect the amount of income the Fund receives from it but will generally affect the value of your investment in the Fund. Changes in interest rates may also affect the liquidity of the Fund’s investments in debt instruments. In general, the longer the maturity or duration of a debt instrument, the greater its sensitivity to changes in interest rates. For example, a three-year duration means a bond is expected to decrease in value by 3% if interest rates rise 1% and increase in value by 3% if interest rates fall 1%. Interest rate declines also may increase prepayments of debt obligations, which, in turn, would increase prepayment risk (the risk that the Fund will have to reinvest the money received in securities that have lower yields). The Fund is subject to the risk that the income generated by its investments may not keep pace with inflation. Actions by governments and central banking authorities can result in increases or decreases in interest rates. Higher periods of inflation could lead such authorities to raise interest rates. Such actions may negatively affect the value of debt instruments held by the Fund, resulting in a negative impact on the Fund's performance and NAV. Debt instruments with floating coupon rates are typically less sensitive to interest rate changes, but these debt instruments may decline in value if their coupon rates do not rise as much as, or keep pace with, yields on such types of debt instruments. Because rates on certain floating rate loans and other debt instruments reset only periodically, changes in interest rates (and particularly sudden and significant changes) can be expected to cause fluctuations in the Fund’s NAV. Any interest rate increases could cause the value of the Fund’s investments in debt instruments to decrease. Rising interest rates may prompt redemptions from the Fund, which may force the Fund to sell investments at a time when it is not advantageous to do so, which could result in losses.
Issuer Risk. An issuer in which the Fund invests or to which it has exposure may perform poorly or below expectations, and the value of its loans or securities may therefore decline, which may negatively affect the Fund’s performance. Underperformance of an issuer may be caused by poor management decisions, competitive pressures, breakthroughs in technology, reliance on suppliers, labor problems or shortages, corporate restructurings, fraudulent disclosures, natural disasters, military confrontations and actions, war, other conflicts, terrorism, disease/virus outbreaks, epidemics or other events, conditions and factors which may impair the value of your investment in the Fund.
Liquidity Risk. Liquidity risk is the risk associated with any event, circumstance, or characteristic of an investment or market that negatively impacts the Fund’s ability to sell, or realize the proceeds from the sale of, an investment at a desirable time or price. Liquidity risk may arise because of, for example, a lack of marketability of the investment, which means that when seeking to sell its portfolio investments, the Fund could find that selling is more difficult than anticipated, especially during times of high market volatility. Decreases in the number of financial institutions, including banks and broker-dealers, willing to make markets (match up sellers and buyers) in the Fund’s investments or decreases in their capacity or willingness to trade such investments may increase the Fund’s exposure to this risk. The debt market has experienced considerable growth, and financial institutions making markets in instruments purchased and sold by the Fund (e.g., bond dealers) have been subject to increased regulation. The impact of that growth and regulation on the ability and willingness of financial institutions to engage in trading or “making a market” in such instruments remains unsettled. Certain types of investments, such as lower-rated securities or those that are purchased and sold in over-the-counter markets, may be especially subject to liquidity risk. Securities or
18
Prospectus 2026
Variable Portfolio – Partners Core Bond Fund
More Information About the Fund (continued)
other assets in which the Fund invests may be traded in the over-the-counter market rather than on an exchange and therefore may be more difficult to purchase or sell at a fair price, which may have a negative impact on the Fund’s performance. Market participants attempting to sell the same or a similar instrument at the same time as the Fund could exacerbate the Fund’s exposure to liquidity risk. The Fund may have to accept a lower selling price for the holding, sell other liquid or more liquid investments that it might otherwise prefer to hold (thereby increasing the proportion of the Fund’s investments in less liquid or illiquid securities), or forego another more appealing investment opportunity. The liquidity of Fund investments may change significantly over time and certain investments that were liquid when purchased by the Fund may later become illiquid, particularly in times of overall economic distress. Changing regulatory, market or other conditions or environments (for example, the interest rate or credit environments) may also adversely affect the liquidity and the price of the Fund's investments. Judgment plays a larger role in valuing illiquid or less liquid investments as compared to valuing liquid or more liquid investments. Price volatility may be higher for illiquid or less liquid investments as a result of, for example, the relatively less frequent pricing of such securities (as compared to liquid or more liquid investments). Generally, the less liquid the market at the time the Fund sells a portfolio investment, the greater the risk of loss or decline of value to the Fund. Overall market liquidity and other factors can lead to an increase in redemptions, which may negatively impact Fund performance and NAV, including, for example, if the Fund is forced to sell investments in a down market. Floating rate loans generally are subject to legal or contractual restrictions on resale, may trade infrequently, their value may be impaired when the Fund needs to liquidate such loans, and are typically subject to extended settlement periods, each of which gives rise to liquidity risk.
Loan Assignment/Loan Participation Risk. If a bank loan is acquired through an assignment, the Fund may not be able to unilaterally enforce all rights and remedies under the loan and with regard to any associated collateral. If a bank loan is acquired through a participation, the Fund generally will have no right to enforce compliance by the borrower with the terms of the loan agreement, and the Fund may not benefit from the collateral supporting the debt obligation in which it has purchased the participation. As a result, the Fund will be exposed to the credit risk of both the borrower and the institution selling the participation.
Market Risk. The Fund may incur losses due to declines in the value of one or more securities in which it invests. These declines may be due to factors affecting a particular issuer, or the result of, among other things, political, regulatory, market, economic or social developments affecting the relevant market(s) more generally. In addition, turbulence in financial markets and reduced liquidity in equity, credit and/or fixed income markets may negatively affect many issuers, which could adversely affect the Fund’s ability to price or value hard-to-value assets in thinly traded and closed markets and could cause significant redemptions and operational challenges. Global economies and financial markets are increasingly interconnected, and conditions and events in one country, region or financial market may adversely impact issuers in a different country, region or financial market. These risks may be magnified if certain events or developments adversely interrupt the global supply chain; in these and other circumstances, such risks might affect companies worldwide. As a result, local, regional or global events such as terrorism, war, other conflicts, natural disasters, disease/virus outbreaks and epidemics or other public health issues, recessions, depressions or other events – or the potential for such events – could have a significant negative impact on global economic and market conditions.
The large-scale invasion of Ukraine by Russia in February 2022 has resulted in sanctions and market disruptions, including declines in regional and global stock markets, unusual volatility in global commodity markets and significant devaluations of Russian currency. In addition, the Iranian conflict that commenced in February 2026 may result in similar, and potentially more severe, disruptions. Escalation of hostilities in the Middle East region could disrupt energy production or transportation, including through key shipping routes, which may lead to increased volatility in energy and other commodity prices. The extent and duration of these conflicts are impossible to predict but could continue to be significant. Market disruption caused by these conflicts, and any countermeasures or responses thereto (including international sanctions, a downgrade in a country’s credit rating, purchasing and financing restrictions, boycotts, tariffs, changes in consumer or purchaser preferences, cyberattacks and espionage) could continue to have severe adverse impacts on regional and/or global securities and commodities markets, including markets for oil and natural gas. These impacts may include reduced market liquidity, distress in credit
Prospectus 2026
19
Variable Portfolio – Partners Core Bond Fund
More Information About the Fund (continued)
markets, further disruption of global supply chains, increased risk of inflation, and limited access to investments in certain international markets and/or issuers. These developments and other related events could negatively impact Fund performance.
Mortgage- and Other Asset-Backed Securities Risk. The value of any mortgage-backed and other asset-backed securities including collateralized debt obligations and collateralized loan obligations, if any, held by the Fund may be affected by, among other things, changes or perceived changes in: interest rates; factors concerning the interests in and structure of the issuer or the originator of the mortgages or other assets; the creditworthiness of the entities that provide any supporting letters of credit, surety bonds or other credit enhancements; or the market's assessment of the quality of underlying assets. Mortgage-backed securities represent interests in, or are backed by, pools of mortgages from which payments of interest and principal (net of fees paid to the issuer or guarantor of the securities) are distributed to the holders of the mortgage-backed securities. Other types of asset-backed securities typically represent interests in, or are backed by, pools of receivables such as credit, automobile, student and home equity loans. Mortgage- and other asset-backed securities can have a fixed or an adjustable rate. Mortgage- and other asset-backed securities are subject to liquidity risk (the risk that it may not be possible for the Fund to liquidate the instrument at an advantageous time or price) and prepayment risk (the risk that the underlying mortgage or other asset may be refinanced or prepaid prior to maturity during periods of declining or low interest rates, causing the Fund to have to reinvest the money received in securities that have lower yields). In addition, the impact of prepayments on the value of mortgage- and other asset-backed securities may be difficult to predict and may result in greater volatility. A decline or flattening of housing values may cause delinquencies in mortgages underlying mortgage-backed securities and thereby adversely affect the ability of the mortgage-backed securities issuer to make principal and/or interest payments to mortgage-backed securities holders, including the Fund. Rising or high interest rates tend to extend the duration of mortgage- and other asset-backed securities, making them more volatile and more sensitive to changes in interest rates. Payment of principal and interest on some mortgage-backed securities (but not the market value of the securities themselves) may be guaranteed (i) by the full faith and credit of the U.S. Government (in the case of securities guaranteed by the Government National Mortgage Association) or (ii) by its agencies, authorities, enterprises or instrumentalities (in the case of securities guaranteed by the Federal National Mortgage Association (FNMA) or the Federal Home Loan Mortgage Corporation (FHLMC)), which are not insured or guaranteed by the U.S. Government (although FNMA and FHLMC may be able to access capital from the U.S. Treasury to meet their obligations under such securities). Mortgage-backed securities issued by non-governmental issuers (such as commercial banks, savings and loan institutions, private mortgage insurance companies, mortgage bankers and other secondary market issuers) may be supported by various credit enhancements, such as pool insurance, guarantees issued by governmental entities, letters of credit from a bank or senior/subordinated structures, and may entail greater risk than obligations guaranteed by the U.S. Government, whether or not such obligations are guaranteed by the private issuer.
Multi-Adviser Risk. The Fund has multiple advisory firms that each manage a portion of the Fund’s net assets on a daily basis. Each adviser makes investment decisions independently from the other adviser(s). It is possible that the security selection process of one adviser will not complement or may conflict or even contradict that of the other adviser(s), including making off-setting trades that have no net effect to the Fund, but which may increase Fund expenses. As a result, the Fund's exposure to a given security, industry, sector or market capitalization could be smaller or larger than if the Fund were managed by a single adviser, which could adversely affect the Fund's performance.
Prepayment and Extension Risk. Prepayment and extension risk is the risk that a loan, bond or other security or investment might, in the case of prepayment risk, be called or otherwise converted, prepaid or redeemed before maturity and, in the case of extension risk, that the investment might not be called as expected. In the case of prepayment risk, if the investment is converted, prepaid or redeemed before maturity, the portfolio managers may not be able to invest the proceeds in other investments providing as high a level of income, resulting in a reduced yield to the Fund. As interest rates decrease or spreads narrow on such investments, the likelihood of prepayment
20
Prospectus 2026
Variable Portfolio – Partners Core Bond Fund
More Information About the Fund (continued)
increases. Conversely, extension risk is the risk that an unexpected rise in interest rates will extend the life of an investment beyond the prepayment time. If the Fund's investments are locked in at a lower interest rate for a longer period of time, the portfolio managers may be unable to capitalize on investments with higher interest rates or wider spreads.
Reinvestment Risk. Reinvestment risk arises when the Fund is unable to reinvest income or principal at the same or at least the same return it is currently earning.
Reverse Repurchase Agreements Risk. Reverse repurchase agreements are agreements in which a Fund sells a security to a counterparty, such as a bank or broker-dealer, in return for cash and agrees to repurchase that security at a mutually agreed upon price and time. Reverse repurchase agreements carry the risk that the market value of the security sold by the Fund may decline below the price at which the Fund must repurchase the security. Reverse repurchase agreements also may be viewed as a form of borrowing, and borrowed assets used for investment creates leverage risk (the risk that losses may be greater than the amount invested). Leverage can create an interest expense that may lower the Fund's overall returns. Leverage presents the opportunity for increased net income and capital gains, but may also exaggerate the Fund’s volatility and risk of loss. There can be no guarantee that this strategy will be successful.
Rule 144A and Other Exempted Securities Risk. The Fund may invest in privately placed and other securities or instruments exempt from SEC registration (collectively “private placements”), subject to certain regulatory restrictions. In the U.S. market, private placements are typically sold only to qualified institutional buyers, or qualified purchasers, as applicable. An insufficient number of buyers interested in purchasing private placements at a particular time could adversely affect the marketability of such investments and the Fund might be unable to dispose of them promptly or at reasonable prices, subjecting the Fund to liquidity risk (the risk that it may not be possible for the Fund to liquidate the instrument at an advantageous time or price). The Fund’s holdings of private placements may increase the level of Fund illiquidity if eligible buyers are unable or unwilling to purchase them at a particular time. The Fund may also have to bear the expense of registering the securities for resale and the risk of substantial delays in effecting the registration. Additionally, the purchase price and subsequent valuation of private placements typically reflect a discount, which may be significant, from the market price of comparable securities for which a more liquid market exists. Issuers of Rule 144A eligible securities are required to furnish information to potential investors upon request. However, the required disclosure is much less extensive than that required of public companies and is not publicly available since the offering information is not filed with the SEC. Further, issuers of Rule 144A eligible securities can require recipients of the offering information (such as the Fund) to agree contractually to keep the information confidential, which could also adversely affect the Fund’s ability to dispose of the security.
U.S. Government Obligations Risk. While U.S. Treasury obligations are backed by the “full faith and credit” of the U.S. Government, such securities are nonetheless subject to credit risk (i.e., the risk that the U.S. Government may be, or may be perceived to be, unable or unwilling to honor its financial obligations, such as making payments). Securities issued or guaranteed by federal agencies or authorities and U.S. Government-sponsored instrumentalities or enterprises may or may not be backed by the full faith and credit of the U.S. Government. For example, securities issued by the Federal Home Loan Mortgage Corporation, the Federal National Mortgage Association and the Federal Home Loan Banks are neither insured nor guaranteed by the U.S. Government. These securities may be supported by the ability to borrow from the U.S. Treasury or only by the credit of the issuing agency, authority, instrumentality or enterprise and, as a result, are subject to greater credit risk than securities issued or guaranteed by the U.S. Treasury.
Unrated Securities Risk. The Fund may purchase unrated securities which are not rated by a rating agency. Unrated securities may be less liquid than comparable rated securities and involve the risk that the Investment Manager may not accurately evaluate the security’s comparative credit rating. Analysis of creditworthiness of issuers of high yield securities may be more complex than for issuers of higher-quality debt securities. To the extent that the Fund purchases unrated securities, the Fund’s success in achieving its investment objective may depend more heavily on the Investment Manager’s creditworthiness analysis than if the Fund invested exclusively in rated securities.
Prospectus 2026
21
Variable Portfolio – Partners Core Bond Fund
More Information About the Fund (continued)
Additional Investment Strategies and Policies
This section describes certain investment strategies and policies that the Fund may utilize in pursuit of its investment objective and some additional factors and risks involved with investing in the Fund.
Investment Guidelines
As a general matter, and except as specifically described in the discussion of the Fund's principal investment strategies in this prospectus or as otherwise required by the Investment Company Act of 1940, as amended (the 1940 Act), the rules and regulations thereunder and any applicable exemptive relief, whenever an investment policy or limitation states a percentage of the Fund's assets that may be invested in any security or other asset or sets forth a policy regarding an investment standard, compliance with that percentage limitation or standard will be determined solely at the time of the Fund's investment in the security or asset.
Holding Other Kinds of Investments
The Fund may hold other investments that are not part of its principal investment strategies. These investments and their risks are described below and/or in the Statement of Additional Information (SAI). The Fund may choose not to invest in certain securities described in this prospectus and in the SAI, although it has the ability to do so. Information on the Fund’s holdings can be found in the Fund’s Form N-CSR or by visiting columbiathreadneedleus.com.
Transactions in Derivatives
The Fund may enter into derivative transactions or otherwise have exposure to derivative transactions through underlying investments. Derivatives are financial contracts whose values are, for example, based on (or “derived” from) traditional securities (such as a stock or bond), assets (such as a commodity like gold or a foreign currency), reference rates (such as the Secured Overnight Financing Rate (commonly known as SOFR)) or market indices (such as the Standard & Poor’s 500® Index). The use of derivatives is a highly specialized activity which involves investment techniques and risks different from those associated with ordinary portfolio securities transactions. Derivatives involve special risks and may result in losses or may limit the Fund’s potential gain from favorable market movements. Derivative strategies often involve leverage, which may exaggerate a loss, potentially causing the Fund to lose more money than it would have lost had it invested in the underlying security or other asset directly. The values of derivatives may move in unexpected ways, especially in unusual market conditions, and may result in increased volatility in the value of the derivative and/or the Fund’s shares, among other consequences. Other risks arise from the Fund’s potential inability to terminate or to sell derivative positions. A liquid secondary market may not always exist for the Fund’s derivative positions at times when the Fund might wish to terminate or to sell such positions. Over-the-counter instruments (investments not traded on an exchange) may be illiquid, and transactions in derivatives traded in the over-the-counter market are subject to the risk that the other party will not meet its obligations. The use of derivatives also involves the risks of mispricing or improper valuation and that changes in the value of the derivative may not correlate perfectly with the underlying security, asset, reference rate or index. The Fund also may not be able to find a suitable derivative transaction counterparty, and thus may be unable to engage in derivative transactions when it is deemed favorable to do so, or at all. The U.S. government and the European Union (and some other jurisdictions) have enacted regulations and similar requirements that prescribe clearing, margin, reporting and registration requirements for participants in the derivatives market. These requirements are evolving and their ultimate impact on the Fund remains unclear, but such impact could include restricting and/or imposing significant costs or other burdens upon the Fund’s participation in derivatives transactions. Additionally, regulations governing the use of derivatives by registered investment companies, such as the Fund, require, among other things, that a fund that invests in derivative instruments beyond a specified limited amount apply a value-at-risk-based limit to its portfolio and establish a comprehensive derivatives risk management program. As of the date of this prospectus, the Fund is required to maintain a comprehensive derivatives risk management program. For more information on the risks of derivative investments and strategies, see the SAI.
22
Prospectus 2026
Variable Portfolio – Partners Core Bond Fund
More Information About the Fund (continued)
Affiliated Fund Investing
The Investment Manager or an affiliate serves as investment adviser to funds using the Columbia brand (Columbia Funds), including those that are structured as “fund-of-funds”, and provides asset-allocation services to (i) shareholders by investing in shares of other Columbia Funds, which may include the Fund (collectively referred to in this section as Underlying Funds), and (ii) discretionary managed accounts (collectively referred to as affiliated products) that invest exclusively in Underlying Funds. These affiliated products, individually or collectively, may own a significant percentage of the outstanding shares of one or more Underlying Funds, and the Investment Manager seeks to balance potential conflicts of interest between the affiliated products and the Underlying Funds in which they invest. The affiliated products’ investment in the Underlying Funds may have the effect of creating economies of scale, possibly resulting in lower expense ratios for the Underlying Funds, because the affiliated products may own substantial portions of the shares of Underlying Funds. However, redemption of Underlying Fund shares by one or more affiliated products could cause the expense ratio of an Underlying Fund to increase, as its fixed costs would be spread over a smaller asset base. Because of large positions of certain affiliated products, the Underlying Funds may experience relatively large inflows and outflows of cash due to affiliated products’ purchases and sales of Underlying Fund shares. Although the Investment Manager or its affiliate may seek to minimize the impact of these transactions where possible, for example, by structuring them over a reasonable period of time or through other measures, Underlying Funds may experience increased expenses as they buy and sell portfolio securities to manage the cash flow effect related to these transactions. Further, when the Investment Manager or its affiliate structures transactions over a reasonable period of time in order to manage the potential impact of the buy and sell decisions for the affiliated products, those affiliated products, including funds-of-funds, may pay more or less (for purchase activity), or receive more or less (for redemption activity), for shares of the Underlying Funds than if the transactions were executed in one transaction. In addition, substantial redemptions by affiliated products within a short period of time could require the Underlying Fund to liquidate positions more rapidly than would otherwise be desirable, which may have the effect of reducing or eliminating potential gain or causing it to realize a loss. In order to meet such redemptions, an Underlying Fund may be forced to sell its liquid (or more liquid) positions, leaving the Underlying Fund holding, post-redemption, a relatively larger position in illiquid investments (i.e., any investment that the Fund reasonably expects cannot be sold or disposed of in current market conditions in seven calendar days or less without the sale or disposition significantly changing the market value of the investment) or less liquid securities. Substantial redemptions may also adversely affect the ability of the Underlying Fund to implement its investment strategy. The Investment Manager or its affiliate also has a conflict of interest in determining the allocation of affiliated products’ assets among the Underlying Funds, as it earns different fees from the various Underlying Funds.
Investing in Money Market Funds
The Fund may invest cash in, or hold as collateral for certain investments, shares of registered or unregistered money market funds, including funds advised by the Investment Manager or its affiliates. These funds are not insured or guaranteed by the Federal Deposit Insurance Corporation (FDIC) or any other government agency. The Fund and its shareholders indirectly bear a portion of the expenses of any money market fund or other fund in which the Fund may invest.
Investing Defensively
The Fund may from time to time take temporary defensive investment positions that may be inconsistent with the Fund’s principal investment strategies in attempting to respond to adverse market, economic, political, social or other conditions, including, without limitation, investing some or all of its assets in money market instruments or shares of affiliated or unaffiliated money market funds or holding some or all of its assets in cash or cash equivalents. The Fund may take such defensive investment positions for as long a period as deemed necessary.
The Fund may not achieve its investment objective while it is investing defensively. Investing defensively may adversely affect Fund performance. During these times, the portfolio managers may make frequent portfolio holding changes, which could result in increased trading expenses and decreased Fund performance. See also Investing in Money Market Funds above for more information.
Prospectus 2026
23
Variable Portfolio – Partners Core Bond Fund
More Information About the Fund (continued)
Other Strategic and Investment Measures
The Fund may also from time to time take temporary portfolio positions that may or may not be consistent with the Fund’s principal investment strategies in attempting to respond to adverse market, economic, political, social or other conditions, including, without limitation, investing in derivatives, such as forward contracts, futures contracts, options, structured investments and swaps, for various purposes, including among others, investing in particular derivatives in seeking to reduce investment exposures, or in seeking to achieve indirect investment exposures, to a sector, country, region or currency where the Investment Manager believes such positioning is appropriate. The Fund may take such portfolio positions for as long a period as deemed necessary. While the Fund is so positioned, derivatives could comprise a substantial portion of the Fund’s investments and the Fund may not achieve its investment objective. Investing in this manner may adversely affect Fund performance. During these times, the portfolio managers may make frequent portfolio holding changes, which could result in increased trading expenses and decreased Fund performance. For information on the risks of investing in derivatives, see Transactions in Derivatives above.
Portfolio Holdings Disclosure
The Board has adopted policies and procedures that govern the timing and circumstances of disclosure to shareholders and third parties of information regarding the securities owned by the Fund. A description of these policies and procedures is included in the SAI. Fund policy generally permits the disclosure of portfolio holdings information on the Fund's website (columbiathreadneedleus.com) only after a certain amount of time has passed, as described in the SAI.
Purchases and sales of portfolio securities can take place at any time, so the portfolio holdings information available on the Fund's website may not always be current.
FUNDamentals
Portfolio Holdings Versus the Benchmarks
The Fund does not limit its investments to the securities within its benchmark(s), and accordingly the Fund's holdings may diverge from those of its benchmark(s). In addition, the Fund may invest in securities outside any industry and geographic sectors represented in its benchmark(s). The Fund's weightings in individual securities, and in industry or geographic sectors, may also vary considerably from those of its benchmark(s).
Cash Flows
The timing and magnitude of cash inflows from investors buying Fund shares could prevent the Fund from always being fully invested. Conversely, the timing and magnitude of cash outflows to shareholders redeeming Fund shares could require the Fund to sell portfolio securities at less than opportune times or to hold ready reserves of uninvested cash in amounts larger than might otherwise be the case to meet shareholder redemptions. Either situation could adversely impact the Fund’s performance.
Understanding Annual Fund Operating Expenses
The Fund’s annual operating expenses, as presented in the Annual Fund Operating Expenses table in the Fees and Expenses of the Fund section of this prospectus, generally are based on expenses incurred during the Fund’s most recently completed fiscal year, may vary by share class and are expressed as a percentage (expense ratio) of the Fund’s average net assets during that fiscal year. The expense ratios reflect the Fund’s fee arrangements as of the date of this prospectus and, unless indicated otherwise, are based on expenses incurred during the Fund’s most recent fiscal year. The Fund’s assets will fluctuate, but unless indicated otherwise in the Annual Fund Operating Expenses table, no adjustments have been or will be made to the expense ratios to reflect any differences in the Fund’s average net assets between the most recently completed fiscal year and the date of this prospectus or a later date. In general, the Fund’s expense ratios will increase as its net assets decrease, such that the Fund’s actual expense ratios may be higher than the expense ratios presented in the Annual Fund Operating Expenses table if assets fall. Any commitment by the Investment Manager and/or its affiliates to waive fees and/or cap (reimburse)
24
Prospectus 2026
Variable Portfolio – Partners Core Bond Fund
More Information About the Fund (continued)
expenses is expected, in part, to limit the impact of any increase in the Fund’s expense ratios that would otherwise result because of a decrease in the Fund’s assets in the current fiscal year. The Fund’s annual operating expenses are comprised of (i) investment management fees, (ii) distribution and/or service fees, and (iii) other expenses. Management fees do not vary by class, but distribution and/or service fees and other expenses may vary by class.
FUNDamentals
Other Expenses
“Other expenses” consist of the fees the Fund pays to its custodian, transfer agent, auditors, lawyers and trustees, costs relating to compliance and miscellaneous expenses. Generally, these expenses are allocated on a pro rata basis across all share classes. These fees include certain sub-transfer agency and shareholder servicing fees. For more information on these fees, see About Fund Shares and Transactions — Financial Intermediary Compensation.
Fee Waiver/Expense Reimbursement Arrangements and Impact on Past Performance
The Investment Manager and certain of its affiliates have contractually agreed to waive fees and/or reimburse expenses (excluding certain fees and expenses described below) through April 30, 2027, unless sooner terminated at the sole discretion of the Fund's Board, so that the Fund’s net operating expenses, after giving effect to fees waived/expenses reimbursed and any balance credits and/or overdraft charges from the Fund’s custodian, do not exceed the annual rates of:
| Variable Portfolio - Partners Core Bond Fund | |
| Class 1 |
0.56% |
| Class 2 |
0.81% |
Under the agreement, the following fees and expenses are excluded from the Fund’s operating expenses when calculating the waiver/reimbursement commitment, and therefore will be paid by the Fund, if applicable: taxes (including foreign transaction taxes), expenses associated with investment in affiliated and non-affiliated pooled investment vehicles (including mutual funds and exchange-traded funds), transaction costs and brokerage commissions, costs related to any securities lending program, dividend expenses associated with securities sold short, inverse floater program fees and expenses, transaction charges and interest on borrowed money, interest, costs associated with shareholder meetings, infrequent and/or unusual expenses and any other expenses the exclusion of which is specifically approved by the Fund’s Board. This agreement may be modified or amended only with approval from all parties.
Effect of Fee Waivers and/or Expense Reimbursements on Past Performance. The Fund’s returns shown in the Performance Information section of this prospectus reflect the effect of any fee waivers and/or reimbursements of Fund expenses by the Investment Manager and/or any of its affiliates that were in place during the performance period shown. Without such fee waivers/expense reimbursements, the Fund’s returns might have been lower.
Primary Service Provider Contracts
The Fund enters into contractual arrangements (Service Provider Contracts) with various service providers, including, among others, the Investment Manager, the Distributor, Columbia Management Investment Services Corp. (the Transfer Agent) and the Fund’s custodian. The Fund’s Service Provider Contracts are solely among the parties thereto. Shareholders are not parties to, or intended to be third-party beneficiaries of, any Service Provider Contracts. Further, this prospectus, the SAI and any Service Provider Contracts are not intended to give rise to any agreement, duty, special relationship or other obligation between the Fund and any investor, or give rise to any contractual, tort or other rights in any individual shareholder, group of shareholders or other person, including any right to assert a fiduciary or other duty, enforce the Service Provider Contracts against the parties or to seek any remedy thereunder, either directly or on behalf of the Fund. Nothing in the previous sentence should be read to suggest any waiver of any rights under federal or state securities laws.
Prospectus 2026
25
Variable Portfolio – Partners Core Bond Fund
More Information About the Fund (continued)
The Investment Manager, the Distributor, and the Transfer Agent are all affiliates of Ameriprise Financial, Inc. (Ameriprise Financial). They and their affiliates currently provide key services, including investment advisory, administration, distribution, shareholder servicing and transfer agency services, to the Fund and various other funds, including the Columbia Funds, and are paid for providing these services. These service relationships are described below.
The Investment Manager
Columbia Management Investment Advisers, LLC is located at 290 Congress Street, Boston, MA 02210 and serves as investment adviser and administrator to the Columbia Funds. The Investment Manager is a registered investment adviser and a wholly-owned subsidiary of Ameriprise Financial. The Investment Manager’s management experience covers all major asset classes, including equity securities, debt instruments and money market instruments. In addition to serving as an investment adviser to traditional mutual funds, exchange-traded funds and closed-end funds, the Investment Manager acts as an investment adviser for itself, its affiliates, individuals, corporations, retirement plans, private investment companies and financial intermediaries.
Subject to oversight by the Board, the Investment Manager manages the day-to-day operations of the Fund. The Investment Manager is responsible for the investment management of the Fund, but has delegated certain of its duties, including day-to-day portfolio management of all or a portion of the Fund’s assets to one or more investment subadvisers that determine what securities and other investments the Fund should buy or sell. The Investment Manager is also responsible for overseeing the administrative operations of the Fund, including the general supervision of the Fund’s operations, the coordination of the Fund’s other service providers and the provision of related clerical and administrative services.
The SEC has issued an order that permits the Investment Manager, subject to the approval of the Board, to appoint unaffiliated subadvisers by entering into subadvisory agreements with them, and to change in material respects the terms of those subadvisory agreements, including the fees paid thereunder, for the Fund without first obtaining shareholder approval, thereby avoiding the expense and delays typically associated with obtaining shareholder approval. The Fund furnishes shareholders with information about new subadvisers retained in reliance on the order within 90 days after hiring the subadviser. The Investment Manager and its affiliates may have other relationships, including significant financial relationships, with current or potential subadvisers or their affiliates, which may create certain conflicts of interest. When making recommendations to the Board to appoint or to change a subadviser, or to change the terms of a subadvisory agreement, the Investment Manager discloses to the Board the nature of any such material relationships. The SEC has issued a separate order that permits the Board to approve new subadvisory agreements or material changes to existing subadvisory agreements at a meeting that is not in person, provided that the Trustees are able to participate in the meeting using a means of communication that allows them to hear each other simultaneously during the meeting and other conditions of the order are satisfied.
The Fund pays the Investment Manager a fee for its management services, which include investment advisory services and administrative services. The fee is calculated as a percentage of the daily net assets of the Fund and is paid monthly. For the Fund’s most recent fiscal year, management services fees paid to the Investment Manager by the Fund amounted to 0.47% of average daily net assets of the Fund, before any applicable reimbursements.
A discussion regarding the basis for the Board’s approval of the renewal of the Fund's management agreement is available in the Fund’s Form N-CSR for the fiscal period ended June 30, 2025.
The Investment Manager has, with the approval of the Board, engaged an investment subadviser(s) to make the day-to-day investment decisions for the Fund. The Investment Manager pays the subadviser(s) for investment advisory services and retains ultimate responsibility (subject to Board oversight) for overseeing any subadviser it engages and for evaluating the Fund’s needs and the subadvisers’ skills and abilities on an ongoing basis. Based on its evaluations, the Investment Manager may at times recommend to the Board that the Fund change, add or terminate one or more subadvisers; continue to retain a subadviser even though the subadviser’s ownership or corporate structure has changed; or materially change a subadvisory agreement with a subadviser. A discussion regarding the basis for the Board’s approval of the renewal of the investment subadvisory agreements with Allspring and JPMIM is
26
Prospectus 2026
Variable Portfolio – Partners Core Bond Fund
More Information About the Fund (continued)
available in the Fund’s Form N-CSR for the fiscal period ended June 30, 2025 and a discussion regarding the basis for the Board’s approval of an amendment to the investment subadvisory agreement between the Investment Manager and Allspring is available in the Fund’s Form N-CSR for the fiscal year ended December 31, 2025.
The date the Subadvisers began serving the Fund is set forth under Subadvisers below. Any performance of the Fund prior to the date the Subadvisers began serving was achieved by one or more different subadvisers. Similarly, the portfolio turnover rate for periods prior to the Subadvisers’ management of the Fund was the result of management by one or more different subadvisers. A change in subadvisers may result in increased portfolio turnover.
Subadvisers
Allspring, which has served as Subadviser to the Fund since May 2017, is located at 1415 Vantage Park Drive, 3rd Floor, Charlotte, NC 28203. Allspring, subject to the supervision of Columbia Management, provides day-to-day management of a portion of the Fund’s portfolio, as well as investment research and statistical information, under a subadvisory agreement with Columbia Management. Allspring was incorporated in the State of California in 1981 and converted to a Delaware limited liability company in 2021. Allspring is a leading independent asset management firm that offers a broad range of investment products and solutions through thoughtful investing, purposeful planning, and the desire to deliver outcomes that expand above and beyond financial gains.
JPMIM, which has served as Subadviser to the Fund since May 2010, is located at 270 Park Avenue, New York, NY 10017. JPMIM, subject to the supervision of Columbia Management, provides day-to-day management of a portion of the Fund’s portfolio, as well as investment research and statistical information, under a subadvisory agreement with Columbia Management. JPMIM was incorporated in 1984 and provides a broad range of investment strategies to meet the diverse requirements of their clients’ investment needs.
Portfolio Managers
Information about the portfolio managers primarily responsible for overseeing the Fund’s investments is shown below. The SAI provides additional information about the portfolio managers, including information relating to compensation, other accounts managed by the portfolio managers, and ownership by the portfolio managers of Fund shares.
Subadviser: Allspring Global Investments, LLC (Allspring)
| Portfolio Management |
Title |
Role with Fund |
Managed Fund Since |
| Maulik Bhansali, CFA |
Senior Portfolio Manager and Co-Head of Core Fixed Income team at Allspring |
Co-Portfolio Manager |
2017 |
| Jarad Vasquez |
Senior Portfolio Manager and Co-Head of Core Fixed Income team at Allspring |
Co-Portfolio Manager |
2017 |
Mr. Bhansali joined Allspring from its predecessor, Wells Fargo Asset Management, where he began in 2001. Mr. Bhansali began his investment career in 2001 and earned a Bachelor’s Degree in Economics and International Studies from Yale University and a Master’s Degree in Financial Engineering from the University of California, Berkeley.
Mr. Vasquez joined Allspring from its predecessor, Wells Fargo Asset Management, where he began in 2007. Mr. Vasquez began his investment career in 2001 and earned a Bachelor’s Degree in Management Science from the Massachusetts Institute of Technology.
Subadviser: J.P. Morgan Investment Management Inc. (JPMIM)
| Portfolio Management |
Title |
Role with Fund |
Managed Fund Since |
| Richard Figuly |
Managing Director and Portfolio Manager of JPMIM |
Co-Portfolio Manager |
2016 |
| J. Andrew Norelli |
Managing Director and Portfolio Manager of JPMIM |
Co-Portfolio Manager |
2021 |
| Thomas Hauser, CFA |
Managing Director and Portfolio Manager of JPMIM |
Co-Portfolio Manager |
2021 |
Prospectus 2026
27
Variable Portfolio – Partners Core Bond Fund
More Information About the Fund (continued)
| Portfolio Management |
Title |
Role with Fund |
Managed Fund Since |
| Kay Herr, CFA |
Managing Director and Portfolio Manager of JPMIM |
Co-Portfolio Manager |
2023 |
| Priya Misra |
Managing Director and Portfolio Manager of JPMIM |
Co-Portfolio Manager |
2024 |
| Vikas Panthani |
Managing Director and Portfolio Manager of JPMIM |
Co-Portfolio Manager |
2025 |
Mr. Figuly joined JPMIM in 1993 and is a member of Global Fixed Income, Currency & Commodities (GFICC) team. Based in Columbus, Mr. Figuly is a portfolio manager for JPMIM’s U.S. Value Driven team and is responsible for managing institutional taxable bond portfolios. Mr. Figuly began his investment career in 1994 and holds a B.S. in finance from Ohio State University.
Mr. Norelli joined JPMIM in 2012 and is a portfolio manager within the GFICC team, where he focuses on multi-asset class portfolios, asset allocation, macroeconomic strategy, and global market dynamics. Mr. Norelli began his investment career in 2003 and holds a Bachelor’s Degree in economics from Princeton University.
Mr. Hauser joined JPMIM in 2004 and is responsible for managing high yield investments. Mr. Hauser is a senior portfolio manager for the GFICC Global High Yield team. In this role, he is responsible for managing high yield total return strategies and sub-advised mutual fund assets with an emphasis on the U.S. dollar high yield market. Mr. Hauser began his investment career in 1995 and holds a Bachelor’s Degree in finance from Miami (Ohio) University.
Ms. Herr joined JPMIM in 1999 and is the U.S. Chief Investment Officer of the GFICC team. Ms. Herr began her investment career in 1994 and holds a B.A. in economics from the University of Virginia and an M.B.A. with distinction from New York University Stern School of Business.
Ms. Misra joined JPMIM in 2023 and is a member of the GFICC team, with a focus on assessing macroeconomic issues, interest rates and sector allocation themes. Prior to joining JPMIM, Ms. Misra was head of Global Rates Strategy at TD Securities, which she joined in 2015. Ms. Misra began her investment career in 2001 and holds a Bachelor’s Degree in economics from the Lady Sri Ram College, University of Delhi and a postgraduate diploma in management, majoring in finance, from the Indian Institute of Management, Bangalore, India.
Mr. Pathani joined JPMIM or one of its affiliates in 2004 and is the Head of U.S. Credit on the Global Investment Grade Corporate Credit Team. Mr. Pathani began his investment career in 2004 and holds a Bachelor of Science in Finance from The Pennsylvania State University's Smeal College of Business.
The Distributor
Shares of the Fund are distributed by Columbia Management Investment Distributors, Inc., which is located at 290 Congress Street, Boston, MA 02210. The Distributor is a registered broker-dealer and an indirect, wholly-owned subsidiary of Ameriprise Financial. The Distributor and its affiliates may pay commissions, distribution and service fees and/or other compensation to entities, including Ameriprise Financial affiliates, for selling shares and providing services to investors.
The Transfer Agent
Columbia Management Investment Services Corp. is a registered transfer agent and wholly-owned subsidiary of Ameriprise Financial. The Transfer Agent is located at 290 Congress Street, Boston, MA 02210, and its responsibilities include processing purchases, redemptions and transfers of Fund shares, calculating and paying distributions, maintaining shareholder records, preparing account statements and providing customer service. The Transfer Agent has engaged SS&C GIDS, Inc. to provide various sub-transfer agency services. The Fund pays a service fee to participating insurance companies or other financial intermediaries that provide sub-recordkeeping and other services to Contract owners and the separate accounts. The Transfer Agent may retain as compensation for its services revenues for fees for wire, telephone and redemption orders, account transcripts due the Transfer Agent from Fund shareholders and interest (net of bank charges) earned with respect to balances in accounts the Transfer Agent maintains in connection with its services to the Fund.
28
Prospectus 2026
Variable Portfolio – Partners Core Bond Fund
More Information About the Fund (continued)
Other Roles and Relationships of Ameriprise Financial and its Affiliates — Certain Conflicts of Interest
The Investment Manager, Distributor and Transfer Agent, all affiliates of Ameriprise Financial, provide various services to the Fund and other Columbia Funds for which they are compensated. Ameriprise Financial and its other affiliates may also provide other services to these funds and be compensated for them.
The Investment Manager and its affiliates may provide investment advisory and other services to other clients and customers substantially similar to those provided to the Columbia Funds. These activities, and other financial services activities of Ameriprise Financial and its affiliates, may present actual and potential conflicts of interest and introduce certain investment constraints.
Ameriprise Financial is a major financial services company, engaged in a broad range of financial activities beyond the fund-related activities of the Investment Manager, including, among others, insurance, broker-dealer (sales and trading), asset management, banking and other financial activities. These additional activities may involve multiple advisory, financial, insurance and other interests in securities and other instruments, and in companies that issue securities and other instruments, that may be bought, sold or held by the Columbia Funds.
Conflicts of interest and limitations that could affect a Columbia Fund may arise from, for example, the following:
■
compensation and other benefits received by the Investment Manager and other Ameriprise Financial affiliates related to the management/administration of a Columbia Fund and the sale of its shares;
■
the allocation of, and competition for, investment opportunities among the Fund, other funds and accounts advised/managed by the Investment Manager and other Ameriprise Financial affiliates, or Ameriprise Financial itself and its affiliates;
■
separate and potentially divergent management of a Columbia Fund and other funds and accounts advised/managed by the Investment Manager and other Ameriprise Financial affiliates;
■
regulatory and other investment restrictions on investment activities of the Investment Manager and other Ameriprise Financial affiliates and accounts advised/managed by them;
■
insurance and other relationships of Ameriprise Financial affiliates with companies and other entities in which a Columbia Fund invests;
■
regulatory and other restrictions relating to the sharing of information between Ameriprise Financial and its affiliates, including the Investment Manager, and a Columbia Fund; and
■
insurance companies investing in the Fund may be affiliates of Ameriprise Financial; these affiliated insurance companies, individually and collectively, may hold through separate accounts a significant portion of the Fund's shares and may also invest in separate accounts managed by the Investment Manager that have the same or substantially similar investment objectives and strategies as the Fund.
The Investment Manager and Ameriprise Financial have adopted various policies and procedures that are intended to identify, monitor and address conflicts of interest. However, there is no assurance that these policies, procedures and disclosures will be effective.
Additional information about Ameriprise Financial and the types of conflicts of interest and other matters referenced above is set forth in the Investment Management and Other Services — Other Roles and Relationships of Ameriprise Financial and its Affiliates — Certain Conflicts of Interest section of the SAI. Investors in the Columbia Funds should carefully review these disclosures and consult with their financial advisor if they have any questions.
Certain Legal Matters
Ameriprise Financial and certain of its affiliates are involved, in the normal course of business, in legal proceedings that include regulatory inquiries, arbitration and litigation (including class actions) concerning matters arising in connection with the conduct of their activities as part of a diversified financial services firm. Ameriprise Financial believes that the Fund is not currently the subject of, and that neither Ameriprise Financial nor any of its affiliates are the subject of, any pending legal, arbitration or regulatory proceedings that are likely to have a material adverse
Prospectus 2026
29
Variable Portfolio – Partners Core Bond Fund
More Information About the Fund (continued)
effect on the Fund or the ability of Ameriprise Financial or its affiliates to perform under their contracts with the Fund. Information regarding certain pending and settled legal proceedings may be found in the Fund’s Form N-CSR and in the SAI. Additionally, Ameriprise Financial is required to make quarterly (10-Q), annual (10-K) and, as necessary, 8-K filings with the SEC on legal and regulatory matters that relate to Ameriprise Financial and its affiliates. Copies of these filings may be obtained by accessing the SEC website at sec.gov.
30
Prospectus 2026
Variable Portfolio – Partners Core Bond Fund
About Fund Shares and Transactions
Description of the Share Classes
Share Class Features
The Fund offers the classes of shares set forth on the cover of this prospectus. Each share class has its own cost structure and other features. The following summarizes the primary features of the Class 1 and Class 2 shares.
| |
Class 1 Shares |
Class 2 Shares |
| Eligible Investors |
Shares of the Fund are available only to separate accounts of participating insurance companies as underlying investments for variable annuity contracts and/or variable life insurance policies (collectively, Contracts) or qualified pension and retirement plans (Qualified Plans) or other eligible investors authorized by the Distributor. | |
| Investment Limits |
none |
none |
| Conversion Features |
none |
none |
| Front-End Sales Charges |
none |
none |
| Contingent Deferred Sales Charges (CDSCs) |
none |
none |
| Maximum Distribution and/or Service Fees |
none |
0.25% |
FUNDamentals
Financial Intermediaries
The term “financial intermediary” refers to the insurance company that issued your contract, qualified pension or retirement plan sponsors or the financial intermediary that employs your financial advisor. Financial intermediaries also include broker-dealers and financial advisors as well as firms that employ broker-dealers and financial advisors, including, for example, brokerage firms, banks, investment advisers, third party administrators and other firms in the financial services industry, including Ameriprise Financial and its affiliates.
Distribution and/or Service Fees
Pursuant to Rule 12b-1 under the Investment Company Act of 1940, as amended (the 1940 Act), the Board has approved, and the Fund has adopted, a distribution plan which sets the distribution fees that are periodically deducted from the Fund’s assets for Class 2 shares. The distribution fee for Class 2 shares is 0.25%. These fees are calculated daily, may vary by share class and are intended to compensate the Distributor and/or financial intermediaries for selling shares of the Fund and/or providing services to investors. Because the fees are paid out of the Fund’s assets on an ongoing basis, they will increase the cost of your investment over time.
The Fund will pay these fees to the Distributor and/or to eligible financial intermediaries for as long as the distribution plan continues. The Fund may reduce or discontinue payments at any time.
The Fund pays a service fee to participating insurance companies or other financial intermediaries that provide sub-recordkeeping and other services to Contract owners, Qualified Plan participants and the separate accounts.
Financial Intermediary Compensation
The Distributor, the Investment Manager and their affiliates make payments, from their own resources, to financial intermediaries, primarily to affiliated and unaffiliated insurance companies, for marketing/sales support services relating to the Fund (Marketing Support Payments). Such payments are generally based upon one or more of the following factors: average net assets of the Columbia Funds sold by the Distributor attributable to that financial intermediary; gross sales of the Columbia Funds distributed by the Distributor attributable to that financial intermediary; or a negotiated lump sum payment. While the financial arrangements may vary for each financial intermediary, the Marketing Support Payments to any one financial intermediary are generally between 0.05% and 0.40% on an annual basis for payments based on average net assets of the Fund attributable to the financial intermediary, and between 0.05% and 0.25% on an annual basis for a financial intermediary receiving a payment based on gross sales of the Columbia Funds attributable to the financial intermediary.
Prospectus 2026
31
Variable Portfolio – Partners Core Bond Fund
About Fund Shares and Transactions (continued)
As employee compensation and business unit operating goals at all levels are generally tied to the success of Ameriprise Financial, employees of Ameriprise Financial and its affiliates, including employees of affiliated broker-dealers and insurance companies, are incented to include shares of the Columbia Funds in Contracts offered by affiliated insurance companies. Certain employees, directly or indirectly, receive higher compensation and other benefits as investment in the Columbia Funds increases. In addition, management, sales leaders and other employees may spend more of their time and resources promoting Ameriprise Financial and its subsidiary companies, including the Distributor and the Investment Manager, and the products they offer, including the Fund.
In addition, the Transfer Agent has certain arrangements in place to compensate financial intermediaries, primarily to affiliated and unaffiliated insurance companies, that hold Fund shares through networked and omnibus accounts, including omnibus retirement plans, for services that they provide to beneficial Fund shareholders (Shareholder Services). Shareholder Services and related fees vary by financial intermediary and may include sub-accounting, sub-transfer agency, participant recordkeeping, shareholder or participant reporting, shareholder or participant transaction processing, maintenance of shareholder records, preparation of account statements and provision of customer service, and are not intended to include services that are primarily intended to result in the sale of Fund shares. Payments for Shareholder Services generally are not expected, with certain limited exceptions, to exceed 0.40% of the average aggregate value of the Fund’s shares. Each Fund pays the Transfer Agent a service fee equal to the payments made by the Transfer Agent to participating insurance companies and other financial intermediaries that provide Shareholder Services up to the lesser of the amount charged by the financial intermediary or a contractual asset-based cap. Payments of amounts that exceed the amount paid by the Fund are borne by the Transfer Agent, the Investment Manager and/or their affiliates.
In addition to the payments described above, the Distributor, the Investment Manager and their affiliates typically make other payments or allow promotional incentives to certain broker-dealers to the extent permitted by SEC and Financial Industry Regulatory Authority (FINRA) rules and by other applicable laws and regulations.
Amounts paid by the Distributor, the Investment Manager and their affiliates are paid out of their own resources and do not increase the amount paid by you or the Fund. You can find further details in the SAI about the payments made by the Distributor, the Investment Manager and their affiliates, as well as a list of the financial intermediaries, including Ameriprise Financial affiliates, to which the Distributor, the Investment Manager or their affiliates have agreed to make Marketing Support Payments and fee payments for Shareholder Services.
Your financial intermediary may charge you fees and commissions in addition to those described in this prospectus. You should consult with your financial intermediary and review carefully any disclosure your financial intermediary provides regarding its services and compensation. Depending on the financial arrangement in place at any particular time, a financial intermediary and its financial advisors may have a conflict of interest or financial incentive with respect to recommendations regarding the Fund or any Contract or Qualified Plan that includes the Fund.
Share Price Determination
The price you pay or receive when you buy, sell or transfer shares is the Fund's next determined net asset value (or NAV) per share for a given share class. The Fund calculates the NAV per share for each class of shares of the Fund at the end of each business day, with the value of the Fund's shares based on the total value of all of the securities and other assets that it holds as of such specified time.
FUNDamentals
NAV Calculation
Each of the Fund's share classes calculates its NAV per share as follows:
NAV per share = (Value of assets of the share class) – (Liabilities of the share class)
Number of outstanding shares of the class
Number of outstanding shares of the class
32
Prospectus 2026
Variable Portfolio – Partners Core Bond Fund
About Fund Shares and Transactions (continued)
FUNDamentals
Business Days
A business day is any day that the New York Stock Exchange (NYSE) is open. A business day typically ends at the close of regular trading on the NYSE, usually at 4:00 p.m. Eastern time. If the NYSE is scheduled to close early, the business day will be considered to end as of the time of the NYSE’s scheduled close. The Fund will not treat an intraday unscheduled disruption in NYSE trading or an intraday unscheduled closing as a close of regular trading on the NYSE for these purposes and will price its shares as of the regularly scheduled closing time for that day (typically, 4:00 p.m. Eastern time). Nonetheless, the NAV of Fund shares may be determined at such other time or times (in addition to or in lieu of the time set forth above) as the Fund’s Board may approve or ratify. On holidays and other days when the NYSE is closed, the Fund’s NAV is not calculated and the Fund does not accept buy or sell orders. However, the value of the Fund’s assets may still be affected on such days to the extent that the Fund holds foreign securities that trade on days that foreign securities markets are open.
Equity securities listed on an exchange are typically valued at the closing price or last trade on their primary exchange at the close of business of the NYSE. Equity securities without a readily available closing price or that are not listed on any exchange are typically valued at the mean between the closing bid and asked prices. Other equity securities, debt securities and other assets are valued differently. For instance, bank loans trading in the secondary market are fair valued unless market quotations are readily available, fixed income investments maturing in 60 days or less are valued primarily using the amortized cost method, unless this methodology results in a valuation that does not approximate the market value of these securities, and those maturing in excess of 60 days are valued based on prices obtained from a pricing service, if available (which may represent market values or fair values). Investments in other open-end funds are valued at their published NAVs. The value of the Fund’s portfolio securities is determined in accordance with the valuation policy approved by the Board (the Valuation Policy). Pursuant to Rule 2a-5 under the 1940 Act, the Board has designated the Investment Manager as the Fund’s valuation designee. The Investment Manager, in turn, has authorized its valuation committee to make fair value determinations and to carry out supervisory and certain other functions relating to the valuation of Fund portfolio securities, pursuant to the Valuation Policy.
If a market price is not readily available or is deemed not to reflect market value for a portfolio security, the Investment Manager will determine the price based on a determination of the security's fair value pursuant to the Valuation Policy. In addition, the Investment Manager may use fair valuation techniques to price securities that trade on a foreign exchange when a significant event has occurred after the foreign exchange closes but before the time at which the Fund’s share price is calculated. Foreign exchanges typically close before the time at which Fund share prices are calculated, and may be closed altogether on days when the Fund is open. Such significant events affecting a foreign security may include, but are not limited to: (1) corporate actions, earnings announcements, litigation or other events impacting a single issuer; (2) governmental action that affects securities in one sector or country; (3) natural disasters or armed conflicts affecting a country or region; or (4) significant domestic or foreign market fluctuations. The Fund uses various criteria, including an evaluation of U.S. market moves after the close of foreign markets, in determining whether a foreign security's market price is readily available and reflective of market value and, if not, the fair value of the security.
Fair valuation may have the effect of reducing stale pricing arbitrage opportunities presented by the pricing of Fund shares. However, when the Investment Manager uses fair valuation to price equity securities, it may value those securities higher or lower than another fund or manager would. Also, fair valuation of Fund holdings may cause the Fund's performance to diverge to a greater degree from the performance of various benchmark indices used to compare the Fund's performance because indices generally do not use fair valuation techniques. Because of the judgment involved in fair valuation decisions, there can be no assurance that the value ascribed to a particular security is accurate. The Fund has retained one or more independent fair valuation pricing services to assist in the fair valuation process for foreign securities.
Prospectus 2026
33
Variable Portfolio – Partners Core Bond Fund
About Fund Shares and Transactions (continued)
Futures and options on futures are valued based upon the settlement price as determined by the principal exchange on which they are traded or, in the absence of a settlement price, at the mean of the closing bid and ask. Generally, over-the-counter derivatives, such as swaps and swaptions, are valued based on a price provided by an approved pricing service.
Shareholder Information
Each share class has its own cost structure and other features. Your product may not offer every share class. The Fund encourages you to consult with a financial advisor who can help you with your investment decisions and for more information about the share classes offered by the Fund and available under your product. Shares of the Fund are generally available for purchase only by participating insurance companies in connection with Contracts and Qualified Plan sponsors.
The Fund, the Distributor or the Transfer Agent may refuse any order to buy or transfer shares. If this happens, the Fund will return any money it received, but no interest will be paid on that money.
Shares of the Fund may not be purchased or sold directly by individual Contract owners or participants in a Qualified Plan. When you sell your shares through your Contract or Qualified Plan, the Fund is effectively buying them back. This is called a redemption. The right of redemption may be suspended or payment postponed whenever permitted by applicable laws and regulations, as described under Satisfying Fund Redemption Requests below.
Depending on the context, references to “you” or “your” herein refer either to the holder of a Contract, participant in a Qualified Plan or qualified institutional investor who may select Fund shares to fund his or her investment in the Contract or Qualified Plan or to the participating insurance company as the holder of Fund shares through one or more separate accounts or the Qualified Plan.
Satisfying Fund Redemption Requests
The Fund typically expects to send the redeeming participating insurance company or Qualified Plan sponsor payment for shares within two business days after your trade date. The Fund can suspend redemptions and/or delay payment of redemption proceeds for up to seven days. The Fund can also suspend redemptions and/or delay payment of redemption proceeds in excess of seven days under certain circumstances, including when the NYSE is closed or trading thereon is restricted or during emergency or other circumstances, including as determined by the SEC.
The Fund typically seeks to satisfy redemption requests from cash or cash equivalents held by the Fund, from the proceeds of orders to purchase Fund shares or from the proceeds of sales of Fund holdings effected in the normal course of managing the Fund. However, the Fund may have to sell Fund holdings, including in down markets, to meet heavier than usual redemption requests. For example, under stressed or abnormal market conditions or circumstances, including circumstances adversely affecting the liquidity of the Fund’s investments, the Fund may be more likely to be forced to sell Fund holdings to meet redemptions than under normal market circumstances. In these situations, the Fund’s portfolio managers may have to sell Fund holdings that would not otherwise be sold because, among other reasons, the current price to be received is less than the value of the holdings perceived by the Fund’s portfolio managers. The Fund may also, under certain circumstances (but more likely under stressed or abnormal market conditions or circumstances), borrow money under a credit facility to which the Fund and certain other Columbia Funds are parties or from other Columbia Funds under an interfund lending program (except for closed-end funds and money market funds, which are not eligible to borrow under the program). The Fund and the other Columbia Funds are limited as to the amount that each may individually and collectively borrow under the credit facility and the interfund lending program. As a result, borrowings available to the Fund under the credit facility and the interfund lending program might be insufficient, alone or in combination with the other strategies described herein, to satisfy Fund redemption requests. Please see About Fund Investments – Borrowings – Interfund Lending in the SAI for more information about the credit facility and interfund lending program. The Fund is also limited in the total amount it may borrow. The Fund may only borrow to the extent permitted by the 1940 Act, the rules and regulations thereunder, and any exemptive relief available to the Fund, which currently limit Fund borrowings to
34
Prospectus 2026
Variable Portfolio – Partners Core Bond Fund
About Fund Shares and Transactions (continued)
33 1/3% of total assets (including any amounts borrowed) less liabilities (other than borrowings), plus an additional 5% of its total assets for temporary purposes (to be repaid within 60 days without extension or renewal), in each case determined at the time the borrowing is made.
In addition, the Fund reserves the right to honor redemption orders in whole or in part with in-kind distributions of Fund portfolio securities instead of cash if the Investment Manager, in its sole discretion, determines it to be in the best interest of the remaining shareholders. Such in-kind distributions typically represent a pro-rata portion of Fund portfolio assets subject to adjustments (e.g., for non-transferable securities, round lots and derivatives). In the event the Fund distributes portfolio securities in kind, shareholders may incur brokerage and other transaction costs associated with converting the portfolio securities into cash. Also, the portfolio securities may increase or decrease in value after they are distributed but before they are converted into cash. For U.S. federal income tax purposes, redemptions paid in securities are generally treated the same as redemptions paid in cash. If, during any 90-day period, you redeem shares in an amount greater than $250,000 or 1% of the Fund’s net assets (whichever is less), and if the Investment Manager determines it to be feasible and appropriate, the Fund may pay the redemption amount above such threshold by an in-kind distribution of Fund portfolio securities. Although shares of the Fund may not be purchased or sold by individual owners of Contracts or Qualified Plans, this policy applies indirectly to Contract and Qualified Plan owners.
Potential Conflicts of Interest – Mixed and Shared Funding
The Fund is available for purchase only through Contracts offered by participating insurance companies, Qualified Plans and other qualified institutional investors authorized by the Distributor. Due to differences in tax treatment and other considerations, the interests of various Contract owners, and the interests of Qualified Plan participants, if any, may conflict. The Fund does not foresee any disadvantages to investors arising from these potential conflicts of interest at this time. Nevertheless, the Board of the Fund intends to monitor events to identify any material irreconcilable conflicts which may arise, and to determine what action, if any, should be taken in response to any conflicts. If such a conflict were to arise, one or more separate accounts might be required to withdraw its investments in the Fund or shares of another mutual fund may be substituted. This might force the Fund to sell securities at disadvantageous prices.
Order Processing
Orders to buy and sell shares of the Fund that are placed by your participating insurance company or Qualified Plan sponsor are processed on business days. Orders received in “good form” by the Transfer Agent or a financial intermediary, including your participating insurance company or Qualified Plan sponsor, before the end of a business day are priced at the NAV per share of the Fund's applicable share class on that day. Orders received after the end of a business day will receive the next business day’s NAV per share. An order is in “good form” if the Transfer Agent or your financial intermediary has all of the information and documentation it deems necessary to effect your order. The market value of the Fund’s investments may change between the time you submit your order and the time the Fund next calculates its NAV per share. The business day that applies to your order is also called the trade date.
There is no sales charge associated with the purchase of Fund shares, but there may be charges associated with your Contract or Qualified Plan. Any charges that apply to your Contract or Qualified Plan, and any charges that apply to separate accounts of participating insurance companies or Qualified Plans that may own shares directly, are described in your separate Contract prospectus or Qualified Plan disclosure documents.
You may transfer all or part of your investment in the Fund to one or more of the other investment options available under your Contract or Qualified Plan. You may provide instructions to sell any amount allocated to the Fund. Proceeds will be mailed within seven days after your surrender or withdrawal request is received in good form by an authorized agent. The amount you receive may be more or less than the amount you invested.
Please refer to your Contract prospectus or Qualified Plan disclosure documents, as applicable, for more information about transfers as well as surrenders and withdrawals.
Prospectus 2026
35
Variable Portfolio – Partners Core Bond Fund
About Fund Shares and Transactions (continued)
Information Sharing Agreements
As required by Rule 22c-2 under the 1940 Act, the Fund or certain of its service providers will enter into information sharing agreements with financial intermediaries, including participating life insurance companies and financial intermediaries that sponsor or offer retirement plans through which shares of the Fund are made available for purchase. Pursuant to Rule 22c-2, financial intermediaries are required, upon request, to: (i) provide shareholder account and transaction information; and (ii) execute instructions from the Fund to restrict or prohibit further purchases of Fund shares by shareholders who have been identified by the Fund as having engaged in transactions that violate the Fund's excessive trading policies and procedures.
Excessive Trading Practices Policy of Non-Money Market Funds
Right to Reject or Restrict Share Transaction Orders — The Fund is intended for investors with long-term investment purposes and is not intended as a vehicle for frequent trading activity (market timing) that is excessive. Investors should transact in Fund shares primarily for investment purposes. The Board has adopted excessive trading policies and procedures that are designed to deter excessive trading by investors (the Excessive Trading Policies and Procedures). The Fund discourages and does not accommodate excessive trading. Investments in a Fund by institutional investors in connection with redemptions in-kind are exempt from the Excessive Trading Policies and Procedures because they generally do not raise market timing or excessive trading concerns. Further discussion about the Fund’s use of redemptions in-kind is available under Satisfying Fund Redemption Requests.
The Fund reserves the right to reject, without any prior notice, any purchase or transfer order for any reason, and will not be liable for any loss resulting from rejected orders. For example, the Fund may in its sole discretion restrict or reject a purchase or transfer order even if the transaction is not subject to the specific limitation described below if the Fund or its agents determine that accepting the order could interfere with efficient management of the Fund's portfolio or is otherwise contrary to the Fund's best interests. The Excessive Trading Policies and Procedures apply equally to purchase or transfer transactions communicated directly to the Transfer Agent and to those received by financial intermediaries.
Specific Buying and Transferring Limitations — If the Fund detects that an investor has made two “material round trips” in any 28-day period, it will generally reject the investor's future purchase orders, including transfer buy orders, involving any Fund.
For these purposes, a “round trip” is a purchase or transfer into the Fund followed by a sale or transfer out of the Fund, or a sale or transfer out of the Fund followed by a purchase or transfer into the Fund. A “material” round trip is one that is deemed by the Fund to be material in terms of its amount or its potential detrimental impact on the Fund. Independent of this limit, the Fund may, in its sole discretion, reject future purchase orders by any person, group or account that appears to have engaged in any type of excessive trading activity.
These limits generally do not apply to automated transactions or transactions by registered investment companies in a “fund-of-funds” structure. These limits do not apply to payroll deduction contributions by retirement plan participants, transactions initiated by a retirement plan sponsor or certain other retirement plan transactions consisting of rollover transactions, loan repayments and disbursements, and required minimum distribution redemptions. They may be modified or rescinded for accounts held by certain retirement plans to conform to plan limits, for considerations relating to the Employee Retirement Income Security Act of 1974 or regulations of the Department of Labor, and for certain asset allocation or wrap programs. Accounts known to be under common ownership or control generally will be counted together, but accounts maintained or managed by a common intermediary generally will not be considered to be under common ownership or control. The Fund reserves the right to modify these restrictions at any time without prior notice to shareholders. In addition, the Fund may, in its sole discretion, reinstate trading privileges that have been revoked under the Fund's Excessive Trading Policies and Procedures.
Limitations on the Ability to Detect and Prevent Excessive Trading Practices — The Fund takes various steps designed to detect and prevent excessive trading, including daily review of available shareholder transaction information. However, the Fund receives buy, sell or transfer orders through financial intermediaries, and cannot always know of or reasonably detect excessive trading that may be facilitated by financial intermediaries or by the use of the
36
Prospectus 2026
Variable Portfolio – Partners Core Bond Fund
About Fund Shares and Transactions (continued)
omnibus account arrangements they offer. Omnibus account arrangements are common forms of holding shares of mutual funds, particularly among certain financial intermediaries such as broker-dealers, retirement plans and variable insurance products. These arrangements often permit financial intermediaries to aggregate their clients' transactions and accounts, and in these circumstances, the identities of the financial intermediary clients that beneficially own Fund shares are often not known to the Fund.
Some financial intermediaries apply their own restrictions or policies to their clients’ transactions and accounts, which may be more or less restrictive than those described here. This may impact the Fund's ability to curtail excessive trading, even where it is identified. For these and other reasons, it is possible that excessive trading may occur despite the Fund's efforts to detect and prevent it.
Although these restrictions and policies involve judgments that are inherently subjective and may involve some selectivity in their application, the Fund seeks to act in a manner that it believes is consistent with the best interests of Fund shareholders in making any such judgments.
Risks of Excessive Trading — Excessive trading creates certain risks to the Fund's long-term shareholders and may create the following adverse effects:
■
negative impact on the Fund's performance;
■
potential dilution of the value of the Fund's shares;
■
interference with the efficient management of the Fund's portfolio, such as the need to maintain undesirably large cash positions, the need to use its line of credit or the need to buy or sell securities it otherwise would not have bought or sold;
■
losses on the sale of investments resulting from the need to sell securities at less favorable prices; and
■
increased brokerage and administrative costs.
To the extent that the Fund invests significantly in foreign securities traded on markets that close before the Fund's valuation time, it may be particularly susceptible to dilution, which may be exacerbated as a result of excessive trading. Because events may occur after the close of foreign markets and before the Fund's valuation time that influence the value of foreign securities, investors may seek to trade Fund shares in an effort to benefit from their understanding of the value of foreign securities as of the Fund's valuation time. This is often referred to as price arbitrage. The Fund has adopted procedures designed to adjust closing market prices of foreign securities under certain circumstances to reflect what the Fund believes to be the fair value of those securities as of its valuation time. To the extent the adjustments do not work fully, investors engaging in price arbitrage may cause dilution in the value of the Fund's shares held by other shareholders.
Similarly, to the extent that the Fund invests significantly in thinly traded securities and other debt instruments that are rated below investment grade (commonly called “high-yield” or “junk” bonds), equity securities of small-capitalization companies, floating rate loans, or tax-exempt or other securities that may trade infrequently, because these securities are often traded infrequently, investors may seek to trade Fund shares in an effort to benefit from their understanding of the value of these securities as of the Fund's valuation time. This is also a type of price arbitrage. Any such frequent trading strategies may interfere with efficient management of the Fund's portfolio to a greater degree than would be the case for mutual funds that invest only, or significantly, in highly liquid securities, in part because the Fund may have difficulty selling these particular investments at advantageous times or prices to satisfy large and/or frequent sell orders. Any successful price arbitrage may also cause dilution in the value of Fund shares held by non-redeeming shareholders.
Excessive Trading Practices Policy of Columbia Variable Portfolio - Government Money Market Fund
A money market fund is designed to offer investors a liquid cash option that they may buy and sell as often as they wish. Accordingly, the Board has not adopted policies and procedures designed to discourage excessive or short-term trading of Columbia Variable Portfolio - Government Money Market Fund shares. However, since frequent purchases and sales of Columbia Variable Portfolio - Government Money Market Fund shares could in certain instances harm shareholders in various ways, including reducing the returns to long-term shareholders by increasing
Prospectus 2026
37
Variable Portfolio – Partners Core Bond Fund
About Fund Shares and Transactions (continued)
costs (such as spreads paid to dealers who trade money market instruments with Columbia Variable Portfolio - Government Money Market Fund) and disrupting portfolio management strategies, Columbia Variable Portfolio - Government Money Market Fund reserves the right, but has no obligation, to reject any purchase or transfer transaction at any time. Columbia Variable Portfolio - Government Money Market Fund has no limits on purchase or transfer transactions. In addition, Columbia Variable Portfolio - Government Money Market Fund reserves the right to impose or modify restrictions on purchases, transfers or trading of Fund shares at any time.
38
Prospectus 2026
Variable Portfolio – Partners Core Bond Fund
Distributions and Taxes
Distributions to Shareholders
A mutual fund can make money two ways:
■
It can earn income on its investments. Examples of fund income are interest paid on money market instruments and bonds, and dividends paid on common stocks.
■
A mutual fund can also have capital gains if the value of its investments increases. While a fund continues to hold an investment, any gain is generally unrealized. If the fund sells an investment, it generally will realize a capital gain if it sells that investment for a higher price than its adjusted cost basis, and will generally realize a capital loss if it sells that investment for a lower price than its adjusted cost basis. Capital gains and losses are either short-term or long-term, depending on whether the fund holds the securities for one year or less (short-term) or more than one year (long-term).
Mutual funds make payments of fund earnings to shareholders, distributing them among all shareholders of the fund. As a shareholder, you are entitled to your portion of a fund's distributed income, including capital gains. Reinvesting your distributions buys you more shares of a fund — which lets you take advantage of the potential for compound growth. Putting the money you earn back into your investment means it, in turn, may earn even more money (or be exposed to additional losses, if the fund earns a negative return). Over time, the power of compounding has the potential to significantly increase the value of your investment. There is no assurance, however, that you'll earn more money if you reinvest your distributions rather than receive them in cash.
The Fund intends to pay out, in the form of distributions to shareholders, a sufficient amount of its income and gains so that the Fund will qualify for treatment as a regulated investment company and generally will not have to pay any federal income or excise tax. The Fund generally intends to distribute any net realized capital gain (whether long-term or short-term gain) at least once a year. Normally, the Fund will declare and pay distributions of net investment income according to the following schedule:
| Declaration and Distribution Schedule | |
| Declarations |
Annually |
| Distributions |
Annually |
The Fund may declare or pay distributions of net investment income more frequently.
Different share classes of the Fund usually pay different net investment income distribution amounts, because each class has different expenses. Each time a distribution is made, the NAV per share of the share class is reduced by the amount of the distribution.
The Fund will automatically reinvest distributions in additional shares of the same share class of the Fund unless you inform us you want to receive your distributions to be paid in cash.
Taxes and Your Investment
Taxation of the Fund: The Fund has elected and intends to qualify and to be eligible for treatment each year as a regulated investment company. A regulated investment company generally is not subject to tax at the fund level on income and gains from investments that are distributed to shareholders. However, the Fund’s failure to qualify and be eligible for treatment as a regulated investment company would result in fund-level taxation, and consequently, a reduction in income available for distribution to you.
Taxation of Fund Shares: Shares of the Fund are only offered to separate accounts of participating insurance companies, Qualified Plans, and certain other eligible persons or plans permitted to hold shares of the Fund pursuant to the applicable U.S. Treasury Regulations without impairing the ability of participating insurance companies to satisfy the diversification requirements of Section 817(h) of the Internal Revenue Code of 1986, as amended. Each participating insurance company, including each participating insurance company that is an affiliate of the Investment Manager, includes in its taxable income any net investment income derived from the investment of assets held in its separate accounts because the insurance company is considered the owner of these assets under federal income tax law. The insurance company may claim certain tax benefits associated with this investment
Prospectus 2026
39
Variable Portfolio – Partners Core Bond Fund
Distributions and Taxes (continued)
income. These benefits, which may include foreign tax credits (which can reduce the insurance company’s U.S. taxes on foreign source income) and the corporate dividends-received deduction (which is a tax deduction for the insurance company attributable to certain dividends received from the Fund), are not passed on to Contract owners since the affiliated insurance company is the owner of the assets under federal tax law and is taxed on the investment income generated by the assets.
Taxation of Variable Annuity Contracts and Variable Life Insurance Policies: Your Contract may qualify for favorable tax treatment. Please refer to your Contract prospectus for more information about the tax implications of your investment in the Contract. As long as your Contract continues to qualify for such favorable tax treatment, you will not be taxed currently on your investment in the Fund through such Contract, even if the Fund makes distributions to the separate account and/or you change your investment options under the Contract. In order to qualify for such treatment, among other things, the separate accounts of participating insurance companies, which maintain and invest net proceeds from Contracts, must be “adequately diversified.” The Fund intends to operate in such a manner so that a separate account investing only in Fund shares on behalf of a holder of a Contract will be “adequately diversified.” If the Fund does not meet such requirements because its investments are not adequately diversified, your Contract could lose its favorable tax treatment, and income and gain allocable to your Contract could be taxable currently to you. This could also occur if Contract holders are found to have an impermissible level of control over the investments underlying their Contracts. You should consult with the participating insurance company that issued your Contract, plan sponsor, or other eligible investor through which your investment in the Fund is made regarding the U.S. federal income taxation of your investment.
FUNDamentals
Taxes
The information provided above is only a summary of how U.S. federal income taxes may affect your indirect investment in the Fund. It is not intended as a substitute for careful tax planning. Your investment in the Fund may have other tax implications. It does not apply to certain types of investors who may be subject to special rules, including foreign or tax-exempt investors or those holding Fund shares through a tax-advantaged account other than a Contract, such as a 401(k) plan or IRA. Please see the SAI for more detailed tax information. You should consult with your own tax advisor about the particular tax consequences to you of an investment in the Fund, including the effect of any foreign, state and local taxes, and the effect of possible changes in applicable tax laws.
40
Prospectus 2026
Variable Portfolio – Partners Core Bond Fund
Financial Highlights
The financial highlights table is intended to help you understand the Fund’s financial performance for the past five fiscal years or, if shorter, the Fund’s period of operations. Certain information reflects financial results for a single Fund share. Per share net investment income (loss) amounts are calculated based on average shares outstanding during the period. The total return in the table represents the rate that an investor would have earned (or lost) on an investment in the Fund assuming all dividends and distributions had been reinvested. Total return does not reflect any fees and expenses imposed under your Contract and/or Qualified Plan, as applicable; such fees and expenses would reduce the total return for all periods shown. Total return and portfolio turnover are not annualized for periods of less than one year. The ratios of expenses and net investment income are annualized for periods of less than one year. The portfolio turnover rate is calculated without regard to purchase and sales transactions of short-term instruments and certain derivatives, if any. If such transactions were included, the Fund’s portfolio turnover rate may be higher. A zero balance may reflect an amount rounding to less than $0.01 or 0.01%. This information has been audited by PricewaterhouseCoopers LLP, an independent registered public accounting firm, whose report, along with the Fund’s financial statements, is included in the Fund’s Form N-CSR, which is available upon request.
Prospectus 2026
41
Variable Portfolio – Partners Core Bond Fund
Financial Highlights (continued)
| |
Net asset value, beginning of period |
Net investment income |
Net realized and unrealized gain (loss) |
Total from investment operations |
Distributions from net investment income |
Distributions from net realized gains |
Total distributions to shareholders |
| Class 1 | |||||||
| Year Ended 12/31/2025 |
$9.59 |
0.42 |
0.29 |
0.71 |
(0.54) |
— |
(0.54) |
| Year Ended 12/31/2024 |
$9.73 |
0.41 |
(0.19) |
0.22 |
(0.36) |
— |
(0.36) |
| Year Ended 12/31/2023 |
$9.41 |
0.35 |
0.23 |
0.58 |
(0.26) |
— |
(0.26) |
| Year Ended 12/31/2022 |
$11.12 |
0.24 |
(1.71) |
(1.47) |
(0.17) |
(0.07) |
(0.24) |
| Year Ended 12/31/2021 |
$11.72 |
0.18 |
(0.32) |
(0.14) |
(0.17) |
(0.29) |
(0.46) |
| Class 2 | |||||||
| Year Ended 12/31/2025 |
$9.54 |
0.39 |
0.29 |
0.68 |
(0.52) |
— |
(0.52) |
| Year Ended 12/31/2024 |
$9.68 |
0.38 |
(0.19) |
0.19 |
(0.33) |
— |
(0.33) |
| Year Ended 12/31/2023 |
$9.36 |
0.33 |
0.23 |
0.56 |
(0.24) |
— |
(0.24) |
| Year Ended 12/31/2022 |
$11.07 |
0.22 |
(1.71) |
(1.49) |
(0.15) |
(0.07) |
(0.22) |
| Year Ended 12/31/2021 |
$11.66 |
0.15 |
(0.31) |
(0.16) |
(0.14) |
(0.29) |
(0.43) |
| Notes to Financial Highlights | |
| (a) |
In addition to the fees and expenses that the Fund bears directly, the Fund indirectly bears a pro rata share of the fees and expenses of any other funds in which it invests. Such indirect expenses are not included in the Fund's reported expense ratios. |
| (b) |
Total net expenses include the impact of certain fee waivers/expense reimbursements made by the Investment Manager and certain of its affiliates, if applicable. |
| (c) |
Ratios include interest on collateral expense which is less than 0.01%. |
42
Prospectus 2026
Variable Portfolio – Partners Core Bond Fund
Financial Highlights (continued)
| |
Net asset value, end of period |
Total return |
Total gross expense ratio to average net assets(a) |
Total net expense ratio to average net assets(a),(b) |
Net investment income ratio to average net assets |
Portfolio turnover |
Net assets, end of period (000's) |
| Class 1 | |||||||
| Year Ended 12/31/2025 |
$9.76 |
7.62% |
0.48% |
0.48% |
4.28% |
225% |
$3,782,520 |
| Year Ended 12/31/2024 |
$9.59 |
2.25% |
0.48%(c) |
0.48%(c) |
4.21% |
220% |
$3,756,936 |
| Year Ended 12/31/2023 |
$9.73 |
6.30% |
0.48%(c) |
0.48%(c) |
3.69% |
205% |
$4,866,151 |
| Year Ended 12/31/2022 |
$9.41 |
(13.29%) |
0.47%(c) |
0.47%(c) |
2.45% |
248% |
$4,842,663 |
| Year Ended 12/31/2021 |
$11.12 |
(1.24%) |
0.47%(c) |
0.47%(c) |
1.55% |
276% |
$6,017,964 |
| Class 2 | |||||||
| Year Ended 12/31/2025 |
$9.70 |
7.28% |
0.73% |
0.73% |
4.03% |
225% |
$23,099 |
| Year Ended 12/31/2024 |
$9.54 |
2.01% |
0.73%(c) |
0.73%(c) |
3.96% |
220% |
$20,757 |
| Year Ended 12/31/2023 |
$9.68 |
6.06% |
0.73%(c) |
0.73%(c) |
3.46% |
205% |
$17,836 |
| Year Ended 12/31/2022 |
$9.36 |
(13.60%) |
0.72%(c) |
0.72%(c) |
2.21% |
248% |
$14,909 |
| Year Ended 12/31/2021 |
$11.07 |
(1.41%) |
0.72%(c) |
0.72%(c) |
1.30% |
276% |
$16,962 |
Prospectus 2026
43
Variable Portfolio – Partners Core Bond Fund

For More Information
The Fund is generally available only to owners of Contracts issued by participating insurance companies and participants in Qualified Plans. Please refer to your Contract prospectus or Qualified Plan disclosure documents for information about how to buy, sell and transfer shares of the Fund.
Additional Information About the Fund
Additional information about the Fund’s investments is available in the Fund’s annual and semiannual reports to shareholders and in Form N-CSR. In the Fund’s annual report, you will find a discussion of the market conditions and investment strategies that significantly affected the Fund’s performance during its last fiscal year. In the Fund’s Form N-CSR, you will find the Fund’s annual and semiannual financial statements. The SAI also provides additional information about the Fund and its policies. The SAI, which has been filed with the SEC, is legally part of this prospectus (incorporated by reference). To obtain these documents free of charge, to request other information about the Fund and to make shareholder inquiries, please contact the Fund as follows:
By Mail: Columbia Management Investment Services Corp.
P.O. Box 219104
Kansas City, MO 64121-9104
P.O. Box 219104
Kansas City, MO 64121-9104
By Telephone: 800.345.6611
Online: columbiathreadneedleus.com
Reports and other information about the Fund are also available in the EDGAR Database on the SEC’s website at http://www.sec.gov. You can receive copies of this information, for a duplication fee, by electronic request at the following e-mail address: publicinfo@sec.gov.
The investment company registration number of Columbia Funds Variable Series Trust II, of which the Fund is a series, is 811-22127.
Columbia Threadneedle Investments (Columbia Threadneedle) is the global brand name of the Columbia and Threadneedle group of companies.
The Fund is distributed by Columbia Management Investment Distributors, Inc., 290 Congress Street, Boston, MA 02210.
The Fund is distributed by Columbia Management Investment Distributors, Inc., 290 Congress Street, Boston, MA 02210.
© 2026 Columbia Threadneedle. All rights reserved.
PRO7052_12_E01_(05/26)

Variable Portfolio – Partners Core Equity Fund
Prospectus
May 1, 2026
As with all mutual funds, the Securities and Exchange Commission (SEC) has not approved or disapproved these securities or passed upon the adequacy of this prospectus. Any representation to the contrary is a criminal offense.

Variable Portfolio – Partners Core Equity Fund
Table of Contents
| 3 | |
| 3 | |
| 3 | |
| 4 | |
| 4 | |
| 6 | |
| 7 | |
| 7 | |
| 7 | |
| 8 | |
| 9 | |
| 9 | |
| 9 | |
| 10 | |
| 14 | |
| 18 | |
| 20 | |
| 21 | |
| 22 | |
| 22 | |
| 22 | |
| 23 | |
| 25 | |
| 30 | |
| 30 | |
| 30 | |
| 33 |
2
Prospectus 2026
Variable Portfolio – Partners Core Equity Fund
Summary of the Fund
Investment Objective
Variable Portfolio – Partners Core Equity Fund (the Fund) seeks to provide shareholders with long-term capital growth.
Fees and Expenses of the Fund
This table describes the fees and expenses that you may pay as an investor in the Fund. The table does not reflect any fees or expenses imposed by your Contract or Qualified Plan, which are disclosed in your separate Contract prospectus or Qualified Plan disclosure documents. If the additional fees or expenses were reflected, the expenses set forth below would be higher.
| | |||
| |
Class 1 |
Class 2 |
Class 3 |
| Management fees |
% |
% |
% |
| Distribution and/or service (12b-1) fees |
% |
% |
% |
| Other expenses |
% |
% |
% |
| Total annual Fund operating expenses(a) |
% |
% |
% |
| Less: Fee waivers and/or expense reimbursements(b) |
( %) |
( %) |
( %) |
| Total annual Fund operating expenses after fee waivers and/or expense reimbursements |
% |
% |
% |
(a)
(b)
Example
The following example is intended to help you compare the cost of investing in the Fund with the cost of investing in other mutual funds. The example illustrates the hypothetical expenses that you would incur over the time periods indicated, and assumes that:
■
you invest $10,000 in the applicable class of Fund shares for the periods indicated,
■
your investment has a 5% return each year, and
■
the Fund’s total annual operating expenses remain the same as shown in the Annual Fund Operating Expenses table above.
The example does not reflect any fees and expenses that apply to your Contract or Qualified Plan. Inclusion of these charges would increase expenses for all periods shown.
Since the waivers and/or reimbursements shown in the Annual Fund Operating Expenses table above expire as indicated in the preceding table, they are only reflected in the 1 year example and the first year of the other examples. Although your actual costs may be higher or lower, based on the assumptions listed above, your costs would be:
| |
1 year |
3 years |
5 years |
10 years |
| Class 1 (whether or not shares are redeemed) |
$ |
$ |
$ |
$ |
| Class 2 (whether or not shares are redeemed) |
$ |
$ |
$ |
$ |
| Class 3 (whether or not shares are redeemed) |
$ |
$ |
$ |
$ |
Prospectus 2026
3
Variable Portfolio – Partners Core Equity Fund
Summary of the Fund (continued)
Portfolio Turnover
The Fund may pay transaction costs, such as commissions, when it buys and sells securities (or “turns over” its portfolio). A higher portfolio turnover rate may indicate higher transaction costs. These costs, which are not reflected in annual fund operating expenses or in the example, affect the Fund’s performance. During the most recent fiscal year, the Fund’s portfolio turnover rate was 52 % of the average value of its portfolio.
Principal Investment Strategies
Under normal circumstances, at least 80% of the Fund’s net assets (plus the amount of any borrowings for investment purposes) are invested in equity securities. Equity securities include, for example, common stock, preferred stock and convertible securities. The Fund may invest in the securities of issuers of any size, including small-, mid- and large-capitalization companies.
The Fund may invest up to 25% of its net assets in foreign investments. The Fund may invest in foreign securities directly or indirectly through depositary receipts. The Fund may at times emphasize one or more sectors in selecting its investments, including the information technology sector.
Multiple subadvisers provide the day-to-day management of the Fund’s portfolio.
Principal Risks
An investment in the Fund involves risks, including Market Risk, Multi-Adviser Risk, and Sector Risk, among others. Descriptions of these and other principal risks of investing in the Fund are provided below. There is no assurance that the Fund will achieve its investment objective and you may lose money . The value of the Fund’s holdings may decline, and the Fund’s net asset value (NAV) and share price may go down. An investment in the Fund is not a bank deposit and is not insured or guaranteed by the Federal Deposit Insurance Corporation or any other government agency. The significance of any specific risk to an investment in the Fund will vary over time depending on the composition of the Fund's portfolio, market conditions, and other factors. You should read all of the risk information below carefully, because any one or more of these risks may result in losses to the Fund.
Active Management Risk. Due to its active management, the Fund could underperform its benchmark index and/or other funds with similar investment objectives and/or strategies.
Convertible Securities Risk. Convertible securities are subject to the usual risks associated with debt instruments, such as interest rate risk and credit risk. Convertible securities also react to changes in the value of the common stock into which they convert and are thus subject to market risk. The Fund may also be forced to convert a convertible security at an inopportune time, which may decrease the Fund’s return.
Depositary Receipts Risk. Depositary receipts are receipts issued by a bank or trust company reflecting ownership of underlying securities issued by foreign companies. Some foreign securities are traded in the form of American Depositary Receipts and/or Global Depositary Receipts. Depositary receipts involve risks similar to the risks associated with investments in foreign securities, including those associated with an issuer’s (and any of its related companies’) country of organization and places of business operations, which may be related to the particular political, regulatory, economic, social and other conditions or events (including, for example, military confrontations and actions, war, other conflicts, terrorism and disease/virus outbreaks and epidemics) occurring in the country and fluctuations in such country’s currency, as well as market risk tied to the underlying foreign company. In addition, holders of depositary receipts may have limited voting rights, may not have the same rights afforded to stockholders of a typical domestic company in the event of a corporate action, such as an acquisition, merger or rights offering, and may experience difficulty in receiving company stockholder communications. There is no guarantee that a financial institution will continue to sponsor a depositary receipt, or that a depositary receipt will continue to trade on an exchange, either of which could adversely affect the liquidity, availability and pricing of the depositary receipt. Changes in foreign currency exchange rates will affect the value of depositary receipts and, therefore, may affect the value of your investment in the Fund.
4
Prospectus 2026
Variable Portfolio – Partners Core Equity Fund
Summary of the Fund (continued)
Equity Securities Risk. Equity securities may experience significant volatility. Such securities may fall sharply in response to adverse events affecting overall markets, a particular industry or sector, or an individual company’s financial condition.
Foreign Securities Risk. Investments in or exposure to securities of foreign companies may involve heightened risks relative to investments in or exposure to securities of U.S. companies. Investing in securities of foreign companies subjects the Fund to the risks associated with an issuer’s (and any of its related companies’) country of organization and places of business operations, including risks related to political, regulatory, economic, social, diplomatic and other conditions or events (including, for example, military confrontations and actions, war, other conflicts, terrorism and disease/virus outbreaks and epidemics) occurring in the country or region, as well as risks associated with less developed custody and settlement practices. Foreign securities may be more volatile and less liquid than securities of U.S. companies and are subject to the risks associated with potential imposition of economic and other sanctions against a particular foreign country, its nationals or industries or businesses within the country. In addition, foreign governments may impose withholding or other taxes on the Fund’s income, capital gains or proceeds from the disposition of foreign securities, which could reduce the Fund’s return on such securities. The performance of the Fund may also be negatively affected by fluctuations in a foreign currency's strength or weakness relative to the U.S. dollar, particularly to the extent the Fund invests a significant percentage of its assets in foreign securities or other assets denominated in currencies other than the U.S. dollar.
Issuer Risk. An issuer in which the Fund invests or to which it has exposure may perform poorly or below expectations, and the value of its securities may therefore decline, which may negatively affect the Fund’s performance. Underperformance of an issuer may be caused by poor management decisions, competitive pressures, breakthroughs in technology, reliance on suppliers, labor problems or shortages, corporate restructurings, fraudulent disclosures, natural disasters, military confrontations and actions, war, other conflicts, terrorism, disease/virus outbreaks, epidemics or other events, conditions and factors which may impair the value of your investment in the Fund.
■
Small- and Mid-Cap Stock Risk. Investments in small- and mid-capitalization companies (small- and mid-cap companies) often involve greater risks than investments in larger, more established companies (larger companies) because small- and mid-cap companies tend to have less predictable earnings and may lack the management experience, financial resources, product diversification and competitive strengths of larger companies. Securities of small- and mid-cap companies may be less liquid and more volatile than the securities of larger companies.
■
Large-Cap Stock Risk. Investments in larger companies may involve certain risks associated with their larger size. For instance, larger companies may be less able to respond quickly to new competitive challenges, such as changes in consumer tastes or innovation from smaller competitors. Also, larger companies are sometimes less able to achieve as high growth rates as successful smaller companies, especially during extended periods of economic expansion.
Market Risk. The Fund may incur losses due to declines in the value of one or more securities in which it invests. These declines may be due to factors affecting a particular issuer, or the result of, among other things, political, regulatory, market, economic or social developments affecting the relevant market(s) more generally. In addition, turbulence in financial markets and reduced liquidity in equity, credit and/or fixed income markets may negatively affect many issuers, which could adversely affect the Fund’s ability to price or value hard-to-value assets in thinly traded and closed markets and could cause significant redemptions and operational challenges. Global economies and financial markets are increasingly interconnected, and conditions and events in one country, region or financial market may adversely impact issuers in a different country, region or financial market. These risks may be magnified if certain events or developments adversely interrupt the global supply chain; in these and other circumstances, such risks might affect companies worldwide. As a result, local, regional or global events such as terrorism, war, other conflicts, natural disasters, disease/virus outbreaks and epidemics or other public health issues, recessions, depressions or other events – or the potential for such events – could have a significant negative impact on global economic and market conditions.
Prospectus 2026
5
Variable Portfolio – Partners Core Equity Fund
Summary of the Fund (continued)
Multi-Adviser Risk. The Fund has multiple advisory firms that each manage a portion of the Fund’s net assets on a daily basis. Each adviser makes investment decisions independently from the other adviser(s). It is possible that the security selection process of one adviser will not complement or may conflict or even contradict that of the other adviser(s), including making off-setting trades that have no net effect to the Fund, but which may increase Fund expenses. As a result, the Fund's exposure to a given security, industry, sector or market capitalization could be smaller or larger than if the Fund were managed by a single adviser, which could adversely affect the Fund's performance.
Preferred Stock Risk. Preferred stock is a type of stock that may pay dividends at a different rate than common stock of the same issuer, if at all, and that has preference over common stock in the payment of dividends and the liquidation of assets. Preferred stock does not ordinarily carry voting rights. The price of a preferred stock is generally determined by earnings, type of products or services, projected growth rates, experience of management, liquidity, and general market conditions of the markets on which the stock trades. The most significant risks associated with investments in preferred stock include issuer risk, market risk and interest rate risk (the risk of losses attributable to changes in interest rates).
Sector Risk. At times, the Fund may have a significant portion of its assets invested in securities of companies conducting business in a related group of industries within one or more economic sectors, including the information technology sector. Companies in the same sector may be similarly affected by economic, regulatory, political or market events or conditions, which may make the Fund vulnerable to unfavorable developments in that group of industries or economic sector.
■
Information Technology Sector. The Fund is vulnerable to the particular risks that may affect companies in the information technology sector. Companies in the information technology sector are subject to certain risks, including the risk that new services, equipment or technologies will not be accepted by consumers and businesses or will become rapidly obsolete. Performance of such companies may be affected by factors including obtaining and protecting patents (or the failure to do so) and significant competitive pressures, including aggressive pricing of their products or services, new market entrants, competition for market share and short product cycles due to an accelerated rate of technological developments. Such competitive pressures may lead to limited earnings and/or falling profit margins. As a result, the value of their securities may fall or fail to rise. In addition, many information technology sector companies have limited operating histories and prices of these companies’ securities historically have been more volatile than other securities, especially over the short term. Some companies in the information technology sector are facing increased government and regulatory scrutiny and may be subject to adverse government or regulatory action, which could negatively impact the value of their securities.
Performance Information
The following bar chart and table show you how the Fund has performed in the past, and can help you understand the risks of investing in the Fund. The bar chart shows how the Fund’s Class 2 share performance has varied for each full calendar year shown. The table below the bar chart compares the Fund’s returns for the periods shown with a broad measure of market performance.
Except for differences in annual returns resulting from differences in expenses (where applicable), the share classes of the Fund would have substantially similar annual returns because all share classes of the Fund invest in the same portfolio of securities.
The returns shown do not reflect any fees and expenses imposed under your Contract or Qualified Plan and would be lower if they did.
The Fund’s performance prior to May 2021 reflects returns achieved by one or more different subadviser(s) that managed the Fund according to different principal investment strategies. If the Fund’s current subadvisers and strategies had been in place for the prior periods, results shown may have been different.
6
Prospectus 2026
Variable Portfolio – Partners Core Equity Fund
Summary of the Fund (continued)
Year by Year Total Return (%) as of December 31 Each Year |
Best and Worst Quarterly Returns During the Period Shown in the Bar Chart | ||
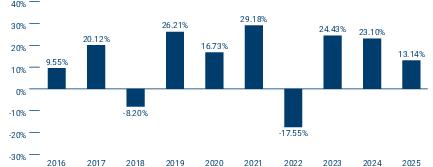 |
|
|
|
| |
|
- | |
Average Annual Total Returns (for periods ended December 31, 2025)
| |
Share Class Inception Date |
1 Year |
5 Years |
10 Years |
| Class 1 |
|
|
|
|
| Class 2 |
|
|
|
|
| Class 3 |
|
|
|
|
| S&P 500® Index (reflects no deductions for fees, expenses or taxes) |
|
|
|
|
Fund Management
Investment Manager: Columbia Management Investment Advisers, LLC
Subadviser: J.P. Morgan Investment Management Inc. (JPMIM)
| Portfolio Management |
Title |
Role with Fund |
Managed Fund Since |
| Scott Davis |
Managing Director of JPMIM |
Co-Portfolio Manager |
2021 |
| Shilpee Raina, CFA |
Executive Director of JPMIM |
Co-Portfolio Manager |
2021 |
Subadviser: T. Rowe Price Associates, Inc. (T. Rowe Price)
| Portfolio Management |
Title |
Role with Fund |
Managed Fund Since |
| Shawn Driscoll |
Vice President and Portfolio Manager of T. Rowe Price |
Portfolio Manager |
2022 |
Purchase and Sale of Fund Shares
The Fund is available for purchase through Contracts offered by the separate accounts of participating insurance companies or Qualified Plans or by other eligible investors authorized by Columbia Management Investment Distributors, Inc. (the Distributor). Shares of the Fund may not be purchased or sold by individual owners of Contracts or Qualified Plans. If you are a Contract holder or Qualified Plan participant, please refer to your separate Contract prospectus or Qualified Plan disclosure documents for information about minimum investment requirements and how to purchase and redeem shares of the Fund on days the Fund is open for business.
Tax Information
The Fund expects to be treated as a partnership for U.S. federal income tax purposes, and does not expect to make regular distributions (other than in redemption of Fund shares) to shareholders which are generally the participating insurance companies investing in the Fund through separate accounts or Qualified Plans or certain other eligible
Prospectus 2026
7
Variable Portfolio – Partners Core Equity Fund
Summary of the Fund (continued)
investors authorized by the Distributor. You should consult with the participating insurance company that issued your Contract, plan sponsor or other eligible investor through which your investment in the Fund is made regarding the U.S. federal income taxation of your investment.
Payments to Broker-Dealers and Other Financial Intermediaries
If you make allocations to the Fund, the Fund, its Distributor or other related companies may pay participating insurance companies or other financial intermediaries for the allocation (sale) of Fund shares and related services in connection with such allocations to the Fund. These payments may create a conflict of interest by influencing the participating insurance company, other financial intermediary or your salesperson to recommend an allocation to the Fund over another fund or other investment option. Ask your financial advisor or salesperson or visit your financial intermediary’s website for more information.
8
Prospectus 2026
Variable Portfolio – Partners Core Equity Fund
More Information About the Fund
Investment Objective
Variable Portfolio – Partners Core Equity Fund (the Fund) seeks to provide shareholders with long-term capital growth. Only shareholders can change the Fund’s investment objective. Because any investment involves risk, there is no assurance the Fund’s investment objective will be achieved.
Principal Investment Strategies
Under normal circumstances, at least 80% of the Fund’s net assets (plus the amount of any borrowings for investment purposes) are invested in equity securities. Equity securities include, for example, common stock, preferred stock and convertible securities. The Fund may invest in the securities of issuers of any size, including small-, mid- and large-capitalization companies.
The Fund may invest up to 25% of its net assets in foreign investments. The Fund may invest in foreign securities directly or indirectly through depositary receipts. Depositary receipts are receipts issued by a bank or trust company reflecting ownership of underlying securities issued by foreign companies. The Fund may at times emphasize one or more sectors in selecting its investments, including the information technology sector.
Columbia Management Investment Advisers, LLC (Columbia Management or the Investment Manager) serves as the investment manager to the Fund and is responsible for the oversight of, including the establishment of risk management parameters for, the Fund’s subadvisers: J.P. Morgan Investment Management Inc. (JPMIM) and T. Rowe Price Associates, Inc. (T. Rowe Price) (JPMIM and T. Rowe Price, each a Subadviser and collectively, the Subadvisers). The Subadvisers provide day-to-day portfolio management to the Fund. The Investment Manager, subject to the oversight of the Fund’s Board of Trustees, decides the proportion of the Fund’s assets to be managed by each Subadviser, and may change these proportions at any time. Each Subadviser acts independently of any other Subadviser and uses its own methodology for selecting investments. Each Subadviser employs an active investment strategy.
JPMIM
In managing its portion of the Fund, JPMIM employs a three-step process that combines research, valuation and stock selection. JPMIM takes an in-depth look at company prospects, which is designed to provide insight into a company’s real growth potential. The research findings allow JPMIM to rank the companies in each sector group according to what JPMIM believes to be their relative value. As a part of its investment process, JPMIM seeks to assess the impact of environmental, social and governance (ESG) factors (including accounting and tax policies, disclosure and investor communication, shareholder rights and remuneration policies) on the cash flows of many companies in which it may invest to identify issuers that JPMIM believes will be negatively impacted by such factors relative to other issuers. These determinations may not be conclusive and securities of such issuers may be purchased and retained by the Fund.
On behalf of the Fund, JPMIM then buys and sells equity securities, using the research and valuation rankings as a basis. In general, JPMIM buys equity securities that are believed to be undervalued and considers selling them when they are believed to be overvalued. Along with valuation, JPMIM often considers a number of other criteria, including:
■
catalysts that could trigger a rise in a stock’s price,
■
high potential reward compared to potential risk, and
■
temporary mispricings caused by apparent market overreactions.
T. Rowe Price
T. Rowe Price uses fundamental, bottom-up research and takes a core approach to stock selection, which includes both growth and value styles of investing. Because the Fund has the flexibility to look for stocks with either growth or value characteristics, stocks will be selected that T. Rowe Price believes have the most favorable combination of company fundamentals, earnings potential, and valuation. Sector allocations are largely the result of T. Rowe Price’s focus on bottom-up stock selection.
Prospectus 2026
9
Variable Portfolio – Partners Core Equity Fund
More Information About the Fund (continued)
In selecting stocks for the Fund, T. Rowe Price typically seeks out companies with one or more of the following characteristics:
■
experienced and capable management;
■
above-average earnings growth, cash flow growth, or profit margins;
■
leading or improving market position or proprietary advantages;
■
attractive business niche with the potential to sustain earnings momentum even during times of slow economic growth;
■
attractive valuation relative to a company’s peers or its own historical norm;
■
low stock price relative to a company’s underlying asset values; and/or
■
potential to conduct share repurchases.
Through bottom-up fundamental analysis, T. Rowe Price seeks to identify the most attractively valued large U.S. companies with capital appreciation potential, by placing less emphasis on economic trends, business cycles, or the industry in which the company operates.
T. Rowe Price may also deviate from its normal investment criteria in special situations which might arise when T. Rowe Price believes a security could increase in value for a variety of reasons, including an extraordinary corporate event, a new product introduction or innovation, a favorable competitive development, or a change in management.
T. Rowe Price integrates ESG factors into its investment research process, focusing on the ESG factors it considers most likely to have a material impact on the performance of the holdings in the Fund's portfolio. While ESG matters vary widely, T. Rowe Price will generally consider ESG to mean: Environmental or “E” matters, such as climate change, resource depletion, waste, pollution, or deforestation; Social or “S” matters, such as companies' relationships with their employees and suppliers, including labor standards, diversity, and human rights issues; and Governance or “G” matters, such as shareholder rights, bribery and corruption, executive pay, and board composition.
T. Rowe Price may sell securities for a variety of reasons, such as to secure gains, limit losses, or redeploy assets into more promising opportunities.
The Fund’s investment policy with respect to 80% of its net assets may be changed by the Fund’s Board of Trustees without shareholder approval as long as shareholders are given 60 days’ advance written notice of the change.
Principal Risks
An investment in the Fund involves risks, including Market Risk, Multi-Adviser Risk, and Sector Risk, among others. Descriptions of these and other principal risks of investing in the Fund are provided below. There is no assurance that the Fund will achieve its investment objective and you may lose money. The value of the Fund’s holdings may decline, and the Fund’s net asset value (NAV) and share price may go down. An investment in the Fund is not a bank deposit and is not insured or guaranteed by the Federal Deposit Insurance Corporation or any other government agency. The significance of any specific risk to an investment in the Fund will vary over time depending on the composition of the Fund's portfolio, market conditions, and other factors. You should read all of the risk information below carefully, because any one or more of these risks may result in losses to the Fund.
Active Management Risk. The Fund is actively managed and its performance therefore will reflect, in part, the ability of the portfolio managers to make investment decisions that seek to achieve the Fund’s investment objective. Due to its active management, the Fund could underperform its benchmark index and/or other funds with similar investment objectives and/or strategies.
Convertible Securities Risk. Convertible securities are subject to the usual risks associated with debt instruments, such as interest rate risk (the risk of losses attributable to changes in interest rates) and credit risk (the risk that the issuer of a debt instrument will default or otherwise become unable, or be perceived to be unable or unwilling, to honor a financial obligation, such as making payments to the Fund when due). Convertible securities also react to changes in the value of the common stock into which they convert and are thus subject to market risk (the risk that the market values of securities or other investments that the Fund holds will fall, sometimes rapidly or unpredictably,
10
Prospectus 2026
Variable Portfolio – Partners Core Equity Fund
More Information About the Fund (continued)
or fail to rise). Because the value of a convertible security can be influenced by both interest rates and the common stock's market movements, a convertible security generally is not as sensitive to interest rates as a similar debt instrument and generally will not vary in value in response to other factors to the same extent as the underlying common stock. In the event of a liquidation of the issuing company, holders of convertible securities would typically be paid before the company's common stockholders but after holders of any senior debt obligations of the company. The Fund may be forced to convert a convertible security before it otherwise would choose to do so, which may decrease the Fund's return.
Depositary Receipts Risk. Depositary receipts are receipts issued by a bank or trust company reflecting ownership of underlying securities issued by foreign companies. Some foreign securities are traded in the form of American Depositary Receipts and/or Global Depositary Receipts. Depositary receipts involve risks similar to the risks associated with investments in foreign securities, including those associated with an issuer’s (and any of its related companies’) country of organization and places of business operations, which may be related to the particular political, regulatory, economic, social and other conditions or events (including, for example, military confrontations and actions, war, other conflicts, terrorism and disease/virus outbreaks and epidemics) occurring in the country and fluctuations in such country’s currency, as well as market risk tied to the underlying foreign company. In addition, holders of depositary receipts may have limited voting rights, may not have the same rights afforded to stockholders of a typical domestic company in the event of a corporate action, such as an acquisition, merger or rights offering, and may experience difficulty in receiving company stockholder communications. There is no guarantee that a financial institution will continue to sponsor a depositary receipt, or that a depositary receipt will continue to trade on an exchange, either of which could adversely affect the liquidity, availability and pricing of the depositary receipt. Changes in foreign currency exchange rates will affect the value of depositary receipts and, therefore, may affect the value of your investment in the Fund.
Equity Securities Risk. Investments in equity securities represent ownership in a company that fluctuates in value with changes in the company’s financial condition. Equity markets may experience significant volatility at times and may fall sharply in response to adverse events. Certain segments of the equity market may react differently than other segments and U.S. markets may react differently than foreign markets. Individual equity prices also may experience dramatic movements in price. Price movements may result from factors affecting individual companies, sectors, or industries selected for the Fund’s portfolio or the securities market as a whole, including periods of slower growth or recessionary economic conditions, future expectations of poor economic conditions, changes in political or social conditions, and lack of investor confidence. In addition, individual equity interests may be adversely affected by factors such as reduced sales, increased costs, or a negative outlook for the future performance of the company. As compared with preferred stock and debt, common stock generally involves greater risk and has lower priority when liquidation, bankruptcy, and dividend payments are made. Preferred stock may be subordinated to bonds or other debt instruments in a company’s capital structure and is typically less liquid than common stock.
Foreign Securities Risk. Investments in or exposure to securities of foreign companies may involve heightened risks relative to investments in or exposure to securities of U.S. companies. For example, foreign markets can be extremely volatile. Foreign securities may also be less liquid, making them more difficult to trade, than securities of U.S. companies so that the Fund may, at times, be unable to sell foreign securities at desirable times or prices. Brokerage commissions, custodial costs and other fees are also generally higher for foreign securities. The Fund may have limited or no legal recourse in the event of default with respect to certain foreign securities, including those issued by foreign governments. In addition, foreign governments may impose withholding or other taxes on the Fund’s income, capital gains or proceeds from the disposition of foreign securities, which could reduce the Fund’s return on such securities. In some cases, such withholding or other taxes could potentially be confiscatory. Other risks include: possible delays in the settlement of transactions or in the payment of income; generally less publicly available information about foreign companies; the impact of economic, political, social, diplomatic or other conditions or events (including, for example, military confrontations and actions, war, other conflicts, terrorism and disease/virus outbreaks and epidemics), possible seizure, expropriation or nationalization of a company or its assets or the assets of a particular investor or category of investors; accounting, auditing and financial reporting standards that may be less comprehensive and stringent than those applicable to domestic companies; the imposition of economic and other sanctions against a particular foreign country, its nationals or industries or businesses within
Prospectus 2026
11
Variable Portfolio – Partners Core Equity Fund
More Information About the Fund (continued)
the country; and the generally less stringent standard of care to which local agents may be held in the local markets. In addition, it may be difficult to obtain reliable information about the securities and business operations of certain foreign issuers. Governments or trade groups may compel local agents to hold securities in designated depositories that are not subject to independent evaluation. The less developed a country’s securities market is, the greater the level of risks. Economic sanctions may be, and have been, imposed against certain countries, organizations, companies, entities and/or individuals. Economic sanctions and other similar governmental actions could, among other things, effectively restrict or eliminate the Fund’s ability to purchase or sell securities, and thus may make the Fund’s investments in such securities less liquid or more difficult to value. In addition, as a result of economic sanctions, the Fund may be forced to sell or otherwise dispose of investments at inopportune times or prices, which could result in losses to the Fund and increased transaction costs. These conditions may be in place for a substantial period of time and enacted with limited advance notice to the Fund. The risks posed by sanctions against a particular foreign country, its nationals or industries or businesses within the country may be heightened to the extent the Fund invests significantly in the affected country or region or in issuers from the affected country that depend on global markets. Additionally, investments in certain countries may subject the Fund to a number of tax rules, the application of which may be uncertain. Countries may amend or revise their existing tax laws, regulations and/or procedures in the future, possibly with retroactive effect. Changes in or uncertainties regarding the laws, regulations or procedures of a country could reduce the after-tax profits of the Fund, directly or indirectly, including by reducing the after-tax profits of companies located in such countries in which the Fund invests, or result in unexpected tax liabilities for the Fund. The performance of the Fund may also be negatively affected by fluctuations in a foreign currency's strength or weakness relative to the U.S. dollar, particularly to the extent the Fund invests a significant percentage of its assets in foreign securities or other assets denominated in currencies other than the U.S. dollar. Currency rates in foreign countries may fluctuate significantly over short or long periods of time for a number of reasons, including changes in interest rates, imposition of currency exchange controls and economic or political developments in the U.S. or abroad. The Fund may also incur currency conversion costs when converting foreign currencies into U.S. dollars and vice versa.
Issuer Risk. An issuer in which the Fund invests or to which it has exposure may perform poorly or below expectations, and the value of its securities may therefore decline, which may negatively affect the Fund’s performance. Underperformance of an issuer may be caused by poor management decisions, competitive pressures, breakthroughs in technology, reliance on suppliers, labor problems or shortages, corporate restructurings, fraudulent disclosures, natural disasters, military confrontations and actions, war, other conflicts, terrorism, disease/virus outbreaks, epidemics or other events, conditions and factors which may impair the value of your investment in the Fund.
■
Small- and Mid-Cap Stock Risk. Securities of small- and mid-cap companies can, in certain circumstances, have a higher potential for gains than securities of larger companies but are more likely to have more risk than larger companies. For example, small- and mid-cap companies may be more vulnerable to market downturns and adverse business or economic events than larger companies because they may have more limited financial resources and business operations. Small- and mid-cap companies are also more likely than larger companies to have more limited product lines and operating histories and to depend on smaller and generally less experienced management teams. Securities of small- and mid-cap companies may trade less frequently and in smaller volumes and may be less liquid and fluctuate more sharply in value than securities of larger companies. When the Fund takes significant positions in small- and mid-cap companies with limited trading volumes, the liquidation of those positions, particularly in a distressed market, could be prolonged and result in Fund investment losses that would affect the value of your investment in the Fund. In addition, some small- and mid-cap companies may not be widely followed by the investment community, which can lower the demand for their stocks.
■
Large-Cap Stock Risk. Investments in larger companies may involve certain risks associated with their larger size. For instance, larger companies may be less able to respond quickly to new competitive challenges, such as changes in consumer tastes or innovation from smaller competitors. Also, larger companies are sometimes less able to achieve as high growth rates as successful smaller companies, especially during extended periods of economic expansion.
12
Prospectus 2026
Variable Portfolio – Partners Core Equity Fund
More Information About the Fund (continued)
Market Risk. The Fund may incur losses due to declines in the value of one or more securities in which it invests. These declines may be due to factors affecting a particular issuer, or the result of, among other things, political, regulatory, market, economic or social developments affecting the relevant market(s) more generally. In addition, turbulence in financial markets and reduced liquidity in equity, credit and/or fixed income markets may negatively affect many issuers, which could adversely affect the Fund’s ability to price or value hard-to-value assets in thinly traded and closed markets and could cause significant redemptions and operational challenges. Global economies and financial markets are increasingly interconnected, and conditions and events in one country, region or financial market may adversely impact issuers in a different country, region or financial market. These risks may be magnified if certain events or developments adversely interrupt the global supply chain; in these and other circumstances, such risks might affect companies worldwide. As a result, local, regional or global events such as terrorism, war, other conflicts, natural disasters, disease/virus outbreaks and epidemics or other public health issues, recessions, depressions or other events – or the potential for such events – could have a significant negative impact on global economic and market conditions.
The large-scale invasion of Ukraine by Russia in February 2022 has resulted in sanctions and market disruptions, including declines in regional and global stock markets, unusual volatility in global commodity markets and significant devaluations of Russian currency. In addition, the Iranian conflict that commenced in February 2026 may result in similar, and potentially more severe, disruptions. Escalation of hostilities in the Middle East region could disrupt energy production or transportation, including through key shipping routes, which may lead to increased volatility in energy and other commodity prices. The extent and duration of these conflicts are impossible to predict but could continue to be significant. Market disruption caused by these conflicts, and any countermeasures or responses thereto (including international sanctions, a downgrade in a country’s credit rating, purchasing and financing restrictions, boycotts, tariffs, changes in consumer or purchaser preferences, cyberattacks and espionage) could continue to have severe adverse impacts on regional and/or global securities and commodities markets, including markets for oil and natural gas. These impacts may include reduced market liquidity, distress in credit markets, further disruption of global supply chains, increased risk of inflation, and limited access to investments in certain international markets and/or issuers. These developments and other related events could negatively impact Fund performance.
Multi-Adviser Risk. The Fund has multiple advisory firms that each manage a portion of the Fund’s net assets on a daily basis. Each adviser makes investment decisions independently from the other adviser(s). It is possible that the security selection process of one adviser will not complement or may conflict or even contradict that of the other adviser(s), including making off-setting trades that have no net effect to the Fund, but which may increase Fund expenses. As a result, the Fund's exposure to a given security, industry, sector or market capitalization could be smaller or larger than if the Fund were managed by a single adviser, which could adversely affect the Fund's performance.
Preferred Stock Risk. Preferred stock is a type of stock that may pay dividends at a different rate than common stock of the same issuer, if at all, and that has preference over common stock in the payment of dividends and the liquidation of assets. Preferred stock does not ordinarily carry voting rights. The price of a preferred stock is generally determined by earnings, type of products or services, projected growth rates, experience of management, liquidity, and general market conditions of the markets on which the stock trades. The most significant risks associated with investments in preferred stock include issuer risk, market risk and interest rate risk (the risk of losses attributable to changes in interest rates).
Sector Risk. At times, the Fund may have a significant portion of its assets invested in securities of companies conducting business in a related group of industries within one or more economic sectors, including the information technology sector. Companies in the same sector may be similarly affected by economic, regulatory, political or market events or conditions, which may make the Fund vulnerable to unfavorable developments in that group of industries or economic sector.
■
Information Technology Sector. The Fund is vulnerable to the particular risks that may affect companies in the information technology sector. Companies in the information technology sector are subject to certain risks, including the risk that new services, equipment or technologies will not be accepted by consumers and businesses or will become rapidly obsolete. Performance of such companies may be affected by factors including
Prospectus 2026
13
Variable Portfolio – Partners Core Equity Fund
More Information About the Fund (continued)
obtaining and protecting patents (or the failure to do so) and significant competitive pressures, including aggressive pricing of their products or services, new market entrants, competition for market share and short product cycles due to an accelerated rate of technological developments. Such competitive pressures may lead to limited earnings and/or falling profit margins. As a result, the value of their securities may fall or fail to rise. In addition, many information technology sector companies have limited operating histories and prices of these companies’ securities historically have been more volatile than other securities, especially over the short term. Some companies in the information technology sector are facing increased government and regulatory scrutiny and may be subject to adverse government or regulatory action, which could negatively impact the value of their securities.
Additional Investment Strategies and Policies
This section describes certain investment strategies and policies that the Fund may utilize in pursuit of its investment objective and some additional factors and risks involved with investing in the Fund.
Investment Guidelines
As a general matter, and except as specifically described in the discussion of the Fund's principal investment strategies in this prospectus or as otherwise required by the Investment Company Act of 1940, as amended (the 1940 Act), the rules and regulations thereunder and any applicable exemptive relief, whenever an investment policy or limitation states a percentage of the Fund's assets that may be invested in any security or other asset or sets forth a policy regarding an investment standard, compliance with that percentage limitation or standard will be determined solely at the time of the Fund's investment in the security or asset.
Holding Other Kinds of Investments
The Fund may hold other investments that are not part of its principal investment strategies. These investments and their risks are described below and/or in the Statement of Additional Information (SAI). The Fund may choose not to invest in certain securities described in this prospectus and in the SAI, although it has the ability to do so. Information on the Fund’s holdings can be found in the Fund’s Form N-CSR or by visiting columbiathreadneedleus.com.
Transactions in Derivatives
The Fund may enter into derivative transactions or otherwise have exposure to derivative transactions through underlying investments. Derivatives are financial contracts whose values are, for example, based on (or “derived” from) traditional securities (such as a stock or bond), assets (such as a commodity like gold or a foreign currency), reference rates (such as the Secured Overnight Financing Rate (commonly known as SOFR)) or market indices (such as the Standard & Poor’s 500® Index). The use of derivatives is a highly specialized activity which involves investment techniques and risks different from those associated with ordinary portfolio securities transactions. Derivatives involve special risks and may result in losses or may limit the Fund’s potential gain from favorable market movements. Derivative strategies often involve leverage, which may exaggerate a loss, potentially causing the Fund to lose more money than it would have lost had it invested in the underlying security or other asset directly. The values of derivatives may move in unexpected ways, especially in unusual market conditions, and may result in increased volatility in the value of the derivative and/or the Fund’s shares, among other consequences. Other risks arise from the Fund’s potential inability to terminate or to sell derivative positions. A liquid secondary market may not always exist for the Fund’s derivative positions at times when the Fund might wish to terminate or to sell such positions. Over-the-counter instruments (investments not traded on an exchange) may be illiquid, and transactions in derivatives traded in the over-the-counter market are subject to the risk that the other party will not meet its obligations. The use of derivatives also involves the risks of mispricing or improper valuation and that changes in the value of the derivative may not correlate perfectly with the underlying security, asset, reference rate or index. The Fund also may not be able to find a suitable derivative transaction counterparty, and thus may be unable to engage in derivative transactions when it is deemed favorable to do so, or at all. The U.S. government and the European Union (and some other jurisdictions) have enacted regulations and similar requirements that prescribe clearing, margin, reporting and registration requirements for participants in the derivatives market. These requirements are evolving
14
Prospectus 2026
Variable Portfolio – Partners Core Equity Fund
More Information About the Fund (continued)
and their ultimate impact on the Fund remains unclear, but such impact could include restricting and/or imposing significant costs or other burdens upon the Fund’s participation in derivatives transactions. Additionally, regulations governing the use of derivatives by registered investment companies, such as the Fund, require, among other things, that a fund that invests in derivative instruments beyond a specified limited amount apply a value-at-risk-based limit to its portfolio and establish a comprehensive derivatives risk management program. As of the date of this prospectus, the Fund is not required to maintain a comprehensive derivatives risk management program given its more limited use of derivatives. For more information on the risks of derivative investments and strategies, see the SAI.
Affiliated Fund Investing
The Investment Manager or an affiliate serves as investment adviser to funds using the Columbia brand (Columbia Funds), including those that are structured as “fund-of-funds”, and provides asset-allocation services to (i) shareholders by investing in shares of other Columbia Funds, which may include the Fund (collectively referred to in this section as Underlying Funds), and (ii) discretionary managed accounts (collectively referred to as affiliated products) that invest exclusively in Underlying Funds. These affiliated products, individually or collectively, may own a significant percentage of the outstanding shares of one or more Underlying Funds, and the Investment Manager seeks to balance potential conflicts of interest between the affiliated products and the Underlying Funds in which they invest. The affiliated products’ investment in the Underlying Funds may have the effect of creating economies of scale, possibly resulting in lower expense ratios for the Underlying Funds, because the affiliated products may own substantial portions of the shares of Underlying Funds. However, redemption of Underlying Fund shares by one or more affiliated products could cause the expense ratio of an Underlying Fund to increase, as its fixed costs would be spread over a smaller asset base. Because of large positions of certain affiliated products, the Underlying Funds may experience relatively large inflows and outflows of cash due to affiliated products’ purchases and sales of Underlying Fund shares. Although the Investment Manager or its affiliate may seek to minimize the impact of these transactions where possible, for example, by structuring them over a reasonable period of time or through other measures, Underlying Funds may experience increased expenses as they buy and sell portfolio securities to manage the cash flow effect related to these transactions. Further, when the Investment Manager or its affiliate structures transactions over a reasonable period of time in order to manage the potential impact of the buy and sell decisions for the affiliated products, those affiliated products, including funds-of-funds, may pay more or less (for purchase activity), or receive more or less (for redemption activity), for shares of the Underlying Funds than if the transactions were executed in one transaction. In addition, substantial redemptions by affiliated products within a short period of time could require the Underlying Fund to liquidate positions more rapidly than would otherwise be desirable, which may have the effect of reducing or eliminating potential gain or causing it to realize a loss. In order to meet such redemptions, an Underlying Fund may be forced to sell its liquid (or more liquid) positions, leaving the Underlying Fund holding, post-redemption, a relatively larger position in illiquid investments (i.e., any investment that the Fund reasonably expects cannot be sold or disposed of in current market conditions in seven calendar days or less without the sale or disposition significantly changing the market value of the investment) or less liquid securities. Substantial redemptions may also adversely affect the ability of the Underlying Fund to implement its investment strategy. The Investment Manager or its affiliate also has a conflict of interest in determining the allocation of affiliated products’ assets among the Underlying Funds, as it earns different fees from the various Underlying Funds.
Investing in Money Market Funds
The Fund may invest cash in, or hold as collateral for certain investments, shares of registered or unregistered money market funds, including funds advised by the Investment Manager or its affiliates. These funds are not insured or guaranteed by the Federal Deposit Insurance Corporation (FDIC) or any other government agency. The Fund and its shareholders indirectly bear a portion of the expenses of any money market fund or other fund in which the Fund may invest.
Prospectus 2026
15
Variable Portfolio – Partners Core Equity Fund
More Information About the Fund (continued)
Investing Defensively
The Fund may from time to time take temporary defensive investment positions that may be inconsistent with the Fund’s principal investment strategies in attempting to respond to adverse market, economic, political, social or other conditions, including, without limitation, investing some or all of its assets in money market instruments or shares of affiliated or unaffiliated money market funds or holding some or all of its assets in cash or cash equivalents. The Fund may take such defensive investment positions for as long a period as deemed necessary.
The Fund may not achieve its investment objective while it is investing defensively. Investing defensively may adversely affect Fund performance. During these times, the portfolio managers may make frequent portfolio holding changes, which could result in increased trading expenses and decreased Fund performance. See also Investing in Money Market Funds above for more information.
Other Strategic and Investment Measures
The Fund may also from time to time take temporary portfolio positions that may or may not be consistent with the Fund’s principal investment strategies in attempting to respond to adverse market, economic, political, social or other conditions, including, without limitation, investing in derivatives, such as forward contracts, futures contracts, options, structured investments and swaps, for various purposes, including among others, investing in particular derivatives in seeking to reduce investment exposures, or in seeking to achieve indirect investment exposures, to a sector, country, region or currency where the Investment Manager believes such positioning is appropriate. The Fund may take such portfolio positions for as long a period as deemed necessary. While the Fund is so positioned, derivatives could comprise a substantial portion of the Fund’s investments and the Fund may not achieve its investment objective. Investing in this manner may adversely affect Fund performance. During these times, the portfolio managers may make frequent portfolio holding changes, which could result in increased trading expenses and decreased Fund performance. For information on the risks of investing in derivatives, see Transactions in Derivatives above.
Portfolio Holdings Disclosure
The Board has adopted policies and procedures that govern the timing and circumstances of disclosure to shareholders and third parties of information regarding the securities owned by the Fund. A description of these policies and procedures is included in the SAI. Fund policy generally permits the disclosure of portfolio holdings information on the Fund's website (columbiathreadneedleus.com) only after a certain amount of time has passed, as described in the SAI.
Purchases and sales of portfolio securities can take place at any time, so the portfolio holdings information available on the Fund's website may not always be current.
FUNDamentals
Portfolio Holdings Versus the Benchmarks
The Fund does not limit its investments to the securities within its benchmark(s), and accordingly the Fund's holdings may diverge from those of its benchmark(s). In addition, the Fund may invest in securities outside any industry and geographic sectors represented in its benchmark(s). The Fund's weightings in individual securities, and in industry or geographic sectors, may also vary considerably from those of its benchmark(s).
Cash Flows
The timing and magnitude of cash inflows from investors buying Fund shares could prevent the Fund from always being fully invested. Conversely, the timing and magnitude of cash outflows to shareholders redeeming Fund shares could require the Fund to sell portfolio securities at less than opportune times or to hold ready reserves of uninvested cash in amounts larger than might otherwise be the case to meet shareholder redemptions. Either situation could adversely impact the Fund’s performance.
16
Prospectus 2026
Variable Portfolio – Partners Core Equity Fund
More Information About the Fund (continued)
Understanding Annual Fund Operating Expenses
The Fund’s annual operating expenses, as presented in the Annual Fund Operating Expenses table in the Fees and Expenses of the Fund section of this prospectus, generally are based on expenses incurred during the Fund’s most recently completed fiscal year, may vary by share class and are expressed as a percentage (expense ratio) of the Fund’s average net assets during that fiscal year. The expense ratios reflect the Fund’s fee arrangements as of the date of this prospectus and, unless indicated otherwise, are based on expenses incurred during the Fund’s most recent fiscal year. The Fund’s assets will fluctuate, but unless indicated otherwise in the Annual Fund Operating Expenses table, no adjustments have been or will be made to the expense ratios to reflect any differences in the Fund’s average net assets between the most recently completed fiscal year and the date of this prospectus or a later date. In general, the Fund’s expense ratios will increase as its net assets decrease, such that the Fund’s actual expense ratios may be higher than the expense ratios presented in the Annual Fund Operating Expenses table if assets fall. Any commitment by the Investment Manager and/or its affiliates to waive fees and/or cap (reimburse) expenses is expected, in part, to limit the impact of any increase in the Fund’s expense ratios that would otherwise result because of a decrease in the Fund’s assets in the current fiscal year. The Fund’s annual operating expenses are comprised of (i) investment management fees, (ii) distribution and/or service fees, and (iii) other expenses. Management fees do not vary by class, but distribution and/or service fees and other expenses may vary by class.
FUNDamentals
Other Expenses
“Other expenses” consist of the fees the Fund pays to its custodian, transfer agent, auditors, lawyers and trustees, costs relating to compliance and miscellaneous expenses. Generally, these expenses are allocated on a pro rata basis across all share classes. These fees include certain sub-transfer agency and shareholder servicing fees. For more information on these fees, see About Fund Shares and Transactions — Financial Intermediary Compensation.
Fee Waiver/Expense Reimbursement Arrangements and Impact on Past Performance
The Investment Manager and certain of its affiliates have contractually agreed to waive fees and/or reimburse expenses (excluding certain fees and expenses described below) through April 30, 2027, unless sooner terminated at the sole discretion of the Fund's Board, so that the Fund’s net operating expenses, after giving effect to fees waived/expenses reimbursed and any balance credits and/or overdraft charges from the Fund’s custodian, do not exceed the annual rates of:
| Variable Portfolio - Partners Core Equity Fund | |
| Class 1 |
0.68% |
| Class 2 |
0.93% |
| Class 3 |
0.805% |
Under the agreement, the following fees and expenses are excluded from the Fund’s operating expenses when calculating the waiver/reimbursement commitment, and therefore will be paid by the Fund, if applicable: taxes (including foreign transaction taxes), expenses associated with investment in affiliated and non-affiliated pooled investment vehicles (including mutual funds and exchange-traded funds), transaction costs and brokerage commissions, costs related to any securities lending program, dividend expenses associated with securities sold short, inverse floater program fees and expenses, transaction charges and interest on borrowed money, interest, costs associated with shareholder meetings, infrequent and/or unusual expenses and any other expenses the exclusion of which is specifically approved by the Fund’s Board. This agreement may be modified or amended only with approval from all parties.
Prospectus 2026
17
Variable Portfolio – Partners Core Equity Fund
More Information About the Fund (continued)
Effect of Fee Waivers and/or Expense Reimbursements on Past Performance. The Fund’s returns shown in the Performance Information section of this prospectus reflect the effect of any fee waivers and/or reimbursements of Fund expenses by the Investment Manager and/or any of its affiliates that were in place during the performance period shown. Without such fee waivers/expense reimbursements, the Fund’s returns might have been lower.
Primary Service Provider Contracts
The Fund enters into contractual arrangements (Service Provider Contracts) with various service providers, including, among others, the Investment Manager, the Distributor, Columbia Management Investment Services Corp. (the Transfer Agent) and the Fund’s custodian. The Fund’s Service Provider Contracts are solely among the parties thereto. Shareholders are not parties to, or intended to be third-party beneficiaries of, any Service Provider Contracts. Further, this prospectus, the SAI and any Service Provider Contracts are not intended to give rise to any agreement, duty, special relationship or other obligation between the Fund and any investor, or give rise to any contractual, tort or other rights in any individual shareholder, group of shareholders or other person, including any right to assert a fiduciary or other duty, enforce the Service Provider Contracts against the parties or to seek any remedy thereunder, either directly or on behalf of the Fund. Nothing in the previous sentence should be read to suggest any waiver of any rights under federal or state securities laws.
The Investment Manager, the Distributor, and the Transfer Agent are all affiliates of Ameriprise Financial, Inc. (Ameriprise Financial). They and their affiliates currently provide key services, including investment advisory, administration, distribution, shareholder servicing and transfer agency services, to the Fund and various other funds, including the Columbia Funds, and are paid for providing these services. These service relationships are described below.
The Investment Manager
Columbia Management Investment Advisers, LLC is located at 290 Congress Street, Boston, MA 02210 and serves as investment adviser and administrator to the Columbia Funds. The Investment Manager is a registered investment adviser and a wholly-owned subsidiary of Ameriprise Financial. The Investment Manager’s management experience covers all major asset classes, including equity securities, debt instruments and money market instruments. In addition to serving as an investment adviser to traditional mutual funds, exchange-traded funds and closed-end funds, the Investment Manager acts as an investment adviser for itself, its affiliates, individuals, corporations, retirement plans, private investment companies and financial intermediaries.
Subject to oversight by the Board, the Investment Manager manages the day-to-day operations of the Fund. The Investment Manager is responsible for the investment management of the Fund, but has delegated certain of its duties, including day-to-day portfolio management of all or a portion of the Fund’s assets to one or more investment subadvisers that determine what securities and other investments the Fund should buy or sell. The Investment Manager is also responsible for overseeing the administrative operations of the Fund, including the general supervision of the Fund’s operations, the coordination of the Fund’s other service providers and the provision of related clerical and administrative services.
The SEC has issued an order that permits the Investment Manager, subject to the approval of the Board, to appoint unaffiliated subadvisers by entering into subadvisory agreements with them, and to change in material respects the terms of those subadvisory agreements, including the fees paid thereunder, for the Fund without first obtaining shareholder approval, thereby avoiding the expense and delays typically associated with obtaining shareholder approval. The Fund furnishes shareholders with information about new subadvisers retained in reliance on the order within 90 days after hiring the subadviser. The Investment Manager and its affiliates may have other relationships, including significant financial relationships, with current or potential subadvisers or their affiliates, which may create certain conflicts of interest. When making recommendations to the Board to appoint or to change a subadviser, or to change the terms of a subadvisory agreement, the Investment Manager discloses to the Board the nature of any such material relationships. The SEC has issued a separate order that permits the Board to approve new subadvisory agreements or material changes to existing subadvisory agreements at a meeting that is not in person, provided that the Trustees are able to participate in the meeting using a means of communication that allows them to hear each other simultaneously during the meeting and other conditions of the order are satisfied.
18
Prospectus 2026
Variable Portfolio – Partners Core Equity Fund
More Information About the Fund (continued)
The Fund pays the Investment Manager a fee for its management services, which include investment advisory services and administrative services. The fee is calculated as a percentage of the daily net assets of the Fund and is paid monthly. For the Fund’s most recent fiscal year, management services fees paid to the Investment Manager by the Fund amounted to 0.69% of average daily net assets of the Fund, before any applicable reimbursements.
A discussion regarding the basis for the Board’s approval of the renewal of the Fund's management agreement is available in the Fund’s Form N-CSR for the fiscal period ended June 30, 2025.
The Investment Manager has, with the approval of the Board, engaged an investment subadviser(s) to make the day-to-day investment decisions for the Fund. The Investment Manager pays the subadviser(s) for investment advisory services and retains ultimate responsibility (subject to Board oversight) for overseeing any subadviser it engages and for evaluating the Fund’s needs and the subadvisers’ skills and abilities on an ongoing basis. Based on its evaluations, the Investment Manager may at times recommend to the Board that the Fund change, add or terminate one or more subadvisers; continue to retain a subadviser even though the subadviser’s ownership or corporate structure has changed; or materially change a subadvisory agreement with a subadviser. A discussion regarding the basis for the Board’s approval of the renewal of the investment subadvisory agreements with JPMIM and T. Rowe Price is available in the Fund’s Form N-CSR for the fiscal period ended June 30, 2025.
The date the Subadvisers began serving the Fund is set forth under Subadvisers below. Any performance of the Fund prior to the date the Subadvisers began serving was achieved by one or more different subadvisers. Similarly, the portfolio turnover rate for periods prior to the Subadvisers’ management of the Fund was the result of management by one or more different subadvisers. A change in subadvisers may result in increased portfolio turnover.
Subadvisers
JPMIM, which has served as Subadviser to the Fund since May 2021, is located at 270 Park Avenue, New York, NY 10017. JPMIM, subject to the supervision of Columbia Management, provides day-to-day management of a portion of the Fund’s portfolio, as well as investment research and statistical information, under a subadvisory agreement with Columbia Management. JPMIM was incorporated in 1984 and provides a broad range of investment strategies to meet the diverse requirements of their clients’ investment needs.
T. Rowe Price, which has served as Subadviser to the Fund since May 2019, is located at 1307 Point Street, Baltimore, MD 21231. T. Rowe Price, subject to the supervision of Columbia Management, provides day-to-day management of a portion of the Fund’s portfolio, as well as investment research and statistical information, under a subadvisory agreement with Columbia Management. T. Rowe Price is a Maryland corporation founded in 1937 that provides investment management services to individual and institutional investors, and sponsors and serves as adviser and subadviser to registered investment companies, institutional separate accounts, and common trust funds.
Portfolio Managers
Information about the portfolio managers primarily responsible for overseeing the Fund’s investments is shown below. The SAI provides additional information about the portfolio managers, including information relating to compensation, other accounts managed by the portfolio managers, and ownership by the portfolio managers of Fund shares.
Subadviser: J.P. Morgan Investment Management Inc. (JPMIM)
| Portfolio Management |
Title |
Role with Fund |
Managed Fund Since |
| Scott Davis |
Managing Director of JPMIM |
Co-Portfolio Manager |
2021 |
| Shilpee Raina, CFA |
Executive Director of JPMIM |
Co-Portfolio Manager |
2021 |
Mr. Davis is a Managing Director of JPMIM and joined the firm in 2006. Mr. Davis began his investment career in 1993 and earned a B.S. from Drexel University and an M.B.A. from Columbia Business School.
Ms. Raina is an Executive Director of JPMIM and joined the firm in 2005. Ms. Raina began her investment career in 2005 and earned a B.S. from The University of Virginia’s McIntire School of Commerce.
Subadviser: T. Rowe Price Associates, Inc. (T. Rowe Price)
Prospectus 2026
19
Variable Portfolio – Partners Core Equity Fund
More Information About the Fund (continued)
| Portfolio Management |
Title |
Role with Fund |
Managed Fund Since |
| Shawn Driscoll |
Vice President and Portfolio Manager of T. Rowe Price |
Portfolio Manager |
2022 |
Mr. Driscoll joined T. Rowe Price in 2006. Mr. Driscoll began his investment career in 2003 and earned a B.A. from the University of Rochester and an M.B.A. from New York University, Leonard N. Stern School of Business.
The Distributor
Shares of the Fund are distributed by Columbia Management Investment Distributors, Inc., which is located at 290 Congress Street, Boston, MA 02210. The Distributor is a registered broker-dealer and an indirect, wholly-owned subsidiary of Ameriprise Financial. The Distributor and its affiliates may pay commissions, distribution and service fees and/or other compensation to entities, including Ameriprise Financial affiliates, for selling shares and providing services to investors.
The Transfer Agent
Columbia Management Investment Services Corp. is a registered transfer agent and wholly-owned subsidiary of Ameriprise Financial. The Transfer Agent is located at 290 Congress Street, Boston, MA 02210, and its responsibilities include processing purchases, redemptions and transfers of Fund shares, calculating and paying distributions, maintaining shareholder records, preparing account statements and providing customer service. The Transfer Agent has engaged SS&C GIDS, Inc. to provide various sub-transfer agency services. The Fund pays a service fee to participating insurance companies or other financial intermediaries that provide sub-recordkeeping and other services to Contract owners and the separate accounts. The Transfer Agent may retain as compensation for its services revenues for fees for wire, telephone and redemption orders, account transcripts due the Transfer Agent from Fund shareholders and interest (net of bank charges) earned with respect to balances in accounts the Transfer Agent maintains in connection with its services to the Fund.
Other Roles and Relationships of Ameriprise Financial and its Affiliates — Certain Conflicts of Interest
The Investment Manager, Distributor and Transfer Agent, all affiliates of Ameriprise Financial, provide various services to the Fund and other Columbia Funds for which they are compensated. Ameriprise Financial and its other affiliates may also provide other services to these funds and be compensated for them.
The Investment Manager and its affiliates may provide investment advisory and other services to other clients and customers substantially similar to those provided to the Columbia Funds. These activities, and other financial services activities of Ameriprise Financial and its affiliates, may present actual and potential conflicts of interest and introduce certain investment constraints.
Ameriprise Financial is a major financial services company, engaged in a broad range of financial activities beyond the fund-related activities of the Investment Manager, including, among others, insurance, broker-dealer (sales and trading), asset management, banking and other financial activities. These additional activities may involve multiple advisory, financial, insurance and other interests in securities and other instruments, and in companies that issue securities and other instruments, that may be bought, sold or held by the Columbia Funds.
Conflicts of interest and limitations that could affect a Columbia Fund may arise from, for example, the following:
■
compensation and other benefits received by the Investment Manager and other Ameriprise Financial affiliates related to the management/administration of a Columbia Fund and the sale of its shares;
■
the allocation of, and competition for, investment opportunities among the Fund, other funds and accounts advised/managed by the Investment Manager and other Ameriprise Financial affiliates, or Ameriprise Financial itself and its affiliates;
■
separate and potentially divergent management of a Columbia Fund and other funds and accounts advised/managed by the Investment Manager and other Ameriprise Financial affiliates;
20
Prospectus 2026
Variable Portfolio – Partners Core Equity Fund
More Information About the Fund (continued)
■
regulatory and other investment restrictions on investment activities of the Investment Manager and other Ameriprise Financial affiliates and accounts advised/managed by them;
■
insurance and other relationships of Ameriprise Financial affiliates with companies and other entities in which a Columbia Fund invests;
■
regulatory and other restrictions relating to the sharing of information between Ameriprise Financial and its affiliates, including the Investment Manager, and a Columbia Fund; and
■
insurance companies investing in the Fund may be affiliates of Ameriprise Financial; these affiliated insurance companies, individually and collectively, may hold through separate accounts a significant portion of the Fund's shares and may also invest in separate accounts managed by the Investment Manager that have the same or substantially similar investment objectives and strategies as the Fund.
The Investment Manager and Ameriprise Financial have adopted various policies and procedures that are intended to identify, monitor and address conflicts of interest. However, there is no assurance that these policies, procedures and disclosures will be effective.
Additional information about Ameriprise Financial and the types of conflicts of interest and other matters referenced above is set forth in the Investment Management and Other Services — Other Roles and Relationships of Ameriprise Financial and its Affiliates — Certain Conflicts of Interest section of the SAI. Investors in the Columbia Funds should carefully review these disclosures and consult with their financial advisor if they have any questions.
Certain Legal Matters
Ameriprise Financial and certain of its affiliates are involved, in the normal course of business, in legal proceedings that include regulatory inquiries, arbitration and litigation (including class actions) concerning matters arising in connection with the conduct of their activities as part of a diversified financial services firm. Ameriprise Financial believes that the Fund is not currently the subject of, and that neither Ameriprise Financial nor any of its affiliates are the subject of, any pending legal, arbitration or regulatory proceedings that are likely to have a material adverse effect on the Fund or the ability of Ameriprise Financial or its affiliates to perform under their contracts with the Fund. Information regarding certain pending and settled legal proceedings may be found in the Fund’s Form N-CSR and in the SAI. Additionally, Ameriprise Financial is required to make quarterly (10-Q), annual (10-K) and, as necessary, 8-K filings with the SEC on legal and regulatory matters that relate to Ameriprise Financial and its affiliates. Copies of these filings may be obtained by accessing the SEC website at sec.gov.
Prospectus 2026
21
Variable Portfolio – Partners Core Equity Fund
About Fund Shares and Transactions
Description of the Share Classes
Share Class Features
The Fund offers the classes of shares set forth on the cover of this prospectus. Each share class has its own cost structure and other features. The following summarizes the primary features of the Class 1, Class 2 and Class 3 shares.
| |
Class 1 Shares |
Class 2 Shares |
Class 3 Shares |
| Eligible Investors |
Shares of the Fund are available only to separate accounts of participating insurance companies as underlying investments for variable annuity contracts and/or variable life insurance policies (collectively, Contracts) or qualified pension and retirement plans (Qualified Plans) or other eligible investors authorized by the Distributor. | ||
| Investment Limits |
none |
none |
none |
| Conversion Features |
none |
none |
none |
| Front-End Sales Charges |
none |
none |
none |
| Contingent Deferred Sales Charges (CDSCs) |
none |
none |
none |
| Maximum Distribution and/or Service Fees |
none |
0.25% |
0.125% |
FUNDamentals
Financial Intermediaries
The term “financial intermediary” refers to the insurance company that issued your contract, qualified pension or retirement plan sponsors or the financial intermediary that employs your financial advisor. Financial intermediaries also include broker-dealers and financial advisors as well as firms that employ broker-dealers and financial advisors, including, for example, brokerage firms, banks, investment advisers, third party administrators and other firms in the financial services industry, including Ameriprise Financial and its affiliates.
Distribution and/or Service Fees
Pursuant to Rule 12b-1 under the Investment Company Act of 1940, as amended (the 1940 Act), the Board has approved, and the Fund has adopted, a distribution plan which sets the distribution fees that are periodically deducted from the Fund’s assets for Class 2 and Class 3 shares. The distribution fee for Class 2 shares is 0.25% and the distribution fee for Class 3 shares is 0.125%. These fees are calculated daily, may vary by share class and are intended to compensate the Distributor and/or financial intermediaries for selling shares of the Fund and/or providing services to investors. Because the fees are paid out of the Fund’s assets on an ongoing basis, they will increase the cost of your investment over time.
The Fund will pay these fees to the Distributor and/or to eligible financial intermediaries for as long as the distribution plan continues. The Fund may reduce or discontinue payments at any time.
The Fund pays a service fee to participating insurance companies or other financial intermediaries that provide sub-recordkeeping and other services to Contract owners, Qualified Plan participants and the separate accounts.
Financial Intermediary Compensation
The Distributor, the Investment Manager and their affiliates make payments, from their own resources, to financial intermediaries, primarily to affiliated and unaffiliated insurance companies, for marketing/sales support services relating to the Fund (Marketing Support Payments). Such payments are generally based upon one or more of the following factors: average net assets of the Columbia Funds sold by the Distributor attributable to that financial intermediary; gross sales of the Columbia Funds distributed by the Distributor attributable to that financial intermediary; or a negotiated lump sum payment. While the financial arrangements may vary for each financial intermediary, the Marketing Support Payments to any one financial intermediary are generally between 0.05% and
22
Prospectus 2026
Variable Portfolio – Partners Core Equity Fund
About Fund Shares and Transactions (continued)
0.40% on an annual basis for payments based on average net assets of the Fund attributable to the financial intermediary, and between 0.05% and 0.25% on an annual basis for a financial intermediary receiving a payment based on gross sales of the Columbia Funds attributable to the financial intermediary.
As employee compensation and business unit operating goals at all levels are generally tied to the success of Ameriprise Financial, employees of Ameriprise Financial and its affiliates, including employees of affiliated broker-dealers and insurance companies, are incented to include shares of the Columbia Funds in Contracts offered by affiliated insurance companies. Certain employees, directly or indirectly, receive higher compensation and other benefits as investment in the Columbia Funds increases. In addition, management, sales leaders and other employees may spend more of their time and resources promoting Ameriprise Financial and its subsidiary companies, including the Distributor and the Investment Manager, and the products they offer, including the Fund.
In addition, the Transfer Agent has certain arrangements in place to compensate financial intermediaries, primarily to affiliated and unaffiliated insurance companies, that hold Fund shares through networked and omnibus accounts, including omnibus retirement plans, for services that they provide to beneficial Fund shareholders (Shareholder Services). Shareholder Services and related fees vary by financial intermediary and may include sub-accounting, sub-transfer agency, participant recordkeeping, shareholder or participant reporting, shareholder or participant transaction processing, maintenance of shareholder records, preparation of account statements and provision of customer service, and are not intended to include services that are primarily intended to result in the sale of Fund shares. Payments for Shareholder Services generally are not expected, with certain limited exceptions, to exceed 0.40% of the average aggregate value of the Fund’s shares. Each Fund pays the Transfer Agent a service fee equal to the payments made by the Transfer Agent to participating insurance companies and other financial intermediaries that provide Shareholder Services up to the lesser of the amount charged by the financial intermediary or a contractual asset-based cap. Payments of amounts that exceed the amount paid by the Fund are borne by the Transfer Agent, the Investment Manager and/or their affiliates.
In addition to the payments described above, the Distributor, the Investment Manager and their affiliates typically make other payments or allow promotional incentives to certain broker-dealers to the extent permitted by SEC and Financial Industry Regulatory Authority (FINRA) rules and by other applicable laws and regulations.
Amounts paid by the Distributor, the Investment Manager and their affiliates are paid out of their own resources and do not increase the amount paid by you or the Fund. You can find further details in the SAI about the payments made by the Distributor, the Investment Manager and their affiliates, as well as a list of the financial intermediaries, including Ameriprise Financial affiliates, to which the Distributor, the Investment Manager or their affiliates have agreed to make Marketing Support Payments and fee payments for Shareholder Services.
Your financial intermediary may charge you fees and commissions in addition to those described in this prospectus. You should consult with your financial intermediary and review carefully any disclosure your financial intermediary provides regarding its services and compensation. Depending on the financial arrangement in place at any particular time, a financial intermediary and its financial advisors may have a conflict of interest or financial incentive with respect to recommendations regarding the Fund or any Contract or Qualified Plan that includes the Fund.
Share Price Determination
The price you pay or receive when you buy, sell or transfer shares is the Fund's next determined net asset value (or NAV) per share for a given share class. The Fund calculates the NAV per share for each class of shares of the Fund at the end of each business day, with the value of the Fund's shares based on the total value of all of the securities and other assets that it holds as of such specified time.
Prospectus 2026
23
Variable Portfolio – Partners Core Equity Fund
About Fund Shares and Transactions (continued)
FUNDamentals
NAV Calculation
Each of the Fund's share classes calculates its NAV per share as follows:
NAV per share = (Value of assets of the share class) – (Liabilities of the share class)
Number of outstanding shares of the class
Number of outstanding shares of the class
FUNDamentals
Business Days
A business day is any day that the New York Stock Exchange (NYSE) is open. A business day typically ends at the close of regular trading on the NYSE, usually at 4:00 p.m. Eastern time. If the NYSE is scheduled to close early, the business day will be considered to end as of the time of the NYSE’s scheduled close. The Fund will not treat an intraday unscheduled disruption in NYSE trading or an intraday unscheduled closing as a close of regular trading on the NYSE for these purposes and will price its shares as of the regularly scheduled closing time for that day (typically, 4:00 p.m. Eastern time). Nonetheless, the NAV of Fund shares may be determined at such other time or times (in addition to or in lieu of the time set forth above) as the Fund’s Board may approve or ratify. On holidays and other days when the NYSE is closed, the Fund’s NAV is not calculated and the Fund does not accept buy or sell orders. However, the value of the Fund’s assets may still be affected on such days to the extent that the Fund holds foreign securities that trade on days that foreign securities markets are open.
Equity securities listed on an exchange are typically valued at the closing price or last trade on their primary exchange at the close of business of the NYSE. Equity securities without a readily available closing price or that are not listed on any exchange are typically valued at the mean between the closing bid and asked prices. Other equity securities, debt securities and other assets are valued differently. For instance, bank loans trading in the secondary market are fair valued unless market quotations are readily available, fixed income investments maturing in 60 days or less are valued primarily using the amortized cost method, unless this methodology results in a valuation that does not approximate the market value of these securities, and those maturing in excess of 60 days are valued based on prices obtained from a pricing service, if available (which may represent market values or fair values). Investments in other open-end funds are valued at their published NAVs. The value of the Fund’s portfolio securities is determined in accordance with the valuation policy approved by the Board (the Valuation Policy). Pursuant to Rule 2a-5 under the 1940 Act, the Board has designated the Investment Manager as the Fund’s valuation designee. The Investment Manager, in turn, has authorized its valuation committee to make fair value determinations and to carry out supervisory and certain other functions relating to the valuation of Fund portfolio securities, pursuant to the Valuation Policy.
If a market price is not readily available or is deemed not to reflect market value for a portfolio security, the Investment Manager will determine the price based on a determination of the security's fair value pursuant to the Valuation Policy. In addition, the Investment Manager may use fair valuation techniques to price securities that trade on a foreign exchange when a significant event has occurred after the foreign exchange closes but before the time at which the Fund’s share price is calculated. Foreign exchanges typically close before the time at which Fund share prices are calculated, and may be closed altogether on days when the Fund is open. Such significant events affecting a foreign security may include, but are not limited to: (1) corporate actions, earnings announcements, litigation or other events impacting a single issuer; (2) governmental action that affects securities in one sector or country; (3) natural disasters or armed conflicts affecting a country or region; or (4) significant domestic or foreign market fluctuations. The Fund uses various criteria, including an evaluation of U.S. market moves after the close of foreign markets, in determining whether a foreign security's market price is readily available and reflective of market value and, if not, the fair value of the security.
24
Prospectus 2026
Variable Portfolio – Partners Core Equity Fund
About Fund Shares and Transactions (continued)
Fair valuation may have the effect of reducing stale pricing arbitrage opportunities presented by the pricing of Fund shares. However, when the Investment Manager uses fair valuation to price equity securities, it may value those securities higher or lower than another fund or manager would. Also, fair valuation of Fund holdings may cause the Fund's performance to diverge to a greater degree from the performance of various benchmark indices used to compare the Fund's performance because indices generally do not use fair valuation techniques. Because of the judgment involved in fair valuation decisions, there can be no assurance that the value ascribed to a particular security is accurate. The Fund has retained one or more independent fair valuation pricing services to assist in the fair valuation process for foreign securities.
Futures and options on futures are valued based upon the settlement price as determined by the principal exchange on which they are traded or, in the absence of a settlement price, at the mean of the closing bid and ask. Generally, over-the-counter derivatives, such as swaps and swaptions, are valued based on a price provided by an approved pricing service.
Shareholder Information
Each share class has its own cost structure and other features. Your product may not offer every share class. The Fund encourages you to consult with a financial advisor who can help you with your investment decisions and for more information about the share classes offered by the Fund and available under your product. Shares of the Fund are generally available for purchase only by participating insurance companies in connection with Contracts and Qualified Plan sponsors.
The Fund, the Distributor or the Transfer Agent may refuse any order to buy or transfer shares. If this happens, the Fund will return any money it received, but no interest will be paid on that money.
Shares of the Fund may not be purchased or sold directly by individual Contract owners or participants in a Qualified Plan. When you sell your shares through your Contract or Qualified Plan, the Fund is effectively buying them back. This is called a redemption. The right of redemption may be suspended or payment postponed whenever permitted by applicable laws and regulations, as described under Satisfying Fund Redemption Requests below.
Depending on the context, references to “you” or “your” herein refer either to the holder of a Contract, participant in a Qualified Plan or qualified institutional investor who may select Fund shares to fund his or her investment in the Contract or Qualified Plan or to the participating insurance company as the holder of Fund shares through one or more separate accounts or the Qualified Plan.
Satisfying Fund Redemption Requests
The Fund typically expects to send the redeeming participating insurance company or Qualified Plan sponsor payment for shares within two business days after your trade date. The Fund can suspend redemptions and/or delay payment of redemption proceeds for up to seven days. The Fund can also suspend redemptions and/or delay payment of redemption proceeds in excess of seven days under certain circumstances, including when the NYSE is closed or trading thereon is restricted or during emergency or other circumstances, including as determined by the SEC.
The Fund typically seeks to satisfy redemption requests from cash or cash equivalents held by the Fund, from the proceeds of orders to purchase Fund shares or from the proceeds of sales of Fund holdings effected in the normal course of managing the Fund. However, the Fund may have to sell Fund holdings, including in down markets, to meet heavier than usual redemption requests. For example, under stressed or abnormal market conditions or circumstances, including circumstances adversely affecting the liquidity of the Fund’s investments, the Fund may be more likely to be forced to sell Fund holdings to meet redemptions than under normal market circumstances. In these situations, the Fund’s portfolio managers may have to sell Fund holdings that would not otherwise be sold because, among other reasons, the current price to be received is less than the value of the holdings perceived by the Fund’s portfolio managers. The Fund may also, under certain circumstances (but more likely under stressed or abnormal market conditions or circumstances), borrow money under a credit facility to which the Fund and certain other Columbia Funds are parties or from other Columbia Funds under an interfund lending program (except for closed-end funds and money market funds, which are not eligible to borrow under the program). The Fund and the
Prospectus 2026
25
Variable Portfolio – Partners Core Equity Fund
About Fund Shares and Transactions (continued)
other Columbia Funds are limited as to the amount that each may individually and collectively borrow under the credit facility and the interfund lending program. As a result, borrowings available to the Fund under the credit facility and the interfund lending program might be insufficient, alone or in combination with the other strategies described herein, to satisfy Fund redemption requests. Please see About Fund Investments – Borrowings – Interfund Lending in the SAI for more information about the credit facility and interfund lending program. The Fund is also limited in the total amount it may borrow. The Fund may only borrow to the extent permitted by the 1940 Act, the rules and regulations thereunder, and any exemptive relief available to the Fund, which currently limit Fund borrowings to 33 1/3% of total assets (including any amounts borrowed) less liabilities (other than borrowings), plus an additional 5% of its total assets for temporary purposes (to be repaid within 60 days without extension or renewal), in each case determined at the time the borrowing is made.
In addition, the Fund reserves the right to honor redemption orders in whole or in part with in-kind distributions of Fund portfolio securities instead of cash if the Investment Manager, in its sole discretion, determines it to be in the best interest of the remaining shareholders. Such in-kind distributions typically represent a pro-rata portion of Fund portfolio assets subject to adjustments (e.g., for non-transferable securities, round lots and derivatives). In the event the Fund distributes portfolio securities in kind, shareholders may incur brokerage and other transaction costs associated with converting the portfolio securities into cash. Also, the portfolio securities may increase or decrease in value after they are distributed but before they are converted into cash. For U.S. federal income tax purposes, redemptions paid in securities are generally treated the same as redemptions paid in cash. If, during any 90-day period, you redeem shares in an amount greater than $250,000 or 1% of the Fund’s net assets (whichever is less), and if the Investment Manager determines it to be feasible and appropriate, the Fund may pay the redemption amount above such threshold by an in-kind distribution of Fund portfolio securities. Although shares of the Fund may not be purchased or sold by individual owners of Contracts or Qualified Plans, this policy applies indirectly to Contract and Qualified Plan owners.
Potential Conflicts of Interest – Mixed and Shared Funding
The Fund is available for purchase only through Contracts offered by participating insurance companies, Qualified Plans and other qualified institutional investors authorized by the Distributor. Due to differences in tax treatment and other considerations, the interests of various Contract owners, and the interests of Qualified Plan participants, if any, may conflict. The Fund does not foresee any disadvantages to investors arising from these potential conflicts of interest at this time. Nevertheless, the Board of the Fund intends to monitor events to identify any material irreconcilable conflicts which may arise, and to determine what action, if any, should be taken in response to any conflicts. If such a conflict were to arise, one or more separate accounts might be required to withdraw its investments in the Fund or shares of another mutual fund may be substituted. This might force the Fund to sell securities at disadvantageous prices.
Order Processing
Orders to buy and sell shares of the Fund that are placed by your participating insurance company or Qualified Plan sponsor are processed on business days. Orders received in “good form” by the Transfer Agent or a financial intermediary, including your participating insurance company or Qualified Plan sponsor, before the end of a business day are priced at the NAV per share of the Fund's applicable share class on that day. Orders received after the end of a business day will receive the next business day’s NAV per share. An order is in “good form” if the Transfer Agent or your financial intermediary has all of the information and documentation it deems necessary to effect your order. The market value of the Fund’s investments may change between the time you submit your order and the time the Fund next calculates its NAV per share. The business day that applies to your order is also called the trade date.
There is no sales charge associated with the purchase of Fund shares, but there may be charges associated with your Contract or Qualified Plan. Any charges that apply to your Contract or Qualified Plan, and any charges that apply to separate accounts of participating insurance companies or Qualified Plans that may own shares directly, are described in your separate Contract prospectus or Qualified Plan disclosure documents.
26
Prospectus 2026
Variable Portfolio – Partners Core Equity Fund
About Fund Shares and Transactions (continued)
You may transfer all or part of your investment in the Fund to one or more of the other investment options available under your Contract or Qualified Plan. You may provide instructions to sell any amount allocated to the Fund. Proceeds will be mailed within seven days after your surrender or withdrawal request is received in good form by an authorized agent. The amount you receive may be more or less than the amount you invested.
Please refer to your Contract prospectus or Qualified Plan disclosure documents, as applicable, for more information about transfers as well as surrenders and withdrawals.
Information Sharing Agreements
As required by Rule 22c-2 under the 1940 Act, the Fund or certain of its service providers will enter into information sharing agreements with financial intermediaries, including participating life insurance companies and financial intermediaries that sponsor or offer retirement plans through which shares of the Fund are made available for purchase. Pursuant to Rule 22c-2, financial intermediaries are required, upon request, to: (i) provide shareholder account and transaction information; and (ii) execute instructions from the Fund to restrict or prohibit further purchases of Fund shares by shareholders who have been identified by the Fund as having engaged in transactions that violate the Fund's excessive trading policies and procedures.
Excessive Trading Practices Policy of Non-Money Market Funds
Right to Reject or Restrict Share Transaction Orders — The Fund is intended for investors with long-term investment purposes and is not intended as a vehicle for frequent trading activity (market timing) that is excessive. Investors should transact in Fund shares primarily for investment purposes. The Board has adopted excessive trading policies and procedures that are designed to deter excessive trading by investors (the Excessive Trading Policies and Procedures). The Fund discourages and does not accommodate excessive trading. Investments in a Fund by institutional investors in connection with redemptions in-kind are exempt from the Excessive Trading Policies and Procedures because they generally do not raise market timing or excessive trading concerns. Further discussion about the Fund’s use of redemptions in-kind is available under Satisfying Fund Redemption Requests.
The Fund reserves the right to reject, without any prior notice, any purchase or transfer order for any reason, and will not be liable for any loss resulting from rejected orders. For example, the Fund may in its sole discretion restrict or reject a purchase or transfer order even if the transaction is not subject to the specific limitation described below if the Fund or its agents determine that accepting the order could interfere with efficient management of the Fund's portfolio or is otherwise contrary to the Fund's best interests. The Excessive Trading Policies and Procedures apply equally to purchase or transfer transactions communicated directly to the Transfer Agent and to those received by financial intermediaries.
Specific Buying and Transferring Limitations — If the Fund detects that an investor has made two “material round trips” in any 28-day period, it will generally reject the investor's future purchase orders, including transfer buy orders, involving any Fund.
For these purposes, a “round trip” is a purchase or transfer into the Fund followed by a sale or transfer out of the Fund, or a sale or transfer out of the Fund followed by a purchase or transfer into the Fund. A “material” round trip is one that is deemed by the Fund to be material in terms of its amount or its potential detrimental impact on the Fund. Independent of this limit, the Fund may, in its sole discretion, reject future purchase orders by any person, group or account that appears to have engaged in any type of excessive trading activity.
These limits generally do not apply to automated transactions or transactions by registered investment companies in a “fund-of-funds” structure. These limits do not apply to payroll deduction contributions by retirement plan participants, transactions initiated by a retirement plan sponsor or certain other retirement plan transactions consisting of rollover transactions, loan repayments and disbursements, and required minimum distribution redemptions. They may be modified or rescinded for accounts held by certain retirement plans to conform to plan limits, for considerations relating to the Employee Retirement Income Security Act of 1974 or regulations of the Department of Labor, and for certain asset allocation or wrap programs. Accounts known to be under common ownership or control generally will be counted together, but accounts maintained or managed by a common
Prospectus 2026
27
Variable Portfolio – Partners Core Equity Fund
About Fund Shares and Transactions (continued)
intermediary generally will not be considered to be under common ownership or control. The Fund reserves the right to modify these restrictions at any time without prior notice to shareholders. In addition, the Fund may, in its sole discretion, reinstate trading privileges that have been revoked under the Fund's Excessive Trading Policies and Procedures.
Limitations on the Ability to Detect and Prevent Excessive Trading Practices — The Fund takes various steps designed to detect and prevent excessive trading, including daily review of available shareholder transaction information. However, the Fund receives buy, sell or transfer orders through financial intermediaries, and cannot always know of or reasonably detect excessive trading that may be facilitated by financial intermediaries or by the use of the omnibus account arrangements they offer. Omnibus account arrangements are common forms of holding shares of mutual funds, particularly among certain financial intermediaries such as broker-dealers, retirement plans and variable insurance products. These arrangements often permit financial intermediaries to aggregate their clients' transactions and accounts, and in these circumstances, the identities of the financial intermediary clients that beneficially own Fund shares are often not known to the Fund.
Some financial intermediaries apply their own restrictions or policies to their clients’ transactions and accounts, which may be more or less restrictive than those described here. This may impact the Fund's ability to curtail excessive trading, even where it is identified. For these and other reasons, it is possible that excessive trading may occur despite the Fund's efforts to detect and prevent it.
Although these restrictions and policies involve judgments that are inherently subjective and may involve some selectivity in their application, the Fund seeks to act in a manner that it believes is consistent with the best interests of Fund shareholders in making any such judgments.
Risks of Excessive Trading — Excessive trading creates certain risks to the Fund's long-term shareholders and may create the following adverse effects:
■
negative impact on the Fund's performance;
■
potential dilution of the value of the Fund's shares;
■
interference with the efficient management of the Fund's portfolio, such as the need to maintain undesirably large cash positions, the need to use its line of credit or the need to buy or sell securities it otherwise would not have bought or sold;
■
losses on the sale of investments resulting from the need to sell securities at less favorable prices; and
■
increased brokerage and administrative costs.
To the extent that the Fund invests significantly in foreign securities traded on markets that close before the Fund's valuation time, it may be particularly susceptible to dilution, which may be exacerbated as a result of excessive trading. Because events may occur after the close of foreign markets and before the Fund's valuation time that influence the value of foreign securities, investors may seek to trade Fund shares in an effort to benefit from their understanding of the value of foreign securities as of the Fund's valuation time. This is often referred to as price arbitrage. The Fund has adopted procedures designed to adjust closing market prices of foreign securities under certain circumstances to reflect what the Fund believes to be the fair value of those securities as of its valuation time. To the extent the adjustments do not work fully, investors engaging in price arbitrage may cause dilution in the value of the Fund's shares held by other shareholders.
Similarly, to the extent that the Fund invests significantly in thinly traded securities and other debt instruments that are rated below investment grade (commonly called “high-yield” or “junk” bonds), equity securities of small-capitalization companies, floating rate loans, or tax-exempt or other securities that may trade infrequently, because these securities are often traded infrequently, investors may seek to trade Fund shares in an effort to benefit from their understanding of the value of these securities as of the Fund's valuation time. This is also a type of price arbitrage. Any such frequent trading strategies may interfere with efficient management of the Fund's portfolio to a greater degree than would be the case for mutual funds that invest only, or significantly, in highly liquid securities, in part because the Fund may have difficulty selling these particular investments at advantageous times or prices to satisfy large and/or frequent sell orders. Any successful price arbitrage may also cause dilution in the value of Fund shares held by non-redeeming shareholders.
28
Prospectus 2026
Variable Portfolio – Partners Core Equity Fund
About Fund Shares and Transactions (continued)
Excessive Trading Practices Policy of Columbia Variable Portfolio - Government Money Market Fund
A money market fund is designed to offer investors a liquid cash option that they may buy and sell as often as they wish. Accordingly, the Board has not adopted policies and procedures designed to discourage excessive or short-term trading of Columbia Variable Portfolio - Government Money Market Fund shares. However, since frequent purchases and sales of Columbia Variable Portfolio - Government Money Market Fund shares could in certain instances harm shareholders in various ways, including reducing the returns to long-term shareholders by increasing costs (such as spreads paid to dealers who trade money market instruments with Columbia Variable Portfolio - Government Money Market Fund) and disrupting portfolio management strategies, Columbia Variable Portfolio - Government Money Market Fund reserves the right, but has no obligation, to reject any purchase or transfer transaction at any time. Columbia Variable Portfolio - Government Money Market Fund has no limits on purchase or transfer transactions. In addition, Columbia Variable Portfolio - Government Money Market Fund reserves the right to impose or modify restrictions on purchases, transfers or trading of Fund shares at any time.
Prospectus 2026
29
Variable Portfolio – Partners Core Equity Fund
Distributions and Taxes
Distributions to Shareholders
A mutual fund can make money two ways:
■
It can earn income on its investments. Examples of fund income are interest paid on money market instruments and bonds, and dividends paid on common stocks.
■
A mutual fund can also have capital gains if the value of its investments increases.
In the case of the Fund, because the Fund expects to be treated as a partnership for tax purposes, it is not required to and does not expect to make regular distributions to its shareholders (other than in redemption of Fund shares), but may do so in the sole discretion of the Fund’s Board of Trustees (or its delegates).
Taxes and Your Investment
Taxation of the Fund: The Fund is currently treated and expects to continue to be treated as a partnership that is not a “publicly traded partnership” for U.S. federal income tax purposes. If the Fund were not to qualify for such treatment, the Fund could be subject to U.S. federal income tax at the Fund level, which would reduce the value of an investment in the Fund.
As a partnership that is not a “publicly traded partnership,” the Fund is generally not itself subject to U.S. federal income tax. Instead, each shareholder will be required to take into account for U.S. federal income tax purposes its allocable share of the Fund’s income, gains, losses, deductions, credits, and other tax items, without regard to whether such shareholder has received or will receive corresponding distributions from the Fund. In addition, unlike mutual funds that intend to be treated as regulated investment companies for U.S. federal income tax purposes, the Fund is not required to meet any specific qualifying income or distribution requirements, although to the extent regulated investment companies invest in the Fund, such requirements will be taken into account by the Fund.
Certain Fund income may be subject to tax in other countries, including withholding or other taxes on dividends, interest or capital gains. Tax conventions between certain countries and the United States may reduce or eliminate such taxes. In certain countries the Fund may incur a higher rate of tax on dividends than it would have incurred if the Fund had been treated as a regulated investment company.
As a partnership that is not a “publicly traded partnership,” the Fund is generally not itself subject to U.S. federal income tax. Instead, each shareholder will be required to take into account for U.S. federal income tax purposes its allocable share of the Fund’s income, gains, losses, deductions, credits, and other tax items, without regard to whether such shareholder has received or will receive corresponding distributions from the Fund. In addition, unlike mutual funds that intend to be treated as regulated investment companies for U.S. federal income tax purposes, the Fund is not required to meet any specific qualifying income or distribution requirements, although to the extent regulated investment companies invest in the Fund, such requirements will be taken into account by the Fund.
Certain Fund income may be subject to tax in other countries, including withholding or other taxes on dividends, interest or capital gains. Tax conventions between certain countries and the United States may reduce or eliminate such taxes. In certain countries the Fund may incur a higher rate of tax on dividends than it would have incurred if the Fund had been treated as a regulated investment company.
Taxation of Fund Shares: Shares of the Fund are only offered to separate accounts of participating insurance companies, Qualified Plans, and certain other eligible persons or plans permitted to hold shares of the Fund pursuant to the applicable U.S. Treasury Regulations without impairing the ability of participating insurance companies to satisfy the diversification requirements of Section 817(h) of the Internal Revenue Code of 1986, as amended. Each participating insurance company, including each participating insurance company that is an affiliate of the Investment Manager, includes in its taxable income any net investment income derived from the investment of assets held in its separate accounts because the insurance company is considered the owner of these assets under federal income tax law. The insurance company may claim certain tax benefits associated with this investment income, which benefits may be greater with respect to the Fund than if the Fund were treated as a regulated investment company for U.S. federal income tax purposes. These benefits, which may include foreign tax credits (which can reduce the insurance company’s U.S. taxes on foreign source income) and the corporate dividends-received deduction (which is a tax deduction for the insurance company attributable to certain dividends received by the Fund), are not passed on to Contract owners since the affiliated insurance company is the owner of the assets under federal tax law and is taxed on the investment income generated by the assets.
Taxation of Variable Annuity Contracts and Variable Life Insurance Policies: Your Contract may qualify for favorable tax treatment. Please refer to your Contract prospectus for more information about the tax implications of your investment in the Contract. As long as your Contract continues to qualify for such favorable tax treatment, you will not be taxed currently on your investment in the Fund through such Contract, even if the Fund makes allocations or distributions to the separate account and/or you change your investment options under the Contract. In order to qualify for such treatment, among other things, the separate accounts of participating insurance companies, which maintain and invest net proceeds from Contracts, must be “adequately diversified.” The Fund intends to operate in such a manner so that a separate account investing only in Fund shares on behalf of a holder of a Contract will be “adequately diversified.” If the Fund does not meet such requirements because its investments are not adequately
30
Prospectus 2026
Variable Portfolio – Partners Core Equity Fund
Distributions and Taxes (continued)
diversified, your Contract could lose its favorable tax treatment, and income and gain allocable to your Contract could be taxable currently to you. This could also occur if Contract holders are found to have an impermissible level of control over the investments underlying their Contracts or if the Fund does not qualify for treatment as a partnership that is not a “publicly traded partnership.” You should consult with the participating insurance company that issued your Contract, plan sponsor, or other eligible investor through which your investment in the Fund is made regarding the U.S. federal income taxation of your investment.
FUNDamentals
Taxes
The information provided above is only a summary of how U.S. federal income taxes may affect your indirect investment in the Fund. It is not intended as a substitute for careful tax planning. Your investment in the Fund may have other tax implications. It does not apply to certain types of investors who may be subject to special rules, including foreign or tax-exempt investors or those holding Fund shares through a tax-advantaged account other than a Contract, such as a 401(k) plan or IRA. Please see the SAI for more detailed tax information. You should consult with your own tax advisor about the particular tax consequences to you of an investment in the Fund, including the effect of any foreign, state and local taxes, and the effect of possible changes in applicable tax laws.
Prospectus 2026
31
Variable Portfolio – Partners Core Equity Fund
Financial Highlights
The financial highlights table is intended to help you understand the Fund’s financial performance for the past five fiscal years or, if shorter, the Fund’s period of operations. Certain information reflects financial results for a single Fund share. Per share net investment income (loss) amounts are calculated based on average shares outstanding during the period. The total return in the table represents the rate that an investor would have earned (or lost) on an investment in the Fund assuming all dividends and distributions had been reinvested. Total return does not reflect any fees and expenses imposed under your Contract and/or Qualified Plan, as applicable; such fees and expenses would reduce the total return for all periods shown. Total return and portfolio turnover are not annualized for periods of less than one year. The ratios of expenses and net investment income are annualized for periods of less than one year. The portfolio turnover rate is calculated without regard to purchase and sales transactions of short-term instruments and certain derivatives, if any. If such transactions were included, the Fund’s portfolio turnover rate may be higher. A zero balance may reflect an amount rounding to less than $0.01 or 0.01%. This information has been audited by PricewaterhouseCoopers LLP, an independent registered public accounting firm, whose report, along with the Fund’s financial statements, is included in the Fund’s Form N-CSR, which is available upon request.
Prospectus 2026
33
Variable Portfolio – Partners Core Equity Fund
Financial Highlights (continued)
| |
Net asset value, beginning of period |
Net investment income |
Net realized and unrealized gain (loss) |
Total from investment operations |
| Class 1 | ||||
| Year Ended 12/31/2025 |
$45.98 |
0.21 |
5.96 |
6.17 |
| Year Ended 12/31/2024 |
$37.25 |
0.22 |
8.51 |
8.73 |
| Year Ended 12/31/2023 |
$29.87 |
0.27 |
7.11 |
7.38 |
| Year Ended 12/31/2022 |
$36.14 |
0.22 |
(6.49) |
(6.27) |
| Year Ended 12/31/2021 |
$27.91 |
0.16 |
8.07 |
8.23 |
| Class 2 | ||||
| Year Ended 12/31/2025 |
$44.39 |
0.09 |
5.74 |
5.83 |
| Year Ended 12/31/2024 |
$36.06 |
0.11 |
8.22 |
8.33 |
| Year Ended 12/31/2023 |
$28.98 |
0.18 |
6.90 |
7.08 |
| Year Ended 12/31/2022 |
$35.15 |
0.14 |
(6.31) |
(6.17) |
| Year Ended 12/31/2021 |
$27.21 |
0.08 |
7.86 |
7.94 |
| Class 3 | ||||
| Year Ended 12/31/2025 |
$45.15 |
0.15 |
5.84 |
5.99 |
| Year Ended 12/31/2024 |
$36.63 |
0.17 |
8.35 |
8.52 |
| Year Ended 12/31/2023 |
$29.41 |
0.22 |
7.00 |
7.22 |
| Year Ended 12/31/2022 |
$35.62 |
0.18 |
(6.39) |
(6.21) |
| Year Ended 12/31/2021 |
$27.54 |
0.12 |
7.96 |
8.08 |
| Notes to Financial Highlights | |
| (a) |
In addition to the fees and expenses that the Fund bears directly, the Fund indirectly bears a pro rata share of the fees and expenses of any other funds in which it invests. Such indirect expenses are not included in the Fund's reported expense ratios. |
| (b) |
Total net expenses include the impact of certain fee waivers/expense reimbursements made by the Investment Manager and certain of its affiliates, if applicable. |
| (c) |
Ratios include interfund lending expense which is less than 0.01%. |
| (d) |
Ratios include interest on collateral expense which is less than 0.01%. |
34
Prospectus 2026
Variable Portfolio – Partners Core Equity Fund
Financial Highlights (continued)
| |
Net asset value, end of period |
Total return |
Total gross expense ratio to average net assets(a) |
Total net expense ratio to average net assets(a),(b) |
Net investment income ratio to average net assets |
Portfolio turnover |
Net assets, end of period (000's) |
| Class 1 | |||||||
| Year Ended 12/31/2025 |
$52.15 |
13.42% |
0.70%(c) |
0.68%(c) |
0.44% |
52% |
$2,143,207 |
| Year Ended 12/31/2024 |
$45.98 |
23.44% |
0.68%(c) |
0.68%(c) |
0.52% |
50% |
$2,244,714 |
| Year Ended 12/31/2023 |
$37.25 |
24.71% |
0.69%(c) |
0.69%(c) |
0.81% |
56% |
$2,760,520 |
| Year Ended 12/31/2022 |
$29.87 |
(17.35%) |
0.68%(c),(d) |
0.68%(c),(d) |
0.72% |
75% |
$2,550,753 |
| Year Ended 12/31/2021 |
$36.14 |
29.49% |
0.68%(d) |
0.68%(d) |
0.50% |
99% |
$3,254,887 |
| Class 2 | |||||||
| Year Ended 12/31/2025 |
$50.22 |
13.14% |
0.95%(c) |
0.93%(c) |
0.18% |
52% |
$16,382 |
| Year Ended 12/31/2024 |
$44.39 |
23.10% |
0.93%(c) |
0.93%(c) |
0.27% |
50% |
$14,847 |
| Year Ended 12/31/2023 |
$36.06 |
24.43% |
0.94%(c) |
0.94%(c) |
0.56% |
56% |
$12,749 |
| Year Ended 12/31/2022 |
$28.98 |
(17.55%) |
0.93%(c),(d) |
0.93%(c),(d) |
0.47% |
75% |
$11,042 |
| Year Ended 12/31/2021 |
$35.15 |
29.18% |
0.93%(d) |
0.93%(d) |
0.26% |
99% |
$13,396 |
| Class 3 | |||||||
| Year Ended 12/31/2025 |
$51.14 |
13.26% |
0.83%(c) |
0.81%(c) |
0.31% |
52% |
$27,823 |
| Year Ended 12/31/2024 |
$45.15 |
23.26% |
0.81%(c) |
0.81%(c) |
0.39% |
50% |
$28,682 |
| Year Ended 12/31/2023 |
$36.63 |
24.55% |
0.81%(c) |
0.81%(c) |
0.69% |
56% |
$27,418 |
| Year Ended 12/31/2022 |
$29.41 |
(17.43%) |
0.81%(c),(d) |
0.81%(c),(d) |
0.59% |
75% |
$25,516 |
| Year Ended 12/31/2021 |
$35.62 |
29.34% |
0.80%(d) |
0.80%(d) |
0.38% |
99% |
$34,599 |
Prospectus 2026
35
Variable Portfolio – Partners Core Equity Fund

For More Information
The Fund is generally available only to owners of Contracts issued by participating insurance companies and participants in Qualified Plans. Please refer to your Contract prospectus or Qualified Plan disclosure documents for information about how to buy, sell and transfer shares of the Fund.
Additional Information About the Fund
Additional information about the Fund’s investments is available in the Fund’s annual and semiannual reports to shareholders and in Form N-CSR. In the Fund’s annual report, you will find a discussion of the market conditions and investment strategies that significantly affected the Fund’s performance during its last fiscal year. In the Fund’s Form N-CSR, you will find the Fund’s annual and semiannual financial statements. The SAI also provides additional information about the Fund and its policies. The SAI, which has been filed with the SEC, is legally part of this prospectus (incorporated by reference). To obtain these documents free of charge, to request other information about the Fund and to make shareholder inquiries, please contact the Fund as follows:
By Mail: Columbia Management Investment Services Corp.
P.O. Box 219104
Kansas City, MO 64121-9104
P.O. Box 219104
Kansas City, MO 64121-9104
By Telephone: 800.345.6611
Online: columbiathreadneedleus.com
Reports and other information about the Fund are also available in the EDGAR Database on the SEC’s website at http://www.sec.gov. You can receive copies of this information, for a duplication fee, by electronic request at the following e-mail address: publicinfo@sec.gov.
The investment company registration number of Columbia Funds Variable Series Trust II, of which the Fund is a series, is 811-22127.
Columbia Threadneedle Investments (Columbia Threadneedle) is the global brand name of the Columbia and Threadneedle group of companies.
The Fund is distributed by Columbia Management Investment Distributors, Inc., 290 Congress Street, Boston, MA 02210.
The Fund is distributed by Columbia Management Investment Distributors, Inc., 290 Congress Street, Boston, MA 02210.
© 2026 Columbia Threadneedle. All rights reserved.
PRO7053_12_E01_(05/26)