Pay vs Performance Disclosure - USD ($)
Dec. 31, 2025
Dec. 31, 2024
Dec. 31, 2023
Dec. 31, 2022
Dec. 31, 2021
P
AY
VERSUS
PERFORMANCE
As required by Section 953(a) of the Dodd-Frank Act and Item 402(v) of Regulation
S-K,
we are providing the following information regarding the relationship between executive “compensation actually paid” and certain financial performance of the Company. The Compensation Committee does not utilize compensation actually paid as the basis for making compensation decisions. For further information concerning the Company’s pay for performance philosophy and how the Company aligns executive compensation with the Company’s performance, see “Compensation Discussion and Analysis.”| |
|
|
|
|
|
|
|
|
Value of Initial Fixed $100 Investment Based On: |
|
| |||||||||||||||||||||||||||||||||||||||||||||||||
Year |
Summary Compensation Table Total for PEO (Timothy Cofer) (1) |
Compensation Actually Paid to PEO (Timothy Cofer) (2) |
Summary Compensation Table Total for PEO (Robert Gamgort) (1) |
Compensation Actually Paid to PEO (Robert Gamgort) (2) |
Summary Compensation Table Total for PEO (Ozan Dokmecioglu) (1) |
Compensation Actually Paid to PEO (Ozan Dokmecioglu) (2) |
Average Summary Compensation Table Total for Non-PEO NEOs (3) |
Average Compensation Actually Paid to Non-PEO NEOs (4) |
Total Shareholder Return (5) |
Peer Group Total Shareholder Return (6) |
Net Income (7) |
Adjusted Operating Income (8) | ||||||||||||||||||||||||||||||||||||||||||||||||
2025 |
$ |
8,217,032 |
$ |
5,670,304 |
$ |
— |
$ |
— |
$ |
— |
$ |
— |
$ |
5,090,975 |
$ |
4,213,542 |
$ |
99 |
$ |
105 |
$ |
2,079 |
$ |
4,156 |
||||||||||||||||||||||||||||||||||||
2024 |
$ |
7,013,457 |
7,045,416 |
6,734,359 |
(1,617,826 |
) |
— |
— |
3,452,285 |
3,533,579 |
110 |
102 |
1,441 |
3,974 |
||||||||||||||||||||||||||||||||||||||||||||||
2023 |
— |
— |
7,620,095 |
8,755,242 |
— |
— |
9,487,917 |
9,599,096 |
111 |
111 |
2,181 |
3,657 |
||||||||||||||||||||||||||||||||||||||||||||||||
2022 |
— |
— |
12,486,492 |
12,970,246 |
16,663,492 |
(22,473,209 |
) |
5,088,351 |
2,821,000 |
116 |
115 |
1,436 |
3,538 |
|||||||||||||||||||||||||||||||||||||||||||||||
2021 |
— |
— |
7,772,521 |
17,501,205 |
— |
— |
6,759,279 |
7,522,595 |
117 |
116 |
2,146 |
3,421 |
||||||||||||||||||||||||||||||||||||||||||||||||
| (1) | The dollar amounts reported in the Summary Compensation Table Total for PEO (Principal Executive Officer) columns are the amounts reported for Timothy Cofer (the Company’s Chief Executive Officer for a portion of 2024 and 2025), Robert Gamgort (the Company’s Chief Executive Officer for 2021, portions of 2022, 2023 and a portion of 2024) and Ozan Dokmecioglu (the Company’s Chief Executive Officer for a portion of 2022) for each of the corresponding years in the Total column in our Summary Compensation Table. See “Executive Compensation Tables – Summary Compensation Table”. |
| (2) | The dollar amounts reported in the Compensation Actually Paid to PEO columns represent the amount of “compensation actually paid” to Messrs. Cofer, Gamgort and Dokmecioglu, as applicable, as computed in accordance with Item 402(v) of Regulation S-K and do not reflect the total compensation actually realized or received by such PEOs. In accordance with these rules, these amounts reflect the Total compensation as set forth in the Summary Compensation Table for each year, adjusted as shown below for 2025. Refer to our Proxy Statement for the 2025, 2024 and 2023 Annual Meetings for information on the calculations applicable for prior years. Equity values are calculated consistent with FASB ASC Topic 718, and the valuation assumptions used to calculate fair values did not materially differ from those disclosed at the time of grant. |
Compensation Actually Paid to Timothy Cofer |
2025 |
|||
Summary Compensation Table Total |
$ |
8,217,032 |
||
Less, value of Stock Awards reported in Summary Compensation Table |
(5,125,514 |
) | ||
Plus, year-end fair value of outstanding and unvested equity awards granted in the year |
4,636,506 |
|||
Plus, fair value as of vesting date of equity awards granted and vested in the year |
— |
|||
Plus (less), year-over-year change in fair value from prior year end of outstanding and unvested equity awards granted in prior years |
(2,196,211 |
) | ||
Plus (less), change in fair value from prior year end to vesting date of equity awards granted in prior years that vested in the year |
138,491 |
|||
Less, prior year-end fair value for any equity awards forfeited in the year |
— |
|||
Compensation Actually Paid to Timothy Cofer |
$ |
5,670,304 |
||
| (3) | The dollar amounts reported in the Average Summary Compensation Table Total for Non-PEO NEOs column represent the average of the amounts reported for the Company’s NEOs as a group (excluding Mr. Cofer for 2025 and 2024, Mr. Gamgort for 2021 through 2024 and Mr. Dokmecioglu for 2022) in the Total column of the Summary Compensation Table in each applicable year. The NEOs included for these purposes in each applicable year are as follows: (i) for 2025, Anthony DiSilvestro, Eric Gorli, Roger Johnson, Anthony Shoemaker, Robert Gamgort and Sudhanshu Priyadarshi, (ii) for 2024, Sudhanshu Priyadarshi, Andrew Archambault, Roger Johnson and Justin Whitmore, (iii) for 2023, Sudhanshu Priyadarshi, Timothy Cofer, Karin Rotem-Wildeman and Andrew Archambault; (iv) for 2022, Sudhanshu Priyadarshi, Mauricio Leyva, Andrew Archambault, Roger Johnson, George Lagoudakis and Tony Milikin; and (v) for 2021, Ozan Dokmecioglu, Mauricio Leyva, Tony Milikin, Fernando Cortes and Justin Whitmore. |
| (4) | The dollar amounts reported in the Average Compensation Actually Paid to Non-PEO NEOs column represent the average amount of “compensation actually paid” to the NEOs as a group (excluding Mr. Cofer for 2025 and 2024, Mr. Gamgort for 2021 through 2024 and Mr. Dokmecioglu for 2022), as computed in accordance with Item 402(v) of Regulation S-K. In accordance with these rules, these amounts reflect Total Compensation as set forth in the Summary Compensation Table for each year, adjusted as shown below for 2025. Refer to our Proxy Statement for the 2025, 2024 and 2023 Annual Meetings for information on the calculations applicable for prior years. Equity values are calculated in accordance with FASB ASC Topic 718, and the valuation assumptions used to calculate fair values did not materially differ from those disclosed at the time of the grant. |
Average Compensation Actually Paid to Non-PEO NEOs |
2025 |
|||
Average Summary Compensation Table Total |
$ |
5,090,975 |
||
Less, average value of Stock Awards reported in Summary Compensation Table |
(4,041,766 |
) | ||
Plus, average year-end fair value of outstanding and unvested equity awards granted in the year |
3,235,514 |
|||
Plus, average fair value as of vesting date of equity awards granted and vested in the year |
— |
|||
Plus (less), average year-over-year change in fair value from prior year end of outstanding and unvested equity awards granted in prior years |
(509,698 |
) | ||
Plus (less), average change in fair value from prior year end to vesting date of equity awards granted in prior years that vested in the year |
41,377 |
|||
Less, prior year-end fair value for any equity awards forfeited in the year |
— |
|||
Plus, average excess fair value of modified awards as of the date of modification |
397,140 |
|||
Average Compensation Actually Paid to Non-PEO NEOs |
$ |
4,213,542 |
||
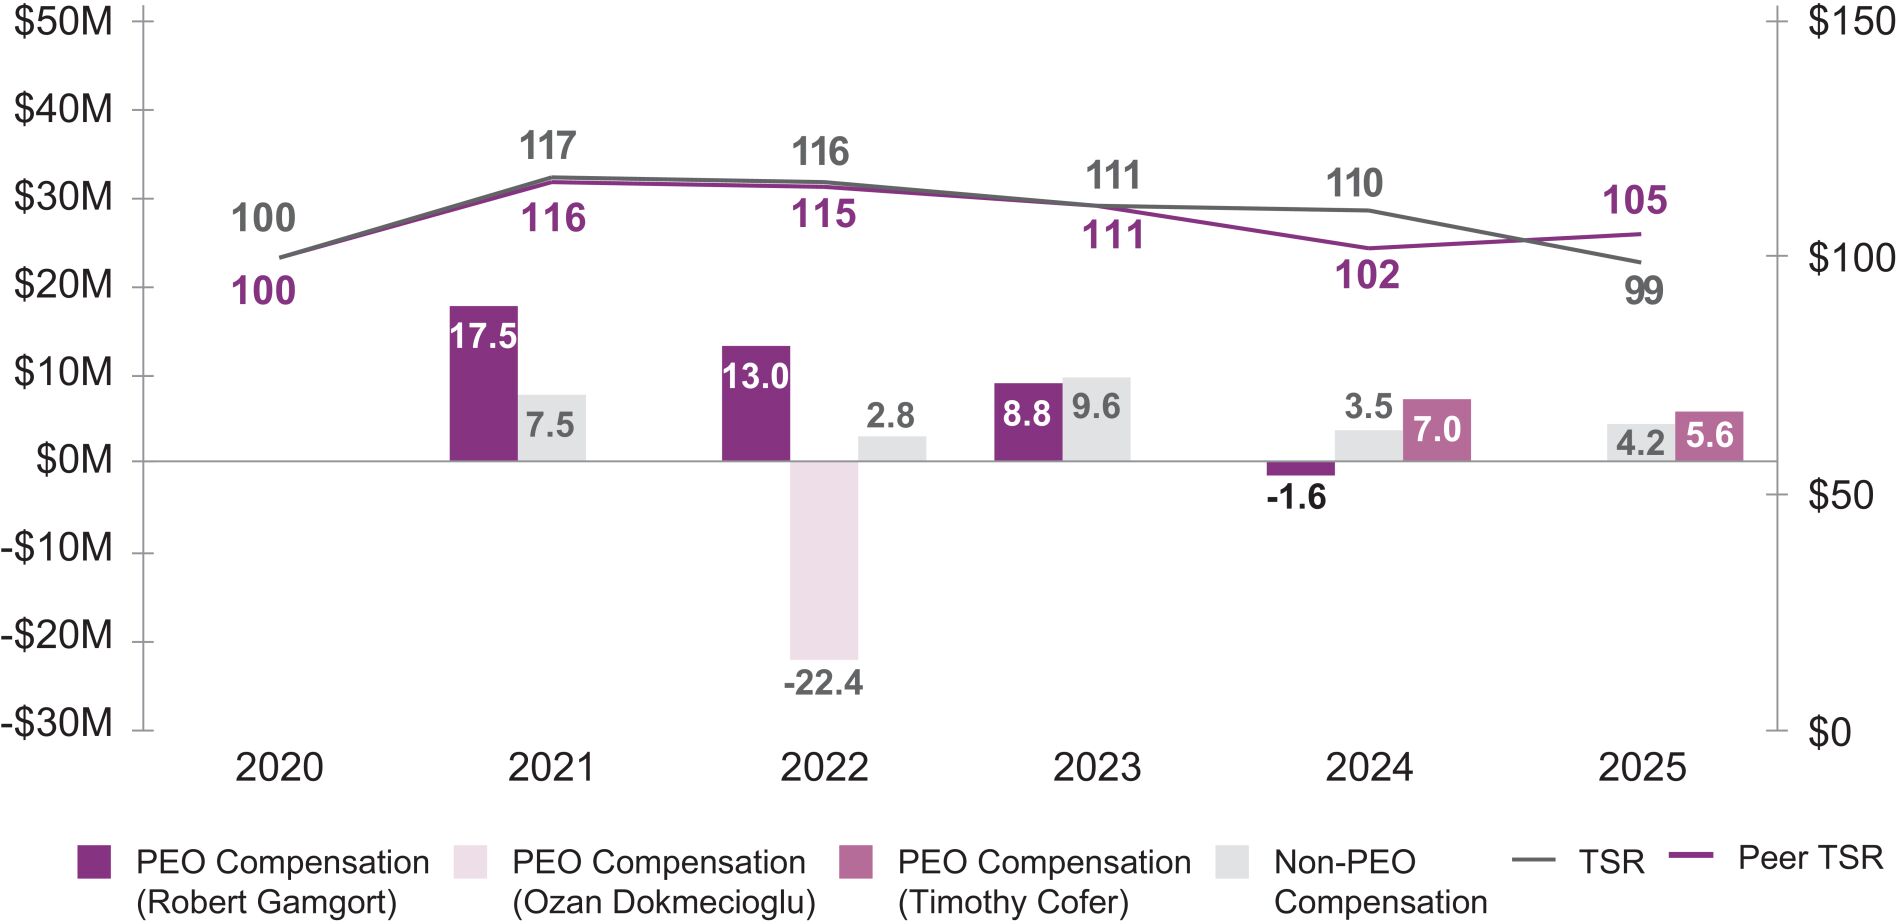
| (5) | Total Shareholder Return (TSR) assumes an initial $100 investment in KDP stock beginning on December 31, 2020. TSR is cumulative, with the value determined at the end of each applicable fiscal year shown, calculated by dividing (a) the sum of (i) the cumulative amount of dividends for the measurement period, assuming dividend reinvestment, and (ii) the difference between the Company’s share price at the end of each fiscal year shown and the beginning of the measurement period by (b) the Company’s share price at the beginning of the measurement period. The beginning of the measurement period for each year in the table is December 31, 2020. |
| (6) | Peer Group Total Shareholder Return represents the weighted peer group TSR, which is weighted according to the respective companies’ stock market capitalization at the beginning of each period for which a return is indicated. For 2025, the RemCo selected a new Compensation Peer Group to better assess the Company’s compensation practices. FW Cook, the Company’s compensation consultant, advised, and the Committee made its determination based on multiple screening criteria, including company size, business relevance, robustness of compensation disclosure and scope of operations.The peer group used prior to 2025 (the “Prior Compensation Peer Group”) included: Anheuser-Busch InBev SA/NV, Campbell Soup Company, Chocoladefabriken Lindt & Sprungli AG, The Coca-Cola Company, Danone, Diageo plc, The Hershey Company, The Kraft Heinz Company, McCormick & Company, Incorporated, Mondelēz International, Inc., Nestle S.A., PepsiCo, Inc., The Procter & Gamble Company, Reckitt Benckiser Group plc and Unilever PLC. The current Compensation Peer Group is discussed in “Compensation Discussion and Analysis” above and includes six new peers (Brown-Forman Corporation, Constellation Brands, Inc., The J.M. Smucker Company, Molson Coors Beverage Company, Monster Beverage Corporation and Starbucks Corporation) and removes four peers (Chocoladefabriken Lindt & Spruengli AG, The Procter & Gamble Company, Reckitt Benckiser Group plc and Unilever PLC) relative to the Prior Compensation Peer Group. Kellanova remained in the Compensation Peer Group in 2025 but was acquired by Mars, Incorporated in December 2025 and is no longer publicly traded; therefore it has been removed from the current Compensation Peer Group. The table below shows Peer Group Total Shareholder Return for the Prior Compensation Peer Group. |
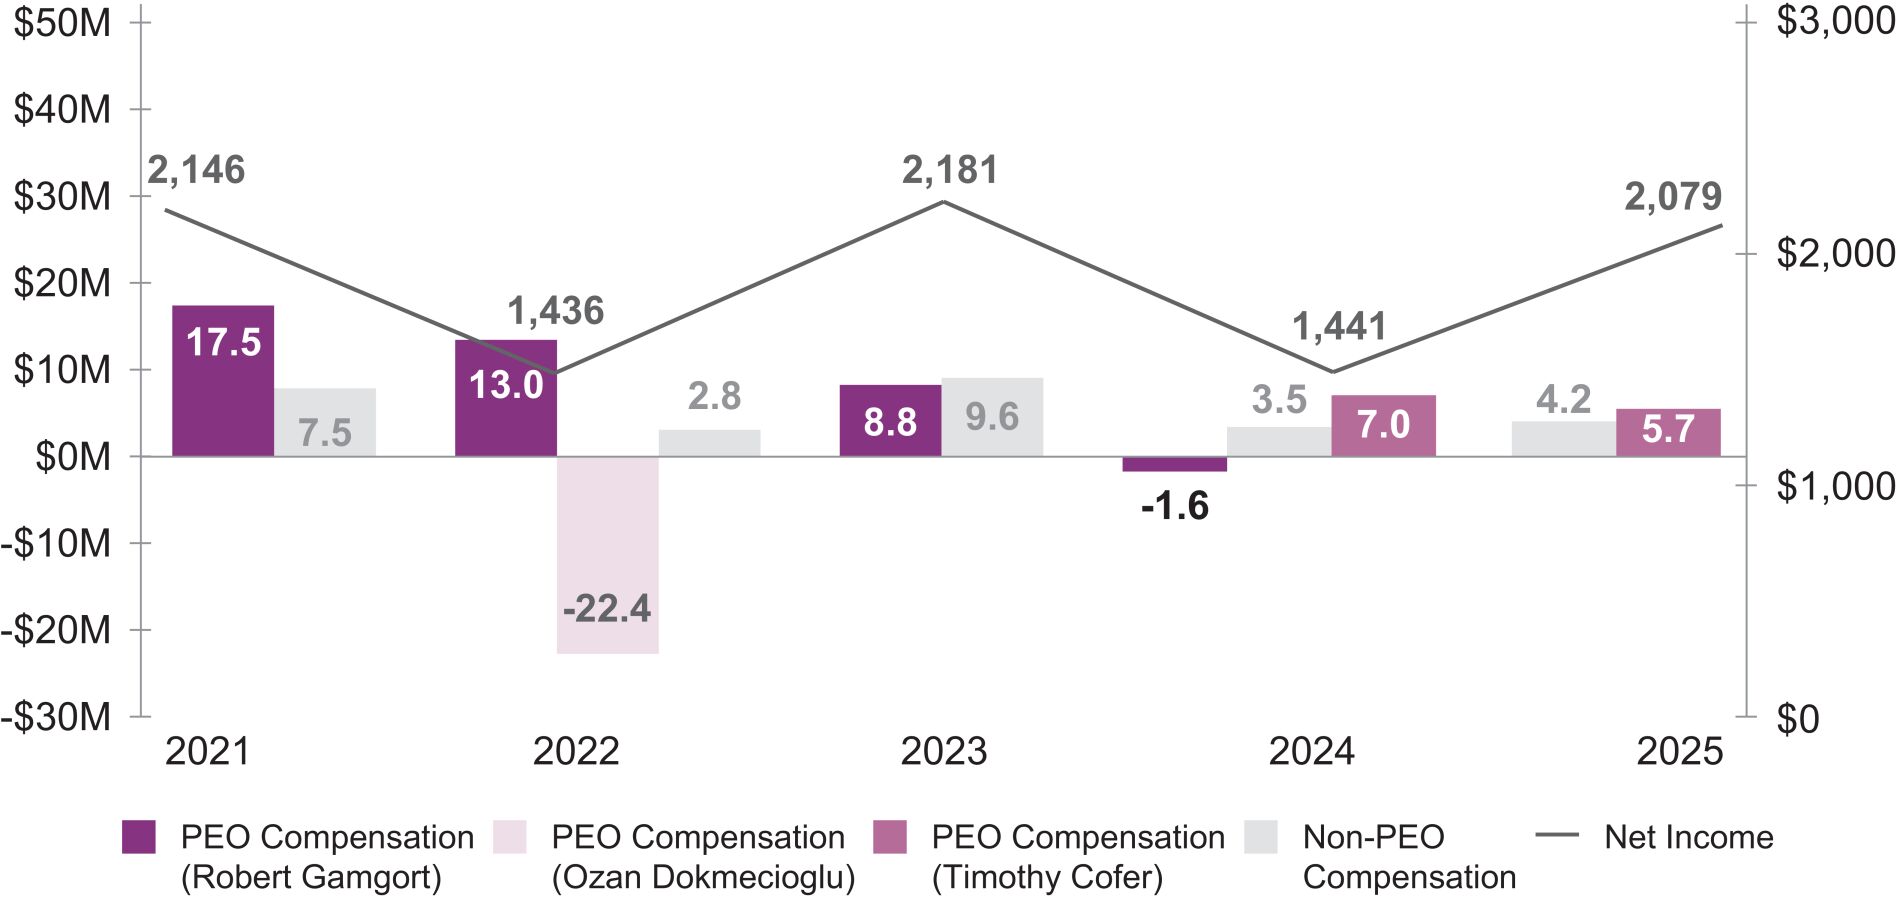
| (7) | The dollar amounts reported represent the amount of net income, in millions, reflected in the Company’s audited financial statements for the applicable year. |
Year |
Value of Initial Fixed $100 Investment Based On Prior Compensation Peer Group Total Shareholder Return | ||||
2025 |
$ |
111 |
|||
2024 |
110 |
||||
2023 |
111 |
||||
2022 |
115 |
||||
2021 |
115 |
||||
| (8) | The dollar amounts reported represent the amount of Adjusted operating income, in millions. Please refer to Appendix A to this Proxy Statement for a description and reconciliation of this non-GAAP compensation performance measure relative to the reported GAAP financial measure. |
Non-PEO
NEOs column represent the average of the amounts reported for the Company’s NEOs as a group (excluding Mr. Cofer for 2025 and 2024, Mr. Gamgort for 2021 through 2024 and Mr. Dokmecioglu for 2022) in the Total column of the Summary Compensation Table in each applicable year. The NEOs included for these purposes in each applicable year are as follows: (i) for 2025, Anthony DiSilvestro, Eric Gorli, Roger Johnson, Anthony Shoemaker, Robert Gamgort and Sudhanshu Priyadarshi, (ii) for 2024, Sudhanshu Priyadarshi, Andrew Archambault, Roger Johnson and Justin Whitmore, (iii) for 2023, Sudhanshu Priyadarshi, Timothy Cofer, Karin Rotem-Wildeman and Andrew Archambault; (iv) for 2022, Sudhanshu Priyadarshi, Mauricio Leyva, Andrew Archambault, Roger Johnson, George Lagoudakis and Tony Milikin; and (v) for 2021, Ozan Dokmecioglu, Mauricio Leyva, Tony Milikin, Fernando Cortes and Justin Whitmore.
| (2) | The dollar amounts reported in the Compensation Actually Paid to PEO columns represent the amount of “compensation actually paid” to Messrs. Cofer, Gamgort and Dokmecioglu, as applicable, as computed in accordance with Item 402(v) of Regulation S-K and do not reflect the total compensation actually realized or received by such PEOs. In accordance with these rules, these amounts reflect the Total compensation as set forth in the Summary Compensation Table for each year, adjusted as shown below for 2025. Refer to our Proxy Statement for the 2025, 2024 and 2023 Annual Meetings for information on the calculations applicable for prior years. Equity values are calculated consistent with FASB ASC Topic 718, and the valuation assumptions used to calculate fair values did not materially differ from those disclosed at the time of grant. |
Compensation Actually Paid to Timothy Cofer |
2025 |
|||
Summary Compensation Table Total |
$ |
8,217,032 |
||
Less, value of Stock Awards reported in Summary Compensation Table |
(5,125,514 |
) | ||
Plus, year-end fair value of outstanding and unvested equity awards granted in the year |
4,636,506 |
|||
Plus, fair value as of vesting date of equity awards granted and vested in the year |
— |
|||
Plus (less), year-over-year change in fair value from prior year end of outstanding and unvested equity awards granted in prior years |
(2,196,211 |
) | ||
Plus (less), change in fair value from prior year end to vesting date of equity awards granted in prior years that vested in the year |
138,491 |
|||
Less, prior year-end fair value for any equity awards forfeited in the year |
— |
|||
Compensation Actually Paid to Timothy Cofer |
$ |
5,670,304 |
||
| (4) | The dollar amounts reported in the Average Compensation Actually Paid to Non-PEO NEOs column represent the average amount of “compensation actually paid” to the NEOs as a group (excluding Mr. Cofer for 2025 and 2024, Mr. Gamgort for 2021 through 2024 and Mr. Dokmecioglu for 2022), as computed in accordance with Item 402(v) of Regulation S-K. In accordance with these rules, these amounts reflect Total Compensation as set forth in the Summary Compensation Table for each year, adjusted as shown below for 2025. Refer to our Proxy Statement for the 2025, 2024 and 2023 Annual Meetings for information on the calculations applicable for prior years. Equity values are calculated in accordance with FASB ASC Topic 718, and the valuation assumptions used to calculate fair values did not materially differ from those disclosed at the time of the grant. |
Average Compensation Actually Paid to Non-PEO NEOs |
2025 |
|||
Average Summary Compensation Table Total |
$ |
5,090,975 |
||
Less, average value of Stock Awards reported in Summary Compensation Table |
(4,041,766 |
) | ||
Plus, average year-end fair value of outstanding and unvested equity awards granted in the year |
3,235,514 |
|||
Plus, average fair value as of vesting date of equity awards granted and vested in the year |
— |
|||
Plus (less), average year-over-year change in fair value from prior year end of outstanding and unvested equity awards granted in prior years |
(509,698 |
) | ||
Plus (less), average change in fair value from prior year end to vesting date of equity awards granted in prior years that vested in the year |
41,377 |
|||
Less, prior year-end fair value for any equity awards forfeited in the year |
— |
|||
Plus, average excess fair value of modified awards as of the date of modification |
397,140 |
|||
Average Compensation Actually Paid to Non-PEO NEOs |
$ |
4,213,542 |
||
Compensation Actually Paid, Cumulative TSR and Peer Group TSR
Compensation Actually Paid and Net Income
Compensation Actually Paid and Adjusted Operating Income

Compensation Actually Paid, Cumulative TSR and Peer Group TSR
Financial Performance Measures
As described in greater detail under “Compensation Discussion and Analysis,” our executive compensation program reflects a variable philosophy that aligns executive and stockholder interests. For the most recently completed fiscal year, the financial performance measures that most closely link Company performance to compensation actually paid to the Company’s NEOs include:
pay-for-performance
§ |
Adjusted diluted EPS growth |
§ |
Adjusted operating income (Company-selected measure) |
§ |
Adjusted operating income growth |
§ |
Free cash flow conversion |
§ |
Net sales growth |
non-GAAP
compensation performance measure relative to the reported GAAP financial measure.