Pay vs Performance Disclosure - USD ($)
Dec. 31, 2025
Dec. 31, 2024
Dec. 31, 2023
Dec. 31, 2022
Dec. 31, 2021
Pay Versus Performance
Below we provide disclosure regarding executive compensation for our CEO and non-CEO NEOs and our performance for the fiscal years listed below in accordance with the applicable SEC rules. For the most recently completed fiscal year and the fiscal years represented in the table, we did not use any “financial performance measures” as defined in the applicable SEC rules to link compensation paid to our NEOs to our performance. Accordingly, we have omitted the “company selected measure” and the tabular list of financial performance measures described in the applicable SEC rules.
The amounts set forth below under the headings “Compensation Actually Paid to CEO” and “Average Compensation Actually Paid to Non-CEO NEOs” have been calculated in a manner consistent with the applicable SEC rules. Use of the term “compensation actually paid” (CAP) is required by the SEC’s rules, and, as a result of the calculation methodology required by the SEC, such amounts differ from compensation actually received by the individuals for the fiscal years listed below.
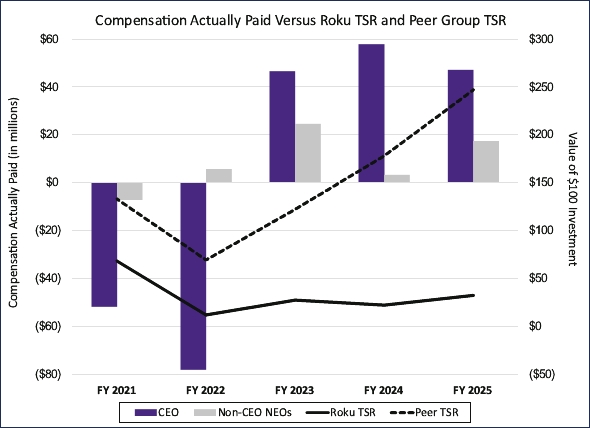
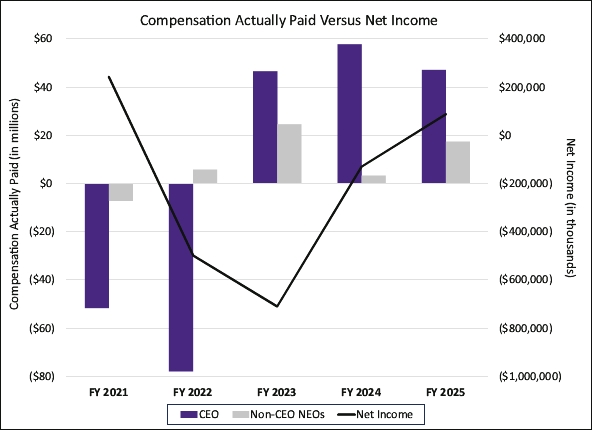
Fiscal Year(1) | Summary Compensation Table Total for CEO ($) | Compensation Actually Paid to CEO ($)(2) | Average Summary Compensation Table Total for Non-CEO NEOs ($) | Average Compensation Actually Paid to Non-CEO NEOs ($)(3) | Value of Initial Fixed $100 Investment Based On: | Net Income (Loss) ($) (in thousands) | |||||||||||||||||
TSR ($) | Peer Group TSR ($)(4) | ||||||||||||||||||||||
2025 | 26,565,120 | 47,142,331 | 10,584,880 | 17,352,593 | 32.68 | 247.03 | 88,361 | ||||||||||||||||
2024 | 27,697,846 | 57,801,785 | 8,231,739 | 3,300,463 | 22.39 | 178.23 | (129,386) | ||||||||||||||||
2023 | 20,218,958 | 46,504,701 | 9,439,261 | 24,541,372 | 27.61 | 122.43 | (709,561)(5) | ||||||||||||||||
2022 | 20,991,685 | (77,933,918) | 20,448,128 | 5,762,267 | 12.26 | 69.69 | (498,005) | ||||||||||||||||
2021 | 18,133,692 | (51,681,097) | 5,005,742 | (7,130,167) | 68.73 | 133.18 | 242,385 | ||||||||||||||||
(1) | The CEO in each year was Anthony Wood. The non-CEO NEOs in each year were as follows: 2025 – Dan Jedda, Charlie Collier, Mustafa Ozgen, and Chris Handman; 2024 – Dan Jedda, Charlie Collier, Mustafa Ozgen, Louise Pentland, and Gidon Katz; 2023 – Dan Jedda, Charlie Collier, Mustafa Ozgen, Gidon Katz, and Steve Louden; 2022 – Steve Louden, Charlie Collier, Gidon Katz, and Mustafa Ozgen; 2021 – Steve Louden, Stephen H. Kay, Mustafa Ozgen, and Scott Rosenberg. |
(2) | To determine the CAP to our CEO, the amounts reported in the Total column of the Summary Compensation Table for the applicable year were adjusted as follows: |
2025 ($) | 2024 ($) | 2023 ($) | 2022 ($) | 2021 ($) | |||||||||||||
Summary Compensation Table Total for CEO | 26,565,120 | 27,697,846 | 20,218,958 | 20,991,685 | 18,133,692 | ||||||||||||
- Grant Date Fair Value of Option Awards and Stock Awards Granted in Fiscal Year | (25,535,210) | (26,560,419) | (19,000,133) | (19,775,041) | (16,917,387) | ||||||||||||
+ Fair Value at Fiscal Year-End of Outstanding and Unvested Option Awards and Stock Awards Granted in Fiscal Year | 28,305,999 | 64,067,424 | 17,717,575 | 6,900,189 | 6,035,966 | ||||||||||||
+ Year over Year Change in Fair Value of Outstanding and Unvested Option Awards and Stock Awards Granted in Prior Fiscal Years | 12,398,865 | (5,077,940) | 15,286,287 | (58,312,566) | (69,472,019) | ||||||||||||
+ Fair Value at Vesting of Option Awards and Stock Awards Granted in Fiscal Year That Vested During Fiscal Year | 2,609,555 | 5,331,267 | 4,802,620 | 2,732,858 | — | ||||||||||||
+ Year over Year Change in Fair Value as of Vesting Date of Option Awards and Stock Awards Granted in Prior Fiscal Years For Which Applicable Vesting Conditions Were Satisfied During Fiscal Year | 2,798,002 | (7,656,393) | 7,479,394 | (30,471,043) | 10,538,650 | ||||||||||||
- Fair Value as of Prior Fiscal Year-End of Option Awards and Stock Awards Granted in Prior Fiscal Years That Failed to Meet Applicable Vesting Conditions During Fiscal Year | — | — | — | — | — | ||||||||||||
Compensation Actually Paid to CEO | 47,142,331 | 57,801,785 | 46,504,701 | (77,933,918) | (51,681,097) |
* | The valuation assumptions used to calculate fair values did not materially differ from those disclosed at the time of grant. |
(3) | To determine the average CAP to our non-CEO NEOs, the amounts reported in the Total column of the Summary Compensation Table for the applicable year were adjusted as follows: |
2025 ($) | 2024 ($) | 2023 ($) | 2022 ($) | 2021 ($) | |||||||||||||
Average Summary Compensation Table Total for Non-CEO NEOs | 10,584,880 | 8,231,739 | 9,439,261 | 20,448,128 | 5,005,742 | ||||||||||||
- Grant Date Fair Value of Option Awards and Stock Awards Granted in Fiscal Year | (7,373,386) | (5,016,733) | (5,139,320) | (18,676,467) | (4,270,687) | ||||||||||||
+ Fair Value at Fiscal Year-End of Outstanding and Unvested Option Awards and Stock Awards Granted in Fiscal Year | 7,986,600 | 5,512,653 | 6,605,446 | 11,948,736 | 1,812,690 | ||||||||||||
+ Year over Year Change in Fair Value of Outstanding and Unvested Option Awards and Stock Awards Granted in Prior Fiscal Years | 4,566,300 | (3,442,360) | 10,487,559 | (5,741,438) | (11,647,173) | ||||||||||||
+ Fair Value at Vesting of Option Awards and Stock Awards Granted in Fiscal Year That Vested During Fiscal Year | 320,636 | 529,321 | 781,615 | 1,067,751 | — | ||||||||||||
+ Year over Year Change in Fair Value as of Vesting Date of Option Awards and Stock Awards Granted in Prior Fiscal Years for Which Applicable Vesting Conditions Were Satisfied During Fiscal Year | 1,267,563 | (2,514,157) | 2,833,412 | (3,284,443) | 1,969,261 | ||||||||||||
- Fair Value as of Prior Fiscal Year-End of Option Awards and Stock Awards Granted in Prior Fiscal Years That Failed to Meet Applicable Vesting Conditions During Fiscal Year | — | — | (466,601) | — | — | ||||||||||||
Average Compensation Actually Paid to Non-CEO NEOs | 17,352,593 | 3,300,463 | 24,541,372 | 5,762,267 | (7,130,167) |
* | The valuation assumptions used to calculate fair values did not materially differ from those disclosed at the time of grant. |
(4) | Roku’s Total Shareholder Return (TSR) and the Peer Group TSR reflected in these columns for each year is calculated based on a fixed investment on December 31, 2020 of $100 through the end of the applicable year on the same cumulative basis as is used in Item 201(e) of Regulation S-K. Peer Group TSR reflects the cumulative TSR for our custom peer group used for purposes of the performance graph included in our Annual Report on Form 10-K filed with the SEC on February 13, 2026, consisting of Alphabet, Inc., Fox Corporation, fuboTV Inc., Interpublic Group of Companies, Inc., LiveRamp Holdings, Inc., Magnite, Inc., Meta Platforms, Inc., Netflix, Inc., Paramount Global, Pinterest, Inc., PubMatic, Inc., Snap, Inc., The Trade Desk, Inc., Vizio Holding Corp., The Walt Disney Company, and Warner Bros. Discovery, Inc. Vizio Holding Corp. was acquired in 2024 and is included in the Peer Group TSR through the last trade date. Interpublic Group of Companies, Inc. was acquired in 2025 and is included in the Peer Group TSR through the last trade date. Netflix, Inc. underwent a 10:1 stock split in 2025, and the Peer Group TSR reflects its post-split data. |
(5) | Net Income (Loss) for 2023 includes restructuring charges of $356.1 million. |
(1) | The CEO in each year was Anthony Wood. The non-CEO NEOs in each year were as follows: 2025 – Dan Jedda, Charlie Collier, Mustafa Ozgen, and Chris Handman; 2024 – Dan Jedda, Charlie Collier, Mustafa Ozgen, Louise Pentland, and Gidon Katz; 2023 – Dan Jedda, Charlie Collier, Mustafa Ozgen, Gidon Katz, and Steve Louden; 2022 – Steve Louden, Charlie Collier, Gidon Katz, and Mustafa Ozgen; 2021 – Steve Louden, Stephen H. Kay, Mustafa Ozgen, and Scott Rosenberg. |
(4) | Roku’s Total Shareholder Return (TSR) and the Peer Group TSR reflected in these columns for each year is calculated based on a fixed investment on December 31, 2020 of $100 through the end of the applicable year on the same cumulative basis as is used in Item 201(e) of Regulation S-K. Peer Group TSR reflects the cumulative TSR for our custom peer group used for purposes of the performance graph included in our Annual Report on Form 10-K filed with the SEC on February 13, 2026, consisting of Alphabet, Inc., Fox Corporation, fuboTV Inc., Interpublic Group of Companies, Inc., LiveRamp Holdings, Inc., Magnite, Inc., Meta Platforms, Inc., Netflix, Inc., Paramount Global, Pinterest, Inc., PubMatic, Inc., Snap, Inc., The Trade Desk, Inc., Vizio Holding Corp., The Walt Disney Company, and Warner Bros. Discovery, Inc. Vizio Holding Corp. was acquired in 2024 and is included in the Peer Group TSR through the last trade date. Interpublic Group of Companies, Inc. was acquired in 2025 and is included in the Peer Group TSR through the last trade date. Netflix, Inc. underwent a 10:1 stock split in 2025, and the Peer Group TSR reflects its post-split data. |
(4) | Roku’s Total Shareholder Return (TSR) and the Peer Group TSR reflected in these columns for each year is calculated based on a fixed investment on December 31, 2020 of $100 through the end of the applicable year on the same cumulative basis as is used in Item 201(e) of Regulation S-K. Peer Group TSR reflects the cumulative TSR for our custom peer group used for purposes of the performance graph included in our Annual Report on Form 10-K filed with the SEC on February 13, 2026, consisting of Alphabet, Inc., Fox Corporation, fuboTV Inc., Interpublic Group of Companies, Inc., LiveRamp Holdings, Inc., Magnite, Inc., Meta Platforms, Inc., Netflix, Inc., Paramount Global, Pinterest, Inc., PubMatic, Inc., Snap, Inc., The Trade Desk, Inc., Vizio Holding Corp., The Walt Disney Company, and Warner Bros. Discovery, Inc. Vizio Holding Corp. was acquired in 2024 and is included in the Peer Group TSR through the last trade date. Interpublic Group of Companies, Inc. was acquired in 2025 and is included in the Peer Group TSR through the last trade date. Netflix, Inc. underwent a 10:1 stock split in 2025, and the Peer Group TSR reflects its post-split data. |
(2) | To determine the CAP to our CEO, the amounts reported in the Total column of the Summary Compensation Table for the applicable year were adjusted as follows: |
2025 ($) | 2024 ($) | 2023 ($) | 2022 ($) | 2021 ($) | |||||||||||||
Summary Compensation Table Total for CEO | 26,565,120 | 27,697,846 | 20,218,958 | 20,991,685 | 18,133,692 | ||||||||||||
- Grant Date Fair Value of Option Awards and Stock Awards Granted in Fiscal Year | (25,535,210) | (26,560,419) | (19,000,133) | (19,775,041) | (16,917,387) | ||||||||||||
+ Fair Value at Fiscal Year-End of Outstanding and Unvested Option Awards and Stock Awards Granted in Fiscal Year | 28,305,999 | 64,067,424 | 17,717,575 | 6,900,189 | 6,035,966 | ||||||||||||
+ Year over Year Change in Fair Value of Outstanding and Unvested Option Awards and Stock Awards Granted in Prior Fiscal Years | 12,398,865 | (5,077,940) | 15,286,287 | (58,312,566) | (69,472,019) | ||||||||||||
+ Fair Value at Vesting of Option Awards and Stock Awards Granted in Fiscal Year That Vested During Fiscal Year | 2,609,555 | 5,331,267 | 4,802,620 | 2,732,858 | — | ||||||||||||
+ Year over Year Change in Fair Value as of Vesting Date of Option Awards and Stock Awards Granted in Prior Fiscal Years For Which Applicable Vesting Conditions Were Satisfied During Fiscal Year | 2,798,002 | (7,656,393) | 7,479,394 | (30,471,043) | 10,538,650 | ||||||||||||
- Fair Value as of Prior Fiscal Year-End of Option Awards and Stock Awards Granted in Prior Fiscal Years That Failed to Meet Applicable Vesting Conditions During Fiscal Year | — | — | — | — | — | ||||||||||||
Compensation Actually Paid to CEO | 47,142,331 | 57,801,785 | 46,504,701 | (77,933,918) | (51,681,097) |
* | The valuation assumptions used to calculate fair values did not materially differ from those disclosed at the time of grant. |
(3) | To determine the average CAP to our non-CEO NEOs, the amounts reported in the Total column of the Summary Compensation Table for the applicable year were adjusted as follows: |
2025 ($) | 2024 ($) | 2023 ($) | 2022 ($) | 2021 ($) | |||||||||||||
Average Summary Compensation Table Total for Non-CEO NEOs | 10,584,880 | 8,231,739 | 9,439,261 | 20,448,128 | 5,005,742 | ||||||||||||
- Grant Date Fair Value of Option Awards and Stock Awards Granted in Fiscal Year | (7,373,386) | (5,016,733) | (5,139,320) | (18,676,467) | (4,270,687) | ||||||||||||
+ Fair Value at Fiscal Year-End of Outstanding and Unvested Option Awards and Stock Awards Granted in Fiscal Year | 7,986,600 | 5,512,653 | 6,605,446 | 11,948,736 | 1,812,690 | ||||||||||||
+ Year over Year Change in Fair Value of Outstanding and Unvested Option Awards and Stock Awards Granted in Prior Fiscal Years | 4,566,300 | (3,442,360) | 10,487,559 | (5,741,438) | (11,647,173) | ||||||||||||
+ Fair Value at Vesting of Option Awards and Stock Awards Granted in Fiscal Year That Vested During Fiscal Year | 320,636 | 529,321 | 781,615 | 1,067,751 | — | ||||||||||||
+ Year over Year Change in Fair Value as of Vesting Date of Option Awards and Stock Awards Granted in Prior Fiscal Years for Which Applicable Vesting Conditions Were Satisfied During Fiscal Year | 1,267,563 | (2,514,157) | 2,833,412 | (3,284,443) | 1,969,261 | ||||||||||||
- Fair Value as of Prior Fiscal Year-End of Option Awards and Stock Awards Granted in Prior Fiscal Years That Failed to Meet Applicable Vesting Conditions During Fiscal Year | — | — | (466,601) | — | — | ||||||||||||
Average Compensation Actually Paid to Non-CEO NEOs | 17,352,593 | 3,300,463 | 24,541,372 | 5,762,267 | (7,130,167) |
* | The valuation assumptions used to calculate fair values did not materially differ from those disclosed at the time of grant. |