Pay Versus Performance
The following table presents information regarding our executive compensation pay relative to corporate performance of our principal executive officer (“PEO”), Mr. Courtney, and non‐PEO named executive officers (“Non-PEO NEOs”) for 2023, 2024 and 2025.
|
Pay Versus Performance |
||||||||||||||||||||||||
|
Year |
Summary Compensation Table Total For PEO |
Compensation Actually Paid to PEO |
Average Summary Compensation Table Total For non-PEO Named Executive Officers (1) ($) |
Average Compensation Actually Paid to non-PEO Named Executive Officers (1) (2) ($) |
Value of Initial Fixed $100 Investment Based on Total Shareholder Return (3) ($) |
Net Income |
||||||||||||||||||
|
(a) |
(b) |
(c) |
(d) |
(e) |
(f) |
(g) |
||||||||||||||||||
|
2023 |
908,283 | 996,245 | 617,988 | 662,493 | 133.80 | 30,848,000 | ||||||||||||||||||
|
2024 |
980,578 | 975,544 | 681,485 | 691,909 | 132.96 | 24,948,000 | ||||||||||||||||||
|
2025 |
1,065,419 | 1,087,309 | 710,991 | 721,503 | 139.60 | 23,913,000 | ||||||||||||||||||
_________________________
|
1. |
The Non-PEO named executive officers for each applicable year include the following individuals: Richard A. McCarty and Michael J. Rodrigues. |
|
2. |
The dollar amounts reported represent the “compensation actually paid”, or “CAP”, to the PEO and the Non-PEO NEOs, respectively, as computed in accordance with Item 402(v) of Regulation S-K. The dollar amounts do not reflect the actual amount of compensation earned by or paid to the PEO or the Non-PEO NEOs, respectively, during the applicable year. To calculate CAP for the PEO and average CAP for the Non-PEO NEOs, the following amounts were deducted from and added to Summary Compensation Table total compensation: |
|
PEO SCT Total to CAP Reconciliation |
||||||||||||||||||||||||
|
Year |
SCT-PEO |
Fair Value of Equity Awards Granted in the Year |
Fair Value of Equity Awards Granted in the Year at year- end |
Change during fiscal year in Fair Value of Outstanding Unvested Equity Awards Granted in Prior Years |
Change in Fair Value from Prior Year-end to Vesting Date of Equity Awards Granted in Prior Years that Vested in the Year |
CAP |
||||||||||||||||||
|
2023 |
908,283 | (101,633 | ) | 111,294 | 60,291 | 18,010 | 996,245 | |||||||||||||||||
|
2024 |
980,578 | (109,406 | ) | 132,620 | (5,596 | ) | (22,652 | ) | 975,544 | |||||||||||||||
|
2025 |
1,065,419 | (200,564 | ) | 224,458 | 6,856 | (8,860 | ) | 1,087,309 | ||||||||||||||||
|
Average Non-PEO NEOs SCT Total to CAP Reconciliation |
||||||||||||||||||||||||
|
Year |
SCT-NEO |
Fair Value of Equity Awards Granted in the Year |
Fair Value of Equity Awards Granted in the Year at year end |
Change during fiscal year in Fair Value of Outstanding Unvested Equity Awards Granted in Prior Years |
Change in Fair Value from Prior Year-end to Vesting Date of Equity Awards Granted in Prior Years that Vested in the Year |
CAP |
||||||||||||||||||
|
2023 |
617,988 | (50,789 | ) | 55,617 | 30,456 | 9,221 | 662,493 | |||||||||||||||||
|
2024 |
681,485 | (116,584 | ) | 141,321 | (2,805 | ) | (11,508 | ) | 691,909 | |||||||||||||||
|
2025 |
710,991 | (92,425 | ) | 103,436 | 5,084 | (5,583 | ) | 721,503 | ||||||||||||||||
|
3. |
Represents the cumulative three-year total return to shareholders of our common stock and assumes that the value of the investment was $100 on December 31, 2022, and that the subsequent dividends were reinvested. The stock price performance included in this column is not necessarily indicative of future stock price performance. |
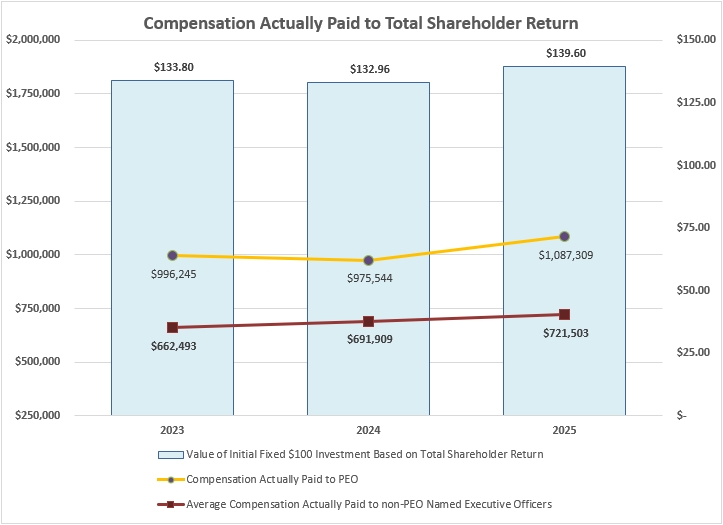
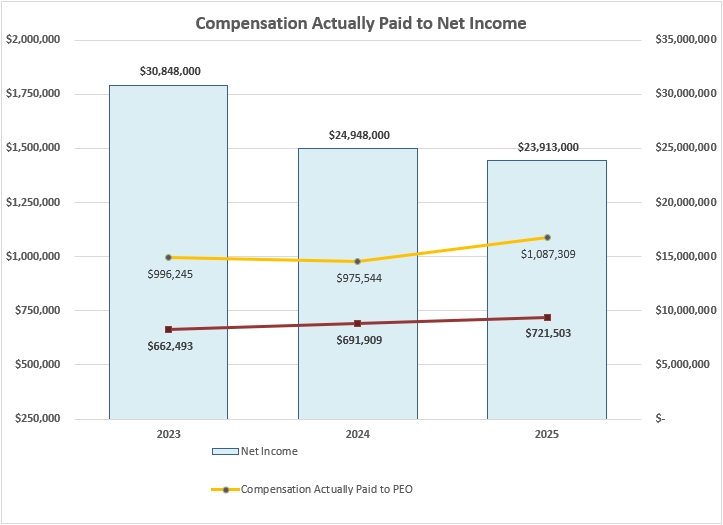
The following graphs show the relationship between the compensation actually paid to our PEO and the average of the compensation actually paid to our other named executive officers to our total shareholder and net income over three most recently completed fiscal years.