Pay vs Performance Disclosure - USD ($)
Dec. 31, 2025
Dec. 31, 2024
Dec. 31, 2023
Pay versus Performance
Year |
Summary Compensation Table Total for PEO(1) ($) |
Compensation Actually Paid to PEO(2) ($) |
Summary Compensation Table Total for former PEO(1) ($) |
Compensation Actually Paid to former PEO(2) ($) |
Average Summary Compensation Table Total for Non-PEO Named Executive Officers(3) ($) |
Average Compensation Actually Paid to Non-PEO Named Executive Officers(4) ($) |
Value of Initial Fixed $100 Investment Based On: |
Net Income(6) ( in thousands ) ($) |
||||||||||||||||||||
Total Shareholder Return(5) ($) |
||||||||||||||||||||||||||||
| (a) | (b) | (c) | (b) | (c) | (d) | (e) | (f) | (h) | ||||||||||||||||||||
2025 |
2,248,568 | 1,646,376 | 913,398 | 574,491 | 9.71 | (136,315 | ) | |||||||||||||||||||||
2024 |
4,175,069 | 1,594,718 | 3,502,850 | 1,265,833 | 16.35 | (186,262 | ) | |||||||||||||||||||||
2023 |
3,522,750 | (360,474 | ) | 2,878,537 | 617,776 | 37.07 | (160,928 | ) | ||||||||||||||||||||
| (1) | For 2025, the dollar amounts reported in column (b) are the amounts of total compensation reported for Bahram Valamehr, corresponding to the applicable year in the “Total” column of the applicable Summary Compensation Table. For the years 2023 and 2024, the dollar amounts reported in column (b) are the amounts of total compensation report for our former PEO, J. Scott Wolchko, corresponding to the applicable year in the “Total” column of the applicable Summary Compensation Table. |
| (2) | The dollar amounts reported in column (c) represent the amount of “compensation actually paid” to Dr. Valamehr or Mr. Wolchko, as applicable, as computed in accordance with Item 402(v) of Regulation S-K during the applicable year. The dollar amounts do not reflect the actual amount of compensation earned by or paid to Dr. Valamehr or Mr. Wolchko during the applicable year. In accordance with the requirements of Item 402(v) of Regulation S-K, the following adjustments were made to Dr. Valamehr’s total compensation for the applicable year to determine the compensation actually paid: |
Year |
Reported Summary Compensation Table Total for PEO ($) |
Reported Value of Equity Awards(a) ($) |
Equity Award Adjustments(b) ($) |
Compensation Actually Paid to PEO ($) |
||||||||||||
2025 |
2,248,568 | (1,283,868 | ) | 681,676 | 1,646,376 | |||||||||||
| (a) | The grant date fair value of equity awards represents the total of the amounts reported in the “Option Awards” and “Stock Awards” columns in the Summary Compensation Table for the applicable year. |
| (b) | The valuation assumptions used to calculate fair values did not materially differ from those disclosed at the time of grant. The amounts deducted or added in calculating the equity award adjustments are as follows: |
Year |
Year End Fair Value of Outstanding and Unvested Equity Awards Granted in the Year ($) |
Year over Year Change in Fair Value of Outstanding and Unvested Equity Awards Granted in Prior Years ($) |
Fair Value as of Vesting Date of Equity Awards Granted and Vested in the Year ($) |
Year over Year Change in Fair Value of Equity Awards Granted in Prior Years that Vested in the Year ($) |
Fair Value at the End of the Prior Year of Equity Awards that Failed to Meet Vesting Conditions in the Year ($) |
Value of Dividends or Other Earnings Paid on Stock or Option Awards not Otherwise Reflected in Fair Value or Total Compensation ($) |
Total Equity Award Adjustments |
|||||||||||||||||||||
2025 |
748,914 | (262,055 | ) | 361,343 | (166,526 | ) | — | — | 681,676 | |||||||||||||||||||
In accordance with the requirements of Item 402(v) of Regulation
S-K,
the following adjustments were made to Mr. Wolchko’s total compensation for the applicable years to determine the compensation actually paid: Year |
Reported Summary Compensation Table Total for former PEO ($) |
Reported Value of Equity Awards(a) ($) |
Equity Award Adjustments(b) ($) |
Compensation Actually Paid to former PEO ($) |
||||||||||||
2024 |
4,175,069 | (3,090,469 | ) | 510,118 | 1,594,718 | |||||||||||
2023 |
3,522,750 | (2,602,350 | ) | (1,280,874 | ) | (360,474 | ) | |||||||||
| (a) | The grant date fair value of equity awards represents the total of the amounts reported in the “Option Awards” and “Stock Awards” columns in the Summary Compensation Table for the applicable year. |
| (b) | The valuation assumptions used to calculate fair values did not materially differ from those disclosed at the time of grant. The amounts deducted or added in calculating the equity award adjustments are as follows: |
Year |
Year End Fair Value of Outstanding and Unvested Equity Awards Granted in the Year ($) |
Year over Year Change in Fair Value of Outstanding and Unvested Equity Awards Granted in Prior Years ($) |
Fair Value as of Vesting Date of Equity Awards Granted and Vested in the Year ($) |
Year over Year Change in Fair Value of Equity Awards Granted in Prior Years that Vested in the Year ($) |
Fair Value at the End of the Prior Year of Equity Awards that Failed to Meet Vesting Conditions in the Year ($) |
Value of Dividends or Other Earnings Paid on Stock or Option Awards not Otherwise Reflected in Fair Value or Total Compensation ($) |
Total Equity Award Adjustments |
|||||||||||||||||||||
2024 |
392,188 | (368,844 | ) | 450,541 | 36,233 | — | — | 510,118 | ||||||||||||||||||||
2023 |
1,048,478 | (1,798,128 | ) | 489,062 | (1,020,286 | ) | — | — | (1,280,874 | ) | ||||||||||||||||||
| (3) | The dollar amounts reported in column (d) represent the average of the amounts reported for our company’s named executive officers as a group (excluding the applicable year’s PEO) in the “Total” column of the Summary Compensation Table in each applicable year. The names of each of the named executive officers (excluding the applicable year’s PEO) included for purposes of calculating the average amounts in each applicable year are as follows: |
Year |
Non-PEO NEOs | |
| 2025 | Kamal Adawi, Cindy Tahl | |
| 2024 | Bahram Valamehr, Cindy Tahl | |
| 2023 | Edward Dulac, Bahram Valamehr, Cindy Tahl |
| (4) | The dollar amounts reported in column (e) represent the average amount of “compensation actually paid” to the named executive officers as a group (excluding the applicable year’s PEO), as computed in accordance with Item 402(v) of Regulation S-K. The dollar amounts do not reflect the actual average amount of compensation earned by or paid to the named executive officers as a group (excluding the applicable year’s PEO) during the applicable year. In accordance with the requirements of Item 402(v) of Regulation S-K, the following adjustments were made to average total compensation for the named |
| executive officers as a group (excluding the applicable year’s PEO) for each year to determine the compensation actually paid: |
Year |
Reported Summary Compensation Table Total for Non-PEO NEOs($) |
Reported Value of Equity Awards(a) ($) |
Equity Award Adjustments(b) ($) |
Compensation Actually Paid to Non- PEO NEOs ($) |
||||||||||||
2025 |
913,398 | (475,398 | ) | 136,491 | 574,491 | |||||||||||
2024 |
3,502,850 | (2,842,250 | ) | 605,233 | 1,265,833 | |||||||||||
2023 |
2,878,537 | (2,255,370 | ) | (5,391 | ) | 617,776 | ||||||||||
| (a) | The grant date fair value of equity awards represents the total of the amounts reported in the “Option Awards” and “Stock Awards” columns in the Summary Compensation Table for the applicable year. |
| (b) | The valuation assumptions used to calculate fair values did not materially differ from those disclosed at the time of grant. The amounts deducted or added in calculating the equity award adjustments are as follows: |
Year |
Year End Fair Value of Outstanding and Unvested Equity Awards Granted in the Year ($) |
Year over Year Change in Fair Value of Outstanding and Unvested Equity Awards Granted in Prior Years ($) |
Fair Value as of Vesting Date of Equity Awards Granted and Vested in the Year ($) |
Year over Year Change in Fair Value of Equity Awards Granted in Prior Years that Vested in the Year ($) |
Fair Value at the End of the Prior Year of Equity Awards that Failed to Meet Vesting Conditions in the Year ($) |
Value of Dividends or Other Earnings Paid on Stock or Option Awards not Otherwise Reflected in Fair Value or Total Compensation ($) |
Total Equity Award Adjustments |
|||||||||||||||||||||
2025 |
305,902 | (128,306 | ) | 38,036 | (79,141 | ) | — | — | 136,491 | |||||||||||||||||||
2024 |
687,463 | (498,975 | ) | 394,226 | 22,519 | — | — | 605,233 | ||||||||||||||||||||
2023 |
908,685 | (1,043,584 | ) | 423,854 | (294,346 | ) | — | — | (5,391 | ) | ||||||||||||||||||
| (5) | The calculation of Cumulative TSR assumes that $100 was invested in our common stock as of the market close on December 31, 2022. |
| (6) | The dollar amounts reported represent the amount of net income (loss) reflected in our consolidated audited financial statements for the applicable year. |
| (3) | The dollar amounts reported in column (d) represent the average of the amounts reported for our company’s named executive officers as a group (excluding the applicable year’s PEO) in the “Total” column of the Summary Compensation Table in each applicable year. The names of each of the named executive officers (excluding the applicable year’s PEO) included for purposes of calculating the average amounts in each applicable year are as follows: |
Year |
Non-PEO NEOs | |
| 2025 | Kamal Adawi, Cindy Tahl | |
| 2024 | Bahram Valamehr, Cindy Tahl | |
| 2023 | Edward Dulac, Bahram Valamehr, Cindy Tahl |
| (2) | The dollar amounts reported in column (c) represent the amount of “compensation actually paid” to Dr. Valamehr or Mr. Wolchko, as applicable, as computed in accordance with Item 402(v) of Regulation S-K during the applicable year. The dollar amounts do not reflect the actual amount of compensation earned by or paid to Dr. Valamehr or Mr. Wolchko during the applicable year. In accordance with the requirements of Item 402(v) of Regulation S-K, the following adjustments were made to Dr. Valamehr’s total compensation for the applicable year to determine the compensation actually paid: |
Year |
Reported Summary Compensation Table Total for PEO ($) |
Reported Value of Equity Awards(a) ($) |
Equity Award Adjustments(b) ($) |
Compensation Actually Paid to PEO ($) |
||||||||||||
2025 |
2,248,568 | (1,283,868 | ) | 681,676 | 1,646,376 | |||||||||||
| (a) | The grant date fair value of equity awards represents the total of the amounts reported in the “Option Awards” and “Stock Awards” columns in the Summary Compensation Table for the applicable year. |
| (b) | The valuation assumptions used to calculate fair values did not materially differ from those disclosed at the time of grant. The amounts deducted or added in calculating the equity award adjustments are as follows: |
Year |
Year End Fair Value of Outstanding and Unvested Equity Awards Granted in the Year ($) |
Year over Year Change in Fair Value of Outstanding and Unvested Equity Awards Granted in Prior Years ($) |
Fair Value as of Vesting Date of Equity Awards Granted and Vested in the Year ($) |
Year over Year Change in Fair Value of Equity Awards Granted in Prior Years that Vested in the Year ($) |
Fair Value at the End of the Prior Year of Equity Awards that Failed to Meet Vesting Conditions in the Year ($) |
Value of Dividends or Other Earnings Paid on Stock or Option Awards not Otherwise Reflected in Fair Value or Total Compensation ($) |
Total Equity Award Adjustments |
|||||||||||||||||||||
2025 |
748,914 | (262,055 | ) | 361,343 | (166,526 | ) | — | — | 681,676 | |||||||||||||||||||
In accordance with the requirements of Item 402(v) of Regulation
S-K,
the following adjustments were made to Mr. Wolchko’s total compensation for the applicable years to determine the compensation actually paid: Year |
Reported Summary Compensation Table Total for former PEO ($) |
Reported Value of Equity Awards(a) ($) |
Equity Award Adjustments(b) ($) |
Compensation Actually Paid to former PEO ($) |
||||||||||||
2024 |
4,175,069 | (3,090,469 | ) | 510,118 | 1,594,718 | |||||||||||
2023 |
3,522,750 | (2,602,350 | ) | (1,280,874 | ) | (360,474 | ) | |||||||||
| (a) | The grant date fair value of equity awards represents the total of the amounts reported in the “Option Awards” and “Stock Awards” columns in the Summary Compensation Table for the applicable year. |
| (b) | The valuation assumptions used to calculate fair values did not materially differ from those disclosed at the time of grant. The amounts deducted or added in calculating the equity award adjustments are as follows: |
Year |
Year End Fair Value of Outstanding and Unvested Equity Awards Granted in the Year ($) |
Year over Year Change in Fair Value of Outstanding and Unvested Equity Awards Granted in Prior Years ($) |
Fair Value as of Vesting Date of Equity Awards Granted and Vested in the Year ($) |
Year over Year Change in Fair Value of Equity Awards Granted in Prior Years that Vested in the Year ($) |
Fair Value at the End of the Prior Year of Equity Awards that Failed to Meet Vesting Conditions in the Year ($) |
Value of Dividends or Other Earnings Paid on Stock or Option Awards not Otherwise Reflected in Fair Value or Total Compensation ($) |
Total Equity Award Adjustments |
|||||||||||||||||||||
2024 |
392,188 | (368,844 | ) | 450,541 | 36,233 | — | — | 510,118 | ||||||||||||||||||||
2023 |
1,048,478 | (1,798,128 | ) | 489,062 | (1,020,286 | ) | — | — | (1,280,874 | ) | ||||||||||||||||||
| (4) | The dollar amounts reported in column (e) represent the average amount of “compensation actually paid” to the named executive officers as a group (excluding the applicable year’s PEO), as computed in accordance with Item 402(v) of Regulation S-K. The dollar amounts do not reflect the actual average amount of compensation earned by or paid to the named executive officers as a group (excluding the applicable year’s PEO) during the applicable year. In accordance with the requirements of Item 402(v) of Regulation S-K, the following adjustments were made to average total compensation for the named |
| executive officers as a group (excluding the applicable year’s PEO) for each year to determine the compensation actually paid: |
Year |
Reported Summary Compensation Table Total for Non-PEO NEOs($) |
Reported Value of Equity Awards(a) ($) |
Equity Award Adjustments(b) ($) |
Compensation Actually Paid to Non- PEO NEOs ($) |
||||||||||||
2025 |
913,398 | (475,398 | ) | 136,491 | 574,491 | |||||||||||
2024 |
3,502,850 | (2,842,250 | ) | 605,233 | 1,265,833 | |||||||||||
2023 |
2,878,537 | (2,255,370 | ) | (5,391 | ) | 617,776 | ||||||||||
| (a) | The grant date fair value of equity awards represents the total of the amounts reported in the “Option Awards” and “Stock Awards” columns in the Summary Compensation Table for the applicable year. |
| (b) | The valuation assumptions used to calculate fair values did not materially differ from those disclosed at the time of grant. The amounts deducted or added in calculating the equity award adjustments are as follows: |
Year |
Year End Fair Value of Outstanding and Unvested Equity Awards Granted in the Year ($) |
Year over Year Change in Fair Value of Outstanding and Unvested Equity Awards Granted in Prior Years ($) |
Fair Value as of Vesting Date of Equity Awards Granted and Vested in the Year ($) |
Year over Year Change in Fair Value of Equity Awards Granted in Prior Years that Vested in the Year ($) |
Fair Value at the End of the Prior Year of Equity Awards that Failed to Meet Vesting Conditions in the Year ($) |
Value of Dividends or Other Earnings Paid on Stock or Option Awards not Otherwise Reflected in Fair Value or Total Compensation ($) |
Total Equity Award Adjustments |
|||||||||||||||||||||
2025 |
305,902 | (128,306 | ) | 38,036 | (79,141 | ) | — | — | 136,491 | |||||||||||||||||||
2024 |
687,463 | (498,975 | ) | 394,226 | 22,519 | — | — | 605,233 | ||||||||||||||||||||
2023 |
908,685 | (1,043,584 | ) | 423,854 | (294,346 | ) | — | — | (5,391 | ) | ||||||||||||||||||
Description of Relationship Between PEO and
Non-PEO
NEO Compensation Actually Paid and Company Total Shareholder Return (“TSR”) The following chart sets forth the relationship between Compensation Actually Paid to our PEOs, the average of Compensation Actually Paid to our
Non-PEO
NEOs, and the Company’s cumulative TSR over the three most recently completed fiscal years. 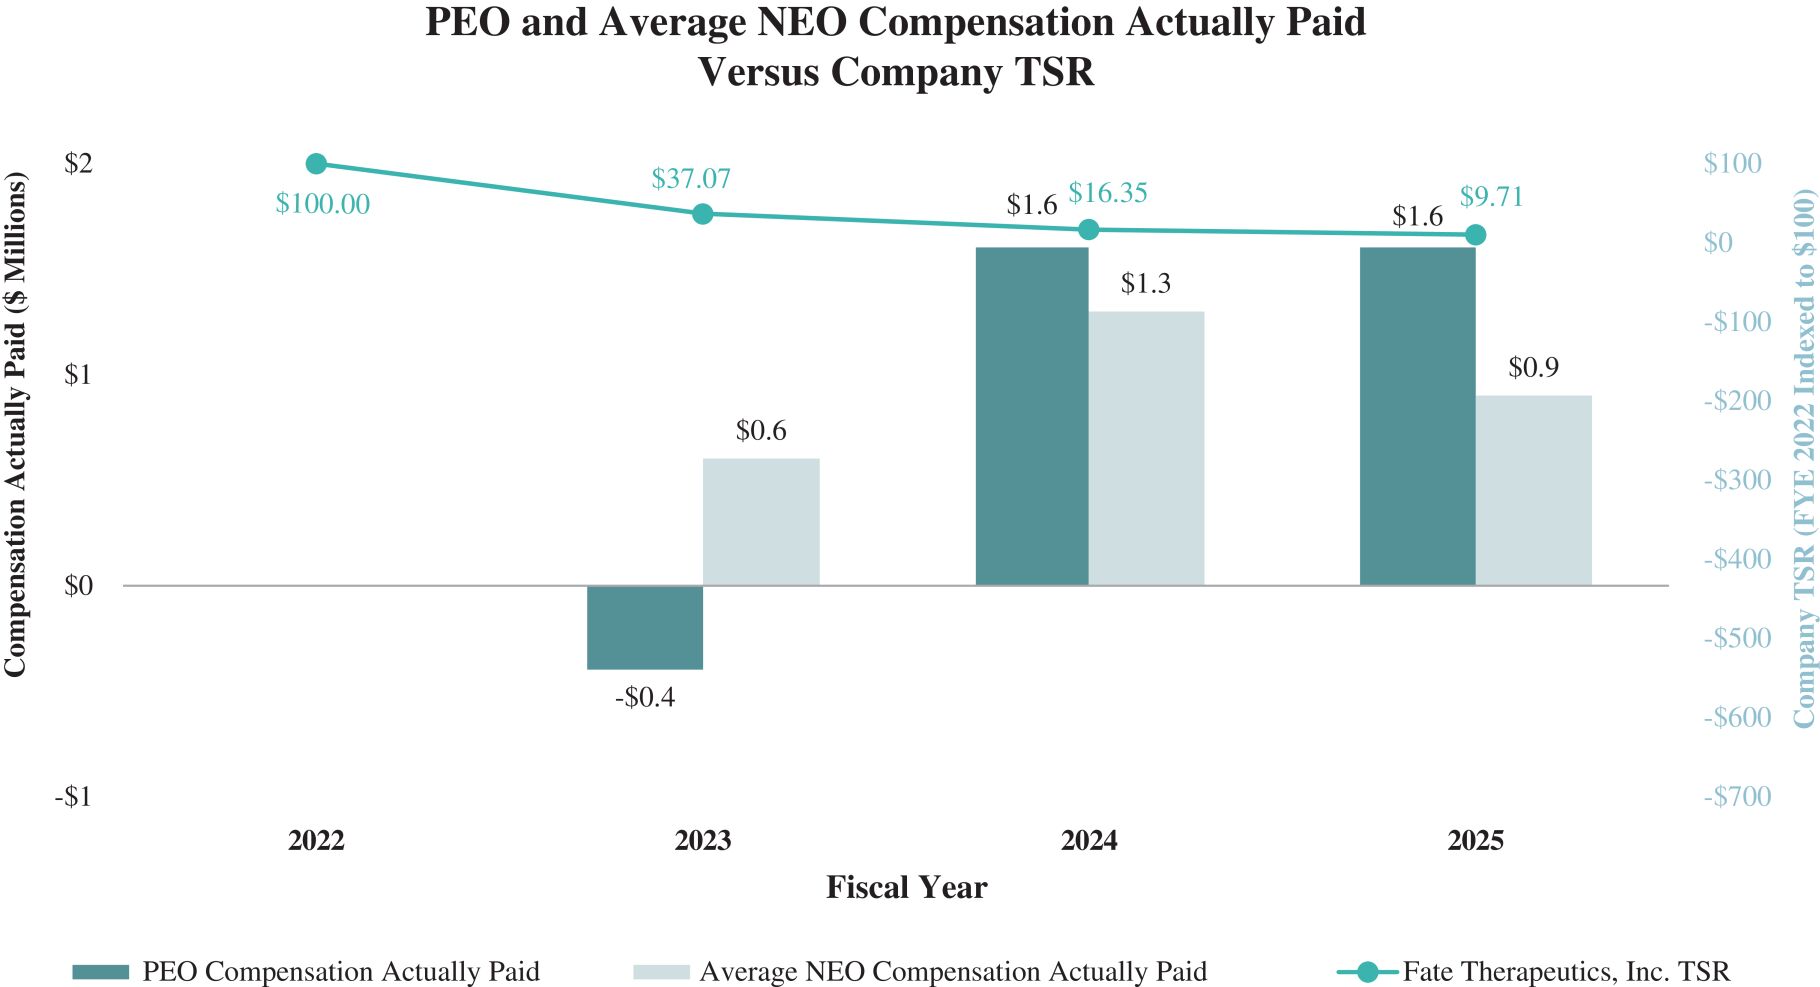
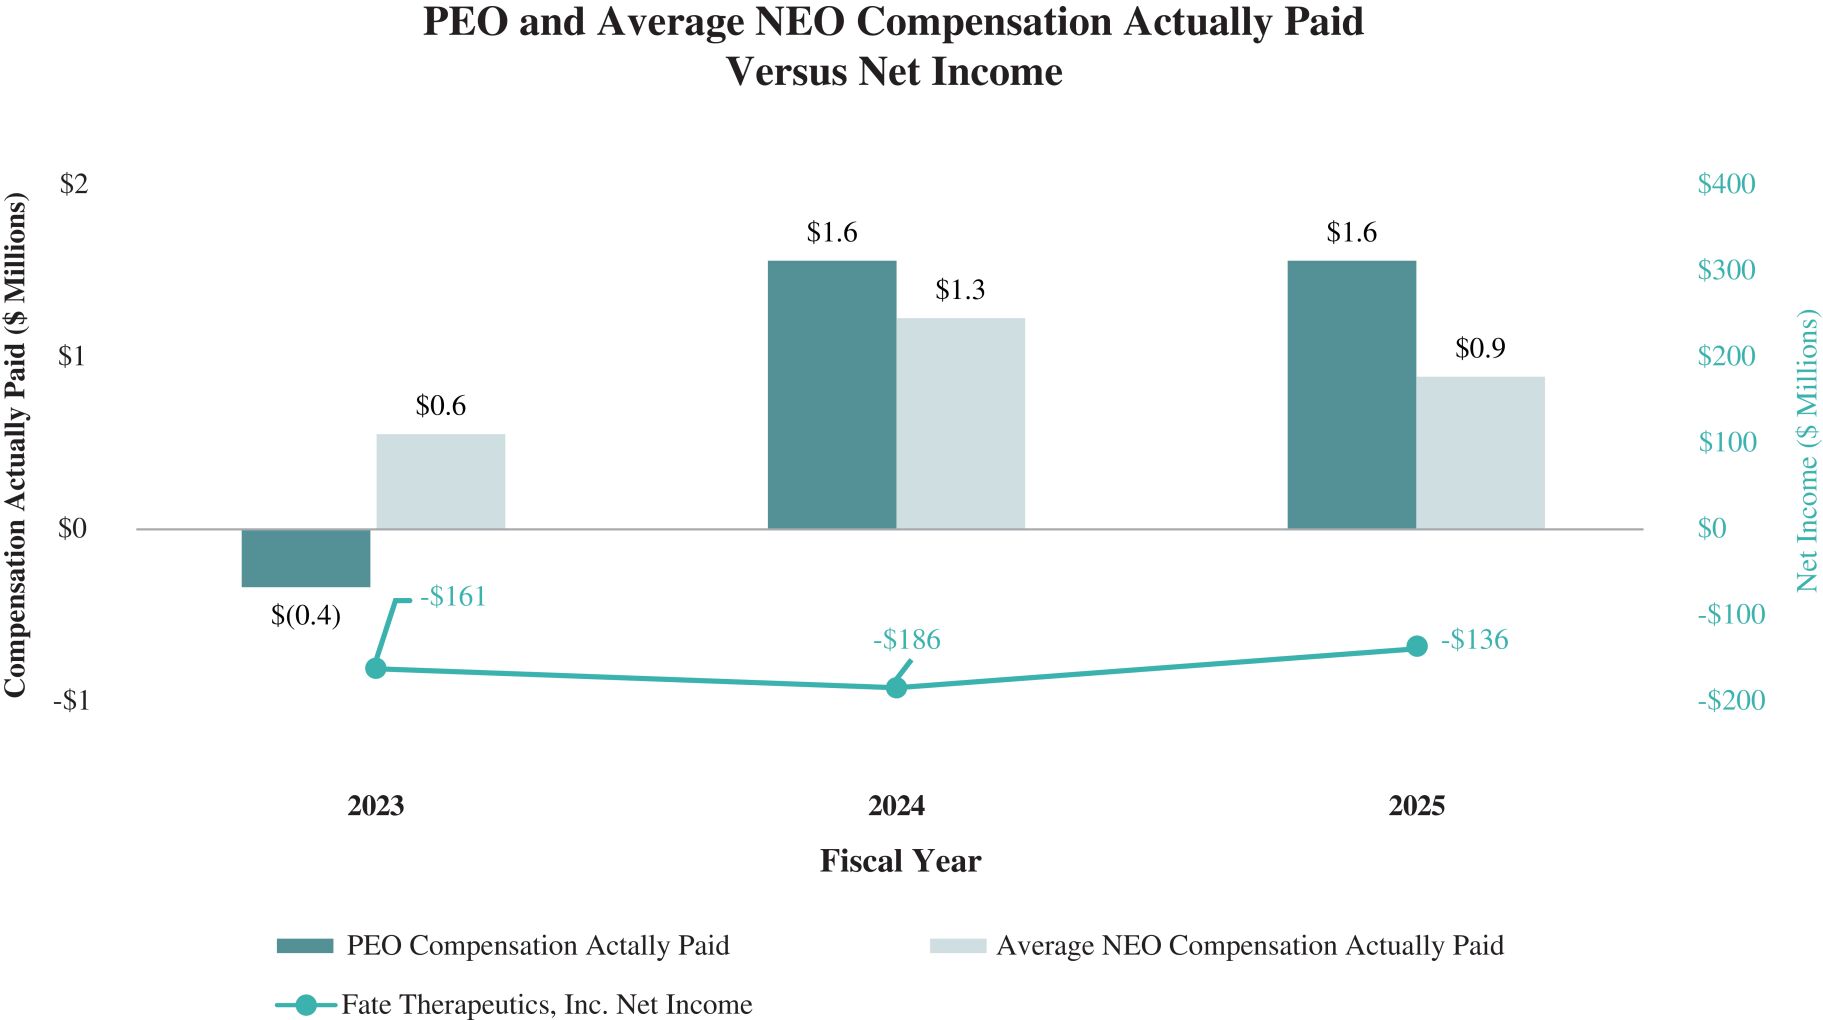
Description of Relationship Between PEO and
Non-PEO
NEO Compensation Actually Paid and Net IncomeThe following chart sets forth the relationship between Compensation Actually Paid to our PEOs, the average of Compensation Actually Paid to our
Non-PEO
NEOs, and our Net Income during the three most recently completed fiscal years.