Pay vs Performance Disclosure - USD ($)
Dec. 31, 2025
Dec. 31, 2024
Dec. 31, 2023
Dec. 31, 2022
Dec. 31, 2021
Dec. 29, 2023
Dec. 30, 2022
| Year | Summary Compensation Table Total for CEO | Compensation Actually Paid to CEO(1)(2) | Average Summary Compensation Table Total for Non-CEO NEOs(2)(3) | Average Compensation Actually Paid to Non-CEO NEOs(4) | Value of Fixed Initial $100 Investment on December 31, 2020 | Net Income (in millions)(6) | Adjusted EBITDA (in millions)(7) | |||||||||||||||||||||||||||||||||||||||||||
| WBD | Peer Group(5) | |||||||||||||||||||||||||||||||||||||||||||||||||
| 2025 | $ | 165,009,366 | $ | 636,141,723 | $ | 21,430,910 | $ | 109,407,589 | $ | 96 | $ | 228 | $ | 749 | $ | 8,744 | ||||||||||||||||||||||||||||||||||
| 2024 | $ | 51,918,563 | $ | 63,582,984 | $ | 17,839,399 | $ | 16,974,522 | $ | 35 | $ | 167 | $ | (11,482) | $ | 9,032 | ||||||||||||||||||||||||||||||||||
| 2023 | $ | 49,702,546 | $ | 64,741,835 | $ | 17,194,027 | $ | 19,194,735 | $ | 38 | $ | 118 | $ | (3,079) | $ | 10,200 | ||||||||||||||||||||||||||||||||||
| 2022 | $ | 39,288,458 | $ | (40,926,334) | $ | 12,897,862 | $ | 8,377,049 | $ | 32 | $ | 71 | $ | (7,297) | $ | 7,718 | ||||||||||||||||||||||||||||||||||
| 2021 | $ | 246,573,481 | $ | 100,779,562 | $ | 10,960,057 | $ | 8,862,525 | $ | 78 | $ | 127 | $ | 1,197 | $ | 3,817 | ||||||||||||||||||||||||||||||||||
CEO — Summary Compensation Table Total to CAP Reconciliation
Fiscal Year | Summary Compensation Total | Summary Compensation Table Total for Stock Awards | Summary Compensation Table Total for Option Awards | Awards Granted During the Year and Outstanding and Unvested as of FYE: Fair Value as of FYE | Awards Granted in Prior Years Outstanding and Unvested as of FYE: Change in Fair Value as of FYE (from Prior FYE) | Awards Granted During the FY that Vested during the FY: Fair Value as of the Vesting Date | Awards Granted in Prior FYs that Vested During the FY: Change in Fair Value as of the Vesting Date (from Prior FYE) | Awards that Fail to Meet the Applicable Vesting Conditions During the FY: Fair Value as of FYE | Dollar Value of any Dividends or other Earnings paid on Awards (not otherwise included in total compensation) | Total Compensation Actually Paid | ||||||||||||||||||||||
2025 | 165,009,366 | (22,597,744) | (109,593,181) | 563,968,168 | 35,994,178 | — | 3,360,936 | — | — | 636,141,723 | ||||||||||||||||||||||
2024 | 51,918,563 | (23,098,980) | — | 56,517,642 | (11,854,629) | — | (9,899,612) | — | — | 63,582,984 | ||||||||||||||||||||||
2023 | 49,702,546 | (23,078,769) | — | 34,242,033 | 1,585,715 | — | 2,290,310 | — | — | 64,741,835 | ||||||||||||||||||||||
2022 | 39,288,458 | (12,025,683) | (1,448,138) | 4,309,229 | (80,586,333) | — | 9,536,133 | — | — | (40,926,334) | ||||||||||||||||||||||
2021 | 246,573,481 | (13,165,436) | (202,889,764) | 94,913,135 | (38,068,152) | — | 13,416,298 | — | — | 100,779,562 | ||||||||||||||||||||||
Our CEO does not have any accumulated benefit under any defined benefit or actuarial pension plans; accordingly, we did not deduct or add any amounts with respect to defined benefit pension plans in calculating CAP to the CEO.
In calculating CAP, the following assumptions were made with respect to adjustments: (a) for PRSUs without the relative TSR modifier and all RSUs awarded to the CEO and non-CEO NEOs, which included grants made from 2022 through 2025, the awards were re-valued based on the applicable WBD or DISCA stock price on each of December 31, 2021 ($23.54), December 30, 2022 ($9.48) and December 29, 2023 ($11.38), December 31, 2024 ($10.57), and December 31, 2025 ($28.82).
(b) for PRSUs with the relative TSR modifier awarded to the non-CEO NEOs, which included a portion of the grants made in 2024 and 2025, the awards were re-valued using a Monte Carlo simulation that determines the probability that the performance targets will be achieved.
(c) for stock options awarded to the CEO and non-CEO NEOs, which included grants made from 2018 through 2025, the awards were re-valued as of , December 31, 2021, December 31, 2022, December 31, 2023, December 31, 2024, and December 31, 2025 using the Black-Scholes option-pricing model. The assumptions used for each valuation date included stock price, risk-free rate, stock price volatility and expected life as determined in accordance with FASB ASC Topic 718.
(a) for PRSUs without the relative TSR modifier and all RSUs awarded to the CEO and non-CEO NEOs, which included grants made from 2022 through 2025, the awards were re-valued based on the applicable WBD or DISCA stock price on each of December 31, 2021 ($23.54), December 30, 2022 ($9.48) and December 29, 2023 ($11.38), December 31, 2024 ($10.57), and December 31, 2025 ($28.82).
(b) for PRSUs with the relative TSR modifier awarded to the non-CEO NEOs, which included a portion of the grants made in 2024 and 2025, the awards were re-valued using a Monte Carlo simulation that determines the probability that the performance targets will be achieved.
(c) for stock options awarded to the CEO and non-CEO NEOs, which included grants made from 2018 through 2025, the awards were re-valued as of , December 31, 2021, December 31, 2022, December 31, 2023, December 31, 2024, and December 31, 2025 using the Black-Scholes option-pricing model. The assumptions used for each valuation date included stock price, risk-free rate, stock price volatility and expected life as determined in accordance with FASB ASC Topic 718.
In calculating Average CAP to non-CEO NEOs for each year in the table, the following amounts in the table below were deducted from and added to the Summary Compensation Table totals reported in the PVP table above:Average Non–CEO NEOs — Summary Compensation Table Total to CAP Reconciliation
Fiscal Year | Summary Compensation Total | Summary Compensation Table Total for Stock Awards | Summary Compensation Table Total for Option Awards | Awards Granted During the Year and Outstanding and Unvested as of FYE: Fair Value as of FYE | Awards Granted in Prior Years Outstanding and Unvested as of FYE: Change in Fair Value as of FYE (from Prior FYE) | Awards Granted During the FY that Vested during the FY: Fair Value as of the Vesting Date | Awards Granted in Prior FYs that Vested During the FY: Change in Fair Value as of the Vesting Date (from Prior FYE) | Awards that Fail to Meet the Applicable Vesting Conditions During the FY: Fair Value as of FYE | Dollar Value of any Dividends or other Earnings paid on Awards (not otherwise included in total compensation) | Total Compensation Actually Paid | ||||||||||||||||||||||
2025 | 21,430,910 | (11,194,016) | (2,035,027) | 26,629,628 | 66,880,681 | 7,430,055 | 265,358 | — | — | 109,407,589 | ||||||||||||||||||||||
2024 | 17,839,399 | (7,983,727) | (1,639,855) | 11,809,981 | (1,981,594) | — | (1,069,682) | — | — | 16,974,522 | ||||||||||||||||||||||
2023 | 17,194,027 | (8,035,548) | (1,933,921) | 10,730,655 | 392,394 | — | 847,128 | — | — | 19,194,735 | ||||||||||||||||||||||
2022 | 12,897,862 | (6,164,747) | — | 2,577,204 | (1,326,381) | — | 393,111 | — | — | 8,377,049 | ||||||||||||||||||||||
2021 | 10,960,057 | (1,919,984) | (2,442,832) | 495,534 | (824,947) | — | 2,594,697 | — | — | 8,862,525 | ||||||||||||||||||||||
Our non-CEO NEOs do not have any accumulated benefit under any defined benefit or actuarial pension plans; accordingly, we did not deduct or add any amounts with respect to defined benefit pension plans in calculating CAP to the non-CEO NEOs.
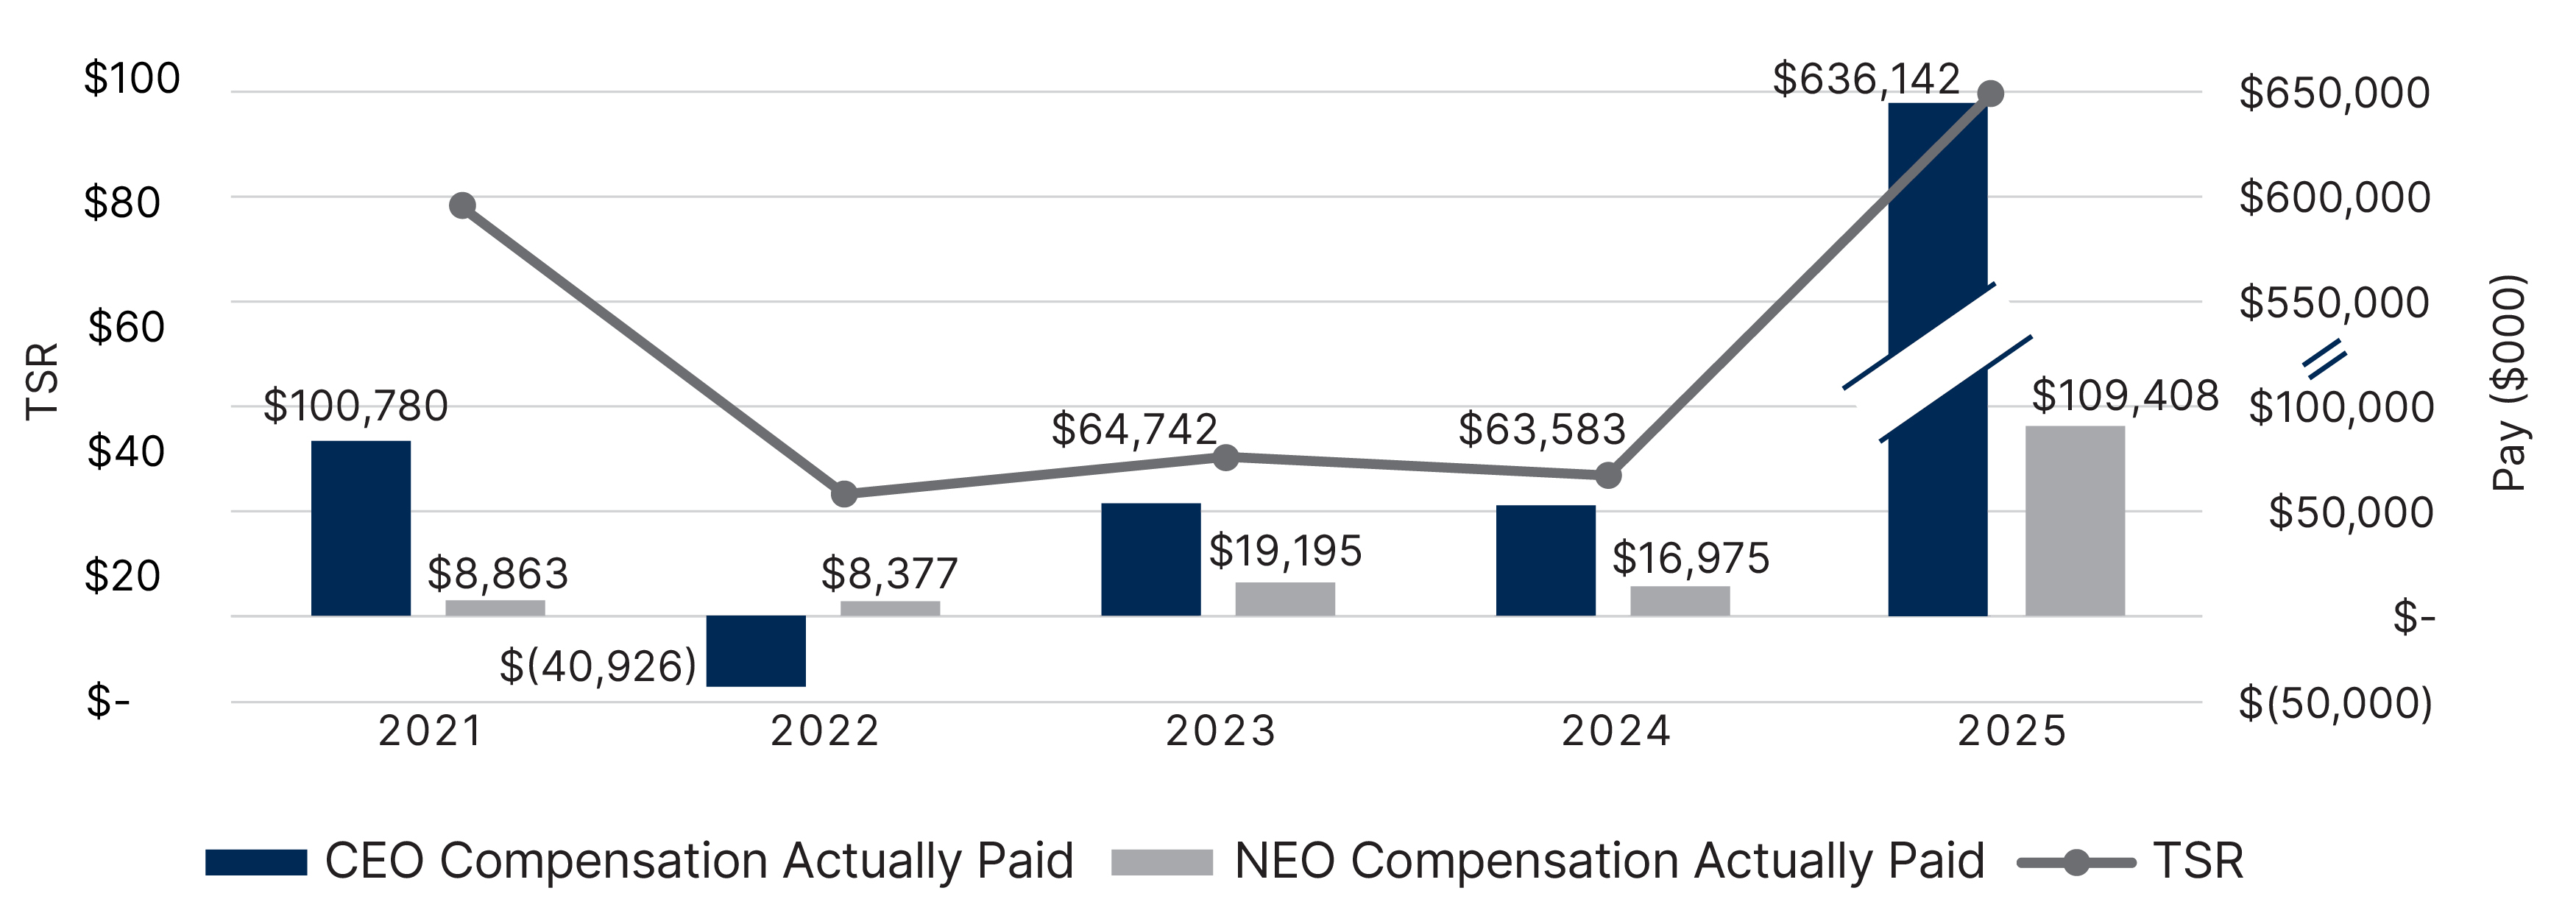
CEO and Average NEO CAP vs. TSR*
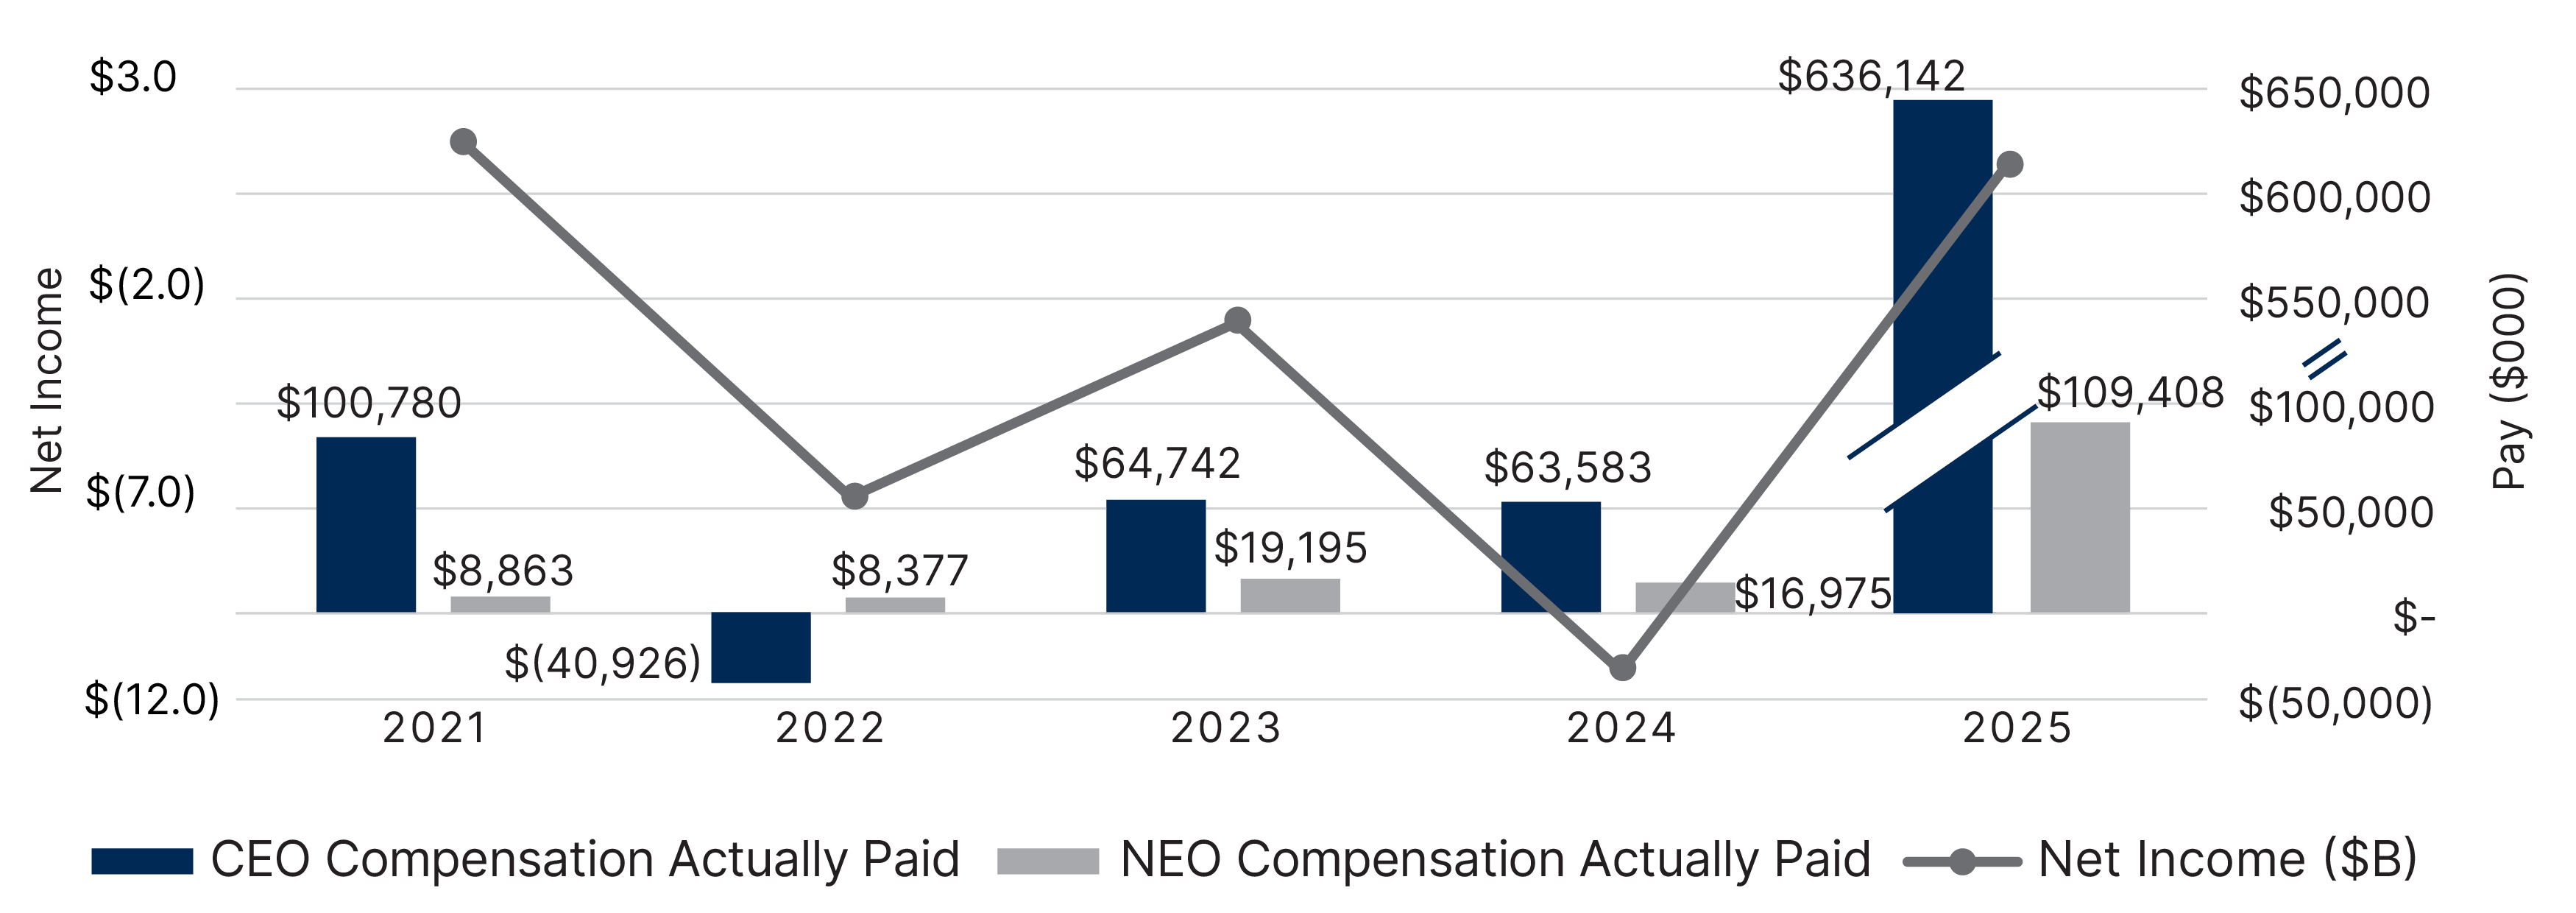
CEO and Average NEO CAP vs. Net Income (GAAP)
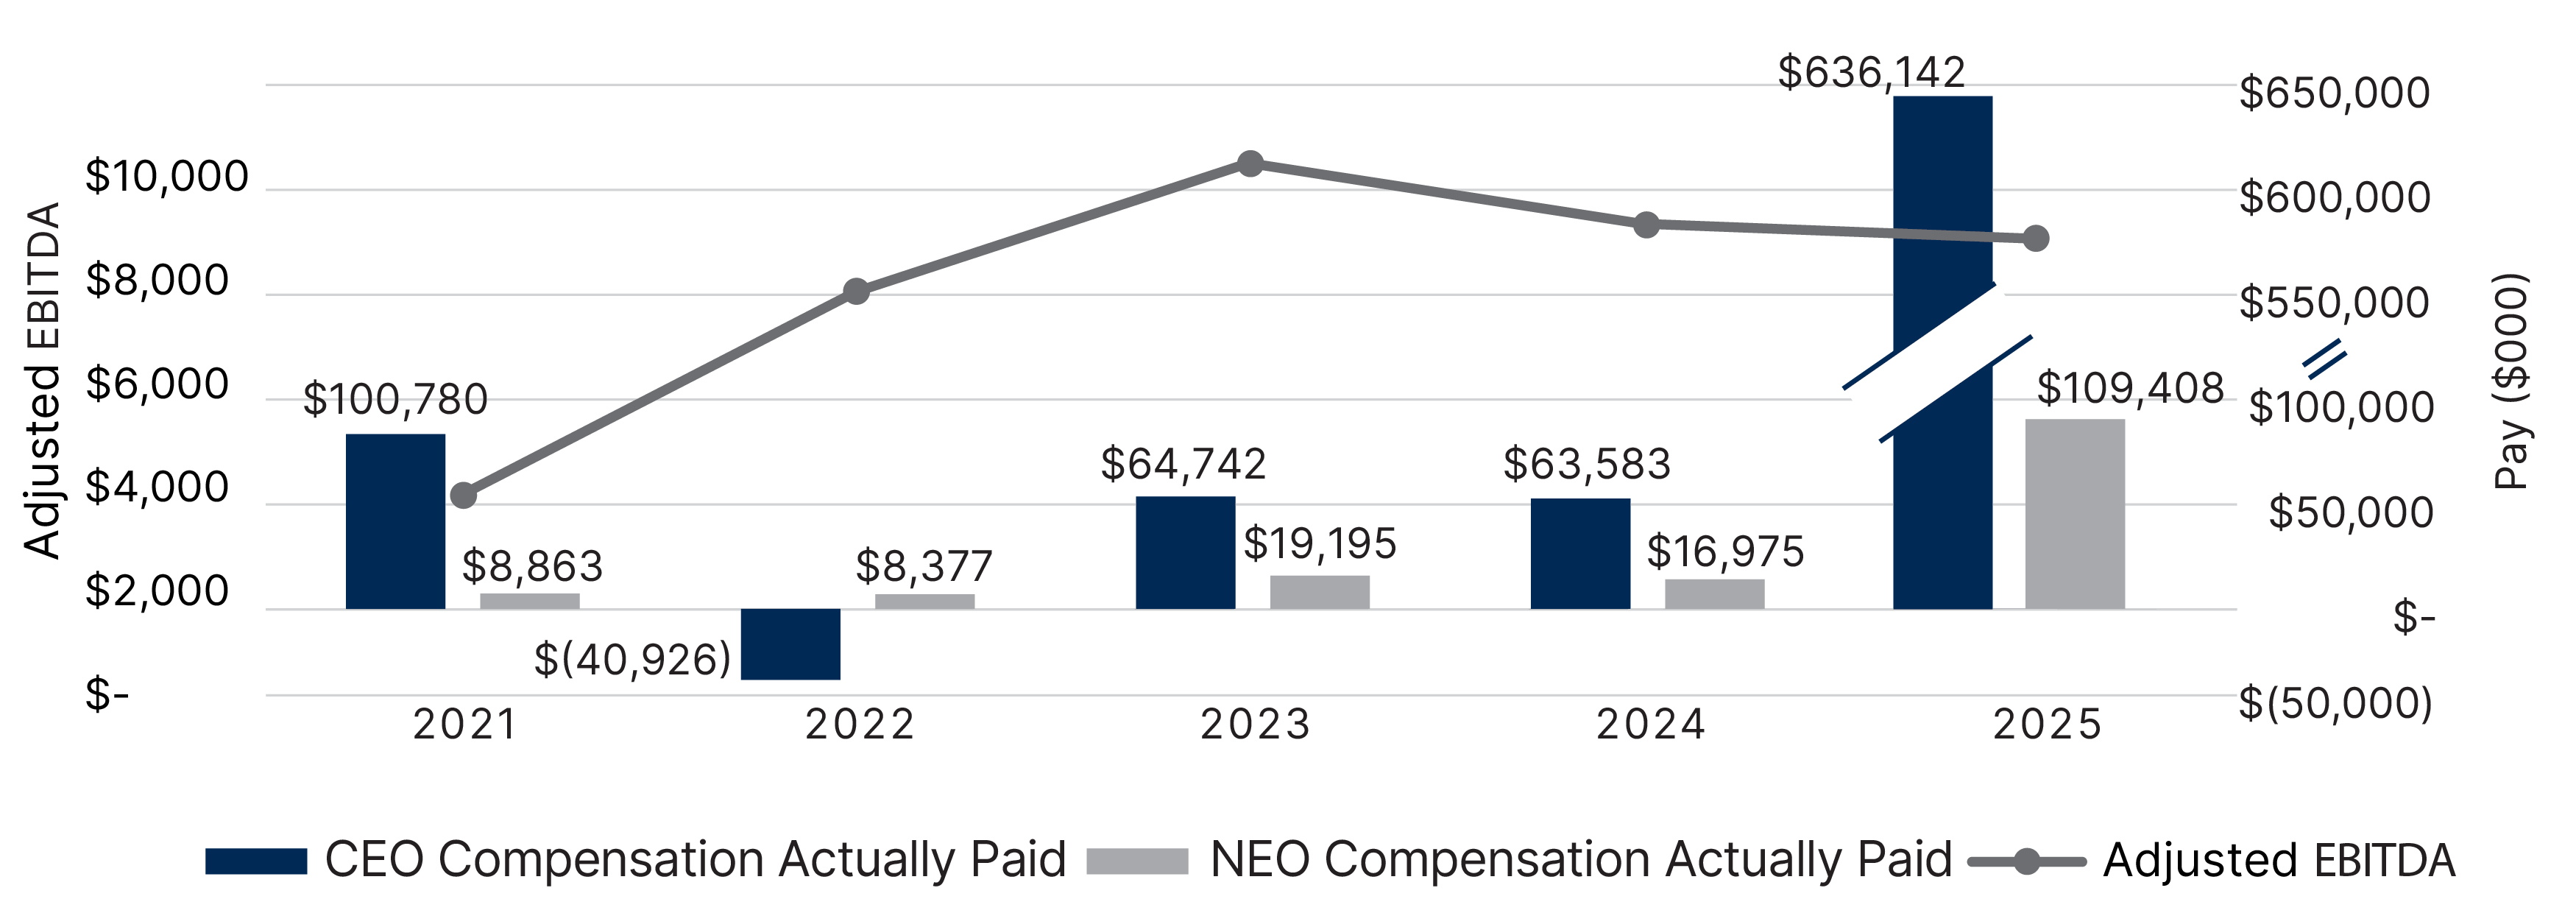
CEO and Average NEO CAP vs. Adjusted EBITDA (Non-GAAP)
2025 Most Important Performance Measures(1) | ||
| Adjusted EBITDA | ||
| Net Revenue | ||
| Free Cash Flow | ||
| Year-End Global Subscribers | ||
The following table reports the compensation of our CEO and the average compensation of the other non-CEO NEOs as reported in the Summary Compensation Table for the past five fiscal years, as well as Compensation Actually Paid ("CAP") as calculated under SEC Pay-Versus-Performance ("PVP") disclosure requirements and certain performance measures required by the rules. Dollar amounts reported as CAP are computed in accordance with Item 402(v) of Regulation S-K, and our Board believes that it is important to recognize that these amounts do not reflect the actual amount of compensation earned by or paid to our CEO and non-CEO NEOs during the applicable years.
Net Income is as reported in our Annual Report on Form 10-K for the applicable year.The following graphs illustrate the relationship between the CAP of our CEO and average non-CEO NEO ("Average NEO") and WBD's TSR, Net Income and Adjusted EBITDA performance over the five-year period from 2021 to 2025. The volatility in our stock price over the five-year period can be attributed to the impact of the WarnerMedia Transaction, the proposed separation and subsequent strategic review in 2025, and the pending Paramount merger, as well as other separate factors that were beyond our control. While the Committee believes that driving stock price appreciation and TSR performance are important objectives for our CEO and non-CEO NEOs, it also believes that achieving other financial objectives, such as Adjusted EBITDA and FCF, as well as achieving other strategic objectives, such as growing our Streaming business, are equally important and it has sought to align our executive compensation with these objectives, as further discussed in the CD&A in this proxy statement.
The five-year compensation history of the CEO and the average NEO shows that the disclosed CAP generally aligns with WBD's TSR, Net Income, and Adjusted EBITDA performance. The exceptions to this were: (a) the CEO's CAP in 2021 which includes the option grant made to Mr. Zaslav in connection with the signing of the WarnerMedia Transaction and his entry into the Zaslav 2021 Employment Agreement, and (b) the CEO's CAP in 2025 which includes the June 2025 option grant made to Mr. Zaslav in connection with the announcement of the proposed separation and his entry into the Zaslav 2025 Employment Agreement. All of the 2021 options awarded to Mr. Zaslav have a strike price that is higher than the current trading price of WBD common stock. If the 2021 and 2025 option grant were excluded, Mr. Zaslav's CAP in 2021 and 2025 would have been substantially lower and better aligned with TSR, Net Income, and Adjusted EBITDA performance for the five-year period.
Overall, the Committee believes the executive compensation program strikes an appropriate balance between incentivizing our executives based on performance, as well as utilizing market competitive pay practices. This is also evidenced by the performance metrics the Committee selected to link pay with performance as described in the section below. See our CD&A in this proxy statement for additional information regarding WBD's pay-for-performance philosophy.
Our executive compensation programs are designed to implement our pay-for-performance compensation philosophy. We strive to ensure a strong alignment between the interests of our stockholders and those of our executives. To align pay and performance, the Committee seeks to utilize metrics that will incentivize our executives to execute against our strategic priorities and deliver long-term sustainable growth. The metrics listed below are the performance measures the Committee deemed as most important for purposes of determining 2025 compensation as further described in our CD&A in this proxy statement. Adjusted EBITDA, Net Revenue and Year-End Global Subscribers were the financial metrics used in our 2025 cash bonus program for the CEO and the 2025 ICP. FCF was the financial metric used for the 2025 Annual PRSU awards and the Supplemental PRSU awards granted in 2025.
See "2025 Financial Metrics" beginning on page 54 for more information on Adjusted EBITDA, Net Revenue and Year-End Global Subscribers and page 65 for more information on FCF. Under Section 953(b) of the Dodd-Frank Wall Street Reform and Consumer Protection Act and Item 402(u) of Regulation S-K, we are required to provide the ratio of the annual total compensation of our CEO to the annual total compensation of the median-paid employee of the Company ("Median Employee"). Our 2025 CEO to Median Employee pay ratio was calculated in accordance with Item 402(u) of Regulation S-K, and represents a reasonable estimate.
For 2025, we reidentified our Median Employee as we are required to do every three years under the relevant SEC rules. To determine our employee population, we defined "employee" as any full-time, part-time or temporary individual employed and paid by us or any of our consolidated subsidiaries as of December 31, 2025. We did not include freelance workers, temporary individuals employed and paid by a third party or independent contractors. To identify the Median Employee from our employee population, we used base salary amounts as of December 31, 2025 as our consistently applied compensation measure. For employees paid in foreign currencies, we converted their base salary into U.S. dollar amounts using an exchange rate as of December 31, 2025. We then sorted the employees (excluding our CEO) by their U.S. dollar equivalent base salary amounts and thereby identified our Median Employee.
Using the same methodology we used for our NEOs (including our CEO) as set forth in the 2025 Summary Compensation Table resulted in our Median Employee having annual total compensation of $119,748. The 2025 annual total compensation for our CEO as disclosed in the 2025 Summary Compensation Table was $165,009,366. Therefore, the ratio of our CEO’s annual total compensation to the Median Employee’s annual total compensation was 1,378 to 1.
The CEO's annual total compensation for 2025 was significantly higher than in prior years primarily due to a one-time grant of stock options awarded in 2025 in connection with the Zaslav 2025 Employment Agreement. Excluding the value of this one-time grant, Mr. Zaslav's annual total compensation for 2025 would have been $55,416,185. Based on this adjusted amount, the ratio of our CEO's annual total compensation to the Median Employee's annual total compensation would have been 463 to 1.