Pay vs Performance Disclosure - USD ($)
Dec. 31, 2025
Dec. 31, 2024
Dec. 31, 2023
Dec. 31, 2022
Dec. 31, 2021
Pay Versus Performance
Pay Versus Performance Table
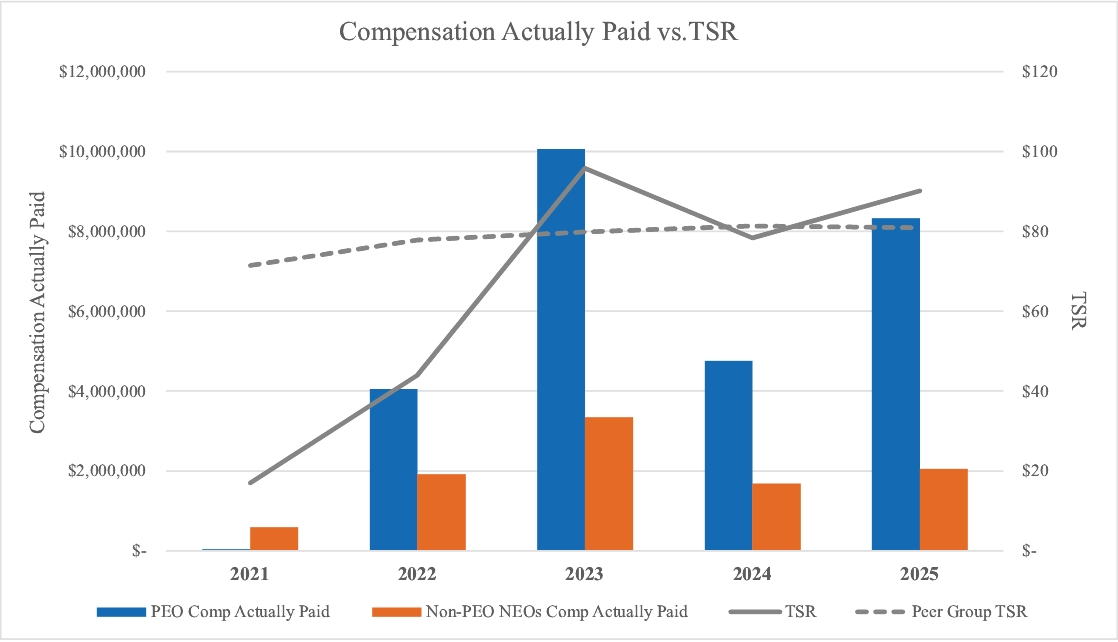
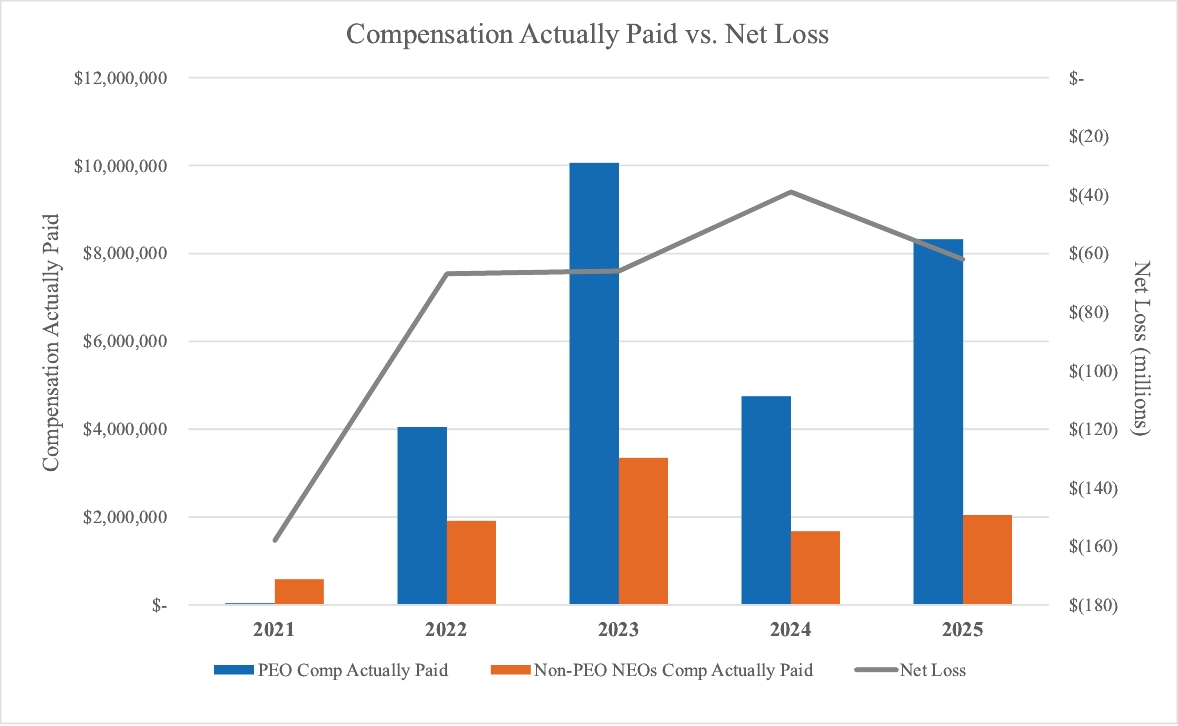
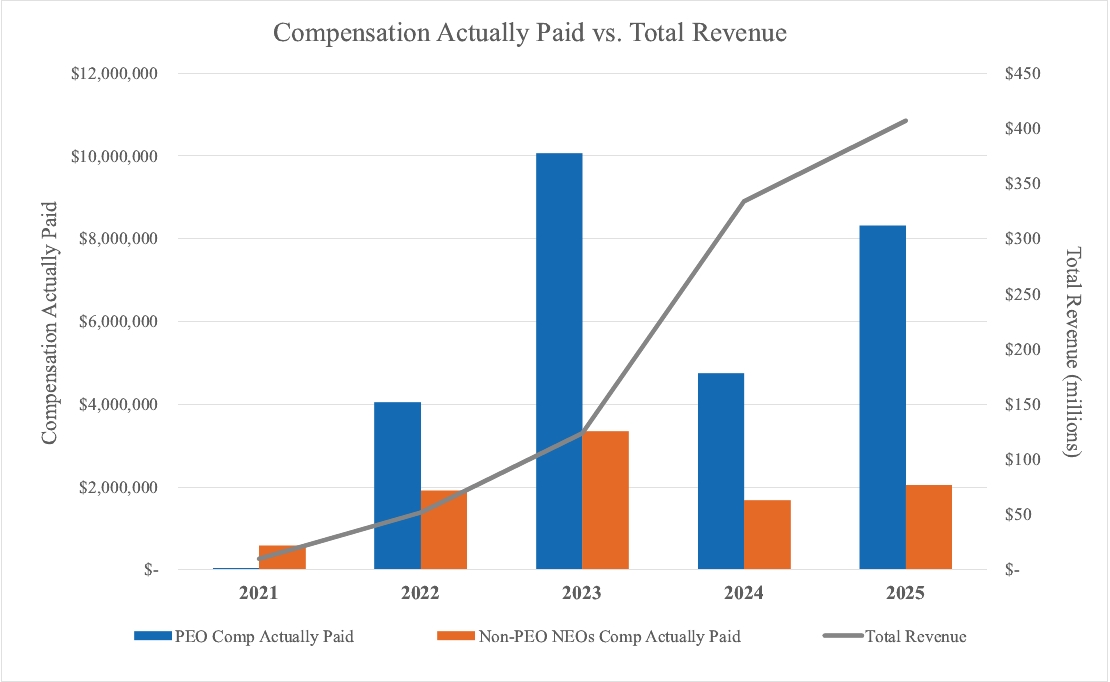
The following table sets forth information concerning the compensation provided to our NEOs and certain measures of Company performance in the years ended December 31, 2025, 2024, 2023, 2022 and 2021, for services to our Company in all capacities. The compensation and leadership development committee did not consider the pay versus performance disclosure below in making its pay decisions for any of the fiscal years shown.
Year | Summary Compensation Table Total for PEO ($) | Compensation Actually Paid to PEO ($)(1) | Average Summary Compensation Table Total for Non-PEO NEOs ($) | Average Compensation Actually Paid to Non-PEO NEOs ($)(1) | Value of Initial Fixed $100 Investment Based on Total Shareholder Return (“TSR”) ($)(2) | Peer Group TSR ($)(3) | Net Loss ($ in millions) | Total Revenue ($ in millions)(4) | ||||||||||||||||||
2025 | 7,796,171 | 8,322,670 | 3,085,821 | 2,048,110 | 90 | 81 | (62) | 407 | ||||||||||||||||||
2024 | 9,606,165 | 4,749,620 | 2,941,814 | 1,676,438 | 78 | 81 | (39) | 334 | ||||||||||||||||||
2023 | 4,113,194 | 10,055,709 | 1,626,676 | 3,344,278 | 96 | 80 | (66) | 124 | ||||||||||||||||||
2022 | 1,947,020 | 4,047,941 | 1,049,800 | 1,913,762 | 44 | 78 | (67) | 52 | ||||||||||||||||||
2021 | 4,230,994 | 39,202 | 1,700,013 | 584,783 | 17 | 71 | (158) | 10 | ||||||||||||||||||
(1) | Amounts represent compensation actually paid (“CAP”) to our CEO, Michael Raab, who was our Principal Executive Officer or “PEO” for each of the five years shown, and the average CAP to our remaining NEOs or “Non-PEO NEOs” for the relevant fiscal year, as determined under SEC rules, which includes Susan Hohenleitner, John Bishop, Ph.D., Elizabeth Grammer, Esq., Edward Conner, M.D., and Justin Renz for 2025; Justin Renz, Elizabeth Grammer, Esq., Laura Williams, M.D., M.P.H., and Michael Kelliher for 2024; Laura Williams, M.D., M.P.H. and Elizabeth Grammer, Esq. for 2023; Laura Williams, M.D., M.P.H. and Susan Rodriguez for 2022; and Justin Renz, Robert Blanks, Elizabeth Grammer, Esq. and David Rosenbaum, Ph.D. for 2021. |
Amounts represent the Summary Compensation Table Total Compensation for the applicable fiscal year adjusted as follows:
Fiscal Year (“FY”) | 2025 | |||||||
PEO ($) | Average non- PEO NEOs ($) | |||||||
2025 Summary Compensation Table Total | 7,796,171 | 3,085,821 | ||||||
Deduction for ASC 718 Fair Value as of Grant Date Reported under the Option Awards Columns in the Summary Compensation Table | (6,367,672) | (2,556,305) | ||||||
Increase based on ASC 718 Fair Value of Awards Granted during the FY that Remain Unvested as of FY End (“FYE”) | 5,060,845 | 1,334,577 | ||||||
Increase based on ASC 718 Fair Value of Awards Granted during the FY that Vested during the FY as of Vesting Date | 1,287,226 | 106,325 | ||||||
Increase based on ASC 718 Fair Value of Outstanding Unvested Prior FY Awards as of FYE Compared to Valuation as of Prior FYE | 144,661 | 8,435 | ||||||
Increase based on ASC 718 Fair Value of Prior FY Awards that Vested during the FY as of Vesting Date Compared to Valuation as of Prior FYE | 401,439 | 28,389 | ||||||
Deduction for Fair Value as of Prior FYE of Option Awards and Stock Awards Granted in Prior Fiscal Years that Failed to Meet Applicable Vesting Conditions during the FY | — | (206,125) | ||||||
Incremental Fair Value of Option Awards and Stock Awards that were Modified during the FY | — | 246,993 | ||||||
Total Adjustments | 526,500 | (1,037,711) | ||||||
Compensation Actually Paid | 8,322,670 | 2,048,110 | ||||||
(2) | Cumulative TSR is calculated by dividing the sum of the cumulative amount of dividends for the measurement period, assuming dividend reinvestment, and the difference between our Company’s share price at the end and the beginning of the measurement period by our Company’s share price at the beginning of the measurement period. No dividends were paid on our common stock in any of the years presented. |
(3) | Represents the weighted peer group TSR, weighted according to the respective companies’ stock market capitalization at the beginning of each period for which a return is indicated. For all years presented, the peer group used is the same peer group disclosed for the purposes of setting our 2025 executive compensation, as discussed under the “Use of Market Data” caption of the “Compensation Discussion and Analysis” section above. In our proxy statement for the fiscal year 2024, the peer group used was the same peer group disclosed under the “Use of Market Data” of the “Compensation Discussion and Analysis” section of this proxy. Had the fiscal year 2024 peer group been used instead, Peer Group TSR would have resulted in the following: 2025: $108, 2024: $105, 2023: $101, 2022: $103, 2021: $92. |
(4) | We have selected total revenue as the most important financial measure used by us to link compensation actually paid for 2025 to our performance since it is the financial measure with the largest impact on the cash bonuses we pay our NEOs. |
(1) | Amounts represent compensation actually paid (“CAP”) to our CEO, Michael Raab, who was our Principal Executive Officer or “PEO” for each of the five years shown, and the average CAP to our remaining NEOs or “Non-PEO NEOs” for the relevant fiscal year, as determined under SEC rules, which includes Susan Hohenleitner, John Bishop, Ph.D., Elizabeth Grammer, Esq., Edward Conner, M.D., and Justin Renz for 2025; Justin Renz, Elizabeth Grammer, Esq., Laura Williams, M.D., M.P.H., and Michael Kelliher for 2024; Laura Williams, M.D., M.P.H. and Elizabeth Grammer, Esq. for 2023; Laura Williams, M.D., M.P.H. and Susan Rodriguez for 2022; and Justin Renz, Robert Blanks, Elizabeth Grammer, Esq. and David Rosenbaum, Ph.D. for 2021. |
(3) | Represents the weighted peer group TSR, weighted according to the respective companies’ stock market capitalization at the beginning of each period for which a return is indicated. For all years presented, the peer group used is the same peer group disclosed for the purposes of setting our 2025 executive compensation, as discussed under the “Use of Market Data” caption of the “Compensation Discussion and Analysis” section above. In our proxy statement for the fiscal year 2024, the peer group used was the same peer group disclosed under the “Use of Market Data” of the “Compensation Discussion and Analysis” section of this proxy. Had the fiscal year 2024 peer group been used instead, Peer Group TSR would have resulted in the following: 2025: $108, 2024: $105, 2023: $101, 2022: $103, 2021: $92. |
(3) | Represents the weighted peer group TSR, weighted according to the respective companies’ stock market capitalization at the beginning of each period for which a return is indicated. For all years presented, the peer group used is the same peer group disclosed for the purposes of setting our 2025 executive compensation, as discussed under the “Use of Market Data” caption of the “Compensation Discussion and Analysis” section above. In our proxy statement for the fiscal year 2024, the peer group used was the same peer group disclosed under the “Use of Market Data” of the “Compensation Discussion and Analysis” section of this proxy. Had the fiscal year 2024 peer group been used instead, Peer Group TSR would have resulted in the following: 2025: $108, 2024: $105, 2023: $101, 2022: $103, 2021: $92. |
Amounts represent the Summary Compensation Table Total Compensation for the applicable fiscal year adjusted as follows:
Fiscal Year (“FY”) | 2025 | |||||||
PEO ($) | Average non- PEO NEOs ($) | |||||||
2025 Summary Compensation Table Total | 7,796,171 | 3,085,821 | ||||||
Deduction for ASC 718 Fair Value as of Grant Date Reported under the Option Awards Columns in the Summary Compensation Table | (6,367,672) | (2,556,305) | ||||||
Increase based on ASC 718 Fair Value of Awards Granted during the FY that Remain Unvested as of FY End (“FYE”) | 5,060,845 | 1,334,577 | ||||||
Increase based on ASC 718 Fair Value of Awards Granted during the FY that Vested during the FY as of Vesting Date | 1,287,226 | 106,325 | ||||||
Increase based on ASC 718 Fair Value of Outstanding Unvested Prior FY Awards as of FYE Compared to Valuation as of Prior FYE | 144,661 | 8,435 | ||||||
Increase based on ASC 718 Fair Value of Prior FY Awards that Vested during the FY as of Vesting Date Compared to Valuation as of Prior FYE | 401,439 | 28,389 | ||||||
Deduction for Fair Value as of Prior FYE of Option Awards and Stock Awards Granted in Prior Fiscal Years that Failed to Meet Applicable Vesting Conditions during the FY | — | (206,125) | ||||||
Incremental Fair Value of Option Awards and Stock Awards that were Modified during the FY | — | 246,993 | ||||||
Total Adjustments | 526,500 | (1,037,711) | ||||||
Compensation Actually Paid | 8,322,670 | 2,048,110 | ||||||
Tabular List of Financial Performance Measures
For 2025, the most important financial measures used to link compensation actually paid to our performance are as follows: (i) total revenue; (ii) net loss; and (iii) TSR.