v3.26.1
Pay vs Performance Disclosures - USD ($)
12 Months Ended
Dec. 31, 2025
Dec. 31, 2024
Dec. 31, 2023
Pay vs Performance Disclosure [Line Items]      
Pay vs Performance Disclosure, Table Pay Versus Performance Table

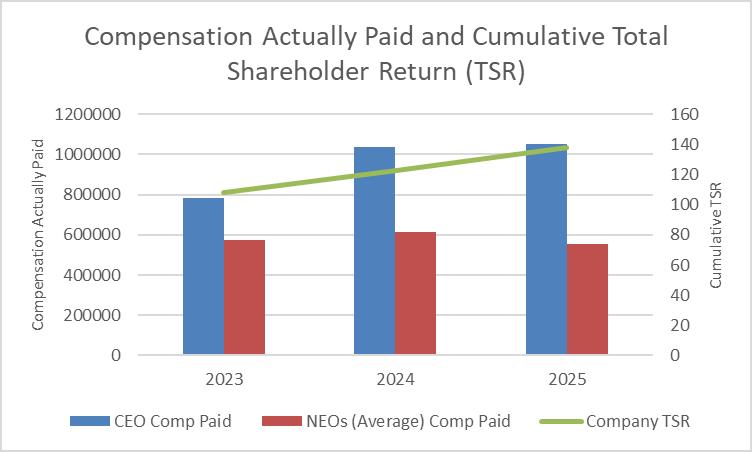
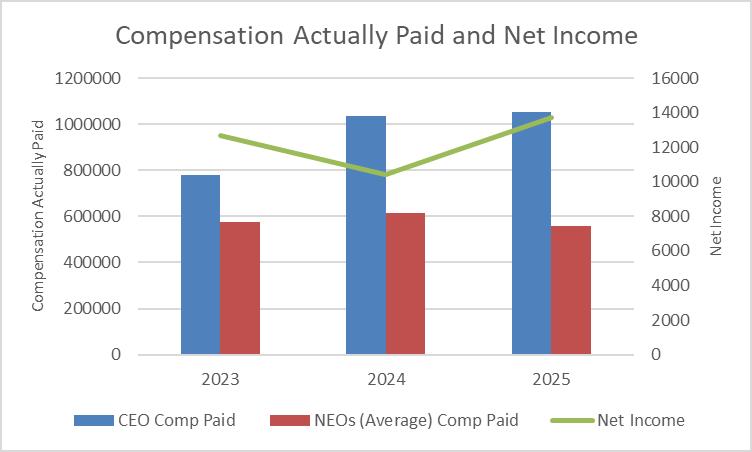
The table below shows the following information for the past three fiscal years: (i) “total” compensation for our named executive officers (“NEOs”) as reported in the Summary Compensation Table (“SCT”) above; (ii) the “compensation actually paid” to our named executive officers (calculated in accordance with SEC rules); (iii) our value of initial fixed $100 investment based on Total Shareholder Return; and (iv) our net income, followed by a table reconciling the total compensation disclosed in in the SCT and the compensation required to be disclosed as “compensation actually paid.” “Compensation actually paid” does not represent the value of cash and shares of the Company’s common stock received by NEOs during the year, but rather is an amount calculated under SEC rules and includes, among other things, the year-over-year changes in the value of unvested equity-based awards. As a result of the calculation methodology required by the SEC, “compensation actually paid” amounts below differ from compensation actually received by the individuals.

Year

Summary Compensation Table Total for CEO(1)

Compensation Actually Paid to CEO(2)

Average Summary Compensation Table Total for Other NEOs(1)

Average Compensation Actually Paid to Other NEOs(2)

Value of Initial Fixed $100 Investment Based on Total Shareholder Return(3)

Net Income (in thousands)

2025

$                 1,041,537 

$                1,053,288 

$                     553,013 

$               556,679 

$                      138 

$                          13,697 

2024

$                 1,004,496 

$                1,035,521 

$                     612,730 

$               614,486 

$                      123 

$                          10,440 

2023

$                    901,590 

$                   781,183 

$                     582,021 

$               574,323 

$                      108 

$                          12,656 

(1) The CEO for each year reported was David M. Lobach. Other NEOs for 2025 were Judith A. Hunsicker, Diane M. Cunningham, Lynne M. Neel and Jeffrey C. Skumin. Other NEOs for 2024 and 2023 were Judith A. Hunsicker, Diane M. Cunningham and Lynne M. Neel.

(2) SEC rules require certain adjustments be made to the SCT table to determine "compensation actually paid" as reported in the "Pay versus Performance Table" above. The following table details the applicable adjustments that were made to determine "compensation actually paid" (all amounts are averages for the NEOs other than the CEO).

(3) Total Shareholder Return is determined based on the value of an initial fixed investment of $100 on December 31, 2020.

   
Named Executive Officers, Footnote (1) The CEO for each year reported was David M. Lobach. Other NEOs for 2025 were Judith A. Hunsicker, Diane M. Cunningham, Lynne M. Neel and Jeffrey C. Skumin. Other NEOs for 2024 and 2023 were Judith A. Hunsicker, Diane M. Cunningham and Lynne M. Neel.    
PEO Total Compensation Amount $ 1,041,537 $ 1,004,496 $ 901,590
PEO Actually Paid Compensation Amount 1,053,288 1,035,521 781,183
Non-PEO NEO Average Total Compensation Amount 553,013 612,730 582,021
Non-PEO NEO Average Compensation Actually Paid Amount 556,679 614,486 574,323
Total Shareholder Return Amount 138 123 108
Net Income $ 13,697,000 $ 10,440,000 $ 12,656,000
PEO Name David M. Lobach David M. Lobach David M. Lobach
Adjustment To PEO Compensation, Footnote The following table sets forth the adjustments made during each year represented in the Pay Versus Performance table to determine “compensation actually paid” for the past three fiscal years, calculated in accordance with SEC rules.

Year

Named
Executives

SCT Total (1)

Deduct Stock Awards

Add Year-End Value of Unvested Equity Awards Granted in Year

Add Fair Value as of the Vesting Date for Awards Granted and Vested in Year

Change in Value of Unvested Equity Awards Granted in Prior Years

Change in Value of Equity Awards Granted in Prior Years Which Vested in Year

Deduct Value of Equity Awards Granted in Prior Years That Failed to Vest

Add Dividends

2025

CEO

$     1,041,537 

$     (61,687)

$             62,614 

$                   - 

$            5,731 

$              2,242 

$                    - 

$            2,851 

Other NEOs

$        553,013 

$     (20,222)

$             20,524 

$                   - 

$            1,492 

$              1,104 

$                    - 

$               769 

2024

CEO

$     1,004,496 

$     (80,964)

$             81,114 

$                   - 

$            5,204 

$            19,243 

$                    - 

$            6,428 

Other NEOs

$        612,730 

$     (26,449)

$             26,499 

$                   - 

$               683 

$                 563 

$                    - 

$               460 

2023

CEO

$        901,590 

$                 - 

$                      - 

$                   - 

$        (67,263)

$           (65,477)

$                    - 

$          12,333 

Other NEOs

$        582,021 

$                 - 

$                      - 

$                   - 

$          (4,287)

$             (4,309)

$                    - 

$               893 

(1) The SCT total for the CEO is actual vs. an average balance for the Other NEOs.

   
Adjustment to Non-PEO NEO Compensation Footnote

Year

Named
Executives

SCT Total (1)

Deduct Stock Awards

Add Year-End Value of Unvested Equity Awards Granted in Year

Add Fair Value as of the Vesting Date for Awards Granted and Vested in Year

Change in Value of Unvested Equity Awards Granted in Prior Years

Change in Value of Equity Awards Granted in Prior Years Which Vested in Year

Deduct Value of Equity Awards Granted in Prior Years That Failed to Vest

Add Dividends

2025

CEO

$     1,041,537 

$     (61,687)

$             62,614 

$                   - 

$            5,731 

$              2,242 

$                    - 

$            2,851 

Other NEOs

$        553,013 

$     (20,222)

$             20,524 

$                   - 

$            1,492 

$              1,104 

$                    - 

$               769 

2024

CEO

$     1,004,496 

$     (80,964)

$             81,114 

$                   - 

$            5,204 

$            19,243 

$                    - 

$            6,428 

Other NEOs

$        612,730 

$     (26,449)

$             26,499 

$                   - 

$               683 

$                 563 

$                    - 

$               460 

2023

CEO

$        901,590 

$                 - 

$                      - 

$                   - 

$        (67,263)

$           (65,477)

$                    - 

$          12,333 

Other NEOs

$        582,021 

$                 - 

$                      - 

$                   - 

$          (4,287)

$             (4,309)

$                    - 

$               893 

(1) The SCT total for the CEO is actual vs. an average balance for the Other NEOs.

   
Compensation Actually Paid vs. Total Shareholder Return  

Picture 1


Compensation Actually Paid vs. Net Income  

Picture 2


PEO | Equity Awards Adjustments, Excluding Value Reported in Compensation Table      
Pay vs Performance Disclosure [Line Items]      
Adjustment to Compensation Amount $ (61,687) $ (80,964)  
PEO | Year-end Fair Value of Equity Awards Granted in Covered Year that are Outstanding and Unvested      
Pay vs Performance Disclosure [Line Items]      
Adjustment to Compensation Amount 62,614 81,114  
PEO | Year-over-Year Change in Fair Value of Equity Awards Granted in Prior Years That are Outstanding and Unvested      
Pay vs Performance Disclosure [Line Items]      
Adjustment to Compensation Amount 5,731 5,204 $ (67,263)
PEO | Change in Fair Value as of Vesting Date of Prior Year Equity Awards Vested in Covered Year      
Pay vs Performance Disclosure [Line Items]      
Adjustment to Compensation Amount 2,242 19,243 (65,477)
PEO | Dividends or Other Earnings Paid on Equity Awards not Otherwise Reflected in Total Compensation for Covered Year      
Pay vs Performance Disclosure [Line Items]      
Adjustment to Compensation Amount 2,851 6,428 12,333
Non-PEO NEO | Equity Awards Adjustments, Excluding Value Reported in Compensation Table      
Pay vs Performance Disclosure [Line Items]      
Adjustment to Compensation Amount (20,222) (26,449)  
Non-PEO NEO | Year-end Fair Value of Equity Awards Granted in Covered Year that are Outstanding and Unvested      
Pay vs Performance Disclosure [Line Items]      
Adjustment to Compensation Amount 20,524 26,499  
Non-PEO NEO | Year-over-Year Change in Fair Value of Equity Awards Granted in Prior Years That are Outstanding and Unvested      
Pay vs Performance Disclosure [Line Items]      
Adjustment to Compensation Amount 1,492 683 (4,287)
Non-PEO NEO | Change in Fair Value as of Vesting Date of Prior Year Equity Awards Vested in Covered Year      
Pay vs Performance Disclosure [Line Items]      
Adjustment to Compensation Amount 1,104 563 (4,309)
Non-PEO NEO | Dividends or Other Earnings Paid on Equity Awards not Otherwise Reflected in Total Compensation for Covered Year      
Pay vs Performance Disclosure [Line Items]      
Adjustment to Compensation Amount $ 769 $ 460 $ 893