Pay vs Performance Disclosure
Dec. 31, 2025
USD ($)
$ / shares
Dec. 31, 2024
USD ($)
$ / shares
Item 402(v) Pay Versus Performance
The disclosure included in this section is prescribed by SEC rules and does not necessarily align with how the Company or the Compensation Committee view the link between the Company’s performance and named executive officer pay. For additional information about our pay for performance compensation philosophy and how we seek to align executive compensation with the Company’s performance, refer to “Executive and Director Compensation” beginning on page 27.
Required Tabular Disclosure of Pay Versus Performance
The table below shows compensation actually paid (as defined by the SEC in Item 402(v) of Regulation S-K) for our Named Executive Officers and the required financial performance measures for the years shown in the table. Use of the term “compensation actually paid” (“CAP”) is required by the SEC’s rules and as a result of the calculation methodology required by the SEC, these amounts differ from compensation actually received by the individuals and the compensation decisions described in the “Executive and Director Compensation” section above. For purposes of this discussion, our Chief Executive Officer is also referred to as our principal executive officer or “PEO” and our other Named Executive Officers are referred to as our “Non-PEO NEOs”.
Fiscal Year | Summary Compensation Table Total for PEO(1)(2) | Compensation Actually Paid to PEO(1)(3) | Average Summary Compensation Table Total for Non-PEO NEOs(1)(2) | Average Compensation Actually Paid to Non-PEO NEOs(1)(3) | Value of Initial Fixed $100 Investment Based on Total Stockholder Return(4) | Net Income (thousands)(5) | ||||||||||||
2025 | $7,682,601 | $28,074,511 | $2,766,588 | $7,003,714 | $200.75 | $(212,394) | ||||||||||||
2024 | $9,226,774 | $8,405,870 | $6,118,184 | $3,993,631 | $99.25 | $(292,963) | ||||||||||||
(1) | NEOs included in these columns reflect the following individuals: |
Year | PEO | Non-PEO NEOs | ||||
2025 | Clay Siegall, Ph.D. | Max Rosett, Robert Lechleider, M.D. | ||||
2024 | Clay Siegall, Ph.D. | Kinney Horn, Sandra G. Stoneman | ||||
(2) | Amounts reflect Summary Compensation Table Total Pay for our NEOs for each corresponding year. |
(3) | CAP has been calculated based on the requirements and methodology set forth in the applicable SEC rules (Item 402(v) of Regulation S-K). The CAP calculation includes the end-of-year value of awards granted within the fiscal year, the change in fair value from prior year end of vested awards and the change in the fair value of unvested awards granted in prior years, regardless of if, when, or at which intrinsic value they will actually vest. To calculate CAP the following amounts were deducted from and added to the total compensation number shown in the Summary Compensation Table (“SCT”): |
Fiscal Year 2025 Reconciliation of SCT Total to CAP* | PEO ($) | Average Non-PEO NEOs ($) | ||||
SCT Total | $7,682,601 | $2,766,588 | ||||
(Minus): Grant Date Fair Value of the “Option Awards” Column in the SCT for Applicable Fiscal Year | $6,272,810 | $1,760,307 | ||||
Plus: Add: Fair Value at Applicable Fiscal Year End of Awards Granted during Applicable Fiscal Year that Remain Unvested as of Applicable Fiscal Year End | $13,447,901 | $3,773,817 | ||||
Plus: Change in Fair Value from the end of the Prior Fiscal Year to the end of the Applicable Fiscal Year of Awards Granted during Prior Fiscal Years that were Outstanding and Unvested as of Applicable Fiscal Year End | $13,598,252 | $2,246,730 | ||||
Plus: Vesting Date Fair Value of Awards Granted during Prior Fiscal Years that Vested During Applicable Fiscal Year | $(381,433) | $(23,113) | ||||
CAP | $28,074,511 | $7,003,714 | ||||
* | For purposes of the above adjustments, the fair value of equity awards on the applicable date were determined in accordance with FASB’s ASC Topic 718, using valuation methodologies that are generally consistent with those used to determine the grant-date fair value for accounting purposes. |
The table below contains ranges of assumptions used in the valuation of outstanding equity awards for the relevant fiscal year(s). For more information, please see the notes to our financial statements in our Annual Report on Form 10-K and the footnotes to the Summary Compensation Table of this Proxy Statement.
Stock Options | Fiscal Year 2025 | ||
Expected Term | 5.31 – 6.08 years | ||
Strike Price | $6.26 - $18.32 | ||
Volatility | 84.38% - 89.48% | ||
Dividend Yield | 0.0% - 0.0% | ||
Risk-Free Interest Rate | 3.77% - 4.43% | ||
Fiscal Year 2024 Reconciliation of SCT Total to CAP* | PEO ($) | Average Non-PEO NEOs ($) | ||||
SCT Total | $9,226,774 | $6,118,184 | ||||
(Minus): Grant Date Fair Value of the “Option Awards” Column in the SCT for Applicable Fiscal Year | $7,991,424 | $5,461,078 | ||||
Plus: Add: Fair Value at Applicable Fiscal Year End of Awards Granted during Applicable Fiscal Year that Remain Unvested as of Applicable Fiscal Year End | $6,283,739 | $3,204,481 | ||||
Plus: Change in Fair Value from the end of the Prior Fiscal Year to the end of the Applicable Fiscal Year of Awards Granted during Prior Fiscal Years that were Outstanding and Unvested as of Applicable Fiscal Year End | $(274,448) | $(4,552) | ||||
Plus: Vesting Date Fair Value of Awards Granted during Prior Fiscal Years that Vested During Applicable Fiscal Year | $1,161,229 | $136,596 | ||||
CAP | $8,405,870 | $3,993,631 | ||||
* | For purposes of the above adjustments, the fair value of equity awards on the applicable date were determined in accordance with FASB’s ASC Topic 718, using valuation methodologies that are generally consistent with those used to determine the grant-date fair value for accounting purposes. |
The table below contains ranges of assumptions used in the valuation of outstanding equity awards for the relevant fiscal year(s). For more information, please see the notes to our financial statements in our Annual Report on Form 10-K and the footnotes to the Summary Compensation Table of this Proxy Statement.
Stock Options | Fiscal Year 2024 | ||
Expected Term | 5.31 – 6.08 years | ||
Strike Price | $11.01 – $25.45 | ||
Volatility | 83.77% - 87.00% | ||
Dividend Yield | 0.0% - 0.0% | ||
Risk-Free Interest Rate | 3.67% - 4.70% | ||
(4) | The amounts reflect the cumulative total stockholder return of our common stock at the end of each fiscal year. In each case, assume an initial investment of $100 on December 31, 2023, and reinvestment of dividends, if any. |
(5) | The amounts reported represent the net income reflected in the Company’s audited financial statements for the applicable fiscal year. |
(1) | NEOs included in these columns reflect the following individuals: |
Year | PEO | Non-PEO NEOs | ||||
2025 | Clay Siegall, Ph.D. | Max Rosett, Robert Lechleider, M.D. | ||||
2024 | Clay Siegall, Ph.D. | Kinney Horn, Sandra G. Stoneman | ||||
(3) | CAP has been calculated based on the requirements and methodology set forth in the applicable SEC rules (Item 402(v) of Regulation S-K). The CAP calculation includes the end-of-year value of awards granted within the fiscal year, the change in fair value from prior year end of vested awards and the change in the fair value of unvested awards granted in prior years, regardless of if, when, or at which intrinsic value they will actually vest. To calculate CAP the following amounts were deducted from and added to the total compensation number shown in the Summary Compensation Table (“SCT”): |
Fiscal Year 2025 Reconciliation of SCT Total to CAP* | PEO ($) | Average Non-PEO NEOs ($) | ||||
SCT Total | $7,682,601 | $2,766,588 | ||||
(Minus): Grant Date Fair Value of the “Option Awards” Column in the SCT for Applicable Fiscal Year | $6,272,810 | $1,760,307 | ||||
Plus: Add: Fair Value at Applicable Fiscal Year End of Awards Granted during Applicable Fiscal Year that Remain Unvested as of Applicable Fiscal Year End | $13,447,901 | $3,773,817 | ||||
Plus: Change in Fair Value from the end of the Prior Fiscal Year to the end of the Applicable Fiscal Year of Awards Granted during Prior Fiscal Years that were Outstanding and Unvested as of Applicable Fiscal Year End | $13,598,252 | $2,246,730 | ||||
Plus: Vesting Date Fair Value of Awards Granted during Prior Fiscal Years that Vested During Applicable Fiscal Year | $(381,433) | $(23,113) | ||||
CAP | $28,074,511 | $7,003,714 | ||||
* | For purposes of the above adjustments, the fair value of equity awards on the applicable date were determined in accordance with FASB’s ASC Topic 718, using valuation methodologies that are generally consistent with those used to determine the grant-date fair value for accounting purposes. |
Fiscal Year 2024 Reconciliation of SCT Total to CAP* | PEO ($) | Average Non-PEO NEOs ($) | ||||
SCT Total | $9,226,774 | $6,118,184 | ||||
(Minus): Grant Date Fair Value of the “Option Awards” Column in the SCT for Applicable Fiscal Year | $7,991,424 | $5,461,078 | ||||
Plus: Add: Fair Value at Applicable Fiscal Year End of Awards Granted during Applicable Fiscal Year that Remain Unvested as of Applicable Fiscal Year End | $6,283,739 | $3,204,481 | ||||
Plus: Change in Fair Value from the end of the Prior Fiscal Year to the end of the Applicable Fiscal Year of Awards Granted during Prior Fiscal Years that were Outstanding and Unvested as of Applicable Fiscal Year End | $(274,448) | $(4,552) | ||||
Plus: Vesting Date Fair Value of Awards Granted during Prior Fiscal Years that Vested During Applicable Fiscal Year | $1,161,229 | $136,596 | ||||
CAP | $8,405,870 | $3,993,631 | ||||
* | For purposes of the above adjustments, the fair value of equity awards on the applicable date were determined in accordance with FASB’s ASC Topic 718, using valuation methodologies that are generally consistent with those used to determine the grant-date fair value for accounting purposes. |
The table below contains ranges of assumptions used in the valuation of outstanding equity awards for the relevant fiscal year(s). For more information, please see the notes to our financial statements in our Annual Report on Form 10-K and the footnotes to the Summary Compensation Table of this Proxy Statement.
Stock Options | Fiscal Year 2025 | ||
Expected Term | 5.31 – 6.08 years | ||
Strike Price | $6.26 - $18.32 | ||
Volatility | 84.38% - 89.48% | ||
Dividend Yield | 0.0% - 0.0% | ||
Risk-Free Interest Rate | 3.77% - 4.43% | ||
The table below contains ranges of assumptions used in the valuation of outstanding equity awards for the relevant fiscal year(s). For more information, please see the notes to our financial statements in our Annual Report on Form 10-K and the footnotes to the Summary Compensation Table of this Proxy Statement.
Stock Options | Fiscal Year 2024 | ||
Expected Term | 5.31 – 6.08 years | ||
Strike Price | $11.01 – $25.45 | ||
Volatility | 83.77% - 87.00% | ||
Dividend Yield | 0.0% - 0.0% | ||
Risk-Free Interest Rate | 3.67% - 4.70% | ||
Relationship between CAP vs. Cumulative TSR of Company
The following chart illustrates the relationship between CAP for our PEO and the average CAP for our Non-PEO NEOs against the Company’s TSR:
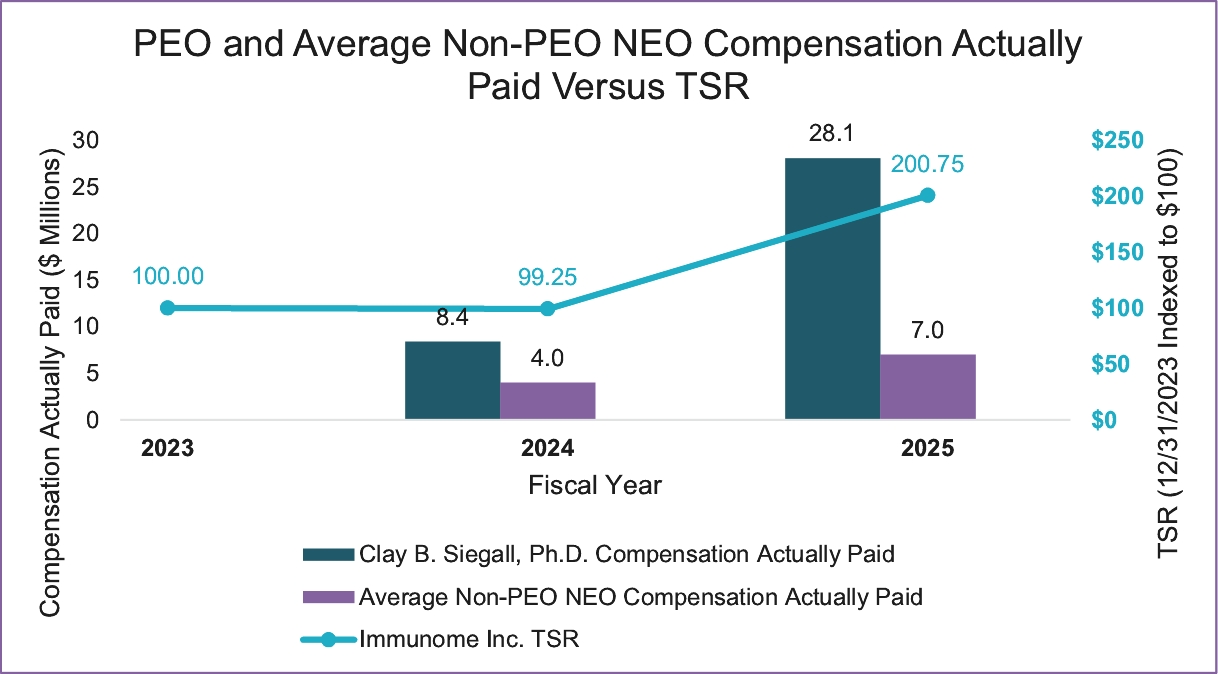
The increase in compensation actually paid in 2025 primarily reflects the appreciation in the Company’s stock price during the year, which increased the value of equity awards previously granted to our Named Executive Officers. As a result, the change in compensation actually paid is aligned with the Company’s total stockholder return and reflects the intended performance-based nature of our compensation program.
Relationship between CAP vs. Net Income
The following chart illustrates the relationship between CAP for our PEO and the average CAP for our Non-PEO NEOs against the Company’s net income: