Pay-Versus-Performance
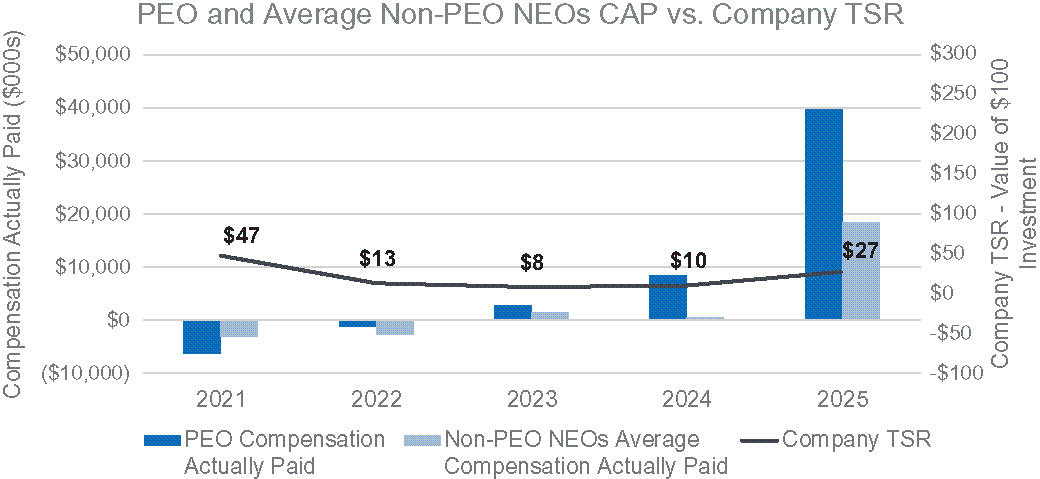
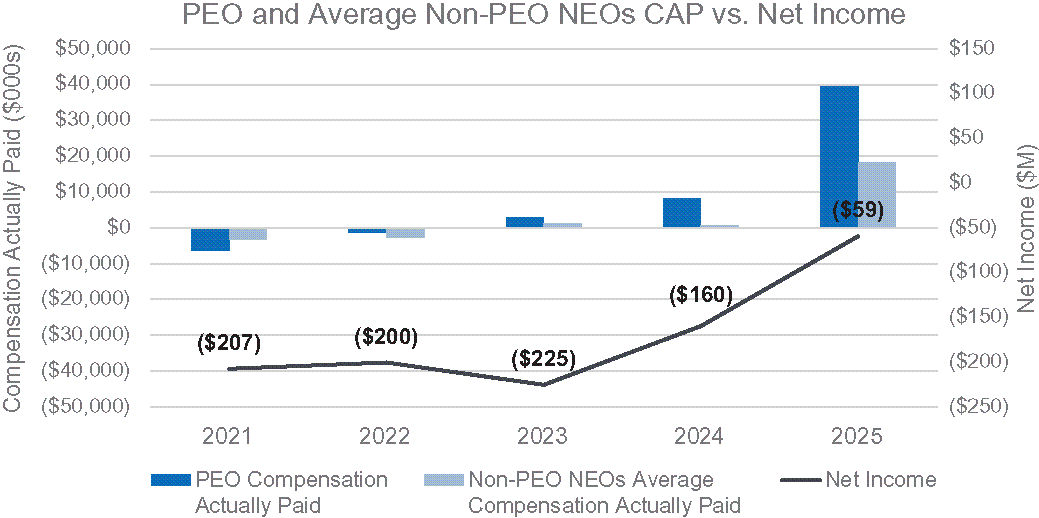
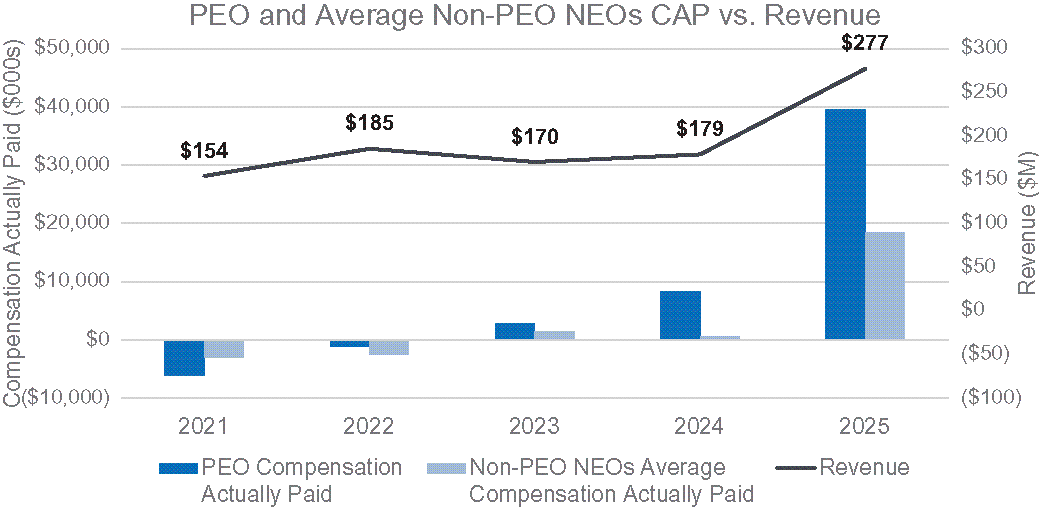
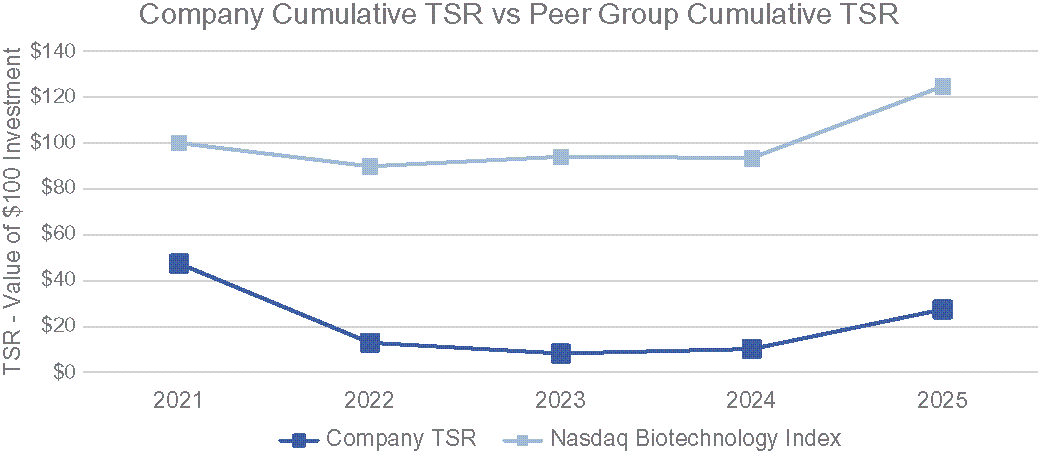
The following table reports the compensation of our Principal Executive Officer (“PEO”) and the average compensation of the non-PEO NEOs as reported in the “Summary Compensation Table” table (“SCT”) in our proxy statements for the past five fiscal years, as well as Compensation Actually Paid (“CAP”) as calculated under SEC Pay-Versus-Performance (“PVP”) rules and certain performance measures required by the rules. The disclosure covers our five most recent fiscal years. Dollar amounts reported as CAP are computed in accordance with Item 402(v) of Regulation S-K, and these amounts do not reflect the actual amount of compensation earned by or paid to our PEO and other NEOs during the applicable years.
|
|
|
|
|
|
|
|
|
|
|
|
|
|
Value of Initial Fixed $100 |
|
|
|
|
|
|
|
|||||||||||
Year(1) |
|
SCT Total for PEO |
|
|
Compensation Actually Paid to PEO(2) |
|
|
Average SCT Total for Non-PEO NEOs |
|
|
Average Compensation Actually Paid to Non-PEO NEOs(2) |
|
|
Total Shareholder Return |
|
|
Peer Group Total Shareholder Return(3) |
|
|
Net Income |
|
|
Revenue(4) |
|
||||||||
(a) |
|
(b) |
|
|
(c) |
|
|
(d) |
|
|
(e) |
|
|
(f) |
|
|
(g) |
|
|
(h) |
|
|
(i) |
|
||||||||
2025 |
|
$ |
9,081,690 |
|
|
$ |
39,597,875 |
|
|
$ |
4,992,964 |
|
|
$ |
18,380,619 |
|
|
$ |
27 |
|
|
$ |
125 |
|
|
$ |
(59,457 |
) |
|
$ |
276,976 |
|
2024 |
|
|
4,973,301 |
|
|
|
8,354,482 |
|
|
|
2,387,776 |
|
|
|
569,712 |
|
|
|
10 |
|
|
|
93 |
|
|
|
(159,595 |
) |
|
|
178,957 |
|
2023 |
|
|
8,904,267 |
|
|
|
2,745,457 |
|
|
|
4,257,240 |
|
|
|
1,361,275 |
|
|
|
8 |
|
|
|
94 |
|
|
|
(225,304 |
) |
|
|
170,276 |
|
2022 |
|
|
8,853,328 |
|
|
|
(1,144,530 |
) |
|
|
4,316,929 |
|
|
|
(2,584,615 |
) |
|
|
13 |
|
|
|
90 |
|
|
|
(200,368 |
) |
|
|
185,308 |
|
2021 |
|
|
8,751,617 |
|
|
|
(6,175,537 |
) |
|
|
5,865,883 |
|
|
|
(3,112,380 |
) |
|
|
47 |
|
|
|
100 |
|
|
|
(207,298 |
) |
|
|
154,344 |
|
Biographical information for each of these individuals and their positions can be found above, or in the proxy for the year upon which compensation was reported, under the heading “Executive Officers.”
|
|
2025 |
|
|
2024 |
|
|
2023 |
|
|
2022 |
|
|
2021 |
|
|||||||||||||||||||||||||
|
|
PEO |
|
|
Average for non-PEO NEOs |
|
|
PEO |
|
|
Average for non-PEO NEOs |
|
|
PEO |
|
|
Average for non-PEO NEOs |
|
|
PEO |
|
|
Average for non-PEO NEOs |
|
|
PEO |
|
|
Average for non-PEO NEOs |
|
||||||||||
Summary Compensation Table |
|
$ |
9,081,690 |
|
|
$ |
4,992,964 |
|
|
$ |
4,973,301 |
|
|
$ |
2,387,776 |
|
|
$ |
8,904,267 |
|
|
$ |
4,257,240 |
|
|
$ |
8,853,328 |
|
|
$ |
4,316,929 |
|
|
$ |
8,751,617 |
|
|
$ |
5,865,883 |
|
Adjustments |
|
|
|
|
|
|
|
|
|
|
|
|
|
|
|
|
|
|
|
|
|
|
|
|
|
|
|
|
|
|
||||||||||
Deduction for Amounts Reported Under the “Stock Awards” and “Option Awards” Columns of the Summary Compensation Table(a) |
|
|
(7,675,100 |
) |
|
|
(4,260,604 |
) |
|
|
(3,716,313 |
) |
|
|
(1,791,706 |
) |
|
|
(7,900,711 |
) |
|
|
(3,600,176 |
) |
|
|
(7,668,040 |
) |
|
|
(3,816,562 |
) |
|
|
(7,592,784 |
) |
|
|
(5,261,470 |
) |
Increase (Decrease) for the Inclusion of Item 402(v) Equity Values |
|
|
|
|
|
|
|
|
|
|
|
|
|
|
|
|
|
|
|
|
|
|
|
|
|
|
|
|
|
|
||||||||||
Year-End Fair Value of Equity Awards Granted During Year That Remained Unvested as of Last Day of Year |
|
|
16,122,275 |
|
|
|
8,906,197 |
|
|
|
5,928,967 |
|
|
|
2,924,160 |
|
|
|
3,859,556 |
|
|
|
1,929,580 |
|
|
|
4,260,108 |
|
|
|
3,475,247 |
|
|
|
4,773,662 |
|
|
|
3,685,849 |
|
Change in Fair Value from Last Day of Prior Year to Last Day of Year of Unvested Equity Awards |
|
|
20,797,691 |
|
|
|
8,191,893 |
|
|
|
1,345,301 |
|
|
|
466,245 |
|
|
|
(2,116,270 |
) |
|
|
(1,152,972 |
) |
|
|
(3,341,668 |
) |
|
|
(1,728,734 |
) |
|
|
(7,548,036 |
) |
|
|
(4,771,395 |
) |
Change in Fair Value of Prior Years’ Equity Awards that Vested During the Year |
|
|
1,271,319 |
|
|
|
550,169 |
|
|
|
(176,774 |
) |
|
|
(139,436 |
) |
|
|
(1,385 |
) |
|
|
(72,397 |
) |
|
|
(3,248,258 |
) |
|
|
(1,519,418 |
) |
|
|
(4,559,996 |
) |
|
|
(2,631,247 |
) |
Change in Value of Prior Years’ Equity Awards that Forfeited During the Year |
|
|
— |
|
|
|
— |
|
|
|
— |
|
|
|
(3,277,327 |
) |
|
|
— |
|
|
|
— |
|
|
|
— |
|
|
|
(3,312,077 |
) |
|
|
— |
|
|
|
— |
|
Compensation Actually Paid |
|
$ |
39,597,875 |
|
|
$ |
18,380,619 |
|
|
$ |
8,354,482 |
|
|
$ |
569,712 |
|
|
$ |
2,745,457 |
|
|
$ |
1,361,275 |
|
|
$ |
(1,144,530 |
) |
|
$ |
(2,584,615 |
) |
|
$ |
(6,175,537 |
) |
|
$ |
(3,112,380 |
) |
|
|
2025 |
|
|
2024 |
|
|
2023 |
|
|
2022 |
|
|
2021 |
|
|||||||||||||||||||||||||
|
|
PEO |
|
|
Average for non-PEO NEOs |
|
|
PEO |
|
|
Average for non-PEO NEOs |
|
|
PEO |
|
|
Average for non-PEO NEOs |
|
|
PEO |
|
|
Average for non-PEO NEOs |
|
|
PEO |
|
|
Average for non-PEO NEOs |
|
||||||||||
Summary Compensation Table |
|
$ |
9,081,690 |
|
|
$ |
4,992,964 |
|
|
$ |
4,973,301 |
|
|
$ |
2,387,776 |
|
|
$ |
8,904,267 |
|
|
$ |
4,257,240 |
|
|
$ |
8,853,328 |
|
|
$ |
4,316,929 |
|
|
$ |
8,751,617 |
|
|
$ |
5,865,883 |
|
Adjustments |
|
|
|
|
|
|
|
|
|
|
|
|
|
|
|
|
|
|
|
|
|
|
|
|
|
|
|
|
|
|
||||||||||
Deduction for Amounts Reported Under the “Stock Awards” and “Option Awards” Columns of the Summary Compensation Table(a) |
|
|
(7,675,100 |
) |
|
|
(4,260,604 |
) |
|
|
(3,716,313 |
) |
|
|
(1,791,706 |
) |
|
|
(7,900,711 |
) |
|
|
(3,600,176 |
) |
|
|
(7,668,040 |
) |
|
|
(3,816,562 |
) |
|
|
(7,592,784 |
) |
|
|
(5,261,470 |
) |
Increase (Decrease) for the Inclusion of Item 402(v) Equity Values |
|
|
|
|
|
|
|
|
|
|
|
|
|
|
|
|
|
|
|
|
|
|
|
|
|
|
|
|
|
|
||||||||||
Year-End Fair Value of Equity Awards Granted During Year That Remained Unvested as of Last Day of Year |
|
|
16,122,275 |
|
|
|
8,906,197 |
|
|
|
5,928,967 |
|
|
|
2,924,160 |
|
|
|
3,859,556 |
|
|
|
1,929,580 |
|
|
|
4,260,108 |
|
|
|
3,475,247 |
|
|
|
4,773,662 |
|
|
|
3,685,849 |
|
Change in Fair Value from Last Day of Prior Year to Last Day of Year of Unvested Equity Awards |
|
|
20,797,691 |
|
|
|
8,191,893 |
|
|
|
1,345,301 |
|
|
|
466,245 |
|
|
|
(2,116,270 |
) |
|
|
(1,152,972 |
) |
|
|
(3,341,668 |
) |
|
|
(1,728,734 |
) |
|
|
(7,548,036 |
) |
|
|
(4,771,395 |
) |
Change in Fair Value of Prior Years’ Equity Awards that Vested During the Year |
|
|
1,271,319 |
|
|
|
550,169 |
|
|
|
(176,774 |
) |
|
|
(139,436 |
) |
|
|
(1,385 |
) |
|
|
(72,397 |
) |
|
|
(3,248,258 |
) |
|
|
(1,519,418 |
) |
|
|
(4,559,996 |
) |
|
|
(2,631,247 |
) |
Change in Value of Prior Years’ Equity Awards that Forfeited During the Year |
|
|
— |
|
|
|
— |
|
|
|
— |
|
|
|
(3,277,327 |
) |
|
|
— |
|
|
|
— |
|
|
|
— |
|
|
|
(3,312,077 |
) |
|
|
— |
|
|
|
— |
|
Compensation Actually Paid |
|
$ |
39,597,875 |
|
|
$ |
18,380,619 |
|
|
$ |
8,354,482 |
|
|
$ |
569,712 |
|
|
$ |
2,745,457 |
|
|
$ |
1,361,275 |
|
|
$ |
(1,144,530 |
) |
|
$ |
(2,584,615 |
) |
|
$ |
(6,175,537 |
) |
|
$ |
(3,112,380 |
) |
Performance Metrics |
||
Revenue |
|
Refer to “Incentive Compensation and 2025 Goals Achievement” under “Compensation Discussion and Analysis-Elements of Executive Compensation” |
Operating Expenses |
|
Refer to “Incentive Compensation and 2025 Goals Achievement” under “Compensation Discussion and Analysis-Elements of Executive Compensation” |
TSR |
|
Refer to “Long-Term Equity Incentive Awards” under “Compensation Discussion and Analysis-Elements of Executive Compensation” |