Pay vs Performance Disclosure - USD ($)
Dec. 31, 2025
Dec. 31, 2024
Dec. 31, 2023
Dec. 31, 2022
Dec. 31, 2021
2021 |
2022 |
2023 |
2024 |
2025 |
||||||||||||||||||||||||||||||||||||
Adjustments |
PEO ($) |
Average Non- PEO NEOs ($) |
PEO ($) |
Average Non- PEO NEOs ($) |
PEO ($) |
Average Non- PEO NEOs ($) |
PEO ($) |
Average Non- PEO NEOs ($) |
PEO ($) |
Average Non- PEO NEOs ($) |
||||||||||||||||||||||||||||||
Reported Summary Compensation Table Total |
6,091,584 | 1,741,895 | 6,652,517 | 2,414,421 | 8,219,499 | 3,259,707 | 8,481,297 | 3,615,003 | 8,552,721 | 2,844,468 | ||||||||||||||||||||||||||||||
Deduction for Amounts Reported under the “Stock Awards” and “Option Awards” Columns in the Summary Compensation Table for Applicable FY |
(4,047,334) | (977,678) | (4,129,117) | (1,352,381) | (4,519,499) | (1,506,507) | (4,781,297) | (1,711,203) | (5,026,721) | (1,005,348) | ||||||||||||||||||||||||||||||
Increase based on ASC 718 Fair Value of Awards Granted during Applicable FY that Remain Unvested as of Applicable FY End, determined as of Applicable FY End |
3,790,585 | 681,645 | 4,071,408 | 1,241,284 | 4,467,554 | 1,489,191 | 4,819,753 | 1,724,966 | 5,029,802 | 1,005,965 | ||||||||||||||||||||||||||||||
Increase based on ASC 718 Fair Value of Awards Granted during Applicable FY that Vested during Applicable FY, determined as of Vesting Date |
– | 193,896 | – | 74,929 | – | – | – | – | – | – | ||||||||||||||||||||||||||||||
Increase/deduction for Awards Granted during Prior FY that were Outstanding and Unvested as of Applicable FY End, determined based on change in ASC 718 Fair Value from Prior FY End to Applicable FY End |
(2,169,499) | (533,341) | 629,203 | 159,830 | 3,237,237 | 923,533 | 4,971,111 | 1,576,975 | 2,710,311 | 930,154 | ||||||||||||||||||||||||||||||
Increase/deduction for Awards Granted during Prior FY that Vested During Applicable FY, determined based on change in ASC 718 Fair Value from Prior FY End to Vesting Date |
(2,532,752) | (658,774) | 64,767 | 12,346 | 807,631 | 195,306 | 853,783 | 238,803 | 1,431,635 | 439,259 | ||||||||||||||||||||||||||||||
Deduction of ASC 718 Fair Value of Awards Granted during Prior FY that were Forfeited during Applicable FY, determined as of Prior FY End |
– | – | – | – | – | – | – | – | – | – | ||||||||||||||||||||||||||||||
Increase based on Dividends or Other Earnings Paid during Applicable FY prior to Vesting Date |
– | – | – | – | – | – | – | – | – | – | ||||||||||||||||||||||||||||||
Increase based on Incremental Fair Value of Options/SARs Modified during Applicable FY |
– | – | – | – | – | – | – | – | – | – | ||||||||||||||||||||||||||||||
TOTAL ADJUSTMENTS |
(4,959,000) | (1,294,252) | 636,261 | 136,008 | 3,992,923 | 1,101,523 | 5,863,350 | 1,829,541 | 4,145,027 | 1,370,030 | ||||||||||||||||||||||||||||||
COMPENSATION ACTUALLY PAID |
1,132,584 |
447,643 |
7,288,778 |
2,550,429 |
12,212,422 |
4,361,230 |
14,344,647 |
5,444,544 |
12,697,748 |
4,214,498 |
||||||||||||||||||||||||||||||
| (3) | The following are our non-Chief Executive Officer Named Executive Officers for each of the years reflected in the table above: |
2025: Talya Nevo-Hacohen and Michael L. Costa |
2024: Talya Nevo-Hacohen and Michael L. Costa |
2023: Talya Nevo-Hacohen and Michael L. Costa |
2022: Talya Nevo-Hacohen and Michael L. Costa |
2021: Talya Nevo-Hacohen, Michael L. Costa and Harold Andrews |
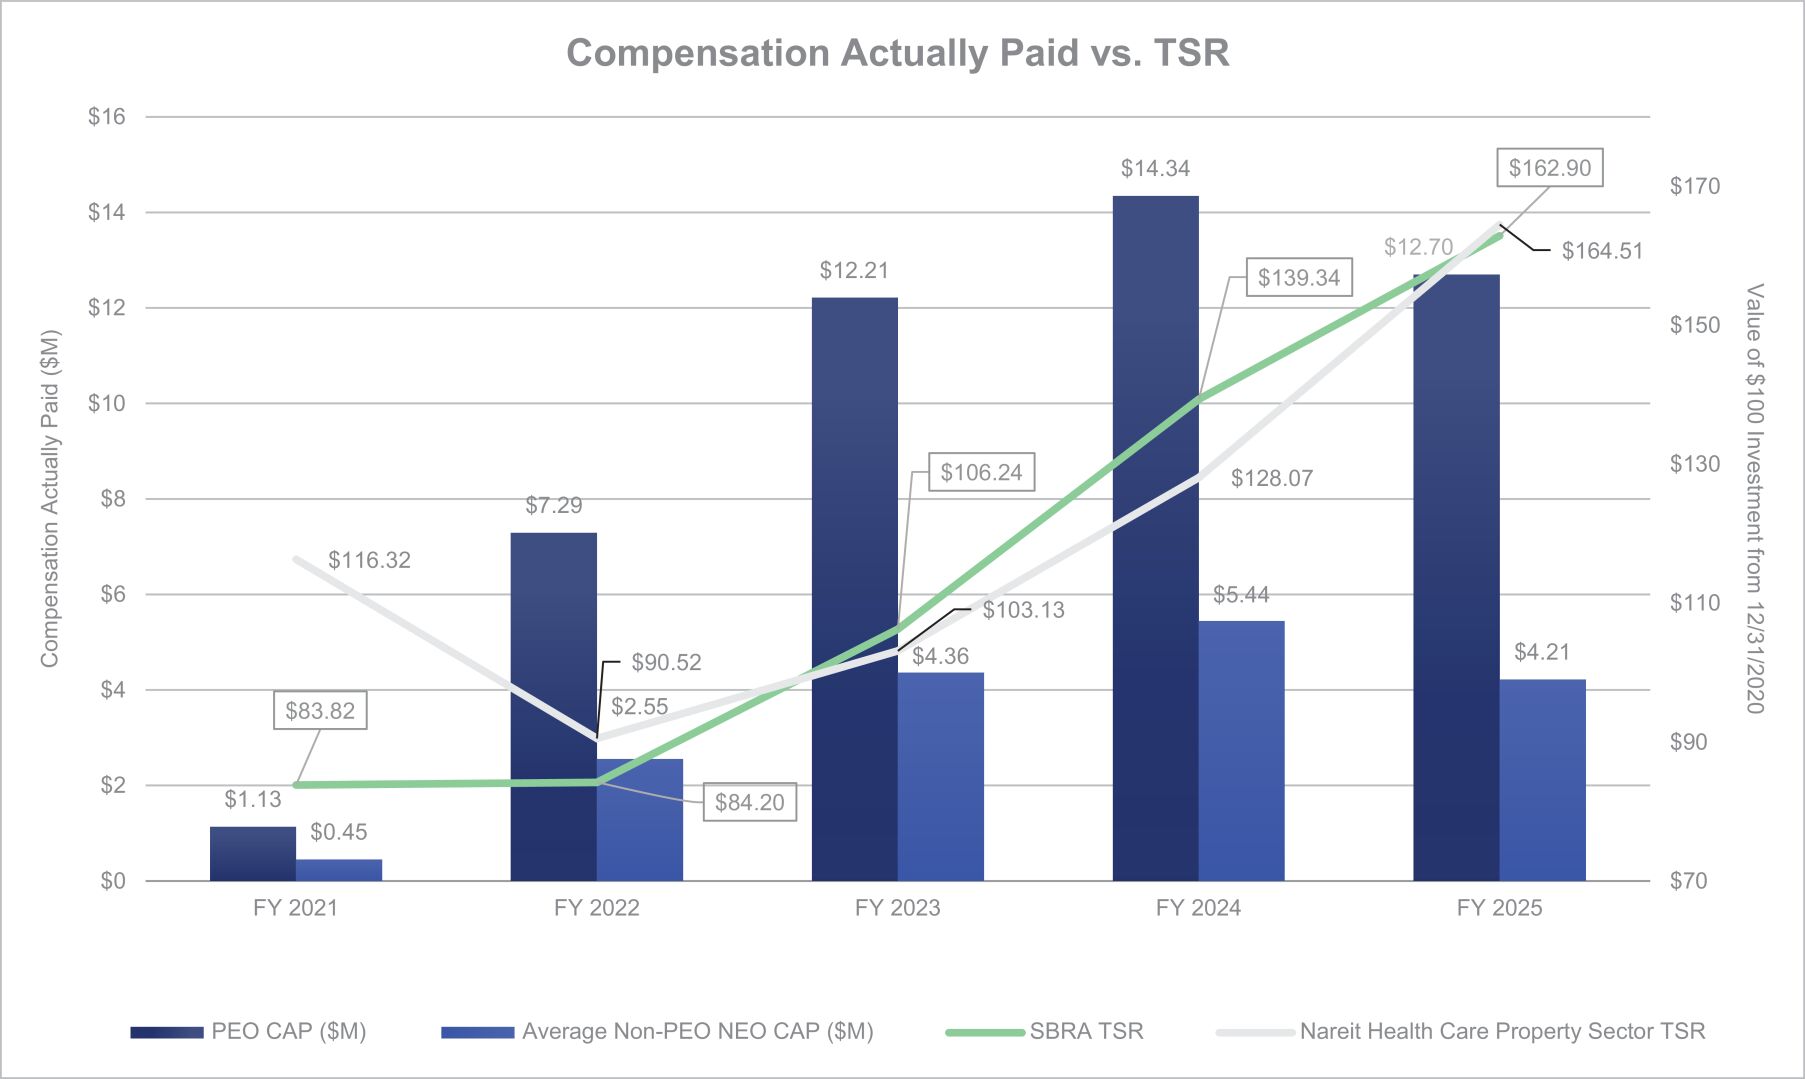
| (4) | Cumulative total shareholder return is calculated by dividing the sum of the cumulative amount of dividends for the measurement period, assuming dividend reinvestment, and the difference between Sabra’s share price at the end and the beginning of the measurement period by Sabra’s share price at the beginning of the measurement period. |
| (5) | Peer group used for this purpose is the following published industry index: Nareit Health Care Property Sector Total Return Index. |
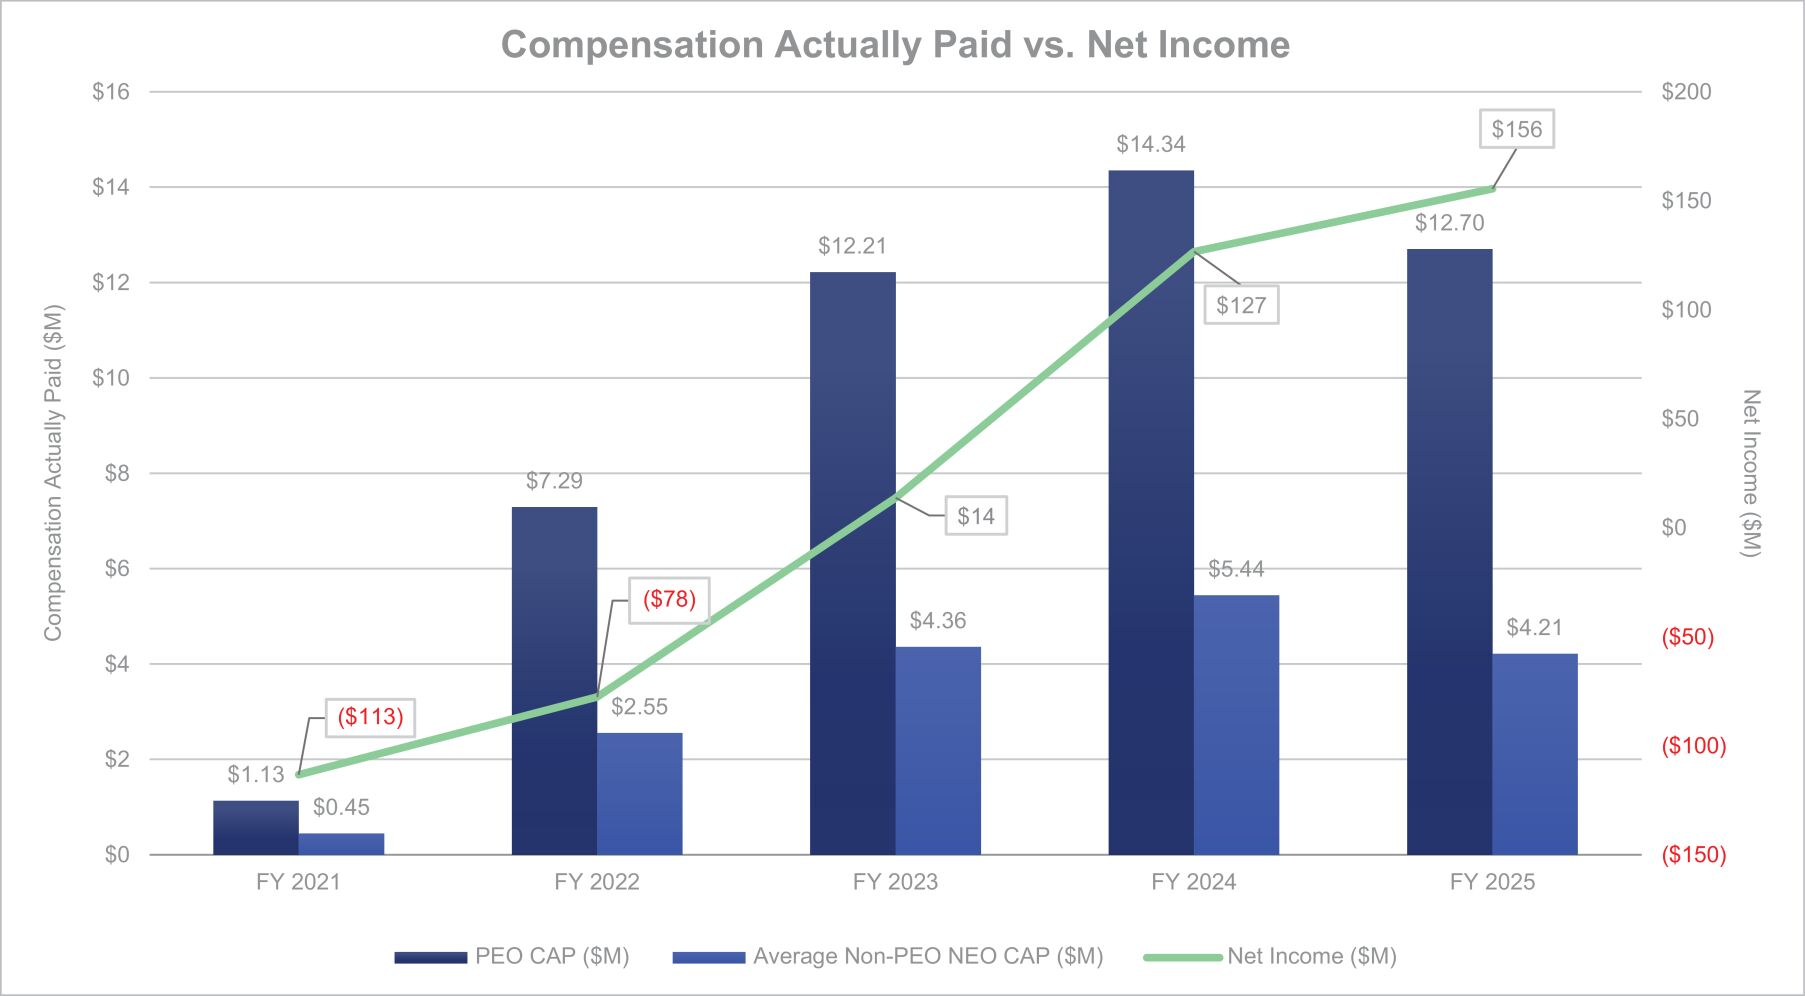
| (6) | The dollar amounts reported represent the amount of net income in millions reflected in the Company’s audited financial statements for the applicable year. |
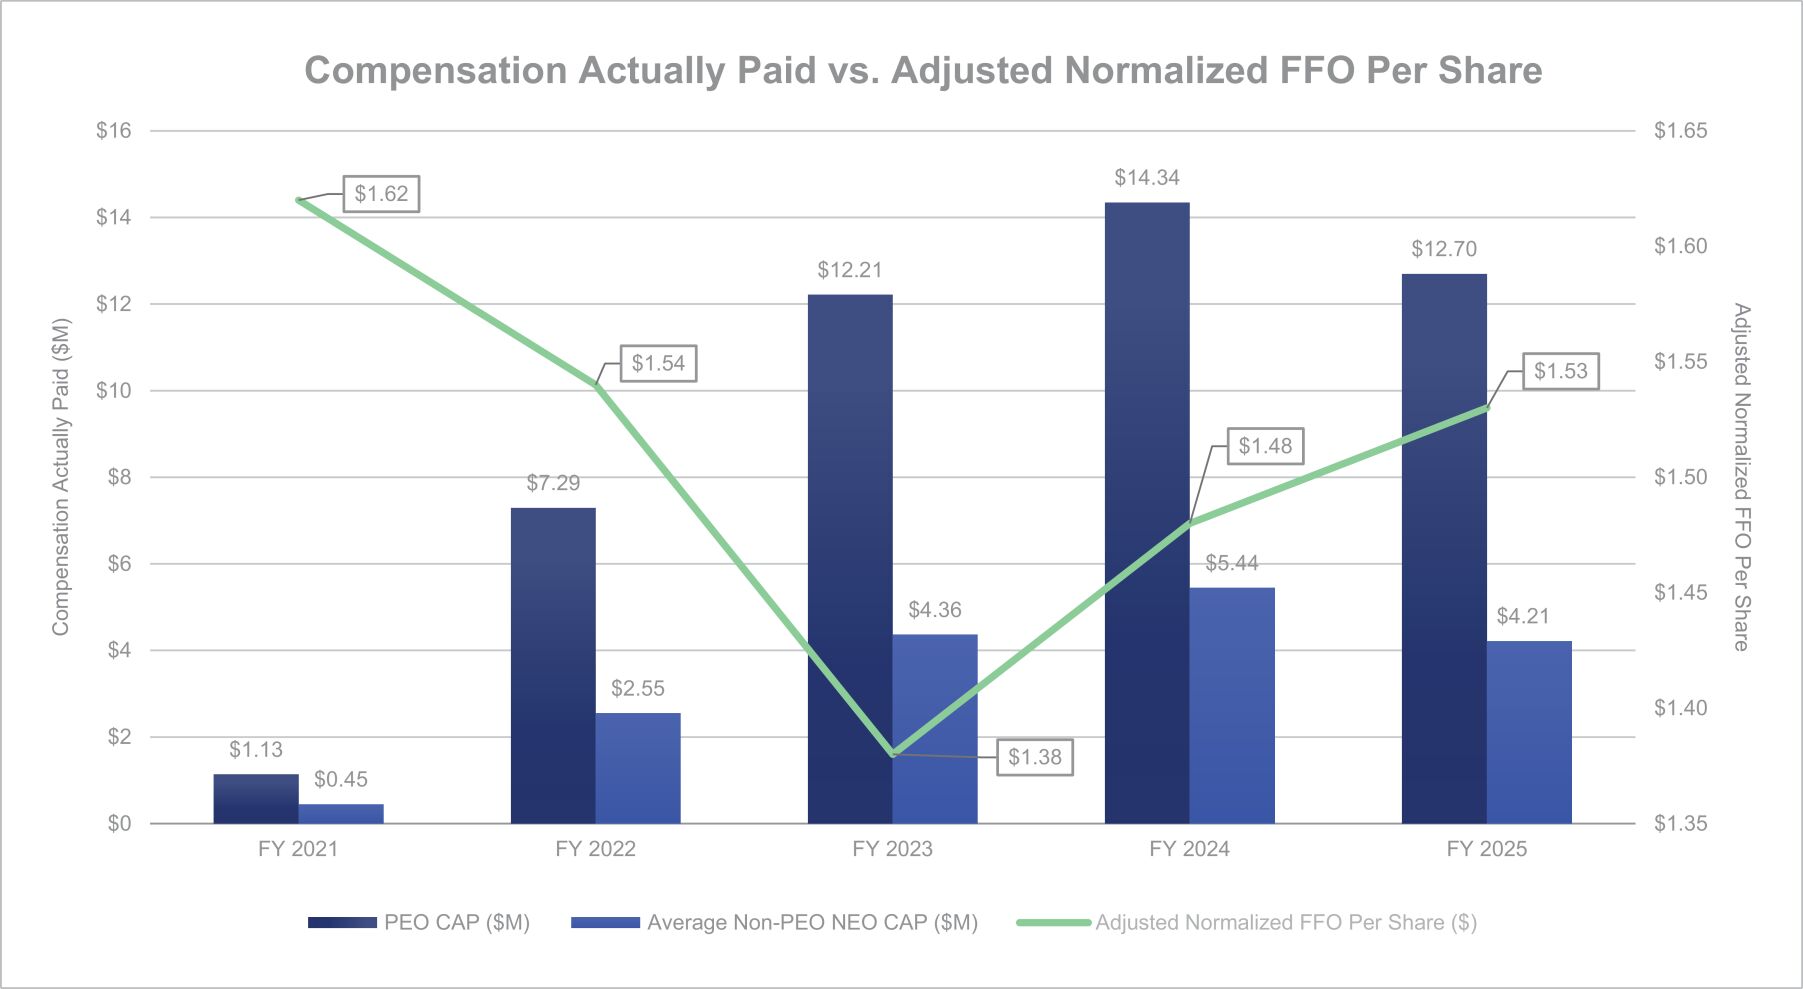
| (7) | Financial Performance Measures. Listed below are the financial performance measures which in our assessment represent the most important financial performance measures we use to link compensation actually paid to our Named Executive Officers, for 2025, to Sabra’s performance: |
Adjusted Normalized FFO Per Share |
Total Shareholder Return |
| (8) | Below are graphs showing the relationship of “compensation actually paid” to our Chief Executive Officer and other Named Executive Officers in 2021, 2022, 2023, 2024 and 2025 to (1) TSR of both Sabra and the Nareit Health Care Property Sector Total Return Index, (2) Sabra’s net income and (3) Sabra’s adjusted normalized FFO per share. |
| (3) | The following are our non-Chief Executive Officer Named Executive Officers for each of the years reflected in the table above: |
2025: Talya Nevo-Hacohen and Michael L. Costa |
2024: Talya Nevo-Hacohen and Michael L. Costa |
2023: Talya Nevo-Hacohen and Michael L. Costa |
2022: Talya Nevo-Hacohen and Michael L. Costa |
2021: Talya Nevo-Hacohen, Michael L. Costa and Harold Andrews |
2021 |
2022 |
2023 |
2024 |
2025 |
||||||||||||||||||||||||||||||||||||
Adjustments |
PEO ($) |
Average Non- PEO NEOs ($) |
PEO ($) |
Average Non- PEO NEOs ($) |
PEO ($) |
Average Non- PEO NEOs ($) |
PEO ($) |
Average Non- PEO NEOs ($) |
PEO ($) |
Average Non- PEO NEOs ($) |
||||||||||||||||||||||||||||||
Reported Summary Compensation Table Total |
6,091,584 | 1,741,895 | 6,652,517 | 2,414,421 | 8,219,499 | 3,259,707 | 8,481,297 | 3,615,003 | 8,552,721 | 2,844,468 | ||||||||||||||||||||||||||||||
Deduction for Amounts Reported under the “Stock Awards” and “Option Awards” Columns in the Summary Compensation Table for Applicable FY |
(4,047,334) | (977,678) | (4,129,117) | (1,352,381) | (4,519,499) | (1,506,507) | (4,781,297) | (1,711,203) | (5,026,721) | (1,005,348) | ||||||||||||||||||||||||||||||
Increase based on ASC 718 Fair Value of Awards Granted during Applicable FY that Remain Unvested as of Applicable FY End, determined as of Applicable FY End |
3,790,585 | 681,645 | 4,071,408 | 1,241,284 | 4,467,554 | 1,489,191 | 4,819,753 | 1,724,966 | 5,029,802 | 1,005,965 | ||||||||||||||||||||||||||||||
Increase based on ASC 718 Fair Value of Awards Granted during Applicable FY that Vested during Applicable FY, determined as of Vesting Date |
– | 193,896 | – | 74,929 | – | – | – | – | – | – | ||||||||||||||||||||||||||||||
Increase/deduction for Awards Granted during Prior FY that were Outstanding and Unvested as of Applicable FY End, determined based on change in ASC 718 Fair Value from Prior FY End to Applicable FY End |
(2,169,499) | (533,341) | 629,203 | 159,830 | 3,237,237 | 923,533 | 4,971,111 | 1,576,975 | 2,710,311 | 930,154 | ||||||||||||||||||||||||||||||
Increase/deduction for Awards Granted during Prior FY that Vested During Applicable FY, determined based on change in ASC 718 Fair Value from Prior FY End to Vesting Date |
(2,532,752) | (658,774) | 64,767 | 12,346 | 807,631 | 195,306 | 853,783 | 238,803 | 1,431,635 | 439,259 | ||||||||||||||||||||||||||||||
Deduction of ASC 718 Fair Value of Awards Granted during Prior FY that were Forfeited during Applicable FY, determined as of Prior FY End |
– | – | – | – | – | – | – | – | – | – | ||||||||||||||||||||||||||||||
Increase based on Dividends or Other Earnings Paid during Applicable FY prior to Vesting Date |
– | – | – | – | – | – | – | – | – | – | ||||||||||||||||||||||||||||||
Increase based on Incremental Fair Value of Options/SARs Modified during Applicable FY |
– | – | – | – | – | – | – | – | – | – | ||||||||||||||||||||||||||||||
TOTAL ADJUSTMENTS |
(4,959,000) | (1,294,252) | 636,261 | 136,008 | 3,992,923 | 1,101,523 | 5,863,350 | 1,829,541 | 4,145,027 | 1,370,030 | ||||||||||||||||||||||||||||||
COMPENSATION ACTUALLY PAID |
1,132,584 |
447,643 |
7,288,778 |
2,550,429 |
12,212,422 |
4,361,230 |
14,344,647 |
5,444,544 |
12,697,748 |
4,214,498 |
||||||||||||||||||||||||||||||