Pay vs Performance Disclosure - USD ($)
Dec. 31, 2025
Dec. 31, 2024
Dec. 31, 2023
Pay Versus Performance
The following table sets forth (i) the total and average total compensation set forth in the Summary Compensation Table (“SCT”) for the then-current Principal Executive Officer (“PEO”) and the other NEOs as a group, respectively; (ii) the total and average total compensation actually paid (“CAP”) for the then-current PEO and the other NEOs as a group, respectively; (iii) the Company’s cumulative TSR (“Cumulative TSR”); and (iv) Net Income, for the previous three years. The Compensation Committee does not use CAP as a basis for making compensation decisions. Further, the Company does not use financial performance measures to link compensation actually paid to the NEOs to Company performance. For this reason, we have omitted disclosure related to a “Company-Selected Measure.”
Year (1) |
Summary Compensation Table Total for PEO ($) |
Compensation Actually Paid to PEO ($) (2) |
Average summary compensation table total for non-PEO NEOs ($) (3) |
Average compensation actually paid to non-PEO NEOs ($) (2) |
Value of initial fixed $100 investment based on Total Shareholder Return ($) (4) |
Net Income ($) |
||||||||||||||||||
2025 (Willette) |
3,194,857 |
2,909,661 |
2,885,750 |
2,351,212 |
90 |
(63,023) |
||||||||||||||||||
2025 (Goranson) |
792,201 |
119,330 |
2,885,750 |
2,351,212 |
90 |
(63,023) |
||||||||||||||||||
2024 |
1,080,991 |
934,975 |
694,818 |
625,421 |
123 |
(67,993) |
||||||||||||||||||
2023 |
1,930,208 |
2,534,761 |
340,872 |
531,959 |
143 |
(25,611) |
||||||||||||||||||
| (1) | For 2023, Mr. Goranson was the PEO and Messrs. Sheriff and Peter Luthiger and Dr. Stover were non-PEO NEOs. For 2024, Mr. Goranson was the PEO and Messrs. Sheriff, Luthiger and Willette, Dr. Stover and Ms. Shona Wilson were non-PEO NEOs. For 2025, Messrs. Goranson and Willette were PEOs and Messrs. Sheriff and McCoig were non-PEO NEOs. |
| (2) | Represents CAP for our PEO and Average CAP for our non-PEO NEOs as a group, as determined in accordance with Item 402(v) and does not reflect the compensation ultimately earned or realized by our PEO or non-PEO NEOs. |
| (3) | Reflects the average SCT and CAP “Total Compensation” of each of the non-PEO NEOs (determined as set forth below). |
| (4) | Pursuant to SEC rules, the Total Shareholder Return (“TSR”) figure assumes a fixed investment of $100 on January 20, 2023 (our first trading day on the Nasdaq). The TSR is cumulative total shareholder returns for enCore, and the comparison assumes all dividends have been reinvested (if any). |
Reconciliations of SCT Total Compensation to CAP Total Compensation for our PEO and Average SCT Total Compensation to Average CAP Total Compensation for our
non-PEO
NEOs is shown below. Adjustments to Determine CAP for PEO
Covered Fiscal Year (i) |
2025 (Willette) ($) |
2025 (Goranson) ($) |
2024 ($) |
2023 ($) |
||||||||||||
SCT Total for PEO |
3,194,857 |
792,201 |
1,080,991 |
1,930,208 |
||||||||||||
Equity Adjustments (ii) |
|
|
|
|
|
|
|
|
|
|
|
| ||||
Subtract fair value (as of grant date) reported in the “Stock Awards” and “Option Awards” columns in the SCT for the covered fiscal year |
(2,416,299 |
) |
— |
(708,875 |
) |
(440,828 |
) | |||||||||
Add fair value (as of end of year) of equity awards granted during the covered fiscal year that remain unvested as of year end |
2,156,729 |
— |
391,274 |
726,774 |
||||||||||||
Add fair value (as of vesting date) of equity awards granted during the covered fiscal year that vest during the covered year |
— |
— |
117,213 |
246,191 |
||||||||||||
Add the change in fair value from the prior year-end to the covered fiscal year-end for equity awards granted in prior fiscal years that remain outstanding and unvested at the end of the covered fiscal year |
(15,152 |
) |
— |
(36,843 |
) |
90,531 |
||||||||||
Add the change in fair value from the prior year-end to vesting date for equity awards granted in prior fiscal years that vested during covered fiscal year |
(10,474 |
) |
— |
91,216 |
(18,115 |
) | ||||||||||
Subtract fair value (as of end of prior year) for equity awards granted in prior fiscal years that were forfeited during covered fiscal year |
— |
(672,871 |
) |
— |
— |
|||||||||||
Total Adjustments |
(285,196 |
) |
(672,871 |
) |
(146,015 |
) |
604,553 |
|||||||||
CAP Total for PEO |
2,909,661 |
119,330 |
934,975 |
2,534,761 |
||||||||||||
Adjustments to Determine Average CAP for
Non-PEO
NEOs as a Group Covered Fiscal Year (i) |
2025 ($) |
2024 ($) |
2023 ($) |
|||||||||
Average SCT Total for Non-PEO NEOs |
2,885,750 |
694,818 |
340,872 |
|||||||||
Equity Adjustments (ii) |
|
|
|
|
|
|
|
|
| |||
Subtract fair value (as of grant date) reported in the “Stock Awards” and “Option Awards” columns in the SCT for the covered fiscal year |
(2,260,023 |
) |
(326,673 |
) |
(137,759 |
) | ||||||
Add fair value (as of end of year) of equity awards granted during the covered fiscal year that remain unvested as of year end |
1,831,600 |
169,318 |
227,117 |
|||||||||
Add fair value (as of vesting date) of equity awards granted during the covered fiscal year that vest during the covered year |
— |
52,929 |
76,935 |
|||||||||
Add the change in fair value from the prior year-end to the covered fiscal year-end for equity awards granted in prior fiscal years that remain outstanding and unvested at the end of the covered fiscal year |
(23,789 |
) |
(11,514 |
) |
29,199 |
|||||||
Add the change in fair value from the prior year-end to vesting date for equity awards granted in prior fiscal years that vested during covered fiscal year |
(82,326 |
) |
46,542 |
(4,404 |
) | |||||||
Total Adjustments |
(534,538 |
) |
(69,397 |
) |
191,087 |
|||||||
CAP Total for Non-PEO NEOs |
2,351,212 |
625,421 |
531,959 |
|||||||||
| (i) | For all years, (a) there was no pension value attributable to “service cost” or “prior service cost”, (b) no awards granted during a year were also forfeited during the same year, (c) no awards were modified creating any incremental fair value expense and (d) no dividends or earnings were paid on any equity awards. |
| (ii) | The fair value or incremental fair value of all incentive equity awards is determined in accordance with ASC 718, “Compensation – Stock Compensation,” generally using the same methodology and assumptions the Company uses for financial reporting purposes when determining the grant date fair value of our equity awards reflected in the Summary Compensation Table; provided, in order to properly value option awards using the Black-Scholes model we use for the grant date fair value, we made appropriate adjustments to the grant date assumptions to reflect changes in the model’s inputs as of each measurement date. |
| (1) | For 2023, Mr. Goranson was the PEO and Messrs. Sheriff and Peter Luthiger and Dr. Stover were non-PEO NEOs. For 2024, Mr. Goranson was the PEO and Messrs. Sheriff, Luthiger and Willette, Dr. Stover and Ms. Shona Wilson were non-PEO NEOs. For 2025, Messrs. Goranson and Willette were PEOs and Messrs. Sheriff and McCoig were non-PEO NEOs. |
Adjustments to Determine CAP for PEO
Covered Fiscal Year (i) |
2025 (Willette) ($) |
2025 (Goranson) ($) |
2024 ($) |
2023 ($) |
||||||||||||
SCT Total for PEO |
3,194,857 |
792,201 |
1,080,991 |
1,930,208 |
||||||||||||
Equity Adjustments (ii) |
|
|
|
|
|
|
|
|
|
|
|
| ||||
Subtract fair value (as of grant date) reported in the “Stock Awards” and “Option Awards” columns in the SCT for the covered fiscal year |
(2,416,299 |
) |
— |
(708,875 |
) |
(440,828 |
) | |||||||||
Add fair value (as of end of year) of equity awards granted during the covered fiscal year that remain unvested as of year end |
2,156,729 |
— |
391,274 |
726,774 |
||||||||||||
Add fair value (as of vesting date) of equity awards granted during the covered fiscal year that vest during the covered year |
— |
— |
117,213 |
246,191 |
||||||||||||
Add the change in fair value from the prior year-end to the covered fiscal year-end for equity awards granted in prior fiscal years that remain outstanding and unvested at the end of the covered fiscal year |
(15,152 |
) |
— |
(36,843 |
) |
90,531 |
||||||||||
Add the change in fair value from the prior year-end to vesting date for equity awards granted in prior fiscal years that vested during covered fiscal year |
(10,474 |
) |
— |
91,216 |
(18,115 |
) | ||||||||||
Subtract fair value (as of end of prior year) for equity awards granted in prior fiscal years that were forfeited during covered fiscal year |
— |
(672,871 |
) |
— |
— |
|||||||||||
Total Adjustments |
(285,196 |
) |
(672,871 |
) |
(146,015 |
) |
604,553 |
|||||||||
CAP Total for PEO |
2,909,661 |
119,330 |
934,975 |
2,534,761 |
||||||||||||
Adjustments to Determine Average CAP for
Non-PEO
NEOs as a Group Covered Fiscal Year (i) |
2025 ($) |
2024 ($) |
2023 ($) |
|||||||||
Average SCT Total for Non-PEO NEOs |
2,885,750 |
694,818 |
340,872 |
|||||||||
Equity Adjustments (ii) |
|
|
|
|
|
|
|
|
| |||
Subtract fair value (as of grant date) reported in the “Stock Awards” and “Option Awards” columns in the SCT for the covered fiscal year |
(2,260,023 |
) |
(326,673 |
) |
(137,759 |
) | ||||||
Add fair value (as of end of year) of equity awards granted during the covered fiscal year that remain unvested as of year end |
1,831,600 |
169,318 |
227,117 |
|||||||||
Add fair value (as of vesting date) of equity awards granted during the covered fiscal year that vest during the covered year |
— |
52,929 |
76,935 |
|||||||||
Add the change in fair value from the prior year-end to the covered fiscal year-end for equity awards granted in prior fiscal years that remain outstanding and unvested at the end of the covered fiscal year |
(23,789 |
) |
(11,514 |
) |
29,199 |
|||||||
Add the change in fair value from the prior year-end to vesting date for equity awards granted in prior fiscal years that vested during covered fiscal year |
(82,326 |
) |
46,542 |
(4,404 |
) | |||||||
Total Adjustments |
(534,538 |
) |
(69,397 |
) |
191,087 |
|||||||
CAP Total for Non-PEO NEOs |
2,351,212 |
625,421 |
531,959 |
|||||||||
| (i) | For all years, (a) there was no pension value attributable to “service cost” or “prior service cost”, (b) no awards granted during a year were also forfeited during the same year, (c) no awards were modified creating any incremental fair value expense and (d) no dividends or earnings were paid on any equity awards. |
| (ii) | The fair value or incremental fair value of all incentive equity awards is determined in accordance with ASC 718, “Compensation – Stock Compensation,” generally using the same methodology and assumptions the Company uses for financial reporting purposes when determining the grant date fair value of our equity awards reflected in the Summary Compensation Table; provided, in order to properly value option awards using the Black-Scholes model we use for the grant date fair value, we made appropriate adjustments to the grant date assumptions to reflect changes in the model’s inputs as of each measurement date. |
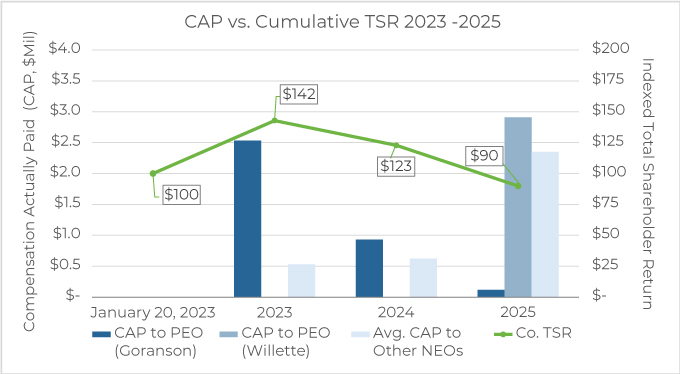
Relationship between CAP and the Company’s Cumulative TSR
The following graphic depicts the relationship of the CAP received by our PEO and other NEOs in 2023, 2024, and 2025 to the Company’s cumulative TSR.
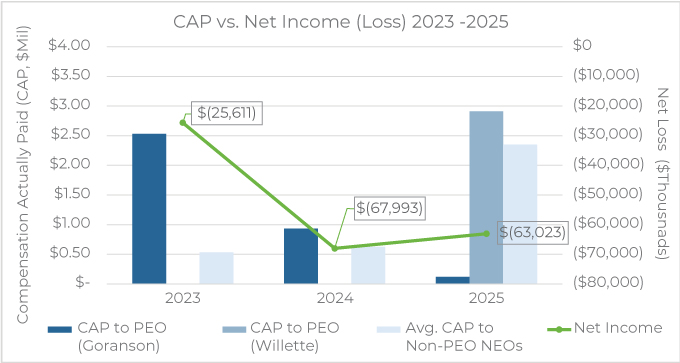
Relationship between CAP and Company Net Income over FY 2023 to 2025
The following graphic depicts the relationship of the CAP received by our PEO and other NEOs in 2023, 2024, and 2025 to the Company’s Net Income.