Pay vs Performance Disclosure - USD ($)
Dec. 31, 2024
Aug. 31, 2024
Dec. 31, 2025
Dec. 31, 2024
Dec. 31, 2023
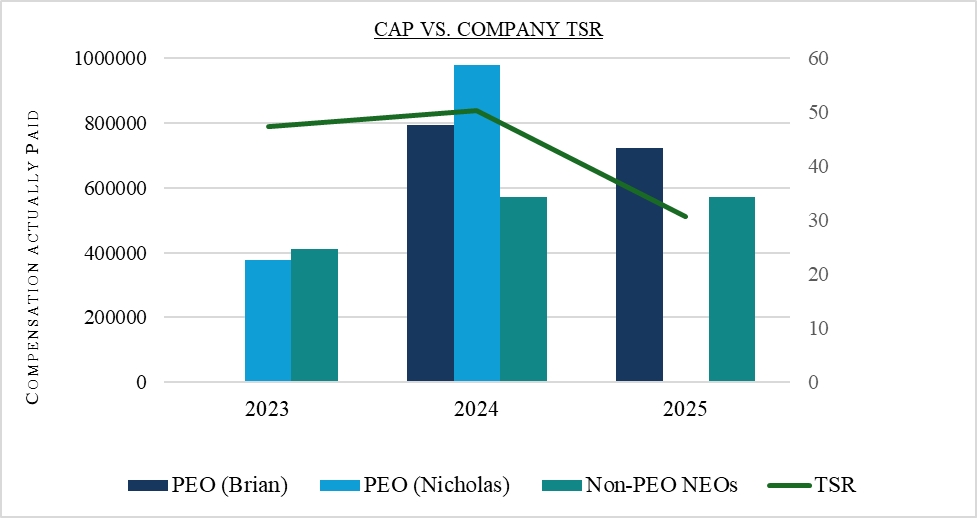
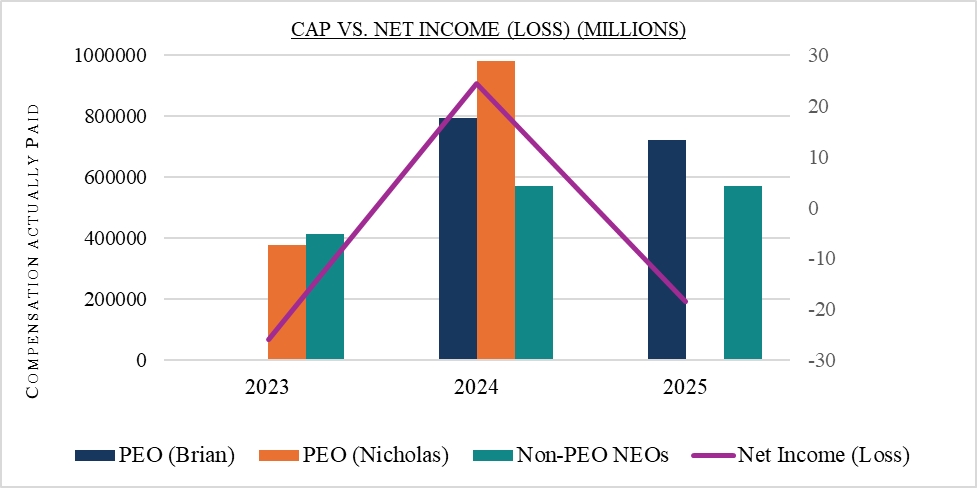
PAY VERSUS PERFORMANCE
We are providing the following information about the relationship between executive compensation actually
paid (CAP) and certain financial performance of the Company as required by SEC rules. Please see “Executive Compensation” for discussion of our compensation philosophy.
|
Year
|
Summary
Comp.
Table Total
for
PEO 11
|
Summary
Comp.
Table Total
for
PEO 21
|
Comp.
Actually
Paid
to
PEO 12
|
Comp.
Actually
Paid
to PEO 23
|
Average
Summary
Comp.
Table Total
for
Non-PEO
NEOs4
|
Average
Comp.
Actually
Paid
to Non-
PEO
NEOs5
|
Value of
Initial
Fixed
$100
Investment
Based On:
Total
Shareholder
Return
|
Net
Income
(Loss) (in
thousands)
|
||||||||||||||||||||||||
|
2025
|
$
|
760,750
|
$
|
-
|
$
|
722,102
|
$
|
-
|
$
|
572,800
|
572,256
|
$
|
30.65
|
$
|
(18,438
|
)
|
||||||||||||||||
|
2024
|
$
|
757,550
|
$
|
930,041
|
$
|
793,295
|
$
|
979,500
|
$
|
572,800
|
$
|
572,403
|
$
|
50.31
|
$
|
24,347
|
||||||||||||||||
|
2023
|
$
|
-
|
$
|
438,200
|
$
|
-
|
$
|
378,636
|
$
|
435,500
|
$
|
412,743
|
$
|
47.30
|
$
|
(25,904
|
)
|
|||||||||||||||
1 The amounts reported in this column represent the amounts reported in the “Total” column of
the Summary Compensation Table for each of Nicholas Petcoff and Brian Roney for the years in which they served as PEO. For the years reported in the table, Nick was our PEO from January 2023 through August 2024, and Brian has been our
PEO since September 2024.
2 Amounts reported reflect CAP for Mr. Brian Roney, as computed in accordance with Item 402(v) of Regulation S-K for
each corresponding year.
|
Year
|
Reported
Summary
Compensation
Table
Total for PEO 1
|
Reported
Value of
Equity
Awards(a)
|
Equity Award
Adjustment
|
Compensation
Actually
Paid to PEO 1
|
||||||||||||
|
2025
|
$
|
$760,750
|
$
|
-
|
$
|
(38,648
|
)
|
$
|
722,102
|
|||||||
|
2024
|
$
|
$757,550
|
$
|
-
|
$
|
35,745
|
$
|
793,295
|
||||||||
3 Amounts reported reflect CAP for Mr. Nicholas Petcoff, as computed in accordance with Item
402(v) of Regulation S-K for each corresponding year.
|
Year
|
Reported
Summary
Compensation
Table Total
for PEO 2
|
Reported
Value of
Equity
Awards(a)
|
Equity
Award
Adjustment
|
Compensation
Actually
Paid to PEO 2
|
||||||||||||
|
2025
|
$
|
-
|
$
|
-
|
$
|
-
|
$
|
-
|
||||||||
|
2024
|
$
|
930,041
|
$
|
-
|
$
|
49,459
|
$
|
979,500
|
||||||||
|
2023
|
$
|
438,200
|
$
|
-
|
$
|
(59,564
|
)
|
$
|
378,636
|
|||||||
The equity award adjustments for each applicable year include the addition (or
subtraction, as applicable) of the following: (i) the amount of change as of the end of the applicable year (from the end of the prior fiscal year) in fair value of any awards granted in prior years that are outstanding and unvested as of the end
of the applicable year; and (ii) for awards granted in prior years that vest in the applicable year, the amount equal to the change as of the vesting date (from the end of the prior fiscal year) in fair value. The valuation assumptions used to
calculate fair values did not materially differ from those disclosed at the time of grant. The amounts deducted or added in calculating the equity award adjustments are as follows:
|
Year
|
Year over Year
Change in
Fair Value of
Outstanding and
Unvested
Equity Awards
|
Change in
Fair Value of
Equity Awards
Granted in
Prior Years that
Vested in the Year
|
Total
Equity Award
Adjustments
|
|||||||||
|
Brian Roney
|
||||||||||||
|
2025
|
$
|
(28,897
|
)
|
$
|
(9,751
|
)
|
$
|
(38,648
|
)
|
|||
|
2024
|
$
|
36,488
|
$
|
(743
|
)
|
$
|
35,745
|
|||||
|
Nicholas Petcoff
|
||||||||||||
|
2024
|
$
|
50,149
|
$
|
(690
|
)
|
$
|
49,459
|
|||||
|
2023
|
$
|
(67,752
|
)
|
$
|
8,188
|
$
|
(59,564
|
)
|
||||
4 Reflects the average amount reported in the “Total” column of the Summary Compensation Table
for our other named executive officers as a group for each corresponding year. The names of each of the other named executive officers included for the purposes of calculating the average amounts in each applicable year are Mr. Meloche for 2025
and 2024, and Mr. Roney and Mr. Meloche for 2023.
5 Amounts reported reflect CAP for the other named executive officers as a group, as computed
in accordance with Item 402(v) of Regulation S-K for each corresponding year. The equity award adjustments for each applicable year include the addition (or subtraction, as applicable) of the following: (i) the year-end fair value of any equity
awards granted in the applicable year that are outstanding and unvested as of the end of the year; (ii) the amount of change as of the end of the applicable year (from the end of the prior fiscal year) in fair value of any awards granted in prior
years that are outstanding and unvested as of the end of the applicable year; and (iii) for awards granted in prior years that vest in the applicable year, the amount equal to the change as of the vesting date (from the end of the prior fiscal
year) in fair value. The valuation assumptions used to calculate fair values did not materially differ from those disclosed at the time of grant. The amounts deducted or added in calculating the equity award adjustments are as follows:
|
Year
|
Average
Reported
Summary
Compensation
Table
Total for
Non-PEO NEOs
|
Average
Reported
Value of
Equity
Awards
|
Average
Equity
Award
Adjustments(a)
|
Average
Compensation
Actually Paid
to Non-
PEO NEOs
|
||||||||||||
|
2025
|
$
|
572,800
|
$
|
-
|
$
|
(544
|
)
|
$
|
572,256
|
|||||||
|
2024
|
$
|
572,800
|
$
|
-
|
$
|
(397
|
)
|
$
|
572,403
|
|||||||
|
2023
|
$
|
435,500
|
$
|
-
|
$
|
(22,757
|
)
|
$
|
412,743
|
|||||||
a) The amounts deducted or added in calculating the total average equity award adjustments are as follows:
|
Year
|
Year over Year
Average
Change in
Fair Value of
Outstanding
and Unvested
Equity Awards
|
Average Change
in Fair Value
of Equity
Awards Granted
in Prior Years
that Vested
in the Year
|
Year End
Fair Value
of Equity
Awards
Granted
In The Year
|
Average
Equity Award
Adjustments(a)
|
||||||||||||
|
2025
|
$
|
-
|
$
|
(544
|
)
|
$
|
-
|
$
|
(544
|
)
|
||||||
|
2024
|
$
|
192
|
$
|
(589
|
)
|
$
|
-
|
$
|
(397
|
)
|
||||||
|
2023
|
$
|
(25,962
|
)
|
$
|
3,205
|
$
|
-
|
$
|
(22,757
|
)
|
||||||
1 The amounts reported in this column represent the amounts reported in the “Total” column of
the Summary Compensation Table for each of Nicholas Petcoff and Brian Roney for the years in which they served as PEO. For the years reported in the table, Nick was our PEO from January 2023 through August 2024, and Brian has been our
PEO since September 2024.
4 Reflects the average amount reported in the “Total” column of the Summary Compensation Table
for our other named executive officers as a group for each corresponding year. The names of each of the other named executive officers included for the purposes of calculating the average amounts in each applicable year are Mr. Meloche for 2025
and 2024, and Mr. Roney and Mr. Meloche for 2023.
2 Amounts reported reflect CAP for Mr. Brian Roney, as computed in accordance with Item 402(v) of Regulation S-K for
each corresponding year.
|
Year
|
Reported
Summary
Compensation
Table
Total for PEO 1
|
Reported
Value of
Equity
Awards(a)
|
Equity Award
Adjustment
|
Compensation
Actually
Paid to PEO 1
|
||||||||||||
|
2025
|
$
|
$760,750
|
$
|
-
|
$
|
(38,648
|
)
|
$
|
722,102
|
|||||||
|
2024
|
$
|
$757,550
|
$
|
-
|
$
|
35,745
|
$
|
793,295
|
||||||||
3 Amounts reported reflect CAP for Mr. Nicholas Petcoff, as computed in accordance with Item
402(v) of Regulation S-K for each corresponding year.
|
Year
|
Reported
Summary
Compensation
Table Total
for PEO 2
|
Reported
Value of
Equity
Awards(a)
|
Equity
Award
Adjustment
|
Compensation
Actually
Paid to PEO 2
|
||||||||||||
|
2025
|
$
|
-
|
$
|
-
|
$
|
-
|
$
|
-
|
||||||||
|
2024
|
$
|
930,041
|
$
|
-
|
$
|
49,459
|
$
|
979,500
|
||||||||
|
2023
|
$
|
438,200
|
$
|
-
|
$
|
(59,564
|
)
|
$
|
378,636
|
|||||||
The equity award adjustments for each applicable year include the addition (or
subtraction, as applicable) of the following: (i) the amount of change as of the end of the applicable year (from the end of the prior fiscal year) in fair value of any awards granted in prior years that are outstanding and unvested as of the end
of the applicable year; and (ii) for awards granted in prior years that vest in the applicable year, the amount equal to the change as of the vesting date (from the end of the prior fiscal year) in fair value. The valuation assumptions used to
calculate fair values did not materially differ from those disclosed at the time of grant. The amounts deducted or added in calculating the equity award adjustments are as follows:
|
Year
|
Year over Year
Change in
Fair Value of
Outstanding and
Unvested
Equity Awards
|
Change in
Fair Value of
Equity Awards
Granted in
Prior Years that
Vested in the Year
|
Total
Equity Award
Adjustments
|
|||||||||
|
Brian Roney
|
||||||||||||
|
2025
|
$
|
(28,897
|
)
|
$
|
(9,751
|
)
|
$
|
(38,648
|
)
|
|||
|
2024
|
$
|
36,488
|
$
|
(743
|
)
|
$
|
35,745
|
|||||
|
Nicholas Petcoff
|
||||||||||||
|
2024
|
$
|
50,149
|
$
|
(690
|
)
|
$
|
49,459
|
|||||
|
2023
|
$
|
(67,752
|
)
|
$
|
8,188
|
$
|
(59,564
|
)
|
||||
5 Amounts reported reflect CAP for the other named executive officers as a group, as computed
in accordance with Item 402(v) of Regulation S-K for each corresponding year. The equity award adjustments for each applicable year include the addition (or subtraction, as applicable) of the following: (i) the year-end fair value of any equity
awards granted in the applicable year that are outstanding and unvested as of the end of the year; (ii) the amount of change as of the end of the applicable year (from the end of the prior fiscal year) in fair value of any awards granted in prior
years that are outstanding and unvested as of the end of the applicable year; and (iii) for awards granted in prior years that vest in the applicable year, the amount equal to the change as of the vesting date (from the end of the prior fiscal
year) in fair value. The valuation assumptions used to calculate fair values did not materially differ from those disclosed at the time of grant. The amounts deducted or added in calculating the equity award adjustments are as follows:
|
Year
|
Average
Reported
Summary
Compensation
Table
Total for
Non-PEO NEOs
|
Average
Reported
Value of
Equity
Awards
|
Average
Equity
Award
Adjustments(a)
|
Average
Compensation
Actually Paid
to Non-
PEO NEOs
|
||||||||||||
|
2025
|
$
|
572,800
|
$
|
-
|
$
|
(544
|
)
|
$
|
572,256
|
|||||||
|
2024
|
$
|
572,800
|
$
|
-
|
$
|
(397
|
)
|
$
|
572,403
|
|||||||
|
2023
|
$
|
435,500
|
$
|
-
|
$
|
(22,757
|
)
|
$
|
412,743
|
|||||||
a) The amounts deducted or added in calculating the total average equity award adjustments are as follows:
|
Year
|
Year over Year
Average
Change in
Fair Value of
Outstanding
and Unvested
Equity Awards
|
Average Change
in Fair Value
of Equity
Awards Granted
in Prior Years
that Vested
in the Year
|
Year End
Fair Value
of Equity
Awards
Granted
In The Year
|
Average
Equity Award
Adjustments(a)
|
||||||||||||
|
2025
|
$
|
-
|
$
|
(544
|
)
|
$
|
-
|
$
|
(544
|
)
|
||||||
|
2024
|
$
|
192
|
$
|
(589
|
)
|
$
|
-
|
$
|
(397
|
)
|
||||||
|
2023
|
$
|
(25,962
|
)
|
$
|
3,205
|
$
|
-
|
$
|
(22,757
|
)
|
||||||
The equity award adjustments for each applicable year include the addition (or
subtraction, as applicable) of the following: (i) the amount of change as of the end of the applicable year (from the end of the prior fiscal year) in fair value of any awards granted in prior years that are outstanding and unvested as of the end
of the applicable year; and (ii) for awards granted in prior years that vest in the applicable year, the amount equal to the change as of the vesting date (from the end of the prior fiscal year) in fair value. The valuation assumptions used to
calculate fair values did not materially differ from those disclosed at the time of grant. The amounts deducted or added in calculating the equity award adjustments are as follows:
|
Year
|
Year over Year
Change in
Fair Value of
Outstanding and
Unvested
Equity Awards
|
Change in
Fair Value of
Equity Awards
Granted in
Prior Years that
Vested in the Year
|
Total
Equity Award
Adjustments
|
|||||||||
|
Brian Roney
|
||||||||||||
|
2025
|
$
|
(28,897
|
)
|
$
|
(9,751
|
)
|
$
|
(38,648
|
)
|
|||
|
2024
|
$
|
36,488
|
$
|
(743
|
)
|
$
|
35,745
|
|||||
|
Nicholas Petcoff
|
||||||||||||
|
2024
|
$
|
50,149
|
$
|
(690
|
)
|
$
|
49,459
|
|||||
|
2023
|
$
|
(67,752
|
)
|
$
|
8,188
|
$
|
(59,564
|
)
|
||||
a) The amounts deducted or added in calculating the total average equity award adjustments are as follows:
|
Year
|
Year over Year
Average
Change in
Fair Value of
Outstanding
and Unvested
Equity Awards
|
Average Change
in Fair Value
of Equity
Awards Granted
in Prior Years
that Vested
in the Year
|
Year End
Fair Value
of Equity
Awards
Granted
In The Year
|
Average
Equity Award
Adjustments(a)
|
||||||||||||
|
2025
|
$
|
-
|
$
|
(544
|
)
|
$
|
-
|
$
|
(544
|
)
|
||||||
|
2024
|
$
|
192
|
$
|
(589
|
)
|
$
|
-
|
$
|
(397
|
)
|
||||||
|
2023
|
$
|
(25,962
|
)
|
$
|
3,205
|
$
|
-
|
$
|
(22,757
|
)
|
||||||