Pay vs Performance Disclosure - USD ($)
Dec. 31, 2025
Dec. 31, 2024
Dec. 31, 2023
Dec. 31, 2022
Dec. 31, 2021
Pay Versus Performance Table
| Value of initial fixed $100 investment based on: | ||||||||||||||||||||||||||||||||||||||||||||
| Year (a) | Summary compensation table total for PEO ($) (b)⁽¹⁾ | Compensation actually paid to PEO ($) (c)⁽¹⁾ | Average summary compensation table total for Non-PEO NEOs ($) (d)⁽²⁾ | Average compensation actually paid to Non-PEO NEOs ($) (e)⁽²⁾⁽³⁾⁽⁴⁾⁽⁵⁾⁽⁶⁾ | Total shareholder return ($) (f)⁽⁷⁾ | Peer group total shareholder return ($) (g)⁽⁷⁾⁽⁸⁾ | Net Income (Loss) (in thousands) ($) (h)⁽⁹⁾ | |||||||||||||||||||||||||||||||||||||
| 2025 | 2.75 | 2.75 | 14,211,140 | 10,425,904 | 29.91 | 228.99 | 1,305,636 | |||||||||||||||||||||||||||||||||||||
| 2024 | 2.75 | 2.75 | 13,619,601 | 15,718,794 | 39.05 | 179.15 | 2,897,047 | |||||||||||||||||||||||||||||||||||||
| 2023 | 2.75 | 2.75 | 10,767,701 | 11,468,047 | 35.54 | 131.65 | 9,772 | |||||||||||||||||||||||||||||||||||||
| 2022 | 2.75 | 2.75 | 11,692,439 | (10,751,801) | 28.87 | 81.71 | (540,747) | |||||||||||||||||||||||||||||||||||||
| 2021 | 2.75 | 2.75 | 9,560,445 | (2,467,273) | 74.21 | 126.40 | 166,284 | |||||||||||||||||||||||||||||||||||||
(1)Reflects compensation amounts reported in our SCT for our Block Head and PEO, Jack Dorsey, for the respective years shown. Mr. Dorsey was our PEO for all applicable years presented. Mr. Dorsey did not receive or hold any equity-based awards or participate in any defined benefit or actuarial pension plans, for any of the years presented and, therefore, no amounts have been deducted or added to calculate the Compensation Actually Paid (“CAP”) to the PEO.
(2)Non-PEO NEOs include (a) Amrita Ahuja, Brian Grassadonia, Alyssa Henry, and Sivan Whiteley for the years ended December 31, 2021 and 2022; (b) Amrita Ahuja, Brian Grassadonia, Alyssa Henry, and Chrysty Esperanza for the year ended December 31, 2023; (c) Amrita Ahuja, Brian Grassadonia, Owen Britton Jennings, and Dhanji R. Prasanna for the year ended December 31, 2024, and (d) Amrita Ahuja, Brian Grassadonia, Owen Britton Jennings, Dhanji R. Prasanna and Arnaud Weber for the year ended December 31, 2025.
(8)We used the S&P North American Technology Index for our peer group TSR, as used in our stock performance graph required by Item 201(e) of Regulation S-K and included in our Annual Report on Form 10-K for the year ended December 31, 2025.
(3)Dollar amounts reported do not reflect the actual amount of compensation earned by or paid to our non-PEO NEOs during the applicable year. We calculate CAP in accordance with the methodology prescribed under SEC guidance to Item 402(v) of Regulation S-K and as shown in the adjustment table below. Average CAP for our non-PEO NEOs is calculated by, as described in more detail under footnote (6) below, (a) taking the average SCT total compensation, less (b) the grant date fair value of equity granted during the year, plus (c) the following: (i) the year-end fair value of outstanding, unvested equity awards granted during the applicable year; (ii) for equity awards
granted in prior years that are outstanding and unvested at the end of the year, the difference between the year-end fair value and the immediately prior year-end fair value; (iii) the vesting date fair value of any equity awards that were granted and vested in the same covered fiscal year; and (iv) for awards granted in prior years that vested during the applicable year, the difference between the fair value as of the vesting date and the immediately prior year-end fair value, less (d) the fair value at the end of the prior fiscal year for awards granted in prior years that were forfeited during the covered fiscal year. We have not paid dividends historically and do not sponsor any pension arrangements; thus no adjustments are made for these items.
(4)For purposes of calculating the average CAP to our non-PEO NEOs, compensation related to equity awards was remeasured. For RSUs, the fair values and the change in fair values were determined by the closing price of our common stock at each applicable year-end date or, in the case of vested awards, the stock price on vesting date. For stock options, a Black-Scholes-Merton option valuation model (“BSM model”) was used as of the applicable year-end date or, in the case of vested options, the vesting date. The BSM model requires us to make assumptions and judgments regarding the variables used in the calculation, including the expected remaining term, expected volatility, and the expected risk-free rate. The valuation assumptions used to calculate fair value of equity awards were materially consistent with those used to calculate the grant date fair value of such award and those used to calculate our share-based compensation expense, as disclosed in the “Share-based Compensation” section of Note 16, Stockholders’ Equity of the Notes to the Consolidated Financial Statements included in our Annual Report on Form 10-K for the fiscal year ended December 31, 2025. For stock options, the fair value amounts of stock options for 2025 reflected in the table above were calculated using the “historical” method for determining the expected term of the options under the BSM model. For stock option fair value amounts for prior years, we used the “simplified method” for determining the expected term of the options under the BSM model. There is no material difference in the reported years as a result of the change in methodology.
(5)Changes in the market price of our Class A common stock following the date of grant of an award can impact CAP to our non-PEO NEOs. For the portion of the average CAP that is based on year-end stock prices, the following prices from the last trading day of the applicable year were used: (a) $217.64 for 2020; (b) $161.51 for 2021; (c) $62.84 for 2022; (d) $77.35 for 2023; (e) $84.99 for 2024; and (g) $65.09 for 2025.
(6)Reflects the following adjustments, reported as averages, to the average of the total compensation of our non-PEO NEOs as reported in our SCT for each fiscal year listed:
| Year Ended | |||||||||||||||||||||||||||||
| December 31, | |||||||||||||||||||||||||||||
| 2021 | 2022 | 2023 | 2024 | 2025 | |||||||||||||||||||||||||
| Total Average Compensation to non-PEO NEOs per SCT ($) | $ | 9,560,445 | 11,692,439 | 10,767,701 | 13,619,601 | 14,211,140 | |||||||||||||||||||||||
| Less: Amounts reported in SCT as equity award amounts, which are based on grant date fair values | (9,060,750) | (11,167,810) | (10,175,781) | (13,054,698) | (13,659,321) | ||||||||||||||||||||||||
| Plus: Year-end fair value of any equity awards granted in the covered fiscal year that were outstanding and unvested as of the end of the covered fiscal year | 4,257,552 | 4,103,883 | 9,579,411 | 12,556,990 | 12,133,397 | ||||||||||||||||||||||||
| Plus: Change in fair value as of the end of the covered fiscal year (from the end of the prior fiscal year) of any equity awards granted in prior years that were outstanding and unvested as of the end of the covered fiscal year. | (10,385,340) | (9,746,528) | 775,615 | 901,216 | (3,339,935) | ||||||||||||||||||||||||
| Plus: Vesting date fair value of any equity awards that were granted and vested in the same covered fiscal year | 1,135,500 | 700,050 | 1,618,086 | 2,250,501 | 2,855,963 | ||||||||||||||||||||||||
| Plus: Change in fair value from the end of the prior fiscal year to the vesting date for awards granted in prior years that vest in the covered fiscal year | 2,025,319 | (6,333,836) | (126,602) | (554,816) | (1,775,340) | ||||||||||||||||||||||||
| Less: Fair value at the end of the prior fiscal year for awards granted in prior years that were forfeited during the covered fiscal year | — | — | (970,382) | — | — | ||||||||||||||||||||||||
| Total Adjustments | (12,027,719) | (22,444,241) | 700,347 | 2,099,193 | (3,785,236) | ||||||||||||||||||||||||
| Total Average CAP to non-PEO NEOs for Fiscal Year | (2,467,273) | (10,751,801) | 11,468,047 | 15,718,794 | 10,425,904 | ||||||||||||||||||||||||
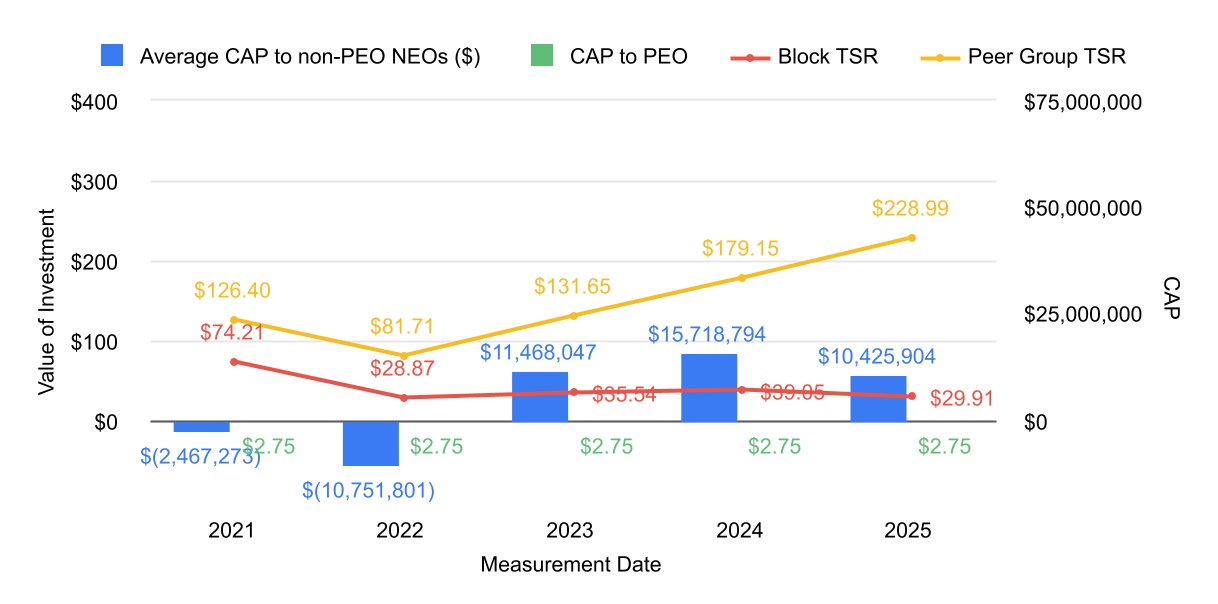
Relationship Between Compensation Actually Paid, Block Total Shareholder Return and Peer Group Total Shareholder Return
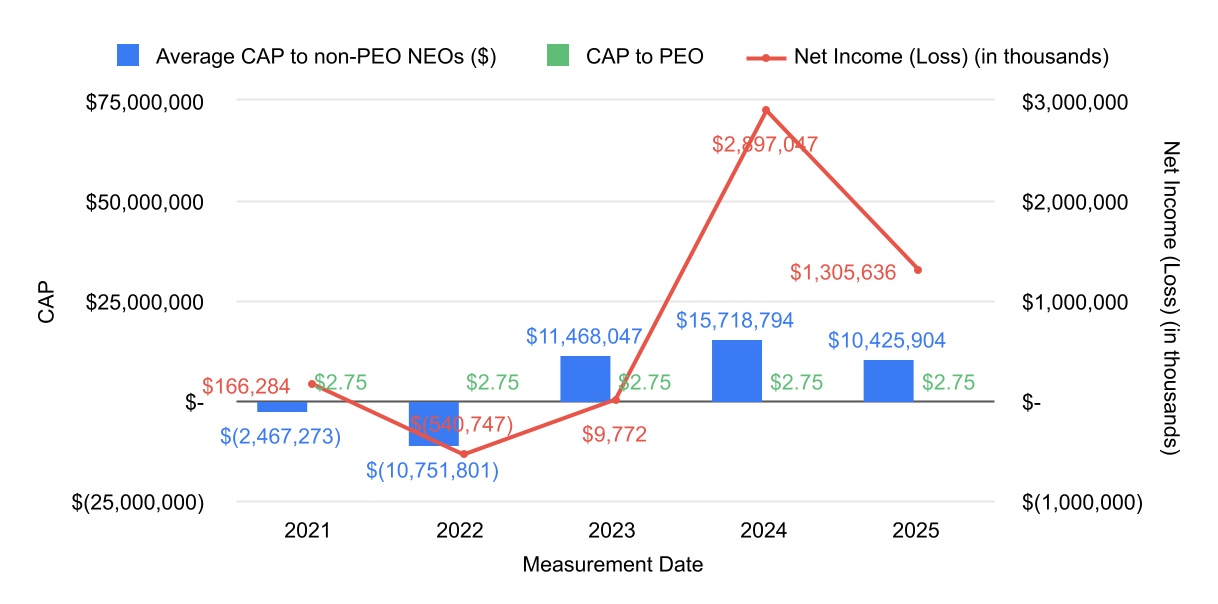
Relationship Between Compensation Actually Paid and Net Income (Loss)
Relationship Between Compensation Actually Paid, Block Total Shareholder Return and Peer Group Total Shareholder Return