Pay vs Performance Disclosure - USD ($)
|
12 Months Ended |
Dec. 31, 2025 |
Dec. 31, 2024 |
Dec. 31, 2023 |
| Pay vs Performance Disclosure |
|
|
|
| Pay vs Performance Disclosure, Table |
| | | | | | | | | | | | | | | | | | | | | | | | | | | | | | | | | | | | | | | | | | | | | | | | | | | | Year | | Summary Compensation Table Total for Mr. Rasmus (1) | | Summary Compensation Table Total for Mr. Marken | | Compensation Actually Paid to Mr. Rasmus (2) | | Compensation Actually Paid to Mr. Marken | | Average Summary Compensation Table Total for Non-PEO NEOs (1) | | Average Compensation Actually Paid to Non-PEO NEOs (2) | | Total Shareholder Return (3) | | Net Loss (in thousands) (4) | | 2025 | | $ | 142,979 | | | $ | — | | | $ | 71,211 | | | $ | — | | | $ | 777,430 | | | $ | (119,030) | | | $ | 134.57 | | | $ | (52,610) | | | 2024 | | $ | 115,385 | | | $ | — | | | $ | 1,850,705 | | | $ | — | | | $ | 776,605 | | | $ | 1,587,564 | | | $ | 311.52 | | | $ | (5,109) | | | 2023 | | $ | 1,011,039 | | | $ | 2,091,425 | | | $ | 2,494,877 | | | $ | 1,430,455 | | | $ | 888,244 | | | $ | 1,065,965 | | | $ | 122.63 | | | $ | (12,249) | |
|
|
|
| Named Executive Officers, Footnote |
Compensation for the Company's Principal Executive Officer (the "PEO"), Robert Rasmus for 2025, 2024 and from July 17, 2023 through the end of 2023, and Greg Marken from January 1, 2023 through July 17, 2023, reflects the amount reported in the "Summary Compensation Table" for the respective years. Average compensation for non-PEO NEOs is based on the compensation for Claiborne Smith and Jeremy Williamson for 2025, Jeremy Williamson, and Joe Wong for 2024, and Morgan Fields, Jeremy Williamson, and Joe Wong for 2023 (collectively, the "non-PEO NEOs") reported in the "Summary Compensation Table" for the respective years.
|
|
|
| PEO Total Compensation Amount |
$ 142,979
|
|
$ 2,091,425
|
| PEO Actually Paid Compensation Amount |
$ 71,211
|
|
1,430,455
|
| Adjustment To PEO Compensation, Footnote |
SEC rules require that certain adjustments be made to the total compensation set forth in the "Summary Compensation Table" in order to determine "compensation actually paid" for purposes of this Pay Versus Performance Disclosure. "Compensation actually paid" does not represent cash and/or equity value transferred to the applicable NEO, but rather is a value calculated under applicable SEC rules. The below table reflects the required adjustments to reconcile total compensation as set forth in the Summary Compensation Table to "compensation actually paid" for purposes of the Pay Versus Performance Disclosure. | | | | | | | | | | | | | | | | | | | | | | Mr. Rasmus
2025 | | | | | Non-PEO NEOs
2025 | | | | Summary Compensation Table Total | | $ | 142,979 | | | | | | $ | 777,430 | | | | | Less stock award value reported in Summary Compensation Table for the covered year | | (60,479) | | | | | | (315,247) | | | | | Plus the year-end fair value of outstanding unvested awards granted in covered year | | 35,778 | | | | | | 186,495 | | | | | Plus (less) change in year-end fair value of outstanding and unvested awards granted in prior years | | (44,199) | | | | | | (334,838) | | | | | Fair value as of the vesting date of vested awards granted in the covered year | | — | | | | | | — | | | | | Plus (less) change in fair value of awards granted in prior years that vested in the covered year | | (2,868) | | | | | | (432,870) | | | | | Less the prior year-end fair value of awards forfeited during the covered year | | — | | | | | | — | | | | | | | | | | | | | | | Compensation Actually Paid | | $ | 71,211 | | | | | | $ | (119,030) | | | |
Fair values of equity awards set forth in the table above are computed in accordance with FASB ASC Topic 718 as of the end of the respective fiscal year, other than fair values of equity awards that vest in the covered year, which are valued as of the applicable vesting date. The valuation methodologies applied do not materially differ from the valuation methodologies applied at the time of grant.
|
|
|
| Non-PEO NEO Average Total Compensation Amount |
$ 777,430
|
$ 776,605
|
888,244
|
| Non-PEO NEO Average Compensation Actually Paid Amount |
$ (119,030)
|
1,587,564
|
1,065,965
|
| Adjustment to Non-PEO NEO Compensation Footnote |
SEC rules require that certain adjustments be made to the total compensation set forth in the "Summary Compensation Table" in order to determine "compensation actually paid" for purposes of this Pay Versus Performance Disclosure. "Compensation actually paid" does not represent cash and/or equity value transferred to the applicable NEO, but rather is a value calculated under applicable SEC rules. The below table reflects the required adjustments to reconcile total compensation as set forth in the Summary Compensation Table to "compensation actually paid" for purposes of the Pay Versus Performance Disclosure. | | | | | | | | | | | | | | | | | | | | | | Mr. Rasmus
2025 | | | | | Non-PEO NEOs
2025 | | | | Summary Compensation Table Total | | $ | 142,979 | | | | | | $ | 777,430 | | | | | Less stock award value reported in Summary Compensation Table for the covered year | | (60,479) | | | | | | (315,247) | | | | | Plus the year-end fair value of outstanding unvested awards granted in covered year | | 35,778 | | | | | | 186,495 | | | | | Plus (less) change in year-end fair value of outstanding and unvested awards granted in prior years | | (44,199) | | | | | | (334,838) | | | | | Fair value as of the vesting date of vested awards granted in the covered year | | — | | | | | | — | | | | | Plus (less) change in fair value of awards granted in prior years that vested in the covered year | | (2,868) | | | | | | (432,870) | | | | | Less the prior year-end fair value of awards forfeited during the covered year | | — | | | | | | — | | | | | | | | | | | | | | | Compensation Actually Paid | | $ | 71,211 | | | | | | $ | (119,030) | | | |
Fair values of equity awards set forth in the table above are computed in accordance with FASB ASC Topic 718 as of the end of the respective fiscal year, other than fair values of equity awards that vest in the covered year, which are valued as of the applicable vesting date. The valuation methodologies applied do not materially differ from the valuation methodologies applied at the time of grant.
|
|
|
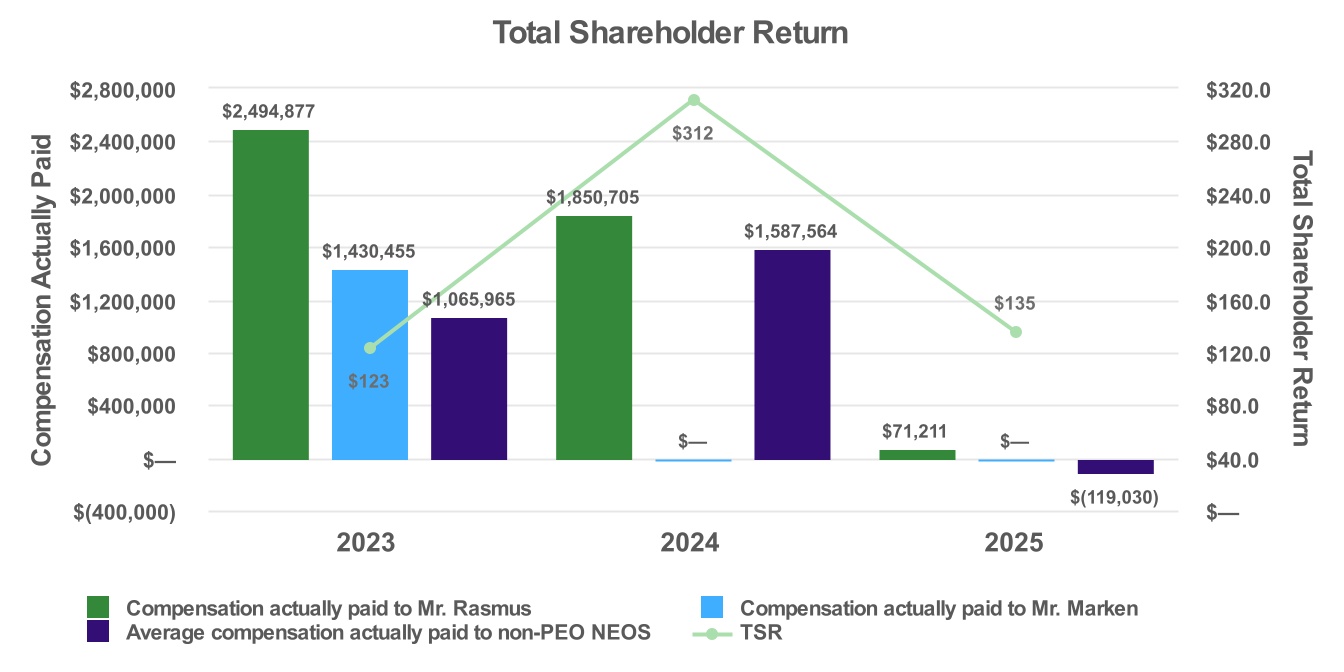
| Compensation Actually Paid vs. Total Shareholder Return |
|
|
|
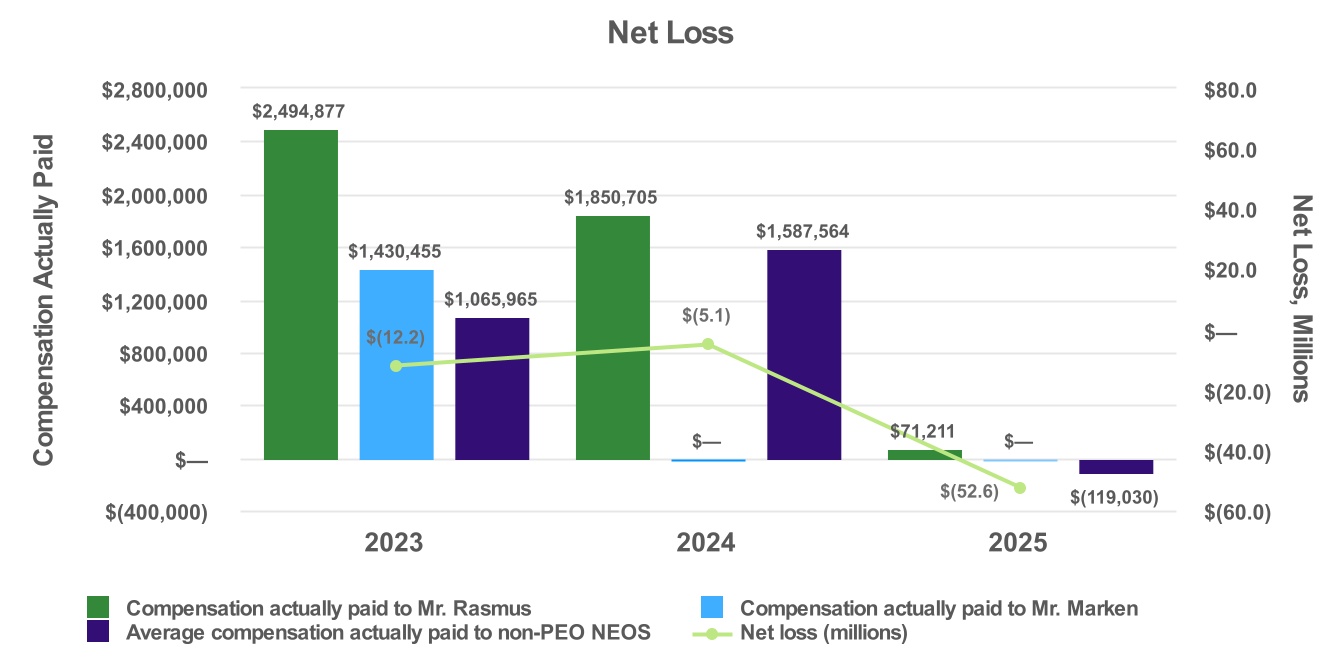
| Compensation Actually Paid vs. Net Income |
Compensation actually paid to Mr. Rasmus and the non-PEO NEOs is primarily comprised of changes in fair value of unvested RSA and PSU awards driven by increases and decreases in Arq, Inc. common share prices from the grant date of July 17, 2023 to the end of our 2025 fiscal year. Arq, Inc.’s common stock closed at $1.59 on July 17, 2023, $2.98 on December 31, 2023 and $7.57 on December 31, 2024, and $3.27 on December 31, 2025.
|
|
|
| Total Shareholder Return Amount |
$ 134.57
|
311.52
|
122.63
|
| Net Income (Loss) |
$ (52,610,000)
|
$ (5,109,000)
|
$ (12,249,000)
|
| Company Selected Measure Amount |
(52,610,000)
|
(5,109,000)
|
(12,249,000)
|
| PEO Name |
Robert Rasmus
|
|
Greg Marken
|
| Additional 402(v) Disclosure |
Total shareholder return, or TSR, is calculated based on the value of an initial fixed $100 investment in the Company. Further, the TSR is cumulative for the measurement periods beginning on December 31, 2022 and ending on December 31 of each of 2023, 2024 and 2025, respectively, calculated in accordance with Item 201(e) of Regulation S-K. (4)Reflects "Net Loss" as reported in the Company's Consolidated Statements of Operations included in the Company's Annual Reports on Form 10-K for each of the years ended December 31, 2025, 2024 and 2023.
|
|
|
| Greg Marken [Member] |
|
|
|
| Pay vs Performance Disclosure |
|
|
|
| PEO Total Compensation Amount |
$ 0
|
$ 0
|
|
| PEO Actually Paid Compensation Amount |
0
|
$ 0
|
|
| PEO Name |
|
Greg Marken
|
|
| Robert Rasmus [Member] |
|
|
|
| Pay vs Performance Disclosure |
|
|
|
| PEO Total Compensation Amount |
|
$ 115,385
|
$ 1,011,039
|
| PEO Actually Paid Compensation Amount |
|
$ 1,850,705
|
$ 2,494,877
|
| PEO Name |
|
Robert Rasmus
|
|
| PEO | Aggregate Grant Date Fair Value of Equity Award Amounts Reported in Summary Compensation Table |
|
|
|
| Pay vs Performance Disclosure |
|
|
|
| Adjustment to Compensation, Amount |
(60,479)
|
|
|
| PEO | Year-end Fair Value of Equity Awards Granted in Covered Year that are Outstanding and Unvested |
|
|
|
| Pay vs Performance Disclosure |
|
|
|
| Adjustment to Compensation, Amount |
0
|
|
|
| PEO | Year-over-Year Change in Fair Value of Equity Awards Granted in Prior Years That are Outstanding and Unvested |
|
|
|
| Pay vs Performance Disclosure |
|
|
|
| Adjustment to Compensation, Amount |
(44,199)
|
|
|
| PEO | Vesting Date Fair Value of Equity Awards Granted and Vested in Covered Year |
|
|
|
| Pay vs Performance Disclosure |
|
|
|
| Adjustment to Compensation, Amount |
35,778
|
|
|
| PEO | Change in Fair Value as of Vesting Date of Prior Year Equity Awards Vested in Covered Year |
|
|
|
| Pay vs Performance Disclosure |
|
|
|
| Adjustment to Compensation, Amount |
(2,868)
|
|
|
| PEO | Prior Year End Fair Value of Equity Awards Granted in Any Prior Year that Fail to Meet Applicable Vesting Conditions During Covered Year |
|
|
|
| Pay vs Performance Disclosure |
|
|
|
| Adjustment to Compensation, Amount |
0
|
|
|
| Non-PEO NEO | Aggregate Grant Date Fair Value of Equity Award Amounts Reported in Summary Compensation Table |
|
|
|
| Pay vs Performance Disclosure |
|
|
|
| Adjustment to Compensation, Amount |
(315,247)
|
|
|
| Non-PEO NEO | Year-end Fair Value of Equity Awards Granted in Covered Year that are Outstanding and Unvested |
|
|
|
| Pay vs Performance Disclosure |
|
|
|
| Adjustment to Compensation, Amount |
0
|
|
|
| Non-PEO NEO | Year-over-Year Change in Fair Value of Equity Awards Granted in Prior Years That are Outstanding and Unvested |
|
|
|
| Pay vs Performance Disclosure |
|
|
|
| Adjustment to Compensation, Amount |
(334,838)
|
|
|
| Non-PEO NEO | Vesting Date Fair Value of Equity Awards Granted and Vested in Covered Year |
|
|
|
| Pay vs Performance Disclosure |
|
|
|
| Adjustment to Compensation, Amount |
186,495
|
|
|
| Non-PEO NEO | Change in Fair Value as of Vesting Date of Prior Year Equity Awards Vested in Covered Year |
|
|
|
| Pay vs Performance Disclosure |
|
|
|
| Adjustment to Compensation, Amount |
(432,870)
|
|
|
| Non-PEO NEO | Prior Year End Fair Value of Equity Awards Granted in Any Prior Year that Fail to Meet Applicable Vesting Conditions During Covered Year |
|
|
|
| Pay vs Performance Disclosure |
|
|
|
| Adjustment to Compensation, Amount |
$ 0
|
|
|