The following information may give some indication of the risks of investing in the Fund. The Fund is the successor to the Predecessor International Equity Fund, a mutual fund with identical investment objectives, policies, and restrictions, as a result of the reorganization of the Predecessor International Equity Fund into the Fund on April 24, 2026. The performance provided in the bar chart and table is that of the Predecessor International Equity Fund. The bar chart illustrates how the Predecessor International Equity Fund’s average annual returns have varied from year to year for the past ten calendar years. The table below illustrates how the Predecessor International Equity Fund’s average annual total returns compare with those of a broad measure of market performance, the MSCI ACWI (All Country World Index) ex USA IMI Index. The performance prior to December 12, 2018 reflects the performance results obtained under a different sub-adviser that used different investment strategies. Had the current sub-adviser and investment strategies been in place during that period, the performance results may have been different. The performance information shown here does not reflect fees that are paid by the insurance company separate accounts that invest in the Fund. Inclusion of those fees would reduce the total return figures for all periods. The Predecessor International Equity Fund’s past performance does not necessarily indicate how the Fund will perform in the future.
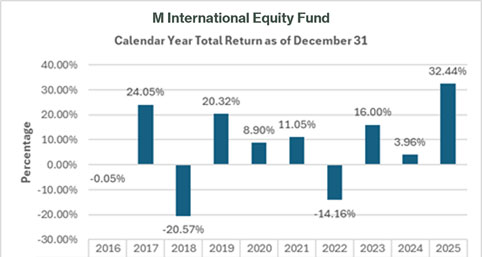
Highest quarterly return: 18.23% (for the quarter ended 12/31/2020)
Lowest quarterly return: (26.33)% (for the quarter ended 3/31/2020)
The table below shows the Predecessor International Equity Fund’s average annual total returns for the periods indicated and how those returns compare to those of the MSCI ACWI (All Country World Index) ex USA IMI Index and the MSCI All Country World ex USA Index. You cannot invest directly in an index. The Index returns are calculated on a total return basis and reflects no deduction for fees or expenses.
| One Year | Five Years | Ten Years | ||||
| Predecessor International Equity Fund | 32.44% | 8.77% | 6.99% | |||
| MSCI ACWI (All Country World Index) ex USA IMI Index1 | 31.96% | 7.77% | 8.37% |
| 1 | The Fund has adopted this broad-based index as its primary benchmark index and serves as the Fund’s regulatory index. |
The following information may give some indication of the risks of investing in the Fund. The Fund is the successor to the Predecessor Large Cap Growth Fund, a mutual fund with identical investment objectives, policies, and restrictions, as a result of the reorganization of the Predecessor Large Cap Growth Fund into the Fund on April 24, 2026. The performance provided in the bar chart and table is that of the Predecessor Large Cap Growth Fund. The bar chart illustrates how the Predecessor Large Cap Growth Fund’s average annual returns have varied from year to year for the past ten calendar years. The table below illustrates how the Predecessor Large Cap Growth Fund’s average annual total returns compare with those of a broad measure of market performance, the S&P 500® Index and the Russell 1000® Growth Index, which is more representative of the market sector in which the Fund invests. The performance information shown here does not reflect fees that are paid by the insurance company separate accounts that invest in the Fund. Inclusion of those fees would reduce the total return figures for all periods. The Predecessor Large Cap Growth Fund’s past performance does not necessarily indicate how the Fund will perform in the future.
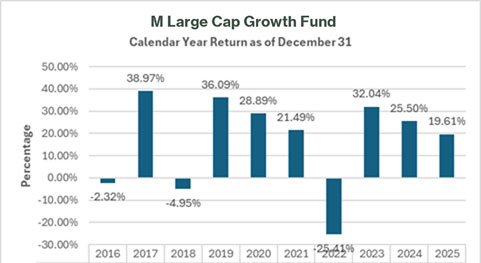
Highest quarterly return: 25.91% (for the quarter ended 6/30/2020)
Lowest quarterly return: (17.70)% (for the quarter ended 6/30/2022)
The table below shows the Predecessor Large Cap Growth Fund’s average annual total returns for the periods indicated and how those returns compare to those of the S&P 500® Index and the Russell 1000® Growth Index. You cannot invest directly in an index. The Index returns are calculated on a total return basis and reflects no deduction for fees, expenses or taxes.
| One Year | Five Years | Ten Years | ||||
| Predecessor Large Cap Growth Fund | 19.61% | 12.43% | 15.06% | |||
| S&P 500® Index1 | 17.88% | 14.43% | 14.82% | |||
| Russell 1000® Growth Index2 (reflects no deduction for fees, expenses or taxes) | 18.56% | 15.32% | 18.13% |
| 1 | The Fund has adopted this broad-based index as its primary benchmark index in response to regulatory requirements and serves as the Fund’s regulatory index. |
| 2 | The Russell 1000® Growth Index is the Fund’s additional index and is more representative of the Fund’s risk and return than the regulatory index. |
The following information may give some indication of the risks of investing in the Fund. The Fund is the successor to the Predecessor Capital Appreciation Fund, a mutual fund with identical investment objectives, policies, and restrictions, as a result of the reorganization of the Predecessor Capital Appreciation Fund into the Fund on April 24, 2026. The performance provided in the bar chart and table is that of the Predecessor Capital Appreciation Fund. The bar chart illustrates how the Predecessor Capital Appreciation Fund’s average annual returns have varied from year to year for the past ten calendar years. The table below illustrates how the Predecessor Capital Appreciation Fund’s average annual total returns compare with those of a broad measure of market performance, the S&P 500 Index and the Russell 2500® Index, which is more representative of the market sector in which the Fund invests. The performance information shown here does not reflect fees that are paid by the insurance company separate accounts that invest in the Fund. Inclusion of those fees would reduce the total return figures for all periods. The Predecessor Capital Appreciation Fund’s past performance does not necessarily indicate how the Fund will perform in the future.
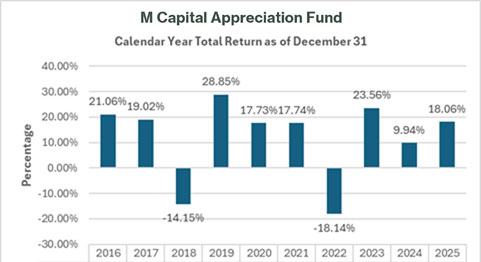
Highest quarterly return: 32.36% (for the quarter ended 6/30/2020)
Lowest quarterly return: (35.85)% (for the quarter ended 3/31/2020)
The table below shows the Predecessor Capital Appreciation Fund’s average annual total returns for the periods indicated and how those returns compare to those of the S&P 500® Index and the Russell 2500® Index. You cannot invest directly in an index. The Index returns are calculated on a total return basis and reflects no deduction for fees, expenses or taxes.
| One Year | Five Years | Ten Years | ||||
| Predecessor Capital Appreciation Fund | 18.06% | 9.10% | 11.24% | |||
| S&P 500® Index1 | 17.88% | 14.43% | 14.82% | |||
| Russell 2500® Index2 (reflects no deduction for fees, expenses or taxes) | 11.91% | 7.26% | 10.41% |
| 1 | The Fund has adopted this broad-based index as its primary benchmark index in response to regulatory requirements and serves as the Fund’s regulatory index. |
| 2 | The Russell 2500® Index is the Fund’s additional index and is more representative of the Fund’s risk and return than the regulatory index. |
The following information may give some indication of the risks of investing in the Fund. The Fund is the successor to the Predecessor Large Cap Value Fund, a mutual fund with identical investment objectives, policies, and restrictions, as a result of the reorganization of the Predecessor Large Cap Value Fund into the Fund on April 24 , 2026. The performance provided in the bar chart and table is that of the Predecessor Large Cap Value Fund. The bar chart illustrates how the Predecessor Large Cap Value Fund’s average annual returns have varied from year to year for the past ten calendar years. The table below illustrates how the Predecessor Large Cap Value Fund’s average annual total returns compare with those of a broad measure of market performance, the Russell 1000® Index and the Russell 1000® Value Index, which is more representative of the market sector in which the Fund invests. The performance prior to December 31, 2019 reflects the performance results obtained under a different sub-adviser that used a different investment strategy. Had the current sub-adviser and investment strategies been in place during that period, the performance results may have been different. The performance information shown here does not reflect fees that are paid by the insurance company separate accounts that invest in the Fund. Inclusion of those fees would reduce the total return figures for all periods. The Predecessor Large Cap Value Fund’s past performance does not necessarily indicate how the Fund will perform in the future.
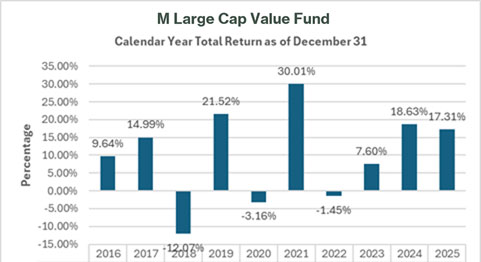
Highest quarterly return: 16.06% (for the quarter ended 12/31/2022)
Lowest quarterly return: (28.75)% (for the quarter ended 3/31/2020)
The table below shows the Predecessor Large Cap Value Fund’s average annual total returns for the periods indicated and how those returns compare to those of the Russell 1000® Index and the Russell 1000® Value Index. You cannot invest directly in an index. The Index returns are calculated on a total return basis and reflects no deduction for fees, expenses or taxes.
| One Year | Five Years | Ten Years | ||||
| Predecessor Large Cap Value Fund | 17.31% | 13.92% | 9.61% | |||
| Russell 1000® Index1 | 17.37% | 13.59% | 14.59% | |||
| Russell 1000® Value Index2 (reflects no deduction for fees, expenses or taxes) | 15.91% | 11.33% | 10.53% |
| 1 | The Fund has adopted this broad-based index as its primary benchmark index in response to regulatory requirements and serves as the Fund’s regulatory index. |
| 2 | The Russell 1000® Value Index is the Fund’s additional index and is more representative of the Fund’s risk and return than the regulatory risk. |