Performance Management - Quantified Gold Futures Tracking Fund
|
May 01, 2026 |
| Class A Shares |
|
| Prospectus [Line Items] |
|
| Bar Chart and Performance Table [Heading] |
Performance:
|
| Performance Narrative [Text Block] |
The bar chart and performance table below show the variability of the Fund’s returns, which is some indication of the risks
of investing in the Fund. The bar chart shows performance of the Fund’s Investor Class shares for each full calendar year for the
past ten years. The performance table compares the performance of the Fund’s Investor Class shares over time to the performance
of a broad-based market index and a supplemental index. You should be aware that the Fund’s past performance (before and after
taxes) may not be an indication of how the Fund will perform in the future. Investor Class shares are not offered in this Prospectus
but would have similar annual returns to Class A shares because the classes are invested in the same portfolio of securities, however,
the returns for Class A shares might be lower than Investor Class shares because Investor Class shares might have lower expenses than
Class A shares. Also, shareholder reports containing financial and performance information will be mailed to shareholders semi-annually.
Updated performance information and daily net asset value per share (“NAV”) is available at no cost by calling toll-free
1-855-647-8268.
|
| Performance Past Does Not Indicate Future [Text] |
You should be aware that the Fund’s past performance (before and after
taxes) may not be an indication of how the Fund will perform in the future.
|
| Performance Information Illustrates Variability of Returns [Text] |
The bar chart and performance table below show the variability of the Fund’s returns, which is some indication of the risks
of investing in the Fund. The bar chart shows performance of the Fund’s Investor Class shares for each full calendar year for the
past ten years.
|
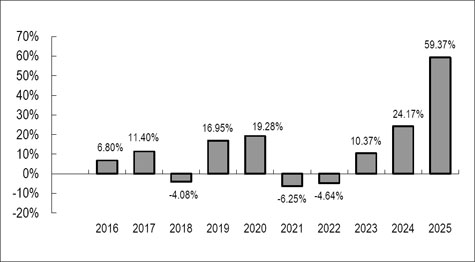
| Bar Chart [Heading] |
Investor
Class Performance Bar Chart
For Calendar Years Ended December 31st
Investor Class Shares
|
| Bar Chart [Table] |
| |
2016 |
2017 |
2018 |
2019 |
2020 |
2021 |
2022 |
2023 |
2024 |
2025 |
| |
6.80% |
11.40% |
-4.08% |
16.95% |
19.28% |
-6.25% |
-4.64% |
10.37% |
24.17% |
59.37% |
|
| Bar Chart Closing [Text Block] |
| Best
Quarter |
3/31/2025 |
18.23% |
| Worst
Quarter |
12/31/2016 |
(13.84)% |
|
| Highest Quarterly Return, Label [Optional Text] |
Best
Quarter
|
| Highest Quarterly Return |
18.23%
|
| Highest Quarterly Return, Date |
Mar. 31, 2025
|
| Lowest Quarterly Return, Label [Optional Text] |
Worst
Quarter
|
| Lowest Quarterly Return |
(13.84%)
|
| Lowest Quarterly Return, Date |
Dec. 31, 2016
|
| Performance Table Heading |
Performance
Table
Average Annual Total Returns
(For periods ended December 31, 2025)
|
| Performance Table Uses Highest Federal Rate |
After-tax
returns were calculated using the historical highest individual federal marginal income tax rates and do not reflect the impact of state
and local taxes.
|
| Performance Table Not Relevant to Tax Deferred |
Actual after-tax returns depend on an investor’s tax situation and may differ from those shown, and after-tax
returns shown are not relevant to investors who hold shares of the Fund through tax-deferred arrangements, such as 401(k) plans or individual
retirement accounts.
|
| Performance [Table] |
| Investor
Class Shares |
One
Year |
Five
Year |
Ten
Years(1) |
| Investor
Class Shares Return before taxes |
59.37% |
14.32% |
12.01% |
| Investor
Class Shares Return after taxes on distributions |
38.48% |
8.19% |
7.56% |
| Investor
Class Shares Return after taxes on distributions and sale of Fund shares |
35.23% |
8.39% |
7.45% |
S&P
500 Total Return(2)
(reflects no deduction for fees, expenses or taxes) |
17.88% |
14.42% |
14.82% |
S&P
GSCI Gold Index(3)
(reflects no deduction for fees, expenses or taxes) |
62.47% |
17.14% |
14.03% |
| (1) | The
performance record shown in the table reflects the investment performance of the Fund’s Investor Class Shares, which are not offered
in this Prospectus. Had Class A Shares been operational during the periods in the table, it would have had similar, but lower, annual
returns because Investor Class shares are invested in the same portfolio of securities and the annual returns would differ only to the
extent that the Class A shares do not have the same expenses and because Class A shares are subject to a sales load. |
| (2) | The
S&P 500 Total Return Index is an unmanaged composite of 500 large capitalization companies and includes the reinvestment of dividends.
This index is widely used by professional investors as a performance benchmark for large-cap stocks. Investors cannot invest directly
in an index. |
| (3) | The
S&P GSCI (Goldman Sachs Commodity Index) Gold Index, a sub-index of the S&P GSCI, provides investors with a reliable and publicly
available benchmark tracking the COMEX gold future. The index is designed to be tradable, readily accessible to market participants,
and cost efficient to implement. Investors cannot directly invest in an index. |
|
| Index No Deduction for Fees, Expenses, or Taxes [Text] |
reflects no deduction for fees, expenses or taxes
|
| Performance Table Closing [Text Block] |
After-tax
returns were calculated using the historical highest individual federal marginal income tax rates and do not reflect the impact of state
and local taxes. Actual after-tax returns depend on an investor’s tax situation and may differ from those shown, and after-tax
returns shown are not relevant to investors who hold shares of the Fund through tax-deferred arrangements, such as 401(k) plans or individual
retirement accounts.
|
| Investor And Advisor Class Shares |
|
| Prospectus [Line Items] |
|
| Bar Chart and Performance Table [Heading] |
Performance:
|
| Performance Narrative [Text Block] |
The bar chart and performance table below show the variability of the Fund’s returns, which is some indication of the risks
of investing in the Fund. The bar chart shows performance of the Fund’s Investor Class shares for each full calendar year for the
past ten years. The performance table compares the performance of the Fund’s Investor Class shares overtime to the performance of
a broad-based market index and a supplemental index. You should be aware that the Fund’s past performance (before and after taxes)
may not be an indication of how the Fund will perform in the future. Also, shareholder reports containing financial and performance information
will be mailed to shareholders semi-annually. Updated performance information and daily net asset value per share (“NAV”) is
available at no cost by calling toll-free 855-647-8268.
|
| Performance Past Does Not Indicate Future [Text] |
You should be aware that the Fund’s past performance (before and after taxes)
may not be an indication of how the Fund will perform in the future.
|
| Performance Information Illustrates Variability of Returns [Text] |
The bar chart and performance table below show the variability of the Fund’s returns, which is some indication of the risks
of investing in the Fund. The bar chart shows performance of the Fund’s Investor Class shares for each full calendar year for the
past ten years.
|
| Bar Chart [Heading] |
Investor
Class Performance Bar Chart
For
Calendar Years Ended December 31st
|
| Bar Chart [Table] |
| |
2016 |
2017 |
2018 |
2019 |
2020 |
2021 |
2022 |
2023 |
2024 |
2025 |
| |
6.80% |
11.40% |
-4.08% |
16.95% |
19.28% |
-6.25% |
-4.64% |
10.37% |
24.17% |
59.37% |
|
| Bar Chart Closing [Text Block] |
| Best
Quarter |
3/31/2025 |
18.23% |
| Worst
Quarter |
12/31/2016 |
(13.84)% |
|
| Highest Quarterly Return, Label [Optional Text] |
Best
Quarter
|
| Highest Quarterly Return |
18.23%
|
| Highest Quarterly Return, Date |
Mar. 31, 2025
|
| Lowest Quarterly Return, Label [Optional Text] |
Worst
Quarter
|
| Lowest Quarterly Return |
(13.84%)
|
| Lowest Quarterly Return, Date |
Dec. 31, 2016
|
| Performance Table Heading |
Performance
Table
Average
Annual Total Returns
(For
periods ended December 31, 2025)
|
| Performance Table Uses Highest Federal Rate |
After-tax
returns were calculated using the historical highest individual federal marginal income tax rates and do not reflect the impact of state
and local taxes.
|
| Performance Table Not Relevant to Tax Deferred |
Actual after-tax returns depend on an investor’s tax situation and may differ from those shown, and after-tax
returns shown are not relevant to investors who hold shares of the Fund through tax-deferred arrangements, such as 401(k) plans or individual
retirement accounts.
|
| Performance [Table] |
| Investor
Class Shares |
One
Year |
Five
Years |
Ten
Years |
| Return
before taxes |
59.37% |
14.32% |
12.01% |
| Return
after taxes on distributions |
38.48% |
8.19% |
7.56% |
| Return
after taxes on distributions and sale of Fund shares |
35.23% |
8.39% |
7.45% |
S&P
500 Total Return Index(2)
(reflects no deduction for fees, expenses or taxes) |
17.88% |
14.42% |
14.82% |
S&P
GSCI Gold Index(3)
(reflects no deduction for fees, expenses or taxes) |
62.47% |
17.14% |
14.03% |
| Advisor
Class Shares |
One
Year |
Five
Year |
Since
Inception(1) |
| Return
before taxes |
58.80% |
13.71% |
9.83% |
| Return
after taxes on distributions |
33.78% |
7.01% |
5.11% |
| Return
after taxes on distributions and sale of Fund shares |
34.84% |
7.67% |
5.48% |
S&P
500 Total Return Index(2)
(reflects no deduction for fees, expenses or taxes) |
17.88% |
14.42% |
14.91% |
S&P
GSCI Gold Index(3)
(reflects no deduction for fees, expenses or taxes) |
62.47% |
17.14% |
12.53% |
| (1) | The
inception date of the Fund’s Advisor Class Shares is April 19, 2016. |
| (2) | The
S&P 500 Total Return Index is an unmanaged composite of 500 large capitalization companies
and includes the reinvestment of dividends. This index is widely used by professional investors
as a performance benchmark for large-cap stocks. Investors cannot invest directly in an index. |
| (3) | The
S&P GSCI (Goldman Sachs Commodity Index) Gold Index, a sub-index of the S&P GSCI,
provides investors with a reliable and publicly available benchmark tracking the COMEX gold
future. The index is designed to be tradable, readily accessible to market participants,
and cost efficient to implement. Investors cannot directly invest in an index. |
|
| Index No Deduction for Fees, Expenses, or Taxes [Text] |
reflects no deduction for fees, expenses or taxes
|
| Performance Table Closing [Text Block] |
After-tax
returns were calculated using the historical highest individual federal marginal income tax rates and do not reflect the impact of state
and local taxes. Actual after-tax returns depend on an investor’s tax situation and may differ from those shown, and after-tax
returns shown are not relevant to investors who hold shares of the Fund through tax-deferred arrangements, such as 401(k) plans or individual
retirement accounts.
|
| Performance Availability Phone [Text] |
855-647-8268
|