Pay vs Performance Disclosure - USD ($)
Dec. 31, 2025
Dec. 31, 2024
Dec. 31, 2023
Dec. 31, 2022
Dec. 31, 2021
Pay vs Performance Table
The following table sets forth information concerning the compensation earned during the fiscal years ended December 31, 2025, 2024, 2023, 2022 and 2021 by the Company’s NEOs:
Year |
Summary Compensation Total for CEO (1)(2) |
Compensation Actually Paid to CEO (3) |
Average SCT Total for Non-CEO NEOs (1)(2) |
Average Compensation Actually Paid to Non-CEO NEOs (3) |
Value of Initial Fixed $100 Investment based on: |
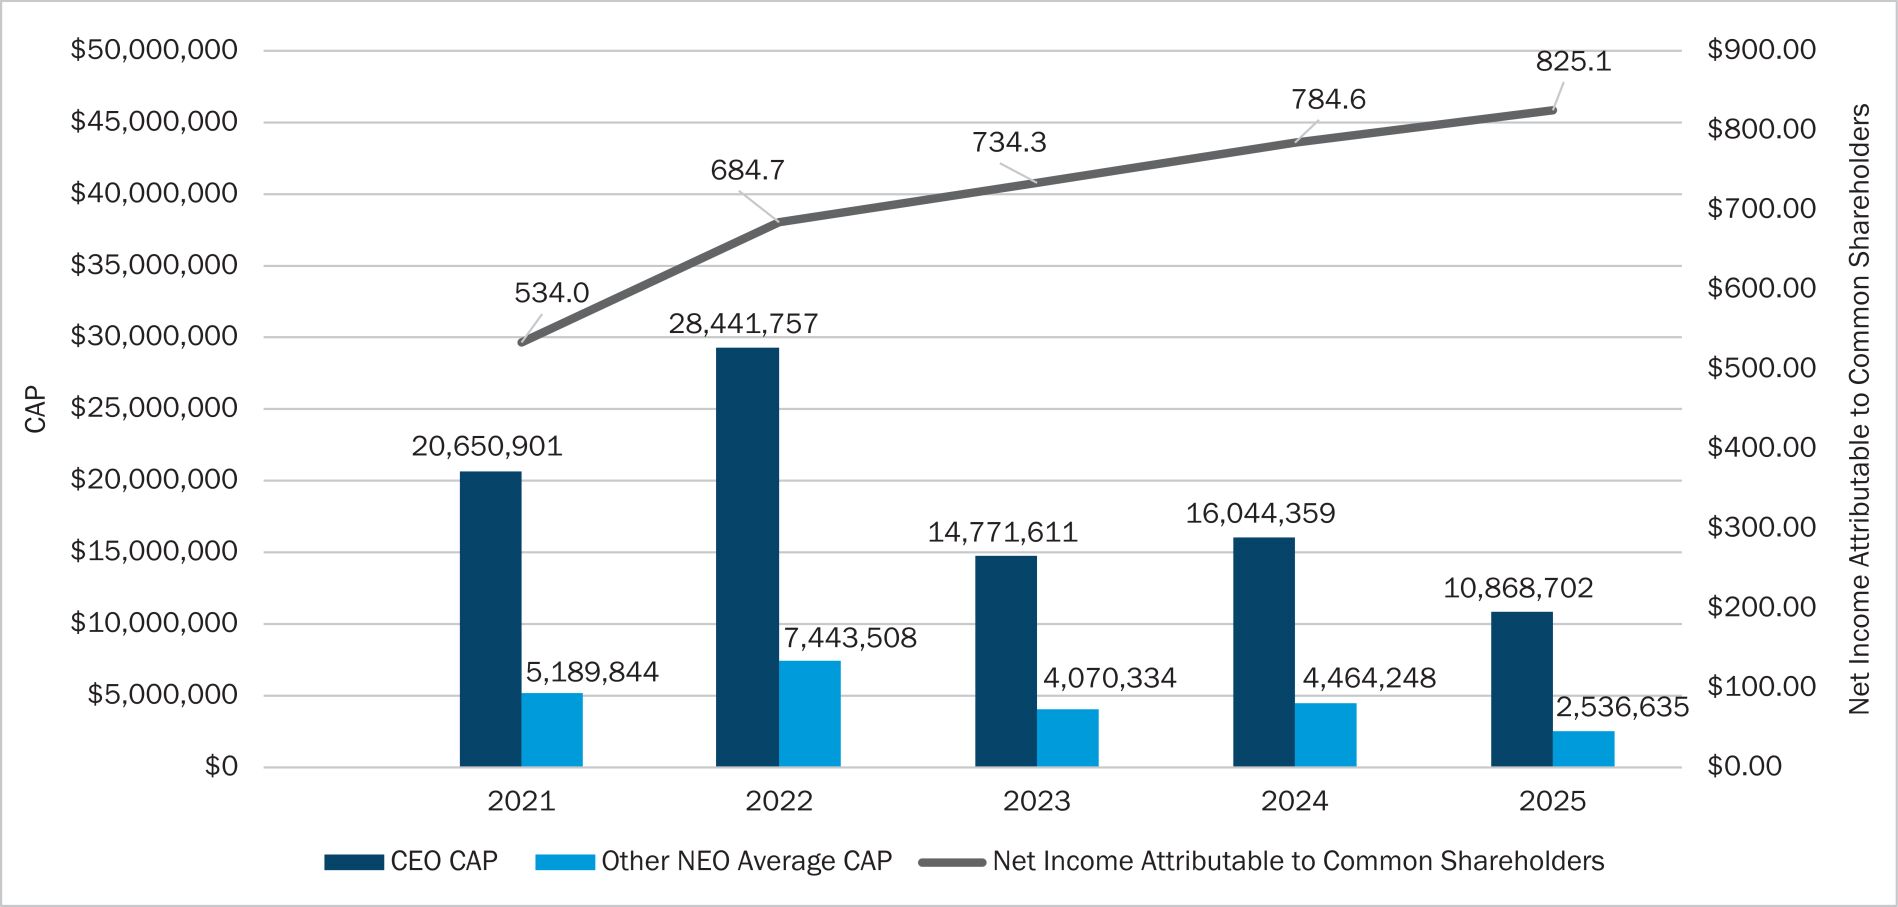
Net Income attributable to common shareholders |
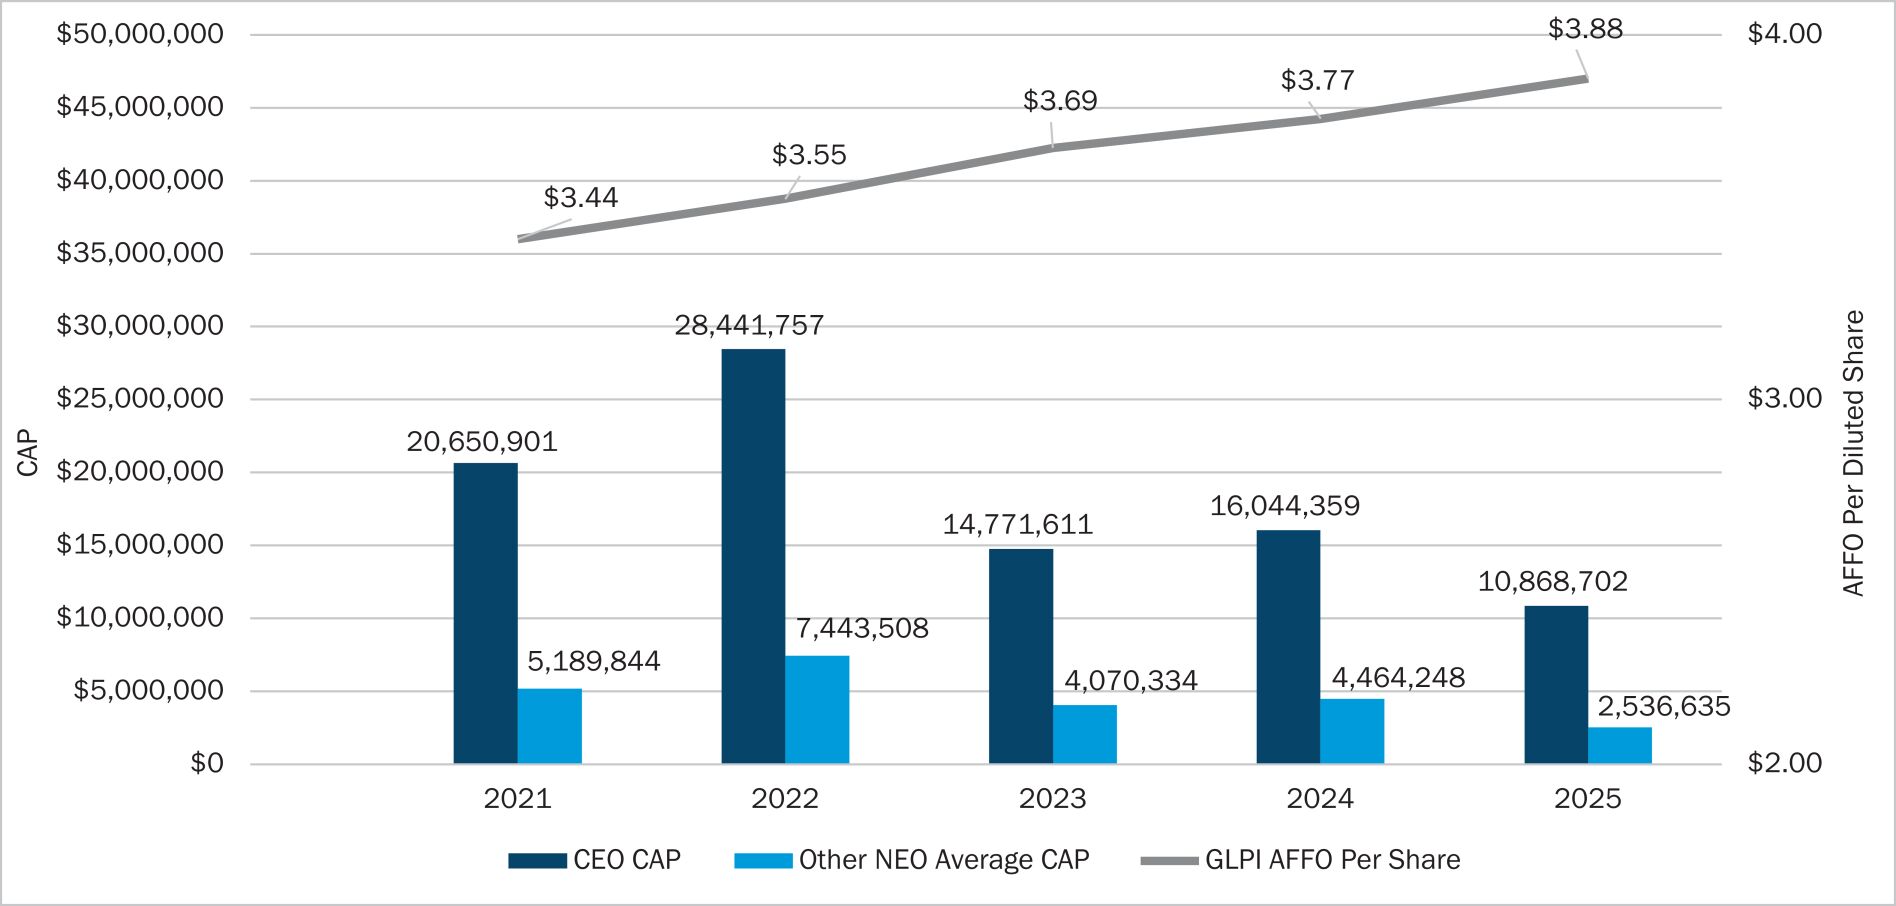
AFFO per Diluted Share (5) | |||||||||||||||||||||||||||||||||
TSR (4) |
Peer Group TSR (4) | |||||||||||||||||||||||||||||||||||||||
2025 |
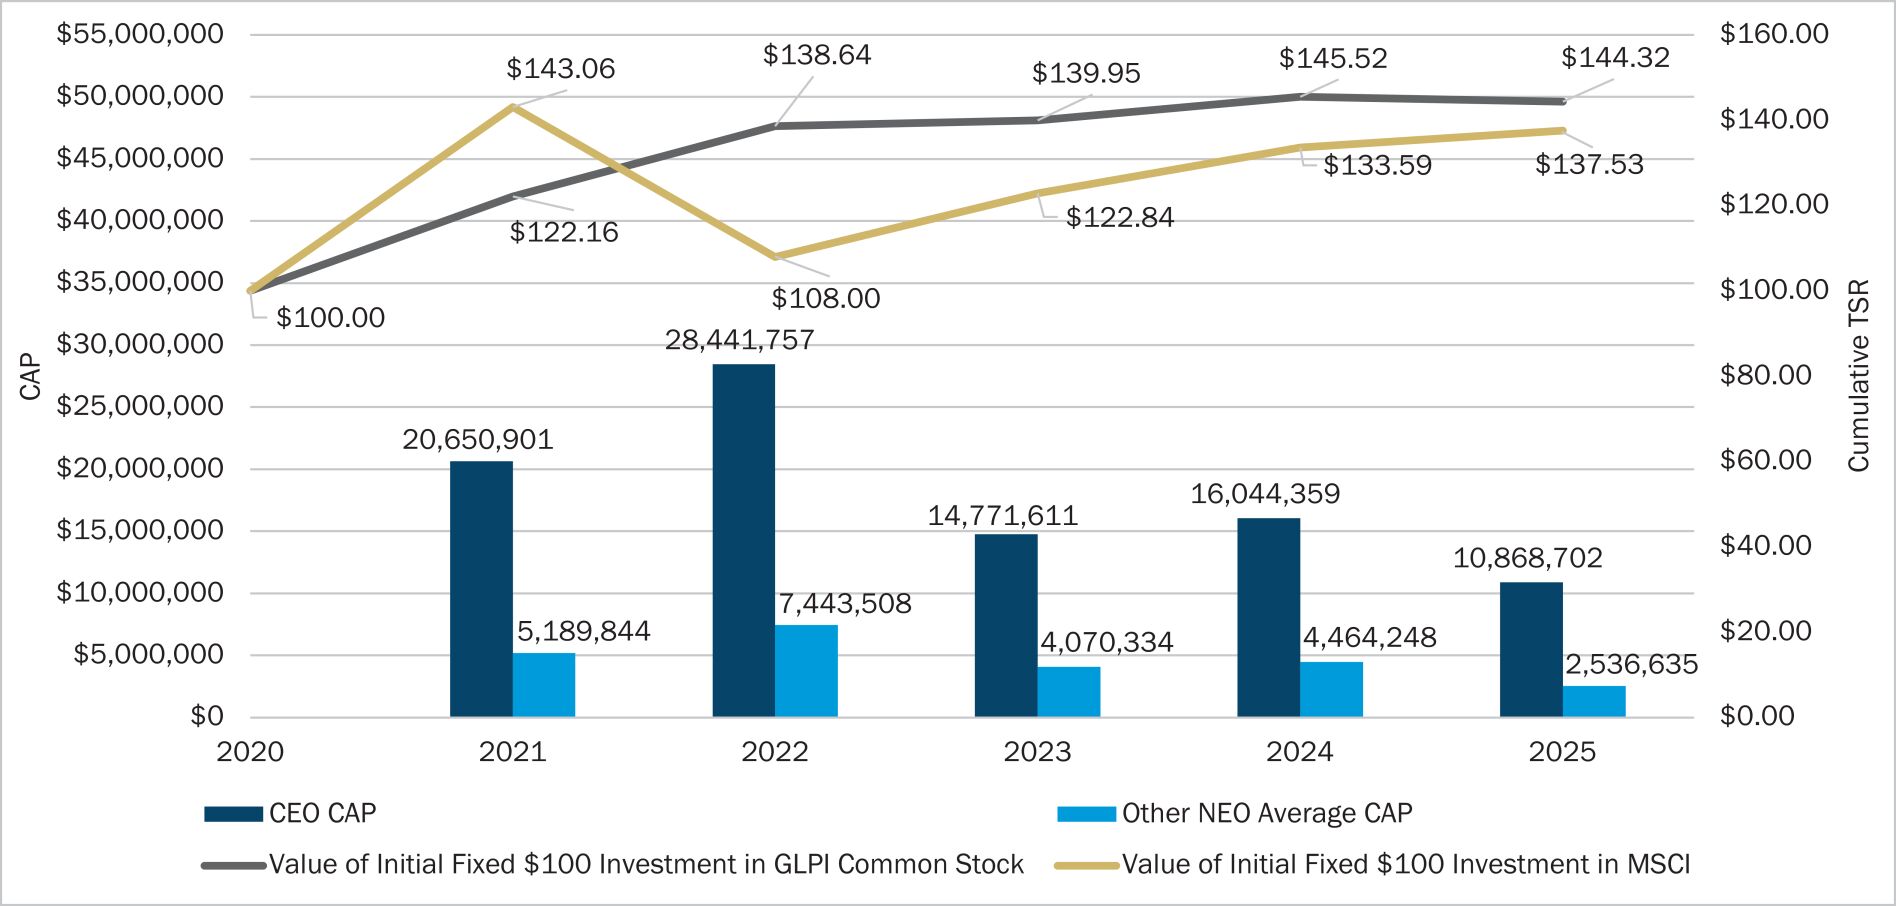
14,054,918 | 10,868,702 | 4,925,491 | 2,536,635 | 144.32 | 137.53 | 825.1 | 3.88 | ||||||||||||||||||||||||||||||||
2024 |
14,853,214 | 16,044,359 | 4,111,319 | 4,464,248 | 145.52 | 133.59 | 784.6 | 3.77 | ||||||||||||||||||||||||||||||||
2023 |
15,947,667 | 14,771,611 | 4,475,135 | 4,070,334 | 139.95 | 122.84 | 734.3 | 3.69 | ||||||||||||||||||||||||||||||||
2022 |
14,989,182 | 28,441,757 | 3,940,203 | 7,443,508 | 138.64 | 108.00 | 684.7 | 3.55 | ||||||||||||||||||||||||||||||||
2021 |
13,407,438 | 20,650,901 | 3,395,082 | 5,189,844 | 122.16 | 143.06 | 534.0 | 3.44 | ||||||||||||||||||||||||||||||||
| (1) | For all periods presented, our CEO is Peter M. Carlino. For the 2025, 2024, 2023 and 2022 periods presented, our other NEOs are Brandon J. Moore, Desiree A. Burke, Matthew J. Demchyk, and Steven L. Ladany. For the 2021 period presented, our other NEOs are Brandon J. Moore, Desiree A. Burke and Matthew J. Demchyk. |
| (2) | The values reflected in this column reflect the “Total” compensation set forth in the Summary Compensation Table (“SCT”) of the corresponding years’ Proxy Statement for our CEO and average of our other NEOs. See the footnotes to the respective tables for further detail regarding the amounts in this column. |
| (3) | In accordance with SEC rules, the Compensation actually paid (“CAP”) reflected in this column is computed by replacing the amounts in the “Service-Based Awards” and “Performance-Based Awards” column of the SCT for each year from the “SCT Total” column of this table with the following amounts: (i) the fair value as of the last day of the reporting year of unvested awards (or portions thereof) that were granted during such year, (ii) as of the last day of the reporting year, the change in fair value of unvested awards granted in prior years that remain unvested as of the last day of such year compared to the last day of the previous reporting year, (iii) as of the applicable vesting date, the change in fair value of awards that vested during the reporting year compared to the last day of the previous reporting year, (iv) as of the applicable vesting date the fair value of awards that were granted and vested during the reporting year and, (v) the value of dividends paid in cash on performance based awards that vested during the reporting year. The dollar amounts do not reflect the actual amount of compensation earned by or paid to our CEO or other NEOs during the applicable year. In accordance with Item 402(v) of Regulation S-K, CAP for our CEO and Average CAP for our other NEOs for the year ended December 31, 2025 was computed as follows: |
| 2025 | ||||||||
| CEO | Other NEO Average |
|||||||
SCT Total Compensation |
$ | 14,054,918 | $ | 4,925,491 | ||||
Minus SCT Service-Based and Performance-Based Award Value |
(8,600,900 | ) | (2,914,370 | ) | ||||
Plus Fair Value of Unvested Awards Granted During the Reporting Year as of Last Day of Reporting Year |
7,611,450 | 2,041,253 | ||||||
Minus Change in Fair Value of Unvested Awards Granted in Prior Years as of Last Day of Reporting Year from Last Day of Year Preceding Reporting Year |
(1,608,746 | ) | (402,187 | ) | ||||
Minus Change in Fair Value of Awards Vested in Reporting Year as of Vesting Date from Last Day of Year Preceding Reporting Year |
(1,396,373 | ) | (1,315,651 | ) | ||||
Plus Fair Value of Awards Granted During the Reporting Year that Vested During the Reporting Year |
— | — | ||||||
Plus Value of Accrued Dividends Paid Upon Vesting of Awards in Reporting Year |
808,353 | 202,099 | ||||||
Total CAP |
$ | 10,868,702 | $ | 2,536,635 | ||||
| (4) | Reflects the cumulative TSR of the Company and the US MSCI REIT Index for the year ended December 31, 2021, the two years ended December 31, 2022, the three years ended December 31, 2023, the four years ended December 31, 2024, and the five years ended December 31, 2025 assuming a $100 investment at the closing price on December 31, 2020 and the reinvestment of all dividends before consideration of income taxes. |
| (5) | AFFO is a non-GAAP financial measure. For a definition and reconciliation of this non-GAAP financial measure to the most directly comparable GAAP measure, see the section entitled “FFO, AFFO and Adjusted EBITDA” on pages 51 – 52 of our 2025 Annual Report on Form 10-K. AFFO per share is presented on a fully diluted basis assuming full conversion of limited partnership units to common shares and therefore before the income statement impact of non-controlling interests. |
| 2025 | ||||||||
| CEO | Other NEO Average |
|||||||
SCT Total Compensation |
$ | 14,054,918 | $ | 4,925,491 | ||||
Minus SCT Service-Based and Performance-Based Award Value |
(8,600,900 | ) | (2,914,370 | ) | ||||
Plus Fair Value of Unvested Awards Granted During the Reporting Year as of Last Day of Reporting Year |
7,611,450 | 2,041,253 | ||||||
Minus Change in Fair Value of Unvested Awards Granted in Prior Years as of Last Day of Reporting Year from Last Day of Year Preceding Reporting Year |
(1,608,746 | ) | (402,187 | ) | ||||
Minus Change in Fair Value of Awards Vested in Reporting Year as of Vesting Date from Last Day of Year Preceding Reporting Year |
(1,396,373 | ) | (1,315,651 | ) | ||||
Plus Fair Value of Awards Granted During the Reporting Year that Vested During the Reporting Year |
— | — | ||||||
Plus Value of Accrued Dividends Paid Upon Vesting of Awards in Reporting Year |
808,353 | 202,099 | ||||||
Total CAP |
$ | 10,868,702 | $ | 2,536,635 | ||||
Compensation Actually Paid (CAP) vs. Cumulative TSR
Compensation Actually Paid (CAP) vs. Net Income Attributable to Common Shareholders
Compensation Actually Paid (CAP) vs. AFFO Per Diluted Share
Compensation Actually Paid (CAP) vs. Cumulative TSR
Financial Performance Measures
The most important financial performance measures used by the Company to link compensation actually paid to performance for the most recently completed fiscal year are listed herein.
Significant Financial Performance Metrics |
| TSR Compared to Peer Groups |
| AFFO Per Diluted Share |
| Dividends Per Share |
non-GAAP
financial measure. For a definition and reconciliation of this non-GAAP
financial measure to the most directly comparable GAAP measure, see the section entitled “FFO, AFFO and Adjusted EBITDA” on pages 51 – 52 of our 2025 Annual Report on Form 10-K.
AFFO per share is presented on a fully diluted basis assuming full conversion of limited partnership units to common shares and therefore before the income statement impact of non-controlling
interests.